1. Introduction
There is need for proven, resilient and scalable building envelope assemblies to decarbonize Canadian housing and buildings. Building operations accounted for 18% of greenhouse gas (GHG) emissions in Canada in 2022 [
1]. Space heating is responsible for almost two thirds of these emissions (64% or 73 MtCO
2e in 2022 [
1]). Canada’s Emission Reduction Plan (ERP) has established targets to reduce emissions by 40–45% from 2005 levels by 2030 and to achieve net-zero emissions economy-wide by 2050 [
2]. By retrofitting the older or the more inefficient Canadian houses and buildings to net-zero or passive house insulation levels and airtightness, heating demand can be reduced by 80% or more [
3,
4]. All else being equal, reducing heating demand reduces emissions, and makes switching to decarbonized (but often more costly) fuel sources more economically and technically viable, given constrained clean fuel sources.
While reducing operational carbon emissions from buildings may be the priority, the embodied carbon for a substantial construction project, such as a deep energy retrofit or a new building, should be considered during the design process. Embodied Carbon refers to CO
2 (or other GHGs) emitted through the production, manufacturing, and transport of building materials and components for the substantial construction projects. According to analysis [
5], building materials could consume up to a half of the remaining global 1.5 °C carbon budget leading to 2050 if business-as-usual construction practices continue. This highlights the need for new, proven building materials, products and systems with minimal carbon footprint. Natural Resources Canada is conducting R&D to identify promising feedstocks, such as residuals from agricultural and industrial processes and to incorporate these materials into enclosure assemblies appropriate for off-site construction.
Finally, Canada will need to significantly ramp up retrofit efforts to decarbonize Canada’s built environment by 2050. Due to the labour required to complete retrofits, and the forecasted shortfall in the construction workforce [
6], its clear that there will need to be a significant improvement in productivity in the construction sector. Digitization and automation technologies can be implemented in the construction sector to improve productivity. Off-site construction and prefabrication are technologies that could alleviate the demands placed on the current and forecasted construction workforce and allow Canada to meet its mid-century targets.
In 2023, NRCan’s Prefabricated Exterior Energy Retrofit (PEER) R&D project addressed technology and productivity gaps in above-grade wall retrofits by developing prototype prefabricated panels using commercially available materials [
7]. Five different panel prototypes were developed, suitable for retrofitting low-rise residential above-grade walls (Part-9 of the National Building Code of Canada). Of these, prefabricated lightweight framed panels insulated with dense-packed cellulose (on-site or off-site) offered the lowest embodied carbon, shown in
Table 1.
As a part of a subsequent project, entitled Low Carbon Building Envelopes for Industrialized Construction and Retrofits, NRCan has explored the use of a variety of abundant agricultural and forestry residues as feedstocks for insulation material. Chopped grain straw (wheat, rye, barley, oat) has emerged as an abundant, affordable material substitute. It can be readily installed into framing cavities pneumatically using conventional blowing equipment.
NRCan developed a prototype, sheathingless retrofit panel with deep framing cavities and a low framing factor that could be readily insulated with loose-fill agricultural or forestry waste fibres. Chopped straw was selected for lab testing and a pilot project due to its low-embodied carbon, market availability as an agricultural residual, its relatively low thermal conductivity needed for insulation, and its biogenic carbon content.
The research project was aimed at the following objectives:
Create confidence in new biogenic low-carbon materials with controlled experiments and modelling;
Use a guarded hot box to tightly control boundary conditions and reduce uncertainty;
Create calibrated hygrothermal model of the panelized assembly for broader use.
In a review of existing research, it was found that there is limited published performance data on prefabricated retrofit panels for residential construction, especially those using novel or biogenic insulation. Hilbrecht [
8] experimentally assessed a wood-frame wall assembly using a guarded hot box apparatus for the purposes of validating a hygrothermal model in DELPHIN [
9]. The investigation was completed using steady-state and transient conditions using a step-function to vary temperature and relative humidity in the climate and guarded chambers. The validation process used a set of visual and multiple statistical approaches, including the mean absolute error (MAE) and the root mean squared error (RMSE). The validation was completed by comparing the measured and simulated temperature and relative humidity to less than
3 °C and 10% RH. While using the guarded hot box was found to be successful, there were limitations due to the transient periods, material properties and the undetermined air infiltration into the assembly that would improve the validation results.
Boudreaux et al. [
10] performed a similar validation using a high permeance assembly with mineral wool, and a low permeance assembly with extruded polystyrene (XPS) in WUFI Pro 6 [
11]. The investigation used a wood frame wall assembly with continuous exterior insulation to mimic a retrofit scenario. The hygrothermal model was validated with an RSME within
1.1 °C and
6.0% RH. The researchers noted that air infiltration had a large effect on their results and would contribute to the experimental errors.
Other studies completed used a similar method and range for validation [
11], and completed experimental and numerical validation of multi-layered assemblies under steady and transient conditions [
12,
13,
14]. However, a research gap exists with novel low carbon materials, and further experimental data and numerical validation are needed to enhance confidence in such emerging materials.
This study presents a novel prototype for low-carbon retrofit panels tailored to Canadian low-rise residential buildings, alongside an original experimental framework using a guarded hot box under both steady-state and transient conditions to validate a numerical hygrothermal model—an approach not previously applied in this context. This provides measured and modelled evidence that dense-packed low-carbon materials can be implemented as building insulation materials.
The low-carbon panelized system, experimental and numerical research methods are described; validation parameters and performance results are presented. Conclusions are drawn and next steps are proposed for the research.
Panelized Assemblies for Retrofit
The panelized design prioritized prefabrication, incorporating air, water and thermal control layers, and the use of vapour-permeable materials to encourage the outward drying potential. The purpose of these priorities is to reduce the amount of labour required on-site and improve the quality control of manufacturing a high-performance enclosure. While it was not performed in this study, it is possible to incorporate off-site installation of cladding and fenestration to the panelized assembly to further reduce on-site labour and improve quality control.
The design criteria for the new prototype panel design were as follows:
To achieve an effective clear field thermal resistance of RSI 5.3 m2K/W (RIP-30
To minimize embodied carbon/maximize biogenic carbon storage;
To maximize outward drying potential;
Include water, air and thermal control functions in a prefabricated system; and
Rapidly achieve a high-quality, high-performance enclosure with minimal on-site labour.
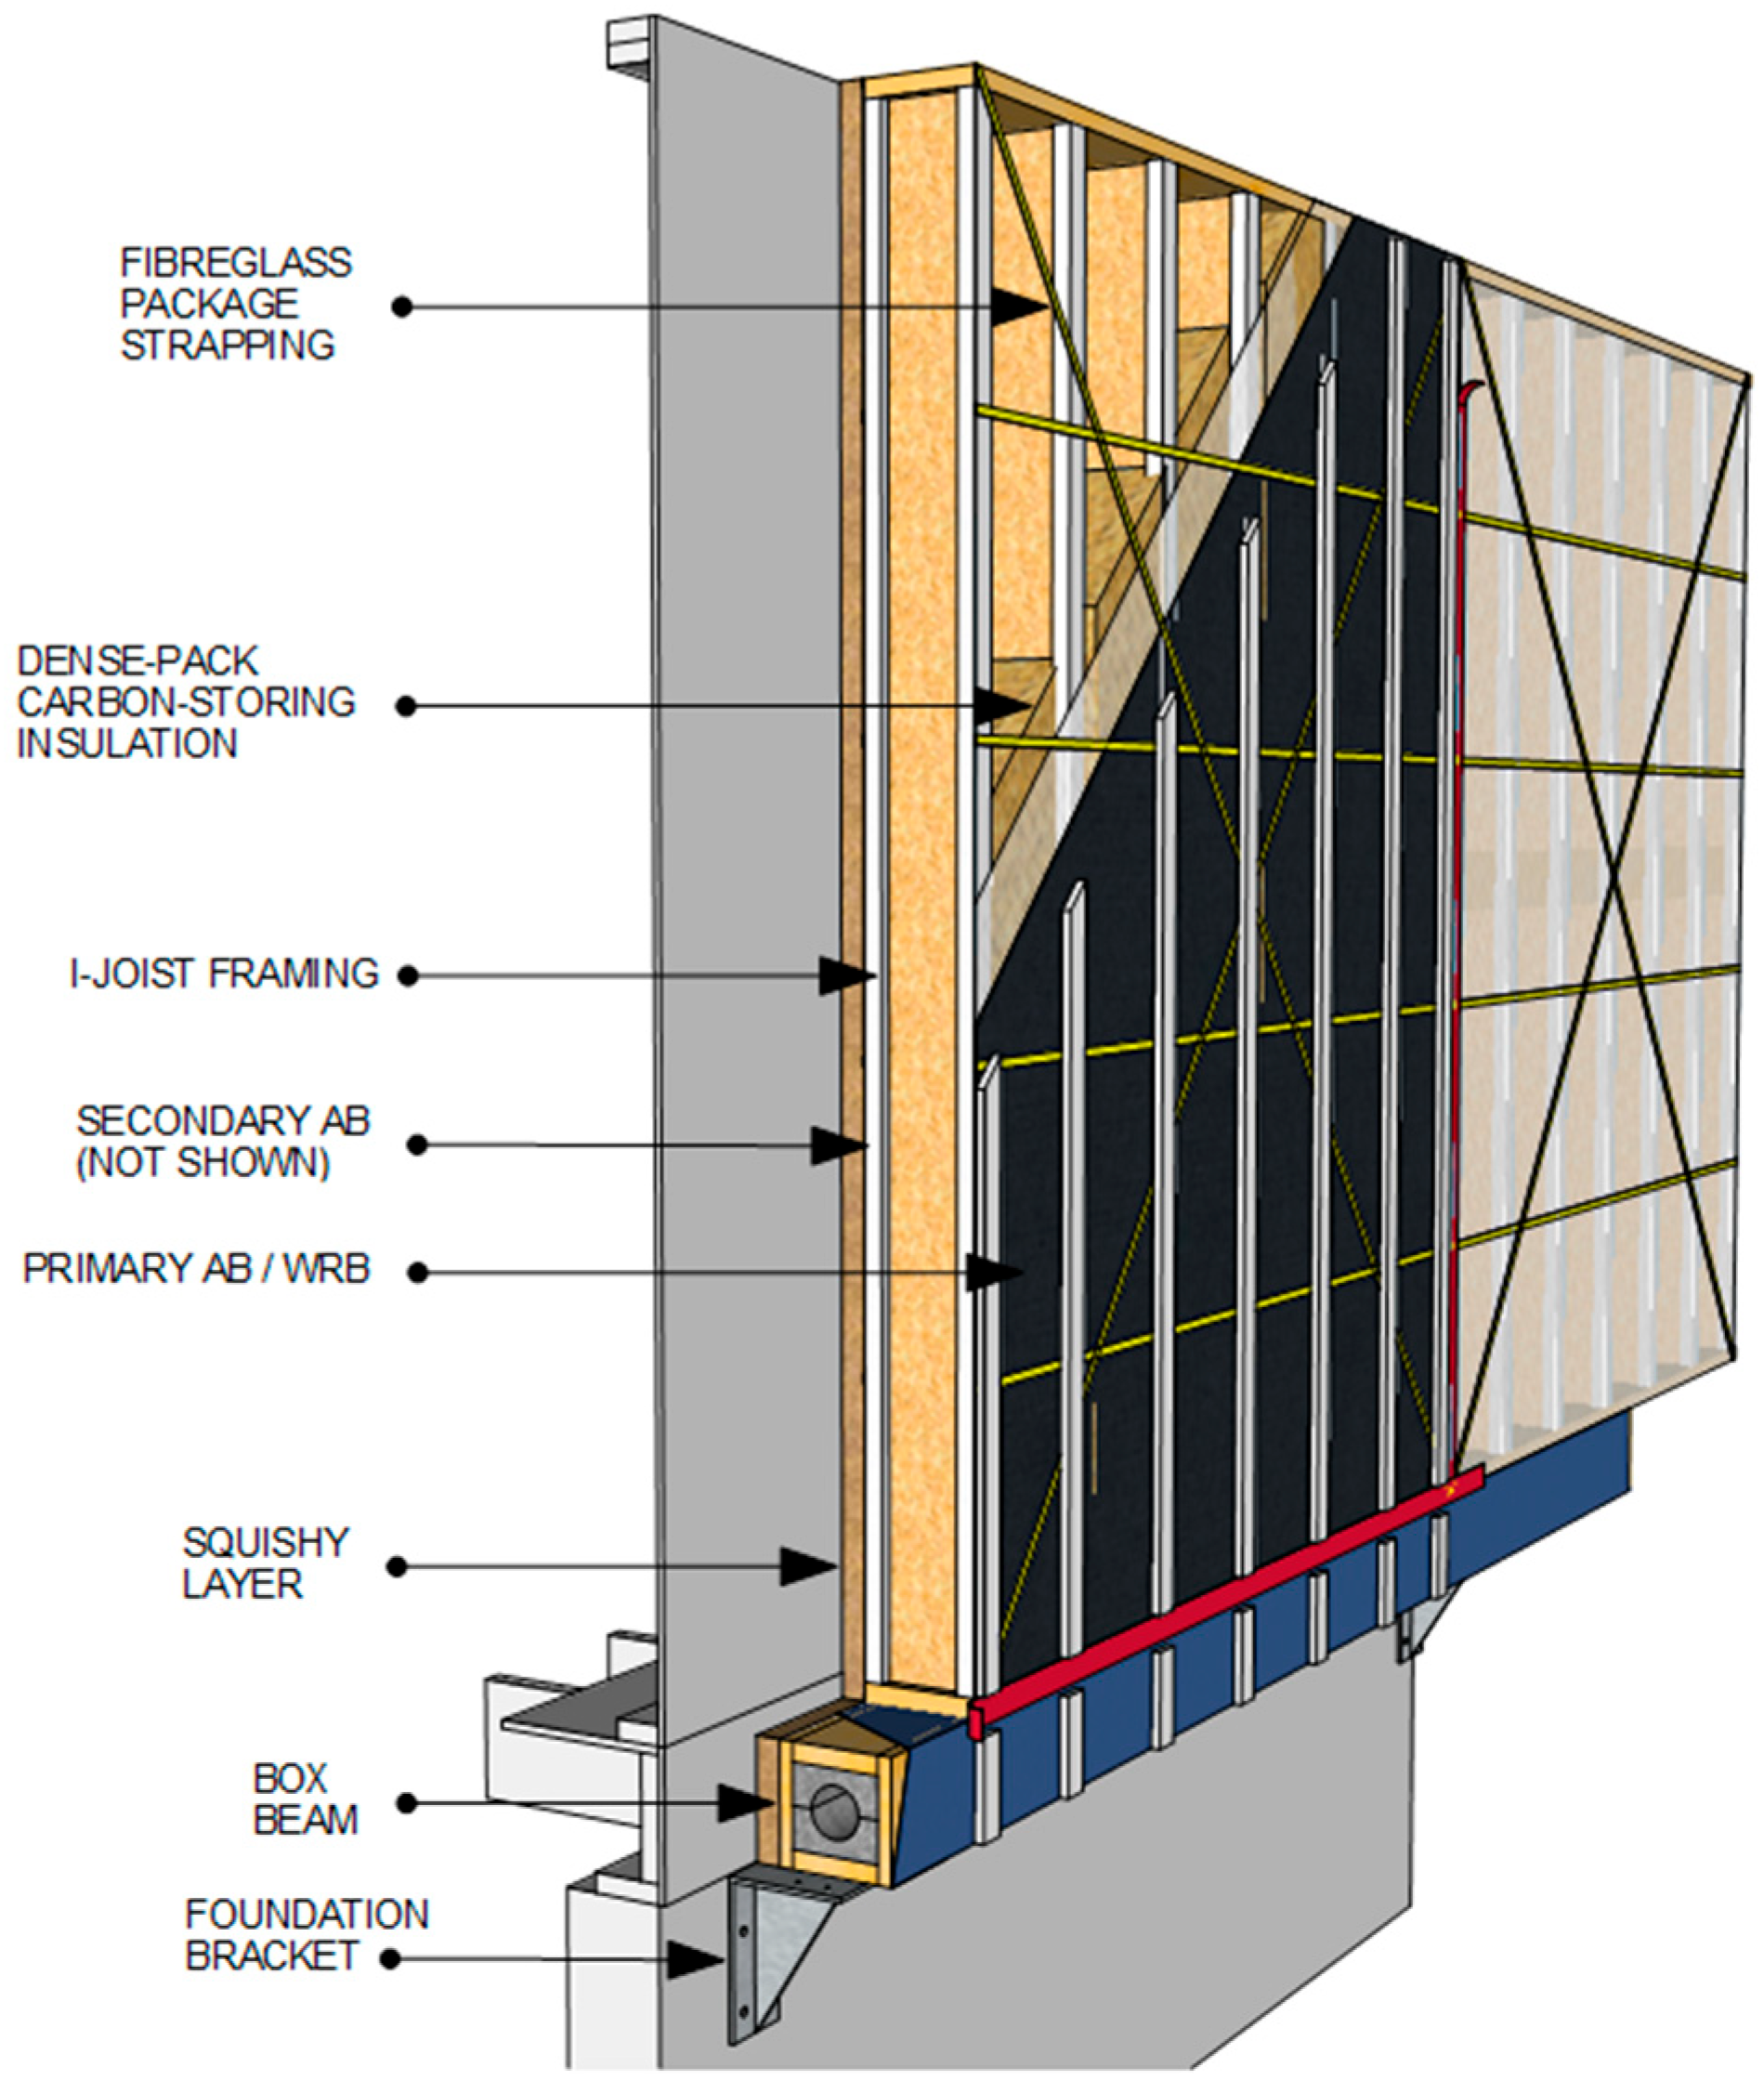
The final design, shown in
Figure 1, used I-joists as vertical framing members to provide a deep cavity to be filled with low-carbon insulation. I-joists are engineered products typically employed in floor and roof systems. They are not designed to be loaded axially, but they are attractive in this application because they are available in long, straight lengths and offer a deep cavity with minimal thermal bridging. For the purposes of this project, the framing cavities were dense-packed with chopped straw and with cellulose insulation (as a control/comparison to chopped straw) but could also incorporate other insulation fills such as hemp, or wood fibre. The panels were wrapped in a vapour-permeable membrane that acted as an air and water control layer, and a retention membrane for the insulation.
In practice, a compressible “squishy” layer is added to the panel to conform to the existing building surface to eliminate the possibility of airflow between the existing building and the panel. For the purposes of this study, the compressible layer was not included.
Chopped wheat straw was selected as the novel insulation material for this test. Cellulose fibre was selected as the benchmark carbon-storing cavity insulation. Cellulose loose fill insulation in Canada typically comprises recycled paper and carboard. It is treated with borate compounds to act as a fire retardant, resist mould growth and insect/rodent infestation. Cellulose is well understood, widely available and is compliant with the National Building Code of Canada and CAN/ULC-S703—Standard for Cellulose Fibre Insulation for Buildings [
15,
16].
The selection of straw and cellulose were determined after a study on market availability of low-carbon and biogenic materials, and the hygrothermal material properties. Based on Statistics Canada’s database, 46.5 million tonnes of straw could be available annually from the wheat and barley harvested in Canada [
17]. Even after accounting for other demands of the agriculture byproducts, it is expected that a surplus remains for many wide-ranging building applications. Additionally, the chopped straw has a thermal conductivity and vapour permeability met the outlined assembly design targets. NRCan undertook hygrothermal material property characterization of the chopped wheat straw, for the following properties to enhance the understanding of dense-packed chopped straw:
Dry density, based on ASTM D2395 [
18];
Air permeance, based on ASTM E2178 [
19];
Vapour permeability, using wet-cup and dry-cup based on ASTM E96 [
20];
Waster absorption coefficient, based on ASTM C1794 [
21];
Moisture storage function, based on ASTM C1498 [
22];
Temperature-dependent and moisture-dependent thermal conductivity, based on ASTM C177 [
23].
Straw-insulated buildings offer lower embodied carbon emissions without more technical difficulties than conventional practices [
24]. However, since straw-insulated buildings are less common, it is perceived that there are barriers to the construction [
25]. Straw-insulated buildings are typically found in two forms: (1) straw bales, and (2) chopped straw for blown-in cavity insulation [
26]. Straw bales are typically installed between framing, and have thermal insulating and moisture buffering capacities [
27]. The moisture-storage capacity of this material, compared to conventional insulation boards like EPS and XPS, aid in managing the moisture loads under extreme conditions. Chopped straw insulation offers similar material property benefits with the ability to introduce prefabrication [
26].
Previous studies have focused on measuring the in-situ performance of chopped straw or straw bale [
26,
28,
29]. Other studies have used a purely numerical approach to evaluate the performance in different climates, assemblies and boundary conditions [
30]. They noted that there were limitations in their investigations that need more in situ and laboratory measurements of chopped straw specifically [
26], highlighting the need for transient and steady-state hygrothermal data [
29]. In all cases, more evidence and future work was needed for chopped-straw-insulated assemblies.
Chopped straw represents a viable, low-carbon alternative to conventional building insulation, along with promising hygrothermal performance that could improve the long-term performance and durability of the envelope. To evaluate the performance under realistic conditions, the following section outlines the test method used to evaluate the thermal and hygric behaviour.
2. Materials and Methods
To fully validate the sheathingless I-joist panel design’s performance, a guarded hot box experiment was commissioned using cellulose fibre and chopped straw insulation and modelling using WUFI Pro 6 [
11]. The methodology included validation parameter selection, design of experiment, development of a hygrothermal model, and a qualitative comparison between experiment and model, shown in
Figure 2. The validation parameters from both studies were statistically compared to quantify the agreement between the experiment and model.
There are limitations on this research methodology. Due to the nature of the experiment, only a finite number of measurement points could be established through the depth of the prefabricated panel. Significant care was taken to position the probes precisely within the assembly; however, once the panels were sealed, access to adjust sensor placement was extremely limited. Furthermore, the initial sensor readings were assumed to represent the baseline condition of the entire material, which may not accurately reflect its true state. To mitigate these limitations, a strict validation range was applied, and model inputs were subsequently revised to improve reliability.
2.1. Guarded Hot Box
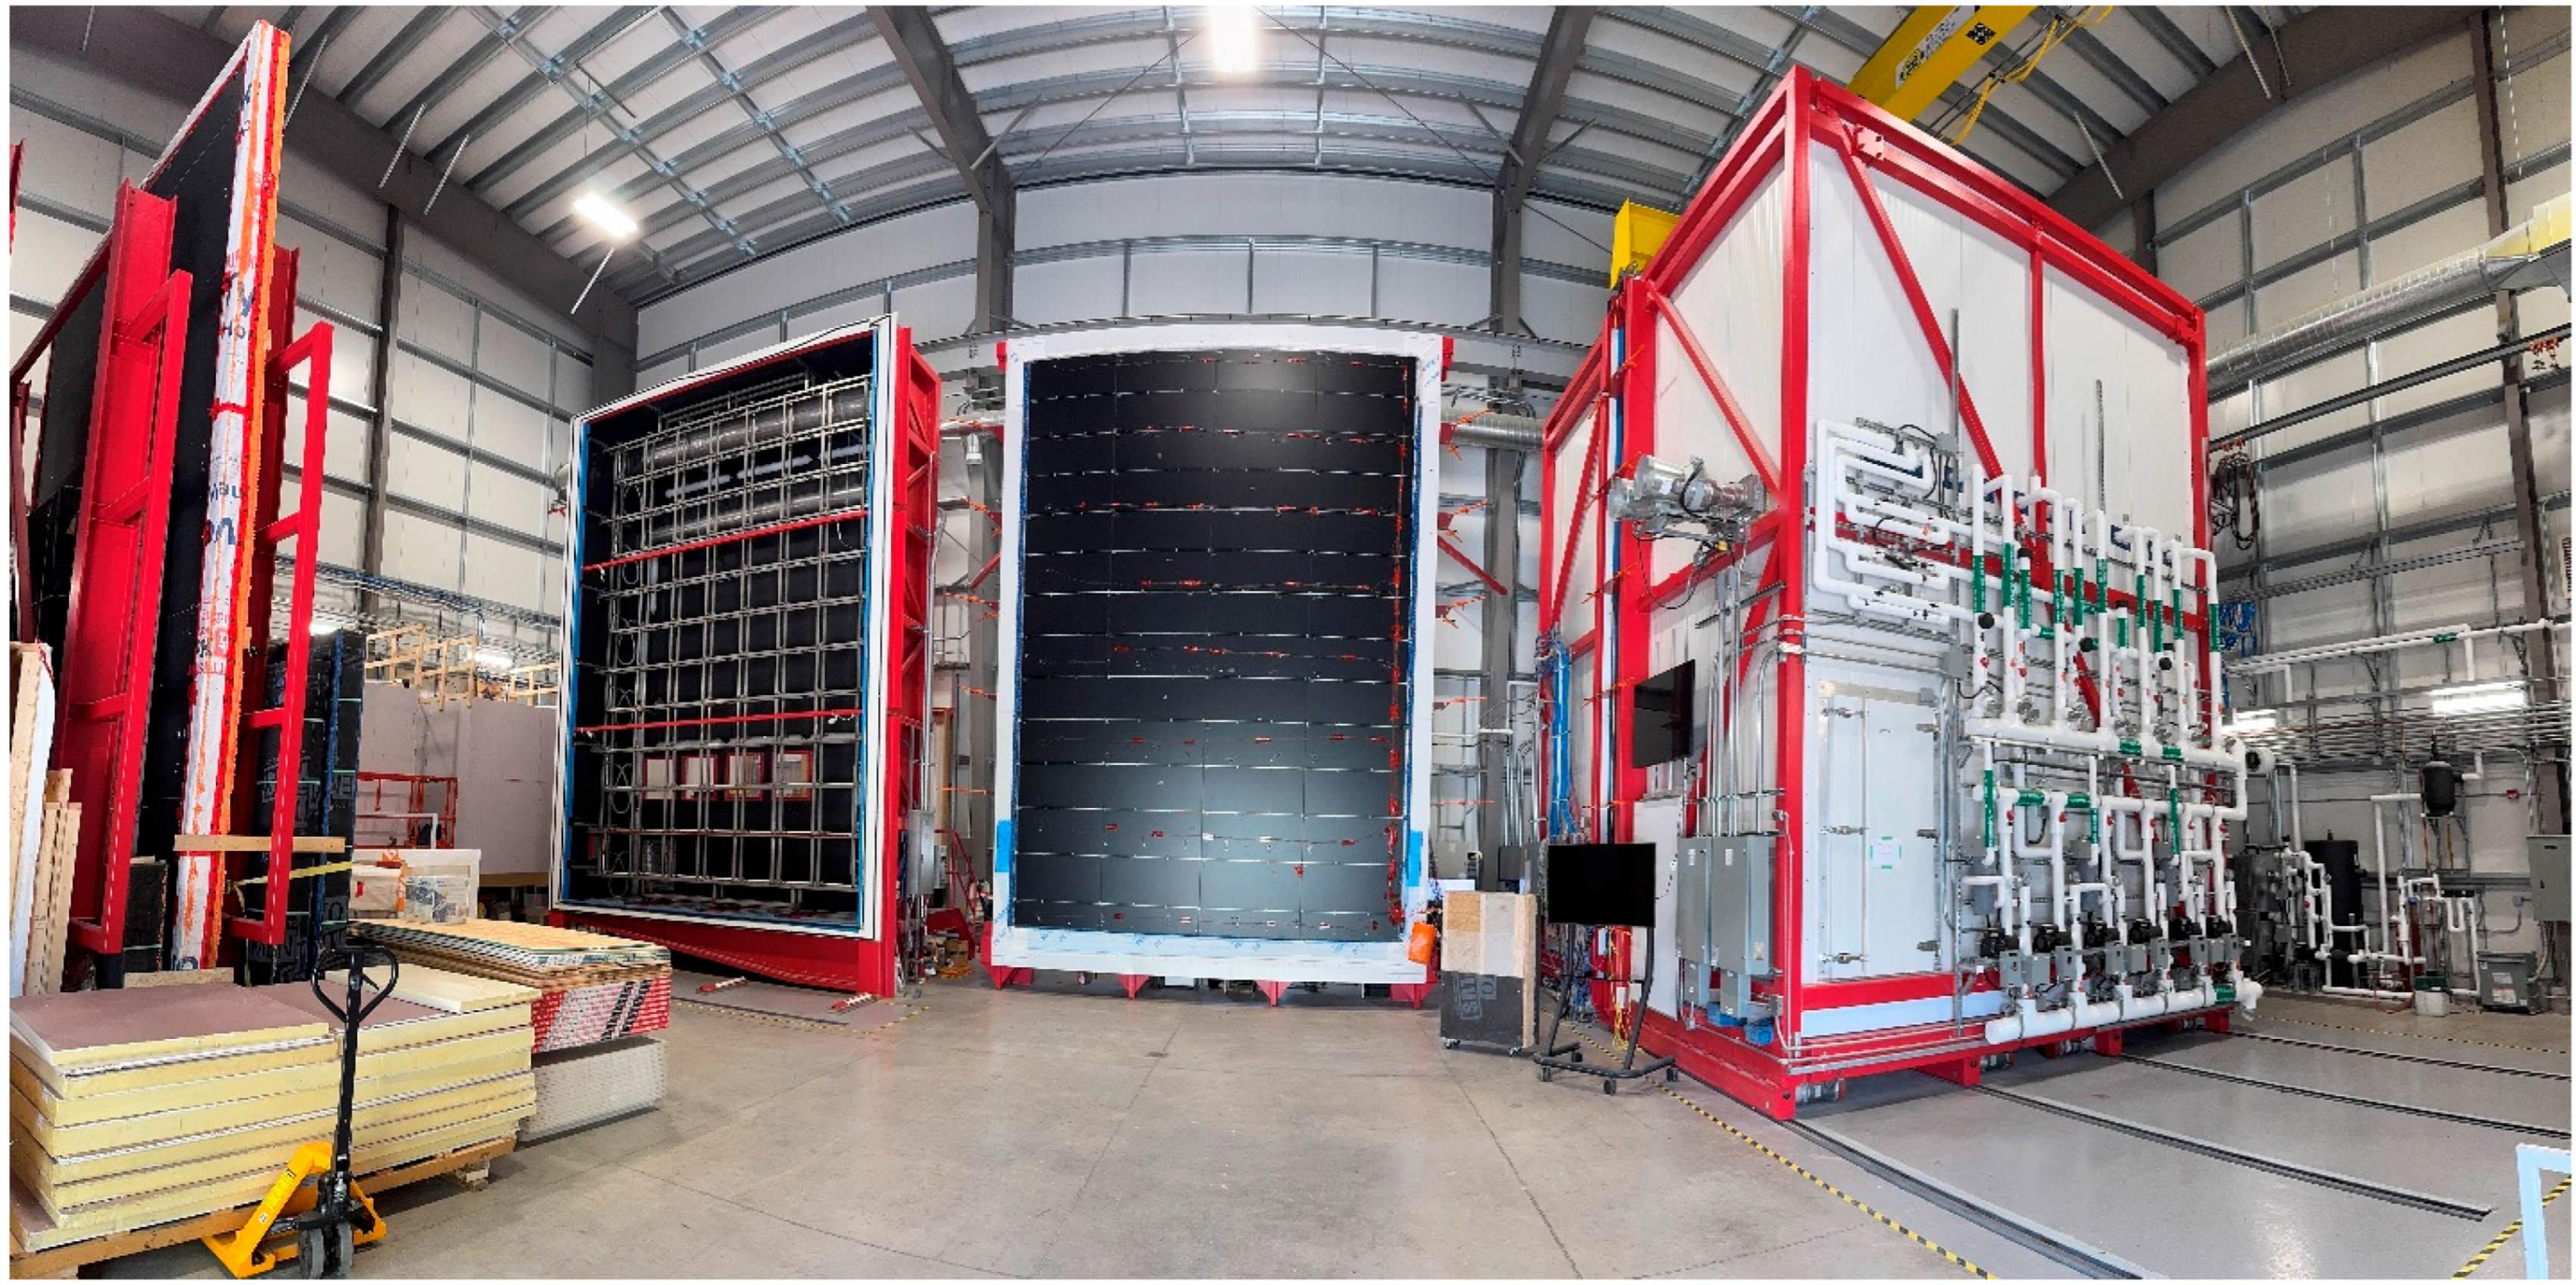
The guarded hot box (GHB) at the Centre for Advanced Building Envelope Research (CABER), shown in
Figure 3, was used to experimentally evaluate the hygrothermal performance of the developed panelized retrofit system. The GHB has been designed and calibrated in accordance with ASTM Standard 1363 [
31]. In addition to the standard, pressure and humidity are controlled on both sides of the test assembly to observe a broader set of hygrothermal conditions. As such, the panelized assemblies were evaluated under a range of climactic conditions, summarized in
Table 2.
These conditions were selected to simulate vapour drive and heat transfer inward and outward under steady-state and transient conditions. Each setpoint was maintained for a 5-day period, and the total test period was 30 days. The pre-test period is used to reach an equal temperature and relative humidity within the sample. The steady period is used to create a constant vapour drive, using constant exterior and interior conditions. The transient period cycled between two exterior air conditions (temperature and relative humidity) using a step-function every 12 h to observe the time-dependent hygrothermal response, shown graphically in
Figure 4. These conditions were selected based on a cold, humid climate and were used for numerical validation.
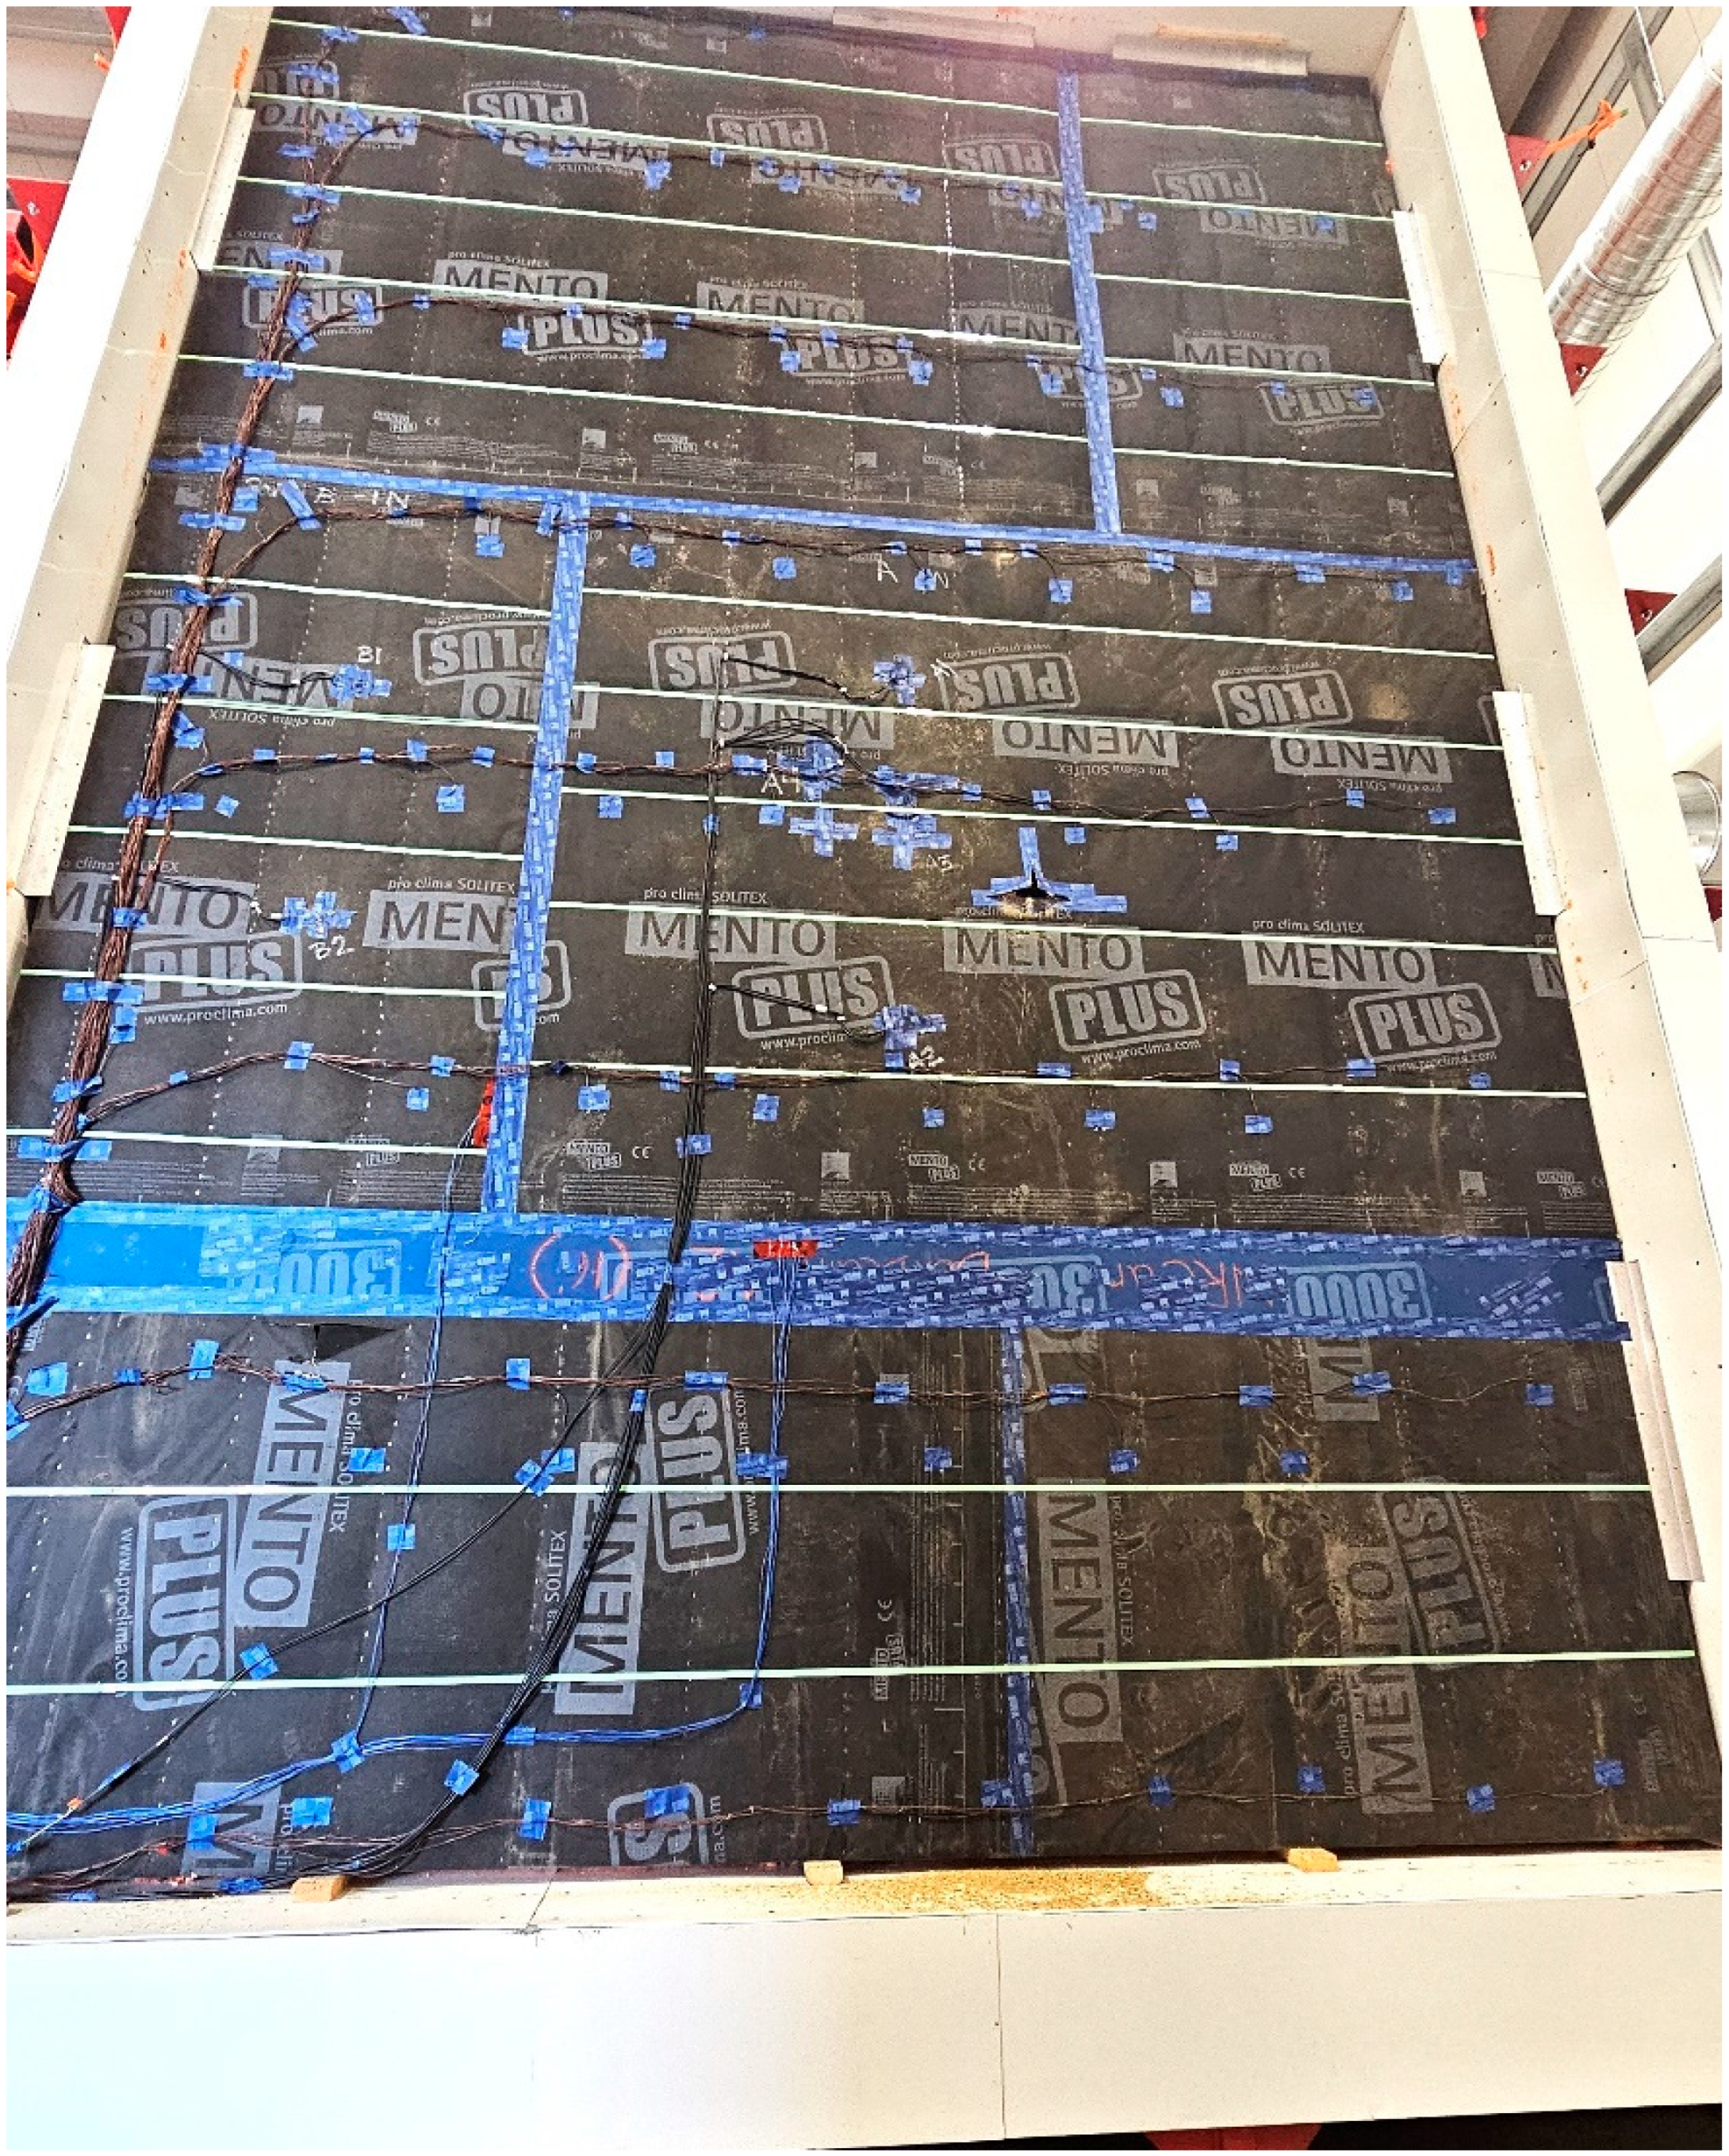
Qualitative assessments were undertaken to understand the system performance after testing was completed. The meter and guard box were removed from the sample, exposing the interior face of the assembly, as shown in
Figure 5. To qualitatively determine the air tightness of the sample and to identify leaks, a theatrical fog machine was placed in the climate box, and the climate box was then pressurized in steps up to +100 Pa relative to the base building; any air leakage occurring through the test assemblies was observed.
Localized thermal bridging was assessed using an infrared thermal camera. With the equipment in the same orientation, the climate chamber was cooled to −5 °C and thermal images were taken after reaching pseudo steady conditions. The most prevalent thermal bridges (coldest areas on the interior surface of the walls) were located and captured. These showed the weak points in the design, and areas where improvement is possible.
Installation
The first step was the experimental set-up and installation of the panelized system into the guarded hot box magazines. It was critical that the panels be installed using the same methodology and materials that would be employed in the field, with only minor modifications made as needed to accommodate the unique nature of the installation within the guarded hot box. The magazine is 600 mm in depth, and the samples had to be installed flush with the exterior face of the magazine. Typically, samples are attached to the magazine using structural screws through the structural members of the sample, into the side of the magazine. Due to the nature of the panels, the use of wood I-joists as the edge members and the fact that they came fully complete with exterior membranes, it was determined that the typical method of structural screws would not meet the requirements for this application. As such, eight 50 mm × 75 mm × 4.7 mm aluminium angles, each approximately 1 m in length, were installed to structurally attach the panels to the magazine.
The installation of the panels began with the bottom row, shown in
Figure 6, and installed up from there, with the same attachment methods, as were used in the pilot project, which included an expanding gasket on the interior surface, compressed hemp batt insulation, and then taped on the exterior surface with vapour-permeable tape. The panels were designed and installed with an approximately 25 mm (1”) gap between the exterior edge of the panel and the interior surface of the magazine. Once all the panels were installed and the seams taped, a bead of spray foam was installed on the outside edge of the panels, sealing the panels to the magazine and preventing any air or moisture transfer around the specimen.
2.2. Instrumentation
The samples were instrumented with sensors to accurately measure the hygrothermal performance of the assemblies. Instrumentation was primarily installed inside the panels to measure the thermal and vapour profiles through the assembly, and surface-mounted to confirm the boundary conditions for the test conditions.
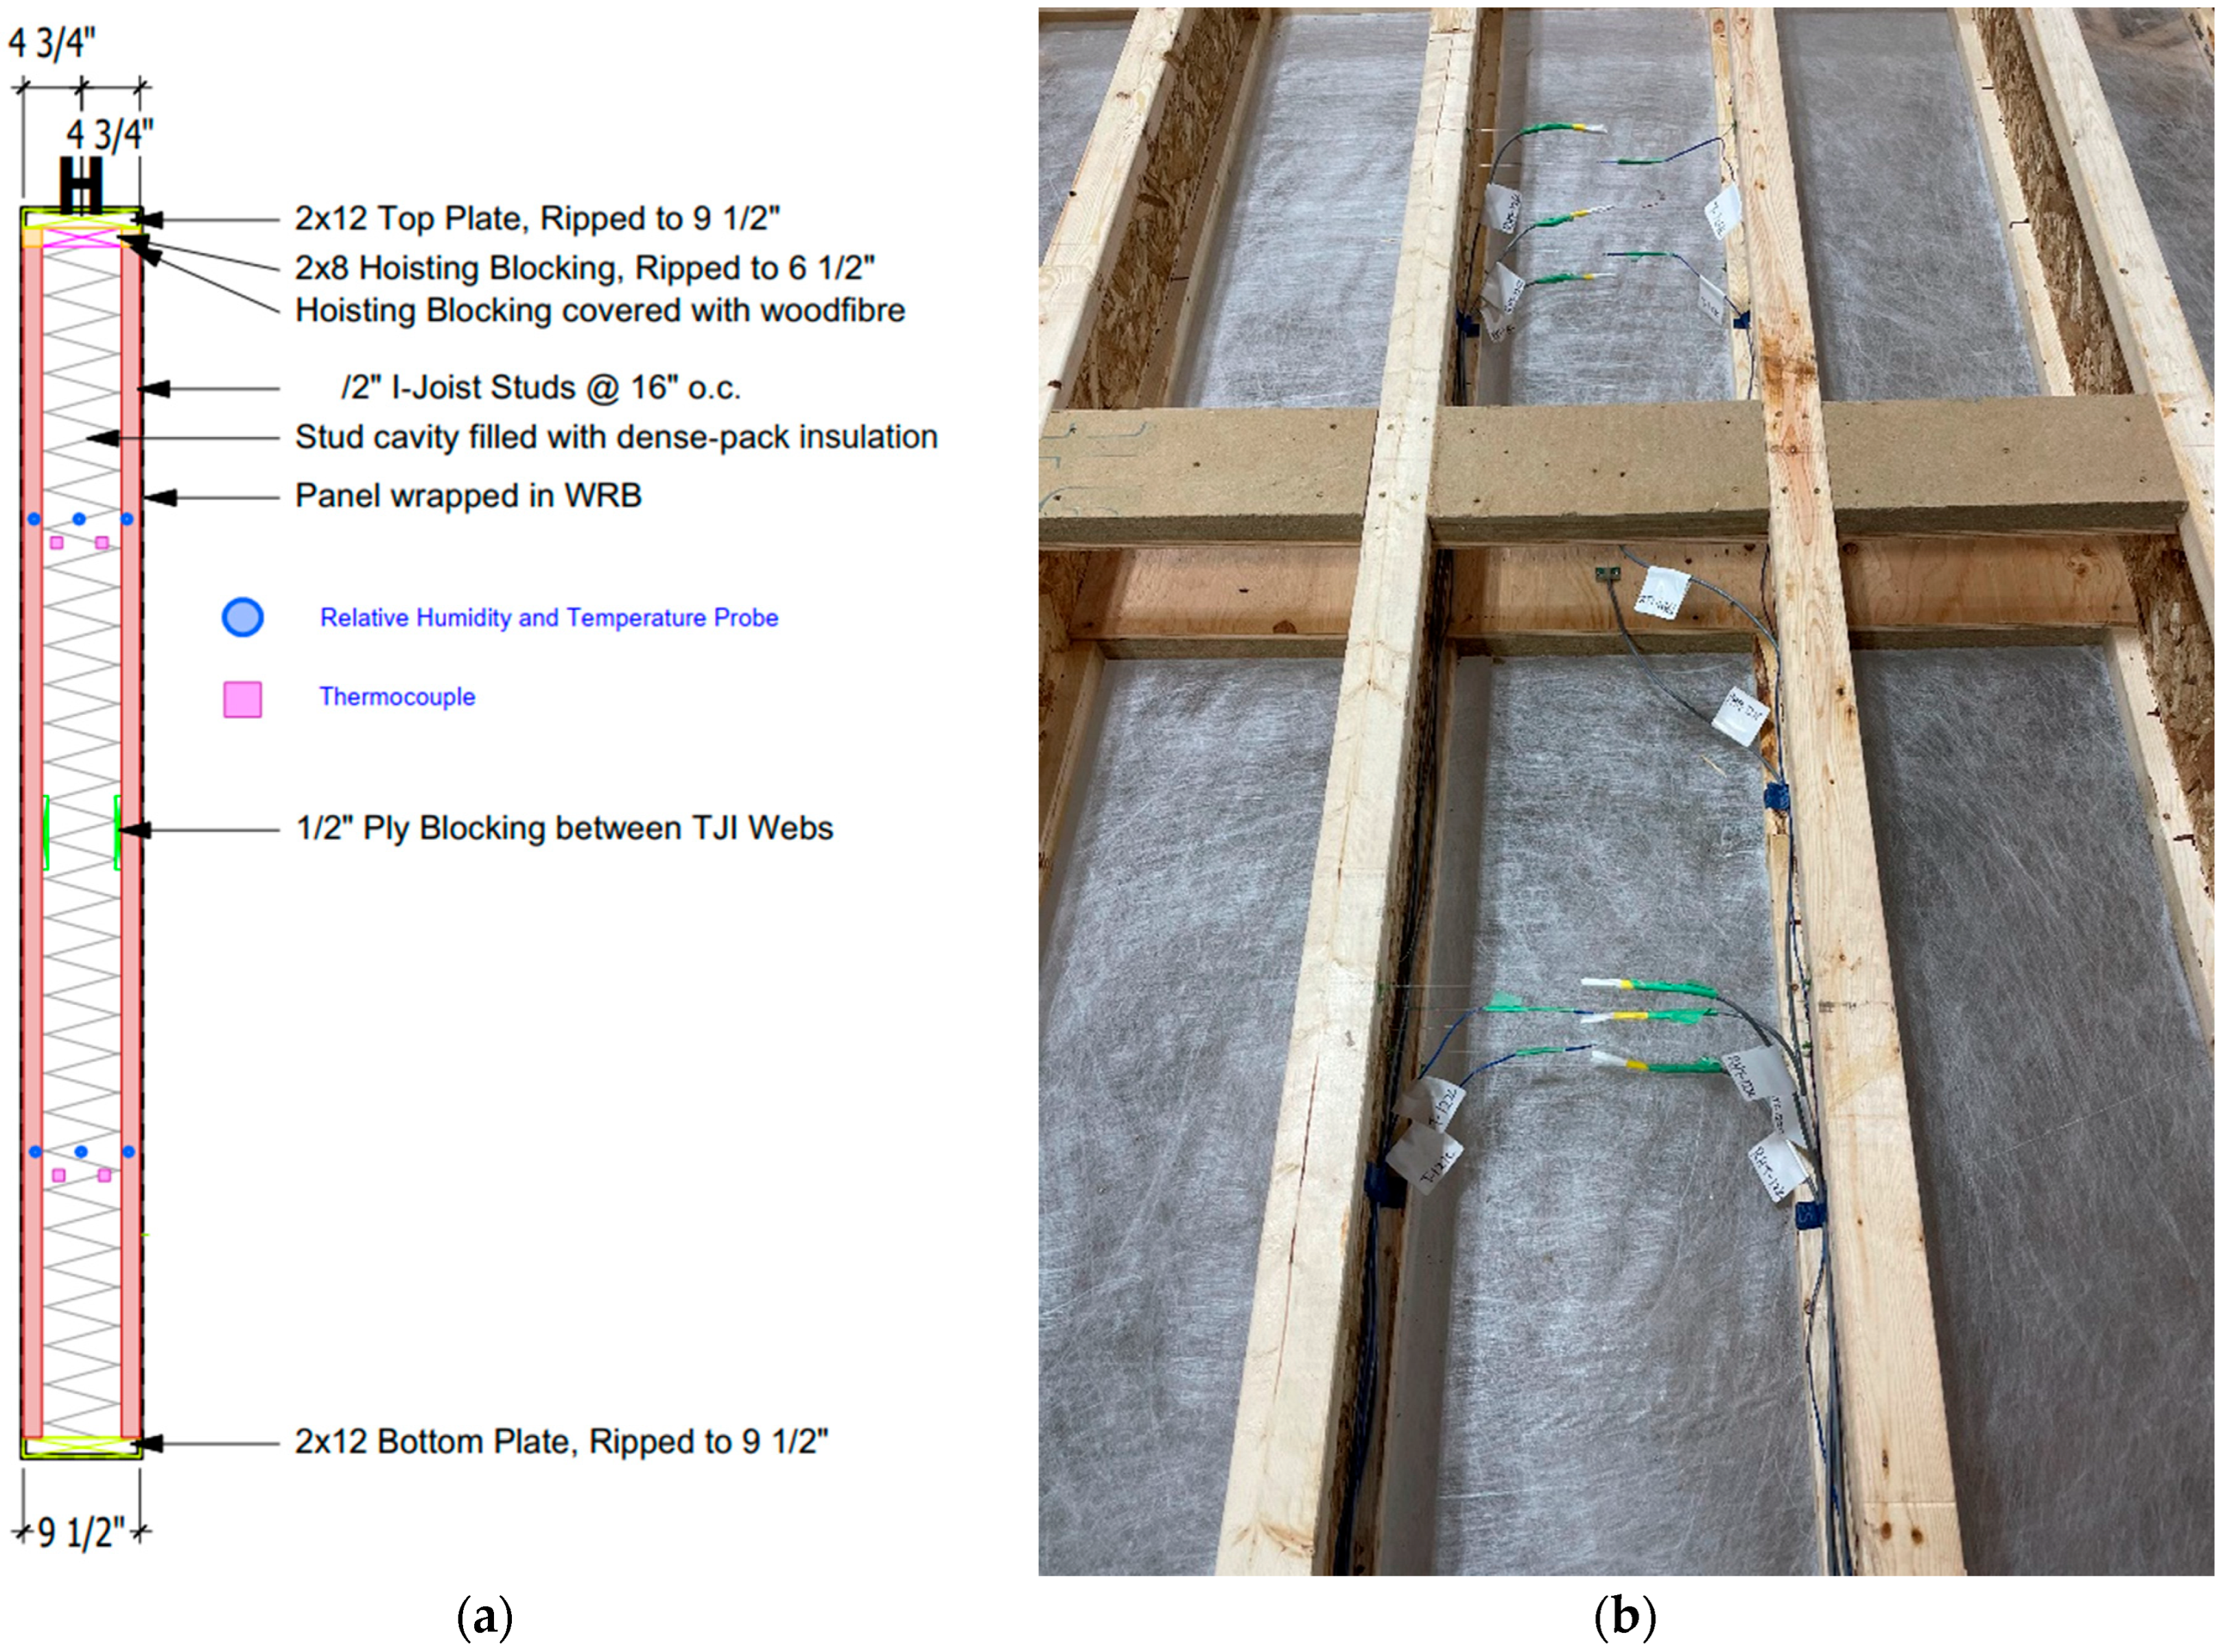
Within the panels, relative humidity, temperature and wood moisture content sensors were included. Sensors were placed in I-Joist studs and at five different planes in the cavity. The instrumentation layout is shown in plan and section view in
Figure 7a, and photos of the sensors in the cavity before blowing in the cellulose insulation in
Figure 7b. The sensors were attached to a suspended line in the cavity to ensure the sensor position did not change during the cellulose dense-packing. This proved to be a successful approach; however, this was completed by the panel supplier and required more preparation from the researchers, and additional time and attention to detail from the supplier to ensure it was successful.
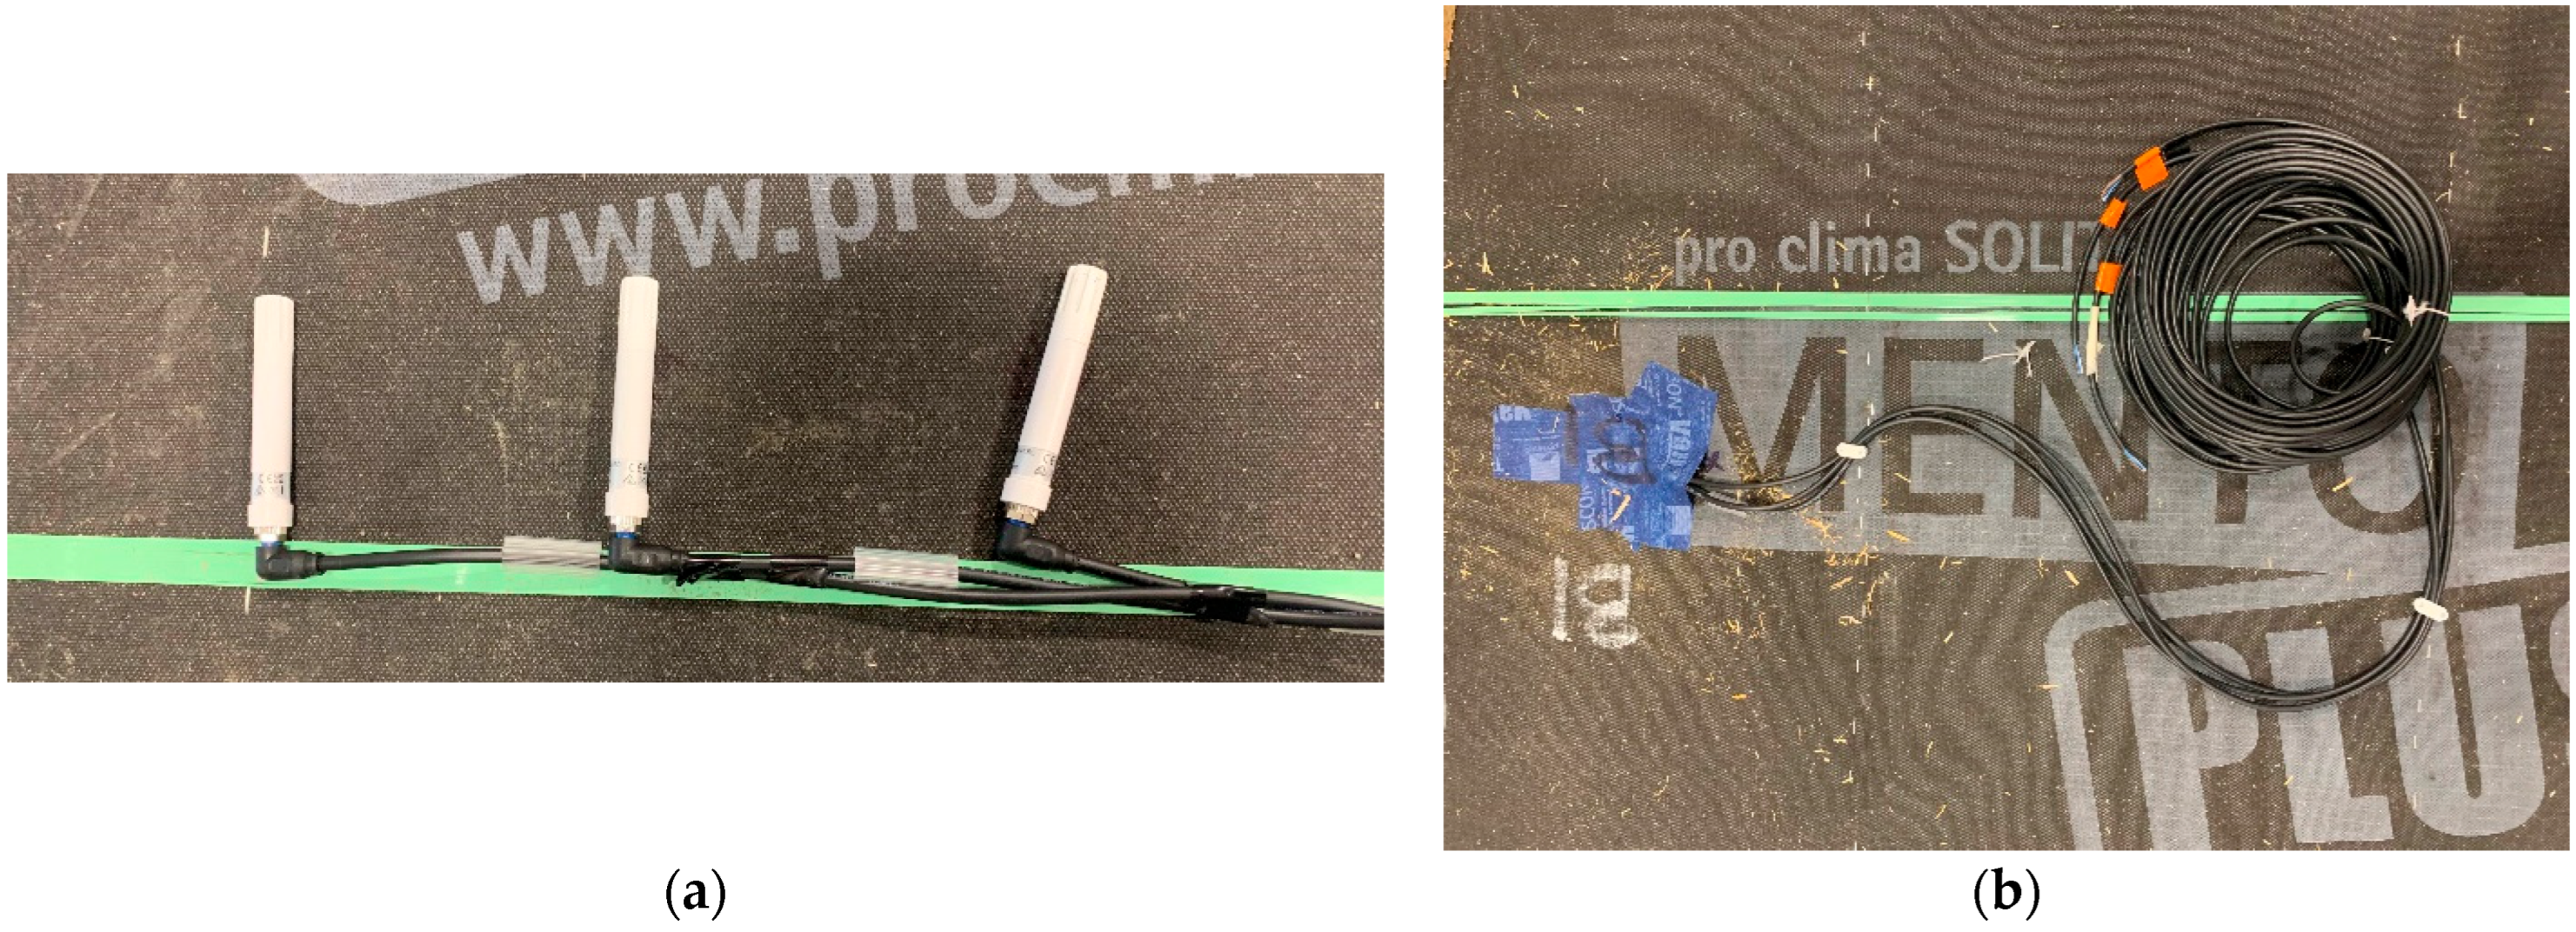
With the straw panels, the sensors were installed after the panels were fully fabricated. Three relative humidity and temperature (RH/T) probes were evenly spaced to span I-joist depth and bonded together using tape, shown in
Figure 8a. A small hole was cut in the membrane, and the bonded probe was slid into the cavity and taped to the backside of the membrane. Any straw that fell out of the hole was re-packed by hand, and the hole was sealed with membrane tape with the sensor lead exposed on the face, as shown in
Figure 8b. This approach was found to be acceptable; however, it was noted that adding the sensors before insulating the cavities resulted in better consistency, control and accuracy.
A total of 36 Type-T thermocouples were surface-mounted to each side of the samples to align with ASTM 1363 standard [
31] for thermal testing using a guarded hot box. While ASTM 1363 does not address hygrothermal testing, it was used to capture the baseline measurements needed in the assembly. Surface-mounted thermocouples were in a grid patten spaced 500 mm horizontally, and 1000 mm vertically on the interior and exterior faces. An additional 24 surface-mounted Type-T thermocouples were installed around the perimeter of the sample, within the guard area, to ensure uniform temperature distribution through the guard and metering area, and that 1D heat transfer was occurring within the sample. A photo of the surface-mounted thermocouples is presented in
Figure 9.
Finally, permanent sensors were employed to characterize the air conditions in the chambers. Thermocouples were placed on the baffle walls to measure the radiative heat transfer between the baffle wall and the sample. Thermopiles were used to measure the conductive heat loss through the metering chamber walls. Thermocouples and pitot tubes in the climate and metering air curtain were also used to measure the convective heat transfer. Relative humidity and pressure were measured in both chambers to determine the vapour and pressure differential across the samples. These permanent sensors are calibrated periodically to ensure compliance and accuracy.
2.3. Hygrothermal Modelling
The experimental data provided by the guarded hot box testing were used to validate the hygrothermal model. The modelling engine used was WUFI Pro, which is a heat and mass transfer model used to perform one-dimensional coupled heat and moisture transfer analysis for building enclosure sections [
11]. User-defined inputs such as boundary conditions, material layers and material properties were provided to the model, and a heat and moisture calculation was performed for each timestep. The modelled temperature, relative humidity and vapour pressure were validated against the experimental results, and the estimated MAE and mean absolute percentage error (MAPE) was reported
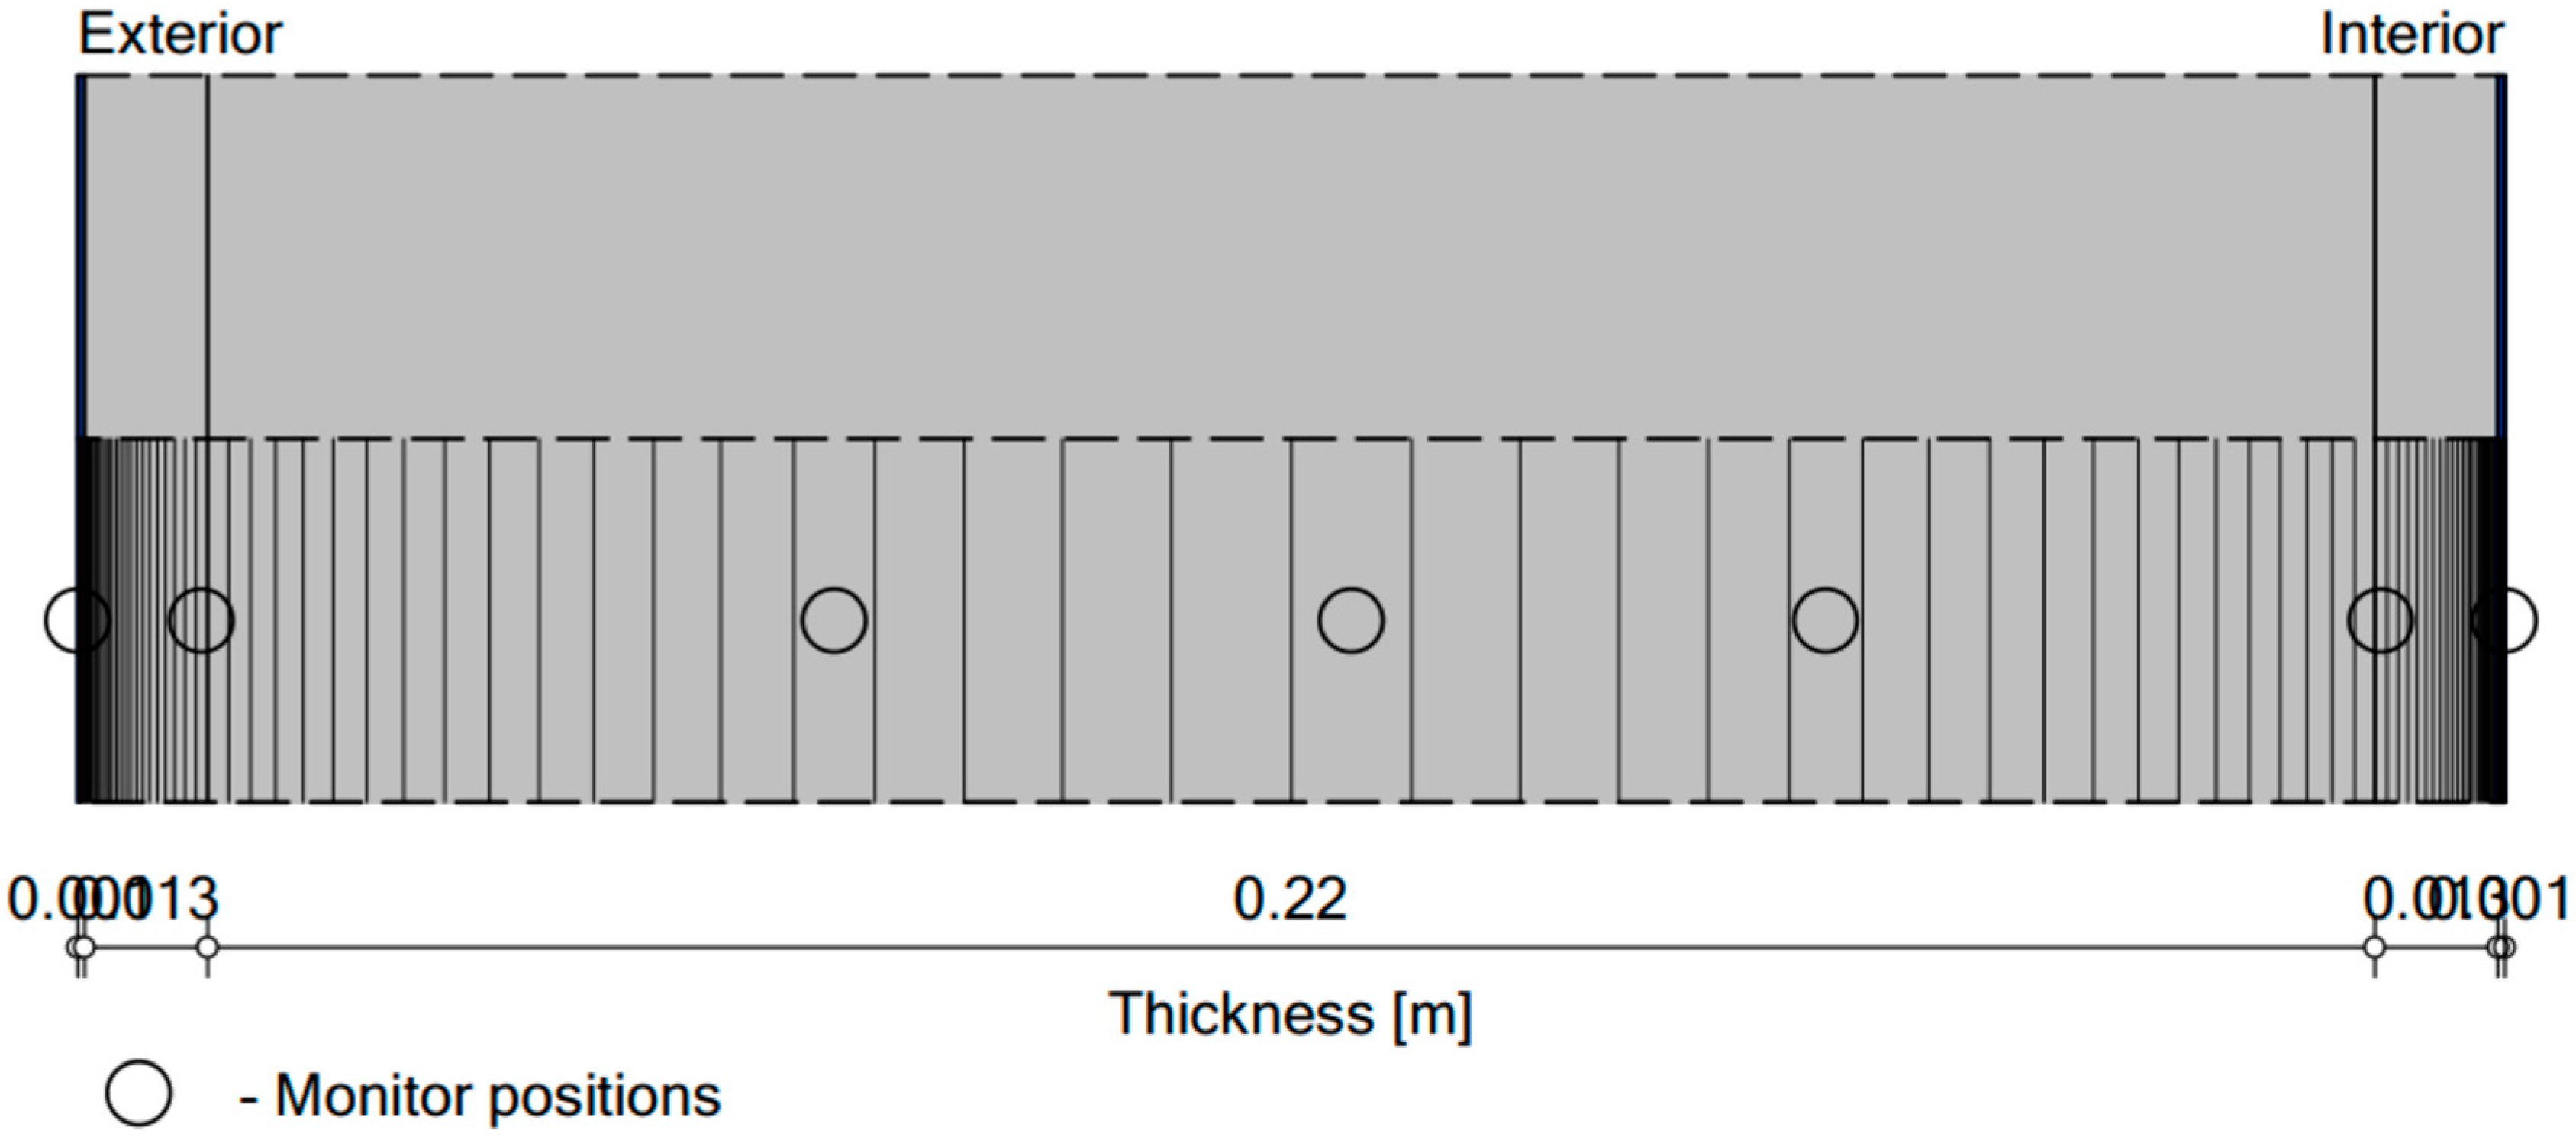
The model construction, shown in
Figure 10, represents only the panelized component, and ignores the backup wall construction, like the guarded hot box experiment. The backup wall was excluded to reduce the uncertainty from having more materials and have a stronger hygrothermal response from the low-carbon panelized system. As such, the model included the insulation bounded by two layers of membrane. The insulation layer was separated into multiple layers to increase the finite elements at the first 42 mm of the material layers, and to approximate the location of the wood moisture content meters.
The boundary condition was an important parameter to match between the experiment and the model. A WUFI climate file was created using the measured hourly, averaged temperature and relative humidity from the experiment boundary conditions. Since the experiment took place in an enclosed climate chamber, as opposed to in situ, other weather metrics such as solar radiation, wind speed and direction, and rain fall were not included in the climate files. The boundary conditions were tightly controlled, and as a result, the experiment introduced less uncertainty compared to other methods for model validation with measured data.
The material properties input into the model were measured directly in the lab if possible, or taken from material specification sheets, or the WUFI generic material database if necessary. New WUFI materials were created for the air barrier/water resistive barrier (AB/WRB), the cellulose insulation and the chopped straw insulation. For the AB/WRB, the base properties from a similar product were used, but the membrane’s water vapour diffusion resistance factor was substituted with a value of 114 available on the specification sheet. A new material for the cellulose was created by copying a generic cellulose material from the WUFI database and updated based on measured laboratory data [
32] and replacing the thermal conductivity values with measured values from a guarded hot plate. The dense-packed straw was not available on the WUFI database, so a wide range of material properties tests were performed to gather the necessary information for the WUFI simulation. The straw and cellulose material properties used for modelling are summarized in
Table 3.
The initial conditions for RH and temperature in the layers were set to match the experiment’s initial timestep. In the case of the cellulose panel, the temperature and RH were constant across the assembly because the panels were at lab conditions before the experiment began. The straw panel had a gradient of temperature and RH since there the experiment was restarted due to an equipment malfunction. In this case, the temperature and RH was approximated using the readings from internal panel sensors at the first timestep. The initial conditions were applied separately to each layer.
The model was run at 1 h timesteps, and the modelled period matched the number of days from the experiment. Other considerations for settings in the model such as initial conditions, orientation, surface transfer coefficients and air and moisture sources were made to best replicate the experiment, set as the default value or excluded due to the lack of impact on the outputs.
3. Results
3.1. Cellulose Panel
The measured and modelled results were compared during the period. The cellulose panel temperature, relative humidity and vapour pressure followed similar trends. These findings support the research method, and highlight areas where it could be refined. It was observed that the measured temperature response presented in
Figure 11 during the transient periods was slower than the model. This could be interpreted by differences in the assumed surface convection, expected near natural convection due to the baffle. The model may overestimate convective heat transfer. During the steady test periods, the modelled and measured temperatures were within a 0.5 °C band. The alignment suggests that the assumed material conductivity for the dense-packed cellulose was appropriate.
The relative humidity comparison, shown in
Figure 12, was within 3% RH for the test period, except for the second acclimatization period, and a brief data collection outage during the summer transient period. Otherwise, the values showed strong agreement throughout the period. At the centre of the cavity, the relative humidity steadily increased over time with the increasing temperature and humidity at the boundary conditions, unlike the temperature under transient conditions. The alignment between modelled and experimental data suggested that the material properties assumed for the vapour permeability and moisture-storage function of dense-packed cellulose were acceptable.
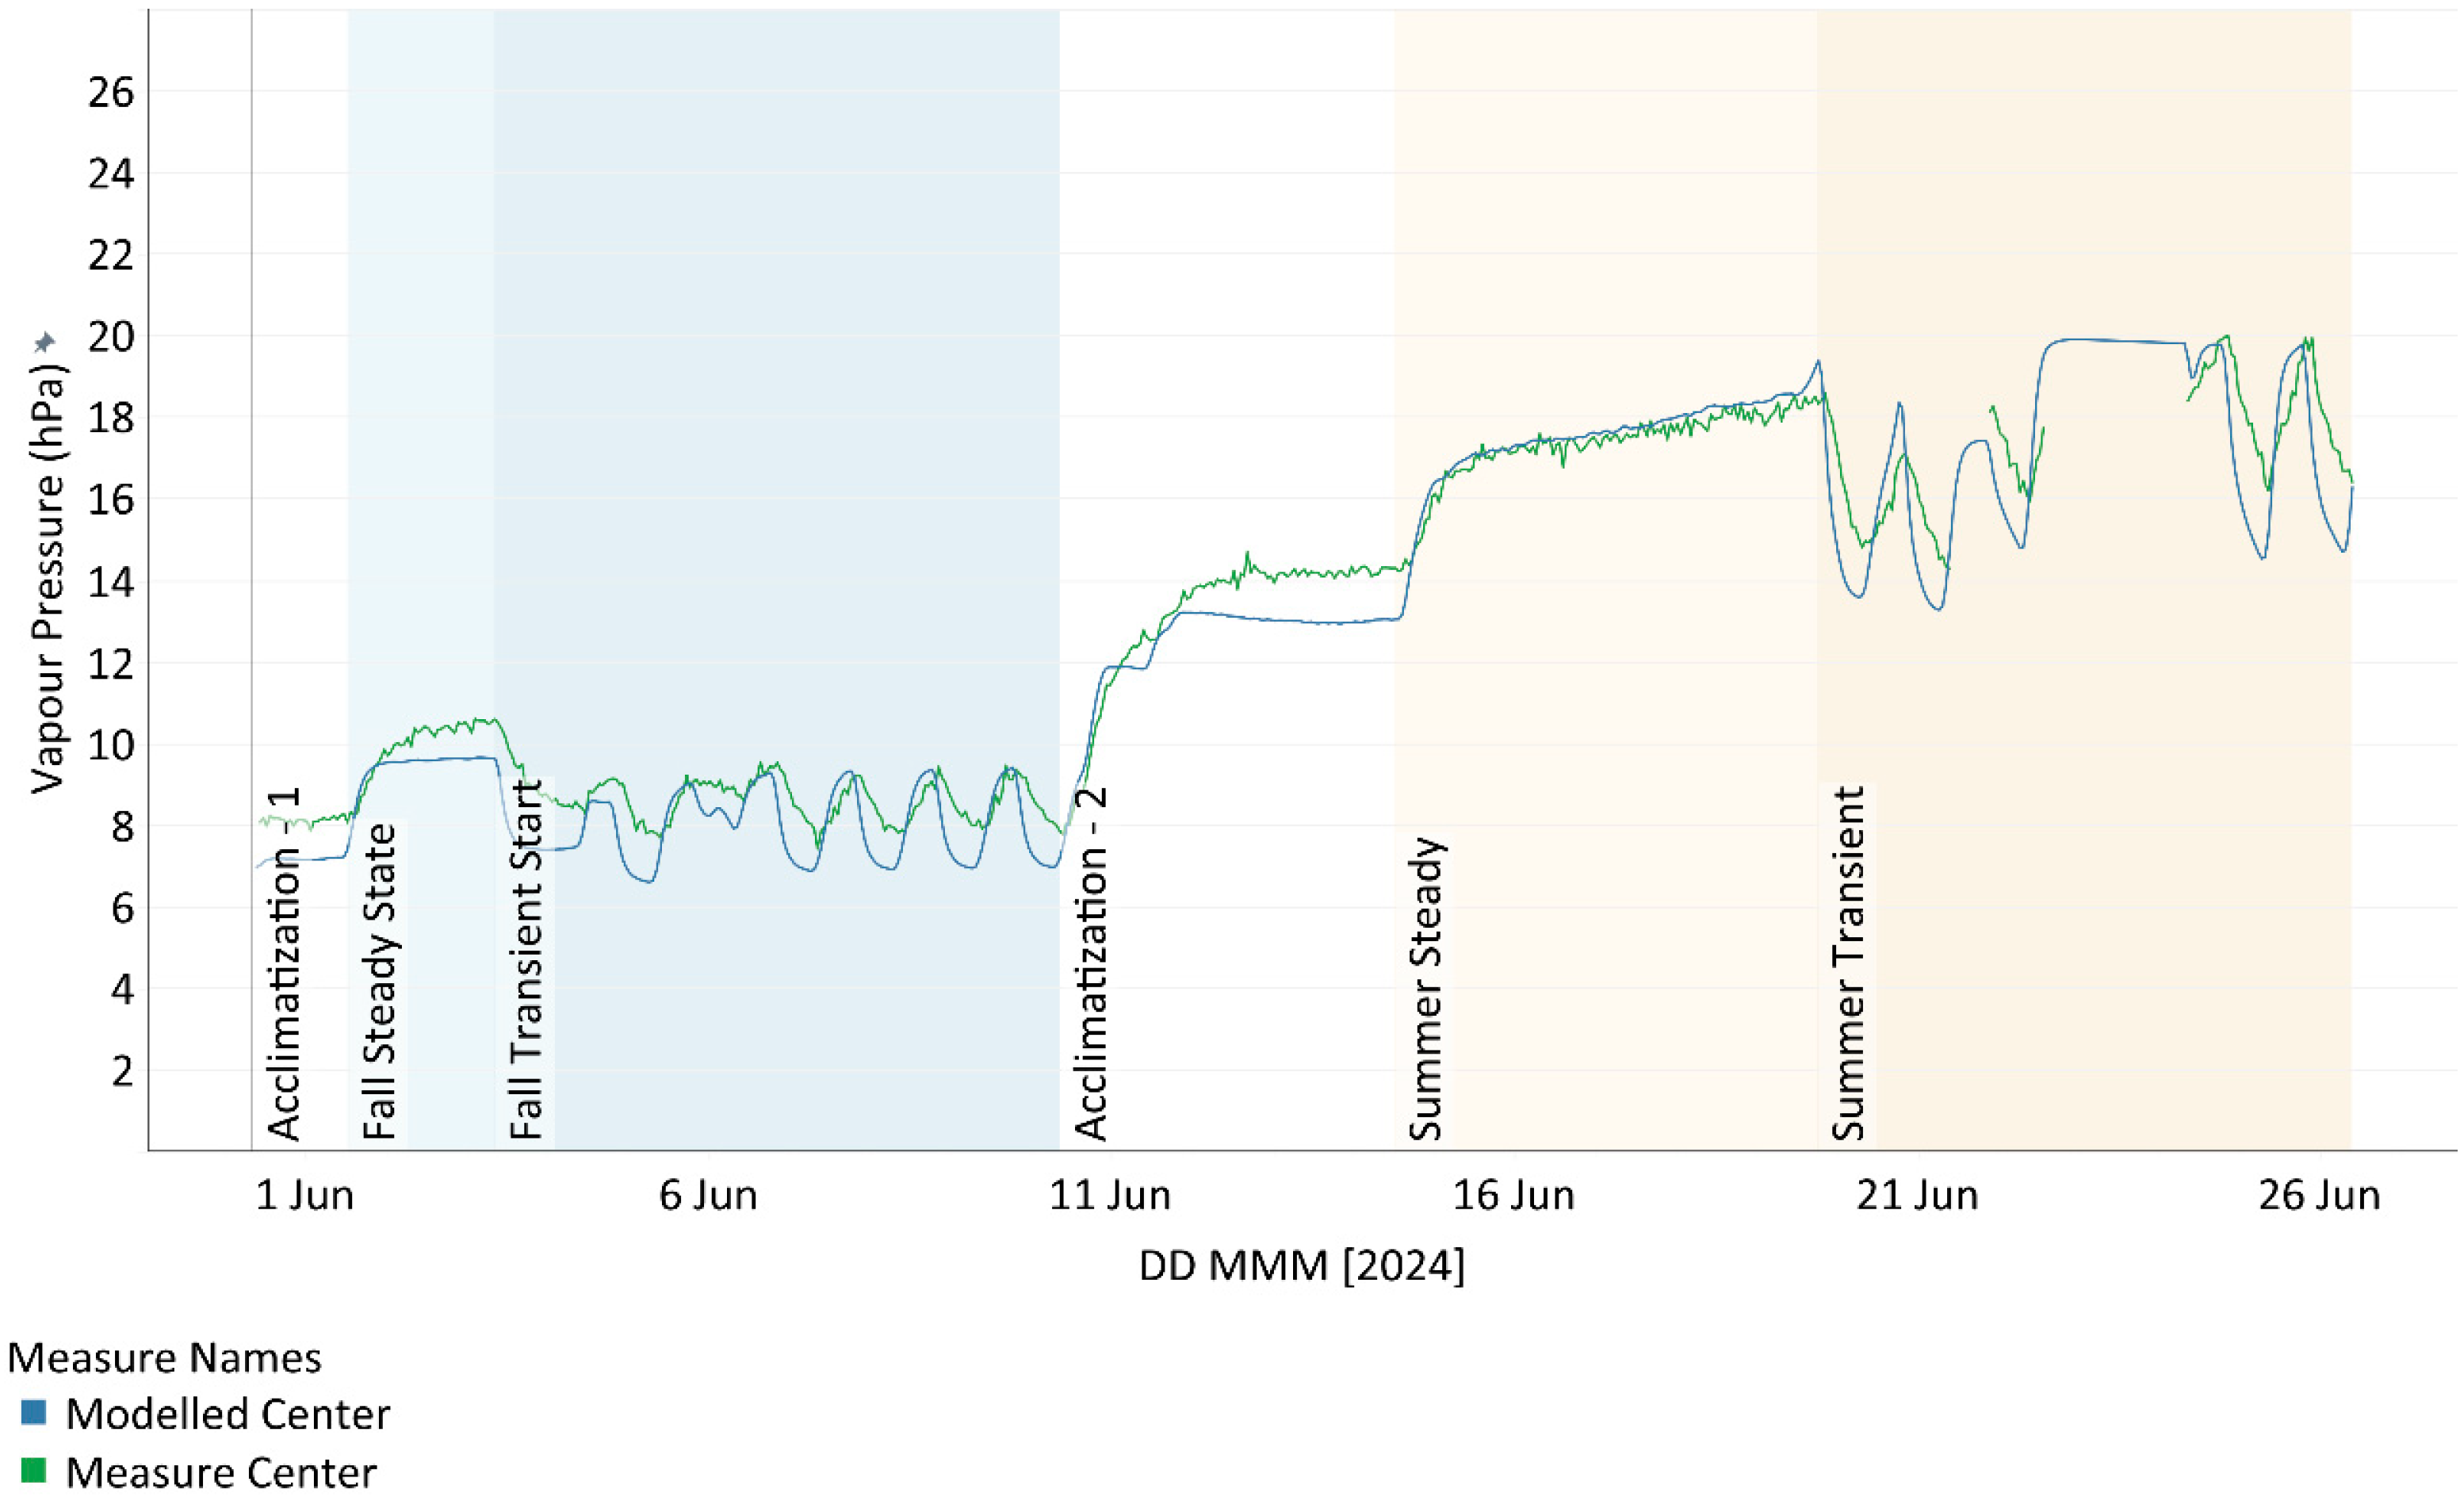
Similar observations were made for the modelled and measured vapour pressure, presented in
Figure 13. During the transient periods, the calculated vapour pressure response was slower than the model due to its dependence on the temperature. The calculated vapour pressure was calculated from the measured temperature and relative humidity for the timestep; therefore, the temperature response would have a strong impact on the vapour pressure response. At steady conditions, the modelled vapour pressure in the cellulose panel was observed to be within 1 hPa of the vapour pressure derived from the experimental data.
3.2. Chopped Straw Panel
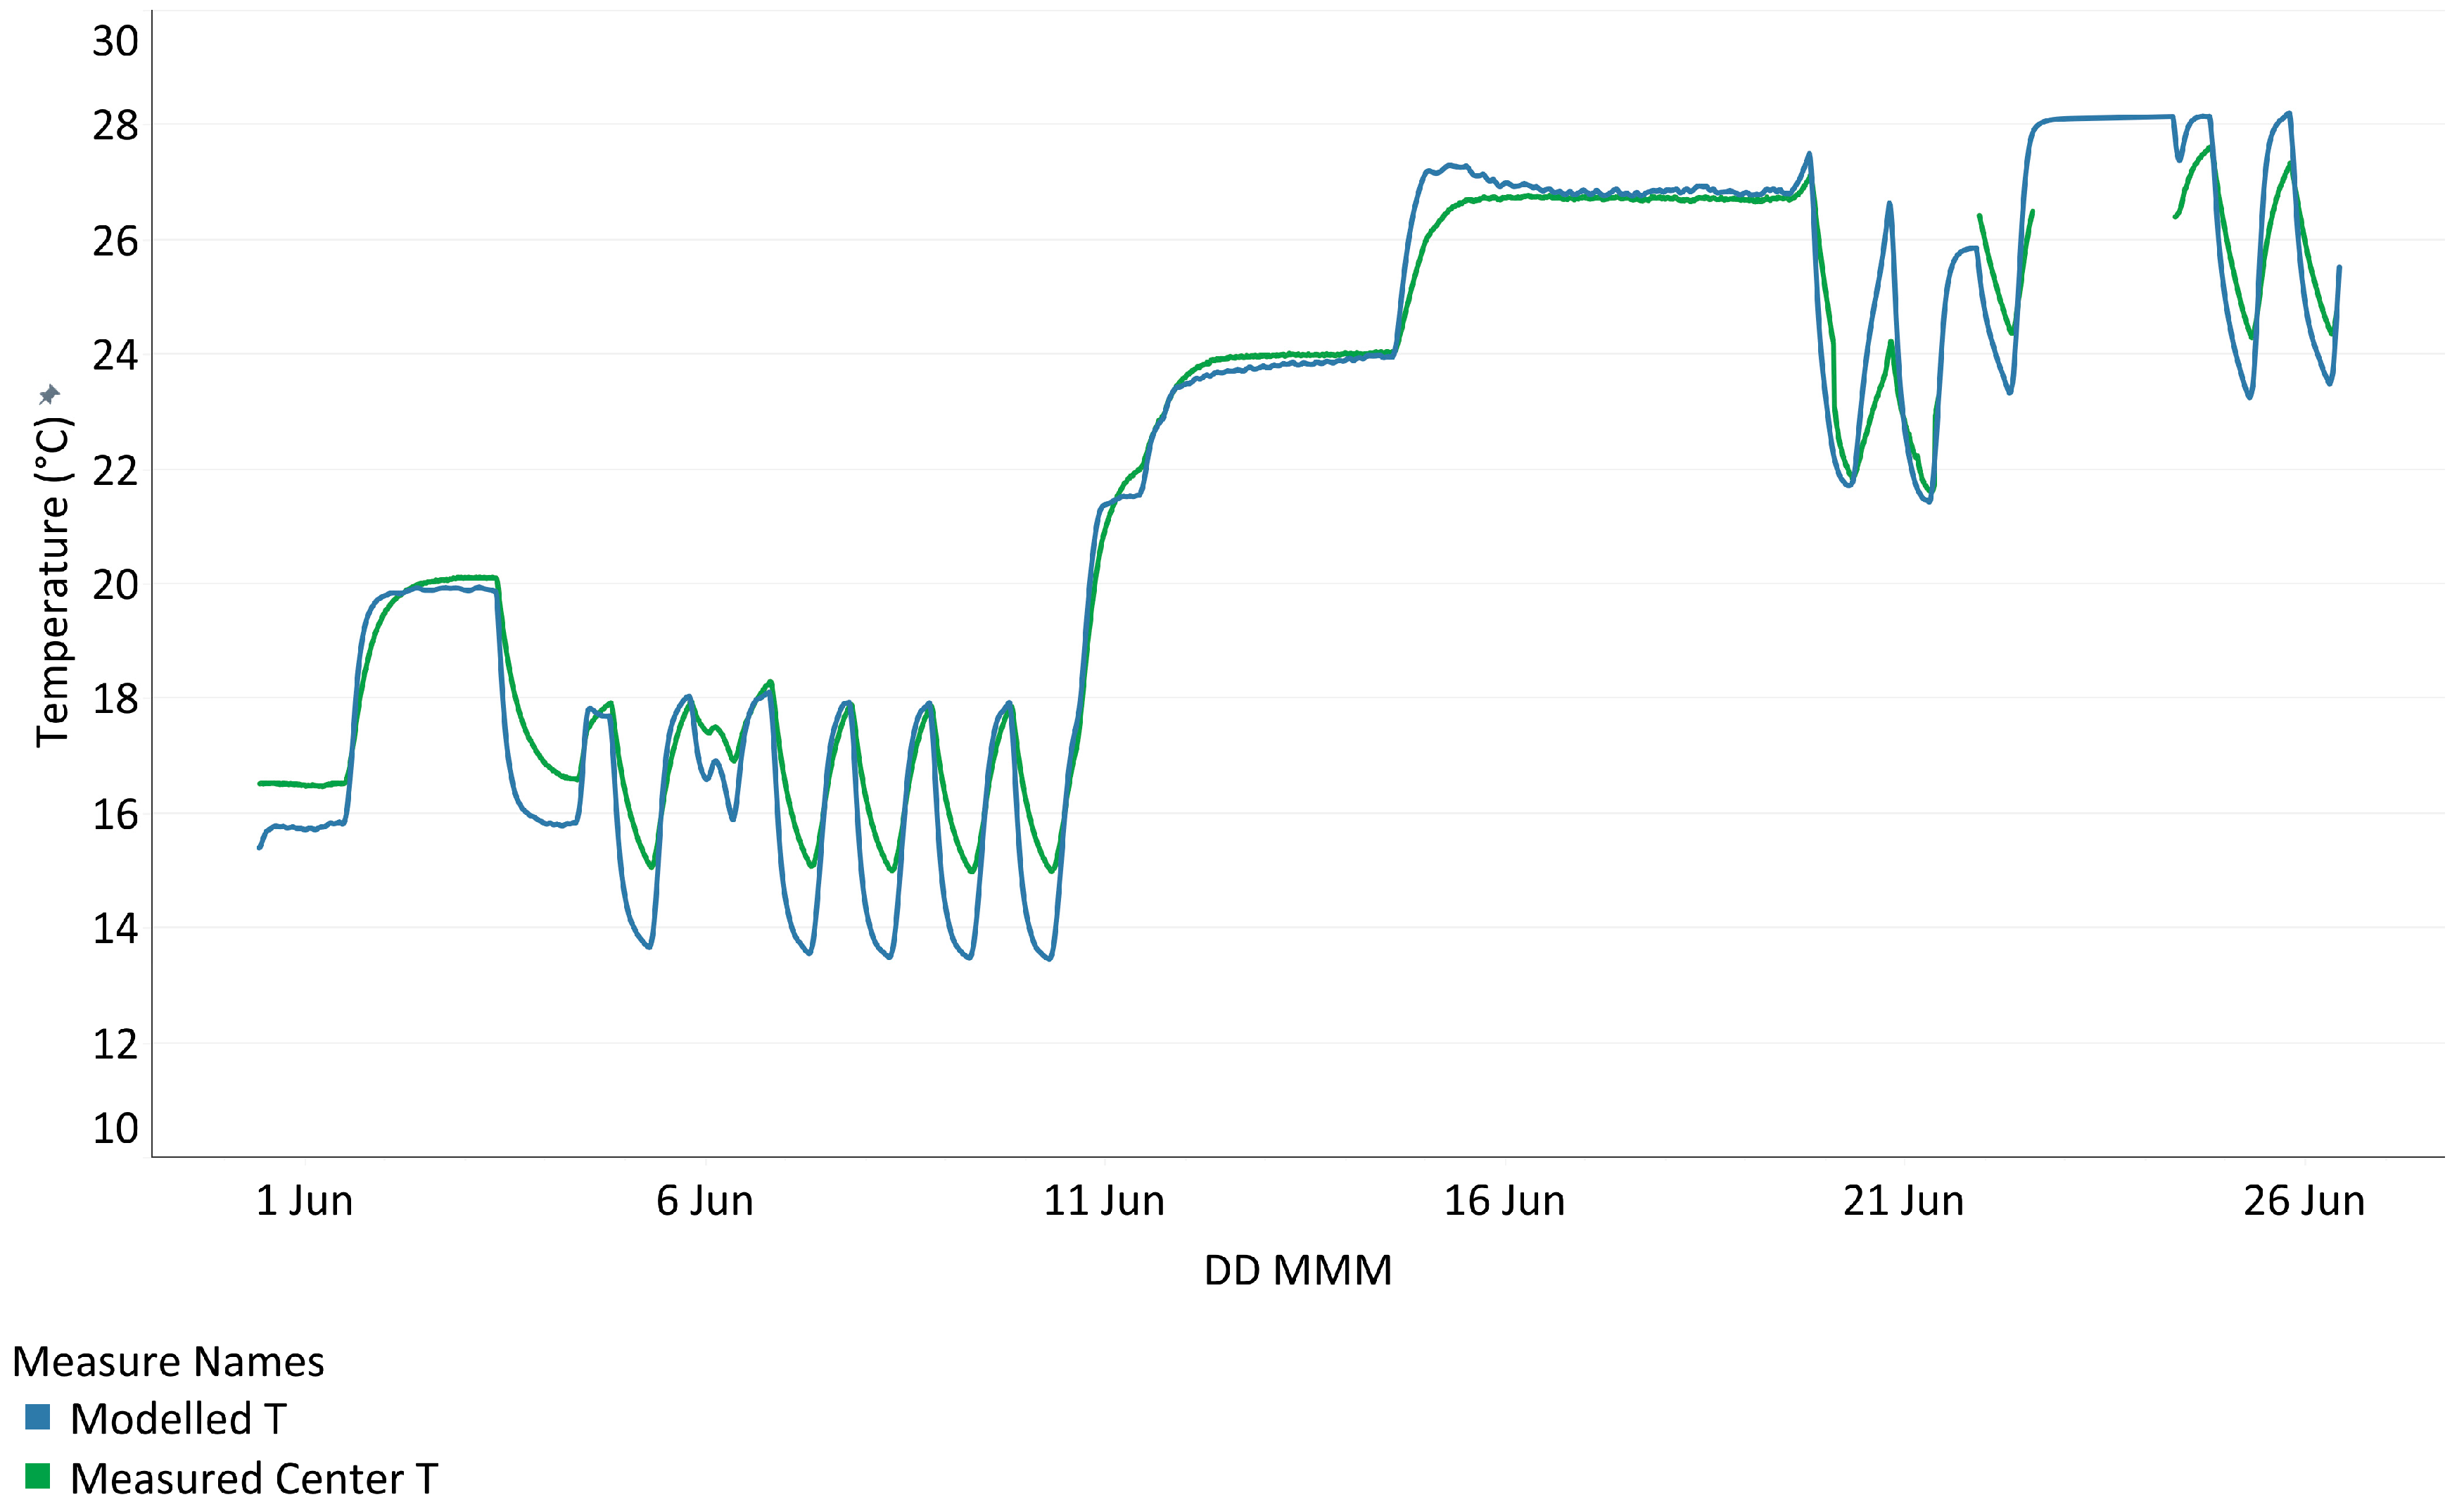
Unlike the cellulose panel, the modelled temperature in the centre of the cavity of the panel insulated with chopped straw closely followed the measured temperature during the monitored period. This can be seen in
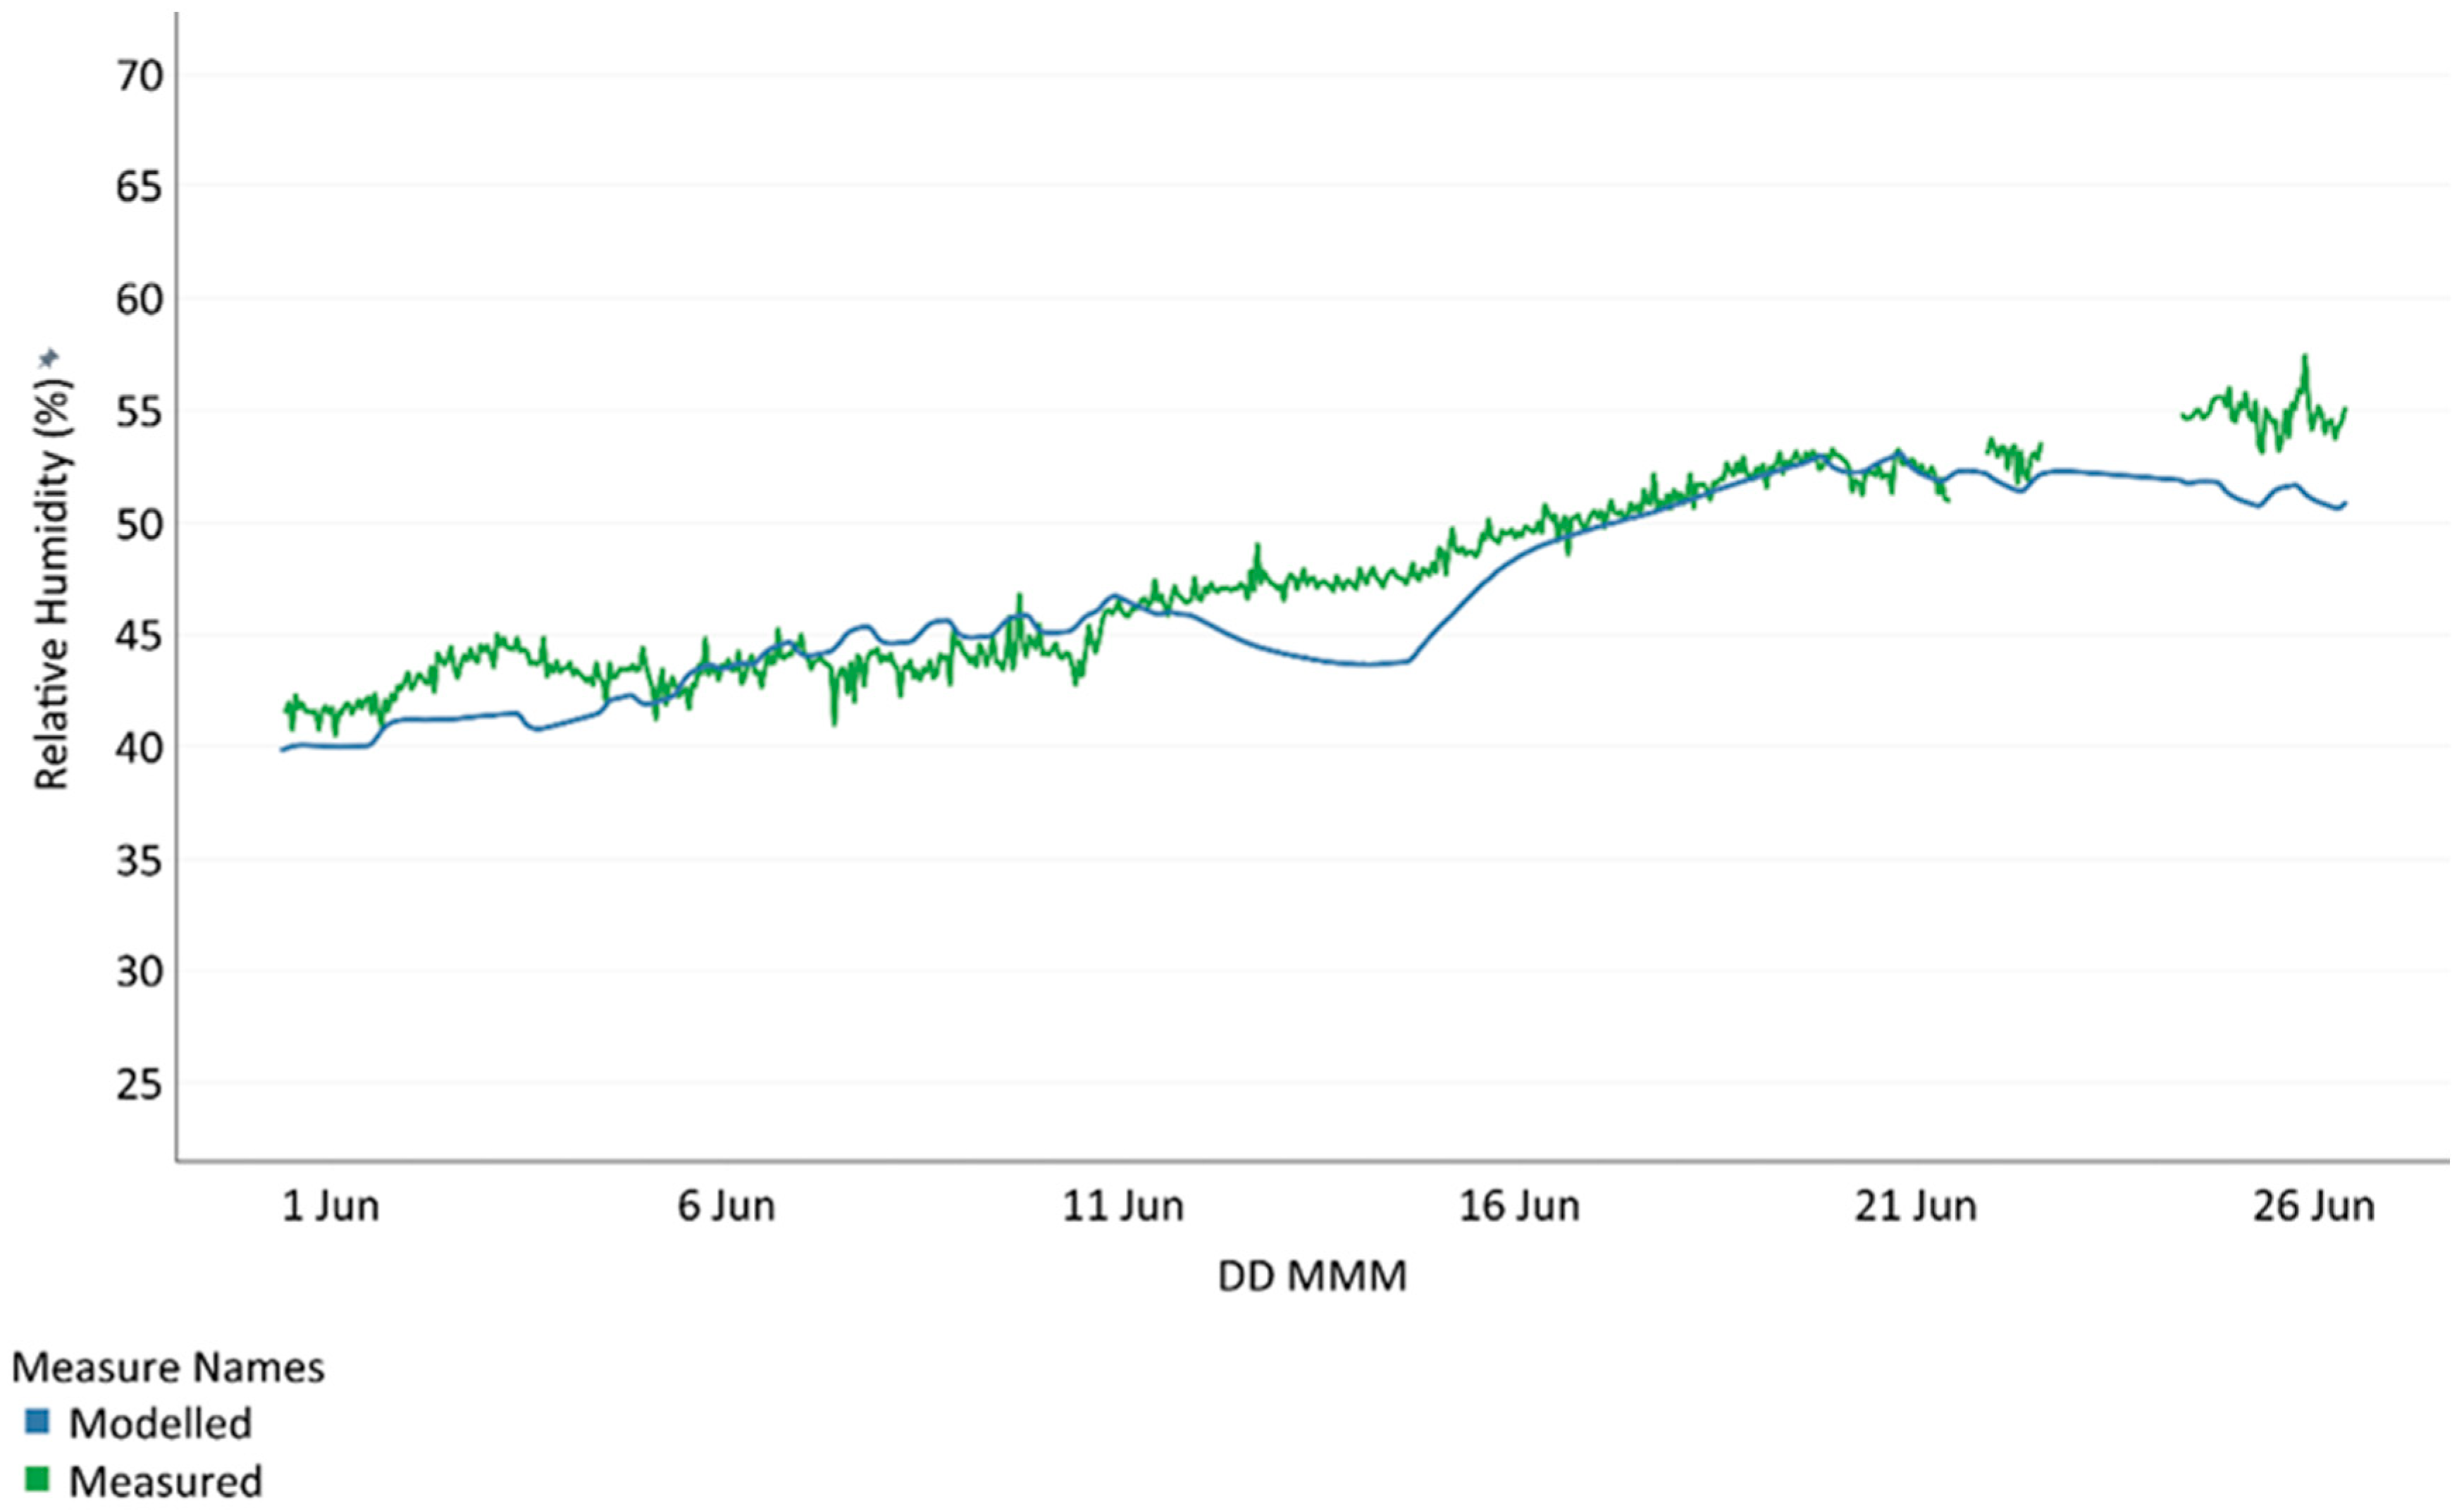
Figure 14. The chopped straw was found to have good agreement during the transient and steady periods. In this experiment, the acclimatization period was eliminated due to time constraints, but it did not have a significant effect on the temperature. In contrast, it was observed that the modelled relative humidity had very little response to changes in boundary conditions compared to the measured result and generally followed the peaks of the measured values during the transient periods, evident in
Figure 15. The result showed that the model makes a conservative estimate on the amount of moisture in the assembly compared to reality, which is beneficial when making assessments against worst case conditions.
The comparison of modelled against the measured vapour pressure comparison showed a similar trend as the cellulose, in which any discrepancies between the temperature and relative humidity were present in the vapour pressure comparison, shown in
Figure 16. To better assess and estimate the error between the model and the measured data, the mean absolute percentage error was used.
The differences between the two datasets may be attributed to how the model idealizes the boundary conditions regarding heat transfer, and material thermal mass and moisture buffering capacity. The modelled temperature has a faster rate of change under transient conditions. This would indicate that the modelled heat transfer at the surface is higher than the experiment, showing faster heat exchange and reduced thermal lag.
It is expected that the assumed material properties had an impact on the discrepancies, since not all were measured. The assumed properties might differ from the actual material properties, specifically a lower thermal mass, which could impact the rate of temperature change under transient conditions, and moisture buffering capacity, which would reduce the peaks and changes in relative humidity. This highlights the need for well-understood material properties for building products that will be used in practice. In this study, material properties were either assumed based on WUFI database and literature or measured when the data was unavailable.
Other issues may arise from sensor inertia, numerical smoothing or moisture sorption hysteresis effects on short timescales but are a less significant factor in these discrepancies.
The experimental and modelled results were compared to the validation criteria to estimate the error and assess whether the validation practice and assumed values were acceptable.
3.3. Estimated Error Between Model and Experiment
The MAE and MAPE were used to estimate the error for validation. Using the measured values from the guarded hot box as the actual values, the model error MAE accounts for the absolute difference between the actual and predicted values, while the MAPE is a relative measure using the absolute difference between the actual and predicted values, expressed as a percentage. These are shown in Equations (1) and (2), respectively. This was used to avoid underestimating the error from model overprediction and underpredictions over time.
where
is the number of times the summation iteration happens,
is the actual value and
is the predicted value for a given timestep,
.
From the literature, the acceptable range of errors are included in
Table 4. The estimated error for both insulation types was taken at the centre of the cavity using the temperature, relative humidity and vapour pressure metrics. The error was estimated at each 1 h timestep and was summarized for the panels, as shown in
Table 5. The measured vapour pressure was calculated using the measured relative humidity and temperature and was expected to have the greatest level of error in the analysis.
The cellulose model had a MAPE of below 5%, highlighting the strong agreement between the output parameters, and within the level of uncertainty of the sensors used in the experiment. In the case of the chopped straw model, the MAPE was calculated by excluding the first 24 h of the experiment due to the inconsistent initial conditions of the model, which contributed to an additional estimated error of 3%. By excluding that period from the analysis, the estimated error of temperature and relative humidity were within the range of sensor error from the relative humidity and temperature sensors. Overall, the model’s estimated error was within the acceptable range and was found to be a good representation of reality.
The estimated error in this study could be improved with better inputs to the model such as material property data, initial conditions, boundary conditions, and quantified air and moisture sources in the assembly. Additionally, adding more time for acclimatization would limit the estimated error since the experiment and model would have a longer period of time to reach the same conditions. However, in this case, it was found that these would provide marginal improvements to the error and that this process yielded acceptable results for the hygrothermal analysis.
3.4. Qualitative Assessments
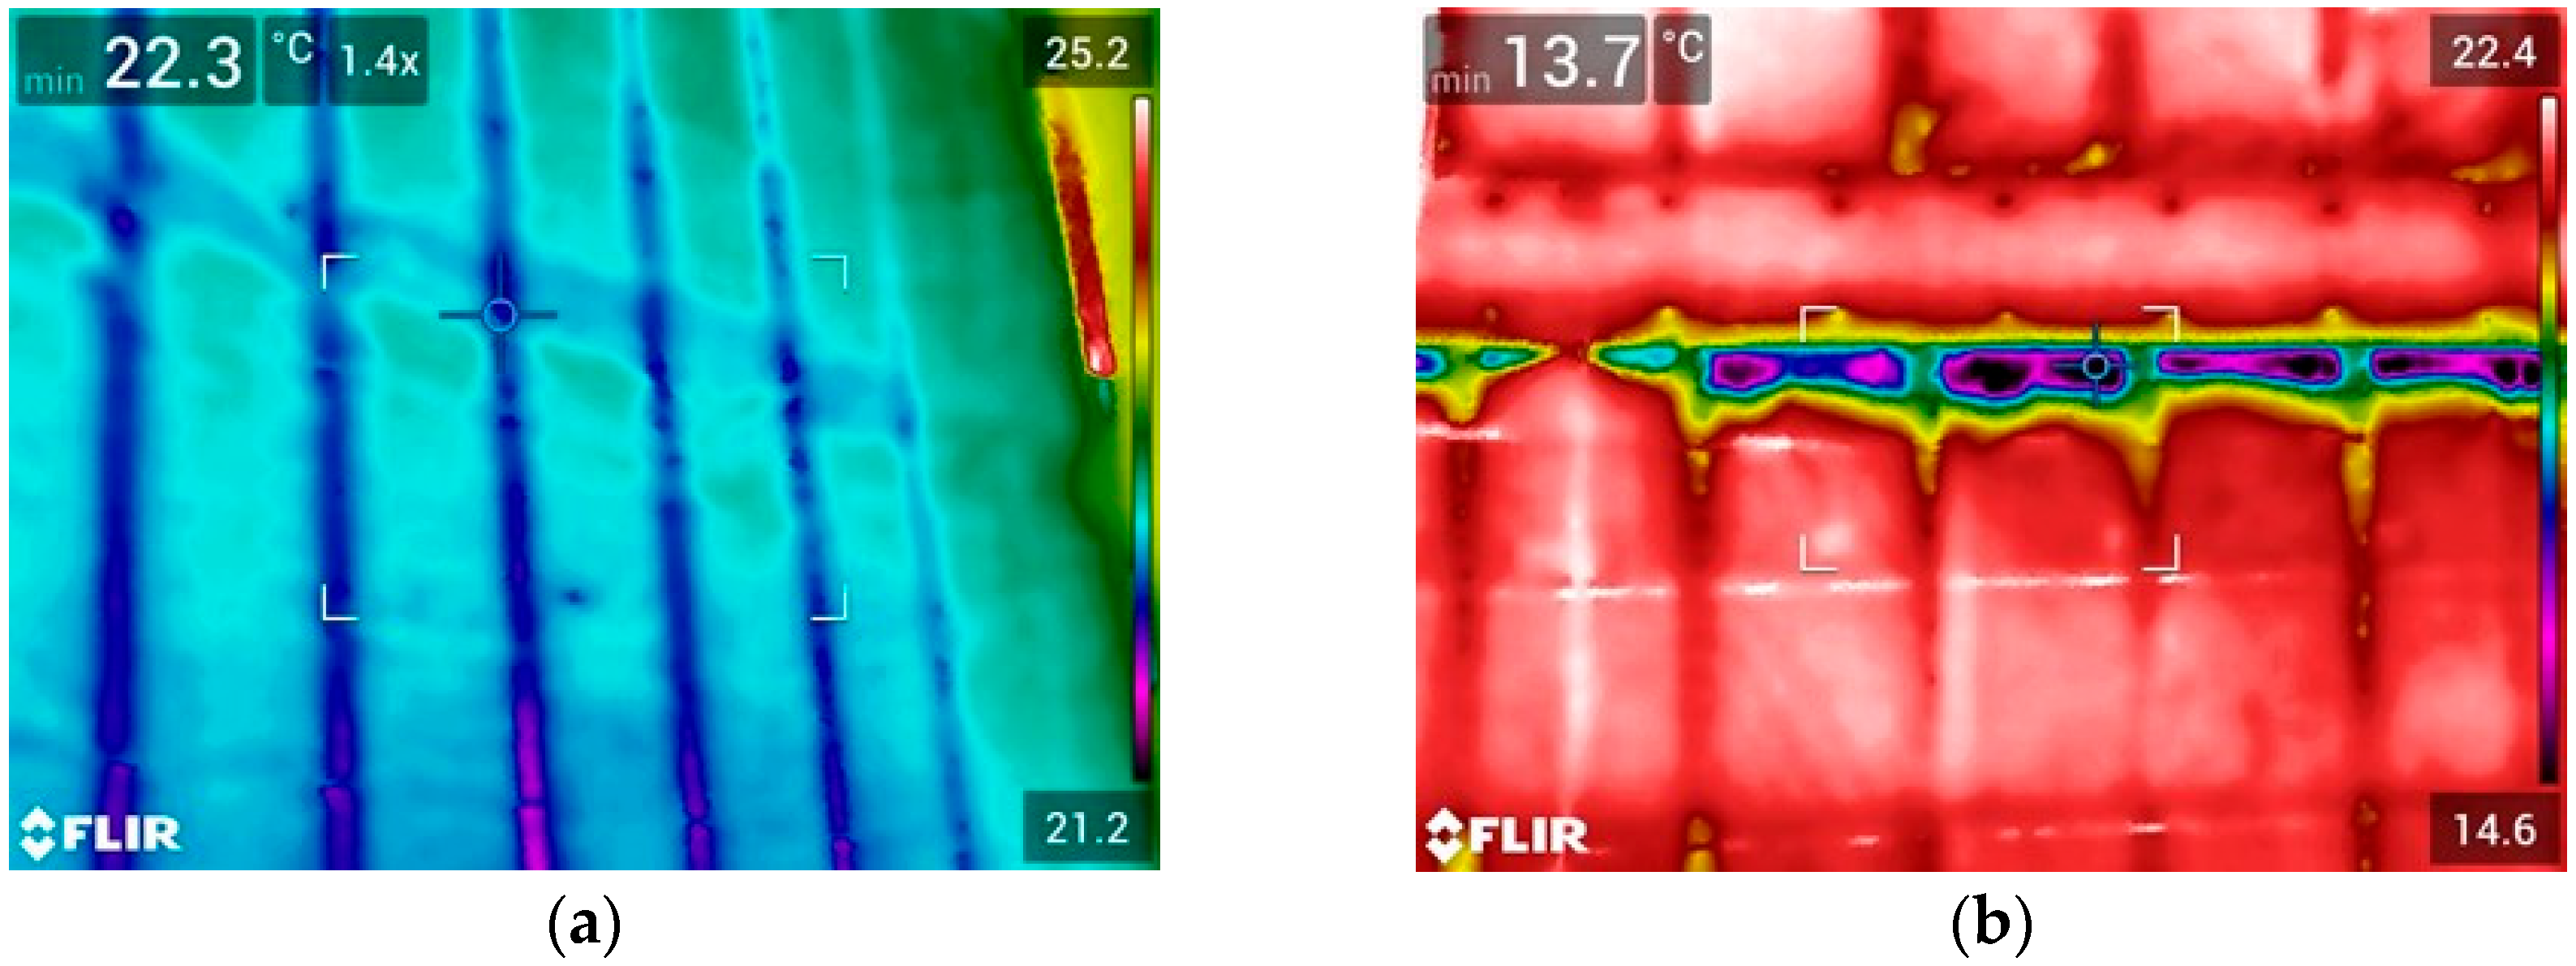
For the straw panels, it was found through infrared thermography, shown in
Figure 17, that some under-insulated voids existed in the cavities and at one location with blocking. It is expected that the installation density of the chopped straw was insufficient, and some settlement occurred during transport. As a result of this observation, the researchers recommend that for this species of chopped straw, at this fibre length, with the fines content used for this test, a higher density than the 70 kg/m
3 is needed to avoid settling. Further investigation was carried out by cutting the membrane and measuring the voids by hand. It was found that the voids were consistently between 50 mm and 180 mm, shown in
Figure 18. This would impact the whole assembly’s measured effective thermal resistance; however, it did not impact the model validation since the sensors were placed lower in the panels where no voids existed. The sensors used for model validation were placed at the mid-height of the 2400 mm panel, and with the infrared imaging, no thermal bridging was observed at that point.
The final qualitative assessment evaluated the air tightness by pressurizing the climate chamber with the same air temperature. The cellulose panel membrane was found to billow at a low pressure, as shown in
Figure 19, and air movement could be felt close to the panel joints. Smoke pencils and fog machines were used to try to visualize the air movement and pinpoint possible leakage paths; however, it was not possible to capture photos of the phenomena. The membrane was cut, and air was felt escaping from within the panel when at the largest pressure difference. It is expected that this would have an impact on the overall performance of the panel; however, it seemed to have a very minor effect on the experiment based on the high level of agreement between the measured and modelled results. Since the error was within stringent targets, it is expected that this amount of air was small. Under real-life conditions, a poor seal could cause an unnecessary wetting path within the panel or assembly and lower the long-term durability by frost and condensation within the assembly. This highlights the importance of continuous air control in this design. The straw panel, which used staples rather than tape to attach the membrane offering greater strength, did not exhibit billowing at high climate side air pressure. No apparent air leakage was observed using a smoke pencil or fog machine. It was concluded that the straw insulated assembly achieved lower air permeance.
One limitation of this study was the absence of a qualitative analysis during the initial commissioning phase of the guarded hot box test. Specifically, no infrared imaging or pressurization was completed during the commissioning to identify unexpected thermal bridges or air leakage paths. For future studies, it is recommended to perform infrared imaging with a significant temperature difference to identify any unintended thermal bridges or voids produced by settling. This is especially important when handling novel loose-fill materials with an unknown minimum required density.
Additionally, a similar diagnostic process could be applied for air tightness testing. By including an airtightness measurement to ensure the assembly meets the required boundary or performance conditions, one could ensure the experiment is not compromised by uncontrolled air leakage. This would improve the reliability and repeatability of measurements.
4. Conclusions
In conclusion, a new low-carbon panelized design was prototyped and evaluated in the guarded hot box for the purpose of model validation. The cellulose and chopped straw panels were tested under controlled steady and transient set points to evaluate the hygrothermal response of the two systems. An original experimental research method was developed to compare modelled data to measured data. This method was employed to determine that a range of validation parameters (temperature, relative humidity and vapour pressure) were found to be within acceptable agreement. The results are also sensitive to several specific assumed material properties. Following the qualitative assessment for thermal bridging and air tightness, it was found that the there were no significant experimental errors, and the dataset was valid for use with the model. However, it is recommended to complete the qualitative testing at the beginning of the experiment during the commissioning phase to ensure no unexpected thermal bridging or air flow paths. Additionally, quantifying air leakage paths in the guarded hot box would be valuable and will be explored in future experiments through ultrasonic or tracer gas methods.
A WUFI Pro 6 model of the assemblies was created, and the outputs were compared. The estimated error from the model after validation was calculated to be between 3% and 7% for the temperature, relative humidity and vapour pressure. Overall, the modelled data showed excellent agreement with the experimental values. Based on limitations from this method, it is recommended to ensure the initial conditions are well understood and the whole assembly is at the same initial conditions. If not, creating multiple layers in the model or creating a custom initial conditions file for the assembly is necessary if greater agreement between model and experiment is needed. Additionally, creating custom materials in WUFI can be beneficial since materials in the database may not represent the materials at hand, especially for agricultural residues and other non-homogenous biomaterials.
The research method outlined in the study is applicable for different assembly designs, or new and innovative building insulation material. It is not limited to panelized cavity filled or dense-packed assemblies, and can be validated in WUFI using temperature, relative humidity and vapour pressure parameters. These models can be used broadly for activities like hygrothermal assessment across different building types, climate zones and future weather conditions in new construction and retrofit contexts. With a well-understood and validated model using experimental data, the novel prefabricated panels with low-carbon or biogenic materials can be applied to different constructions and Canadian climate zones with more confidence. This is especially important in the case of retrofits where different existing construction and initial moisture levels can introduce a significant uncertainty during the design stage. With a validated model, the designers can assess short- and long-term envelope performance under a wide array of scenarios, increase the confidence in and uptake of panelization and biogenic materials.
In the future, NRCan will conduct a study of the low-carbon, biogenic feedstocks available in Canada, along with a literature review of the available material property data. This proposed work will focus on the potential of grain straw as an insulation material, along with its immediacy and large-scale impact. The scope will include its availability, affordability, and high carbon-storage capacity to show that it is a compelling feedstock and a viable alternative to conventional insulation for buildings. Furthermore, the research methodology will be expanded to evaluate multiple panelized assemblies concurrently in the guarded hot box, and address the limitations outlined in this study.
