Abstract
Timely detection of the spatial distribution of building damage in the immediate aftermath of a disaster is essential for guiding emergency response and recovery strategies. In January 2025, a large-scale wildfire struck the Los Angeles metropolitan area, with Altadena as one of the most severely affected regions. A timely and comprehensive understanding of the spatial distribution of building damage is essential for guiding rescue and resource allocation. In this study, we adopted the MambaBDA framework, which is built upon Mamba, a recently proposed state space architecture in the computer vision domain, and tailored it for spatio-temporal modeling of disaster impacts. The model was trained on the publicly available xBD dataset and subsequently applied to evaluate wildfire-induced building damage in Altadena, with pre- and post-disaster data acquired from WorldView-3 imagery captured during the 2025 Los Angeles wildfire. The workflow consisted of building localization and damage grading, followed by optimization to improve boundary accuracy and conversion to individual building-level assessments. Results show that about 28% of the buildings in Altadena suffered Major or Destroyed levels of damage. Population impact analysis, based on GHSL data, estimated approximately 3241 residents living in Major damage zones and 31,975 in Destroyed zones. These findings highlight the applicability of MambaBDA to wildfire scenarios, demonstrating its capability for efficient and transferable building damage assessment. The proposed approach provides timely information to support post-disaster rescue and recovery decision-making.
1. Introduction
Disasters are commonly understood as adverse consequences for human life, infrastructure, economies, and the environment that emerge from the interaction between hazardous events and underlying exposure, vulnerabilities, and coping capacities [1]. A complete disaster management system usually consists of two main stages: preparedness before the hazard strikes and response after its occurrence. In the post-disaster phase, rapid and accurate assessment of the extent and spatial distribution of damage is particularly critical, as it supports efficient resource deployment and timely rescue operations [2,3]. Among various types of impacts, damage to buildings serves as one of the most direct indicators, since it closely reflects population exposure and the likelihood of casualties [4]. Accelerating the identification of collapsed or heavily damaged structures is therefore vital, as delays in recognition and response can significantly reduce the effectiveness of life-saving operations.
Wildfires are among the most destructive natural hazards, causing widespread destruction to ecosystems, infrastructure, and human settlements. In recent decades, climate change, rising temperatures, and prolonged droughts have increased the frequency and severity of wildfire events, particularly in the western United States. The 2025 Los Angeles wildfire represents a typical large-scale disaster, where densely populated suburban areas such as Altadena suffered significant building damage. Timely and accurate evaluation of building damage during such events is essential for guiding emergency operations, allocating resources efficiently, and supporting post-disaster recovery efforts [5].
Conventional on-site surveys are frequently challenging, risky, and time-intensive, especially during large-scale disasters when transportation and communication infrastructure may be compromised [6]. In such situations, remote sensing provides a significant advantage by enabling rapid, large-area observation that can supplement or replace field assessments [7]. The advent of high-resolution remote sensing has further allowed for detailed monitoring over extensive regions [8]. Nonetheless, manually analyzing imagery remains laborious and resource-demanding, often taking months to assess a broad disaster-affected area. These delays are incompatible with the urgent timeframe required for life-saving interventions, which has driven the development and application of advanced computer vision and deep learning techniques capable of automatically detecting and classifying damaged buildings within hours, thereby greatly enhancing the efficiency of post-disaster response.
Remote sensing combined with deep learning has become an efficient tool for automated building damage assessment, replacing labor-intensive manual interpretation of high-resolution imagery and enabling single-image or pre- vs. post-disaster change detection via machine learning advances [9,10,11]. Convolutional neural networks (CNNs) [12], Faster R-CNN [13], and semantic segmentation frameworks have been widely applied in earthquake damage scenarios, demonstrating strong end-to-end learning capabilities and adaptability to complex structural changes [14]. Dual-branch architectures, such as RescueNet [15], BDANet [16], further leverage temporal differences between pre- and post-disaster images to improve multi-class damage classification [17]. For instance, Xu et al. [18] proposed a large-scale vision model based on the Transformer architecture, enabling universal segmentation of structural damage across multiple disaster types. Wang et al. [19] developed a geometry consistency-enhanced convolutional encoder–decoder framework using UAV imagery, achieving highly accurate and automated urban seismic damage assessment. Despite these advances, wildfire-induced building damage remains underexplored, as it presents distinct spectral and spatial signatures—roof scorching, structural collapse, and surface darkening—that challenge models relying primarily on texture or geometric cues.
Recently, state space models have shown strong potential for spatio-temporal modeling in remote sensing change detection. In particular, ChangeMamba [20] introduced a novel architecture that efficiently captures temporal dependencies between pre- and post-event imagery. Building upon this advancement, the MambaBDA framework extends the concept to building damage assessment by integrating spatio-temporal state space modeling into a two-stage pipeline of building localization and damage grading [20]. Compared to conventional convolutional or Transformer-based approaches, MambaBDA provides a more efficient and adaptive mechanism for capturing cross-temporal changes.
This study addresses the challenge of limited annotated wildfire-damage samples by leveraging the publicly available xBD dataset for model training. The xBD dataset [21], containing pre- and post-event satellite imagery across multiple disaster scenarios, annotated building polygons, and ordinal labels of damage severity [21]. We trained the MambaBDA framework on xBD to learn generalizable spatio-temporal features of building damage and then transferred the trained model to the 2025 Los Angeles wildfire case using WorldView-3 imagery. With the assistance of pre-disaster building footprints extracted from high-resolution imagery, MambaBDA enabled accurate building localization and subsequent damage grading. Post-processing was applied to optimize building contours, ensuring close alignment with actual building boundaries. At the building-unit scale, damage levels were aggregated, and by combining the results with Global Human Settlement Layer (GHSL) data, the number of affected residents was estimated. This approach provides a rapid and transferable framework for post-disaster building damage and population exposure assessment, significantly reducing the need for extensive labeled wildfire-specific data while supporting timely emergency response and recovery planning.
2. Materials and Methods
2.1. Study Area
Wildfires are among the most destructive natural hazards in the western United States, and their frequency and intensity have increased significantly in recent years [22]. Climate change-induced high temperatures, low humidity, and prolonged droughts have markedly elevated fuel accumulation and dryness, thereby increasing the likelihood and rapid spread of wildfires [23]. The influence of strong wind events, such as the Santa Ana Winds, further accelerates fire propagation, causing extensive ecological damage and significant losses to human settlements and infrastructure [24].
On 7 January 2025, a large-scale wildfire occurred in Altadena, Los Angeles County, California. Driven by the combination of dry climatic conditions and strong winds, the fire rapidly expanded, affecting numerous residential areas, public facilities, and surrounding ecosystems. The wildfire resulted in localized power outages and transportation disruptions, necessitating the emergency evacuation of residents. Field investigations and media reports indicated severe building damage and vegetation loss, imposing long-term socio-economic and environmental impacts on the affected communities [24,25]. Altadena was selected as the study area for building damage assessment in this research. Figure 1 presents relevant information for the Los Angeles wildfire case, including post-disaster field maps and satellite imagery, providing essential data support for subsequent model training and assessment.
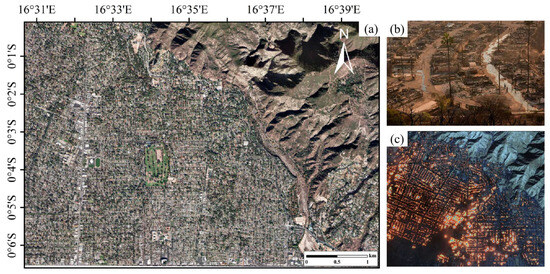
Figure 1.
Overview of the Study Area: (a) Overview of Altadena; (b) Post-disaster on-site images; (c) Images captured by remote sensing satellites.
2.2. Data
2.2.1. WorldView-3 Remote Sensing Imagery
In this study, WorldView-3 high-resolution optical remote sensing imagery covering the Altadena area of Los Angeles was selected. The imagery has a spatial resolution of 0.5 m, with the pre-disaster data acquired on 1 January 2025, and the post-disaster data on 15 January 2025. High-resolution satellite imagery provides detailed ground information that is essential for accurately identifying and assessing building damage [26]. As shown in Figure 2, the pre- and post-disaster images of three randomly selected regions within the study area are presented. Such temporal data enable effective detection of fire-induced building damage and establish a reliable foundation for subsequent automatic damage assessment using MambaBDA models [20].
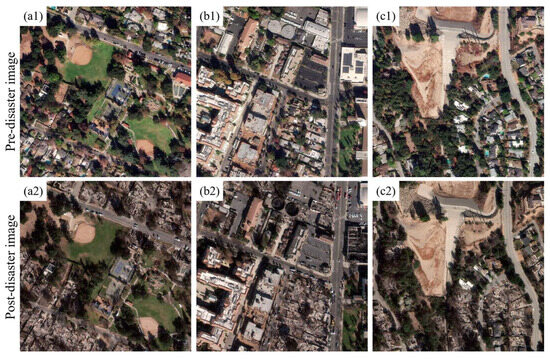
Figure 2.
WorldView3 imagery before and after the disaster. (a1,b1,c1) pre-disaster images; (a2,b2,c2) post-disaster images.
2.2.2. The xView2 Building Damage Assessment (xBD) Dataset
For the purposes of training and evaluating the model, this research utilizes the publicly accessible xBD dataset [21], which is currently the largest and most comprehensive collection of satellite imagery for building damage assessment. The dataset covers 19 distinct disaster events globally (among which five are wildfire-related, providing sufficient wildfire samples for training), including earthquakes, wildfires, volcanic eruptions, storms, floods, and tsunamis. Each entry comprises paired pre- and post-disaster images with a spatial resolution of 0.8 m, provided as three-channel RGB tiles measuring 1024 × 1024 pixels.
The dataset additionally includes building footprint annotations along with standardized damage classifications. Building damage is divided into four categories—No damage, Minor damage, Major damage, and Destroyed—based on expert evaluations, as summarized in Table 1. The corresponding annotation counts and distribution across categories are provided in Table 2. Specifically, the training subset comprises 18,336 image tiles containing a total of 632,228 building instances. Of these, 313,033 are classified as “No damage” while 36,860, 29,904, and 31,560 fall into the “Minor damage”, “Major damage” and “Destroyed” categories, respectively.

Table 1.
Description of building damage categories.

Table 2.
Distribution of building instances across different damage levels in the xBD dataset.
Notably, the dataset exhibits a significant class imbalance, as undamaged buildings make up roughly 76.04% of all annotated instances (as listed in Table 2). To address this imbalance and strengthen the robustness of model training, and to avoid data leakage, the dataset was first split by disaster event before creating the training and validation subsets, and CutMix-based data augmentation is applied during preprocessing below [27]. This approach increases the representation of underrepresented damage categories and improves the generalization performance of the deep learning model.
2.2.3. Global Human Settlement Layer Data
To assess population exposure in the study area, this work utilizes the Global Human Settlement Layer (GHSL) dataset, specifically the 2020 edition, which constitutes the most recent publicly accessible population distribution data below [28]. While GHSL represents a static snapshot, the short temporal gap relative to the wildfire event has a minimal effect on the accuracy of estimated affected populations. The dataset is produced under the Global Human Settlement project coordinated by the European Commission and provides population information in a gridded raster format at a spatial resolution of 100 m. Population distribution is derived by integrating satellite-observed built-up areas with census-based demographic statistics. For the present study, the 2020 GHSL covering Los Angeles County was extracted and clipped to the Altadena wildfire region. These raster data were then combined with building damage assessment results to estimate the number of residents potentially affected by the disaster.
2.3. Building Damage Assessment Method
Analyzing building damage after a disaster typically requires a systematic workflow that includes identifying affected structures, delineating their boundaries, and quantifying the extent of damage. Traditional approaches have relied on very high-resolution (VHR) optical or synthetic aperture radar (SAR) imagery to capture structural changes induced by disasters. For example, Zhou et al. [29] used a density-based algorithm to extract building clusters, and then a new clustering matching algorithm was proposed to improve the robustness of pre- and post-disaster building cluster matching [30,31]. Nevertheless, these approaches often depend on convolutional or Transformer-based architectures, which can be limited in capturing long-range spatial dependencies and may demand considerable computational resources.
To overcome these limitations, this study employs MambaBDA [20], a spatio-temporal state space framework designed for building damage assessment [32]. The MambaBDA model employed in this study has been extensively validated in its original publication, where it demonstrated superior accuracy and robustness compared with several mainstream architectures such as UNet, Swin Transformer, and SegFormer. The overall architecture of the model is illustrated in Figure 3. MambaBDA processes paired pre- and post-disaster images through an encoder that captures hierarchical representations, and a decoder that reconstructs detailed building masks and predicts damage severity (as shown in Figure 3). What distinguishes MambaBDA is the incorporation of selective state space models, known as VMamba blocks [33,34], which efficiently capture temporal dependencies between the two image domains while maintaining scalability (as shown in Figure 4). By doing so, the network learns not only spatial patterns of buildings but also their evolution across time, which is essential for accurate change detection.
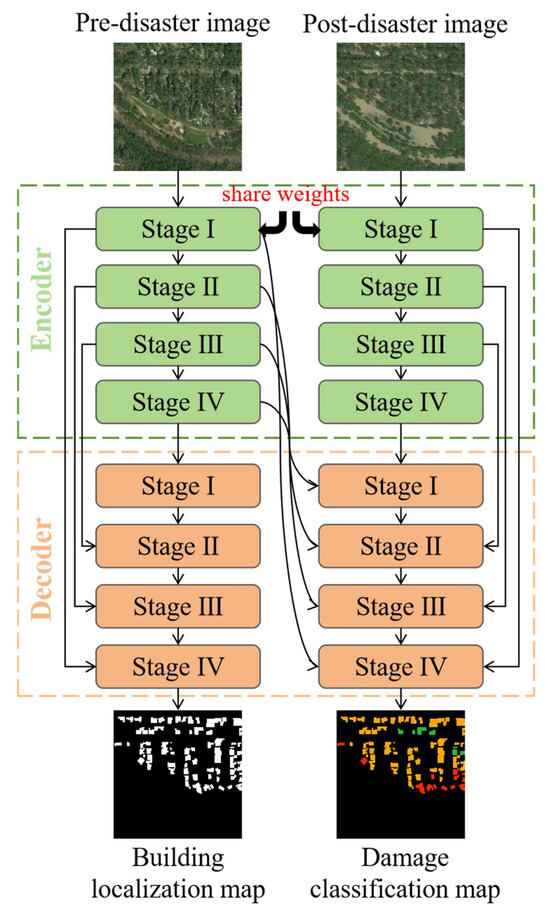
Figure 3.
Overall architecture of the MambaBDA framework for building damage assessment [20].
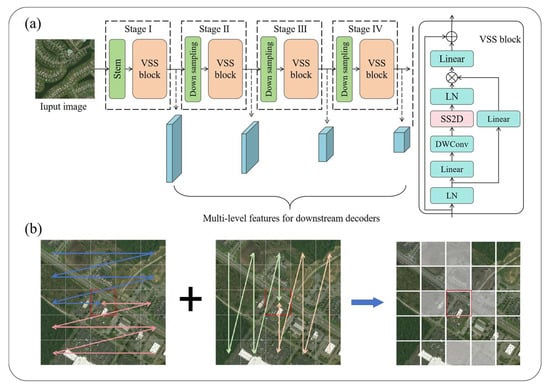
Figure 4.
(a) Encoder structure of MambaBDA with stacked Mamba blocks; (b) Illustration of the cross-scan mechanism for temporal feature interaction [20].
The encoder of MambaBDA (as shown in Figure 4) consists of stacked convolutional layers combined with Mamba blocks that enable bidirectional state scanning. Unlike CNNs that rely on local receptive fields or Transformers that model global attention at high computational cost [35], Mamba achieves a balance by projecting image features into a latent state space where temporal relationships are selectively updated. The extracted features from pre- and post-disaster images are then aligned through a cross-scan mechanism (Figure 4b), which scans feature maps horizontally and vertically across both temporal streams. This mechanism facilitates bidirectional interaction between pre-event and post-event representations, ensuring that the model effectively distinguishes structural changes from background variations.
The decoder (as shown in Figure 5a) progressively upsamples encoded features to the original spatial resolution while integrating skip connections from the encoder to recover building boundaries. In addition to reconstructing accurate segmentation masks, the decoder incorporates a grading module that assigns ordinal damage levels—No damage, Minor damage, Major damage, and Destroyed—to each building. Beyond the encoder–decoder pipeline, MambaBDA explicitly models spatio-temporal relations through three complementary mechanisms, as depicted in Figure 5b. First, spatial relation modeling enhances local feature representation and delineates fine structural details such as rooftops and edges. Second, temporal relation modeling aligns pre- and post-disaster features to ensure consistent comparison across time. Finally, spatio-temporal fusion integrates both spatial and temporal cues, producing coherent change features that drive the final prediction. These components jointly improve the robustness of damage detection, particularly in challenging wildfire scenarios where smoke, burn scars, and illumination differences can obscure traditional spectral cues.
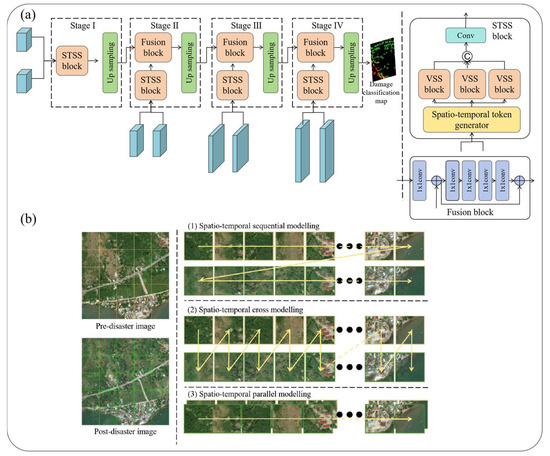
Figure 5.
(a) Decoder structure of MambaBDA for building mask reconstruction and damage grading; (b) Three mechanisms for spatio-temporal relation modeling in MambaBDA [20].
Compared with conventional UNet- or Transformer-based methods [36], it is able to process high-resolution imagery with reduced computational overhead while maintaining sensitivity to subtle structural changes. Based on the above framework, the training of MambaBDA in this study was conducted using the xBD dataset. To address the inherent issue of class imbalance—particularly the underrepresentation of severely damaged and destroyed categories—the CutMix (as shown in Figure 6) augmentation technique was employed during data preprocessing [27]. CutMix generates synthetic samples by randomly selecting two images, cutting and exchanging portions of their content, and merging the corresponding labels. In this study, this approach was applied specifically to the difficult classes, namely Minor Damage and Major Damage, which are visually similar and prone to misclassification. By focusing on these classes, the method enriches the diversity of challenging training samples, alleviates sample imbalance, and enhances the model’s generalization ability.
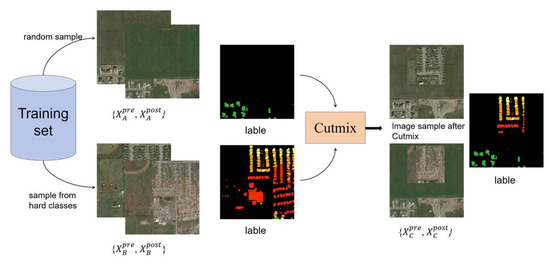
Figure 6.
Data augmentation with CutMix for difficult classes.
The model produces as output a probability tensor PL ∈ R5×H×W, where each channel encodes spatial likelihoods for a specific class. Specifically, PL1 corresponds to the building mask, while PL2 to PL5 represent the probabilities for the four ordinal damage levels: No damage, Minor damage, Major damage, and Destroyed, respectively. During post-processing, the binary building mask is element-wise multiplied with the damage probability maps, suppressing false classifications outside building regions [37]. To derive building-level assessments, pixel counts associated with each damage class are aggregated for individual building footprints [38,39]. A weighted scoring scheme is then applied to assign a final damage grade:
where P1–P4 denote the pixel counts corresponding to the four damage categories (No damage, Minor damage, Major damage, Destroyed). This formulation ensures that each building is assigned a severity level based on the dominant damage evidence while preserving information from fine-grained pixel-level predictions. The resulting building-unit grading supports downstream mapping of damage distribution and facilitates regional impact analysis.
3. Results
3.1. Building-Level Damage Assessment
Model development was carried out within the PyTorch 2.1.1 framework using the PyCharm environment, and experiments were executed on a single NVIDIA RTX 4090 GPU. To maintain consistency and stability, the training setup followed the optimization strategies and loss configurations recommended in the original ChangeMamba implementation. The values of epoch count and batch size were adjusted based on the available hardware resources to strike a balance between convergence quality and computational efficiency. For data preprocessing, raw imagery from the study area was divided into tiles of 1024 × 1024 pixels. During training, these tiles were further partitioned into 256 × 256 patches, whereas for testing, the original 1024 × 1024 resolution was retained to preserve spatial detail. In addition, several augmentation techniques, including random flipping, scaling, and rotation, were applied to strengthen the model’s generalization capability.
The trained MambaBDA model directly produced a multi-channel probability tensor from paired pre- and post-disaster images, where one channel represented the building mask and the other four channels corresponded to the ordinal damage levels of No damage, Minor damage, Major damage, and Destroyed. Each pixel was assigned to the class with the highest probability, generating an initial building damage map at the original resolution.
To refine these outputs, several post-processing operations were applied. Connected regions smaller than 100 pixels were removed, as experiments demonstrated that this threshold effectively suppressed noise while retaining valid building structures. Morphological erosion was further performed using a structured kernel to separate adjacent buildings, followed by hole filling to improve the completeness of building masks. These operations eliminated spurious responses on roads or vegetation and improved the clarity of building boundaries. The optimized building damage results are shown in Figure 7.
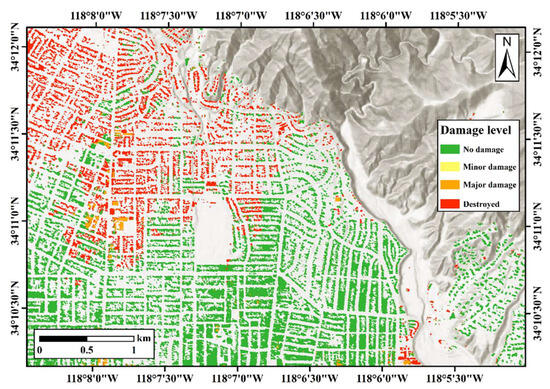
Figure 7.
Visualization of the building damage assessment for the Los Angeles wildfire event.
According to the processed results, the pixel-level statistics of different damage categories were calculated, including the total pixel count, affected area, and proportional share, as summarized in Table 3. The analysis indicates that approximately 28% of the area pixels within the Altadena region were identified as wildfire-affected, among which 25.59% correspond to completely destroyed zones and 2.53% to major damage. The remaining majority of pixels were classified as undamaged, revealing a distinctly polarized spatial distribution of wildfire damage across the study area.

Table 3.
Damage-Level-Based Building Areas.
Building-level damage assessment was derived from the pixel-wise classification results using Formula (1). For each building footprint, the number of pixels falling into the four damage categories was aggregated and weighted to determine a final severity label [38]. The outcomes, illustrated in Figure 8, present a clear building-scale overview of wildfire impacts. Compared with the pixel-based map, this analysis highlights clusters of severely damaged structures concentrated near the wildland–urban interface, where the fire spread from mountainous areas toward residential zones. In contrast, buildings situated further away from the fire’s progression corridor experienced relatively lower levels of destruction. This refined evaluation provides a more realistic depiction of structural vulnerability and establishes the basis for subsequent population exposure estimation.
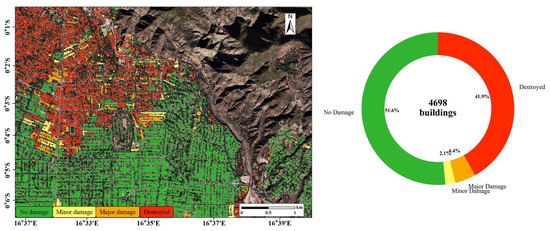
Figure 8.
Building-by-building damage assessment and Proportion of buildings with different damage levels in the Altadena study area.
Following the building-level assessment, the number of buildings assigned to each damage category was further quantified. As shown in Figure 8, a total of 4698 buildings were identified within the Altadena study area. Among them, 51.5% were classified as No Damage, while 2.1% and 4.4% were categorized as Minor and Major Damage, respectively. Notably, 41.9% of buildings were labeled as Destroyed, underscoring the extensive impact of the wildfire on residential infrastructure. This distribution highlights a pronounced polarization of outcomes, with a large proportion of buildings either remaining intact or being completely destroyed. The pie chart provides an intuitive statistical overview that complements the spatial visualization in Figure 8, allowing both structural patterns and quantitative proportions of damage to be clearly assessed.
The differences between the pixel-based and building-level results arise from the distinct statistical perspectives adopted in these two analyses. The pixel-level statistics were computed by independently classifying each pixel, reflecting the overall spatial extent of burned areas. In contrast, the building-level analysis was conducted by aggregating and weighting pixel-based results through Formula (1) to determine each building’s damage degree. Consequently, a building containing a certain proportion of damaged pixels was categorized as a damaged structure. This process inevitably leads to differences between the two sets of results, as pixel-based statistics focus on areal coverage while building-level statistics capture object-specific structural impacts. The comparison underscores the advantage of the proposed method, which provides a more accurate and object-oriented evaluation of wildfire-induced damage at the level of individual buildings.
3.2. Damage Severity Zoning and Affected Population Analysis
Assessing building damage from remote sensing imagery is subject to several inherent challenges. One major issue lies in the heterogeneity of structural impacts: a single building may contain both intact and heavily damaged sections, yet classification systems typically force an assignment to one dominant category, potentially distorting the true severity. Furthermore, complex roof geometries or spectral confusion with adjacent surfaces, such as vegetation or paved areas, can introduce errors along building boundaries. To support operational use, this study further aggregated the pixel-level outputs into broader damage zones. As illustrated in Figure 9, the original high-resolution predictions were resampled into a 50 m grid to create a zoning map. This generalization provides a balance between detail and interpretability, reducing noise at the individual building scale while retaining essential spatial patterns. The resulting map, divided into four categories—No damage, Minor damage, Major damage, and Destroyed—offers a clear visualization of the disaster’s spatial footprint and delivers practical guidance for prioritizing rescue and recovery actions.
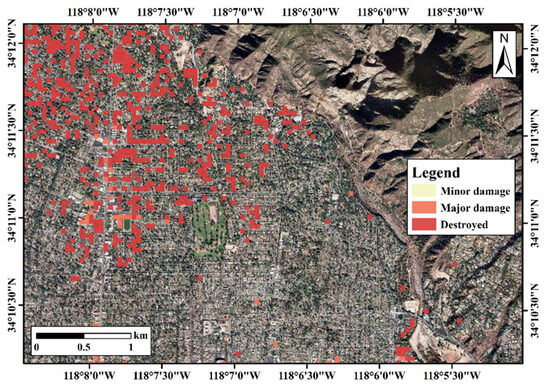
Figure 9.
Damage severity zoning of the Altadena study area based on resampled building damage results.
Considering the strong relationship between building destruction and population exposure, further analysis was carried out using Global Human Settlement Layer (GHSL) population data. The 2020 dataset was clipped to match the Altadena study area and overlaid with the resampled building damage zones. As summarized in Table 4, approximately 118,352 residents were located in No damage areas. Notably, 3241 residents were associated with Major damage areas and as many as 31,975 residents were found within Destroyed zones. These statistics reveal that while the majority of residents remained outside the direct impact zone, a substantial population cluster experienced severe to complete structural losses, highlighting the significant social consequences of the wildfire.

Table 4.
Estimated affected population in different building damage zones of Altadena study area.
In order to highlight locations requiring urgent attention, this study integrated building damage grades with population distribution through a bivariate spatial analysis. The combined results, shown in Figure 10, reveal hotspots where extensive structural destruction overlaps with densely populated zones. These high-risk areas indicate a greater likelihood of casualties and thus provide critical evidence for prioritizing rescue deployment and optimizing emergency resource allocation. By linking physical damage patterns with human exposure, the approach delivers a more holistic perspective on wildfire impacts and strengthens the foundation for evidence-based disaster response planning.
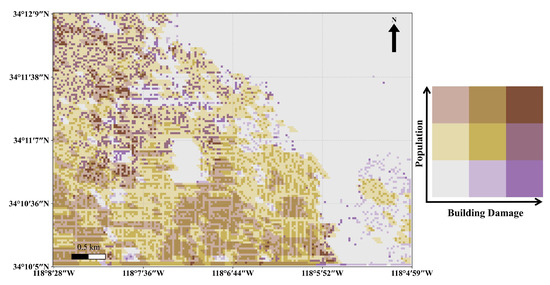
Figure 10.
Bivariate gradient map of building damage severity and population density in the Altadena study area.
4. Discussion
By training the model on the xBD dataset and transferring it to WorldView-3 imagery of the Altadena region, the framework successfully identified damaged buildings and classified severity levels with considerable precision. Compared with commonly used CNN- or Transformer-based architectures, MambaBDA achieves effective building damage recognition in wildfire scenarios, benefiting from its selective state space modeling and spatio-temporal fusion design. The selective state space modeling mechanism effectively captured spatio-temporal dependencies between pre- and post-disaster imagery, improving its ability to distinguish true structural changes from background noise such as vegetation burn scars and illumination variations. The cross-scan mechanism and spatio-temporal fusion strategies also contributed to more robust feature learning, which is particularly important in complex wildfire environments where smoke and surface darkening can obscure building features. Although the proposed framework can alleviate the influence of smoke and lighting differences through data augmentation and adaptive feature fusion, these measures cannot fundamentally eliminate their effects. Future research will consider incorporating additional data modalities, such as SAR or thermal infrared imagery, to better mitigate these effects and enhance classification robustness [40]. Given the flexible spatio-temporal fusion structure of MambaBDA, such modalities can be integrated as additional input channels, allowing cross-modal features to be jointly represented and dynamically weighted. This would help preserve building details under smoke occlusion and lighting disturbances while further strengthening damage discrimination.
Despite these encouraging outcomes, several limitations remain. First, the training of MambaBDA relied on the xBD dataset, which includes multiple disaster types but relatively few wildfire-specific samples. This may limit the model’s ability to fully capture the unique spectral and structural signatures of fire-induced damage. Second, the GHSL population dataset used for exposure analysis has a spatial resolution of 100 m, which may introduce uncertainties when overlaid with building-level damage maps. Finer-resolution population data or dynamic information such as mobile phone records could improve the accuracy of social impact estimates [41].
Finally, although post-processing steps improved the quality of building masks, limitations remain in delineating complex building footprints or capturing partial structural failures [42]. A minor limitation lies in identifying partially damaged buildings, which may cause slight uncertainty in detailed statistics. Overall, the findings highlight the potential of MambaBDA as a practical framework for rapid post-wildfire building damage assessment, offering valuable support for emergency response and urban resilience planning. Nevertheless, challenges such as limited wildfire-specific samples, partial damage recognition, and dependence on optical imagery remain, suggesting that future work should explore its adaptability to diverse wildfire environments and integration with other disaster scenarios.
5. Conclusions
This study employed the MambaBDA framework, a spatio-temporal state space model, to assess building damage in the Altadena region following the 2025 Los Angeles wildfire. Trained on the xBD dataset and applied to pre- and post-disaster WorldView-3 imagery, the model effectively generated pixel-level building masks and multi-class damage assessments. Post-processing steps, including small-object removal, morphological erosion, and hole filling, further refined building boundaries and improved the reliability of outputs.
The results indicate that approximately 28% of buildings in the study area sustained wildfire-induced damage, with nearly 25.6% categorized as Destroyed. Building-level aggregation and integration with GHSL population data revealed that over 32,000 residents were directly affected by destroyed buildings. The combination of damage severity zoning and bivariate gradient mapping identified priority zones where high destruction overlapped with dense population, offering valuable references for emergency rescue and recovery operations.
The findings highlight the applicability of MambaBDA for wildfire-related damage assessment, demonstrating its capability to transfer from multi-hazard training datasets to real disaster scenarios. By bridging pixel-level predictions, building-unit grading, and population exposure analysis, this framework offers a scalable and transferable approach for rapid disaster evaluation. Future research will focus on incorporating SAR and thermal imagery, enhancing population datasets, and fine-tuning the model for wildfire-specific contexts to further improve accuracy, robustness, and operational value.
Author Contributions
Conceptualization, Y.Y. and J.F.; methodology, Y.Y.; validation, Y.Y., W.B., Z.H., and Y.L.; investigation, Y.Y.; data curation, Y.Y. and W.B.; writing—original draft preparation, Y.Y.; writing—review and editing, W.B., J.F., M.T., Z.H., and Y.L.; supervision, J.F. and G.F.; funding acquisition, J.F. and G.F.; resources, J.F. All authors have read and agreed to the published version of the manuscript.
Funding
This research was funded by “Pioneer” and “Leading Goose” R&D Program of Zhejiang (No. 2023C03190), Zhejiang Provincial Emergency Management Science and Technology Project (No. 2025YJ021), Zhejiang Provincial Natural Science Foundation of China under Grant (No. ZJMZ25D050010).
Data Availability Statement
The data presented in this study are openly available in [xBD], reference: https://arxiv.org/pdf/1911.09296 (accessed on 27 September 2025).
Conflicts of Interest
The authors declare that they have no competing interests.
References
- Uprety, P.; Yamazaki, F. Building damage detection using SAR images in the 2010 Haiti earthquake. In Proceedings of the 15th World Conference on Earthquake Engineering, Lisbon, Portugal, 24–28 September 2012; Volume 2012, pp. 24–28. [Google Scholar]
- Ji, Y.; Sri Sumantyo, J.T.; Chua, M.Y.; Waqar, M.M. Earthquake/tsunami damage assessment for urban areas using post-event PolSAR data. Remote Sens. 2018, 10, 1088. [Google Scholar] [CrossRef]
- Liu, Y.; Chen, D.; Ma, A.; Zhong, Y.; Fang, F.; Xu, K. Multiscale U-shaped CNN building instance extraction framework with edge constraint for high-spatial-resolution remote sensing imagery. IEEE Trans. Geosci. Remote Sens. 2020, 59, 6106–6120. [Google Scholar] [CrossRef]
- Wu, F.; Gong, L.; Wang, C.; Zhang, H.; Zhang, B.; Xie, L. Signature analysis of building damage with TerraSAR-X new staring spotlight mode data. IEEE Geosci. Remote Sens. Lett. 2016, 13, 1696–1700. [Google Scholar] [CrossRef]
- Brunner, D.; Lemoine, G.; Bruzzone, L. Earthquake damage assessment of buildings using VHR optical and SAR imagery. IEEE Trans. Geosci. Remote Sens. 2010, 48, 2403–2420. [Google Scholar] [CrossRef]
- Normand, J.C.L.; Heggy, E. Assessing flash flood erosion following storm Daniel in Libya. Nat. Commun. 2024, 15, 6493. [Google Scholar] [CrossRef]
- Yamazaki, F.; Matsuoka, M. Remote sensing technologies in post-disaster damage assessment. J. Earthq. Tsunami 2007, 1, 193–210. [Google Scholar] [CrossRef]
- Silva, V.; Brzev, S.; Scawthorn, C.; Yepes, C.; Dabbeek, J.; Crowley, H. A building classification system for multi-hazard risk assessment. Int. J. Disaster Risk Sci. 2022, 13, 161–177. [Google Scholar] [CrossRef]
- Mangalathu, S.; Sun, H.; Nweke, C.C.; Yi, Z.; Burton, H.V. Classifying earthquake damage to buildings using machine learning. Earthq. Spectra 2020, 36, 183–208. [Google Scholar] [CrossRef]
- Yu, X.; Hu, X.; Song, Y.; Xu, S.; Li, X.; Song, X.; Fan, X.; Wang, F. Intelligent assessment of building damage of 2023 Turkey-Syria Earthquake by multiple remote sensing approaches. npj Nat. Hazards 2024, 1, 3. [Google Scholar] [CrossRef]
- Ge, P.; Gokon, H.; Meguro, K. A review on synthetic aperture radar-based building damage assessment in disasters. Remote Sens. Environ. 2020, 240, 111693. [Google Scholar] [CrossRef]
- Ji, M.; Liu, L.; Buchroithner, M. Identifying collapsed buildings using post-earthquake satellite imagery and convolutional neural networks: A case study of the 2010 Haiti earthquake. Remote Sens. 2018, 10, 1689. [Google Scholar] [CrossRef]
- Wang, N.; Zhao, X.; Zhao, P. Automatic damage detection of historic masonry buildings based on mobile deep learning. Autom. Constr. 2019, 103, 53–66. [Google Scholar] [CrossRef]
- Weber, E.; Kane, H. Building disaster damage assessment in satellite imagery with multi-temporal fusion. arXiv 2020, arXiv:2004.05525. [Google Scholar] [CrossRef]
- Gupta, R.; Goodman, B.; Patel, N.; Hosfelt, R.; Sajeev, S.; Heim, E.; Doshi, J.; Lucas, K.; Choset, H.; Gaston, M. Creating xBD: A dataset for assessing building damage from satellite imagery. In Proceedings of the IEEE/CVF Conference on Computer Vision and Pattern Recognition Workshops, Long Beach, CA, USA, 16–17 June 2019; pp. 10–17. [Google Scholar]
- Shen, Y.; Zhu, S.; Yang, T. Bdanet: Multiscale convolutional neural network with cross-directional attention for building damage assessment from satellite images. IEEE Trans. Geosci. Remote Sens. 2021, 60, 1–14. [Google Scholar] [CrossRef]
- Chen, H.; Nemni, E.; Vallecorsa, S.; Li, X.; Wu, C.; Bromley, L. Dual-tasks siamese transformer framework for building damage assessment. In Proceedings of the IGARSS 2022–2022 IEEE International Geoscience and Remote Sensing Symposium, Kuala Lumpur, Malaysia, 17–22 July 2022; IEEE: New York, NY, USA, 2022; pp. 1600–1603. [Google Scholar]
- Xu, Y.; Zhang, C.; Li, H. Transformer-based large vision model for universal structural damage segmentation. Autom. Constr. 2025, 176, 106256. [Google Scholar] [CrossRef]
- Wang, Y.; Jing, X.; Cui, L. Geometric consistency enhanced deep convolutional encoder-decoder for urban seismic damage assessment by UAV images. Eng. Struct. 2023, 286, 116132. [Google Scholar] [CrossRef]
- Chen, H.; Song, J.; Han, C.; Xia, J.; Yokoya, N. ChangeMamba: Remote sensing change detection with spatiotemporal state space model. IEEE Trans. Geosci. Remote Sens. 2024, 62, 1–20. [Google Scholar] [CrossRef]
- Gupta, R.; Hosfelt, R.; Sajeev, S.; Patel, N.; Goodman, B.; Doshi, J.; Heim, E.; Choset, H.; Gaston, M. xbd: A dataset for assessing building damage from satellite imagery. arXiv 2019, arXiv:1911.09296. [Google Scholar] [CrossRef]
- Marlon, J.R.; Bartlein, P.J.; Gavin, D.G.; Long, C.J.; Anderson, R.S.; Briles, C.E.; Brown, K.J.; Colombaroli, D.; Hallett, D.J.; Power, M.J.; et al. Long-term perspective on wildfires in the western USA. Proc. Natl. Acad. Sci. USA 2012, 109, E535–E543. [Google Scholar]
- Burke, M.; Driscoll, A.; Heft-Neal, S.; Xue, J.; Burney, J.; Wara, M. The changing risk and burden of wildfire in the United States. Proc. Natl. Acad. Sci. USA 2021, 118, e2011048118. [Google Scholar] [CrossRef]
- Modaresi Rad, A.; Abatzoglou, J.T.; Kreitler, J.; Alizadeh, M.R.; AghaKouchak, A.; Hudyma, N.; Nauslar, N.J.; Sadegh, M. Human and infrastructure exposure to large wildfires in the United States. Nat. Sustain. 2023, 6, 1343–1351. [Google Scholar] [CrossRef]
- Mata-Lima, H.; Alvino-Borba, A.; Pinheiro, A.; Mata-Lima, A.; Almeida, J.A. Impacts of natural disasters on environmental and socio-economic systems: What makes the difference? Ambiente Soc. 2013, 16, 45–64. [Google Scholar] [CrossRef]
- Wang, D.; Du, B.; Zhang, L. Adaptive spectral–spatial multiscale contextual feature extraction for hyperspectral image classification. IEEE Trans. Geosci. Remote Sens. 2020, 59, 2461–2477. [Google Scholar] [CrossRef]
- Yun, S.; Han, D.; Oh, S.J. Cutmix: Regularization strategy to train strong classifiers with localizable features. In Proceedings of the IEEE/CVF International Conference on Computer Vision, Seoul, Republic of Korea, 27 October–2 November 2019; pp. 6023–6032. [Google Scholar]
- Ehrlich, D.; Freire, S.; Melchiorri, M. Open and consistent geospatial data on population density, built-up and settlements to analyse human presence, societal impact and sustainability: A review of GHSL applications. Sustainability 2021, 13, 7851. [Google Scholar] [CrossRef]
- Zhou, Z.; Gong, J.; Hu, X. Community-scale multi-level post-hurricane damage assessment of residential buildings using multi-temporal airborne LiDAR data. Autom. Constr. 2019, 98, 30–45. [Google Scholar] [CrossRef]
- Lv, Z.; Liu, J.; Sun, W.; Lei, T.; Benediktsson, J.A.; Jia, X. Hierarchical attention feature fusion-based network for land cover change detection with homogeneous and heterogeneous remote sensing images. IEEE Trans. Geosci. Remote Sens. 2023, 61, 1–15. [Google Scholar] [CrossRef]
- Zheng, Z.; Zhong, Y.; Wang, J.; Ma, A.; Zhang, L. Building damage assessment for rapid disaster response with a deep object-based semantic change detection framework: From natural disasters to man-made disasters. Remote Sens. Environ. 2021, 265, 112636. [Google Scholar] [CrossRef]
- Gu, A.; Dao, T. Mamba: Linear-time sequence modeling with selective state spaces. arXiv 2023, arXiv:2312.00752. [Google Scholar] [CrossRef]
- Liu, Y.; Tian, Y.; Zhao, Y.; Yu, H.; Xie, L.; Wang, Y.; Ye, Q.; Jiao, J.; Liu, Y. Vmamba: Visual state space model. Adv. Neural Inf. Process. Syst. 2024, 37, 103031–103063. [Google Scholar]
- Zhu, L.; Liao, B.; Zhang, Q.; Wang, X.; Liu, W.; Wang, X. Vision mamba: Efficient visual representation learning with bidirectional state space model. arXiv 2024, arXiv:2401.09417. [Google Scholar] [CrossRef]
- Mou, L.; Bruzzone, L.; Zhu, X.X. Learning spectral-spatial-temporal features via a recurrent convolutional neural network for change detection in multispectral imagery. IEEE Trans. Geosci. Remote Sens. 2018, 57, 924–935. [Google Scholar] [CrossRef]
- Zheng, Z.; Zhong, Y.; Tian, S.; Ma, A.; Zhang, L. ChangeMask: Deep multi-task encoder-transformer-decoder architecture for semantic change detection. ISPRS J. Photogramm. Remote Sens. 2022, 183, 228–239. [Google Scholar] [CrossRef]
- Suzuki, S. Topological structural analysis of digitized binary images by border following. Comput. Vis. Graph. Image Process. 1985, 30, 32–46. [Google Scholar] [CrossRef]
- Liu, T.; Yang, L.; Lunga, D. Change detection using deep learning approach with object-based image analysis. Remote Sens. Environ. 2021, 256, 112308. [Google Scholar] [CrossRef]
- Xia, H.; Wu, J.; Yao, J.; Zhu, H.; Gong, A.; Yang, J.; Hu, L.; Mo, F. A deep learning application for building damage assessment using ultra-high-resolution remote sensing imagery in Turkey earthquake. Int. J. Disaster Risk Sci. 2023, 14, 947–962. [Google Scholar] [CrossRef]
- Jing, H.; Sun, X.; Wang, Z.; Chen, K.; Diao, W.; Fu, K. Fine building segmentation in high-resolution SAR images via selective pyramid dilated network. IEEE J. Sel. Top. Appl. Earth Obs. Remote Sens. 2021, 14, 6608–6623. [Google Scholar] [CrossRef]
- Fan, Y.; Li, H.; Bao, Y.; Xu, Y. Cycle-consistency-constrained few-shot learning framework for universal multi-type structural damage segmentation. Struct. Health Monit. 2024, 14759217241293467. [Google Scholar] [CrossRef]
- Yu, B.; Sun, Y.; Hu, J.; Chen, F.; Wang, L. Post-disaster building damage assessment based on gated adaptive multi-scale spatial-frequency fusion network. Int. J. Appl. Earth Obs. Geoinf. 2025, 141, 104629. [Google Scholar] [CrossRef]
Disclaimer/Publisher’s Note: The statements, opinions and data contained in all publications are solely those of the individual author(s) and contributor(s) and not of MDPI and/or the editor(s). MDPI and/or the editor(s) disclaim responsibility for any injury to people or property resulting from any ideas, methods, instructions or products referred to in the content. |
© 2025 by the authors. Licensee MDPI, Basel, Switzerland. This article is an open access article distributed under the terms and conditions of the Creative Commons Attribution (CC BY) license (https://creativecommons.org/licenses/by/4.0/).