Abstract
In this study, iron ore tailings (IOTs) with different mass replacement rates (0%, 20%, 40%, 60%, 80%, 100%) and basalt fibers (BFs) with different volume contents (0, 0.1%, 0.2%, 0.3%) were co-incorporated into recycled concrete. To better simulate real-world conditions, a coupled carbonation–freeze–thaw cycling test was performed on C30 cubic specimens. Each test cycle comprised 7 days of carbonation followed by 25 freeze–thaw cycles, with four total cycles conducted. For specimens subjected to different numbers of test cycles, measurements were taken of the recycled concrete’s variations in mass, dynamic elastic modulus, and compressive strength. Scanning electron microscopy (SEM) was employed to examine the microscopic morphology of concrete under the test conditions and to analyze the mechanism through which the two materials influence the durability of recycled concrete in the experimental environment. Based on the Weibull distribution, a damage prediction model for basalt fiber iron ore tailing recycled concrete (BF-IOT-RAC) under the test environment was developed, and the service life of BF-IOT-RAC in Northwest China was predicted. The results indicate that the two materials can enhance the performance of recycled concrete when their dosages are appropriate; however, excessive dosages exert adverse effects. BF1T40 had a mass loss rate of 1%, an RDEM of 92%, and the cube compressive strength of 33.5 MPa at the conclusion of this test, with all three indicators being higher than those of recycled concrete with a single material incorporated. SEM observations revealed that the surface of BF1T40 was more intact than that of other recycled concretes after the test. According to the prediction, BF1T40 has the longest service life in the northwest region, reaching 42–43 years.
1. Introduction
With the continuous improvement of global infrastructure, innovations in the application of building materials have created many obstacles. The exploitation of natural stone and river sand has led to the rapid depletion of natural resources, prompting many regions worldwide to implement policies prohibiting or restricting the mining of natural stone in response to this issue [1]. In addition, the renovation of buildings generates a large amount of construction waste, which accumulates in cities or is landfilled, causing a significant burden on the natural environment [2]. Many scholars around the world have studied the treatment of construction waste. Recycled aggregate is made from waste concrete after the demolition of existing buildings, after crushing, cleaning, and grading, and replacing part of the natural stone with recycled aggregate to prepare concrete has become a more effective method of treating construction waste [3]. However, the inferior performance of recycled aggregate concrete (RAC) compared to ordinary concrete is primarily attributed to microcracks induced during crushing and the old mortar adhering to its surface. This has significantly hindered the application and research progress of recycled concrete [4]. Therefore, many researchers around the world have conducted research on the improvement of recycled concrete.
For the improvement of the durability of recycled concrete, the most direct way is to solve the defects of the recycled aggregate itself, so that it is close to the natural aggregate in terms of basic performance. Commonly used methods include soaking chemical slurry, carbonation of recycled aggregate, nanomaterial enhancement, etc. [5,6,7,8,9]. Although these methods can enhance the durability and strength of RAC, the actual project uses a large amount of aggregate, and if this method is adopted, the price and difficulty are relatively high. Accordingly, considering the economic benefits in actual engineering and the difficulty of implementation, these methods do not meet these needs.
Two primary approaches to enhance RAC performance are strengthening the recycled aggregates themselves and modifying the concrete mix by incorporating supplementary cementitious materials or alternative binders. Under this requirement, the application of machine-made sand and fiber to concrete has been greatly studied. Gong et al. utilized fly ash as a raw material to prepare concrete, which was cured at different temperatures followed by freeze–thaw cycling tests. They observed that the performance of natural sand concrete was poorer [10]. The utilization of waste glass sand in concrete production can enhance the carbonation resistance and frost resistance of concrete [11]. Wu et al. demonstrated that appropriate incorporation of manufactured sand enhances concrete frost resistance by improving its microstructure densification [12]. Wei et al. found that while blending manufactured sand with river sand improves the frost resistance of concrete, an excessively high content of manufactured sand leads to the formation of new cracks [13]. Research by Wu et al. demonstrates that incorporating manufactured limestone sand as a partial replacement for river sand reduces the open porosity of concrete, significantly enhancing its frost resistance and sulfate attack performance under freeze–thaw cycles; the mass loss after 225 cycles remains well below the damage threshold [14]. Ma et al. prepared C50 machine-made sand concrete for bridges using two common machine-made aggregates in Gansu Province as raw materials. Testing revealed that the resistance of tuff sand concrete to salt and freeze–thaw cycles was superior to that of granite sand concrete [15]. Selva et al. added fibers to machine-made sand as a fine aggregate and found that this combination could improve the durability of concrete [16].
Fiber is used as an advanced and well-performing material to improve the durability of concrete. Polypropylene fiber concrete has a good resistance to chloride ion erosion [17]. Guo et al. added basalt fibers to concrete through experiments and found that the permeability of concrete was improved [18]. Joshi et al. demonstrated that incorporating 0.3% volume of basalt fiber significantly enhances the frost resistance and durability of concrete, markedly reducing mass loss and strength degradation after freeze–thaw cycles [19]. Guo et al. found that 0.15% basalt fiber effectively improves the residual compressive strength of concrete after freeze–thaw action under various curing conditions, with a maximum increase of 30.9%, primarily by suppressing microcrack propagation and mitigating freeze–thaw damage [20]. Yuan et al. reported that adding 6 kg/m3 of basalt fiber to fully recycled pervious concrete reduces the mass loss to 0.9% after 100 freeze–thaw cycles, with a maximum relative dynamic elastic modulus of 62.5%, significantly improving the overall frost resistance [21]. Zhang et al. indicated that a basalt fiber content of 0.1% to 0.2% provides the most notable improvement in concrete frost resistance, outperforming polypropylene fibers [22]. Liu et al. found that the incorporation of 10–30% graphite tailings can densify concrete, thereby enhancing its frost resistance. However, when the content of graphite tailings is high, microcracks propagate rapidly, leading to corresponding internal damage to the concrete. They further added steel fibers to the concrete and observed that steel fibers can reinforce the concrete; with an appropriate dosage of steel fibers, a higher amount of graphite tailings can be utilized, thus improving the utilization rate [23].
Shaanxi Province, China, is abundant in metal mineral resources, accompanied by large quantities of metal tailings, which provide a rich source of tailing sand for this study. Basalt fiber (BF) is an advanced material with excellent performance. Natural volcanic rocks are melted and fluidized at high temperatures, then continuously drawn at high speed through leakage plates made of precious metals (e.g., platinum–rhodium alloys) to produce basalt fiber. Owing to its superior properties, such as alkali resistance, high modulus, and heat resistance, it has been widely applied in fields including civil engineering, transportation engineering, chemical engineering, and environmental engineering. It is also listed as one of the four major high-tech fibers prioritized for development in China, along with carbon fiber, high-molecular-weight polyethylene fiber, and aramid fiber [24].
Previously, we investigated the effects of BF and iron ore tailings (IOT) on the durability of recycled aggregate concrete (RAC) under the conditions of single carbonation and independent freeze–thaw cycles [25]. However, in natural environments, concrete is never exposed to a single carbonation environment or an independent freeze–thaw cycle environment; instead, it operates under the coupling of multiple environmental factors. Currently, there are relatively few studies on the durability of recycled concrete with BF and IOT added under complex environments. Therefore, in this study, BF was used as a reinforcing material, and IOT was used to replace natural sand for concrete preparation. To better simulate real-world conditions, alternating carbonation and freeze–thaw cycle tests were conducted. Specifically, a rapid carbonation test was performed in a carbonation chamber for 7 days, followed by 25 freeze–thaw cycles in a rapid freeze–thaw cycle testing machine, and this process constituted one major cycle, with a total of four major cycles carried out. The changes in RAC durability indicators of each material after each major cycle test were analyzed. Based on the relative dynamic elastic modulus (RDEM), the freeze–thaw cycle damage degree (Dn) was defined. Furthermore, Dn was used to predict the number of cycles and service life achieved during the damage process in Northwest China based on the Weibull distribution freeze–thaw cycle damage model. This study verifies the durability of concrete while promoting the utilization of solid waste.
This research plays a certain role in promoting the recycling of construction waste and tailings, the development of building materials, and the improvement of economic and environmental benefits.
2. Test Materials and Method
2.1. Aggregate
In this study, we selected natural coarse aggregates with a particle size of 10~20 mm obtained by screening method. Both coarse aggregates come from Yan’an, Shaanxi Province, China, and the recycled aggregate is made from crushed concrete with a concrete grade of C30 (Table 1).

Table 1.
Basic properties of coarse aggregates.
The natural fine aggregate was sourced from a sand and gravel yard in Yan’an City, Shaanxi Province, China. Iron tailings sand comes from a tailings yard in Hanzhong City, Shaanxi Province, China. The physical and chemical properties are shown in Table 2 and Table 3. The particle size distribution of the natural sand and IOT are presented in Figure 1.
Table 2.
Natural sand and IOT physical properties.
Table 3.
Chemical composition of IOT.
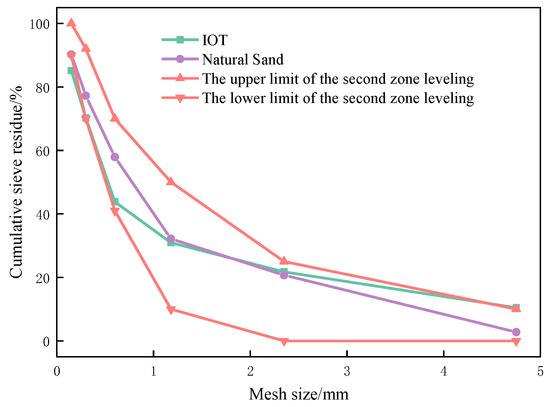
Figure 1.
Particle size of the natural sand and IOT.
2.2. Cement
This study used P·O42.5. Ordinary silicate cement, the chemical composition of cement is shown in the Table 4 below.
Table 4.
Chemical composition of cement.
2.3. Basalt Fiber
The properties of the BF employed in this study are presented in the following Table 5.
Table 5.
Performance parameters of basalt fibers.
2.4. Concrete Mix Ratio Design
The design strength of the concrete in this test is C30, and the slump is designed to be 100–150 mm. Due to the inherent defects of recycled aggregates, this study selected a recycled aggregate replacement rate of 50% and fixed the water–binder ratio at 0.5. Consequently, the dosage of water reducer was set to 1%, equivalent to 1.7 kg/m3. BF1T0 served as the control group for BF1T20, BF1T40, BF1T60, BF1T80, and BF1T100, while BF0T40 was the control group for BF1T40, BF2T40, and BF3T40. The water reducer used was a polycarboxylate superplasticizer, with a water reduction rate of over 25% and a solid content of 20.1%. Nine different mix proportions were designed, as detailed in Table 6.
Table 6.
Concrete test mix ratio (Unit: kg/m3).
2.5. Specimen Molding and Curing
The concrete mixing method employed in this study involves pre-wetting followed by a two-stage feeding and mixing process. In the first step, the recycled aggregate was pre-moistened in a blender with one-tenth of the water for 2 min. Next, half of the cement and water were added, and stirring was continued for 30 s. Finally, the natural sand and IOT, water reducer and cement, and BF and remaining water were added, followed by another 2 min of stirring. The mixture was then poured into molds, vibrated, and properly marked. The surface was smoothed and covered with plastic film. The abrasive was removed after 24 h at room temperature and marked according to the mixing ratio. Subsequently, the concrete specimens were cured for 28 days under standard conditions in a controlled environmental chamber.
2.6. Coupling Test Method of Carbonation and Freeze–Thaw Cycle
The mechanisms underlying concrete freeze–thaw damage and carbonation are distinct, and their reaction products also differ. In general, carbonation reactions make the surface structure of concrete dense, while freeze–thaw makes the concrete structure loose. Conversely, when the freeze–thaw cycle is conducted first, it damages the concrete, leading to a loosened microstructure and surface scaling. This damage provides additional pathways for CO2 ingress during the subsequent carbonation test, accelerating the deterioration process [26]. Therefore, the test in this study adopted a sequence where the carbonation test was conducted first, followed by the freeze–thaw cycle test. The specimens were dried in an oven at 60 °C for 48 h. Subsequently, the dried specimens were placed in a carbonation chamber with a CO2 concentration of 20%, a relative humidity of 70 ± 5%, and a temperature of 20 ± 2 °C. The carbonation part of the coupling experiment was carried out in accordance with (GB/T 50082-2024) [27]. After the completion of the carbonation test, the specimens were taken out and immersed in water for 4 days, followed by the freeze–thaw cycle test. In the freeze–thaw cycle test, the lowest temperature was −18 ± 2 °C and the maximum temperature was 5 ± 2 °C. Each freeze–thaw cycle took about 3.5–4 h. The freeze–thaw cycle test was also in accordance with (GB/T 50082-2024). After 7 days of carbonation test and 25 freeze–thaw cycles, the mass, dynamic elastic modulus, and compressive strength of BF-IOT-RAC were measured. The final experimental result was determined as the arithmetic mean of the measurements from three replicates. A total of four large cycles of the carbonation–freeze–thaw coupling test were conducted (Figure 2).
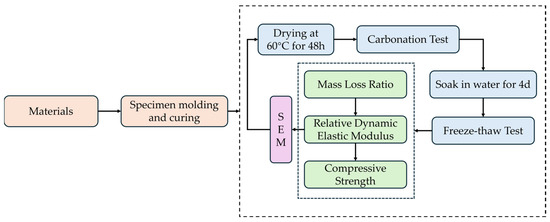
Figure 2.
Test flow chart.
2.7. Test on Mass Loss Rate
Upon completion of each combined cycle, a standard procedure was followed: the specimens were extracted from the chamber, whereby all surface moisture and any spalled particles were carefully removed before the mass of each specimen was determined to an accuracy of 1 g using an electronic scale. The mass loss rate was determined by testing three specimens from each mixture group. The values were subjected to an outlier screening wherein any value deviating by more than 15% from the median was removed. The final result was then calculated as the average of the remaining two values. The method for calculating the mass loss rate is derived from (GB/T 50082-2024) [27].
2.8. Test on Relative Dynamic Elastic Modulus
After each coupled cycle, the transverse fundamental frequency of each specimen was measured using a DT-20 instrument. With the pouring surface facing up, the input sensor gently touches the center of the side of the specimen, and the output sensor gently touches the center point of the right end of the side of the specimen. The lowest frequency was set to 1500 Hz, and the highest frequency was set to 3000 Hz. For the RDEM test, three samples were taken from each mixture group for RDEM testing, and the difference between the maximum and minimum values and the median value was not more than 15% of the median value. When it exceeded 15%, this value was eliminated, and the calculated average of the remaining two values was taken as the final value. The method for calculating the RDEM is derived from (GB/T 50082-2024) [27]. The RDEM calculation equation is shown in the following equation:
represents the relative dynamic elastic modulus of the i-th specimen; and and are the transverse fundamental frequencies (in Hz) of the -th specimen after and 0 freeze–thaw cycles, respectively.
2.9. Compressive Strength Method
After the coupling tests, three 100 mm cube specimens were taken from each mix proportion. The compressive strength tests were performed using a universal press. The compressive strength was determined from three tested specimens per mixture, adopting the rule wherein the deviation of any result from the median must be within 15%. When it exceeded 15%, this value was eliminated, and the calculated average of the remaining two values was taken as the final value. The compressive strength test method follows GB/T 50082-2024 [27].
2.10. SEM Microscopic Observations
After the test, a 1 cm3 sample was taken, and the durability of BF-IOT-RAC was analyzed at the microscopic scale using a scanning electron microscope (SEM).
3. Results and Discussion
3.1. Mass Loss Behavior
Figure 3 and Figure 4 illustrate the mass variations of nine groups of RAC with different mix proportions under various carbonation–freeze–thaw coupling cycles. All specimen weights were measured in a wet state after the freeze–thaw cycle test, and surface moisture and detached aggregates were wiped dry with a towel before measurement. Figure 3 and Figure 4 demonstrate that all BF-IOT-RAC mixes exhibited a net increase in mass upon completion of the first coupled carbonation–freeze–thaw cycle. The underlying cause is that the freeze–thaw cycle of concrete in this study is water freezing, and the whole process is carried out in water. Upon completion of the carbonation test in each full carbonation–freeze–thaw cycle, the BF-IOT-RAC specimens are taken out and soaked in water at room temperature for a duration of four days as part of the preparation for the subsequent freeze–thaw cycle. There are certain pores on the surface and inside of BF-IOT-RAC, and after the RAC is soaked for 4 days and undergoes a period of testing, the pores inside the BF-IOT-RAC are filled with moisture. Therefore, as shown in the Figures, the mass of concrete with all mix proportions rose at the initial stage of the coupling cycle test.
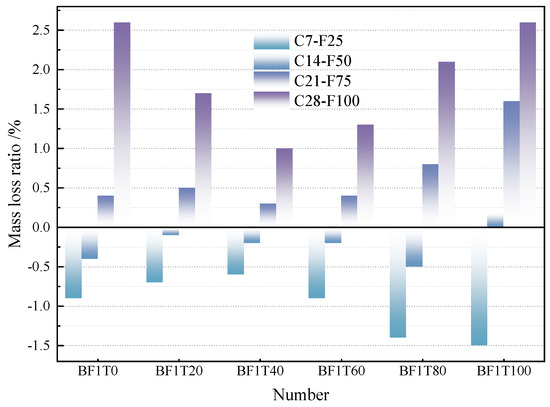
Figure 3.
The mass of concrete changes under different test cycles (C7 is the carbonation test for 7 days; F25 indicates 25 freeze–thaw cycles. C7−F25 is carbonized for 7 days, freeze−thaw cycles performed 25 times).
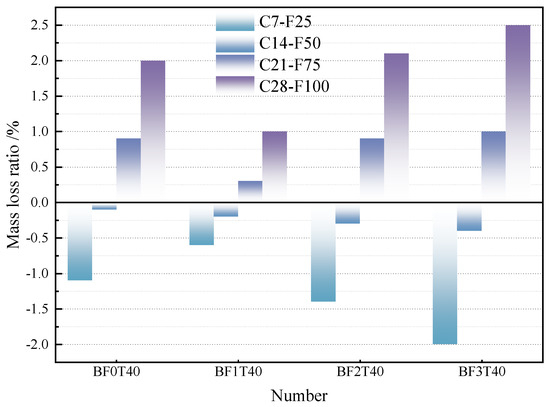
Figure 4.
The mass of concrete changes under different test cycles (C7 is the carbonation test for 7 days; F25 indicates 25 freeze–thaw cycles. C7−F25 is carbonized for 7 days, freeze–thaw cycles performed 25 times).
Figure 3 illustrates the mass loss rate of RAC at different IOT replacement rates during the coupling cycle test when the BF volume content is 0.1%. In Figure 3, when C7-F25 (carbonation for 7 days, freeze–thaw cycle for 25 times), all concrete mass loss rates are negative, indicating that the concrete mass is increased. With the increase in IOT replacement rate, the mass gain of RAC exhibited a trend of first decreasing and then increasing. Among them, the mass of BF1T40 increased the least, only 0.6%. BF1T100 mass increased the most, to 1.5%. The increase in mass is the embodiment of the water absorption of each concrete group in the initial stage of the coupling test, which reflects the compactness of BF-IOT-RAC. At C14-F50 (carbonation for 14 days, freeze–thaw cycle performed 50 times), except for BF1T100, the mass of all other concrete was greater than that before the carbonation–freeze–thaw cycle coupling test. BF1T100 at C14-F50, the mass loss rate is greater than 0, at which point the mass of the particles peeled off the BF1T100 surface has exceeded the mass of water absorption. This indicates that BF1T100 compactness is the worst, with the greatest loss of mass from C7-F25 to C14-F50, reaching 1.7%. At C28-F100 (carbonation for 28 days, freeze–thaw cycle performed 100 times), BF1T40 had the lowest mass loss rate of only 1%, which was due to the fact that the finer particles of IOT could optimize the fine aggregate gradation, and the 40% IOT replacement rate could give full play to the IOT filling effect and minimize the mass loss of RAC in the test environment [28]. BF1T0 and BF1T100 had a higher mass loss rate of 2.6%. This shows that BF1T40 has the best durability in the test environment, and the replacement rate of 40% IOT is reasonable. However, the mass loss rate of BF1T0 and BF1T100 indicates that the higher the replacement rate, the better, and when the replacement rate is too high, the durability of RAC in the test coupling environment is not obvious.
Figure 4 shows the mass changes in RAC with different BF volume content (0, 0.1%, 0.2%, 0.3%), under the condition of 40% IOT replacement rate. It can be found in the Figure that when the IOT replacement rate is 40%, with the increase in BF volume content, the mass loss lower first and then rise under different carbonation–freeze–thaw cycle coupling cycles. At C7-F25, BF1T40 showed the least increase in mass after immersion and coupling tests, only 0.6%. After four cycles of carbonation–freeze–thaw cycle coupling test (28 days of carbonation and 100 freeze–thaw cycles), there is little mass loss compared to the BF1T40 at this time. After four carbonation–freeze–thaw cycle-coupling cycles, the mass of BF3T40 increased by 2.5% compared with the initial mass and 0.5% higher than that of BF1T0. This suggests that BF in concrete does not necessarily improve concrete durability. For any number of test cycles, the mass of BF0T40 is greater than BF2T40 and BF3T40. The main reason is the bridging effect of BF and their good compatibility with concrete, although they can perform well in improving the durability of RAC, the agglomeration phenomenon will occur in the concrete matrix when the dosage is too high [29]. BF clumping together will create larger pores and increase porosity, which will have a negative effect on BF-IOT-RAC. When the fibers are evenly distributed in the aggregate, they can fully exert their effect, which significantly reduces the mass loss of RAC in the test environment.
In summary, combined with the following two Figs., it can be found that the mass change in BF1T40 is the smallest, while that of BF3T40 is the largest at the end of the test. This shows that BF1T40 has the best durability in this environment.
3.2. Relative Dynamic Elastic Modulus (RDEM)
During the test, the damage degree of the internal structure of the concrete gradually increases with the progress of the test, and calculating the change in the fundamental transverse frequency of the elastic wave in the concrete can be used to reflect the degree of internal damage [30]. Figure 5 and Figure 6 illustrate the changes in the RDEM of RAC under different test cycles.
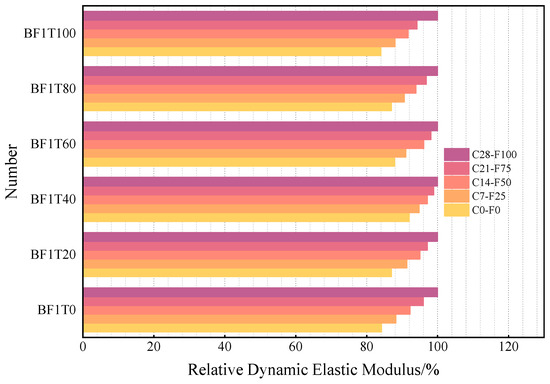
Figure 5.
The RDEM of concrete changes under different test cycles (C7 is the carbonation test for 7 days; F25 indicates 25 freeze–thaw cycles. C7-F25 is carbonized for 7 days, freeze–thaw cycles performed 25 times).
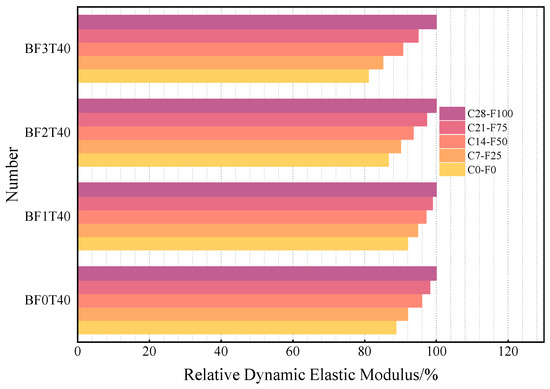
Figure 6.
The RDEM of concrete changes under different test cycles (C7 is the carbonation test for 7 days; F25 indicates 25 freeze–thaw cycles. C7-F25 is carbonized for 7 days, freeze–thaw cycles 25 times).
Figure 5 illustrates the changes in the RDEM of RAC across different test cycles as the IOT replacement rate increases, with the BF volume content set at 0.1%. It can be found from Figure 5 that at C7-F25 (carbonation for 7 days, freeze–thaw cycle for 25 times), with the increase in IOT replacement rate, the RDEM first increases and then decreases. BF1T40 has the least loss of dynamic elastic modulus of only 1.1%. When all fine aggregates are natural aggregates, the RDEM is 96%, and when all fine aggregates are IOT, the RDEM is the least. The Relative Dynamic Elastic Modulus (RDEM) is a crucial quantitative measure of durability for Recycled Aggregate Concrete (RAC) undergoing these test cycles. It directly reflects the degree of internal damage within the BF-IOT-RAC specimens. At this time, it can be found that after C7-F25, the internal damage of BF1T40 is the smallest, and with the increasing replacement rate of IOT, the internal damage of recycled concrete first decreases, then increases, with the internal damage of BF1T40 being the smallest, and the internal damage of BF1T100 being the largest. With the continuous coupling test of the test cycle, the RDEM decreases continuously. At C28-F100 (carbonation for 28 days, freeze–thaw cycle for 100 times), the RDEM of every BF-IOT-RAC reached the least. At this time, it can be found from the figure that the RDEM of BF1T40 is the largest, which is 92%, and the RDEM is only 8% lost in the whole test cycle. The RDEM difference between the RAC without IOT and the RAC with full IOT is only 0.2%, which indicates that the addition of IOT may not necessarily improve the durability of RAC in the test environment.
Figure 6 illustrates the change in the RDEM of RAC in different test cycles with the increase in BF volume content when the IOT replacement rate is 40%. It can be found from Figure 6 that the RDEM of RAC first rises and then falls in each carbonation–freeze–thaw cycle. Thus, the effect of BF on the RDEM of RAC in this study environment varies with the change in its volume content. At C7-F25, the RDEM of BF1T40 was the highest, and the dynamic elastic modulus was lost by 0.7%, less than that of BF0T40. However, with the BF volume content being 0.3%, the RDEM of BF3T40 was only 94.9%, and the modulus was lost by 3.3% more than that of RAC without BF. The results showed that adding 0.3% volume content of BF to RAC would lead to poor durability in the carbonation–freeze–thaw cycle coupling environment. At C28-F100, the whole test is over, and the RDEM of the BF3T100 is only 81% at this time. The RDEM of BF1T40 without fiber was 88.7%. Many researchers have found that when too much BF is mixed with RAC, agglomeration will occur. The 0.1% content of BF can be intricately and evenly distributed in RAC, giving full play to its excellent bridging effect and hindering the development of matrix cracks [31].
Figure 5 and Figure 6 show the downward trend of concrete RDEM with the test under different mix ratios. With the increase in IOT substitution rate and BF content, RDEM showed a trend of first rising and then falling in different test cycles, and the relative dynamic elastic modulus of BF1T40 was the largest in each test cycle. Therefore, when the IOT substitution rate is 40% and the BF content is 2.65 kg/m3, the durability is the best.
3.3. Compressive Strength
As one of the most commonly used indicators to measure the performance of concrete, compressive strength is widely used in concrete research. In this study, the compressive strength test of concrete is one of the important indicators for testing the durability of RAC after undergoing the carbonation–freeze–thaw cycle coupling test.
Figure 7 illustrates the changes in the compressive strength of RAC with different IOT replacement rates with the continuous coupling test of carbonation–freeze–thaw cycle when the volume content of BF is 0.1%. Figure 7 shows that the compressive strength of each group of BF-IOT-RAC continues to decrease throughout the testing period. At the end of different test cycles, with the increase in IOT content, the compressive strength first rises and then falls. At C0-F0 (carbonation for 0 days, freeze–thaw cycle for 0 times), BF1T40 had the highest compressive strength of 41.3 MPa. It is 6 MPa higher than BF1T0 and 4.7 MPa higher than BF1T100. This indicates that when the content of BF is 0.1, the IOT with a replacement rate of 40% can better improve the properties of RAC, which can reflect the compactness of RAC before the test. After the coupling test, the compressive strength reflects the durability of BF-IOT-RAC. At C28-F100 (carbonation for 28 days, freeze–thaw cycle for 100 times), Figure 8 illustrates that BF1T40 has the highest compressive strength of 33.5 MPa, and the least loss is only 7.8 MPa. While BF1T0 has a compressive strength of 26.6 MPa, with a loss of 8.7 MPa. BF1T100 at C28-F100, the compressive strength is the lowest, which is 24.5 MPa. This is due to the fact that its own water absorption is higher, and more water will freeze inside the concrete during the freeze–thaw cycle after carbonation, resulting in greater icing pressure and further damaging the inside of the concrete.
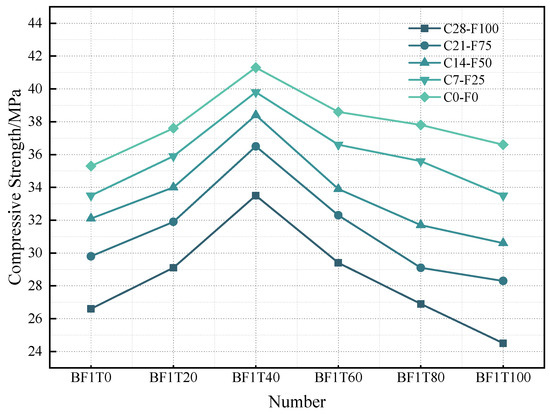
Figure 7.
The compressive strength of concrete changes under different test cycles (C7 is the carbonation test for 7 days; F25 indicates 25 freeze–thaw cycles. C7-F25 is carbonized for 7 days, freeze–thaw cycles performed 25 times).
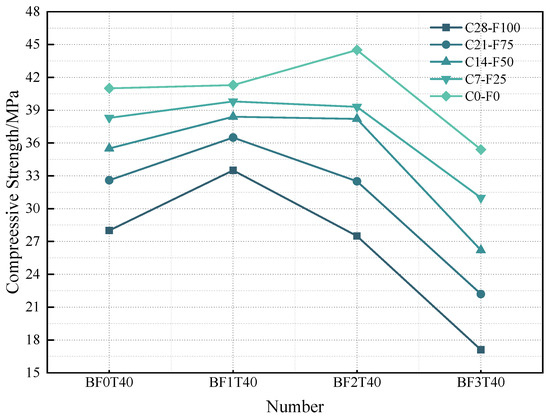
Figure 8.
The compressive strength of concrete changes under different test cycles (C7 is the carbonation test for 7 days; F25 indicates 25 freeze–thaw cycles. C7-F25 is carbonized for 7 days, freeze–thaw cycles performed 25 times).
Figure 8 depicts the influence of varying BF volume fractions on the compressive strength of BF-IOT-RAC under the continuous coupling test, with the IOT replacement rate fixed at 40%. Additionally, Figure 8 illustrates the progressive decrease in compressive strength observed across all concrete groups throughout the testing process. Results indicate that the durability of the BF2T40 group is inferior to that of the BF1T40 group under the present test conditions. This phenomenon can be attributed to the high water absorbency of BF when its volume fraction is 0.2%: specifically, the bridging effect of BF within the concrete during testing is insufficient to offset the adverse effects arising from this high water absorbency. After exposure to the C28-F100 regime, the BF3T40 group exhibits the lowest compressive strength, at merely 17.1 MPa—representing a reduction of 10.9 MPa compared to the BF1T40 group. Under this condition, the fibers inside the concrete undergo more severe agglomeration, which results in the formation of additional pores. These pores subsequently lead to further deterioration of the concrete following freeze–thaw cycles.
In summary, combined with the following two figures, it can be found that BF1T40 has the least loss of compressive strength at the end of the entire test, while BF3T40 has the largest loss. This trend is consistent with the RDEM results presented in Section 3.2. In both cases, the decline in compressive strength corresponds to a reduction in the elastic modulus. Among all mixes, BF1T40 exhibited the slowest RDEM decline, consequently demonstrating the highest compressive strength and optimal durability following the coupling tests (Table 7).
Table 7.
Compressive strengths of each mix.
3.4. BF-IOT-RAC SEM Observations
In order to more clearly analyze the mechanism of the effect of BF and IOT on the durability of BF-IOT-RAC in the test environment, the scanning electron microscope (SEM) was used for microscopic observation of BF1T0, BF0T100, BF1T40, and BF1T40. Figure 9 shows that ettringite (Aft), BF, and calcium silicate hydrate (C-S-H) are present in the concrete at C28-F100. Reticular calcite structures appeared after the coupling test of carbonation–freeze–thaw cycle. This is because concrete has undergone carbonation tests first, and a complex multiphase physicochemical continuous process is carried out in the carbonation phases of concrete in the vapor, liquid, and solid phases. During the carbonation test, CO2 enters the pores and capillaries of RAC and then dissolves in the liquid phase in the capillary tube, interacting with Ca(OH)2 and hydration products such as tricalcium silicate and dicalcium silicate produced during cement hydration to form calcium carbonate. The main reaction chemical equations are as follows: Equations (2)–(6) [32].
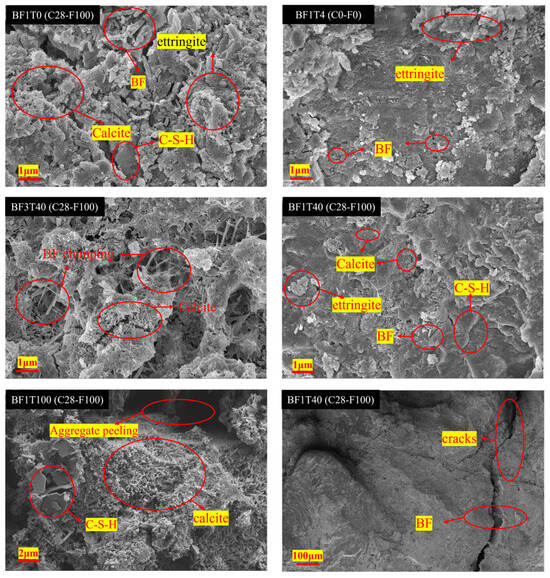
Figure 9.
SEM observations (C28 is the carbonation test for 28 days; F100 indicates 100 freeze–thaw cycles. C28-F100 is carbonized for 28 days, freeze–thaw cycles performed 100 times).
Products such as CaCO3 generated by the reaction can fill the pores of the RAC surface, forming a hard, brittle shell [33]. After a 7-day carbonation test, 25 freeze–thaw cycles need to be conducted, which can cause the surface aggregates of RAC to peel off and may lead to the formation of cracks. These damages destroy the shell created during the carbonation process, which promotes the diffusion of carbon dioxide and water into the concrete. In addition to this, it can be found from the above equation that concrete releases chemically bound water during carbonation. It undergoes a reaction with the CO2 and CaCO3 present in the concrete, resulting in a volume of calcite larger than the volume of the original Ca(OH)2, causing internal cracking of the concrete. Therefore, in the coupled test, compared to a single carbonation test or freeze–thaw cycle test, the concrete experiences more severe damage.
As shown in Figure 9, the fine aggregate in mix BF1T0 is composed entirely of natural sand. After C28-F100, in addition to a small amount of flaky C-S-H that can be clearly observed on the surface of the hydrated products, there are also reticular calcite structures and ettringite. Furthermore, internal cracks, a relatively loose structure, and broken BF were observed within BF1T0. Prior to the test, in BF1T40, the BF were uniformly distributed in a staggered orientation and tightly bonded with the matrix. It can be observed that the matrix was relatively dense, indicating that the replacement rate of IOT was reasonable at this point. At the C28-F100 stage, a small amount of reticular calcite structures were visible, while flaky C-S-H remained the dominant hydration product. Notably, calcite and C-S-H could be distinguished from each other under this condition. When observed at a magnification of 100x, the concrete surface appeared dense in most areas, except for the cracks generated during the fragmentation process and the broken BF. There are two reasons for this phenomenon: (1) BF with a volume content of 0.1% formed a tight connection with the matrix. (2) The IOT with a 40% replacement rate effectively exerted its filling effect. The synergistic effect of these two materials enhances the resistance to CO2 erosion and reduces the freeze–thaw damage caused by pore water.
Compared with BF1T40, BF3T40, due to the excessive dosage of BF, inevitably leads to fiber agglomeration, which creates many pores. These pores offer additional space for CO2 ingress and for freeze–thaw damage induced by pore water. With the alternation of carbonation and freeze–thaw cycles, at the C28-F100 stage, in addition to the calcite generated by the reaction, many BFs are observed to cluster together, forming larger pores. It can be seen that in BF3T40, BFs instead exacerbate CO2 erosion, leading to severe internal damage and crack formation in the concrete during subsequent freeze–thaw cycles. From the observation of BF1T100 at C28-F100, a large amount of reticular calcite is generated in the matrix, with only a very small amount of flaky C-S-H, and C-S-H and calcite have become difficult to distinguish. Moreover, there is significant aggregate disintegration in the images of BF1T100, and the structure is extremely loose. The IOT has a high water absorption rate, which increases the amount of pore water inside BF1T100 during freeze–thaw cycles, leading to greater freezing pressure and more severe frost heave damage.
From the SEM observation results, BF1T40 exhibits a denser structure and better durability under the test conditions. During this period, the potential volcanic ash activity of the IOT is activated. This activation promotes the formation of cement hydration products. When the IoT content is reasonable, the internal structure of the concrete becomes denser [34]. In addition, an appropriate volume content of BF allows it to fully perform the bridging function, forming a close bond with the matrix.
4. Damage Model and Life Prediction of BF-IOT-RAC Based on Weibull Distribution
4.1. Weibull Distribution Theory and Damage Model
Due to the particular structure of BF-IOT-RAC, its performance in all aspects is inferior to that of ordinary concrete. To apply BF-IOT-RAC in engineering structures, this study needs to predict its service life in a carbonation–freeze–thaw cycle environment.
Therefore, the Weibull distribution model of two parameters consistent with concrete is used to predict the durability life of concrete. The Weibull distribution, proposed by Waloddi Weibull, is widely used in data processing and failure analysis models for various life tests because it can easily infer its distribution parameters using probability values [35]. Currently, a large number of scholars around the world have demonstrated that when RDEM is used as an indicator, the freeze–thaw cycle damage of concrete satisfies the Weibull distribution [10,36]. Therefore, this study establishes a T-D damage model using the Weibull distribution. The shape parameters and scale parameters of the two parameters are estimated, and the failure probability distribution formula of concrete is established. The formula for the failure probability distribution is:
where μ is its shape parameter, λ is its scale parameter, and both parameters are greater than 0; x is the predicted freeze–thaw cycle times.
By deriving the above equations, the failure probability density formula of concrete can be obtained.
Take the logarithm at both ends of Equation (8) at the same time to obtain Equation (9):
According to the above form, it can be regarded as a function Y = aX + b. Let Y = ln[−ln(1 − F(n))], X = ln(n), a = μ, b = μln(λ).
The values of a and b can be obtained by linear regression fitting of the equation Y = aX + b. μ = a, λ = exp − (b/). X is calculated by the freeze–thaw cycle times n in this test. In the process of testing, when the concrete damage degree is Dn ≥ 1, it means that the concrete is about to reach the state of loss of strength. The change in the RDEM is calculated as a damage variable as follows:
represents the degree of damage to the freeze–thaw cycle. represents RDEM, in the (GB/T 50082-2024) regulations, when RDEM drops to 60%, it is classified as concrete failure. Therefore, when Dn ≥ 1 is defined in the above equation, the concrete fails.
The Y value varies with the value of the about the freeze–thaw cycle times n. During testing, the internal damage in the RAC accumulated, accompanied by a corresponding increase in the Weibull failure probability. Therefore, the failure probability of BF-IOT-RAC can be equivalent to the degree of internal damage. According to GB/T 50082–2024 [27], when the RDEM of the specimen is reduced to 60%, the concrete is considered to be damaged. Therefore, can be equivalent to Equation (11).
The linear fitting analysis of the values at different is carried out by the least squares method, and the fitting graphs are obtained as shown in Figure 10 and Figure 11, and the corresponding regression parameters a, b, μ, λ, and correlation coefficient R2 are shown in the Table 8.
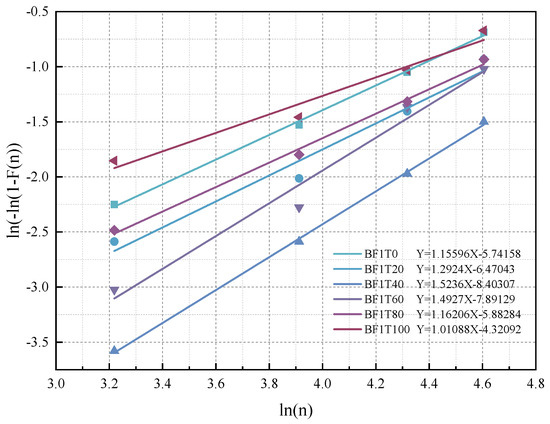
Figure 10.
Fitting diagram of ln[−ln(1 − F(n))] values.
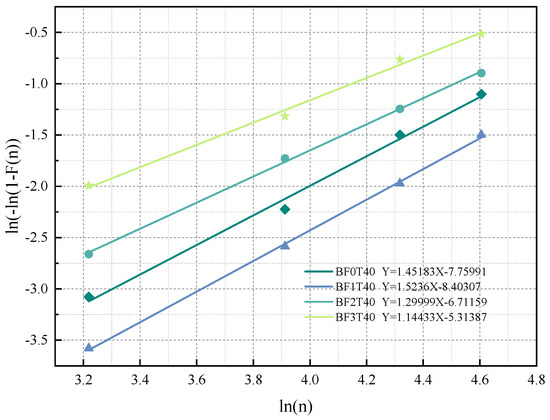
Figure 11.
Fitting diagram of ln[−ln(1 − F(n))] values.
Table 8.
The corresponding regression parameters a, b, μ, λ, and the correlation coefficient R2.
μ and λ are located within the 95 % confidence interval, with a significance level of p > 0.05.
4.2. Life Prediction of BF-IOT-RAC Based on Weibull Distribution
Bringing the corresponding μ and λ derived from the above table into Equation (6) can obtain nine different sets of failure probability distribution function curves, as shown in Figure 12. With the rise in the freeze–thaw cycle times (a 7-day carbonation test is carried out before every 25 freeze–thaw cycles), the failure probability of BF-IOT-RAC increases, which means that the concrete continues to be damaged internally during the test. In general, it is believed that when the failure probability reaches 0.9, the structure needs to be repaired or renovated [10]. This is because a failure probability of 0.9 indicates that structural failure is imminent. Without immediate intervention, this state poses a significant risk of safety incidents and potential casualties. In this study, the freeze–thaw cycle times with a failure probability of 0.9 were used as the predicted freeze–thaw cycle times.
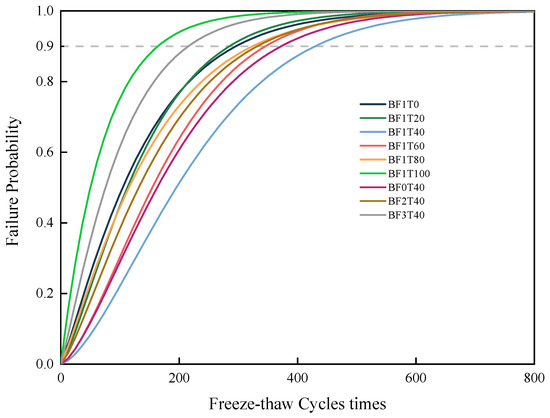
Figure 12.
Distribution curve of BF-IOT-RAC failure probability.
Based on Figure 12, the Table 9 presents the freeze–thaw cycle times for BF-IOT-RAC at a failure probability of 0.9. According to the test scheme and the predicted freeze–thaw cycle times, the number of coupling test cycles can be obtained. The climate in northwest China is cold, with significant annual temperature variations, leading to the ongoing carbonation of concrete. Taking Northwest China as the experimental environmental background, according to the literature, the Northwest Region experiences about 169 days of cold weather each year. There are about 120 freeze–thaw cycles per year [37]. Li et al. have conducted a large number of studies and found that when RDEM is the same, the approximate conversion ratio between indoor freeze–thaw cycles and outdoor freeze–thaw cycles is 1:12 [38]. Therefore, the service life of concrete is obtained by conversion, as shown in Table 6. It illustrates that the BF1T40 has the longest predicted lifespan of 42.4 years, while BF1T100 has the shortest predicted lifespan of only 15.7 years, which shows that a 0.1% volume dosage of BF, and 40% replacement rate IOT can better improve the durability of BF-IOT-RAC in the test environment.
Table 9.
Cycle number and life prediction of coupling test based on Weibull distribution.
5. Conclusions
This study investigated the durability of recycled aggregate concrete (RAC) in a coupled environment by enhancing it with basalt fiber (BF) and iron ore tailings (IOT). The microstructure was examined using scanning electron microscopy (SEM). Furthermore, the service life of the BF-IOT-RAC in the Northwest China’s environment was predicted employing the Weibull distribution model. The main findings are as follows:
- (1)
- Both BF and IOT contribute to enhancing the durability of BF-IOT-RAC under the coupled environment of carbonation and freeze–thaw cycles. However, excessive BF may agglomerate due to uneven agitation, thereby resulting in increased porosity of the mixture. Under such circumstances, carbonation further induces a reduction in the material’s density. During freeze–thaw cycles, the freezing of pore water exacerbates damage to the concrete matrix. In terms of IOT, it inherently contains cracks; when its replacement rate is relatively high, it aggravates the degradation of concrete during the testing process. When both BF and IOT are employed in excessive quantities, their synergistic effect on RAC significantly impairs the latter’s durability. Specifically, when the BF content is 0.1% and the IOT substitution rate is 40%, the mixture achieves optimal durability, characterized by a mass loss rate of merely 1%, a relative dynamic elastic modulus (RDEM) of 92%, and a compressive strength of 33.5 MPa.
- (2)
- As observed via scanning electron microscopy (SEM) at C28-F100, the matrix surface of BF1T40 still retains a substantial amount of C-S-H, with relatively few reticular calcite structures; notably, the surface remains relatively intact when viewed at 100× magnification. In contrast, for BF1T100—where IOT was employed as the sole fine aggregate—the C-S-H and reticulated calcite on its surface became indistinguishable following the test, and the matrix structure exhibited obvious looseness. For BF3T40, excessive BF led to agglomeration, which generated numerous pores within the matrix. These pores further exacerbated the damage induced by CO2 ingress and the freeze–thaw cycling of pore water.
- (3)
- The damage index (Dn) was derived from the relative dynamic elastic modulus (RDEM) acquired in the testing process. By employing the Weibull distribution function, a damage model was developed for the nine distinct groups of BF-IOT-RAC under the given experimental conditions. Based on this established model, the number of freeze–thaw cycles and the corresponding service life in Northwest China were predicted. Specifically, when the BF content was 0.1% and the IOT substitution rate was 40%, the service life of the concrete was expected to reach 42–43 years.
In this paper, the effects of BF and IOT on RAC durability in a carbonization–freeze–thaw coupling cycle in recycled concrete with a 50% recycled aggregate substitution rate are discussed. With 0.1% BF and a 40% substitution rate, IOT can work together in recycled concrete to maximize the durability of recycled concrete. This research can promote sustainable development and reduce resource consumption, while promoting the further application of materials in the construction industry.
This study has certain limitations. The durability of RAC is influenced by the source of recycled aggregates, and the physicochemical properties of IOT vary across regions. Furthermore, experimental conditions were constrained by laboratory limitations. These aspects will be addressed in future work to improve the study.
Author Contributions
Data curation, X.-H.W.; Writing—original draft, X.-H.W.; Writing—review & editing, X.-J.T.; Project administration, Y.Z. All authors have read and agreed to the published version of the manuscript.
Funding
This research was funded by the National Natural Science Foundation of China, [52278217]; Science and Technology Plan Project of Yan’an Science and Technology Bureau of China, 2023SLSFGG-087; and Henan Province key R&D and promotion special project, 202102310255.
Data Availability Statement
The original contributions presented in this study are included in the article. Further inquiries can be directed to the corresponding author.
Conflicts of Interest
The authors declare no conflicts of interest.
References
- Rigo, E.; Gava, G.P.; Felix, E.F.; Borges, P.M.; Possan, E. Concrete with recycled aggregates from construction: Properties, emissions and carbon capture assessment. Case Stud. Constr. Mater. 2025, 23, e04983. [Google Scholar] [CrossRef]
- Masood, S.; Lu, D.G.; Onyelowe, K.C.; Shah, M.M.; Almujibah, H.; Rezzoug, A.; Ahmed, H.; Ramzan, T.; Kahla, N.B.; Ghazouani, N. Performance and sustainability in hybrid concrete: A study of recycled aggregates and activated fly ash. Ain Shams Eng. J. 2025, 16, 103597. [Google Scholar] [CrossRef]
- Rosales, M.; Rosales, J.; Moreno, S.; Agrela, F.; Díaz-López, J.L. Sustainable concrete manufactured with mixed recycled aggregate and biomass bottom ash, replacing aggregate and cement to a high percentage. Case Stud. Constr. Mater. 2025, 22, e04785. [Google Scholar] [CrossRef]
- Alkhteeb, L.; Dawood, M.B. The effect of recycled aggregate on properties of concrete: A review. Hybrid Adv. 2025, 11, 100535. [Google Scholar] [CrossRef]
- Li, J.H.; Chen, J.; Bu, C.M.; Zhang, M.T.; Yu, J.; Yu, X.R.; Sun, Y.; Yu, Y. Synergistic enhancement of sulfate resistance in recycled aggregate concrete through multi-pathway blocking via carbonation treatment and fly ash incorporation. Constr. Build. Mater. 2024, 491, 142685. [Google Scholar] [CrossRef]
- Wahab, S.; Abbasi, A.M.; Ahmed, A.; Khan, I.U. Influence of acetic acid treated recycled concrete aggregates on the rheological and mechanical properties of self-compacting concrete: Experiments and machine learning. Constr. Build. Mater. 2024, 491, 142770. [Google Scholar] [CrossRef]
- Wang, C.Q.; Lu, Y.L.; Zhang, Y.C.; Wu, H.X.; Ma, Z.M. Computed tomography images and digital volume correlation analysis of microstructural damage evolution in carbonated recycled aggregate concrete. Constr. Build. Mater. 2024, 491, 142761. [Google Scholar] [CrossRef]
- Yang, J.Y.; Chen, Y.Z.; Chen, G.J.; Wang, D.C.; Tam, V.W.; Guo, T.T.; Li, P.R.; Li, Z.X.; Fang, C.Z.; Shen, A.Q. Mechanical properties and improvement mechanism of pervious concrete made with modified recycled aggregates. Constr. Build. Mater. 2024, 490, 142548. [Google Scholar] [CrossRef]
- Zhang, X.G.; Li, M.B.; Wang, C.H.; Li, Y.L.; Fan, Y.H.; Liu, X.Y.; Ding, Y.H.; Shen, W.L. Multi-parameter analysis of nano-SiO2 modified recycled aggregate concrete: Fatigue damage and microscopic mechanisms. Structures 2025, 79, 109414. [Google Scholar] [CrossRef]
- Gong, L.; Ran, T.; Bu, Y.Z.; Xu, T.L.; Zhao, X.H. Research on frost resistance and life prediction of fly ash manufactured sand concrete under negative temperature curing. Case Stud. Constr. Mater. 2025, 23, e05012. [Google Scholar] [CrossRef]
- Son, M.; Kim, G.; Eu, H.; Lee, Y.; Sasui, S.; Pyeon, S.; Lee, S.; Nam, J. Effect of pretreated waste glass sand on comprehensive performance of concrete based on mechanical properties, durability, and microstructure. Constr. Build. Mater. 2025, 487, 141963. [Google Scholar] [CrossRef]
- Wu, H.; Gao, Q. Study on Freeze–Thaw Resistance of Cement Concrete with Manufactured Sand Based on BP Neural Network. Buildings 2024, 14, 2952. [Google Scholar] [CrossRef]
- Wei, F.; Zhang, F.; Gao, L.; Wang, R.; Ren, X.; Zhang, D. Mechanical Properties and Micromorphology of Calcium Oxide Expansion Agent on River Sand/Machine-Made Sand Concrete. Adv. Civ. Eng. 2022, 2022, 9407640. [Google Scholar] [CrossRef]
- Wu, Q.; Hou, Y.; Mei, J.; Yang, J.; Gan, T. Influence of synthetic limestone sand on the frost resistance of magnesium potassium phosphate cement mortar. Materials 2022, 15, 6517. [Google Scholar] [CrossRef] [PubMed]
- Ma, F.R.; Zhang, Y.S.; Qiao, H.X.; Liu, H.X. Damage constitutive model of manufactured sand concrete for bridges under composite salt freeze-thaw cycles. Constr. Build. Mater. 2025, 483, 141339. [Google Scholar] [CrossRef]
- Selva, G.M.; Jagadeesh, P. Assessment of usage of manufactured sand and recycled aggregate as sustainable concrete: A review. Mater. Today Proc. 2022, 64, 1029–1034. [Google Scholar]
- Bediako, M.; Ametefe, T.K.; Asante, N.; Adumatta, S. Incorporation of natural coconut fibers in concrete for sustainable construction: Mechanical and durability behavior. Case Stud. Constr. Mater. 2025, 22, e04867. [Google Scholar] [CrossRef]
- Guo, R.; Li, J.Y.; Huo, X.Y.; Wang, Z.K. Durability experimental study and service life evaluation of basalt-PVA fibre-reinforced concrete in chloride-rich environments. Case Stud. Constr. Mater. 2025, 23, e05060. [Google Scholar] [CrossRef]
- Joshi, S.P.; Ramaswamy, V.; Sohail, M.A.S. Enhancing frost resistance and durability of self-compacting concrete through basalt fiber reinforcement. J. Build. Pathol. Rehabil. 2024, 9, 3. [Google Scholar] [CrossRef]
- Guo, Y.; Gao, J.; Lv, J. Experimental study on the frost resistance of basalt fiber reinforced concrete. Materials 2024, 17, 4593. [Google Scholar] [CrossRef]
- Yuan, S.; Li, K.; Luo, J.; Yin, W.; Chen, P.; Dong, J.; Liang, W.; Zhu, Z.; Tang, Z. Research on the frost resistance performance of fully recycled pervious concrete reinforced with fly ash and basalt fiber. J. Build. Eng. 2024, 86, 108792. [Google Scholar] [CrossRef]
- Zhang, Y.; Zhou, G.; Zheng, Y. Effect of fiber type on the mechanical properties and durability of hardened concrete. J. Mater. Sci. 2023, 58, 16063–16088. [Google Scholar] [CrossRef]
- Liu, H.B.; Zhang, C.; Jia, C.; Tao, D.D. Freeze-thaw cycle characteristics of graphite tailing concrete and steel fiber reinforced-graphite tailing concrete. Constr. Build. Mater. 2025, 462, 140006. [Google Scholar] [CrossRef]
- Xiao, J.Z.; Zhou, Y.W.; Deng, Z.H.; Yang, H.F.; Mei, J.J.; Jiang, J.S.; Wei, T. Investigation of biaxial compressive mechanical properties and strength criteria of basalt fiber-reinforced coral aggregate concrete. Constr. Build. Mater. 2025, 475, 141199. [Google Scholar] [CrossRef]
- Zhang, Y.; Wang, X.-H.; Tang, X.-J. An Experimental Study on the Effects of Basalt Fiber and Iron Ore Tailings on the Durability of Recycled Concrete. Buildings 2025, 15, 2492. [Google Scholar] [CrossRef]
- Wang, J.G. Durability Decay Law and Improvement Mechanism of Recycled Concrete Under Complex Environmental Conditions. Ph.D. Thesis, Beijing University of Technology, Beijing, China, 2020. (In Chinese). [Google Scholar]
- GB/T 50082−2024; Standard for Test Methods for Long-Term Performance and Durability of Ordinary Concrete. China Architecture & Building Press: Beijing, China, 2024.
- Zhang, H.Y.; Jin, J.X.; Wu, P.F. Mesostructural alteration in porosity of iron tailings sand under freeze-thaw cycle studied by X-ray microcomputed tomography. Micron 2025, 198, 103871. [Google Scholar] [CrossRef]
- Yang, Q.G.; Wang, H.H.; Yi, Q.G.; Zeng, L.Y.; Xiang, R.; Guan, L.F.; Cheng, J.W.; Chen, K.L.; Li, Y.H. Performance assessment of basalt fibre concrete under freeze-thaw cycles using hybrid long short-term memory models. Case Stud. Constr. Mater. 2025, 23, e04995. [Google Scholar] [CrossRef]
- Gong, L.; Zhao, X.H.; Bu, Y.Z.; Xu, T.L.; Yu, X.B.; Liang, Y.T. Research on frost resistance of desert sand + machine-made sand blended concrete and life prediction. Structures 2024, 70, 107875. [Google Scholar] [CrossRef]
- Huang, D.G.; Wang, X.Z.; Li, X.F.; Su, L.; Tian, J.B.; Li, Y.; Liu, Y.H. Research on the mechanical properties and pore structure deterioration of Basalt-polyvinyl alcohol hybrid fiber concrete under the coupling effects of sulfate attack and freeze-thaw cycles. Constr. Build. Mater. 2025, 473, 140949. [Google Scholar] [CrossRef]
- Geng, H.N. Research on the Relationship Between Concrete Microstructure and Durability. Master’s Thesis, Wuhan University of Technology, Wuhan, China, 2011. (In Chinese). [Google Scholar]
- Zhou, M.H.; Dong, W. Grey relativity correlations between the pore structures and compressive strength of aeolian sand concrete undergoing carbonation and freeze-thaw cycles. J. Build. Eng. 2023, 77, 107515. [Google Scholar] [CrossRef]
- Liu, Q.; Cheng, X.C.; Sun, C.; Jin, C.K.; Tam, V. Impact of carbonization and aggregate properties on modeled recycled concrete: Mechanical characteristics, stress concentration and damage evolution. Constr. Build. Mater. 2025, 467, 140327. [Google Scholar] [CrossRef]
- Adamu, M.; Ibrahim, Y.E.; Raut, A. High-temperature performance evaluation of sustainable date palm fiber concrete with activated carbon: An MCDM and Weibull analysis approach. Results Control. Optim. 2025, 20, 100602. [Google Scholar] [CrossRef]
- Cheng, X.; Tian, W. Based on Weibull distribution analysis of salt freeze damage of multi-walled carbon nanotube concrete. J. Build. Mater. 2025, 28, 202–209. (In Chinese) [Google Scholar]
- Wang, J.; Han, F.; Liu, Q. Research on freeze-thaw damage and life prediction model of polyethylene fiber-reinforced cementitious composites based on reliability analysis. Case Stud. Constr. Mater. 2024, 20, e03049. [Google Scholar] [CrossRef]
- Li, J.Y.; Peng, X.P.; Deng, Z.G.; Cao, J.G.; Guan, Y.S.; Lin, L.; Tian, J.T.; Li, F.; Wang, A.Q.; Wang, Z.G.; et al. Quantitative design of concrete frost resistance. Concrete 2000, 12, 61–65. [Google Scholar]


Disclaimer/Publisher’s Note: The statements, opinions and data contained in all publications are solely those of the individual author(s) and contributor(s) and not of MDPI and/or the editor(s). MDPI and/or the editor(s) disclaim responsibility for any injury to people or property resulting from any ideas, methods, instructions or products referred to in the content. |
© 2025 by the authors. Licensee MDPI, Basel, Switzerland. This article is an open access article distributed under the terms and conditions of the Creative Commons Attribution (CC BY) license (https://creativecommons.org/licenses/by/4.0/).