Article

Failure Mechanism and Load Carrying Capacity of Hybrid High-Strength Steel Composite Cellular Beams Under Low Cyclic Loading

by
Jiangran Guo
1,
Siyu Huo
1,
He Zhao
1,* and
Tengfei Li
2,*
1
School of Future Cities, University of Science and Technology Beijing, Beijing 100083, China
2
Department of Civil Engineering, Tsinghua University, Beijing 100084, China
*
Authors to whom correspondence should be addressed.
Buildings 2025, 15(21), 3954; https://doi.org/10.3390/buildings15213954
Submission received: 26 September 2025 / Revised: 28 October 2025 / Accepted: 31 October 2025 / Published: 2 November 2025
(This article belongs to the Special Issue High-Performance Steel–Concrete Composite/Hybrid Structures)

Abstract

This study reveals the Vierendeel mechanism of hybrid high-strength steel composite cellular beams (HHS-CCBs) through experimental investigation and finite element analysis (FEA). The forces acting on the openings of composite cellular beams (CCBs) are further analyzed. A calculation method is developed to evaluate the load-carrying capacity of HHS-CCBs under the combined action of bending moment and shear force, which takes into account the shear contributions of the concrete slab and beam flange at circular openings. The accuracy of the proposed formula and the influence of key parameters on load-carrying capacity are thoroughly examined through FEA. The results indicate that within the range of D = 0.6hs − 0.7hs and L = 0.7hs − 1.0hs (D and L represent the hole diameter and edge distance, respectively; hs is the height of the steel beam), stress concentration at the beam-end welds could be avoided, the formation of Vierendeel mechanism at the beam-end opening could be ensured, and excessive reduction in load-carrying capacity could be prevented. Furthermore, the high-strength steel (HSS) flange strength and location had a minimal effect on the failure mode of HHS-CCBs. As the flange strength increased, full plasticity was not achieved in the cross-section, and the load-carrying capacity increased nonlinearly. Asymmetric specimens with HSS in the lower flange only and symmetric specimens with HSS in both the upper and lower flanges exhibited comparable load-carrying capacities. The load-carrying capacity calculation formula is applicable to HHS-CCBs with different section types, provided that circular holes are present in the beam web and Vierendeel mechanism damage occurs. However, the flange width–thickness ratio must not significantly exceed the specified limit.

1. Introduction

Composite beams with web openings refer to a new type of component formed by creating single openings or continuous openings in the web of the steel beam, as shown in Figure 1. When applied in multi-story and high-rise buildings, composite beams with web openings can not only increase the clear height of buildings and reduce the structural self-weight, but also, through rational design, utilize the energy dissipation of web openings under seismic action to prevent structural collapse. Thus, they have broad prospects for engineering application.
Since the 1980s, research on the load-carrying capacity calculation of composite beams with web openings has relatively matured, and three general calculation methods have been established. The first method directly calculates the shear and bending capacity at the openings based on the failure mechanism of a Vierendeel truss [1,2,3]. This method was first proposed by Lawson [2] and was subsequently calibrated by Lawson and Chung through tests on composite beams with web openings [1]. On this basis, the design method was re-proposed based on the application rules of Eurocode 4 [4] for the detailed design of composite beams with large web openings and general rules for the size of the openings [3]. However, this method requires prior specification of the external loads to which the composite beam is subjected and is used to verify the load-carrying capacity at the opening. The second method derives the formula of the sub-bending moment function at the four corners of the opening using the virtual stress map method, and the curves of the sub-bending moment–axial force and axial force–shear force for each section of the opening are calculated by programming. Then, an axial force N is given, and the total bending moment of the corresponding cross-section can be found [5,6,7,8,9]. Based on the above design concept, Zhou [5,6,7] proposed a load-carrying capacity calculation model for composite beams with openings without reinforcement under positive bending moments. Subsequently, Wang et al. [8,9] determined the axial force–submoment–shear interrelation diagrams of web-opening reinforced composite beams under a positive bending moment for load-carrying capacity calculations. The design method is applicable to various opening heights and lengths with high computational accuracy; however, the derivation is complicated and not conducive to generalization. Based on the above study, Li [9] derived an equation for calculating the ultimate load-carrying capacity at the hole of web openings without reinforcement composite beams under the negative loading, which provides a theoretical reference for the design of a composite beam under the negative loading. In the third method, the composite beam may be subjected to both a bending moment and shear force at the web opening, and the strength of the web opening is lower than that obtained under the action of the pure bending moment or pure shear forces alone when the loads are combined. Therefore, it is necessary to calculate the pure bending capacity (under zero shear condition) and pure shear capacity (under zero bending moment condition) at the web opening and then determine the load-carrying capacity at the opening using bending–shear action curves [10,11,12,13,14].
Thus far, the most common method for determining the load carrying capacity of composite beams with web openings is based on the bending–shear interaction criterion [10,11,12,13,14,15,16,17,18,19,20,21,22,23,24,25,26,27]. The calculation of the maximum bending capacity in most design methods is based on the plastic development of the full section [4,28,29], and these methods differ mainly in how they calculate the maximum shear capacity and what curve shapes are used to complete the bending moment–shear interaction diagram. Among them, the interaction curves are mainly divided into two categories: one is segmented secondary bending–shear action curves [10,11,12,13,14,15,16,17], another is cubic bending–shear action curves [18,19,20,21,22,23,24,25]. The method proposed by Darwin and Lucas [20,21] has the broadest scope of application. Furthermore, the cubic interaction curves of bending–shear are used, where the pure bending capacity is calculated using plastic limit theory [29], the pure shear capacity of the composite beam is calculated according to the stress distribution assumed at the opening under maximum shear, and the shear capacity of the concrete slab is ignored. This method is the easiest to use, has the highest accuracy, and has been adopted by the American Institute of Steel Construction (AISC) in the Structural Steel Design Guide series [22]. Moreover, it is the primary design technique in the Structural Engineering Institute/American Society of Civil Engineers (SEI/ASCE) standards [23]. The load carrying calculation studies highlighted above focused on web openings of composite beams under positive bending moments. In recent years, some researchers have conducted experimental and theoretical studies on the web opening of composite beams under negative bending moment [26,27]. Based on the bending–shear interaction criterion, the bending–shear interaction curve and pure shear capacity proposed in SEI/ASCE [23] are modified to obtain the load carrying capacity calculation model of the web opening of composite beams under negative bending moment.
The author previously proposed a hybrid high-strength steel composite cellular beam (HHS-CCB) with ordinary steel (OS) in the web and high-strength steel (HSS) in the flange, and conducted experimental and numerical studies on its seismic performance under cyclic loading [30]. The results revealed that, with a reasonable hole diameter and distance from the first opening at the beam end to the joint (referred to as the hole edge distance), the Vierendeel mechanism damage occurs at the beam end opening of the HHS-CCBs, the stress concentration at the beam end is avoided, and the hybrid design specimens maintain a better ductility, stiffness degradation, strength degradation, and energy dissipation capacity, while the hybrid of HSS and OS significantly improves the loss of structural load-carrying capacity owing to the web opening [30]. The method for calculating composite beams with web openings in SEI/ASCE [23] is relatively simple and mature. When a cellular beam flange is composed of an HSS, the section type of the beam can change [31]. The calculation method in ASCE [23] and subsequent improvements by researchers assume that the steel yield strength does not exceed 448.5 MPa and must satisfy the criteria of compact sections in the AISC specification [29]. The calculation method in SEI/ASCE [23] is based on numerous experimental studies on composite beams with rectangular openings on the web. The case of a circular opening in the web is simply equated to rectangular openings; therefore, further investigations are needed to determine whether the method in SEI/ASCE [23] applies to the calculation of the load-carrying capacity of HHS-CCBs with circular openings as well as ways of improving it.
In this study, the research was conducted by integrating experimental data, numerical simulations, and theoretical analysis: First, relying on the failure modes, strain analysis, and numerical simulation results of the specimens in Guo et al. [30], the damage mechanism of HHS-CCBs was revealed, and theoretical force analysis was conducted at the web opening of HHS-CCBs (Section 2 and Section 3). Next, the corresponding load-carrying capacity calculation model was constructed and verified by experimental results (Section 4 and Section 5). Subsequently, a validated finite element model of HHS-CCB was used for parametric analysis to investigate the effects of different hole diameters, hole edge distances, and flange-web strength matching on the load-carrying capacity. By comparing numerical results with theoretical results, the accuracy and applicability of the proposed load-carrying capacity calculation method were further verified (Section 6 and Section 7).

2. Experimental Design

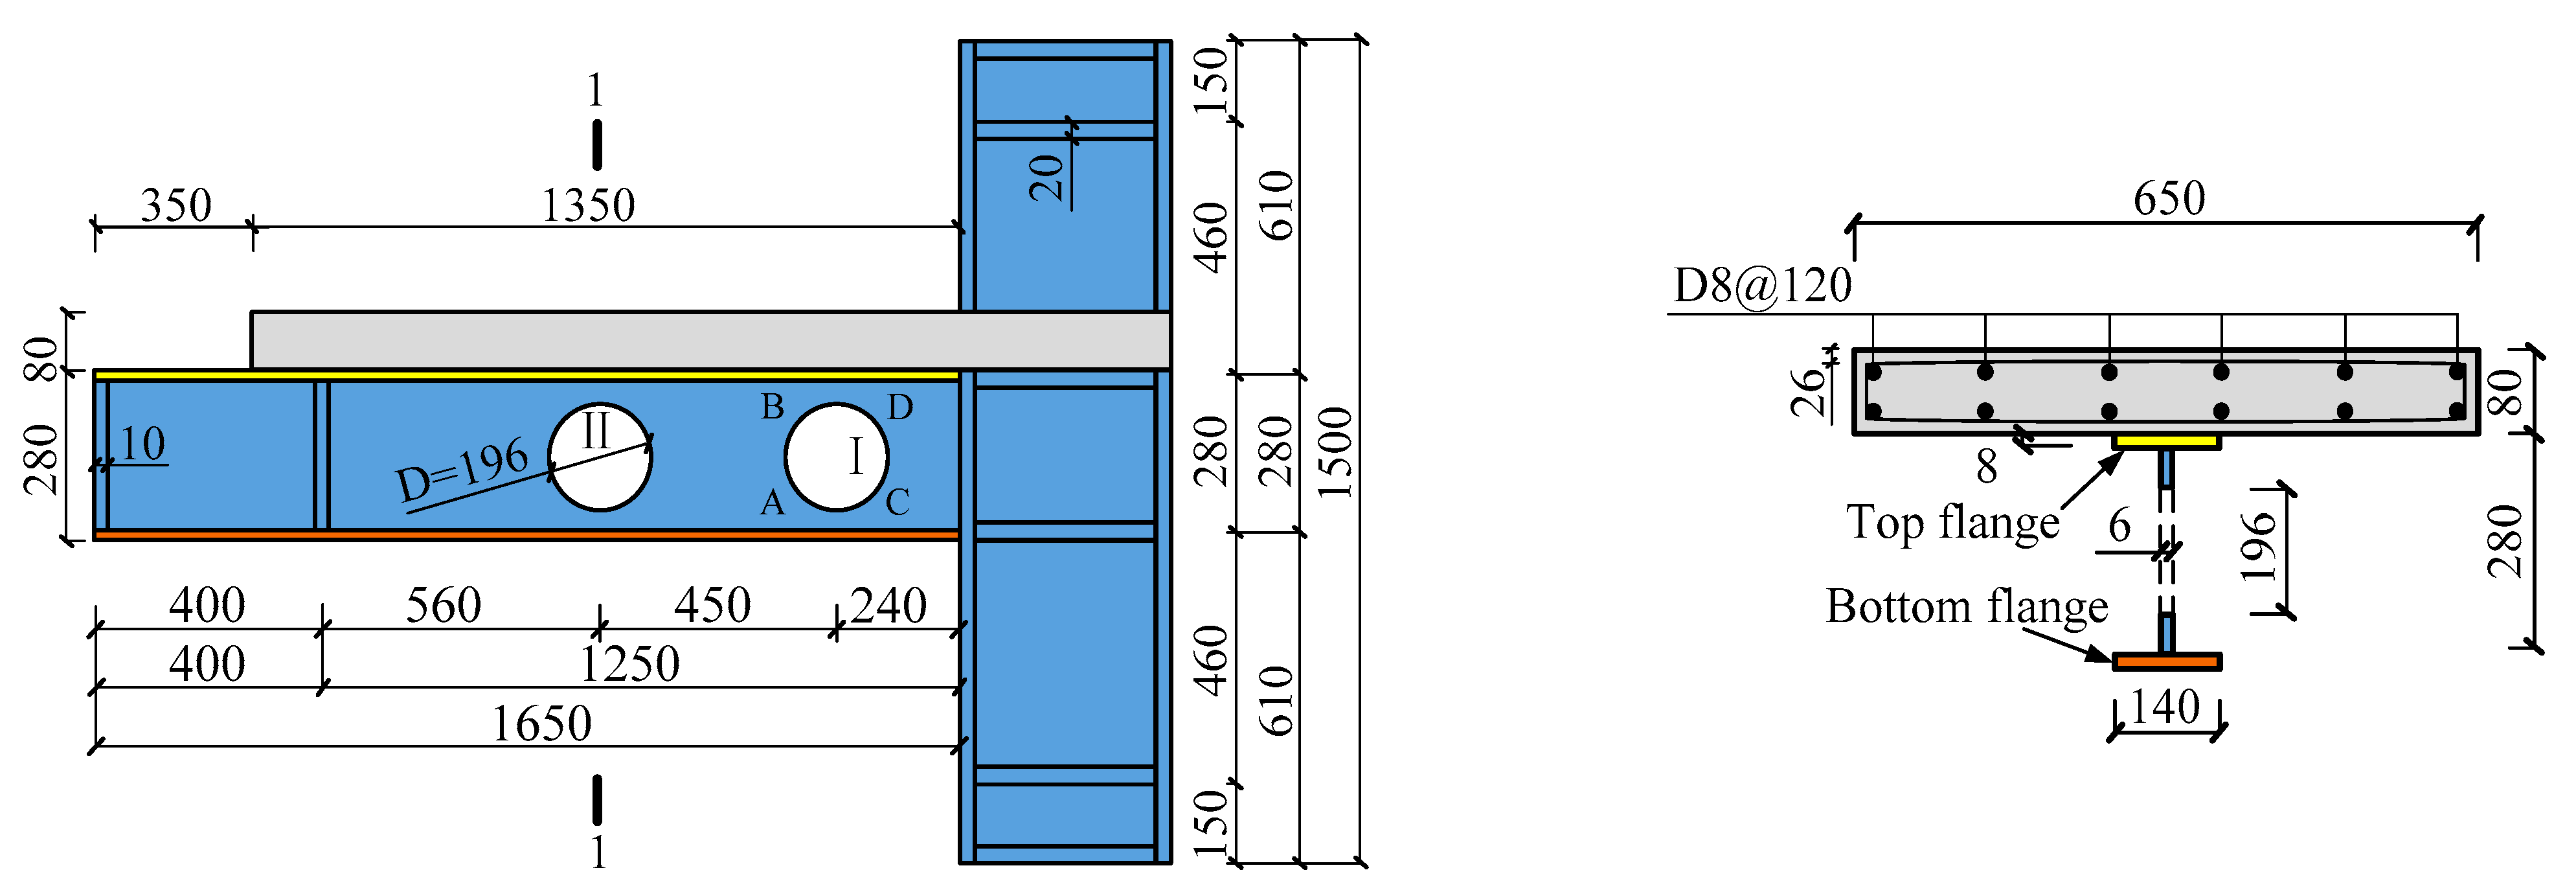
Experiments on HHS-CCBs under cyclic loading were completed in Guo et al. [30], and the design details of the specimen are shown in Figure 2. All five specimens had the same size, with a concrete slab size of 1740 mm × 650 mm × 80 mm and a strength of C40. HRB400 was used as the longitudinal and transverse reinforcement. The cross-sectional dimensions of the column were 390 × 300 × 10 × 15 mm. The beams and columns were connected via full-penetration welds. The cross-sectional dimensions of the beams were 280 ×140 × 6 × 8 mm. Q355, Q460, and Q550 steels were used as the CCBs. The hole diameter D of the beam web was 196 mm, hole edge distance L was 240 mm, and hole spacing S was 450 mm. The more geometric and constructional details of the specimens can be found in Guo et al. [30].
The HHS-CCBs were fabricated using OSs in the web, OSs or HSSs in the upper flange, and HHSs in the lower flange. According to the AISC specification [29] for compact sections, the definitions of the compact sections of the web and flange should comply with Equations (1) and (2), respectively.
h w t w 3.76 E s f y
b f / 2 t f 0.38 E s f y
Table 1 lists the section types of all specimen beam flanges and webs. The detailed experimental processes and analysis of the results are described in Guo et al. [30]. Based on this, further research was conducted on the failure mechanism and load-carrying capacity calculation method for HHS-CCBs.

3. Vierendeel Mechanism of HHS-CCBs

3.1. Failure Modes

All specimens eventually exhibited similar crack distributions and damage patterns in the experiments; therefore, HCCB-1 was used as a representative specimen.
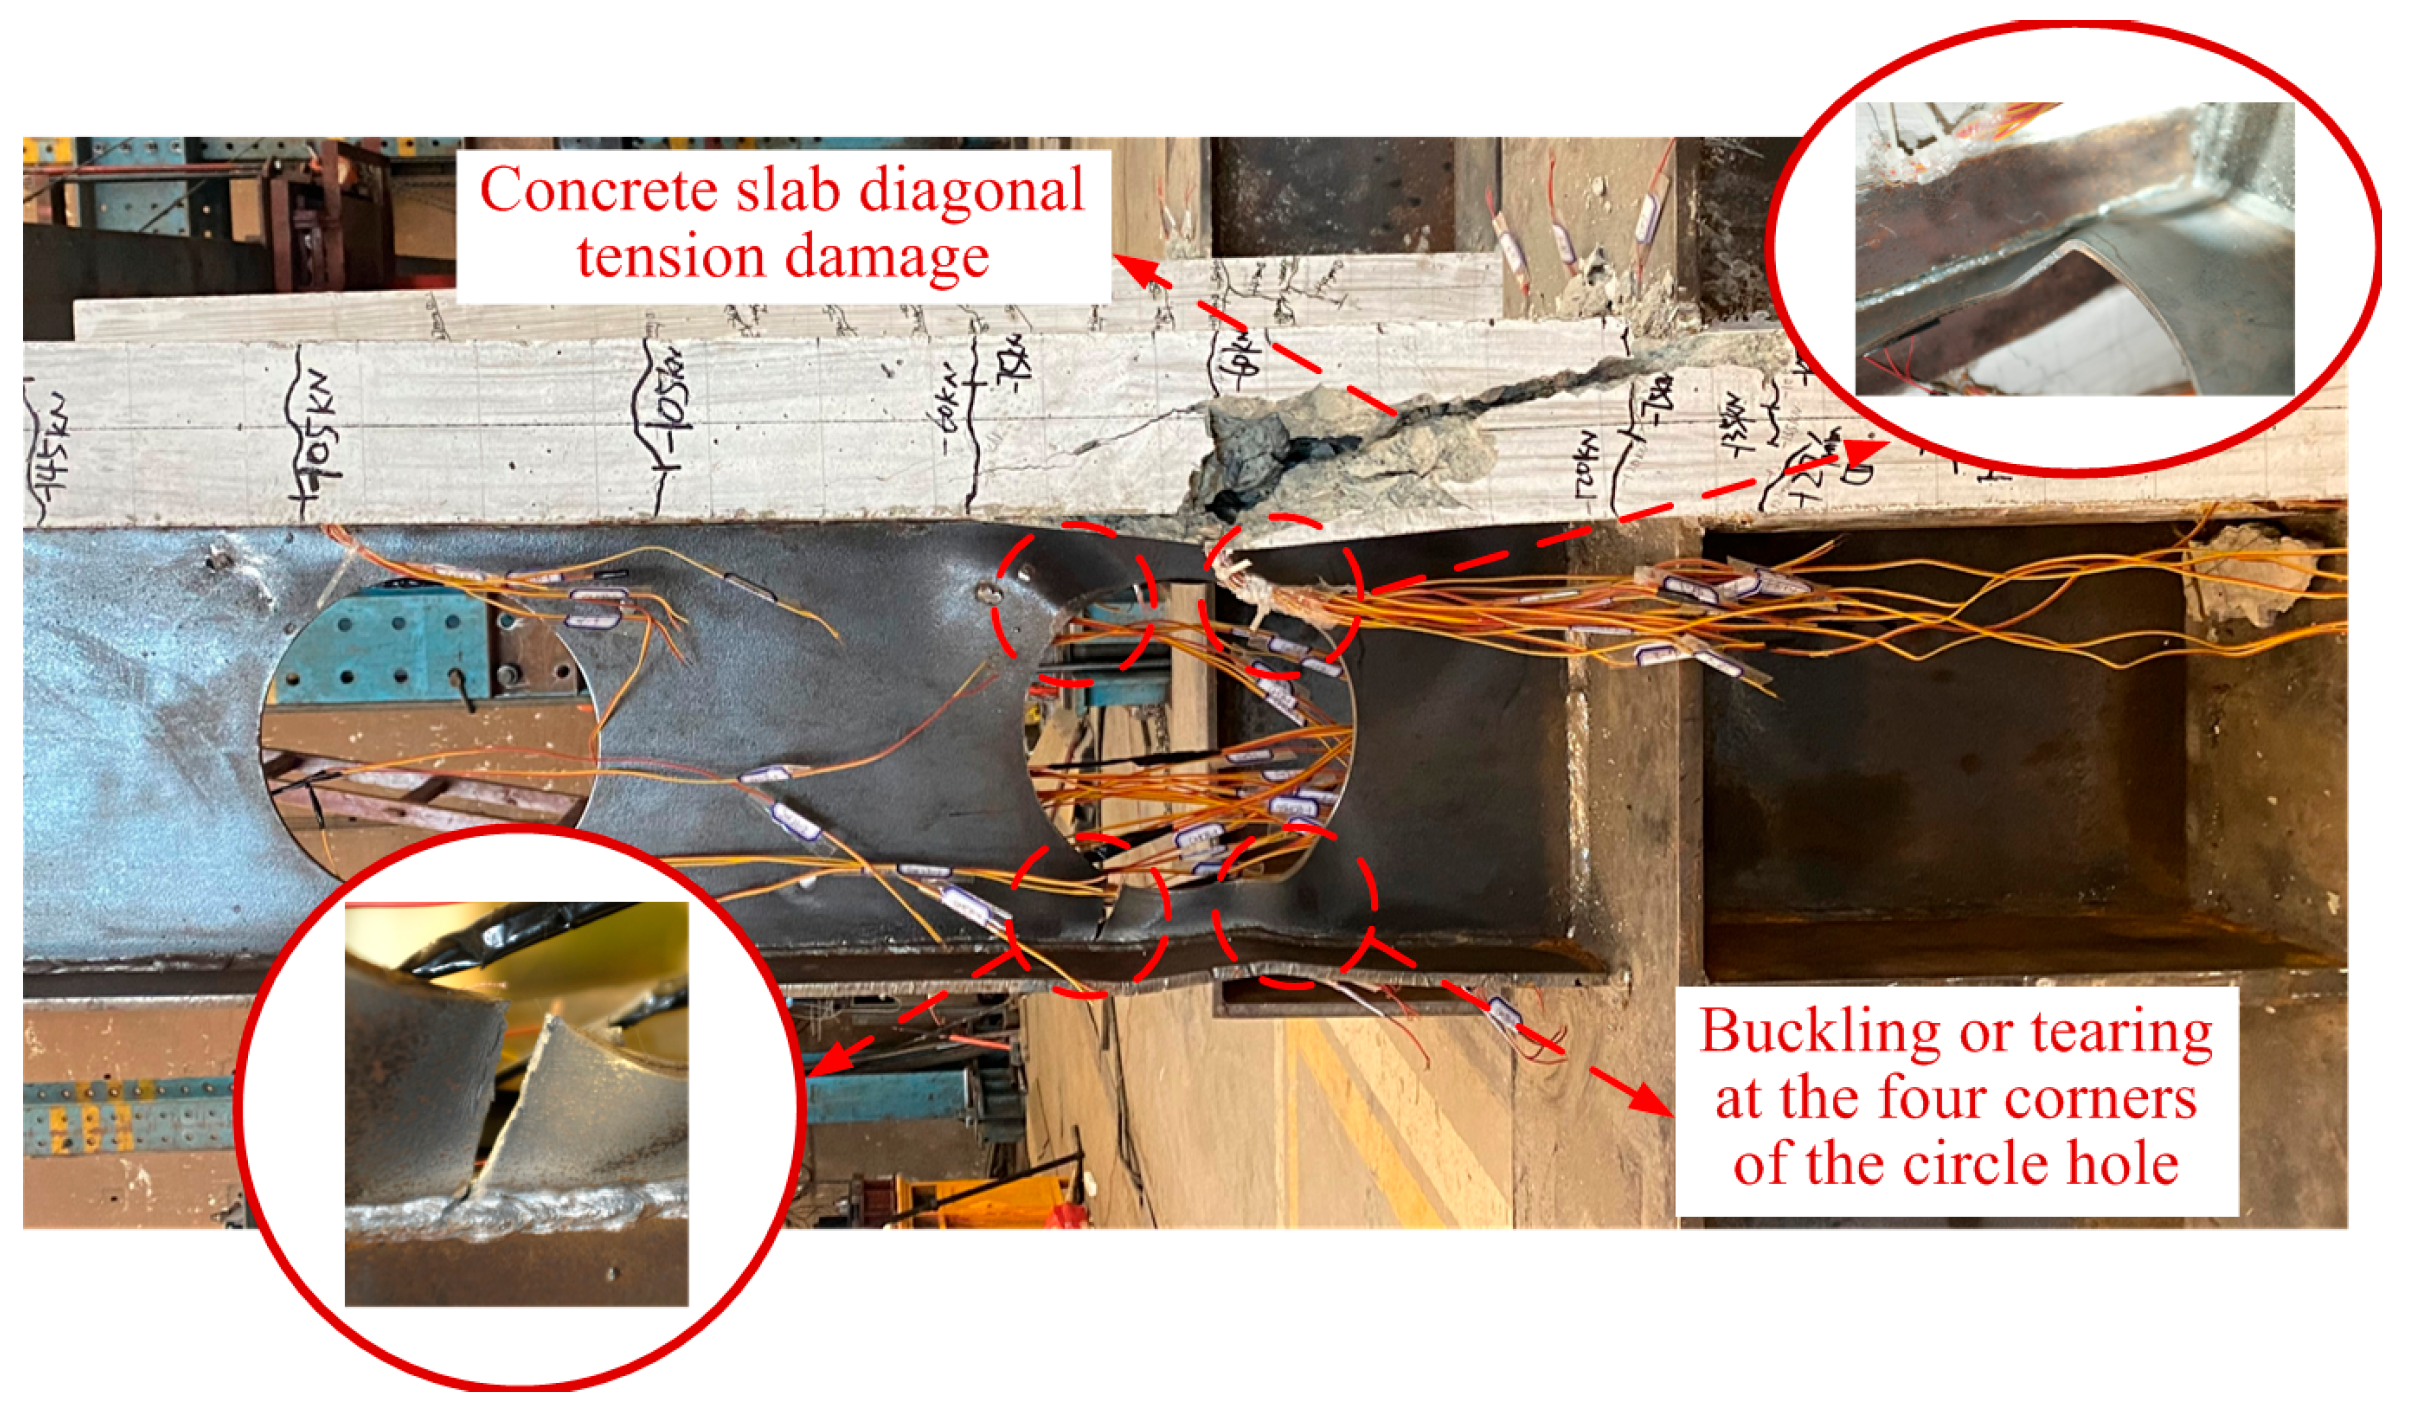
As shown in Figure 3, at the initial stage of load-controlled loading, all specimens behaved elastically, and horizontal cracks first appeared at the front and back of the concrete slab between the beam end and hole II and developed toward the side of the slab. No significant deformations were observed in the cellular beam during this stage. As the loading progressed, the slab at the beam end was eventually crushed. The concrete slab between the high moment end of hole I and the beam end was damaged by diagonal tension, and a large amount of concrete spalling occurred and the slab failed. Hole I of all the specimens formed an irregular ellipse, the web around the hole was severely deformed, the bulges of the four hole corners A, B, C, and D were fully developed, and corner A of hole I of specimens HCCB-1 and HCCB-4 became torn. This damage pattern has been confirmed in many experiments as a typical four-hinged Vierendeel damage pattern [7,8,9,10,11,12].
In summary, the web openings of HHS-CCBs under cyclic loading were subjected to the combined action of bending and shearing. The damage mechanism of the HHS-CCBs was the same as that of the composite beams with web openings under monotonic loading, in which plastic hinges appeared at the four corners of the beam-end opening, forming a four-hinged Vierendeel mechanism accompanied by diagonal tensile damage to the concrete slab above the high-moment end of the openings.

3.2. Strain Analysis Around Hole I of the Specimens

The experiments revealed that all the specimens exhibited four-hinged Vierendeel mechanism damage at hole I at the beam end. As the webs of all the specimens were made of the same specification Q355 steel, specimen HCCB-1 was chosen to analyze the main strain around hole I. The strain distribution around the hole exhibited a similar trend under different loading levels. The ratios of the principal strain to the yield strain (μεy = 1.957 × 10³) at the elastic loading stage (0.5Fy) and yielding (1.0Δy) of the specimen were selected for analysis, as shown in Figure 4.
The stress around hole I was symmetrical along the BD and AC directions under positive and negative loadings, respectively. The maximum stress of the circular hole appeared at corners B and C of hole I, instead of at the edge of the hole. Under positive loading, corners B and D extruded and bulged outward, exhibiting compressive stress, whereas corners A and C were in a tensile state, exhibiting tensile stress. Under negative loading, corners A and C were squeezed and bulged outward, exhibiting compressive stress; conversely, corners B and D exhibited tensile stress. During the entire loading process, the stress value and stress variation in the edge at the upper part of the circular hole were smaller than those at the lower part of the circular hole owing to the restraint of the concrete slab and upper flange. This is consistent with the damage phenomenon of hole I in the experiment described in Section 3.1.

3.3. Finite Element Analysis (FEA) Around Hole I of the Specimens

The damage mechanism of the HHS-CCBs was further analyzed using the validated ABAQUS finite element model introduced in Guo et al. [30]. The three-dimensional eight-node solid element with reduced integration (C3D8R) provided by ABAQUS was used to simulate the concrete slab, cellular beam, and H-beam columns. A three-node numerically integrated truss element (T3D2) was used for reinforcement bars. The cellular beam was directly connected to the column by the “tie” contact. The interaction between the cellular beam and concrete was simulated by contact. The friction coefficient was chosen as 0.2. The elastic–plastic damage model was used for the concrete model and the bilinear model was used for the steel members. The more detailed modeling process can be found in Guo et al. [30]. Specimen HCCB-1 was taken as a typical example, and the Mises stress distribution around hole I of the cellular beam under different stages were shown in Figure 5, Figure 6 and Figure 7. The stress distribution was divided into three stages: the yield point, peak point, and ultimate point.

3.3.1. Stress Distribution Development of Cellular Beam Under Yield Stage

Figure 5 shows that, when the specimen was loaded to yield load, the four hole corners A, B, C, and D of hole I first reached the yield stress fy = 395.13 MPa (as shown in Figure 2). Meanwhile, the yield stress fy = 475.45 MPa was reached in the lower flange region corresponding to hole I, and the yield stress fy = 345.65 MPa was reached in a small area of the upper flange. At this time, the cellular beam did not exhibit significant deformation, and most regions of the flange and web at the beam end achieved a stress less than the yield stress; furthermore, they were in the elastic stage. Similarly to those of hole I, the four corners of hole II reached the yield stress, but the yield area was smaller, and there was no obvious deformation, which was consistent with the fact that the cellular beam did not show significant deformation during the loading stage of the experiment.

3.3.2. Stress Distribution Development of Cellular Beam Under Peak Stage

Figure 6 shows that, when the specimen was loaded to the peak load, the stresses in the four hole corner regions A, B, C, and D of cellular beam hole I and the upper and lower flanges corresponding to hole I developed further. A small part of the four-hole corners even reached the ultimate strength of web fu = 497.02 MPa, the part of the lower flange corresponding to hole I reached the ultimate strength fu = 576.68 MPa, and the yield area of the upper flange increased, but the ultimate strength was hardly reached. Simultaneously, a slight out-of-plane bulge began to appear in hole I, and wavy buckling began to appear in the flange. At the positive peak, hole I elongated along the BD direction, and the buckling deformation of the upper flange was not obvious owing to the restraint of the concrete slab. At the negative peak, hole I elongated along the AC direction, and the lower flange was squeezed and exhibited a slight wavy buckling. In addition, the stress development around hole II was not evident, and it was still mainly in the yielding stage without significant deformation. The stress in most areas of the flange and web at the beam end developed slowly, except for the upper flange where the beam end yielded, whereas the other areas were still less than the yield stress and were in the elastic stage, which was consistent with the buckling deformation phenomenon of the flange and web in the experiment.

3.3.3. Stress Distribution Development of Cellular Beam Under Ultimate Stage

Figure 7 shows that, when the specimen was loaded to the ultimate load, the four hole corners A, B, C, and D of cellular beam hole I and most areas of the lower flange corresponding to hole I reached the ultimate stress state, and the stress of corner A was the largest. The yield region of the upper flange corresponding to hole I increased, and most of the region was between the yield and the ultimate stress, mainly because the upper flange was close to the neutral axis position, which was subject to low stress. The upper flange at approximately 100 mm from the beam end reached the ultimate stress owing to the stress concentration between the perfobond rib and flange. Meanwhile, the deformation around hole I and flange further developed; the four corners of hole I exhibited obvious out-of-plane bulging, and the flange corresponding to hole I showed wavy buckling. At the positive ultimate point, hole I elongated along the BD direction to form an irregular ellipse, and the upper flange exhibited slight buckling and deformation. At the negative ultimate point, hole I elongated along the AC direction to form an irregular ellipse, and the wavy buckling of the lower flange increased significantly. In addition, the stress around hole II and the beam end was similar to the peak point, and there was no significant stress development, which was consistent with the observation during the experiment that the deformation of the cellular beam was mainly concentrated in hole I and that web tearing occurred in corner A.

3.4. Mechanical Model of a Composite Beam with Web Opening

The experiment, strain analysis, and finite element simulation results for the HHS-CCBs revealed that the HHS-CCBs were damaged by a four-hinged Vierendeel mechanism at the beam-end opening.
To determine the load-carrying capacity calculation model of the HHS-CCBs, the forces of the specimen at circular hole I were analyzed based on the Vierendeel mechanism. The bending moment and shear force applied to the central section of circular hole I were assumed to be M and V, respectively. In the weakened zone of the hole in the web, the beam section consists of two variable T-shaped sections at the top and bottom. Using the simplified method of the equivalent rectangle of a circular hole in the web [14,15,16], the isolated body within the rectangular length a0 shown in Figure 8 was determined and selected for force analysis. The low moment ends on the left side of the hole and the high moment ends on the right side. Figure 8b,c show the force states at the openings under Vierendeel mechanical conditions of the CCBs. Under positive bending, the T-section below the opening is subjected to tensile force T, shear force Vb, and secondary bending moments Mv,bl and Mv,bh caused by the shear force along the length of the opening. The section above the opening is subjected to pressure P, shear force Vt, and secondary bending moments Mv,tl and Mv,th caused by the shear force. The direction of the force is reversed under a negative bending moment. Therefore, the member may be subjected to both bending and shearing at the opening of the web. Under the combined action of bending and shear, the strength of the member is lower than that obtained under bending or shear alone.

4. Applicability of the Calculation Method in SEI/ASCE [23]

The four-hinged Vierendeel mechanism damage occurred at the beam end opening of all the HHS-CCBs; therefore, the load carrying capacity of the specimen can be calculated by borrowing the calculation method for web opening composite beams in SEI/ASCE [23]. The analytical model presented in SEI/ASCE [23] is commonly used to calculate the load-carrying capacity at the centerline of a web opening, considering the interaction of shear and bending moments. It is worth noting that this calculation model is appropriate for compact steel section beams, whereas the section type changes when HSSs are used for the flange. Additionally, the calculation method presented in the SEI/ASCE code [23] is based on the experimental data of a large number of composite beams with rectangular openings on the web. Therefore, further investigation is required to determine the applicability of the bending–shear interaction model in SEI/ASCE [23] to HHS-CCBs with circular openings in the web.
The moment–shear cubic interaction curve in SEI/ASCE [23] is shown in Figure 9 and is calculated as follows:
M M m 3 + V V m 3 1.0
where M is the design bending moment at the centerline of the circular web hole, V is the design shear force at the centerline of the circular web hole, Mm is the maximum nominal bending capacity under pure bending at the circular web hole, and Vm is the maximum nominal shear capacity under pure shear at the circular web hole.
When the location of the web opening is known, γ is defined as the bending–shear ratio of the hole: γ = M/V. Then, the bending capacity M and shear capacity V can be calculated as follows:
V = V m V m γ M m 3 + 1 1 3
M = M m M m V m γ 3 + 1 1 3
According to the above analysis, the maximum nominal bending capacity Mm under pure bending and the maximum nominal shear capacity Vm under pure shear of the composite beam at the web opening should be determined before calculating the ultimate load-carrying capacity of the member under the combined action of bending and shear. The calculation of Mm adopts the ultimate load-carrying capacity calculation method for the composite beam in SEI/ASCE [23]. Vm is calculated as follows: first, the web circle opening of the composite beam is equated to a rectangular opening, and the forces of the cross-section at the location of the rectangular opening are calculated according to the pure shear state, assuming that the shear force of the cross-section of the CCBs is mainly borne by the web.
The shear capacities Vp,c1 and Vn,c1 under positive and negative bending moments calculated using the SEI/ASCE code method [23] are shown in Table 2 and Table 3, respectively. The shear capacities Vp,t and Vn,t under the positive and negative loading of the experimental specimens in Guo et al. [30] were compared. The mean value of the ratio of the results obtained with the SEI/ASCE code method [23] to the experimental results under the positive loading was 0.739, and the standard deviation was 0.072. Under the negative loading, the mean value of the ratio was 0.589, and the standard deviation was 0.035, indicating that the SEI/ASCE code method [23] is too conservative for predicting the load-carrying capacity of HHS-CCBs with circular openings in the web.
This is because, together with the results in References [32,33,34], the results above reveal that for composite beams with rectangular holes in the web, under both positive or negative loading, the section is often damaged because of the four-hole corner tear produced by the stress concentration, resulting in a small contribution to the shear capacity of the flanges and concrete slabs that are not fully exerted. Therefore, the maximum shear capacity of the composite beams at the web opening in SEI/ASCE [23] is obtained based on the analysis of the four-hinged mechanism of the rectangular holes, where the moments at the corners of each of the four holes are equal to the plastic bending capacity of each of the four cross-sections when the rectangular-hole cross-section reach the shear capacity. However, many studies [32,33,34] have shown that CCBs with circular holes in the web have smooth transitions around the holes and are less prone to stress concentration. During shearing, no premature tearing damage occurs at the hole corners. Typically, the entire section fully develops into a yield state or is destroyed. In addition to the web, both the flange and concrete slab would participate in the shear, with both flanges contributing more than 70% to the shear capacity. Therefore, to calculate the maximum shear capacity of CCBs with circular holes in the web, it is recommended in SEI/ASCE [23] that the circular holes be directly and simply equated to rectangular holes, and the calculation method based on the four-hinge mechanism of damage to rectangular holes is too conservative.
In summary, it is necessary to redefine the method for calculating the maximum shear capacity of HHS-CCBs with circular holes in their webs.

5. Design Model of HHS-CCBs with Circular Holes

Considering that the Vierendeel mechanism damage occurred in the specimens HHS-CCBs and that the circular holes at the beam end were under the combined action of bending moment and shear force, the bending–shear cubic action curve in Equation (3) was continued to be followed to determine the load-carrying capacity of HHS-CCBs with circular holes. First, the maximum bending capacity Mm and maximum shear capacity Vm at the circular holes should be determined separately, and then the final capacity calculation results of HHS-CCBs with circular holes were obtained by substituting into Equation (3).

5.1. Maximum Bending Capacity at the Web Opening

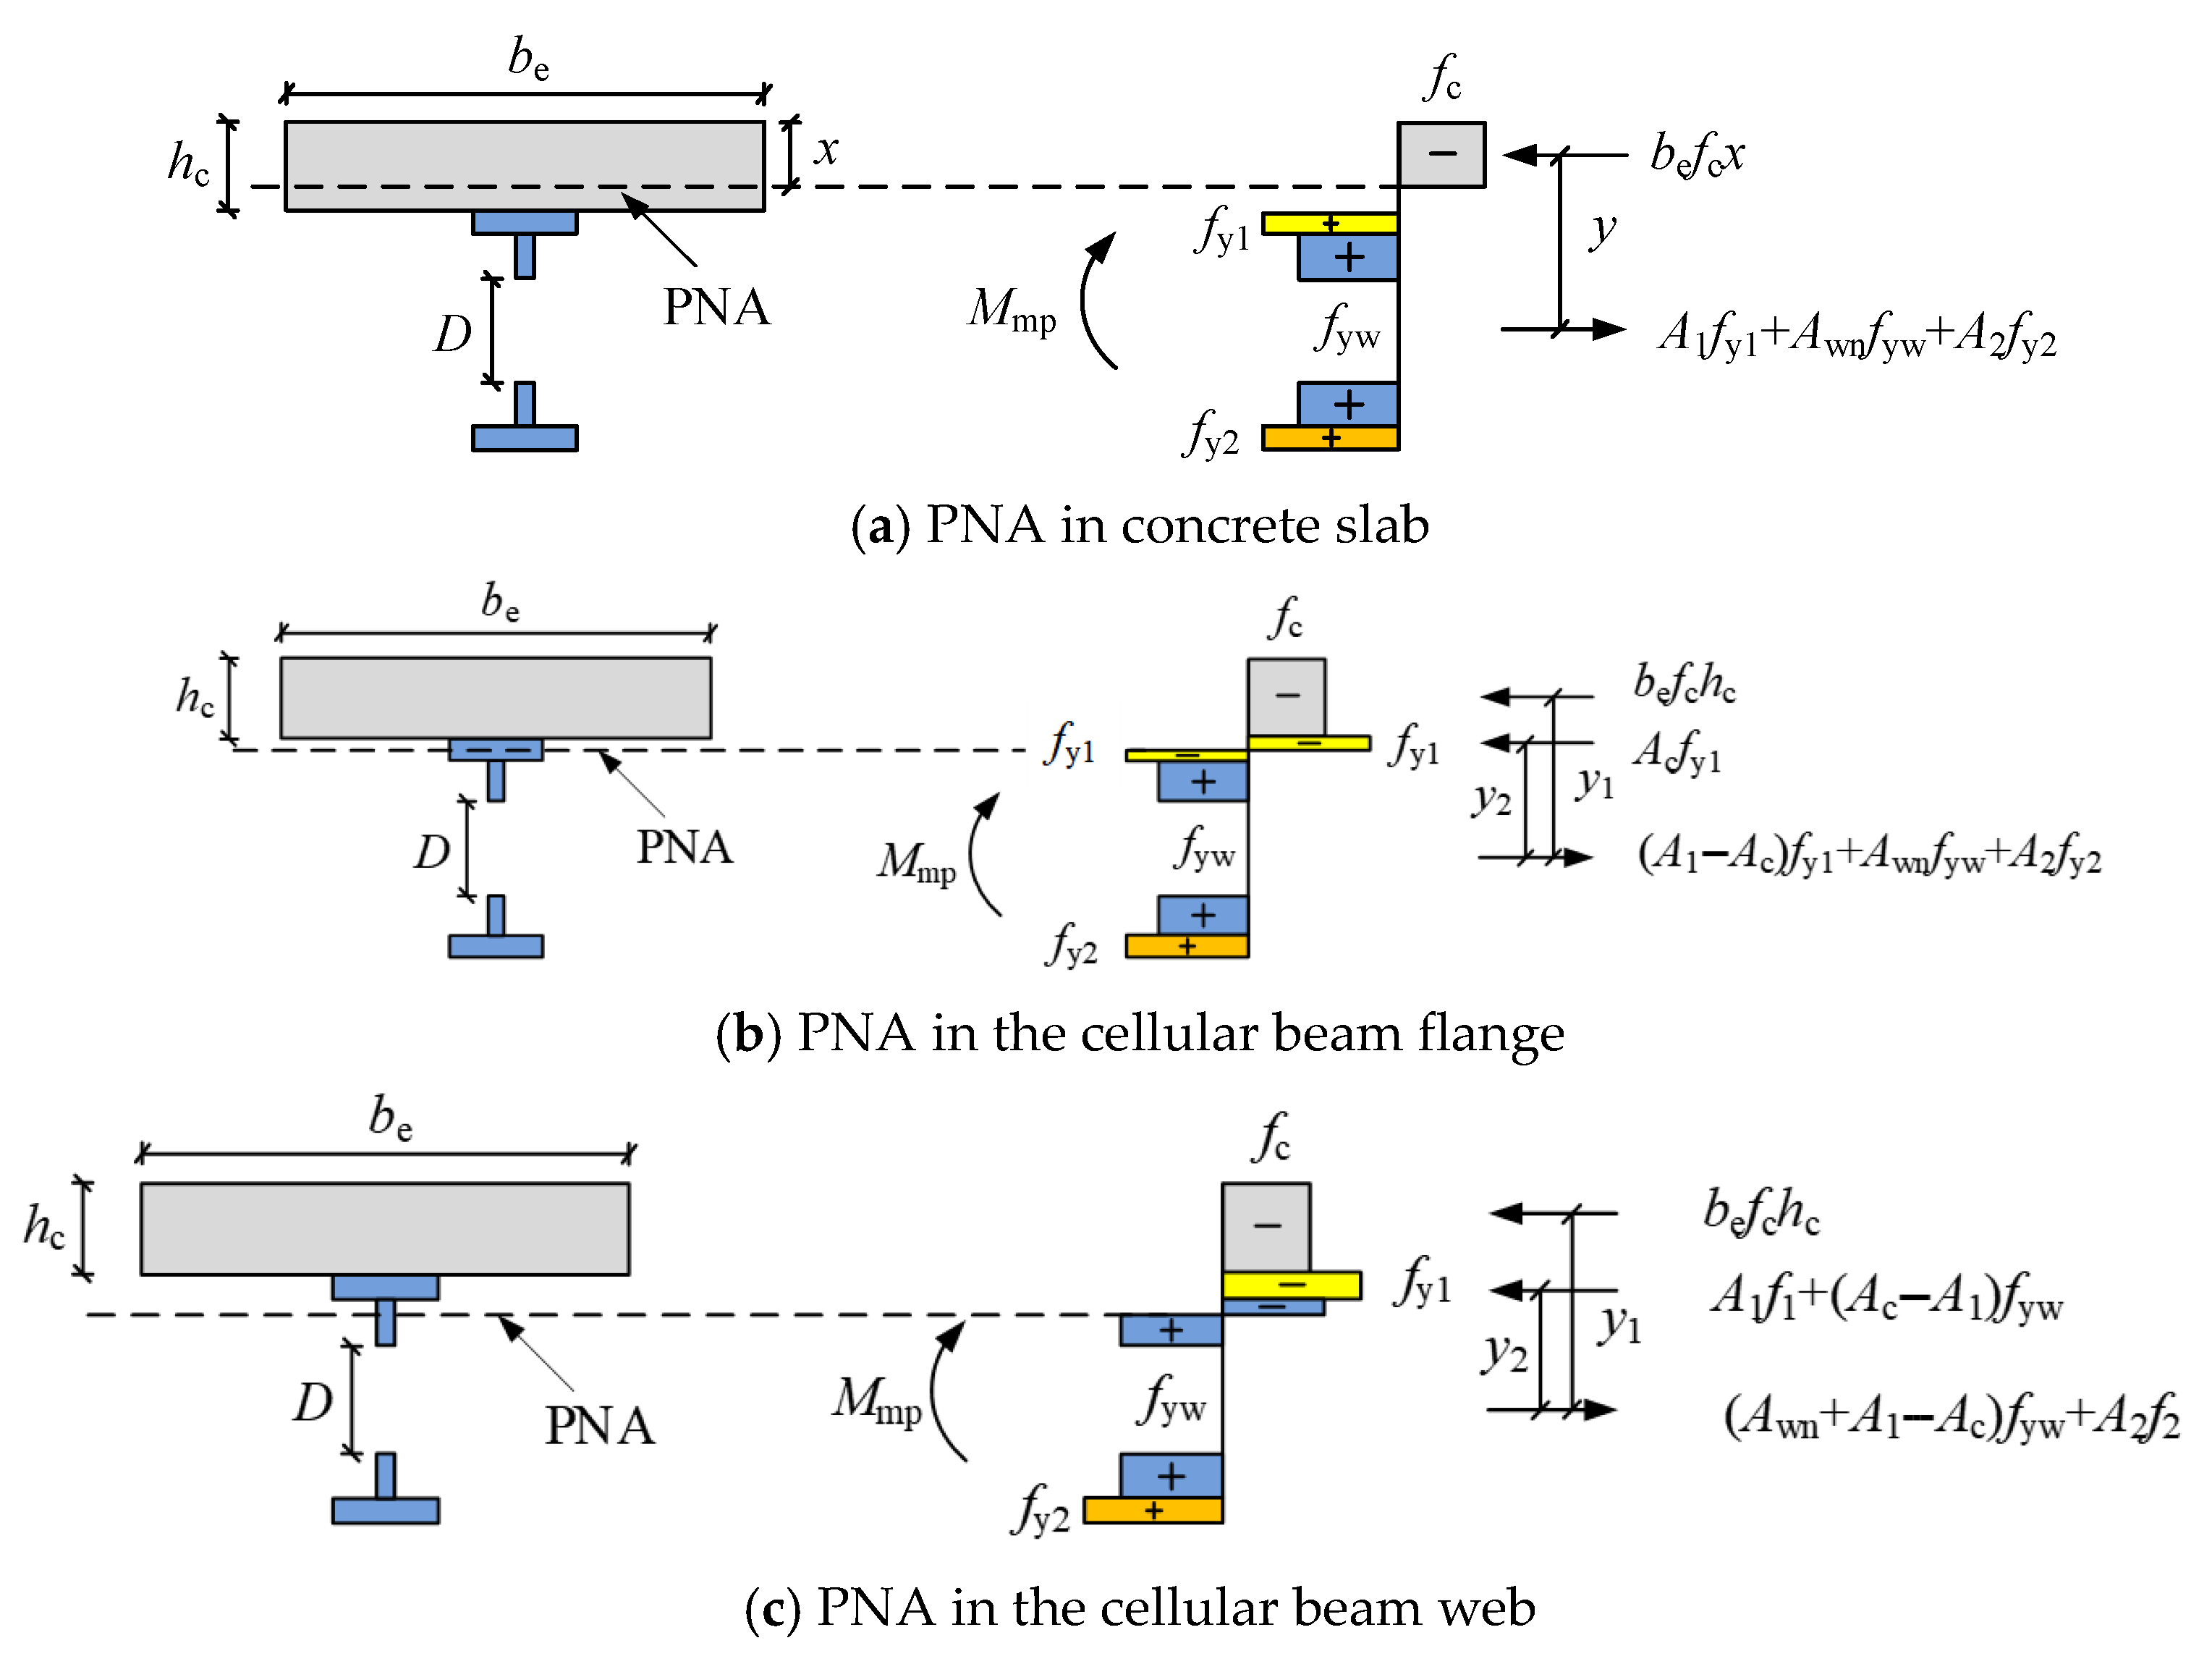
The calculation method of the maximum nominal bending capacity at web openings for HHS-CCBs is similar to that of general composite beams. Both are based on the mature plastic limit theory [35] and only need to consider the effect of web openings and higher-grade flange strength on the bending capacity. Similar calculation methods are available for EC4 [4], GB50017-2017 [28], and AISC [29]. Based on this, the positive and negative bending capacities of the HHS-CCBs under pure bending should be calculated separately, and the actual calculation should be analyzed according to the different positions of the plastic neutral axis (PNA). Figure 10 and Figure 11 show the distribution of neutral axis positions in different plasticity of HHS-CCBs under positive and negative loading, respectively.

5.1.1. Maximum Bending Capacity at Web Opening Under Positive Loading

As shown in the stress distribution of the section at the web opening of the HHS-CCBs under positive loading in Figure 10, there are three cases of PNA position.
(a)
PNA in the concrete slab
When the PNA of the HHS-CCBs is in the concrete slab (Figure 10a), the height x of the compression zone of the concrete slab can be calculated as follows:
x = A 1 f y 1 + A wn f yw + A 2 f y 2 / b e f c
where A1, Awn, and A2 are the areas of the upper flange, web opening, and lower flange of the cellular beam, respectively; fy1, fyw, and fy2 are the areas of the upper flange, web opening, and lower flange of the cellular beam, respectively; be is the effective width of the concrete slab; fc is the axial compressive strength of concrete.
The maximum bending capacity Mmp of the HHS-CCBs under positive loading is:
M mp = A 1 f y 1 + A wn f yw + A 2 f y 2 × y
where y is the distance between the resultant stress point of the cellular beam and the resultant stress of concrete compression zone section.
(b)
PNA in the cellular beam flange
When the PNA is in the flange of the HHS-CCBs (Figure 10b), the maximum bending capacity Mmp is:
M mp = b e f c h c × y 1 + A c f y 1 × y 2
where hc is the height of the concrete slab; Ac is the area of the compression zone section of the cellular beam under positive loading, y1 is the distance between the stress resultant point of the tension zone of the cellular beam and the stress resultant point of the compression zone section of the concrete slab, and y2 is the distance between the stress resultant point of the tension zone of the cellular beam and the stress resultant point of the compression zone section of the cellular beam.
(c)
PNA in the cellular beam web
When the PNA of the HHS-CCBs is in the web opening (Figure 10c), the maximum bending capacity Mmp is:
M mp = b e f c h c × y 1 + A 1 f y 1 + A c A 1 f yw × y 2

5.1.2. Maximum Bending Capacity at Web Opening Under Negative Loading

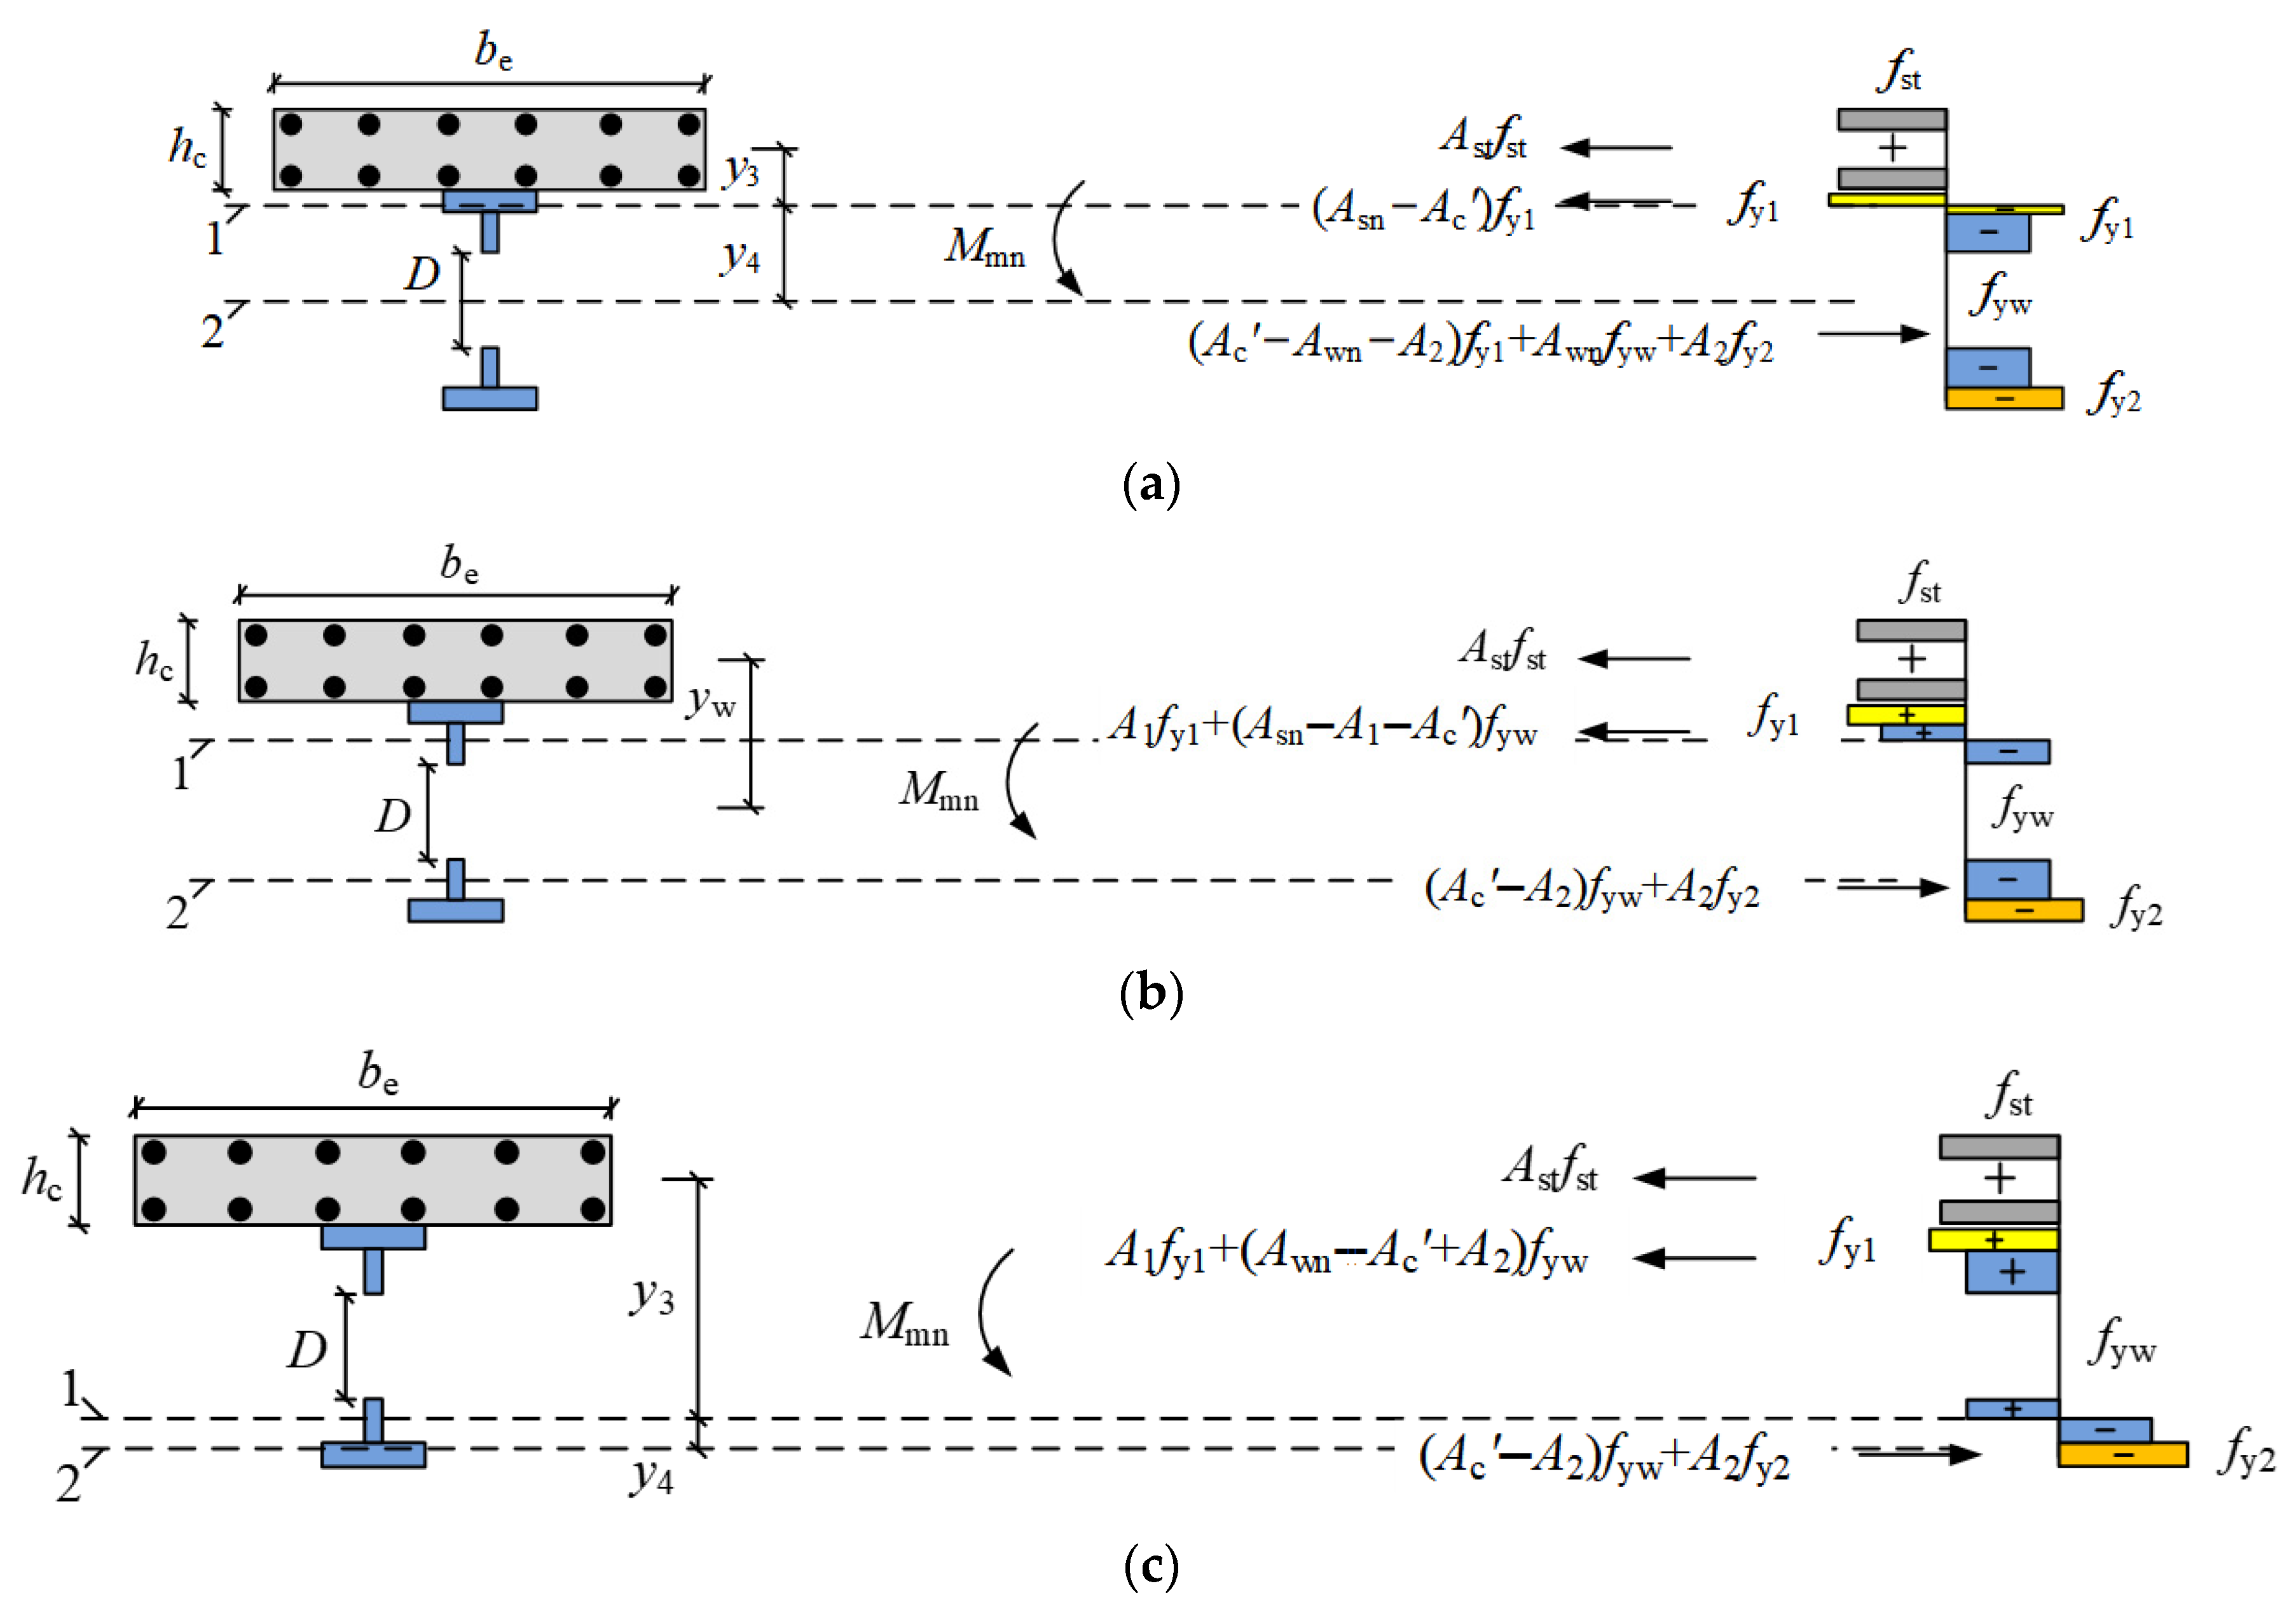
According to the simplified plastic theory analysis method for composite beams under negative loading in GB50017-2017 [28], the stress distribution at the web opening of HHS-CCBs under negative loading is shown in Figure 11, where the 1-axis is the PNA of the HHS-CCBs, and the 2-axis is the PNA of the cellular beams. For homogeneous OS-CCBs or symmetrical HHS-CCBs, the 1-axis under negative loading is generally located at the upper flange of the cellular beam, and the 2-axis is located at the center of the web opening of the cellular beam. As the lower flange of the asymmetric HHS-CCBs is strengthened, the positions of the 1-axis and 2-axis move downward accordingly, and there may be a situation where the 2-axis appears in the lower T-shape of the cellular beam. Three typical stress distribution of HHS-CCBs at the openings under negative loading is analyzed, as shown in Figure 11.
(a)
1-axis is located on the upper flange of the cellular beam, and the 2-axis is located at the opening center of the cellular beam
When the 1-axis is located at the upper flange of the cellular beam and the 2-axis is located at the opening center of the cellular beam, the maximum bending bearing capacity Mmn is:
M mn = M s + A st f st × y 3 + y 4 D / 2 2
where Ms is the plastic bending moment of HHS-CCBs under negative loading; Ast is the section area of longitudinal reinforcements within the effective width range of the concrete slab in the negative bending moment zone; fst is the design value of the tensile strength of longitudinal reinforcements; y3 is the distance from the point of application of the longitudinal reinforcements stress resultant force to the 1-axis. Firstly, based on the force balance of the HHS-CCB section, the compressive area Ac’ of the cellular beam under negative loading is calculated, and the position at the junction of the tensile and compressive areas is taken as the plastic neutral axis position of the HHS-CCB; y4 is the distance between the 1-axis and the 2-axis. When the 1-axis is within the upper flange of the cellular beam, y4 can be taken as the distance from the 2-axis to the upper edge of the beam web.
(b)
1-axis is located on the upper T-shape of the cellular beam, and the 2-axis is located at the lower T-shape of the cellular beam
When the 1-axis is located on the upper T-shape of the cellular beam, and the 2-axis is located on the lower T-shape of the cellular beam, the maximum bending capacity Mmn is:
M mn = M s + A st f st × y w
where yw is the distance from the point of action of the longitudinal reinforcement stress resultant force to the point of action of the web resultant force between the 1-axis and the 2-axis.
(c)
1-axis is located on the lower T-shape of the cellular beams, and the 2-axis is located at the lower flange of the cellular beam
When the 1-axis is located at the lower T-shape of the cellular beams, and the 2-axis is located at the lower flange of the cellular beam, the maximum bending capacity Mmn is:
M mn = M s + A st f st × y 3 + y 4 2

5.2. Maximum Shear Capacity at the Web Opening

In SEI/ASCE, the maximum shear capacity calculation method for composite beams with web openings under either positive or negative loading assumes that the section shear force is carried only by the web [26]. However, the floor slab in composite beams significantly affects both the bending and shear resistance of the structural members [36]. Subsequently, some researchers modified the calculation by considering the shear contribution of the concrete slab and the steel beam [17,24,28]. However, based on the flange strain analysis of the specimens [30] and according to the results of the studies by Chung et al. [37], it was found that, when the opening weakened the beam web, the shear force weight borne by the beam flange increased and could not be neglected. Ding et al. [38] found that the flange was involved in shear resistance even in composite beams without web openings by analyzing the shear resistance. Nie et al. [39,40] found that the shear strength of composite beams without web openings was generally determined based on the superposition principle. The calculated shear capacities of the composite beams under positive and negative bending moments differed. Similarly, the maximum shear capacities of the CCBs under positive and negative loading were discussed separately using the superposition principle, while the shear contribution of the flange of the cellular beam was considered.

5.2.1. Maximum Shear Capacity at Web Opening Under Positive Loading

The pure shear capacity equation obtained by Ding [38] based on the analysis of the shear performance of the entire composite beam under positive loading was modified, and a maximum shear capacity calculation method for CCBs under positive loading was proposed.
Considering the average shear strength of a concrete slab under pure shear [37] τ c = 0.67 f c 0 . 48 , the maximum shear capacity Vcp of the slab under positive loading can be obtained as follows:
V cp = τ c b e h c
The equation for calculating the maximum shear capacity Vsp of a cellular beam under positive loading, considering both the flange and web contributions of different strengths [35], is modified as follows:
V sp = A wn f yw + 0.3 A 1 f y 1 + 0.3 A 2 f y 2 3
The maximum shear capacities of the cellular beam and concrete slab are superimposed, and the improvement factor of the combined action on the shear capacity of the CCB is introduced [38]. The maximum shear capacity Vmp of the CCB under positive loading is obtained as follows:
V mp = 1.1 V cp + V sp

5.2.2. Maximum Shear Capacity at the Web Opening Under Negative Loading

Unlike composite beams under positive loading, which exhibit the compressive properties of concrete and the tensile properties of steel beams, when loaded in the negative direction, composite beams are in an unfavorable state that leads to concrete slab cracking under tension and steel beam yielding or buckling under compression, causing a reduction in the shear capacity of the concrete and steel beam. In this case, the shear capacity of the composite beam is derived only from the superposition of the shear contributions of the steel beam web and concrete slab, and the contribution of the combined action could be neglected [39,40]. The CCBs have similar characteristics under negative loading; therefore, the superposition principle was used to calculate the maximum shear capacity of the CCBs under negative loading without considering the contribution of the combined action between the steel, and the area of the concrete slab and flange involved in the shear was corrected.
The smaller effective shear area of the concrete slab A vc = 3 h c × h c in the SEI/ASCE [23] was selected under negative loading, and the maximum shear capacity of the slab under negative loading Vcn was calculated as follows:
V cn = τ c A vc
According to Chung et al. [37], regarding the shear resistance of cellular beams, the equivalent areas Av1 and Av2 of the upper and lower flanges involved in the shear resistance at the opening were obtained and calculated as follows:
A v 1 = t f 1 × 0.75 t f 1 + t w
A v 2 = t f 2 × 0.75 t f 2 + t w
where tf1, tf2, and tw denote the thicknesses of the upper flange, lower flange, and web of the cellular beam, respectively.
The equation for calculating the maximum shear capacity Vsn of the cellular beam under negative loading, considering both the flange and web contributions, can be expressed as
V sn = A wn f yw + A v 1 f y 1 + A v 2 f y 2 3
The maximum shear capacities of the cellular beam and concrete slab are superimposed to obtain the formula for calculating the maximum shear capacity Vmn of the CCBs under negative loading:
V mn = V cn + V sn

5.3. Comparison of the Experimental and Theoretical Load Carrying Capacities at the Web Opening

After calculating the maximum bending bearing capacity Mm and the modified maximum shear bearing capacity Vm of the CCBs at the web opening, the bending shear cubic action curve in SEI/ASCE 23-97 [23] can be used to calculate the positive bending and shear bearing capacities Mp and Vp of the HHS-CCBs at the web opening under bending shear composite action using Equations (4) and (5) in Section 4:
M p = M mp M mp V mp γ 3 + 1 1 3
V p = V mp V mp γ M mp 3 + 1 1 3
The calculation equations for the negative bending and shear bearing capacities Mn and Vn are:
M n = M mn M mn V mn γ 3 + 1 1 3
V n = V mn V mn γ M mn 3 + 1 1 3
The results obtained from the theoretical calculations presented in this study are listed in Table 2 and Table 3. Mp,c2 and Vp,c2 are the theoretical calculations of the load-carrying capacities of the CCBs under positive loading, and Mn,c2 and Vn,c2 are the theoretical calculations under the corresponding negative loading. The mean value of the ratio of the theoretically calculated strength to the experimental strength under a positive bending moment was 0.975, with a standard deviation of 0.075. The mean value of the ratio of the theoretically calculated strength to the experimental strength under a negative bending moment was 0.988, with a standard deviation of 0.063. The computational model proposed in this study provided a reasonable prediction of the strength of HHS-CCBs with circular holes.
These results, together with the material strength results in Table 1, reveal that the load carrying capacity calculation model has safer and more conservative predictions for specimens CCB-1, HCCB-1, and HCCB-3 with flange yield strengths of 345.65 MPa and 475.45 MPa. The load-carrying capacities of HCCB-2 and HCCB-4 were slightly overestimated because the flange yield strengths of these two specimens were as high as 668.33 MPa, which made it difficult for the plasticity of the section to develop fully.
As the past research on composite beams with web openings has mainly focused on rectangular holes, the collected experimental data are very limited, and it is necessary to further validate the proposed method in conjunction with finite element parametric analysis.

6. Comparison of FEA and Theoretical Results

To further investigate the influence of each parameter on the load-carrying capacity of the HHS-CCBs and validate the load-carrying capacity calculation method proposed in this study, the finite element model of the HHS-CCBs validated in Guo et al. [30] was used as the basis, and the hole diameter D, hole edge distance L, and strength matching of the flange and web were selected as the primary parameters.

6.1. Weakening Parameter

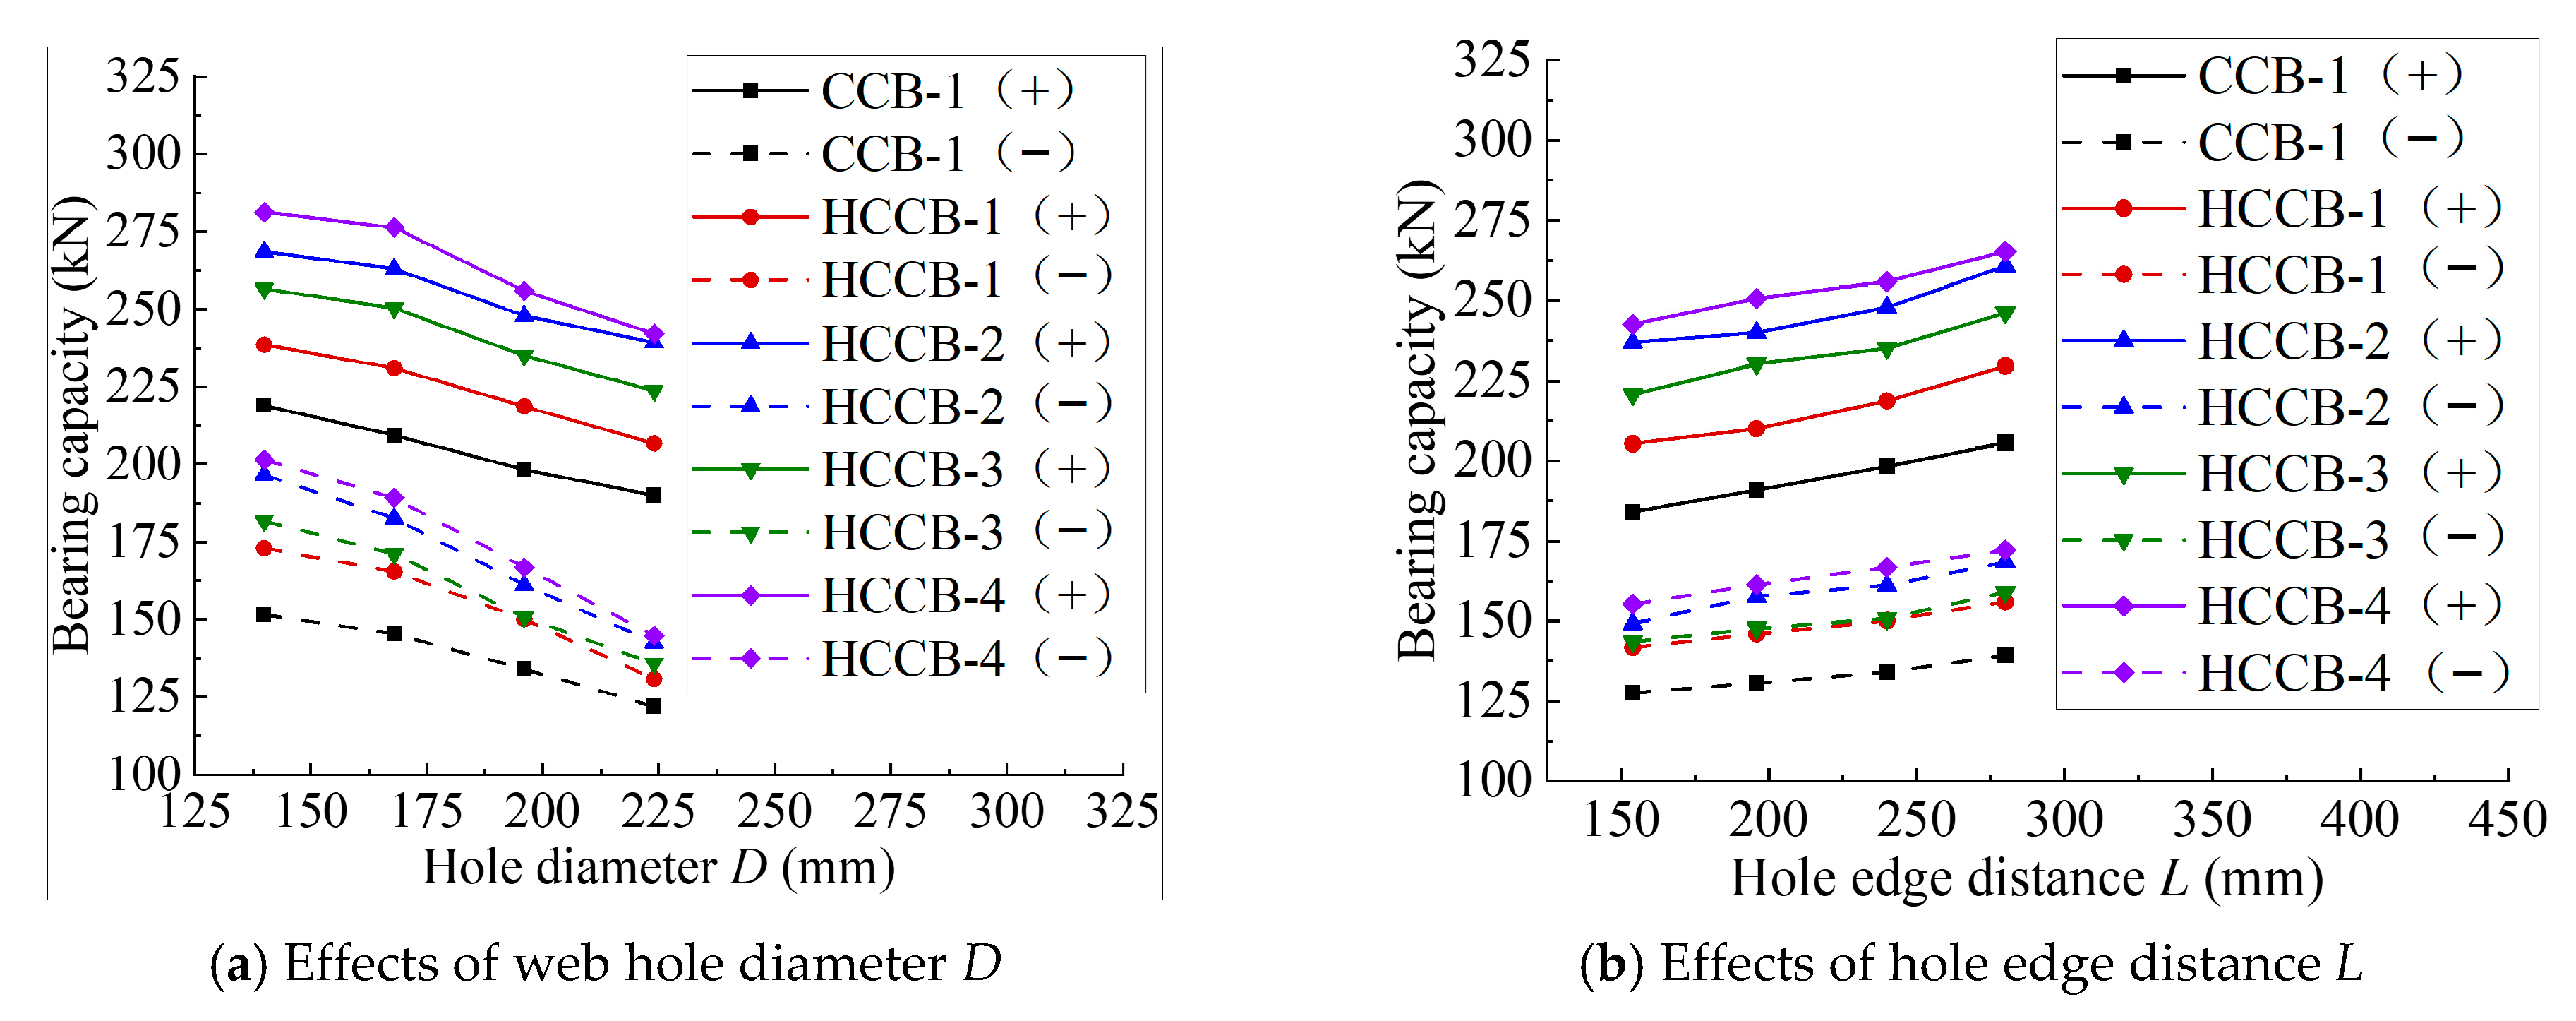
To ensure that the Vierendeel mechanism damage occurred at the opening of the HHS-CCBs, the weakening parameters were taken as D = 140, 168, 196, and 224 mm, and L = 154, 196, 240, and 280 mm, as listed in Table 4. The remaining modeling details were consistent with the experimental specimens in Guo et al. [30]. Eventually, taking D = 196 and L = 280 as an example, the Vierendeel mechanism damage of the opening occurred at all specimens under different weakening parameters, as shown in Figure 12.
The effects of the weakening parameters on the load-carrying capacity of all the specimens, including an ordinary steel composite cellular beam (OS-CCB) specimen and four HHS-CCB specimens, are shown in Figure 13. Together with the data in Table 4, they reveal that hole diameter D had a greater effect on the load-carrying capacity of the HHS-CCB specimens, whereas hole edge distance L had a lesser effect.
When L was certain, the load-carrying capacities of all the specimens decreased as D increased. Owing to the presence of concrete slabs in both the OS-CCB and HHS-CCB specimens, the rate of decrease in the load-carrying capacity under the positive loading was less than that in the negative direction, and the load-carrying capacity was more stable. In addition, when D was changed from 140 to 224 mm, the decreasing trend of the load-carrying capacity of all specimens under positive loading was very similar at 11–14%. However, under the negative loading, the load-carrying capacity of the OS-CCB specimen CCB-1 decreased by approximately 20%; in contrast, the reduction in the load-carrying capacity of the HHS-CCB specimens increased with an increase in flange strength, especially the load-carrying capacity of specimen HCCB-4, which decreased by almost 30%. This is because under the negative loading, the yield strength of the Q550 steel used in the flange of specimen HCCB-4 was as high as 668.33 MPa; therefore, the plastic deformation capacity of the steel could not be fully utilized, which led to a large decrease in the load-carrying capacity.
When D is certain, with an increase in L, the load-carrying capacities of both the OS-CCB and HHS-CCB specimens show an increasing trend, and the trends of all specimens under positive and negative loading are close to each other. When L increased from 154 to 280 mm, the load-carrying capacity of the specimens increased by approximately 10%. It was shown that the load-carrying capacity of CCBs could be improved by appropriately shifting the position of the beam-end openings in practical engineering.
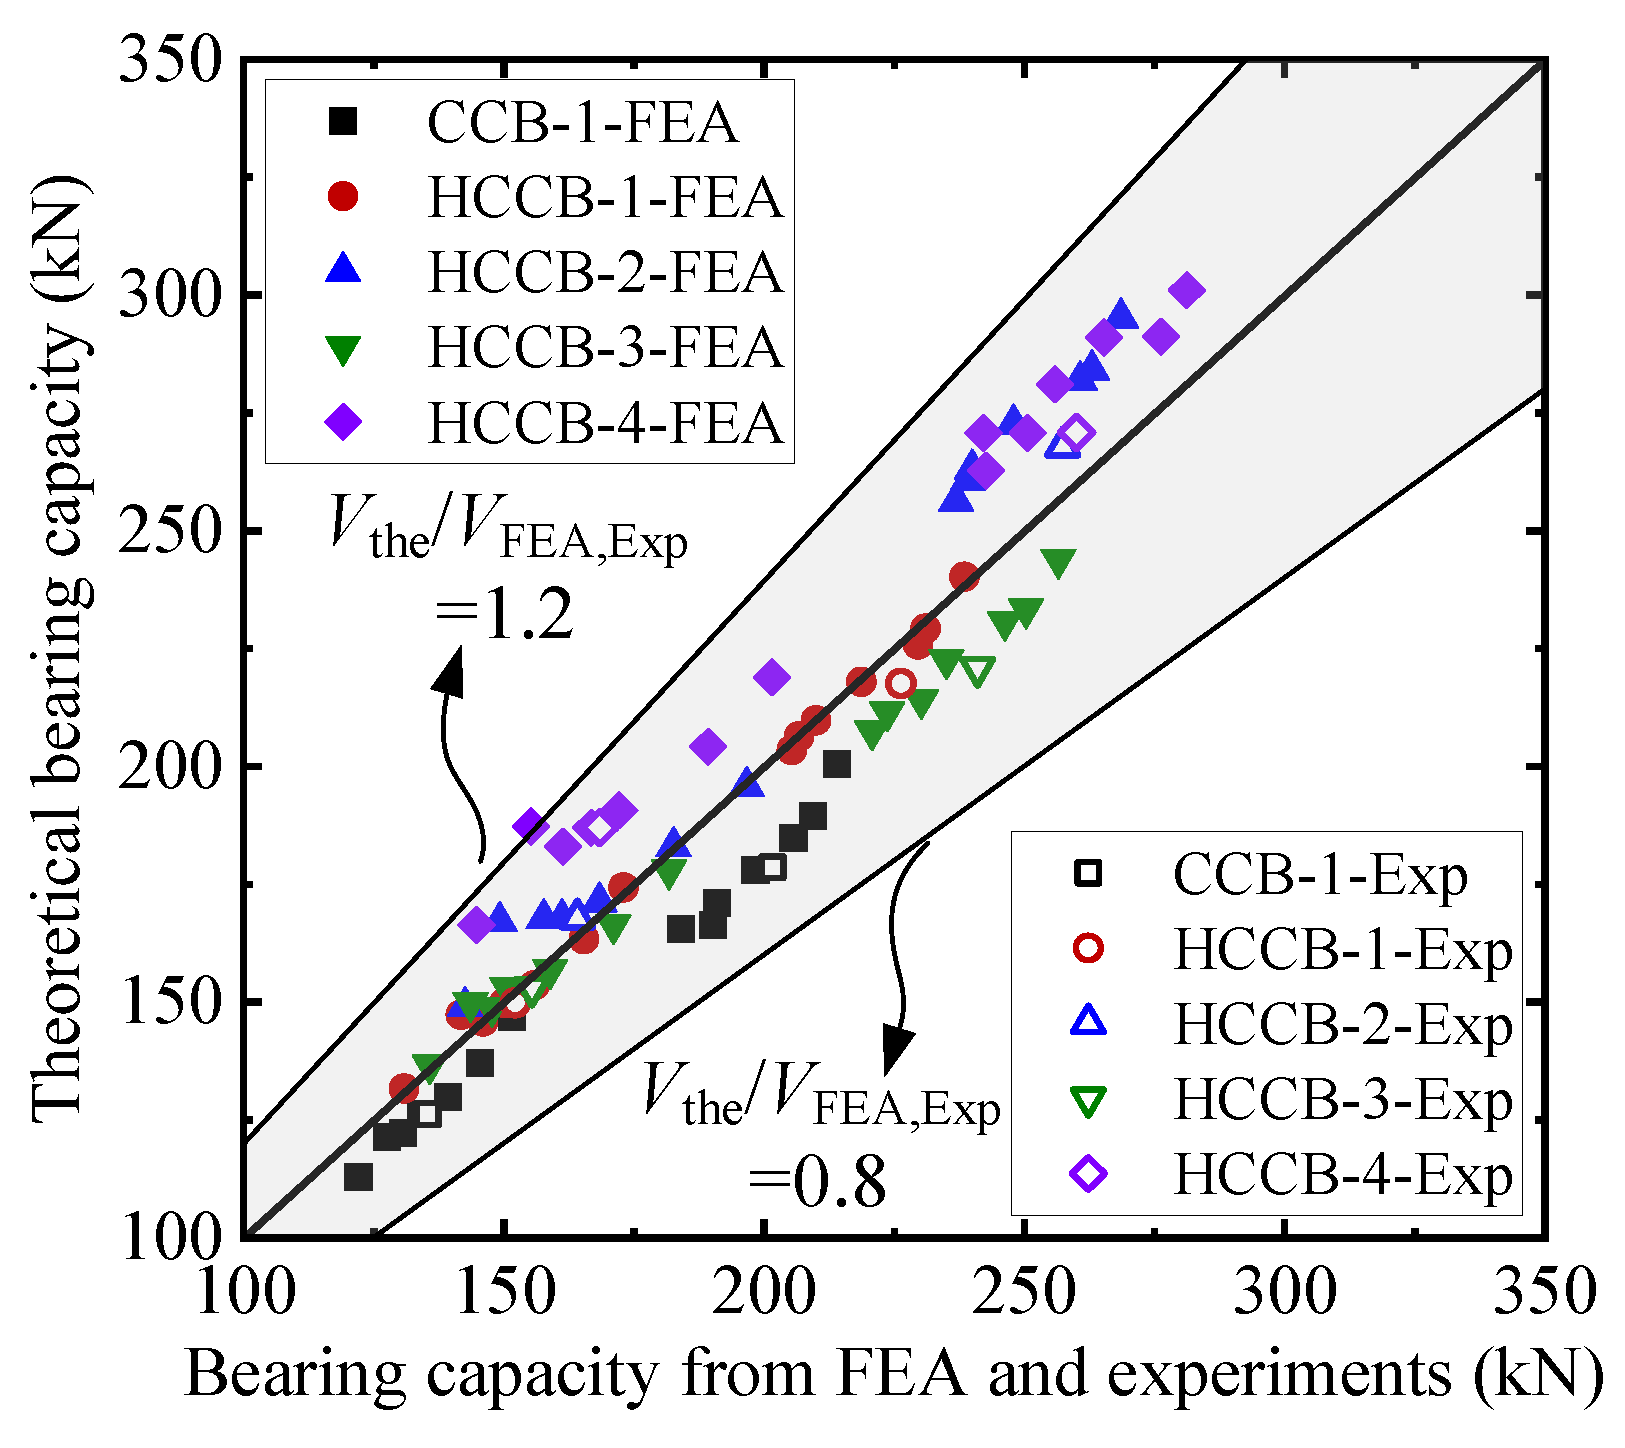
Table 4 lists the load carrying capacities of HHS-CCBs with different weakening parameters and the theoretical calculation results. The average value of the ratio between the theoretical and the FEA results under positive loading is 0.996, and the standard deviation is 0.075. The average value of the ratio between the theoretical and the FEA results under negative loading is 1.020, and the standard deviation is 0.066. Combined with Figure 14, in the range of weakening parameters D = 0.6hs − 0.8hs and L = 0.55hs − 1.0hs, the Vierendeel mechanism damage occurred at the opening of the beam end, and the calculation method proposed in this study can predict the load carrying capacity at the opening of the HHS-CCB accurately. When D = 0.8hs and L = 0.55hs, the load carrying capacity of HCCB-1 is even lower than that of CCB-1. Therefore, the suggested ranges for the hole diameter and hole edge distance of HHS-CCBs are revised to D = 0.6hs − 0.7hs and L = 0.7hs − 1.0hs, respectively. For symmetric HHS-CCBs with a flange strength of up to 690 MPa, the upper limit of the hole edge distance can be extended to 1.3hs.
In addition, the calculation model slightly overestimated the load-carrying capacities of HCCB-2 and HCCB-4, and the ratio between the theoretical calculations and the FEA results was between 1 and 1.2. This is because the yield strength of the flanges of these two specimens was as high as 668.33 MPa, which is much greater than that of the web, and the cross-section plasticity could not fully develop in the experiments.

6.2. Strength Matching of the Flange and Web

The experimental results indicate that the load-carrying capacity calculation method proposed in this study is applicable to HHS-CCBs with noncompact sections. However, flange strength should not be excessively high. The yield strength ratios of the flange to the web were excessively large when the flange strength was 668.33 MPa. In these cases, the web was the first to yield, and the flange failed to become fully plastic, leading to an overestimation of the load-carrying capacity of the specimens. Therefore, attention should be paid to the strength matching between the flange and web in practical engineering applications.
Two types of HHS-CCB specimens were selected: asymmetric and symmetric. Q355 strength-grade webs were matched with flanges of different strengths (Q420, Q460, Q500, Q550, Q620, and Q690). The specific steel-strength design parameters and section types are listed in Table 5. The strength matching between the flange and web of the ACCB and SCCB models is presented in Table 6. To investigate the effect of strength matching between flanges and webs on HHS-CCBs, modeling details consistent with those for the experimental specimens in Guo et al. [30] were used. The yield strength and elastic modulus of steels with different strength grades were determined according to the specifications in References [28,41]. The HOS-CCB model was CCB-355, the HHS-CCB asymmetric model was ACCB-460-690, and the HHS-CCB symmetric model was SCCB-460-690. Eventually, the Vierendeel mechanism damage of the opening occurred at all models under different strength matching of the flange and web, similar to that shown in Figure 12.
Figure 15 further shows the effect of the flange strength on the load-carrying capacity of the HHS-CCBs. Based on the data in Table 6, as the flange strength gradually increased from 355 to 690 MPa, the load-carrying capacities of the asymmetric and symmetric specimens increased nonlinearly, and the rate of increase gradually decreased.
When the lower flange strength increased from 355 to 550 MPa, the load-carrying capacities of the ACCB series specimens increased by 21.94% and 16.12%. When the lower-flange strength increased from 550 to 690 MPa, the load-carrying capacities of the ACCB series specimens increased by only 5.79% and 3.10%, respectively. For the SCCB series specimens, similar to the ACCB series, when the flange strength increased from 355 to 550 MPa, the load-carrying capacities increase by 28.45% and 20.61%, respectively. When the flange strength increased from 550 to 690 MPa, the load-carrying capacities increased by 3.28% and 2.95%, respectively. This is because the flange strength is too high to exert full-section plasticity, which makes a small contribution to the load-carrying capacity of the HHS-CCBs.
Under positive loading, as the strength of the flange increases, the increase in the load-carrying capacity of the SCCB series specimens becomes smaller than that of the ACCB series specimens, and the load-carrying capacities of the two gradually approach each other. When the flange strengths were 620 and 690 MPa, the load-carrying capacities of the SCCB series specimens were only 3.86% and 2.84% higher than those of the ACCB series specimens, respectively. This is because when the lower flange strengths of the two types of specimens were the same, the upper flange strength of the SCCB series specimens was higher than that of the ACCB series specimens, PNA was closer to the upper flange, and the stress on the upper flange was smaller. A higher upper flange strength showed little improvement in the load-carrying capacity of the HHS-CCBs, resulting in a small difference in the load-carrying capacity between the two types of specimens. Under negative loading, the difference in the load-carrying capacity between the two types of specimens was between 3.71% and 4.18%, which was much smaller than the difference in the load-carrying capacity under positive loading. This is primarily because the concrete slab cracks prematurely and exits under the negative loading.
By comparing the ACCB and SCCB series models, the following conclusions can be drawn. To avoid the difficulty of developing section plasticity owing to the high strength of the flange and to ensure a reasonable combination of steel with different strength grades to fully utilize its own performance and improve material utilization, it is recommended that the flange strength of HHS-CCBs should not exceed 550 MPa when the web strength is 355 MPa. Owing to the small difference in the load-carrying capacity between the two types of specimens, the HHS-CCB asymmetric specimen has good mechanical properties and economic benefits, which is more in line with the hybrid design concept.
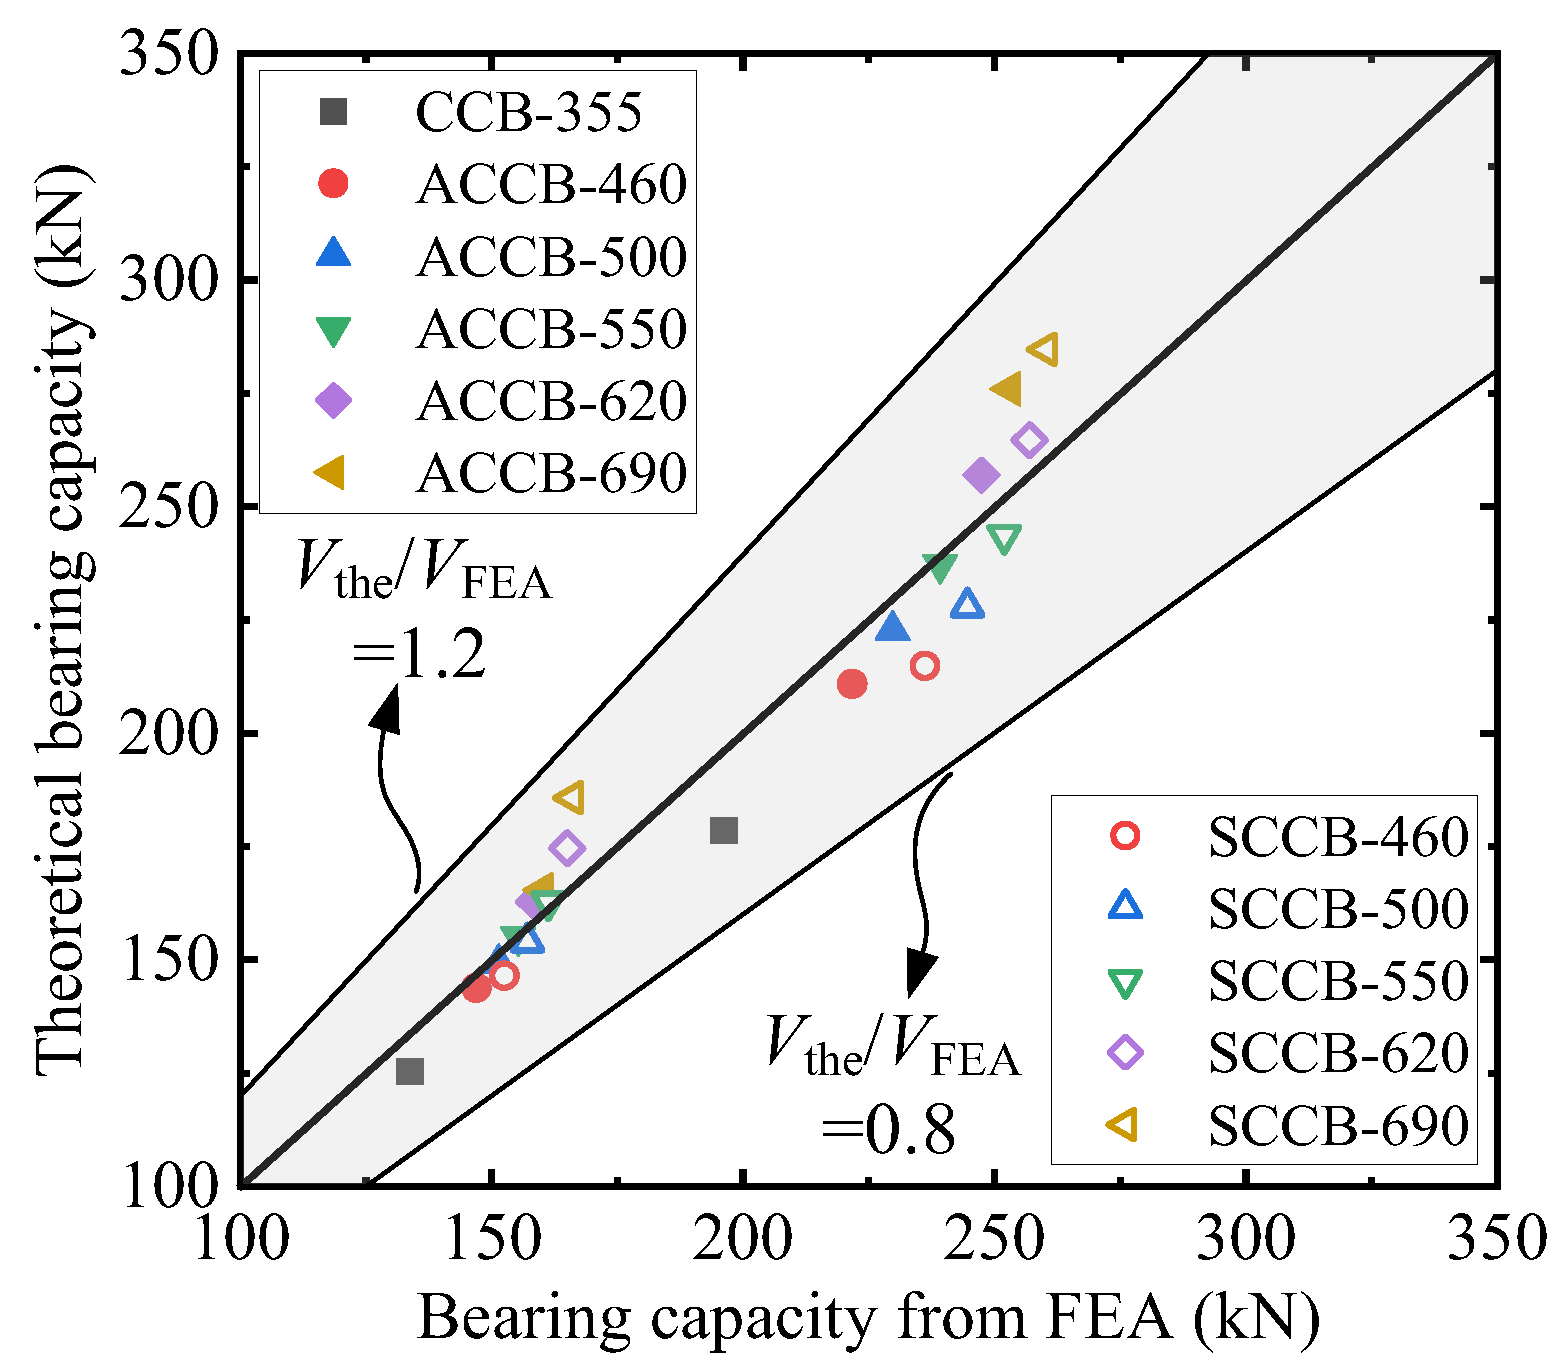
A comparison of the FEA and theoretical calculation results under different strength matching is shown in Table 6 and Figure 16, where the average value of the ratio between the theoretical calculation and FEA results under positive loading was 0.981, and the standard deviation was 0.062. The mean value of the comparison under the negative loading condition was 1.004, with a standard deviation of 0.047. Notably, the calculation model proposed in this study provides a reasonable prediction of the strength at the web opening of HHS-CCBs with different flanges and web strength matching. However, in both symmetric and asymmetric specimens, when the flange strength exceeded 550 MPa, the proposed calculation method slightly overestimated the load-carrying capacity of the HHS-CCBs. Moreover, the maximum ratio of the theoretical calculations to the FEA results for the load-carrying capacity of SCCB-690 was 1.119. Consistent with the experimental results, when the flange strength was too high, the difference between the flange and web strengths was too large, and the web first yielded and then generated a large deformation. While the HSSs led to a significant reduction in the λl of the flange, the section type changed, and it was difficult for the flanges to exert section plasticity, resulting in material waste. Therefore, the calculation model proposed in this study can be applied to HHS-CCBs with different flange section types; however, to ensure design safety and reasonable strength matching to reap the advantages of hybrid design members, it is recommended that the flange yield strength should not exceed 550 MPa when the web strength of the CCB is 355 MPa in actual engineering.

7. Design Suggestions

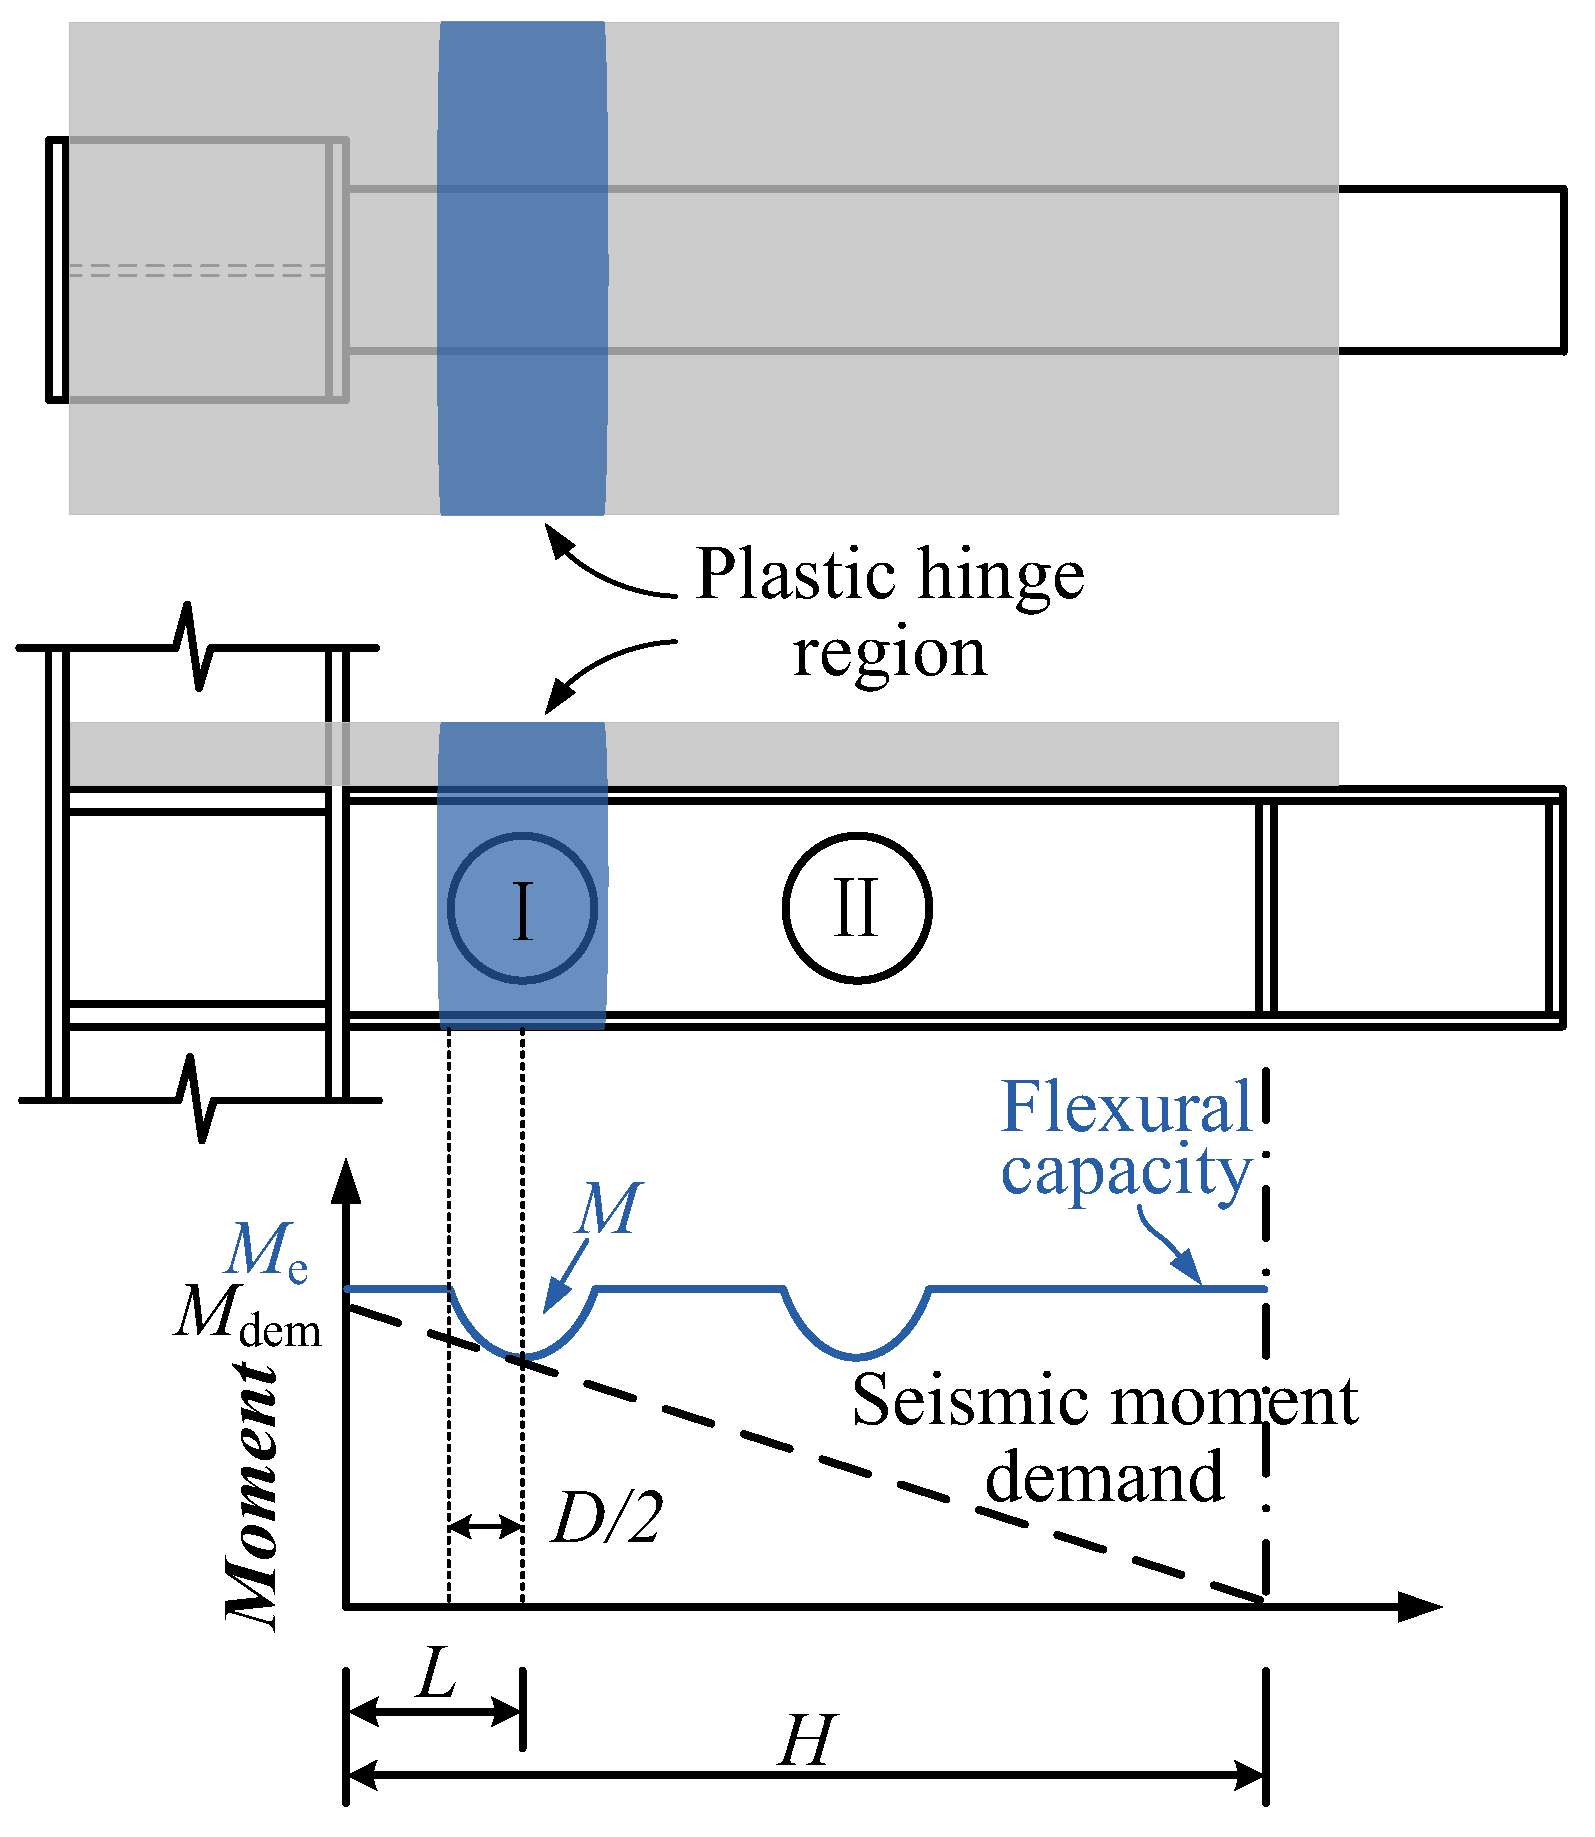
Under earthquake action, HHS-CCBs should exhibit a ductile failure mechanism, where a plastic hinge occurs at the web opening before it occurs at the beam end, to avoid brittle fracture of the beam-end weld. The specific design limits the design values of the beam-end bending moment Me, hole diameter D, and hole edge distance L. As shown in Figure 17, Me should satisfy the following formula:
M e M dem
where Mdem is the bending capacity of the beam end when the Vierendeel mechanism occurs at the beam-end opening and can be calculated according to the following formula:
M dem = H H L M
where M is the design value of bending capacity at the beam-end opening.
Simultaneously, using JGJ138-2016 [42], the bending capacity of the beam end was checked, and the design value of the beam-end bending moment Me was determined as follows:
M e M pc
where Mpc is the bending bearing capacity of the composite beam end calculated based on the full-section plasticity theory [42].
In summary, hole diameter D and hole edge distance L have a significant impact on the failure mode of HHS-CCBs. Only by reasonably setting hole diameter D and hole edge distance L can the Vierendeel mechanism occur at hole I of the beam end of HHS-CCBs, thereby achieving the design goal of improving the load-carrying capacity of the CCBs while ensuring their seismic performance. Based on the aforementioned experimental and finite element study results of HHS-CCBs, the recommended ranges for the hole diameter and hole edge distance are proposed as D = 0.6hs − 0.7hs and L = 0.7hs − 1.0hs, respectively. For symmetric HHS-CCBs with a flange strength of up to 690 MPa, the upper limit of the hole edge distance L can be extended to 1.3hs. To ensure design safety and reasonable strength matching, it is recommended that in practical engineering, when the web strength of cellular beams is 355 MPa, the flange yield strength should not exceed 550 MPa. Additionally, asymmetric HHS-CCBs exhibit both favorable mechanical properties and economic benefits, which are more in line with the hybrid design concept.

8. Conclusions

This study analyzed the mechanical mechanism of HHS-CCBs based on experiments and FEA, established a load-carrying capacity calculation method for HHS-CCBs with circular holes, and verified its accuracy and applicability. The main conclusions are as follows.
(1)
Based on the Vierendeel mechanism damage at the beam-end opening web, a calculation method for the load-carrying capacity of HHS-CCBs with circular holes was proposed using the cubic interaction curve of the bending moment shear force. Simultaneously, the shear contributions of the flange and concrete slab at the web opening were considered. The calculation results were consistent with the results of the experiments and FEA, and can provide a reference for practical engineering design.
(2)
The weakening parameters at the beam ends determine the failure mode of HHS-CCBs. In practical engineering, to avoid stress concentration at the beam-end welds, ensure the development of the Vierendeel mechanism at the web openings of the beam ends, and prevent excessive reduction in load-carrying capacity, it is recommended that the weakening parameter ranges for HHS-CCBs be set as follows: hole diameter D = 0.6hs − 0.7hs and hole edge distance L = 0.7hs − 1.0hs, respectively. For symmetric HHS-CCBs with a flange strength of up to 690 MPa, the upper limit of the hole edge distance L can be extended to 1.3hs.
(3)
The experimental and finite element results indicate that strength matching between the flange and web has almost no effect on the failure mode of the HHS-CCBs. It is recommended that when the web strength of cellular steel beam is 355 MPa, the flange yield strength should not exceed 550 MPa. Additionally, asymmetric HHS-CCBs exhibit both favorable mechanical properties and economic benefits and have greater overall advantages over symmetric HHS-CCBs.
(4)
The load-carrying capacity calculation formula can be applied to HHS-CCBs with different section types, where there are circular holes at the beam web and Vierendeel mechanism damage occurs, but the flange width–thickness ratio cannot significantly exceed the limit.
In future research, parameters such as the material strength grade of cellular steel beams and the shape of openings will be further investigated to broaden the applicability of the HHS-CCB design method proposed in this study.

Author Contributions

Writing, J.G.; analysis, J.G.; model, S.H.; reviewing and editing, T.L.; validation, H.Z.; conceptualization, T.L.; supervision, H.Z.; methodology, J.G.; investigation, T.L. All authors have read and agreed to the published version of the manuscript.

Funding

This research was funded by the National Natural Science Foundation of China (Grant Nos. 52408189, 52408149, and 52308133) and the Postdoctoral Fellowship Program of CPSF (Grant No. GZB20240378).

Informed Consent Statement

Informed consent was obtained from all subjects involved in the study.

Data Availability Statement

Some or all data, models, or code that support the findings of this study are available from the corresponding author upon reasonable request.

Acknowledgments

The authors express their thanks to the people who helped with this work, and acknowledge the valuable suggestions from the peer reviewers.

Conflicts of Interest

The authors declare no conflicts of interest.

References

  1. Lawson, R.M.; Chung, K.F.; Price, A.M. Tests on composite beams with large web openings to justify existing design methods. Struct. Eng. Lond. 1992, 70, 1–7. [Google Scholar]
  2. Lawson, R.M. Design for Openings in the Webs of Composite Beams; CIRIA Special Publication and SCI Publication 068; CIRIA, Steel Construction Institute: Bracknell, UK, 1987. [Google Scholar]
  3. Chung, K.F.; Lawson, R.M. Simplified design of composite beams with large web openings to Eurocode 4. J. Constr. Steel Res. 2001, 57, 135–164. [Google Scholar] [CrossRef]
  4. Eurocode4: Design of Composite Steel and Concrete Structures; European Committee for Standardization: Brussels, Belgium, 2004.
  5. Zhou, D. Beitrag zum Tragverhalten und zur Entwicklung der Rechenmodelle von Verbundträgern mit Stegöffnungen; Shaker-Verlag: Düren, Germany, 2003. [Google Scholar]
  6. Zhou, D. Ein Rechenverfahren für Verbundträgern mit Stegöffnungen-Teil 1. Stahlbau 2003, 72, 626–634. [Google Scholar] [CrossRef]
  7. Zhou, D. Ein Rechenverfahren von Verbundträgern mit Stegöffnungen-Teil 2. Stahlbau 2003, 72, 744–747. [Google Scholar] [CrossRef]
  8. Wang, P.; Zhou, D.H.; Wang, Y.H.; Han, C.X. Theoretical study on ultimate bearing capacity of composite beams with reinforced web opening. Eng. Mech. 2013, 30, 138–146. [Google Scholar]
  9. Li, L.Q. Experimental Study and Theoretical Analysis of Steel-Concrete Continuous Composite Beams with Web Opening. Master’s Thesis, Kunming University of Science and Technology, Kunming, China, 2014. [Google Scholar]
  10. Todd, D.M.; Cooper, P.B. Strength of composite beams with web openings. J. Struct. Div. 1980, 106, 431–444. [Google Scholar] [CrossRef]
  11. Donoghue, C.M. Composite beams with web openings: Design. J. Struct. Div. 1982, 108, 2652–2667. [Google Scholar] [CrossRef]
  12. Redwood, R.G.; Pournbouras, G. Analysis of composite beams with web openings. J. Struct. Eng. 1984, 110, 1949–1958. [Google Scholar] [CrossRef]
  13. Clawson, W.C.; Darwin, D. Tests of composite beams with web openings. J. Struct. Div. 1980, 108, 145–162. [Google Scholar] [CrossRef]
  14. Clawson, W.C.; Darwin, D. Strength of composite beams at web openings. J. Struct. Div. 1982, 108, 623–641. [Google Scholar] [CrossRef]
  15. Cho, S.H.; Redwood, R.G. Slab behavior in composite beams at openings. I Anal. J. Struct. Eng. 1992, 118, 2287–2303. [Google Scholar] [CrossRef]
  16. Redwood, R.; Cho, S.H. Design of steel and composite beams with web openings. J. Constr. Steel Res. 1993, 25, 23–41. [Google Scholar] [CrossRef]
  17. Fahmy, E.H. Analysis of composite beams with rectangular web openings. J. Constr. Steel Res. 1996, 37, 47–62. [Google Scholar] [CrossRef]
  18. Donahey, R.C.; Darwin, D. Performance and Design of Composite Beams with Web Openings; University of Kansas: Lawrence, KS, USA, 1986. [Google Scholar]
  19. Darwin, D.; Donahey, R.C. LRFD for composite beams with unreinforced web openings. J. Struct. Eng. 1988, 114, 535–552. [Google Scholar] [CrossRef]
  20. Darwin, D.; Lucas, W.K. LRFD for steel and composite beams with web openings. J. Struct. Eng. 1990, 116, 1579–1593. [Google Scholar] [CrossRef]
  21. Lucas, W.K.; Darwin, D. Steel and Composite Beams with Web Openings; University of Kansas Center for Research, Inc.: Lawrence, KS, USA, 1990. [Google Scholar]
  22. Darwin, D. Design of Steel and Composite Beams with Web Openings; Steel Design Guide Series No.2; American Institute of Steel Construction: Chicago, IL, USA, 1990. [Google Scholar]
  23. American Society of Civil Engineers. Specifications for Structural Steel Beams with Web Openings; American Society of Civil Engineers: Reston, VA, USA, 1999. [Google Scholar]
  24. Park, J.W.; Kim, C.H.; Yang, S.C. Ultimate strength of ribbed slab composite beams with web openings. J. Struct. Eng. 2003, 129, 810–817. [Google Scholar] [CrossRef]
  25. Du, H.; Hu, X.; Shi, D.; Fang, B. Effect of reinforcement on the strength of the web opening in steel-concrete composite beam. Eng. Struct. 2021, 235, 112038. [Google Scholar] [CrossRef]
  26. Chen, T.; Gu, X.; Li, H. Behavior of steel-concrete composite cantilever beams with web openings under negative moment. Int. J. Steel Struct. 2011, 11, 39–49. [Google Scholar] [CrossRef]
  27. Ma, H.W.; Liu, W.Y.; Lin, L.; Yuan, J.L. Experimental Study on the Bending Capacity of Castellated Composite Beam Under Negative Moment. J. South China Univ. Technol. 2019, 47, 75–85. [Google Scholar]
  28. GB 50017-2017; Standard for Design of Steel Structures. China Architecture and Building Press: Beijing, China, 2017.
  29. American Institute of Steel Construction. Load and Resistance Factor Design Specification for Structural Steel Buildings; American Institute of Steel Construction, Inc: Chicago, IL, USA, 1999. [Google Scholar]
  30. Guo, J.R.; Shi, Q.X.; Li, T.F.; Ma, G. Seismic performance of hybrid high-strength steel composite cellular beam under low cyclic loading. J. Constr. Steel Res. 2023, 203, 107801. [Google Scholar] [CrossRef]
  31. Zhao, H.; Lu, R.; Guo, J.R.; Hai, L.T. Influence of cold-forming on cyclic behaviors and constitutive model constants of Q460 high-strength steel. J. Constr. Steel Res. 2025, 235, 109793. [Google Scholar] [CrossRef]
  32. Jia, L.G.; Li, Q.W.; Zhang, Y.G. Analysis of shear behaviour of steel-concrete cellular composite beam. Ind. Constr. 2012, 42, 150–156. [Google Scholar]
  33. Liu, Y.F. Experimental Study on Shear Performance of Cellular Composite Beam. Master’s Thesis, Shenyang Jianzhu University, Shengyang, China, 2013. [Google Scholar]
  34. Jia, L.G.; Li, Q.W.; Liu, Y.F. Performance analysis and calculation of shear force resistance for cellular beam. Eng. Mech. 2012, 29, 23–30+56. [Google Scholar]
  35. Guo, J.R.; Sun, L.H.; Zhao, H.; Hu, X.H.; Hai, L.T. Seismic performance of a novel non-diaphragm joint between concrete-filled cold-formed high-strength square steel tubular columns and composite beams. Eng. Struct. 2025, 339, 120700. [Google Scholar] [CrossRef]
  36. Zhao, H.; Tao, M.X.; Ding, R. Experimental study on seismic behaviour of composite frames with wide floor slabs considering the effect of floor loads. Eng. Struct. 2020, 220, 111024. [Google Scholar] [CrossRef]
  37. Chung, K.F.; Liu, C.H.; Ko, A. Steel beams with large web openings of various shapes and sizes: An empirical design method using a generalised moment-shear interaction curve. J. Constr. Steel Res. 2003, 59, 1177–1200. [Google Scholar] [CrossRef]
  38. Ding, F.X.; Wang, E.; Lv, F.; Wang, L.P.; Yu, Y.J.; Huang, Q.L.; Yu, Z.W. Composite action of steel-concrete composite beams under lateral shear force. Eng. Mech. 2021, 38, 86–98. [Google Scholar]
  39. Nie, J.G.; Tang, L. Vertical shear strength of composite beams with compact steel sections. Part I: Composite beams subjected to sagging moment. China Civ. Eng. J. 2008, 41, 7–14. [Google Scholar]
  40. Tang, L.; Nie, J.G. Vertical shear strength of composite beams with compact steel sections. Part II: Composite beams subjected to hogging moment. China Civ. Eng. J. 2008, 41, 15–20. [Google Scholar]
  41. JGJ/T 483-2020; Standard for Design of High Strength Steel Structure. China Architecture and Building Press: Beijing, China, 2020.
  42. JGJ 138-2016; Code for Design of Composite Structures. China Architecture and Building Press: Beijing, China, 2020.
Figure 1. Composite beams with web openings.
Buildings 15 03954 g001
Figure 2. Design details of specimen (units: mm).
Buildings 15 03954 g002
Figure 3. Final damage patterns in HCCB-1: Vierendeel mechanism.
Buildings 15 03954 g003
Figure 4. Principal strain distribution around hole I of specimen HCCB-1.
Buildings 15 03954 g004
Figure 5. Mises stress distribution of specimen HCCB-1 at the yield point (units: MPa).
Buildings 15 03954 g005
Figure 6. Mises stress distribution of specimen HCCB-1 at the peak point (units: MPa).
Buildings 15 03954 g006
Figure 7. Mises stress distribution of specimen HCCB-1 at the ultimate point (units: MPa).
Buildings 15 03954 g007
Figure 8. Mechanical model of a composite beam with a web opening.
Buildings 15 03954 g008
Figure 9. Moment–shear cubic interaction diagrams.
Buildings 15 03954 g009
Figure 10. PNA of the HHS-CCBs under positive loading.
Buildings 15 03954 g010
Figure 11. PNA of the HHS-CCBs under negative loading. (a) 1-axis is located on the upper flange of the cellular beam, and the 2-axis is located at the opening center of the cellular beam. (b) 1-axis is located on the upper T-shape of the cellular beam, and the 2-axis is located at the lower T-shape of the cellular beam. (c) 1-axis is located on the lower T-shape of the cellular beam, and the 2-axis is located at the lower flange of the cellular beam.
Buildings 15 03954 g011
Figure 12. The failure modes when D = 196, L = 280.
Buildings 15 03954 g012
Figure 13. Effects of the weakening parameters.
Buildings 15 03954 g013
Figure 14. Comparison of the FEA and theoretical load carrying capacities with different weakening parameters.
Buildings 15 03954 g014
Figure 15. Effects of strength matching of the flange and web.
Buildings 15 03954 g015
Figure 16. Comparison of the load carrying capacity between FEA and theoretical calculation results.
Buildings 15 03954 g016
Figure 17. Bending moment gradient diagram of the CCBs.
Buildings 15 03954 g017
Table 1. Section classification of the beam flanges and webs.
SpecimenYield Strength fy (MPa)Section ClassificationSchematic Diagram of Section (AISC)
Top FlangeWebBottom FlangeTop FlangeWebBottom Flange
CCB-1345.65395.13345.65CompactCompactCompactBuildings 15 03954 i001
HCCB-1345.65395.13475.45CompactCompactNon-compact
HCCB-2345.65395.13668.33CompactCompactNon-compact
HCCB-3475.45395.13475.45Non-compactCompactNon-compact
HCCB-4668.33395.13668.33Non-compactCompactNon-compact
Table 2. Comparison of the experimental and theoretical load carrying capacities at the web opening under positive loading.
SpecimensExperimental Results [30]SEI/ASCE Method [23]Proposed MethodVp,c1/Vp,tVp,c2/Vp,t
Mp,t (kN·m)Vp,t (kN)Mp,c1 (kN·m)Vp,c1 (kN)Mp,c2 (kN·m)Vp,c2 (kN)
CCB-1203.67201.65152.52151.01178.67176.900.7490.877
HCCB-1227.06224.81159.09157.51218.57216.400.6960.963
HCCB-2259.93257.36169.90168.22273.25270.540.6481.051
HCCB-3243.40240.99180.63178.84222.93220.720.7370.916
HCCB-4262.61260.01230.11227.84280.81278.030.8651.069
Average0.7390.975
Standard deviation0.0720.075
Table 3. Comparison of the experimental and theoretical load carrying capacities at the web opening under negative loading.
SpecimensExperimental Results [30]SEI/ASCE Method [23]Proposed MethodVp,c1/Vp,tVn,c2/Vn,t
Mn,t (kN·m)Vn,t (kN)Mn,c1 (kN·m)Vn,c1 (kN)Mn,c2 (kN·m)Vn,c2 (kN)
CCB-1136.76135.4188.0587.18127.23125.970.6440.930
HCCB-1153.75152.2388.8687.98150.89149.400.5780.981
HCCB-2165.72164.0889.0588.17168.81167.140.5371.019
HCCB-3156.93155.3894.9694.02154.13152.610.6050.982
HCCB-4170.10168.4299.0398.05188.21186.350.5821.106
Average0.5891.004
Standard deviation0.0350.059
Table 4. Comparison of the FEA and theoretical load carrying capacities with different weakening parameters.
GroupWeakening ParametersFEA ResultsProposed MethodVp,c2/Vp,aVn,c2/Vn,a
D (mm)L (mm)Vp,a (kN)Vn,a (kN)Vp,c2 (kN)Vn,c2 (kN)
CCB-1140240213.91151.56199.17146.730.9310.968
168240209.43145.39188.15136.950.8980.942
196240198.29134.00176.90125.970.8920.940
224240190.09122.01165.40112.590.8700.923
196154183.99127.46165.39121.230.8990.951
196196190.86130.56170.01122.000.8910.934
196280205.59139.26183.62129.730.8930.932
HCCB-1140240238.52173.01238.39174.100.9991.006
168240231.01165.41227.54163.020.9850.986
196240218.68150.12216.40149.400.9900.995
224240206.74130.86204.95131.030.9911.001
196154205.34141.76203.29147.080.9901.038
196196209.99146.03208.31145.470.9920.996
196280229.57155.90224.25153.030.9770.982
HCCB-2140240268.56196.67292.69195.511.0900.994
168240262.99182.61281.83182.551.0721.000
196240247.91161.19270.54167.141.0911.037
224240239.26142.52258.78148.281.0821.040
196154236.90149.19255.97166.731.0801.118
196196240.00157.66261.07163.301.0881.036
196280260.70168.35279.64170.651.0731.014
HCCB-3140240256.53181.74244.65177.720.9540.978
168240250.33171.08231.32166.080.9240.971
196240235.02150.71220.72152.610.9391.013
224240223.67135.75209.82136.030.9381.002
196154220.72143.58207.38149.660.9401.042
196196230.21147.71212.37148.500.9231.005
196280246.23158.89228.83156.410.9290.984
HCCB-4140240281.23201.47297.96218.491.0591.084
168240276.26189.22288.08203.651.0431.076
196240255.87166.79278.03186.351.0871.117
224240242.11144.75267.75165.581.1061.144
196154242.61155.17262.55186.831.0821.204
196196250.67161.35267.83182.391.0681.130
196280265.26172.16287.89189.941.0851.103
Average0.9961.020
Standard deviation0.0750.066
Table 5. Section classification of the components of the CCBs in FEA.
Componentsfy (MPa)Es (105 MPa)λλlSection Classification
Beam Web355.002.0644.0090.57Compact
Beam flange355.002.068.759.15Compact
Beam flange460.002.068.758.04Non-compact
Beam flange500.002.068.757.71Non-compact
Beam flange550.002.068.757.35Non-compact
Beam flange620.002.068.756.92Non-compact
Beam flange690.002.068.756.57Non-compact
Table 6. Comparison of the FEA and theoretical load carrying capacity with different strength matching.
Groupfy (MPa)FEA ResultsTheoretical Results V p , c V p , a V n , c V n , a
Top FlangeWebBottom FlangeVp,a (kN)Vn,a (kN)Vp,c (kN)Vn,c (kN)
CCB-355355355355196.16133.72177.41125.060.9040.935
ACCB-460355355460221.72147.00209.40143.350.9440.975
ACCB-500355355500229.72151.39221.14148.680.9630.982
ACCB-550355355550239.19155.28235.48154.500.9840.995
ACCB-620355355620247.42158.39254.96162.171.0301.024
ACCB-690355355690253.05160.10273.77164.771.0821.029
SCCB-460460355460236.18152.54213.07146.060.9020.958
SCCB-500500355500244.60157.15225.86153.440.9230.976
SCCB-550550355550251.97161.28241.28162.260.9581.006
SCCB-620620355620256.98165.02261.84173.951.0191.054
SCCB-690690355690260.23166.04281.63185.011.0821.114
Average0.9811.004
Standard deviation0.0620.047
Disclaimer/Publisher’s Note: The statements, opinions and data contained in all publications are solely those of the individual author(s) and contributor(s) and not of MDPI and/or the editor(s). MDPI and/or the editor(s) disclaim responsibility for any injury to people or property resulting from any ideas, methods, instructions or products referred to in the content.