Abstract
This paper studied the flexural behavior of flat steel–HPC composite beams and corrugated steel–HPC composite slabs using finite element analysis. The accuracy and reliability of the finite element model were verified by comparing it with related experimental data in the literature. The influence of different factors on the flexural bearing capacity of the composite slab/beam is discussed. Increasing the concrete thickness, friction coefficient, concrete strength, and wave height of a corrugated steel plate and employing an optimized rebar configuration significantly enhanced the flexural behavior. Remarkably, increasing the thickness of the steel plate and the number of studs also improved the flexural bearing capacity, but an over-reinforcement phenomenon could easily occur, not being conducive to optimal structural performance. An equation for calculating the flexural bearing capacity of steel–HPC composite slab/beam structures considering the effects of the number of studs and the friction coefficient is proposed. The rationality of the proposed method was verified through the finite element results, providing a more accurate method for designing steel–HPC composite structures.
1. Introduction
Steel–concrete composite structures exhibit high strength, straightforward applicability, and excellent seismic performance [1,2,3]. As composite structures, they host the full potential of both steel and concrete [4,5,6,7], which makes them favorable in contemporary construction and engineering applications. They can reduce the structure’s section height, save space, and have good constructability, thereby shortening the construction period and reducing construction costs [8,9,10].
Ordinary concrete is extensively used as a material of choice in composite structures due to its cost-effectiveness and wide application range. However, civil engineering is constantly facing increasing performance requirements, so ordinary concrete fails to meet expectations in specific applications. In this context, high-performance concrete has attracted increased attention due to its excellent mechanical properties and durability [11,12,13,14]. Ultra-High-Performance Concrete (UHPC) has a very high compressive strength, usually between 120–180 MPa, and Engineered Cementitious Composite (ECC) is a fiber-reinforced cementitious composite that exhibits high ductility under tensile and shear loads. These two kinds of concrete were applied in practical engineering combined with steel plates, forming unique composite structures. The mechanical properties of these composite structures were studied in detail [15], and many tests confirmed the high bearing capacity and good ductility of steel plate–HPC composite slab/beam structures. Hamoda et al. [16] investigated the behavior of composite girders made of HPC slabs connected to steel I-beams through stud shear connectors subjected to a hogging moment. The results showed that the flexural cracking loads of ECC and steel fiber-reinforced concrete (SFRC) girder specimens were ~16 and 51% higher than that of their normal concrete (NC) counterparts, respectively. Wang et al. [17] proposed a new kind of continuous composite beam, considering a steel box girder and an ultra-high-performance concrete waffle slab. The mechanical characterization indicated that the bending capacity of the steel–ultra-HPC continuous composite beam was 1.2 times that of the steel–concrete continuous composite beam. Du et al. [18] studied the flexural performance of high-strength steel (HSS)–concrete composite beams, demonstrating their good mechanical and deformation properties, where the ultimate bending strength and ductility increased with the concrete strength. Based on a nonlinear programming (NLP) algorithm, Wu et al. [19] conducted a comparative study of I-beam and corrugated web composite floor systems. The composite floor with the corrugated web beam exhibited high shear resistance and stability and a reasonable and economical cross-section with reduced steel consumption. The above literature verified the advantages of steel–high-performance concrete composite structures and provided a guarantee for the research value and popularization of this paper. The influence of different parameters on the force of steel–concrete composite structures was extensively investigated [20,21]. The following literature provides references for the selection of different parameters in this paper. Du et al. [22] showed that the flexural capacity of the composite beams with HSS and high-strength concrete (HSC) increased with the shear connection degree. Chen et al. [23] studied the negative bending moment performance of steel–ECC concrete composite bridge panels. The increase in the ECC layer thickness increases the ultimate bearing capacity of the specimen significantly, and the decrease in the bolt spacing increases the ultimate bearing capacity of the specimen less. You et al. [24] studied the influence of the reinforcement ratio and shear connection degree on the flexural performance of the alkali-activated cement-based ultra-high-performance concrete (AAUHPC) overlay. Increasing the reinforcement ratio effectively reduced the ultimate tensile strain, delayed the onset of crack development, and reduced the crack width, while the relative slip between the AAUHPC cladding and the steel deck was significantly reduced with the degree of shear connection. Zhang et al. [25] assessed the interface shear behavior and the flexural performance of steel–NC–UHPC composite slabs using an interface test and finite element analysis. The normal stress of UHPC, concrete, and the steel plate decreased with the thickness of the concrete and steel plate. Reducing the steel rib spacing effectively improved the flexural performance of UHPC, concrete, and steel plates and reduced stress. The properties of steel–concrete composite structures have been continuously improved via comprehensive structural, material, and process optimization, and their application field has expanded from bridge superstructures to foundation engineering and underground structures [26].
At present, there are few studies on steel plate–HPC composite structures, providing no analysis of the influence of multiple parameters on the bearing capacity of steel plate–HPC composite structures. Herein, we applied a finite element simulation to investigate the influence of various parameters on the bending performance of corrugated steel–HPC composite slabs and flat steel–-HPC composite beams. The validity of the finite element model of composite slab/beam structures was verified based on two sets of tests performed on corrugated steel–concrete composite slabs and flat steel plate–HPC composite beams available in the literature. Based on the sufficient parameter analysis, an equation describing the influence of the stud and interfacial friction coefficient on the flexural bearing capacity of steel–-concrete composite slab/beam structures was obtained by data fitting, providing theoretical support for the promotion and application of high-performance steel–concrete composite structures.
2. Finite Element Modeling
2.1. Basic Information
2.1.1. Corrugated Steel–Concrete Composite Slab
This study of a corrugated steel plate–concrete composite slab was performed based on a previously reported test [27]. Taking specimen 1 and specimen 3 in the paper as examples, their structures are shown in Figure 1. All specimens were made of C30 strength grade concrete and Q235 strength grade steel slab. The specimen’s total length and net span L were 2000 mm and 1600 mm, and the width and thickness of corrugated slabs were divided into 450 mm, 460 mm, and 600 mm, and 3 mm and 5 mm, respectively, according to the corrugated steel slab waveform types. The height was divided into 250 mm, 264 mm, and 310 mm according to the concrete filling thickness. The rebar was HRB335, with a diameter of 12 mm. The diameter of the studs was 8 mm, the horizontal spacing was 150 mm, and the vertical spacing was 300 mm. Details of specimens are shown in Table 1. Hydraulic jacks were used in the test to carry out graded loading at three symmetrical points by a distributing beam, and the load increment in each stage was 5 kN until the specimen yielded. The loading scheme is shown in Figure 2.
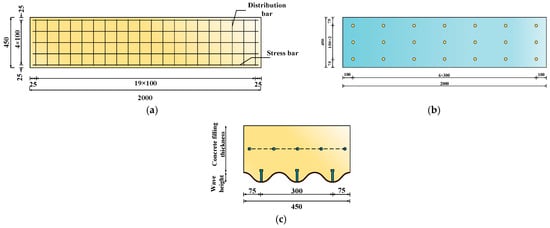
Figure 1.
Specimen structure [27] (units: mm). (a) Rebar layout plan; (b) stud layout plan; (c) component elevation.

Table 1.
The properties of the specimen [27].
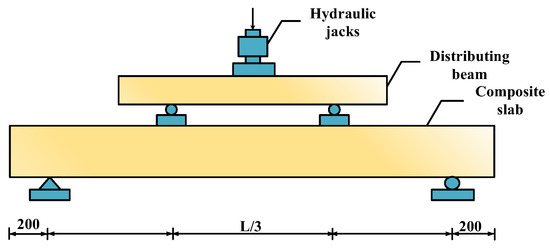
Figure 2.
Specimen loading [27] (units: mm).
The finite element model included five parts: the concrete, corrugated steel plate, stud, pad, and rebar. Among them, a C3D8R solid unit was used for the concrete, stud, and pad, an S4R unit was used for the corrugated steel plate, and a T3D2 unit was used for the rebar to simulate its tension and compression states. The grid was divided into structured grids. To ensure the model’s convergence and accuracy, the mesh size of the concrete and rebar was 40 mm, the mesh size of the corrugated steel plate was 30 mm, and the mesh size of the stud was 1.5 mm. The finite element model is shown in Figure 3.
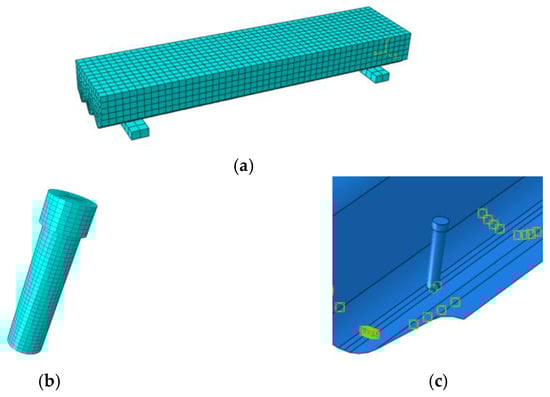
Figure 3.
Finite element model of the corrugated steel plate–concrete composite slab. (a) Overall mesh; (b) stud model; (c) stud–steel plate connection.
2.1.2. Flat Steel–UHPC Composite Beam
The finite element analysis of a flat steel–concrete composite beam refers to the previously reported flexural performance test of a steel–UHPC composite beam [28]. The reported specimen structure is shown in Figure 4. The specimen’s total length, net span, width, and height were 3200, 3000, 150, and 362 mm, respectively. The thickness of the steel plate was 12 mm, and the concrete height was 350 mm. The stud diameter was 13 mm, with 42 studs in total, and the horizontal double-row arrangement was adopted. The horizontal spacing was 55 mm, and the vertical spacing was 160 mm. The diameter of rebars from N1 to N4 was 10, 6, 8, and 8 mm, respectively. The basic mechanical properties of the rebars and plates are shown in Table 2. The test loading scheme is shown in Figure 5. Two-point symmetric loading was adopted, and the applied boundary conditions were that one end was a fixed hinge support, while the other end was a movable hinge support.
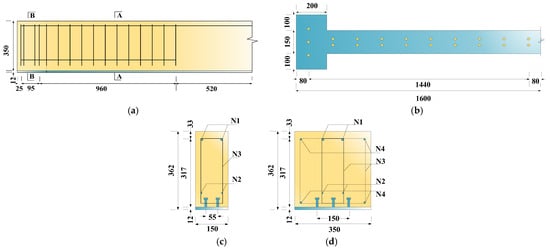
Figure 4.
Specimen structure [28] (units: mm). (a) Specimen elevation (half side); (b) specimen stud layout plan (half side); (c) A-A cross-section; (d) B-B cross-section.
Table 2.
Basic mechanical properties of rebars and plates.
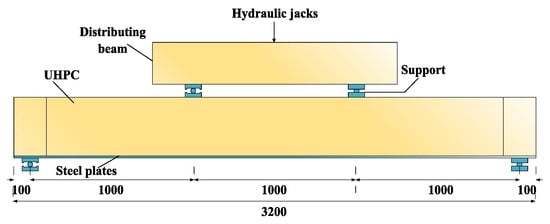
Figure 5.
Specimen loading [28] (units: mm).
In ABAQUS, concrete, steel plates, and studs were simulated using C3D8R solid units, while rebars were simulated using T3D2 truss units. The mesh unit size of the steel plate, UHPC, pad, and rebar was 20 mm, and the unit size of the stud was 1.5 mm. The finite element model of a flat steel–concrete composite beam is shown in Figure 6.
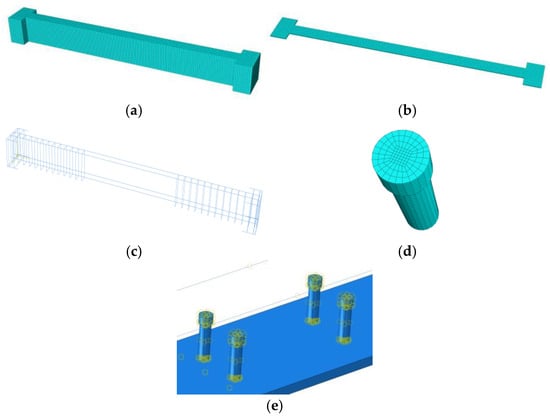
Figure 6.
Finite element model of a flat steel–concrete composite beam. (a) Concrete model; (b) steel plate model; (c) steel cage model; (d) stud model; (e) stud–steel plate connection.
2.1.3. Flat Steel–ECC Composite Slab
The study of a flat steel plate–ECC composite slab was performed based on a previously reported test [29]. The reported specimen structure is shown in Figure 7. The specimen’s total length, width, and height were 1400, 200, and 74 mm, respectively. The steel plate was 14 mm thick, and Q345 steel was used. The ECC thickness was 60 mm. The stud diameter was 13 mm, and its height was 40 mm. The diameter of the longitudinal and transverse rebars were 10 mm, the grade of rebar was HRB400, and the layout spacing was 33 mm. The loading scheme is shown in Figure 8. The loading mode of the specimen is three-point loading. The finite element modeling method adopts the above method of a flat steel–UHPC composite beam and is shown in Figure 9.
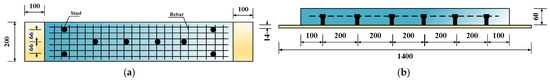
Figure 7.
Specimen structure [29] (units: mm). (a) Specimen stud layout plan; (b) specimen elevation.
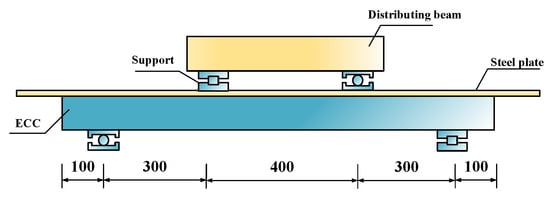
Figure 8.
Specimen loading [29] (units: mm).
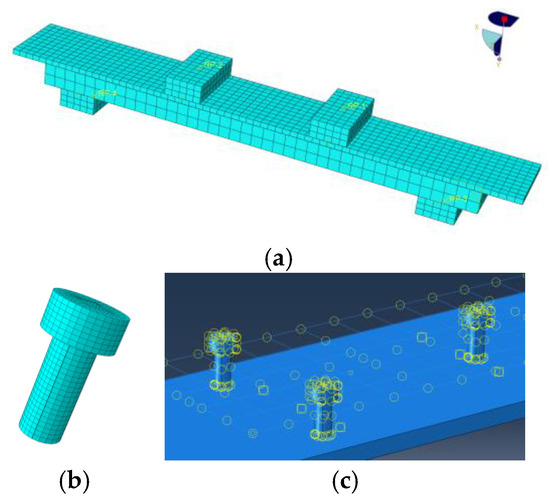
Figure 9.
Finite element model of a flat steel–ECC composite slab. (a) Overall mesh figure; (b) stud model; (c) stud–steel plate connection.
2.2. Constitutive Relation
2.2.1. Constitutive Relation of Ordinary Concrete
The stress–strain curve specified in the Code for Design of Concrete Structures (GB 50010-2010) [30] was adopted as the constitutive relation of ordinary concrete, and the constitutive relation of uniaxial compression is shown in Figure 10.
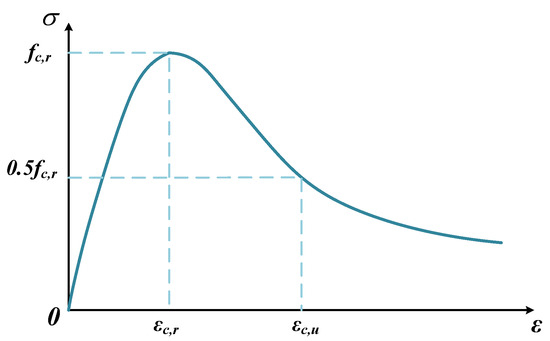
Figure 10.
Compression constitutive relation of ordinary concrete.
fc,r is the uniaxial compressive strength of concrete, and εc,r is the peak compressive strain of concrete.
The constitutive relation of uniaxial tension is shown in Figure 11.
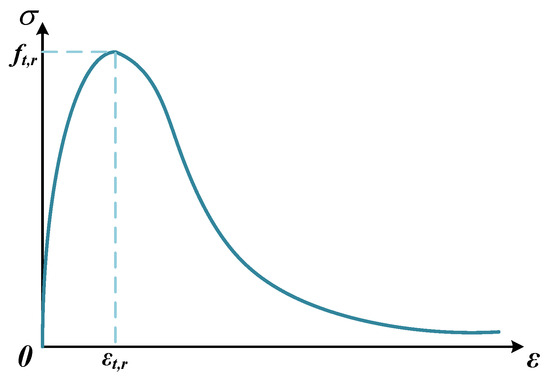
Figure 11.
Tensile constitutive relation of ordinary concrete.
ft,r is the uniaxial tensile strength of concrete, and εt,r is the peak tensile strain of concrete.
2.2.2. Constitutive Relation of ECC
The values of the ECC parameters are as follows: shear angle 30°, eccentricity 0.1, biaxial-to-uniaxial compressive strength ratio 1.26, Kc 0.667, and viscosity coefficient 0.0005. The stress–strain curve proposed by Yuan et al. [31] was adopted for both tension and compression constitutive relations, and the compression relationship was calculated according to Equation (1).
σc0 is the ECC axial compressive strength, and in this paper, a value of 50.3 MPa was used. εc0 is the ECC axial compressive peak strain, here 4.05 × 10⁻³, and εcu is the ECC ultimate compressive strain, here 1.15 × 10⁻².
The tension relationship was calculated according to Equation (2).
σtc is the ECC cracking strength, here 3.96 MPa; εtc is the ECC cracking strain, here 2.15 × 10⁻⁴; σtu is the ECC ultimate tensile strength, here 4.63 MPa; and εtu is the ECC limit tensile strain, here 2.00 × 10⁻².
2.2.3. Constitutive Relation of UHPC
The relevant parameters of UHPC are as follows: shear angle 36°, eccentricity 0.1, biaxial-to-uniaxial compressive strength ratio 1.16, Kc 0.666 7, and viscosity coefficient 0.0005. The UHPC tensile structure adopted a bilinear stress–strain relationship used from the literature [32]. (The same constitutive model for UHPC was adopted in References [28,32]) and is shown in Figure 12).
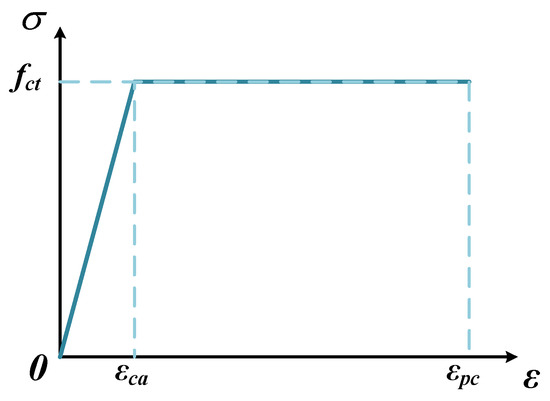
Figure 12.
Tensile constitutive relation of UHPC.
fct is the tensile strength; εca is the peak strain at the elastic stage, here 200 × 10−6; and εpc is the ultimate tensile strain, here 2000 × 10−6. The stress–strain relationship of the UHPC compression constitutive relation was obtained from [32] and is shown in Figure 13.
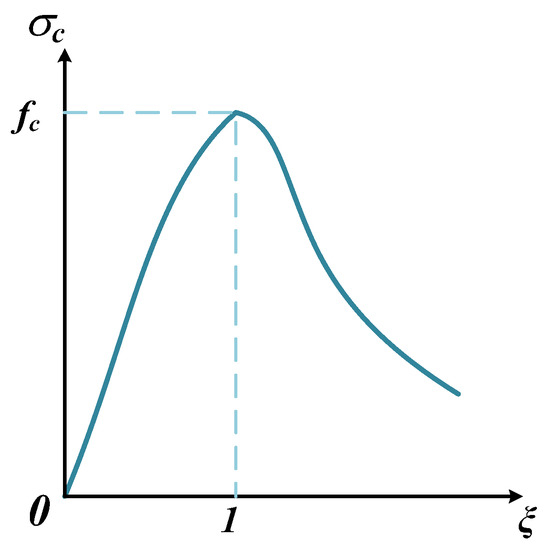
Figure 13.
Compression constitutive relation of UHPC.
fc is the compressive strength of a cylinder; ξ is the strain ratio, ξ = ε/ε0; and ε0 is the peak strain under pressure, here 3500 × 10−6.
2.2.4. Constitutive Relation of Steel Plate
The stress–strain relationship of the steel plate adopts a three-fold model, as shown in Equation (3):
Es is the elastic modulus of steel; fy is the yield strength of steel; εy is the yield strain; εs,h is the starting strain of the steel strengthening stage, here 0.025; and εs,u is the ultimate strain.
2.2.5. Constitutive Relation of Rebar
The stress–strain relationship of the rebar adopted an ideal elastic–plastic model and is shown in Figure 14.
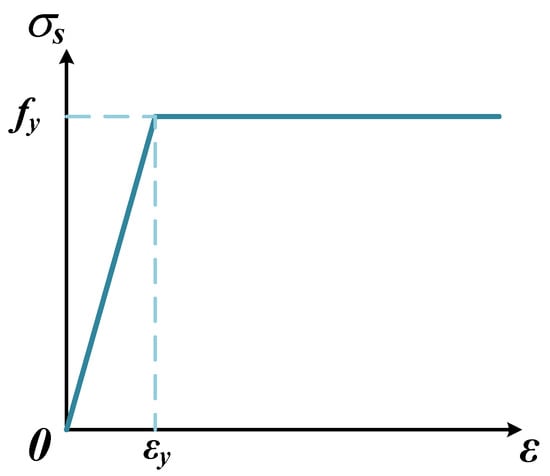
Figure 14.
The stress–strain relation of rebar.
fy is the yield strength of the rebar; and εy is the yield strain.
2.2.6. Constitutive Relation of Stud
The stress–strain relationship of the studs also adopted a three-fold model obtained from the literature [33,34], as shown in Equation (4):
Ess is the elastic modulus of the studs, here taken as 206 GPa; fsy is the yield strength of the studs, here 375 MPa; εsy is the yield strain, with εsy = fsy/Ess = 0.00182; and εsu is the ultimate strain, here 0.03822.
2.3. Interaction Relationship and Load Application
2.3.1. Corrugated Steel–Concrete Composite Slab
Surface-to-surface contact between the corrugated steel plate and concrete was adopted; the tangential action followed the penalty friction formula, the friction factor was set to 0.3, and normal action was represented by a hard contact. The connection of the rebar and concrete in References [35,36] was adopted, and the rebar was combined with concrete by embedding. The stud’s bottom was bound with the steel plate; at the same time, a rigid backing plate was set at the support to effectively reduce the stress concentration phenomenon, and the binding mode was adopted between the backing plate and the steel plate. The composite slab creates constraints by applying boundary conditions to rigid backing plates. The left end of the composite slab was set as a fixed support, the right end was set as a hinged support, and the symmetric boundary condition was set in the middle of the composite slab to reduce the number of degrees of freedom and the complexity of calculation. The model adopted such displacement-controlled loading that assumed applying load to the symmetrical tripartite points of the composite slab. The boundary conditions and the load application diagram are shown in Figure 15.
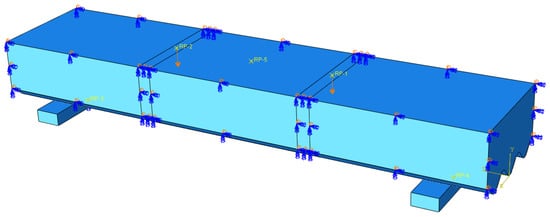
Figure 15.
Schematic diagram of boundary conditions and load application.
2.3.2. Flat Steel–UHPC Composite Beam and Flat Steel–ECC Composite Slab
The flat steel–UHPC composite beam and flat steel–ECC composite slab used the same boundary conditions and load application. In the used model, rebars and studs were embedded in concrete, and the stud was combined with the steel plate as binding, same as the pad and concrete. Surface-to-surface contact was adopted between the steel plate and concrete, the penalty function was set in tangential behavior, the friction coefficient was 0.5, and the contact surface was set as “hard contact” in normal behavior. The boundary conditions were set as one end of a fixed hinge support (U1 = U2 = U3 = UR1 = UR2 = 0) and the other end of a movable hinge support (U2 = U3 = UR1 = UR2 = 0). In this model, the displacement-controlled loading method was selected for loading, and the boundary conditions and load application are shown in Figure 16.
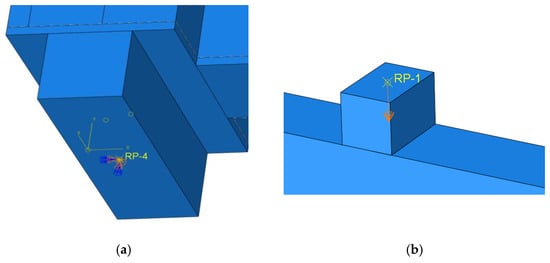
Figure 16.
Boundary conditions and load application. (a) Boundary conditions; (b) load application.
3. Verification of the Finite Element Results
3.1. Corrugated Steel–Concrete Composite Slab
Specimens 1, 2, 3, 4, 5, and 7 from the literature [27] were established by adopting the modeling method of a corrugated steel–concrete composite slab in Chapter 1. The load–midspan deflection curves and load–strain curves of some specimens were compared, as shown in Figure 17. Specimens 1, 2, 3, 4, and 7 were all F-shaped corrugated steel, while specimen 5 was H-shaped corrugated steel, respectively. With specimen 2 as the control group, specimens 1, 3, 4, 5, and 7 were compared to investigate the effects of studs, steel slab thickness, steel mesh configuration, and steel slab waveform on the bearing capacity of the composite slabs, respectively. The errors of comparison data were within 5% (Table 3), and the reasons for this difference are related to the selection of the material’s constitutive model, the degree of model simplification, the way of mesh division, etc. However, overall, the finite element modeling process in this paper successfully simulated the mechanical performance of the corrugated steel sheet–concrete composite slab. Taking specimen 3 as an example, the concrete gradually separated from the corrugated steel plate with loading, and the cracks were mainly concentrated near the loading point and in the span. When the upper surface of the concrete reached the ultimate compressive strain, the specimen was damaged, and the failure mode is shown in Figure 18. From the analysis results of finite element PEEQ (equivalent plastic strain) in Figure 18, the findings in this study corroborate previously reported failure results.
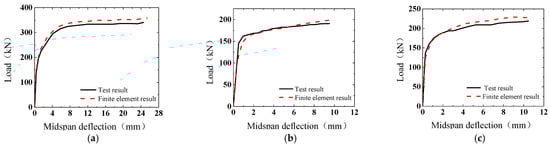
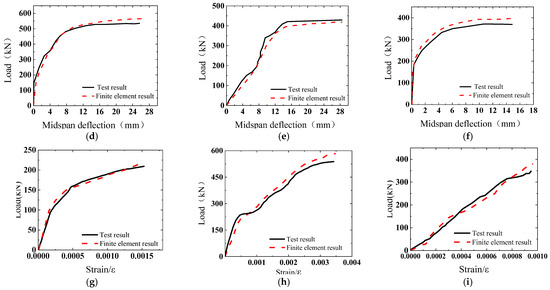
Figure 17.
Comparison of the finite element simulation data and test data. (a) Load–midspan deflection contrast curve of specimen 1; (b) load–midspan deflection contrast curve of specimen 2; (c) load–midspan deflection contrast curve of specimen 3; (d) load–midspan deflection contrast curve of specimen 4; (e) load–midspan deflection contrast curve of specimen 5; (f) load–midspan deflection contrast curve of specimen 7; (g) load–strain comparison curve of concrete in span of specimen 2; (h) load–strain comparison curve at mid-span trough of specimen 4 corrugated steel plate; (i) load–strain comparison curve at mid-span crest of specimen 7 corrugated steel plate.
Table 3.
Comparison table of finite element simulation results and test results.
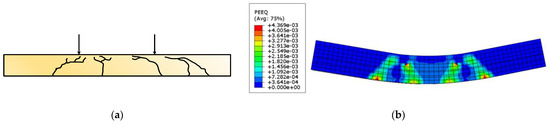
Figure 18.
Comparison of the failure modes of specimen 3. (a) Test failure phenomenon [27]; (b) finite element equivalent plastic strain cloud diagram.
3.2. Flat Steel–UHPC Composite Beam
The modeling method of a flat steel–concrete composite beam in Chapter 1 was used for the finite element modeling analysis of previously published components [28]. The load–displacement curves and load–strain curves of steel–UHPC composite beams were compared with the published test results, as shown in Figure 19. The value of the ultimate bearing capacity obtained from the finite element simulation is 4.41% smaller than the reported results. At the beginning of the test, the specimen was in the elastic stage, and no obvious cracks appeared on the surface. With the gradual load increase, cracks began to appear near the bottom of the beam at the loading point; afterward, more and more subtle vertical cracks emerged in the pure bend section of the specimen, mainly distributed near the stud. Finally, when the specimen was damaged, the main crack of the specimen extended to the top of the beam, the crack width increased, and the top of the beam locally collapsed. According to the analysis results of finite element PEEQ in Figure 20, the failure condition of the specimen is consistent with the previously reported data [28].
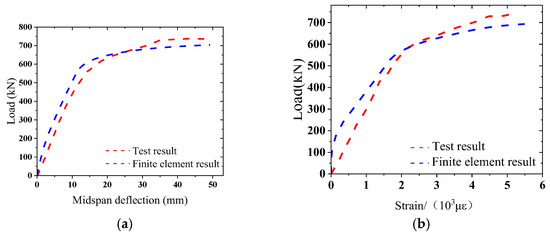
Figure 19.
Comparison of the finite element simulation data and test data. (a) Load–midspan deflection contrast curve; (b) load–midspan strain contrast curve.
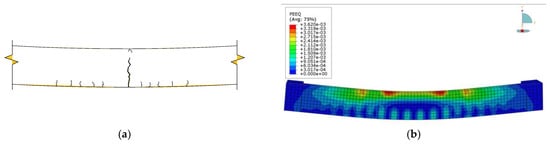
Figure 20.
Comparison of the failure modes of studied specimens. (a) Test failure phenomenon [28]; (b) finite element equivalent plastic strain cloud diagram.
3.3. Flat Steel–ECC Composite Slab
The modeling method of a flat steel–ECC composite slab in Chapter 1 was used for the finite element modeling analysis of previously published components [29]. The load–displacement curves and load–slip curves of the steel–ECC composite slab were compared with the published test results, as shown in Figure 21. The value of the ultimate bearing capacity obtained from the finite element simulation is 3.56% smaller than the reported results. In the middle stage of the test, a large number of cracks began to appear in the mid-span of the member, and a slight slip occurred between the steel plate and the ECC layer. The PEEQ results of finite element analysis are the same as the failure mode of the member in the literature [29], as shown in Figure 22. In summary, the modeling method mentioned above can effectively reflect the actual test situation.
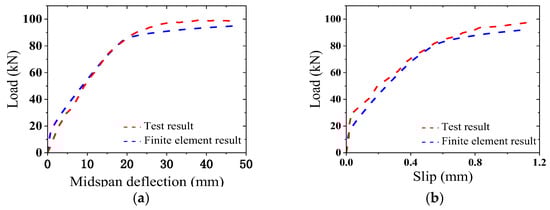
Figure 21.
Comparison of the finite element simulation data and test data. (a) Load–midspan deflection contrast curve; (b) load–slip contrast curve.
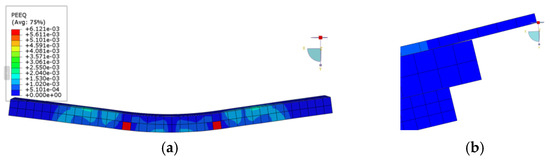
Figure 22.
Comparison of the failure modes of studied specimens. (a) Finite element equivalent plastic strain cloud diagram. (b) End slip phenomenon.
4. Parameter Analysis
4.1. Component Design
4.1.1. Design of the Corrugated Steel Plate–High-Performance Concrete Composite Slab Member
Based on Sample 3 in Ref. [27], ABAQUS finite element analysis was utilized to discuss the influence of the corrugated steel plate wave height, steel plate thickness, concrete thickness, presence of reinforcement, the number of studs, the strength grade of concrete, the steel–concrete friction coefficient, and the concrete type on the load–midspan deflection curve of the corrugated steel–concrete composite slab, respectively. A total of 31 subgroups were set up, and the specific parameters are shown in Table 4. Different mix ratios of UHPC and ECC had different compressive strength, while in ABAQUS, the compressive strength, tensile strength, and elastic modulus of concrete were reflected in the constitutive relationship. Different mix ratios of UHPC and ECC were collected from References [37,38], as shown in Table 5.
Table 4.
Parameters of the corrugated steel plate–high-performance concrete composite slab members.
Table 5.
Mix ratios of UHPC and ECC with different strengths.
4.1.2. Design of the Flat Steel Plate–High-Performance Concrete Composite Beam Member
Based on the sample in Ref. [28], ABAQUS finite element analysis was used to estimate the influence of the strength grade of concrete, rebar diameter, number of studs, steel–concrete friction coefficient, and concrete type on the load–midspan deflection curve of the flat steel plate–concrete composite beams. A total of 26 subgroups were set up, and the specific parameters are shown in Table 6.
Table 6.
Parameters of the flat steel plate–high-performance concrete composite beam members.
4.2. Results Analysis
4.2.1. Effect of the Concrete Thickness
The load–midspan deflection curves of different concrete thicknesses are shown in Figure 23. (In the figure, for example, 180 mm concrete thickness indicates that the thickness of the concrete poured in the composite structure is 180 mm.) Compared with composite slabs with a thickness of 180 mm, the ultimate bearing capacity of slabs with a thickness of 200, 220, 240, and 260 mm increased by 13.96, 38.78, 47.60, and 56.01%, respectively.
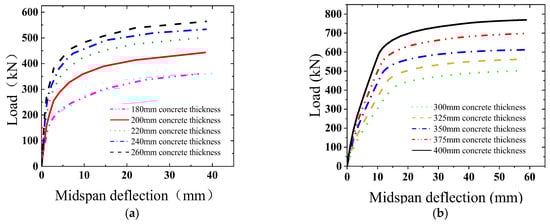
Figure 23.
Load–midspan deflection curves for different concrete thicknesses. (a) Load–midspan deflection curve of a corrugated steel plate; (b) load–midspan deflection curve of a flat steel plate.
Compared with composite beams with a thickness of 300 mm, the ultimate bearing capacity of beams with a thickness of 325, 350, 375, and 400 mm increased by 12.06, 21.78, 38.84, and 53.08%, respectively.
The ultimate load-bearing capacity of steel–concrete composite structures improved with the concrete thickness. Higher concrete castings increased the effective height of the cross-section of the combined structure, providing a larger area under pressure, thus, increasing the load-bearing capacity of the structure.
4.2.2. Effect of the Concrete Type
We separately considered the effect of the concrete type, i.e., C30, ECC, C50, and UHPC concrete, on the stress performance of steel–concrete composite structures. For composite slabs, the use of ECC with a strength of 50 MPa instead of C30 concrete improved the performance by 52.22%, C50 instead of 50 MPa ECC concrete led to 2.14% better performance, and UHPC with a strength of 170 Mpa enhanced the performance by 29.26% compared to C50 concrete. ECC with a strength of 50 MPa and 60 MPa was 4.19% and 10.18% higher than that of 40 MPa, and UHPC with a strength of 170 MPa and 160 MPa was 6.28% and 3.84% higher than that of 150 MPa, respectively.
For composite beams, the ultimate load capacity was increased by 46.35, 32.44, and 27.79 for UHPC with a strength of 170 Mpa, ECC with a strength of 50 MPa, and C50 concrete types, respectively, compared to C30 concrete. ECC with a strength of 50 MPa and 60 MPa was 4.84% and 10.55% higher than that of 40 MPa, and UHPC with a strength of 170 MPa and 160 MPa was 1.73% and 1.27% higher than that of 150 MPa, respectively.
The load–midspan deflection curve of each member is shown in Figure 24. (In the figure, for example, ECC/UHPC170 indicates that the strength of the ECC/UHPC is 170 MPa.) High-strength concrete usually exhibits higher tensile strength and elastic modulus, and the overall performance of the composite board was better for higher concrete strengths. Compared with C50 concrete, there is a slight difference in strength for ECC concrete, but its yield curve is smoother because ECC concrete contains polymer fibers that can prevent the crack extension inside the structure, effectively improving the cracking resistance of the structure. For ECC and UHPC with different strengths, increasing the material strength has a positive effect on the combined structure to a certain extent, but its change is not significant, and its influence on stiffness is small.
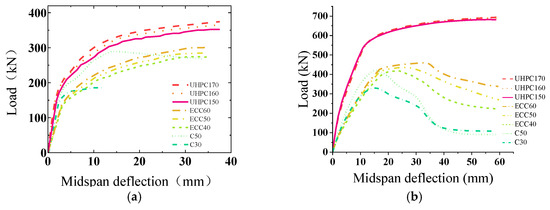
Figure 24.
Load–midspan deflection curves for different concrete types. (a) Load–midspan deflection curve of corrugated steel plate; (b) load–midspan deflection curve of flat steel plate.
4.2.3. Effect of the Rebar Configuration
The influence of rebar addition on the mechanical performance of composite slabs was studied for UHPC and ECC concrete types, and the load–deflection curve of each member is shown in Figure 25. (In the figure, ECC/UHPC indicates the ECC/UHPC composite board without reinforcing bars, and ECC/UHPC-S indicates the ECC/UHPC composite board with reinforcing bars.) The ultimate bearing capacity of the UHPC concrete composite board equipped with rebars was 11.14% higher than that without rebars, being even 17.43% higher in the case of ECC concrete. A reasonable rebar configuration can effectively contribute to controlling and dispersing the load, reducing the stress concentration in the concrete structure, improving the ductility and toughness of the structure, and delaying structural failure to improve the overall bearing capacity of the composite slab.
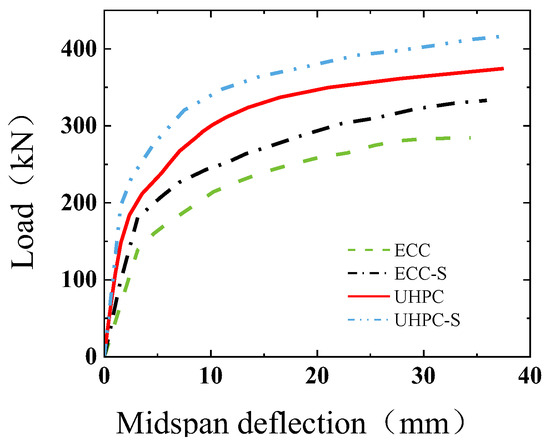
Figure 25.
Load–midspan deflection curves for different rebar configurations.
For composite beams, we investigated the influence of the rebar diameter on the mechanical properties. Four control groups were set up as follows (other conditions remained unchanged): without rebars and with rebar, and for a rebar diameter increased by 2 and 4 mm. The related load–midspan deflection curves are shown in Figure 26. Compared with the scenarios without rebars, the ultimate bearing capacity with rebars, with a rebar diameter increased by 2 mm, and with a rebar diameter increased by 4 mm was improved by 2.05, 3.09, and 4.44%, respectively, demonstrating that the rebar diameter has no significant influence on the stiffness of the composite beam within a certain range. This occurs because the steel plate is located in the tension zone, undertaking most of the tension work, and the longitudinal rebar located in the compression zone cannot exhibit tension performance and fully participate in the force distribution, so the bearing capacity of the structure is not strongly affected.
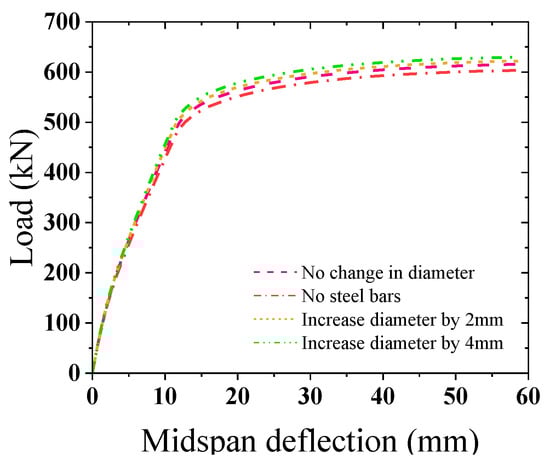
Figure 26.
Load–midspan deflection curves for different rebar diameters.
4.2.4. Effect of the Number of Studs
The influence of the number of studs on the mechanical performance of the combined structures is shown in Figure 27. (In the figure, for example, 20 studs indicate that 20 studs are configured in the composite structure.) For composite slabs, when the number of studs is 10, 12, 14, 16, 18, and 20, the bearing capacity increased by 11.68, 21.64, 35.46, 46.16, 55.78, and 61.98%, respectively, compared with the composite slabs without studs.
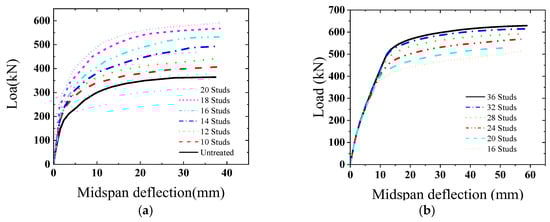
Figure 27.
Load–midspan deflection curves for different stud numbers. (a) Corrugated steel plate; (b) flat steel plate.
For composite beams, when the number of studs was 20, 24, 28, 32, and 36, the bearing capacity increased by 2.37, 10.02, 14.78, 19.10, and 21.95%, respectively, compared with the composite beams with 16 studs.
In general, the number of studs can effectively improve the bearing capacity of the composite slab via enhanced shear transfer efficiency between the corrugated steel plate and concrete so that the stress distribution in the concrete compression zone is more uniform. However, when the number of studs reached a certain level, the overall carrying capacity did not significantly improve further.
4.2.5. Effect of the Friction Coefficient
We considered the effect of different friction coefficients of the steel–concrete interface on the mechanical properties of steel–concrete composite structures. The load–deflection curve of each structural member is shown in Figure 28. (In the figure, for example, a 0.5 Friction coefficient indicates that in the finite element simulation, the friction coefficient between the steel plate and HPC is set to 0.5.) The ultimate bearing capacity of the composite slab increased by 2.82, 5.54, 8.71, 11.88, 15.01, and 18.17% when the friction coefficient changed from 0.2 to 0.25, 0.3, 0.35, 0.4, 0.45, and 0.5, respectively, while the ultimate bearing capacity of composite beams increased by 1.88, 3.82, 5.84, 8.12, 10.16, and 12.56%, respectively, for the same changes. The increase in the friction coefficient improved the bonding force between the corrugated steel plate and concrete, which reduced the relative slip between the two and enhanced the integrity and stability of the structure.
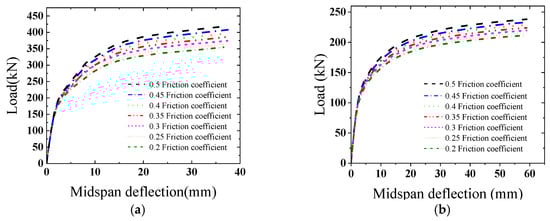
Figure 28.
Load–midspan deflection curves for different friction coefficients. (a) Corrugated steel plate; (b) flat steel plate.
4.2.6. Effect of the Steel Plate Thickness
For composite slabs, the thickness of the corrugated steel plate was set to 3, 5, and 7 mm. The load–deflection curves for each member are shown in Figure 29. (In the figure, for example, 3 mm plate thickness indicates that the thickness of the corrugated steel plate is 3 mm.) The ultimate bearing capacity of members with 5 mm and 7 mm steel thicknesses increased by 3.20 and 5.91% compared with members with a steel thickness of 3 mm, respectively. Increasing the thickness of the corrugated steel plate can improve the bearing capacity of the composite slab, and a thicker steel plate can provide better bending and shear stiffness and increase the stiffness and stability of the composite slab. However, when the plate thickness exceeded a certain threshold, the concrete structure crushed, and the steel did not yield, resulting in uneven stress distribution of the members, similar to the failure of concrete super-reinforced beams, indicating that the influence of the steel plate thickness on the ultimate bearing capacity of the composite structure is limited.
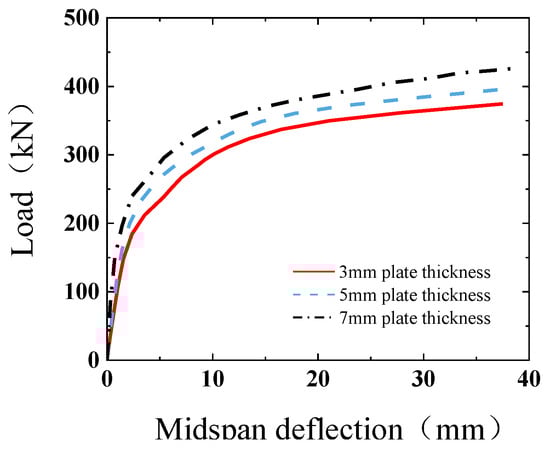
Figure 29.
Load–midspan deflection curves for different plate thicknesses.
4.2.7. Effect of the Wave Height of a Corrugated Steel Plate
In the finite element modeling, the wave distance of the corrugated steel plate was kept unchanged, and only the wave height and the radius of the circular arc were varied. The line connecting the adjacent circular arc represents a tangent to the circular arc. The ultimate bearing capacity of the composite slab continually increased with the wave height of a corrugated steel plate. The load–deflection curves of composite slabs with different wave heights are shown in Figure 30. (In the figure, for example, a 30 mm wave height indicates that the wave height of the corrugated steel plate is 30 mm.) Compared with the composite slab with a wave height of 30 mm, the ultimate bearing capacity of composite slabs with a wave height of 40, 50, and 60 mm was increased by 10.52, 15.35, and 29.48%, respectively. This occurs because the wave’s crest and trough of the corrugated steel plate bear the compressive stress and tensile stress during the stress, respectively, and the increase in the wave height makes the stress distribution more uniform, alleviating the stress concentration phenomenon and improving the ultimate bearing capacity of the composite slab. However, the cracking load of the composite slab with a wave height of 50 mm was lower than that of the composite slab with a wave height of 40 mm; this may occur because the dead weight of the steel plate increases with the wave height, changing the load distribution of the whole structure and reducing the plate plasticity, yielding a decreased cracking load.
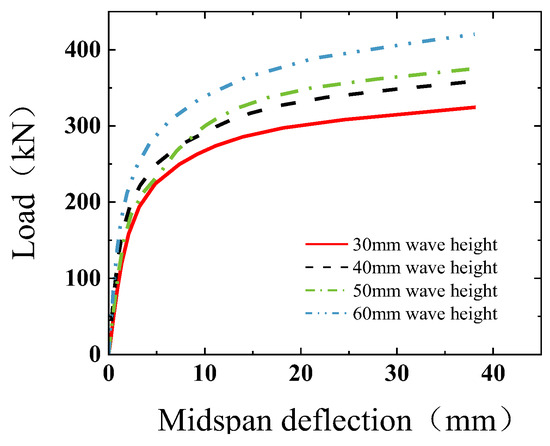
Figure 30.
Load–midspan deflection curves for different wave heights.
5. A Method for Calculating the Flexural Capacity of Composite Members Considering the Peg Action and Friction Coefficient
According to the Code for Composite Slabs Design and Construction (CECS273-2010) [39], the normal section bearing capacity of composite beams/slabs was calculated by a plastic design method based on the following assumptions: (1) steel plates and concrete always work together, and the slip is small, that is, there is a unique plastic neutral axis; (2) concrete reaches the compressive strength in the compression zone, and the tensile action of concrete below the axis is ignored; and (3) the steel plate reaches the yield strength in the tensile and compressive zones.
For a corrugated steel–concrete composite slab, as , the plastic neutralization axis is located in the concrete section above the corrugated steel plate crest. The concrete above the neutral axis is compressed, and the concrete below the neutral axis is strained (regardless of its role), as well as the corrugated steel plate. The stress distribution diagram is shown in Figure 31.
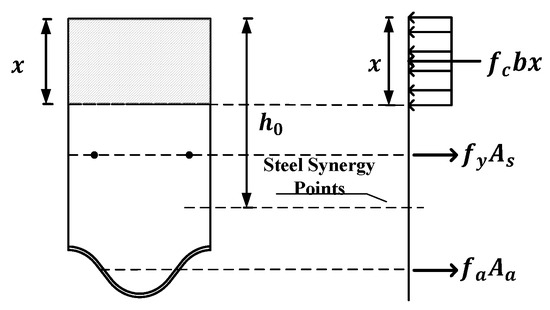
Figure 31.
Stress distribution diagram of a corrugated steel plate and a concrete composite slab.
Considering the internal force, the balance conditions of the section are obtained:
The stress distribution diagram of a flat steel–concrete composite beam is shown in Figure 32.
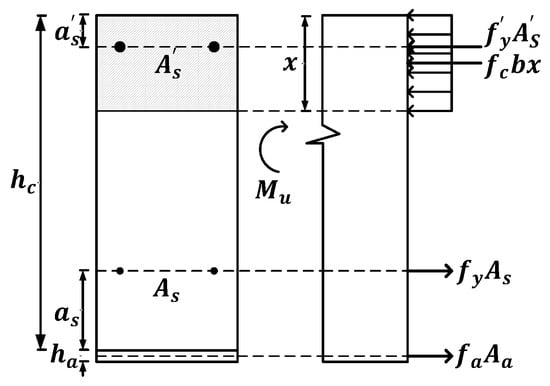
Figure 32.
Stress distribution diagram of a flat steel–concrete composite beam.
From the internal force, the balance conditions of the section are obtained:
The applicable conditions are x ≤ hc and x ≤ ξbh0. Mu is the ultimate bearing capacity of the composite slab under ideal conditions; α1 is a coefficient whose value is specified in Code for Design of Concrete Structures; ξb is the relative limit of the height of the compression zone, calculated according to the CDCS; fc is the design value of the concrete compressive strength; b is the calculation span of the composite slab; x stands for the composite slab section to calculate the height of the compression zone; h0 is the effective height of the composite slab; hc is the height of concrete; ha is the thickness of the steel plate; As is the section area of the longitudinal tensile rebar; is the section area of longitudinal compression reinforcement; fy is the design value of the tensile strength of rebar; Aa is the cross-sectional area of the corrugated steel plate in the calculated span b; and fa is the design value of the tensile strength of corrugated steel plate.
Interface slip is a phenomenon that cannot be ignored in composite structures [40,41]. The number of studs and friction coefficient are the key parameters determining the sliding behavior of the steel–mixture interface. The bearing capacity of composite beams and composite slabs in the parameter analysis was calculated above under ideal conditions without considering slip but taking into account the action of the studs and the coefficient of friction. The results are shown in Figure 33 and Figure 34. Mu is the ultimate bearing capacity of composite slabs/beams under ideal conditions, Ma is the ultimate bearing capacity calculated by finite element method, and MEu is the ultimate bearing capacity of the partial connection composite slabs/beams according to Eurocode 4 [42]. Mud is the ultimate bending bearing capacity of composite slabs/beams considering the action of the studs, and Muf is the ultimate flexural capacity of the composite slab/beam considering the coefficient of friction.
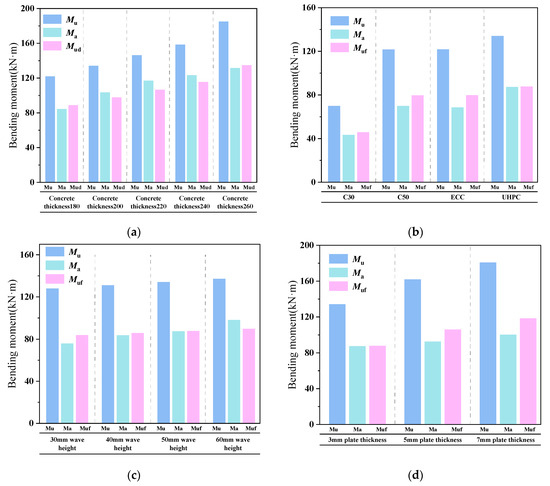
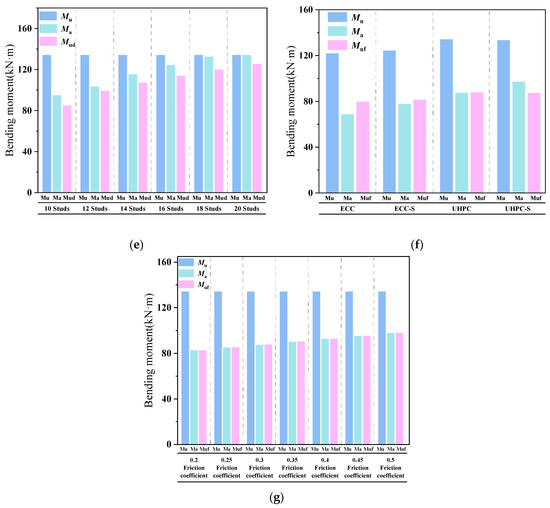
Figure 33.
Comparison of bearing capacity values considering various parameters between the corrugated plate and the concrete composite slab. (a) Bearing capacity for different concrete thicknesses; (b) bearing capacity for different concrete types; (c) bearing capacity for different wave heights of corrugated plates; (d) bearing capacity for different plate thicknesses; (e) bearing capacity for different stud numbers; (f) bearing capacity with/without rebar; (g) bearing capacity for different friction coefficients.
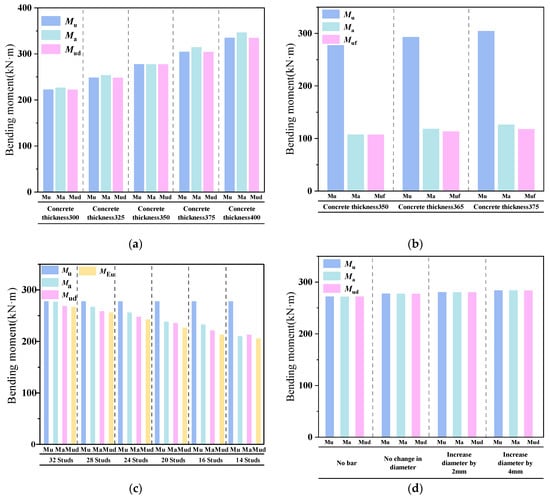
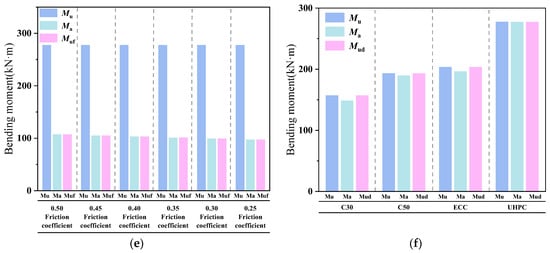
Figure 34.
Comparison of bearing capacity values for various parameters of flat steel–concrete composite beams. (a) Bearing capacity for different concrete thicknesses (with studs); (b) bearing capacity for different concrete thicknesses (without studs); (c) bearing capacity for different stud numbers; (d) bearing capacity for different rebar diameters; (e) bearing capacity for different friction coefficients; (f) bearing capacity for different concrete types.
The predicted values of bearing capacity are high when the slip is not considered. Therefore, the effect of the number of bolts and friction coefficient on the ultimate bearing capacity of the composite slab was considered based on the standard calculation method and the finite element simulation results, and the reduction coefficient of flexural bearing capacity was proposed. For the composite slab of the corrugated steel plate and concrete, the finite element results of groups 1–6 and 7–13 were used for fitting, while the finite element results of groups 6, 10–16, and 20–24 were used for fitting the data of the composite beam of the flat steel plate and concrete, as shown in Figure 35, Figure 36, Figure 37 and Figure 38. The following assumptions were made: (1) Both reinforcement and concrete are linear elastic materials before reaching yield strength; (2) The rebar is completely bonded to the surrounding concrete without relative sliding; and (3) During the stress process, the section of the component remains flat. The equations for calculating the flexural capacity of a wave (CP)/plain grain (FP) steel–concrete composite structure considering the stud action and friction coefficient are given as follows:
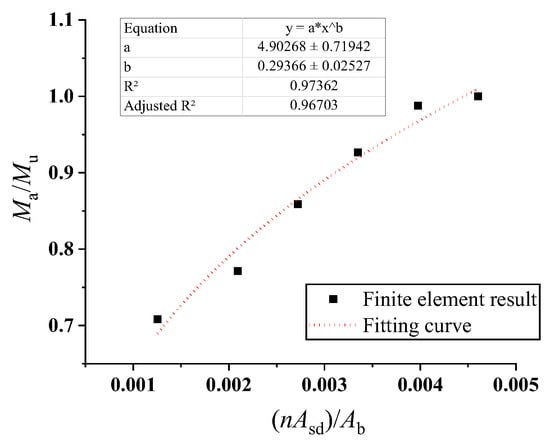
Figure 35.
Reduction coefficient of the flexural bearing capacity of a corrugated steel plate and a concrete composite slab considering the stud action.
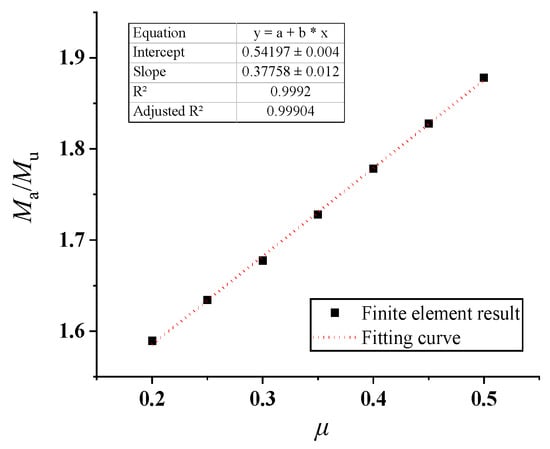
Figure 36.
Reduction coefficient of flexural bearing capacity of a corrugated steel plate and a concrete composite slab considering friction coefficient.
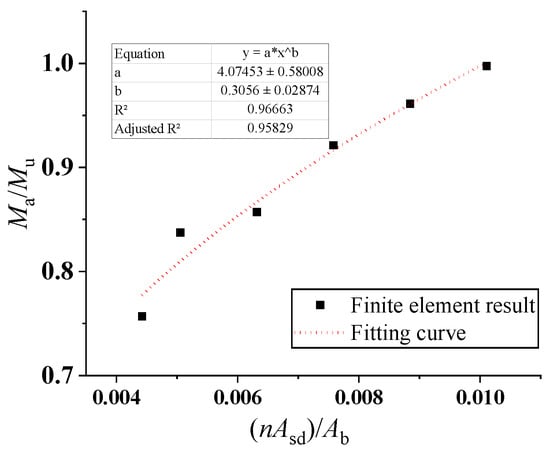
Figure 37.
Reduction coefficient of the flexural bearing capacity of flat steel–concrete composite beams considering the stud action.
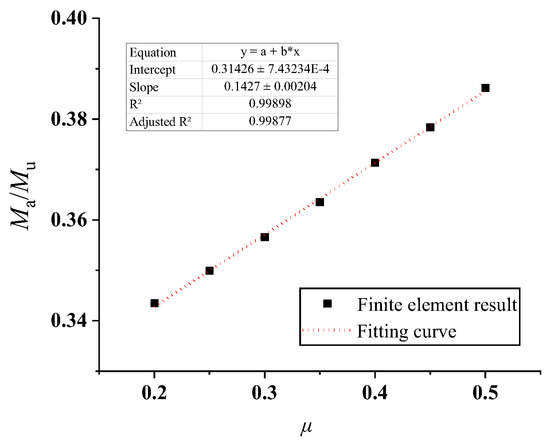
Figure 38.
Reduction coefficient of the flexural bearing capacity of flat steel–concrete composite beams considering friction coefficient.
n is the number of studs in the composite structure; Asd is the cross-sectional area of the stud (Asd = πd2/4, and d is the stud diameter); Ab is the cross-sectional area of the composite structure (length × width of the composite structure); and μ is the friction coefficient of the steel–concrete interface.
Figure 33 and Figure 34 compare the finite element results (Ma) and calculation results (Mud, Muf) of the corrugated steel–concrete composite slabs and flat steel–concrete composite beams, respectively, demonstrating good agreement. It can be observed that the partial connection method given in Eurocode 4 can reflect the effect of the stud number on the bending moment capacity. The partial connection method given in Eurocode 4 is not applicable to the cases in which no studs were adopted. In addition, the proposed method has more accuracy. However, the proposed equations are based on the specification and finite element results, and the equations are proposed under ideal conditions. The parameter verification range is limited. In practical application, the equations should be modified according to specific conditions such as the variability of material characteristics, the development and control of cracks, and the nonlinear behavior of materials.
6. Conclusions
In this paper, the influence of multiple parameters on the flexural bearing capacity of steel–HPC composite slabs and beams was studied using numerical simulations. Based on the analysis of a sufficient number of parameters, the flexural bearing capacity formula of the steel–HPC composite slab/beam was obtained by data fitting, considering the influence of the stud action and interface friction coefficient. The effects of the wave height of a corrugated steel plate, steel plate thickness, concrete thickness, reinforcement, rebar diameter, number of studs, friction coefficient between steel and concrete, the strength grade of concrete, and type of concrete on the flexural bearing capacity of composite slab/beams were analyzed. The main conclusions are summarized as follows:
- (1)
- The flexural behavior of composite slabs/beams consisting of steel and high-performance concrete was studied by finite element analysis. Applying the existing modeling method, we established an analysis model and compared it with the load–displacement curves and failure modes of specimens reported in the related literature. The error was within a reasonable range, proving the accuracy and reliability of the proposed finite element model;
- (2)
- The mechanical properties of the corrugated steel–concrete composite slab and the flat steel–concrete composite beam were similar. For example, with the increase in the concrete thickness and friction coefficient, the load-bearing capacity of the composite slab/beam increased. Increasing the steel plate thickness and the number of studs improved the bearing capacity of the composite slab/beam, but an excessively thick steel plate or too many studs led to super-reinforcement, which was not conducive to reaching the optimal mechanical performance of the composite structure. The concrete type significantly influenced the bearing capacity of composite slabs/beams. Compared with C30 concrete, C50, ECC, and UHPC concrete types greatly improved the ultimate bearing capacity and ductility of the composite structures due to their excellent mechanical properties, especially for UHPC with its high compressive and tensile strength and excellent toughness. The composite structures maintained a high bearing capacity after reaching the limit state. For the corrugated steel plate and concrete composite slab, the structural bearing capacity could be enhanced by increasing the wave height of the corrugated steel plate and optimizing the rebar configuration; remarkably, changing the rebar diameter exhibited no obvious effect on the structural bearing capacity of the flat steel–concrete composite beam;
- (3)
- A formula for calculating the ultimate bearing capacity of steel–concrete composite slab/beam structures, considering the effects of the stud action and friction coefficient, was presented, and its rationality was verified by the finite element results. The proposed calculation formula provided a more accurate method for designing steel–concrete composite structures, which can help optimize the structural design and improve structural performance;
- (4)
- The research of this paper provides the application value of steel–HPC composite structures in various engineering fields. For example, in foundation pit engineering, the composite structure can withstand soil side pressure more effectively and ensure the safety of foundation pits. In the prefabricated foundation pit support, the prefabricated corrugated steel plate or flat steel plate is connected to the concrete with insufficient shear force, and the method in this paper can provide a reference for the calculation of this kind of composite structure.
In this paper, the bond–slip performance between the concrete and steel bars was not considered in the finite element modeling process, which deviated from the actual situation. The effects of the bond–slip performance between the rebar and concrete will be further studied in the future.
Author Contributions
Writing—original draft preparation, investigation, validation and visualization, J.-P.L. and L.-Y.Z.; methodology, supervision and writing—review and editing, Y.-J.Z.; writing—review and editing, funding acquisition and resources, G.Z., F.-Z.L. and T.Z. All authors have read and agreed to the published version of the manuscript.
Funding
The authors gratefully acknowledge the financial support provided by the National Natural Science Foundation of China (Grant No. 52108103), the Yuxiu Innovation Project of NCUT (Project No. 2024NCUTYXCX112), and R&D Program of Beijing Municipal Education Commission (Grant No. KM202210009007).
Data Availability Statement
The original contributions presented in the study are included in the article; further inquiries can be directed to the corresponding author.
Conflicts of Interest
Authors Guo Zhao, Fu-Zhong Liu and Tao Zhang were employed by the company Shandong Provincial Communications Planning and Design Institute Group Co., Ltd. The remaining authors declare that the research was conducted in the absence of any commercial or financial relationships that could be construed as a potential conflict of interest.
References
- Patil, S.; Pujari, A.; Undre, A.; Jadhav, V. Seismic evaluation of existing reinforced cement concrete building and steel–concrete composite building. Asian J. Civ. Eng. 2024, 25, 4133–4140. [Google Scholar] [CrossRef]
- Aghdam, P.; Parent, S.; Roy, N. A Review of Structural Behavior and Composite Action Between the Steel Beams and Concrete Slabs. In Proceedings of the Canadian Society of Civil Engineering Annual Conference, Whistler, BC, Canada, 25–28 May 2022; pp. 497–517. [Google Scholar] [CrossRef]
- Tong, L.; Chen, L.; Wen, M.; Xu, C. Static behavior of stud shear connectors in high-strength-steel–UHPC composite beams. Eng. Struct. 2020, 218, 110827. [Google Scholar] [CrossRef]
- Zhuang, L.; Tao, M.-X.; Zhao, J.-Z.; Yang, K.-Y. Experimental and numerical investigations on the mechanical behaviour of large-span circular steel-concrete composite slabs for wind power tower. Thin-Walled Struct. 2024, 202, 112107. [Google Scholar] [CrossRef]
- Wang, Y.; Khan, M.; Uy, B.; Katwal, U.; Tao, Z.; Thai, H.-T.; Ngo, T. Long-term performance of steel-concrete composite wall panels under axial compression. Structures 2024, 64, 106606. [Google Scholar] [CrossRef]
- Zha, S.; Deng, W.; Liu, D.; Jiandong, Z.; Gu, J. Experimental study on flexural behavior of steel-laminated concrete (NC and UHPC) composite beams with corrugated steel webs. Eng. Struct. 2024, 306, 117802. [Google Scholar] [CrossRef]
- John, K.; Ashraf, M.; Weiss, M.; Al-Ameri, R. Experimental study and numerical modelling of a novel two-way steel-concrete composite slab. Structures 2023, 57, 105096. [Google Scholar] [CrossRef]
- Kang, X.; You, Q.; Li, G.; Shen, H. Construction Technology Innovation of Light-Weight Steel-Concrete Composite Cable-Stayed Bridge. In Proceedings of the International Conference on Green Building, Civil Engineering and Smart City, Guilin, China, 8–10 April 2022; pp. 455–464. [Google Scholar] [CrossRef]
- Xiong, L.; Li, S.; Jiang, K.; He, J.; Kong, F. Development and assessment of sustainable steel-concrete composite beams with novel demountable shear connections. Soil. Dyn. Earthq. Eng. 2024, 180, 108606. [Google Scholar] [CrossRef]
- Liu, R.; Yang, Y. Research on fatigue performance of steel-plate-concrete composite slab. Thin-Walled Struct. 2021, 160, 107339. [Google Scholar] [CrossRef]
- Shi, C.; He, W. Comparative study on flexural properties of ultra-high performance concrete with supplementary cementitious materials under different curing regimes. Constr. Build. Mater. 2017, 136, 307–313. [Google Scholar] [CrossRef]
- Shaikh, F.; Luhar, S.; Arel, H.; Luhar, I. Performance evaluation of Ultrahigh performance fibre reinforced concrete—A review. Constr. Build. Mater. 2020, 232, 117152. [Google Scholar] [CrossRef]
- Qi, R.; Wu, H.; Qi, Y.; Tang, H. Investigation of Mechanical Properties of High-Performance Concrete via Multi-method of Regression Tree Approach. Mater. Today Commun. 2024, 40, 109922. [Google Scholar] [CrossRef]
- Bian, Z.; Zhang, L.; Peng, C.; Zhou, Z.; Shen, H. Experimental study on hybrid fiber reinforced high performance concrete properties: Investigatingcomprehensive energy consumption capacity. Constr. Build. Mater. 2024, 443, 137682. [Google Scholar] [CrossRef]
- Fan, J.; Gou, S.; Ding, R.; Zhang, J.; Shi, Z. Experimental and analytical research on the flexural behaviour of steel–ECC composite beams under negative bending moments. Eng. Struct. 2020, 210, 110309. [Google Scholar] [CrossRef]
- Hamoda, A.; Hossain, K.; Sennah, K.; Shoukry, M.; Mahmoud, Z. Behaviour of composite high performance concrete slab on steel I-beams subjected to static hogging moment. Eng. Struct. 2017, 140, 51–65. [Google Scholar] [CrossRef]
- Wang, H.; Sun, T.; Tang, C.; Wang, J. Experimental and numerical investigation of steel–ultra-high-performance c-oncrete continuous composite beam behavior. Adv. Struct. Eng. 2020, 23, 2220–2236. [Google Scholar] [CrossRef]
- Du, H.; Yuan, S.; Yu, T.; Hu, X. Experimental and Analytical Investigation on Flexural Behavior of High-Strength Steel-Concrete Composite Beams. Buildings 2023, 13, 902. [Google Scholar] [CrossRef]
- Wu, Y.; Pan, W.H.; Luo, Y. Economical Design Comparison of Large-Span Composite Floor Systems with I Beams and Corrugated Web Beams. Buildings 2023, 13, 1940. [Google Scholar] [CrossRef]
- Zhang, J.-L.; Liu, B.-D.; Liu, R. Behavior of sinusoidal-corrugated-steel-plate–concrete composite slabs: Experimental investigation and theoretical model development. J. Constr. Steel Res. 2021, 187, 106958. [Google Scholar] [CrossRef]
- John, K.; Ashraf, M.; Weiss, M.; Al-Ameri, R. Parametric finite element study of novel corrugated steel deck for two-way action in steel-concrete composite floors. Structures 2022, 44, 1152–1167. [Google Scholar] [CrossRef]
- Du, H.; Hu, X.; Shi, D.; Xue, W. Flexural Performance of Composite Beams Using High-Strength Steel and High-Strength Concrete. Int. J. Steel Struct. 2021, 22, 27–41. [Google Scholar] [CrossRef]
- Chen, Z.; Wang, S.; Zeng, Z.; Li, C. An Experimental Study on the Flexural Performance of a Steel-ECC Composite Bridge Deck Sheet in the Negative Moment Zone. Appl. Sci. 2023, 13, 3777. [Google Scholar] [CrossRef]
- You, W.; Bradford, M.; Liu, H.; Zhao, W.; Yang, G. Steel-alkali activated cement based ultra-high performance concrete lightweight composite bridge decks: Flexural behavior. Eng. Struct. 2022, 266, 114639. [Google Scholar] [CrossRef]
- Zhang, D.; Ma, X.; Shen, H.; Guo, S.; Liu, C. Analysis of Structural Parameters of Steel–NC–UHPC Composite Beams. Materials 2023, 16, 5586. [Google Scholar] [CrossRef] [PubMed]
- Liu, M. Practices and prospects of steel-concrete composite technology in bridge engineering. Bridge Constr. 2022, 52, 18–25. [Google Scholar]
- Yan, X. The Mechanical Properties of Corrugated Steel-Concrete Composite Structures and Application in Tunnels. Master’s Thesis, Soochow University, Suzhou, China, 2019. (In Chinese). [Google Scholar]
- Huang, Y.; Zhao, H.; Tu, L. Tset and finite element analysis on flexural properties of steel plate-UHPC composite beam. J. China Foreign Highwa 2023, 43, 69–76. (In Chinese) [Google Scholar] [CrossRef]
- Han, L. Study on Bending Fatigue Properties of ECC and Its Composite Plates. Master’s Thesis, Shandong University, Jinan, China, 2021. (In Chinese). [Google Scholar]
- Ministry of Housing and Urban-Rural Development of the People’s Republic of China. Code for Design of Concrete Structures: GB 50010-2010; China Standard Press: Beijing, China, 2015; (In Chinese).
- Yuan, F.; Pan, J.; Leung, C. Flexural Behaviors of ECC and Concrete/ECC Composite Beams Reinforced with Basalt Fiber-Reinforced Polymer. J. Compos. Constr. 2013, 17, 591–602. [Google Scholar] [CrossRef]
- Zhang, Z.; Shao, X.D.; Li, W.; Zhu, P.; Chen, H. Axial tensile behavior test of ultra high performance concrete. China J. Highw. Transp. 2015, 28, 50–58. (In Chinese) [Google Scholar]
- Ding, F.; Ni, M.; Gong, Y.; Yu, Z.; Zhou, Z.; Zhou, L. Experimental study on slip behavior and calculation of shear bearing capacity for shear stud connectors. Jianzhu Jiegou Xuebao/J. Build. Struct. 2014, 35, 98–106. (In Chinese) [Google Scholar] [CrossRef]
- Cao, J. Research on Basic Performance of Steel-Thin UHPC Lightweight Composite Deck. Ph.D. Thesis, Hunan University, Changsha, China, 2016. (In Chinese). [Google Scholar]
- Hai, R.; Ma, Z.; Chen, X.; Cao, Y.; Zhang, J.; Hui, C. Experimental and numerical investigations on the bond-slip behavior of the interface between geopolymer concrete and steel tube. Sci. Rep. 2024, 14, 28480. [Google Scholar] [CrossRef] [PubMed]
- Haghighi, H.; Urgessa, G. Finite Element Analysis of Pre-Stressed Ultra High-Performance Concrete (UHPC) Girders. Eng 2024, 5, 2362–2378. [Google Scholar] [CrossRef]
- Yang, Y.; Huang, W.; Geng, J.; Cui, T.; Yan, M. UHPC mix design method based on semi-experience. Mater. Rep. 2021, 35, 188–193. (In Chinese) [Google Scholar]
- Zhang, H.-P. Research on Mechanical Properties of Highly Ductility Concrete (ECC) and Reinforced Tunnels. Master’s Thesis, Chongqing Jiaotong University, Chongqing, China, 2024. (In Chinese) [Google Scholar] [CrossRef]
- China Association for Engineering Construction Standardization. Code for Composite Slabs Design and Constructio-n: CECS273-2010; China Planning Press: Beijing, China, 2010. (In Chinese) [Google Scholar]
- He, S.; Xu, Y.; Zhong, H.; Chen, Z. Investigation on interfacial anti-sliding behavior of high strength steel-UHPC composite beams. Compos. Struct. 2023, 316, 117036. [Google Scholar] [CrossRef]
- Zhang, Y.; Wang, H.; Qin, Y.; Huang, S.; Fan, W. Experimental and analytical studies on the flexural behavior of steel plate-UHPC composite strengthened RC beams. Eng. Struct. 2023, 283, 115834. [Google Scholar] [CrossRef]
- Anderson, D. Eurocode 4-Design of Composite Steel and Concrete Structures; Springer: Berlin/Heidelberg, Germany, 1994. [Google Scholar]
Disclaimer/Publisher’s Note: The statements, opinions and data contained in all publications are solely those of the individual author(s) and contributor(s) and not of MDPI and/or the editor(s). MDPI and/or the editor(s) disclaim responsibility for any injury to people or property resulting from any ideas, methods, instructions or products referred to in the content. |
© 2024 by the authors. Licensee MDPI, Basel, Switzerland. This article is an open access article distributed under the terms and conditions of the Creative Commons Attribution (CC BY) license (https://creativecommons.org/licenses/by/4.0/).