Abstract
The growing generation of solid waste, driven by urbanization and industrialization, represents one of today’s greatest environmental challenges. The construction industry can play a key role in this scenario by incorporating recycling and waste reuse practices. Glass, a fully recyclable material, is still largely disposed of in landfills. A promising alternative is the use of ground glass in cementitious materials, partially or completely replacing cement or aggregates. Thus, in this paper, the effect of partially replacing Portland cement with ground glass of different colors including green, blue, transparent, amber, and colorful (all colors used mixed) in proportions of 15 and 35% in mortars was evaluated. The ground glasses were characterized by laser granulometry and chemical analysis. The properties of the mortars were then evaluated in the fresh and hardened state (apparent specific gravity, mechanical strength, water absorption, and open porosity). Regarding workability, the highest improvement observed was 6.8% for the 35% colored glass series compared to the reference series. In terms of entrapped air, there was an increase of up to 18.8% in the 35% green glass series. At 28 days of hydration, the 15% colored glass series obtained a 33% increase in flexural strength compared to the REF series. In the microstructure, it was found that a 15% glass presence was sufficient to reduce the portlandite index from 16.04 to 13.53, while a 35% glass presence was sufficient to reduce it to 7.51% portlandite, equivalent to a 54% reduction, suggesting significant potential for the reaction of the finer glass fractions with portlandite. This study suggests that the use of glass waste in a cementitious matrix can provide an environmentally appropriate alternative for recycling this material, contributing to a sustainable application and increased recycling rates of glass waste.
1. Introduction
Solid waste generation has become one of the most urgent global environmental problems, driven by rapid urbanization, industrialization, and population growth. Currently, the world produces more than 2.1 billion tons of municipal waste annually, and this volume is estimated to exceed 3.8 billion tons by 2050 if effective mitigation strategies are not adopted [1]. Despite advances in recycling technologies and increasing environmental awareness, about 70% of the waste generated globally is still sent to landfills or disposed of inappropriately, especially in developing countries [2]. This inefficient management results in environmental degradation, depletion of natural resources, and increased greenhouse gas emissions. In this context, the construction industry stands out as one of the economic activities that consumes the most resources and generates waste, playing a central role in sustainability debates. Considering this scenario, the Federal Government of Brazil implemented, in August 2010, Law No. 12,305 [3], which instituted the National Solid Waste Policy (PNRS), with the main objective of promoting “increased recycling and reuse of solid waste”.
Reusing solid waste as raw material to produce other products is an environmentally friendly solution. It has an impact on reducing the volume of waste that would otherwise be discarded irregularly. In this sense, the various productive means of the construction sector can help by recycling and reusing the waste it produces and waste from other sources [4,5].
Glass is a material that can be completely recycled without any loss. However, for recycling to be effective, a logistics structure must be in place to collect and clean this waste. Because of the inefficiency of this structure, mainly in developing countries, it is estimated that around 60% of glass waste is disposed of in landfills [6]. There is also an economic factor that discourages glass reuse due to the reverse logistics since the cost of glass is high compared to other recyclable materials. Furthermore, glass is a naturally abundant raw material and can be easily extracted at a low cost [7].
Even so, reusing glass is worthwhile, as it is worth noting that glass can be recycled in its entirety and in countless cycles, without any material being wasted. Brazil produces approximately 8.6 billion glass annually. Of this amount, only 25% is reused. Studies indicate that for every 6 tons of glass recycled in the production of new glass, approximately 1 ton of carbon dioxide (CO2) is saved from being emitted into the environment [8]. Also, compared to 2019, it is estimated that by 2050, Brazil will increase the amount of waste generated by practically 50%, while the world average will be around 70%.
One way to increase the consumption and reuse of glass waste is to use it as a total or partial constituent of cementitious matrix composites, as studies have already evaluated the potential of glass powders in cementitious composites as a replacement for cement, aggregate, or supplementary cementitious materials [9,10,11,12,13,14].
Finely ground glass is an amorphous material. When incorporated into a cement matrix, as it is basically composed of silica, it is considered a pozzolanic material; the silica reacts with calcium hydroxide (Ca(OH)2), which is released during the cement hydration process, to form hydrated calcium silicate (C-S-H). In also functions as a filler material, refining the pores and densifying the cement matrix [15,16,17].
Partial replacement of Portland cement with ground glass can, in some cases, improve workability (increased flow) due to the non-absorbent nature of the glass (which increases the amount of free water in the mix) and the smooth surface of the particles [15,18,19]. For example, the use of ground-glass powder with an average particle size of 45 µm led to a marginal increase in concrete workability [20]. However, when larger or angular particles are used, workability tends to be reduced, as these characteristics hinder paste flow [10,21].
Glass powder also influences the setting behavior of cementitious materials. In general, an acceleration is observed at the beginning and end of setting, attributed both to the reactivity of the alumina (Al2O3) present in the ground glass and to the nucleation effect of the fine particles, which provide preferential sites for the precipitation of hydration products [15,20].
Regarding performance in the hardened state, the improvements provided by glass incorporation become more evident at advanced ages due to the slow nature of the pozzolanic reaction. At early ages (7 and 28 days), the compressive strength tends to be slightly lower than that of the reference sample due to the dilution effect of the cement. However, at later ages (56 and 90 days), strength can equal or even exceed that of the reference sample due to the pozzolanic reaction and the consequent microstructural densification [10,15,22].
The influence of glass color on the properties of the final material still lacks consensus in the literature. Some authors suggest that coloration may play a relevant role in material reactivity, although the exact mechanisms still require further investigation [10]. Several studies have observed greater pozzolanic reactivity associated with the use of green glass [10,23,24]. This behavior may be related to the elements responsible for the coloration and the structural differences between the glass types [23].
Similarly, other studies have reported that green and white glass resulted in higher strengths at 28 days when compared to amber glass [23,25]. These performance variations may result from the participation of coloring elements in chemical reactions, as well as from structural differences between different types of glass [10].
The detailed chemical composition of colored glasses—such as amber, brown, transparent, and green—reveals variations in components such as Fe2O3 and Cr2O3, the latter being particularly high in green glass [10]. Although the overall chemical composition of colored glasses may be similar, their structure tends to differ depending on the role each chemical element plays, whether as a glass network builder, modifier, or intermediary [26].
Belouadah et al. [27] evaluated the influence of transparent glass powder together with marble powder on the characteristics of cementitious composites. Although there is no indication of the specific water/cement, water/binder, or water/powder ratios of the composites, the authors tested pastes and mortars with up to 5 or 10% glass powder and found that there was an increase in compressive strength at 2, 7, 14, and 28 days compared to the reference series. They also found that higher levels of non-cementing powders in the samples resulted in a loss of mechanical performance. There was also a reduction in shrinkage after 28 days in samples with glass powder due to the lower amount of cement in the samples. In this case, the cement is the primary reactant in the mixture and is responsible for shrinkage.
Du and Tan [28] evaluated the influence of transparent glass powders on concrete, where glass powders replaced cement at levels ranging from 15% to 60%. It was found that the greater the presence of glass in the mixture was, the lower the calcium hydroxide content in the cement paste due to the potential reaction of part of the silica with portlandite favoring secondary hydration. Regarding mechanical strength, it was found that at 7 and 28 days of hydration, there was no trend in the behavior of the samples so that the reference presented higher strength and lower strength, respectively. At 365 days, all samples with the presence of glass powder presented higher compressive strength than did the reference, where mixtures with 15 and 30% glass showed an increase of approximately 27%. Similar behavior was found by Elaqra et al. [11], who reported that samples with up to 30% glass powder in the concrete showed lower compressive strength values at up to 28 days of hydration, but at 90 days, values were higher than the reference, demonstrating the potential use of glass in cementitious composites.
Deng et al. [29] evaluated engineered cementitious composites and fibers, samples with up to 20% transparent glass powder were studied, and it was found that the greater the amount of glass in the sample was, the lower the mechanical performance. However, when associated with 60% fly ash, the results tended to improve, showing comparable results.
One of the primary concerns associated with adding glass powder to a cementitious matrix is its potential impact on the durability of the composite. Thus, Siad et al. [30] evaluated concrete structures with the presence of glass in a field situation at prolonged ages. Samples with up to 20% glass powder were evaluated, and it was found that the glass powder improves the microstructure of the matrix, improving the durability potential. There was an improvement in the mechanical properties derived from the pozzolanic reaction of glass powder with portlandite, and there was less penetration of chlorides in samples with the presence of glass powder.
Therefore, it is necessary to study the behavior of ground glass added to cement mortar as a partial replacement for Portland cement given that the cement industry is considered one of the largest emitters of CO2, contributing to approximately 10% of global emissions. Furthermore, it consumes a significant amount of natural resources, from extraction to the production of Portland cement. To mitigate these negative impacts, additions of construction waste are being used, with the aim of replacing part of the cement used in the mixture without compromising the mechanical properties of the mortar [31].
Although there is great interest in the evaluation, study, and development of cementitious composites using glass waste or powder, studies are normally based on transparent glasses. Although there are studies related to the use of colorful glass in cement matrix [25,26,32,33], there is a limitation in the use of colorful glasses or even comparing the colors of the glasses, and few studies have been presented on this specific topic. From this perspective, the present work aims to evaluate the effect of partially replacing (15% and 35% by volume) cement with ground glass in different colors (green, blue, transparent, amber, and colorful) in mortars and to contrast the results obtained in physical and mechanical properties with the reference mortar in the fresh and hardened states at 28, 90, and 365 days.
2. Materials and Methods
2.1. Materials
In this research, a high-initial-strength Portland cement (CP V-ARI, equivalent to the Type III by ASTM C150) was used, which is a material with greater purity due to the absence of additions such as pozzolans and slag (NBR 16,697 [34] similar to an ASTM C150 [35]), which allows for the pozzolanic effect of ground-glass residue to be evaluated. The granulometric distribution of the cement was obtained using the Bettersize/S3 Plus laser particle analyzer (Bettersize Instruments, Dandong, China) with a liquid dispersion system, in which ethyl alcohol was used (Figure 1). Its specific gravity is 3.11 g/cm3, as defined by industry specifications. Table 1 shows the chemical composition, and Table 2 provides an estimate of the mineral composition of cement clinker calculated according to the Bogue formula (ASTM C150 [35]).
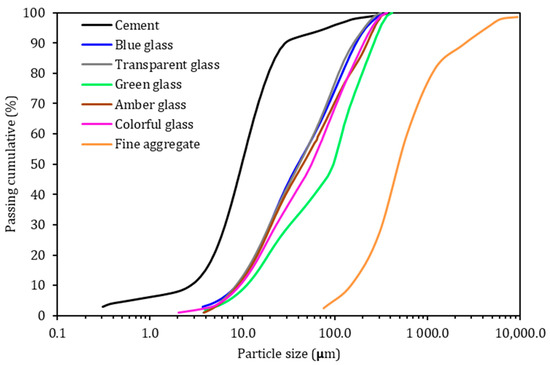
Figure 1.
Particle size distribution of cement and crushed glass waste.

Table 1.
Chemical composition of glass and cement.
Table 2.
Mineralogical composition of the Portland cement used.
The transparent soda-lime glass waste was obtained from a plant processing recyclable construction material. For the other glass colors, long-neck bottles were used and were collected from a recycling plant. All glass bottles were cleaned before use, the label removed, and the inside washed. Table 1 shows the chemical composition of the different colors of glass used, determined by XRF (model: EDX720/800HS, SHIMADZU, Tokyo, Japan). The specific mass of the ground glass was 2.44 g/cm3. Figure 1 shows the granulometric distribution of the glass waste. The D50 (average diameter of the particles) of the ground-glass waste was 97, 45, 41, and 40 µm for the colors green, amber, transparent, and blue, respectively. It is worth mentioning that the average diameter of the cement is 10 µm. To compose the colorful glass sample, 25% of each color (blue, transparent, green, and amber) was mixed.
Images were taken at 20× magnification using an Olympus Model BX51 microscope (Olympus Corporation, Tokyo, Japan), with 100W Halogen transmitted and reflected light and a maximum sample height of 25 mm. A 3.3-megapixel, 2048 × 1532-pixel SC30 color camera, and Stream Essentials software (version 2.4.2) were used. The images show that the samples had a smooth surface and were composed primarily of rounded grains, with a few lamellar grains (Figure 2).
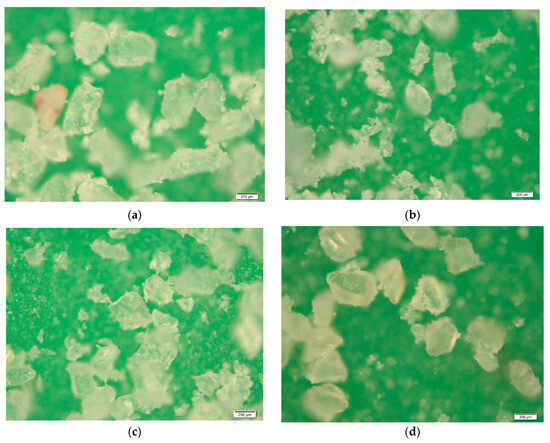
Figure 2.
Microscope images at 20× magnification. (a) Transparent glass, (b) blue glass, (c) green glass, and (d) amber glass.
Each color of glass was ground separately. The glasses were first ground in a ball mill at a grinding speed of 60 rpm to reduce the initial size. For this, steel balls with diameters of 30 mm and 20 mm were used with a grinding time of 5 min. Afterward, the glasses were placed in a pan mill (AMP1-M, AMEF, São Paulo, Brazil) at 1120 rpm for 60 s. After the initial 60 s grinding, the ground glass was sieved through a 0.3 mm sieve, and all the retained glass was ground again for another 60 s, with the process being repeated until all the glass passed through this sieve (Figure 3).
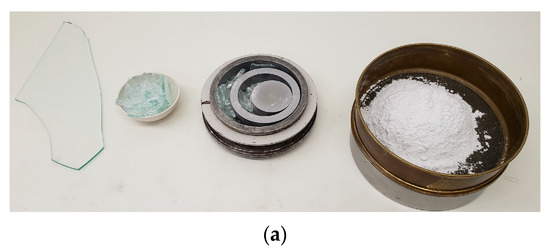
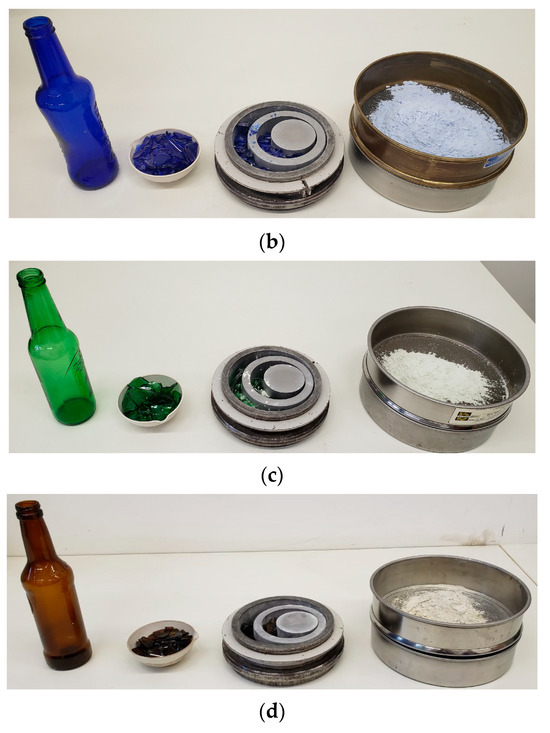
Figure 3.
Glass grinding process. (a) Transparent glass, (b) blue glass, (c) green glass, and (d) amber glass.
For the mortars production, quartz sand was used. This sand presents a maximum characteristic dimension of 4.8 mm and a fineness modulus of 2.38, classified as medium-fine sand (Figure 1). The specific gravity of the sand was 2.57 g/cm3.
2.2. Methods
Figure 4 shows the scheme of the steps of the experimental program.
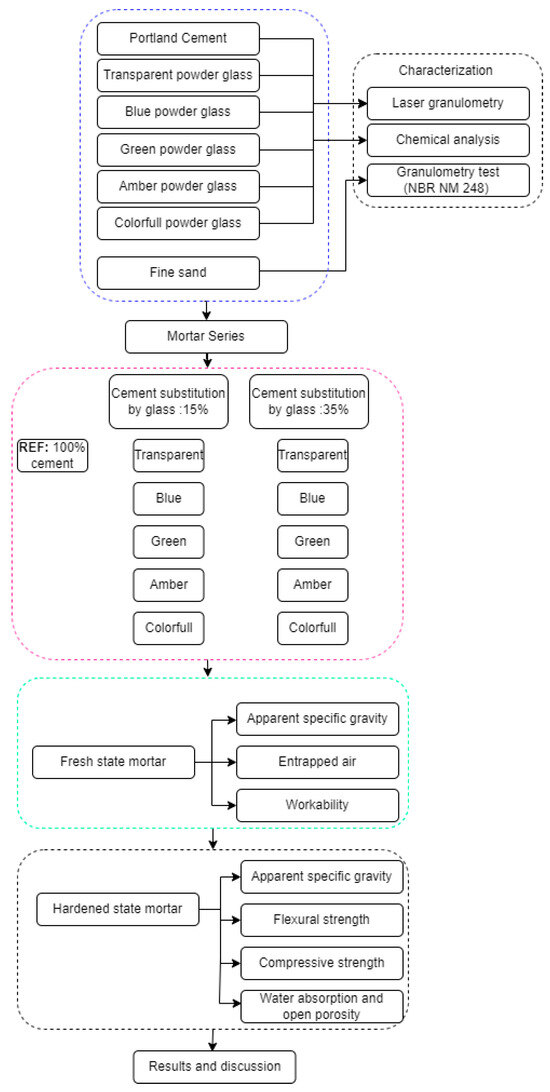
Figure 4.
Experimental program. The boxes within the blue dashed lines refer to the material characterization stage. The boxes within the pink dashed lines refer to the different compositions tested. The boxes within the green dashed lines refer to the characterization stage of the composites in the fresh state. The boxes within the black dashed lines refer to the characterization stage of the composites in the hardened state.
The mortars were prepared based on the composition 1:3:0.7 (cement–fine aggregate–water) in volume. In this study, mortars were produced with glass waste with different colors and 15 or 35% partial replacement, in volume, of Portland cement with five glass type, as shown in Table 3. The selection of the 15 and 35% contents was based on previous studies that demonstrated the ability of the cementitious matrix to support glass additions greater than 20% [15], thus allowing for the analysis of the composite’s performance in ranges below and above this limit. Table 4 shows the composition of the mortars in kilograms per cubic meter.
Table 3.
Cementitious mortar composition.
Table 4.
Composition of mortars in kilograms per cubic meter.
The mortar named "REF: is the reference mortar, composed only of Portland cement, sand, and water. Mortars with 15 and 35% replacement of Portland cement with ground glass were named by the color and percentage of glass used. In colorful glass, all glass colors were mixed in equal parts (25% green glass powder, 25% blue glass powder, 25% transparent glass powder, and 25% amber glass powder).
The mixtures of the mortars were prepared in a 5 L capacity vessel and a 280 rpm vertical axis mechanical mixer. The mixture procedure took 5 min, and at the end of mixing, the fresh properties of the mortars were measured. The tests included entrapped air (NBR 13278 [36], similar to ASTM C185 [37]) and workability index in terms of spread on the table (NBR 13276 [38], similar to ASTM C1437 [39]).
Then, the 40 × 40 × 160 mm specimens (according to NBR 13279 [40], similar to ASTM C348 [41] and ASTM C349 [42]) were molded for the measurement of flexural strength, which involved a three-point flexural test (three specimens for each series were used). After breaking, the two halves (40 × 40 mm) were generated, and they were tested for compressive strength (six specimens for each series were used). The mechanical strength tests were conducted at cement hydration times of 28, 90, and 365 days of cement hydration. The mechanical tests were performed on the EMIC universal hydraulic press, model DL30.000 (Brazil), with a capacity of 300 kN. The flexural strength test was carried out with a controlled load speed of 50 N/s and the compressive strength test with a controlled speed of 500 N/s. Cylindrical specimens of 50 mm in diameter × 100 mm in height were also molded for the water absorption by immersion and void index tests (according to NBR 9778 [43], similar to C642 [44]) (three specimens for each series were used). The specimens were kept in a humid chamber with a temperature of 25 ± 3 °C and with a controlled relative humidity of 95 ± 5% until the tests. The absorption tests determined by the immersion and void index were conducted after 28 days of cement hydration of the samples.
The immersion water absorption test was performed by submerging the samples (oven-dried at 100 ± 5 °C) in water at a temperature of 23 ± 2 °C for 72 h. The samples were then placed in a thermal bath, where they were gradually brought to a boil and maintained for a period of 5 h. After the samples cooled naturally to a temperature of 23 ± 2 °C, their mass was determined using a hydrostatic balance. Finally, the samples were removed from the water and dried with damp cloth, after which their mass was determined. To calculate water absorption with the immersion and void index, Equations (1) and (2) were used, respectively.
where A is the water absorption by immersion in %, Msat is the mass of the sample saturated in water after immersion and boiling in grams, Mdry refers to the mass of the oven-dried sample in grams, I is the void index in %, and Mi is the mass of the saturated sample immersed in water (hydrostatic balance) after boiling in grams.
One of the parameters used to determine the efficiency of a cementitious composite is cement consumption. Equation (3) was used for this determination. The calculation principle is based on the cement consumption per cubic meter of fresh material. Thus, the calculation method was based on the ratio between the apparent specific gravity and the unit composition of the sample.
where CC is the cement consumption, γ is the specific mass of the mortar in the fresh state in kg/m3, c is the amount of cement in the sample in kg, V is the amount of glass in the sample in kg, S is the amount of sand in kg, and a is the amount of water in kg.
The specific gravity in the hardened state was determined in accordance with NBR 13280 [45], similar to ASTM C642 [44], after 28 days of hydration of the material as the ratio between the mass and the dimension of the test specimen (40 × 40 × 160 mm) before the mechanical tests were carried out.
Thermogravimetric analysis (TG) was performed at 28 days of cement hydration in the pastes. The tests were performed using an SDT-Q600 (TA Instruments, New Castle, DE, USA) analyzer, with a heating rate of 10 °C/min up to 1000 °C and in a reducing atmosphere with a flow rate of 100 mL/min of N2.
From the TG data, each parameter was calculated from the mass loss value at a specific temperature, and the calcium hydroxide (CH) content and degree of hydration (α) of the samples were determined using Equations (4) and Equation (5), respectively [46,47].
where W refers to the weight of the samples at the indicated temperatures; and 74/18 is the molar mass ratio of calcium hydroxide to water [46]; Ldh, Ldx, and Ldc are mass losses due to dehydration (105–420 °C), dehydroxylation (420–540 °C), and decarbonation (550–1000 °C), respectively; and 0.26 is the chemically bound water at an infinite time (assuming complete hydration) estimated from the theoretical stoichiometry of cement [47].
The results of mechanical strength tests were statistically analyzed. An analysis of variance (ANOVA) was performed to identify possible differences between the means resulting from the partial replacement of the binder for glass waste. The F-test in ANOVA was used to determine whether there were statistically significant differences between the average values of the studied properties. If the p-value of the F test is less than 0.05, it has a statistically significant effect on the property under analysis at a 95% confidence level; if it is greater than 0.05, its effect is statistically insignificant.
3. Results and Discussion
3.1. Fresh State
The physical properties of the mortars are presented in Figure 5, Figure 6 and Figure 7. Regarding the workability of mortars (Figure 5), the REF series spread on the table achieved 240.7 mm, and the highest value obtained was 257 mm, which is 6.8% higher than that of the REF series obtained by the 15% colorful series; however, no general behavior tendency was observed in the series with powder glasses added, independent of the glass amount present. If there is less cement for the initial reaction and, at the same time, there is a coarser powder (in comparison with cement), a higher workability for the same water consumption is expected. This was not found in the results of this research, where 15% blue and 15% transparent series achieved 237.7 and 236 mm of spread, respectively. In the case of the series that presented lower workability, the shape of the glass particles with sharp edges reduced fluidity. Also, it can be explained by the average size of the glass particles, which directly influences the consistency index of the mortars, with the blue, transparent, and amber glass samples showing the smallest particle size, which reduced the fluidity of the mortar. On the other hand, the results where there were higher workability than that of the REF series may be due to the grinding effect, where the rounded shape of the particles is more favorable to fluidity and smooth surfaces promote particle movement which lead to fluidity increase, mainly due the non-absorbent nature of glass particles which increases the water/cement (w/c) ratio and improves fluidity [5,26,48,49,50,51]. The size of the glass particles play a crucial role in their interaction with the cementitious matrix [15,52]. Also, glass particles, in most cases, have impermeable characteristics that allow more free water to improve workability [53,54]. Additionally, the reduction in workability may be due to its high surface area, which adsorbs a large amount of mixing water and increases friction between matrix particles [55].
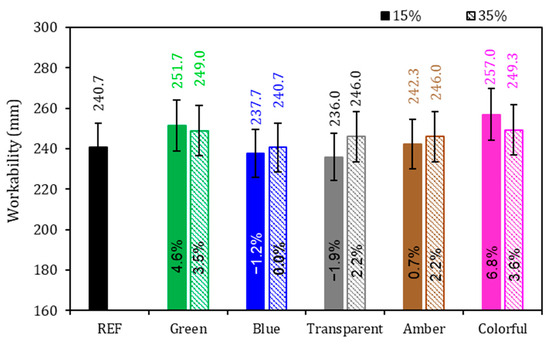
Figure 5.
Workability of the mortars. Note: The percentage values shown inside each bar are the variation compared to the REF series. The errors bars are ±1 standard deviation.
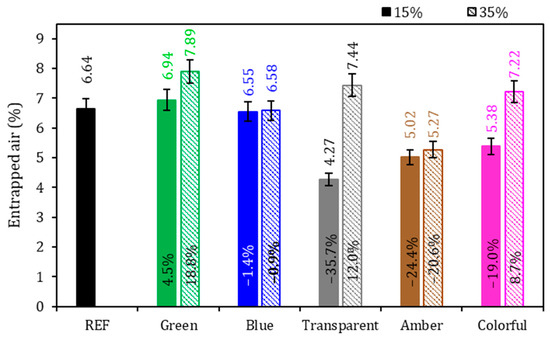
Figure 6.
Entrapped air of the mortars. Note: The percentage values shown inside each bar are the variation compared to the REF series. The errors bars are ±1 standard deviation.
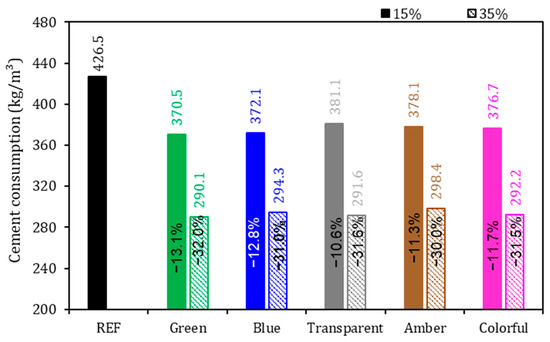
Figure 7.
Cement consumption of the mortars. Note: The percentage values shown inside each bar are the variation compared to the REF series.
Regarding entrapped air (Figure 6), the REF series achieved 6.64%, and it was found that there was no general tendency of behavior with the addition of ground glass to the cementitious mortar: there was a sample with an increased presence of entrapped air and another with lower values of entrapped air. In the evaluation of the glasses colors, no tendency could be identified for the air in the mortars. From the comparison of the 15% and 35% replacement levels with ground glass, it can be concluded that the samples with 15% replacement showed a reduction in the entrapped air content in comparison to the REF series, except for the sample with green glass, which showed an increase of 4.5% in comparison to the REF series. This reduction in the entrapped air may be explained by the size of the grains of the ground glass that might have worked as a filling material due to the better granulometric packaging, reducing porosity, but without significantly contributing to the formation of new hydration compounds through a pozzolanic reaction [15,52,56,57]. For the series with a 35% glass presence, except for the amber series, all samples indicated higher results than the reference. This is due to less packing in the cement matrix due to the higher glass content and lower cement consumption. According to Soliman and Tagnit-Hamou [52], the density of the samples becomes lower as the ground glass content is added.
As expected, there was a reduction in cement consumption with the substitution of 15% and 35% of the cement by ground glass in the mortars (Figure 7).
3.2. Hardened State
3.2.1. Mechanical Properties
Figure 8 shows the apparent specific gravity of the mortars after 28, 90, and 365 days of cement hydration. In general, the apparent specific gravity in the hardened state decreased over the hydration time, which may be attributed to the free water evaporation. However, for this test, there was no behavioral tendency attributed to the amount or color of ground glass. The REF series with 28, 90, and 365 days achieved 2.04, 2.00, and 1.89 g/cm3, respectively, that is, a reduction of 7.3% from 28 to 365 days. With 28 days, except in the sample with 35% colorful glass, all glass-added series presented lower specific gravity than did REF; however the variation of the samples was less than 5% in comparison to the REF series.
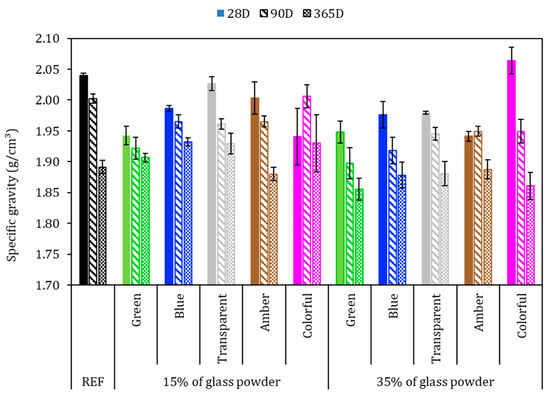
Figure 8.
Specific gravity in the hardened state with 28, 90, and 365 days. Note: The errors bars are ±1 standard deviation.
The results showed that the higher the proportion of ground glass replacing the cement, the lower the apparent specific gravity. This phenomenon was more evident in the 35% glass-added series. This can be explained by the lower cement content, which resulted in a less compact product since Portland cement has a specific gravity of 3.11 g/cm3 and ground glass has one of 2.44 g/cm3, as observed by Jochem et al. [15].
Concerning 365 days, these samples followed the trend of reducing the specific gravity due to the increase in the hydration period, in which the loss of free water occurs through evaporation. This can be attributed to the smooth surface of the glass, which does not absorb water and may result in weak adhesion with hydrated cement products, resulting in a weaker bond between the glass and the cement paste [58]. As verified by the granulometric analysis of ground glasses, more than 70% of these samples are less than 150 μm in size and may be considered a pozzolanic material [59]. Samples with 15% colorful added glass at 90 days and 365 days presented a specific gravity greater than or equal to that of the REF series. This means the glass powder might have worked as a filler or reacted with Portland cement, precipitating in new hydrated products, densifying the matrix microstructure [60].
A pozzolanic reaction occurs when pozzolanic materials, such as ground glass, react with the free lime present in the cement matrix, forming new hydration compounds that contribute to the development of additional mechanical strength. However, the size of the glass particles can influence the extent and speed of this reaction. This lack of significant pozzolanic reaction may explain the decrease in mortar strength as the proportion of ground glass increases [61].
The flexural strength of the mortars was evaluated after 28, 90, and 365 days of hydration and is presented in Figure 9, with the black bars in Figure 9a representing the standard deviation. The flexural strength results presented different behaviors with different hydration times; at 28 days, all glass-added series presented higher strength in comparison with REF series (4.3 MPa), which was inconsistent with the specific gravity (Figure 8—where the glass-added series presented lower values than did REF), as it was expected that the mechanical strength would be lower, which did not occur. This behavior suggests more efficient hydration in the first days, resulting in higher strength for the glass-added series. This effect may be attributed to the higher water disponible for cement hydration in the first days and to the glass filler effect, which was largely evident from the 15% transparent and colorful series achieving 5.7 MPa, which represents a 34.6% higher increase compared to the REF series. This phenomenon may also due the better cement hydration and matrix densification [48,61,62,63].
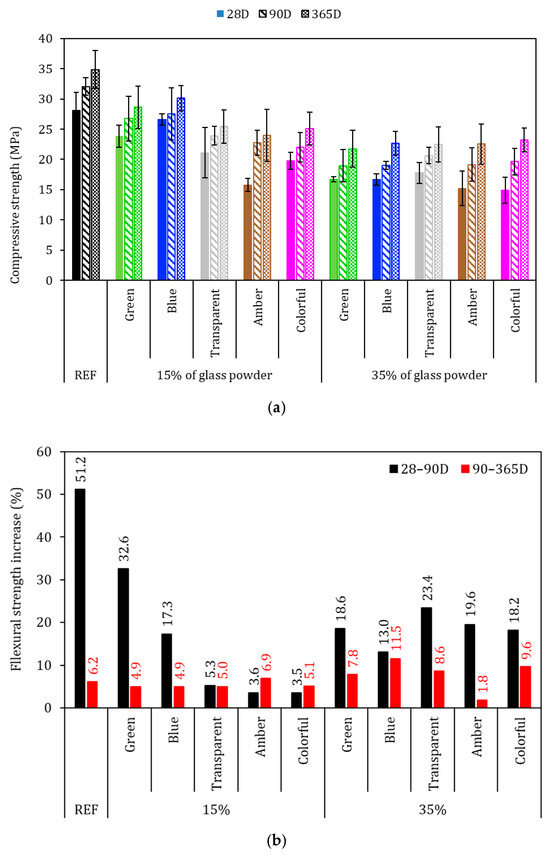
Figure 9.
Flexural strength of the mortars. (a) Average of the specimens and (b) percentage increase in flexural strength. Note: The errors bars are ±1 standard deviation.
The flexural strength with 90 days of cement hydration was 6.5 MPa for the REF series, and all the glass-added series achieved a lower average in comparison to the REF series at this time. Although the averages were lower, for 15% glasses added, the reduction in the flexural strength ranged from −5 to −10%, while for the 35% glasses-added series, the average results ranged from −10 to −21% in comparison to REF. These results are associated with the continuous cement hydration of the REF series, where there was an increase in the flexural strength from 4.3 to 6.5 MPa, while that of the glass added series ranged from 4.3 to 6.1 MPa. This might have occurred due to the fact that the thinner part of the powder glass had already been consumed in the first days (until 28 days). From this moment, the remaining glass did not have enough time to be dissolved and react with calcium hydroxide [64]. The flexural strength at 365 days of cement hydration had a 6.9 MPa for the REF series, and at 90 days, no glasses-added series achieved an average strength higher than that of REF at this time.
Figure 9b presents the strength increase from 28 to 90 days and from 90 to 365 days of cement hydration. The REF series had a 51.2% increase in flexural strength for 28–90 D, and no glasses-added series presented a higher strength increase than did REF series for this hydration time. This behavior indicated that cement is faster than glass in providing strength increase for the first days of cement hydration, as evidenced by the average 15.5% strength increase of the glass-added series. However, for 90–365 D, the cement hydration slowed down, and the strength increased was in the same scale of that of the glasses-added series. The REF series achieved a 6.2% strength increase in this period, and the glasses-added series achieved a 6.6% in strength increase on average, which shows that the binder with glass particles had a reaction similar to that of a cement without glass. Also, the findings suggested that there was late hydration of the cement with glass in the 35% glass-added series, where, with the exception of the amber series, all of the 35% glass-added series presented a higher strength increase than did the REF series. This may be explained by the thinner part of the glass being consumed in the first 28 D, with the remaining glass needing time to be dissolved; thus, there is a need to have more than 15% of glass to achieve continuous late hydration [15,65].
The two effects were evaluated with ANOVA at a 95% confidence level (Table 5), and it was observed that the partial replacement of cement by glass (15 and 35%) affected the flexural strength at the hydration times analyzed (p-value < 0.05). On the other hand, the glass color did not significantly affect the flexural strength at the hydration times analyzed (p-value > 0.05).
Table 5.
Statistical results of the flexural strength of mortars.
Figure shows the results of compressive strength at 28, 90, and 365 days. At all hydration times analyzed, the REF series achieved the highest compressive strength, which was expected since it is the sample with the highest content of cementitious material (Figure 10a). The REF series achieved 28.1, 32.0, and 34.9 MPa at, 28, 90, and 365 days of cement hydration, respectively. Is it possible to discern a trend in behavior in this strength test. The samples with a 15% replacement of cement with glass had a 23% lower strength compared to the REF series, independent of the hydration time analyzed. Similarly to this, series with 35% replacement had a 39% lower strength than the REF series. For all specimens, considerable improvement was noted in the magnitudes of compressive strength as the curing period increased (Figure 10b). This may be a result of the continuous progression in the hydration process with curing time forming hydration products between the cement grains, filling open pores, and increasing the ratio of hydration products, ultimately improving mechanical properties [66].
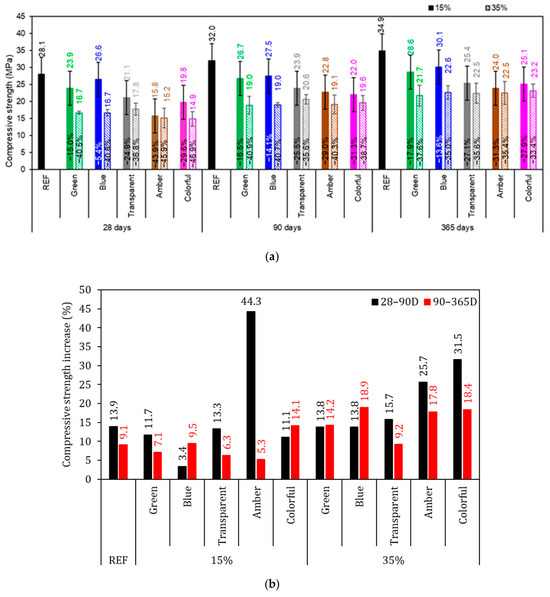
Figure 10.
Compressive strength of mortars. (a) Average of the specimens and (b) percentage increase in compressive strength. Note: The percentage values shown inside each bar are the variation compared to the REF series. The errors bars are ±1 standard deviation.
According to Ramadan et al. [53] and Shwita et al. [67], sodium-rich glass waste (equivalent to the blue and amber glass in this study) has pozzolanic potential due to the high content of amorphous silica (SiO2) (in order of 70%), the high area surface, and the presence of very fine particles (30% less than 20 µm in blue and amber colors, for example), which allow it to effectively participate in the cement hydration process and thus improve the mechanical properties (Figure 10b—15% amber and 35% colorful). This was confirmed by the average strength increase, which in the REF series was 13.9% and 9.1%, for 28–90 D and 90–365 D, respectively; thus, the 15% series had a strength increase in the same proportion to that of the REF series; meanwhile, the 35% series had a compressive strength increase generally higher than that of the REF series.
A reduction in mechanical strength when using waste glass was also reported by Mohamed et al. [64], who attributed this to the low bond phases built after significant dilution of Portland cement via the exclusion of glass since the CaO and Al2O3 content is also limited. Furthermore, due to the dilution of Portland cement, the amount of released Ca(OH)2 produced during the hydration process, essential for activating glass elimination, is reduced; therefore, the amount of binder phases produced from the pozzolanic reaction of the glass with calcium hydroxide elimination is not sufficient to compensate for the reduction in tensile strength. Also, the high level of glass destruction makes it difficult for it to disperse well in the prepared cementitious composite [64].
The beneficial effect caused by using glass waste powder is slow and gradual, being observed only after 28 D of cement hydration, according to Soliman and Tagnit-Hamou [52]. Therefore, it was expected that samples with ground glass would present compressive strength similar to that of the REF series from 90 D onwards since glass, when finely ground, may present a pozzolanic reaction and form additional hydrated products in the cementitious matrix. In the work by Zizková [68], the compressive strength of mixtures containing powder glass waste with 90 D of hydration was comparable to that of reference pastes. This result was due to the average diameter of the glass waste being at least 300% coarser than the average diameter of the Portland cement used; the ground glass worked as a filler, filling the voids and densifying the interfacial transition zone, without presenting a pozzolanic reaction. Also, mortars with a low proportion of ground glass replacing Portland cement obtained compressive strength results closer to the reference value, while mortars with a higher ground-glass content resulted in lower strength due to lower cement consumption, which leads to a reduction in the amount of clinker compounds, mainly material for the development of strength [19,26,69].
The two effects were evaluated with ANOVA at a 95% confidence level, and it was observed that partial replacement of cement by glass (15 and 35%) and the glass color affected the compressive strength at the hydrations times analyzed (p-value < 0.05) (Table 6).
Table 6.
Statistical results of the compressive strength of mortars.
Du and Tan [28] and Soliman and Tagnit-Hamou [52] achieved results superior to the REF at 90 and 365 days, respectively; however, in their research, the average particle size of the powder glass was 10 µm, practically 300% smaller than that used in this study (except for the size of the green ground glass). In other words, the glass waste used by the authors had an average particle diameter comparable to that of Portland cement. Due to this, the glass waste showed pozzolanic reaction, resulting in an increase in mechanical strength. In this sense, it is extremely important to control the size of ground glass waste particles in the production of modified cementitious mortars, as this may significantly affect their reactivity and, consequently, their mechanical strength. Thus, in parallel to the research presented here, the compressive strength comparable to the reference was not observed with the increase in the hydration period, opposite to what is indicated in the literature [70,71]. This may be due to the average diameter of the glasses that are at least 300% coarser than Portland cement preventing a pozzolanic reaction.
3.2.2. Physical Properties
Figure 11 presents water absorption by immersion. The REF series achieved 13.3%, and with the exception of the 15% transparent series, all the series had higher values than did REF. It was identified that the higher the proportion of Portland cement being replaced by ground glass, the higher the absorption index was in percentage; this means that the 35% series had a higher index in comparison to the 15% series. It was possible to analyze the behavior of different substitution levels and their relationship with absorption in samples in the hardened state after 28 days. The lowest values identified were from the 15% transparent series, with an absorption value of 12.9%, and from the 15% amber series, with a value of 13.3%. On the other hand, the highest absorption values were recorded in the 35% green series, with 14.6% absorption, and in the 35% colorful series, with 14.8% water absorption.
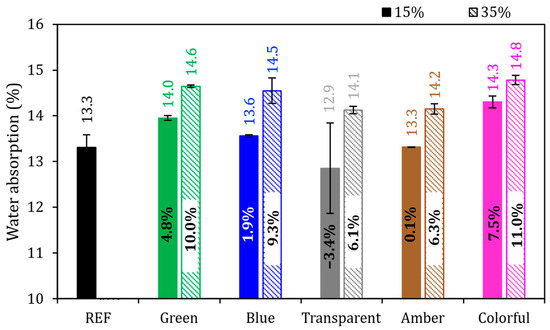
Figure 11.
Water absorption by immersion of mortars in the reference series compared to the series with the addition of glass. Note: The percentage values shown inside each bar are the variation compared to the REF series. The errors bars are ±1 standard deviation.
Mortars with a 15% cement replacement by ground glass showed an average water absorption of 13.6%. Comparing the average value of 15% series directly with the REF value, we found that the water absorption increased by 1.9%. For mortars with 35% of replacement content, the water absorption average reached 14.5%, with the average value being 9.3% higher than that of the REF series. This water absorption being close to the reference, especially in samples with 15% replacement, occurred due to the refinement of the porous structure of the matrix produced, possibly due to the filler effect of the addition, which left the structure relatively dense, per what was observed by Ali-Boucetta et al. [72].
The two effects were evaluated with ANOVA at a 95% confidence level (Table 7), and it was observed that partial replacement of cement by glass (15 and 35%) affected the water absorption of the mortars (p-value < 0.05), but the glass color did not affect the water absorption at the hydration times analyzed (p-value > 0.05).
Table 7.
Statistical results of the water absorption of mortars.
Figure 12 presents the void index (open porosity), the REF achieved a 24% void index, and as presented in the water absorption, with the exception of 15% transparent series, all series had higher values than did the REF series. It can be noted that samples with a higher content of powder glass replacing Portland cement had a higher void index, meaning that the 35% series had a higher void index in comparison to the 15% series. The ANOVA performed indicated that the amount of glass replacing cement was statistically significant (p-value < 0.05) and affected the void index of the mortars (Table 8). On the other hand, the glass color did not affect the void index of the mortars (p-value > 0.05). The void index also increased because mortars with a higher glass content have coarser particles in their granulometry, increasing the intergranular void spaces and retaining more water, which is in line with the water absorption test (Figure 11). The void index of a cementitious material is influenced by its constituents by the hydration process that leads to the formation and alteration of the microstructure. Replacing cement with glass powder may increase the porosity of the material due to the Portland cement dilution effect. Due to the reduction of cement particles and glass particles that are non-absorbent, this results in more free water in the matrix. As the material hydrates and dries, water escapes and makes the mortar more porous [26].
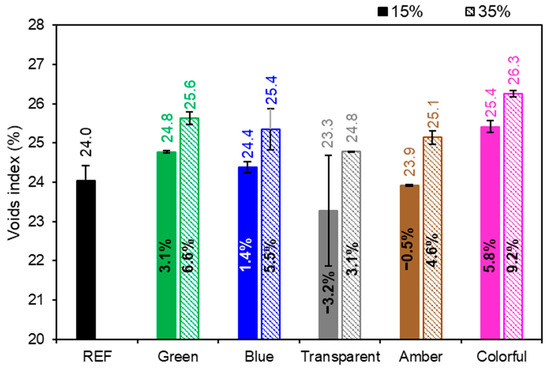
Figure 12.
Void index of mortars in the reference series compared to the series with the addition of glass. Note: The percentage values shown inside each bar are the variation compared to the REF series. The errors bars are ±1 standard deviation.
Table 8.
Statistical results of the void index of mortars.
The thermogravimetry curves of the pastes at 28 days are presented in Figure 13. The first axis presents the derived of mass loss, and the secondary axes present the mass loss.
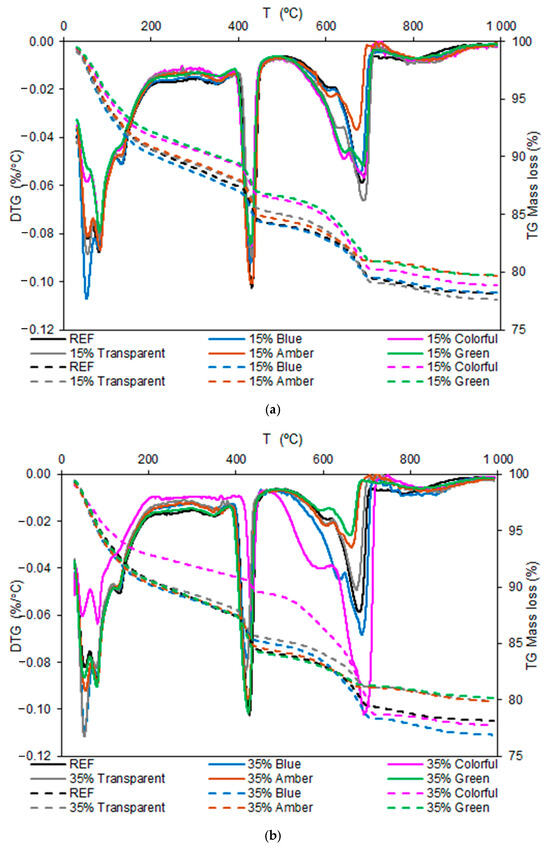
Figure 13.
Thermogravimetry results of the pastes at 28 days: (a) 15% and (b) 35%.
Figure 13a shows that the DTG peaks were similar between the glass-containing and REF samples, indicating that the ground glass did not affect the hydration reactions. However, the intensity of the peaks varies, with a reduction in the calcium hydroxide (CH) formation peak, which may indicate a pozzolanic reaction of the glass, which consumes Ca(OH)2 and forms additional C-S-H. Regarding mass loss, it can be seen that the green, colored, and amber glass samples showed lower mass loss, indicating a smaller amount of hydrated products than that of the REF. Glass color slightly influenced reactivity, but all glass types maintained a similar behavior.
Figure 13b shows an even more significant reduction in the portlandite peak, especially for the colored glass, indicating that the greater the substitution with glass was, the more CH was consumed by the pozzolanic reaction. In terms of mass loss, fewer hydrated products were formed compared with the REF and 15% replacement samples due to the greater replacement of cement by glass. The differences between the glass colors became more pronounced at 35% than at 15%, indicating that glass composition has a greater influence as the glass proportion increases.
One factor associated with the reactivity of glass samples with different colors may be the chemical elements that compose the glass, ensuring the color pattern [26]. In the case of green glass, elements such as Fe3+, Al3+, and SO3−2 are present. Iron ions have moderate reactivity with the ions in the cement solution, while aluminum and sulfate ions are highly reactive and therefore likely participate in cement hydration reactions. In the case of blue glass, Al3+ and K+ ions are present in its composition. We already know that aluminum participates in the reactions, while potassium ions have high reactivity with the oxygen atoms on the surface of the hydrated products. This is especially true because it is a chemical element in the alkali metals family, which has high solubility in aqueous solutions. Therefore, some reactivity of the glass powder is expected to be detected, potentially through reactions that form hydration products or doping of the hydration products, which can primarily measure mechanical strength results [52,73].
The REF presented a portlandite content of 16.04%, a value expected based on normal clinker hydration. With the replacement of 15% by ground glass, a moderate reduction in portlandite contents was observed for green (13.16%), transparent (13.74%), and colored (13.53%) glass, suggesting an active, albeit partial, pozzolanic action, in agreement with the literature [74,75]. On the other hand, the sample with amber glass showed an increase in portlandite content (16.64%), indicating low reactivity (Figure 14).
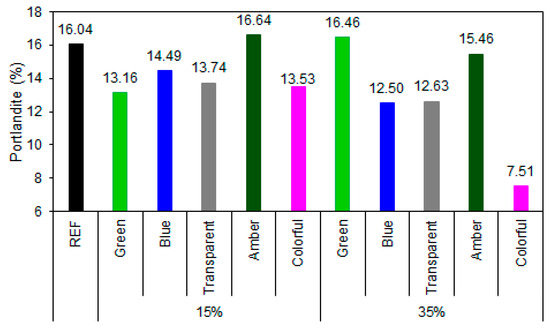
Figure 14.
Portlandite content in the samples at 28 days of cement hydration.
At 35% substitution, the results became more pronounced. Colored glass had the lowest portlandite content (7.51%), demonstrating high pozzolanic reactivity, while transparent (12.63%) and blue (12.50%) glasses also showed satisfactory performance, with significant calcium hydroxide consumption. In contrast, green (16.46%) and amber (15.46%) glasses presented similar contents to those of REF, even with a higher substitution proportion, reinforcing the hypothesis of the low reactivity of these compositions. This behavior may be related to the chemical composition due to the metal oxides used as coloring agents or the presence of impurities, which can reduce the solubility of amorphous silica and compromise the glass’s reactivity [76]. The influence of color is even more evident when the surface area of the glass powders is analyzed; powders with a larger surface area are expected to have greater reactivity potential [52]. In the case observed in this study, the blue and green samples had an equivalent amount of portlandite to that of the clear sample when 15% of the glass was replaced. At 35%, the green glass sample obtained more portlandite than did the REF sample, demonstrating the influence of color on the composite’s properties.
The degree-of-hydration (Figure 15) assessment indicates that most samples with ground-glass replacement performed satisfactorily in terms of binder hydration. REF exhibited a degree of hydration of 0.892, representing the maximum expected limit for complete hydration of Portland cement without additions. Among the samples with 15% glass, the values ranged from 0.831 to 0.856, or 93.2 to 96.0% of the hydration of REF series, indicating that this replacement does not significantly compromise the evolution of hydration reactions. The blue, transparent, and amber glasses showed values close to those of REF, suggesting that despite the dilution of the clinker, the presence of glass may favor hydration, possibly acting as a nucleating agent. At 35% replacement, the results were more diverse: blue glass maintained a high degree of hydration (99.4% of the REF series hydration), indicating good compatibility with the cementitious matrix, while transparent glass showed a sharp decrease (85.3% of the REF series hydration), revealing a possible dilution effect predominating over any pozzolanic contribution. Colorful and amber glasses also showed a reduction in the degree of hydration (89.2% and 91.6%, respectively).
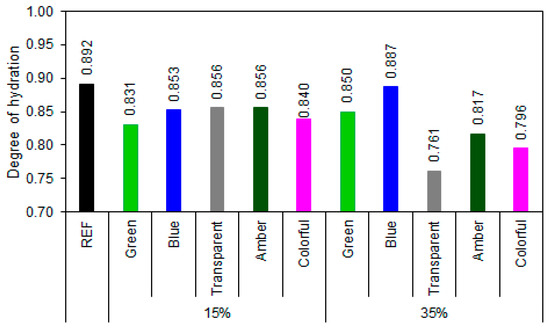
Figure 15.
Hydration degree of samples at 28 days of cement hydration.
The combined analysis of the degree of hydration and portlandite content data allows for a more robust assessment of the efficiency of the hydration reactions and the pozzolanic activity of the different types of ground glass [77,78,79]. With the incorporation of 15% glass, all samples maintained a high degree of hydration (>93%), and moderate reductions in portlandite contents were observed for the green, transparent, blue, and colored glasses, demonstrating moderate pozzolanic activity. However, the amber glass, despite presenting a high degree of hydration (96%), exhibited a higher portlandite content than did the reference (3.74% higher), suggesting predominantly inert behavior.
With 35% substitution, the differences between the glass types became more pronounced. The blue glass demonstrated excellent performance, with a degree of hydration (99.4%) almost equal to that of the REF sample and a significant reduction in portlandite content (12.50%), demonstrating synergy between cement hydration and the pozzolanic activity of the glass. Similarly, colored glass showed the highest portlandite consumption (7.51%), even with a lower degree of hydration (0.796), indicating high pozzolanic reactivity. On the other hand, transparent glass, despite promoting portlandite reduction, showed the lowest degree of hydration (0.761), indicating that at higher contents, the dilution effect outweighs the gains from pozzolanic activity. Amber glass maintained inert behavior, with a high portlandite content (15.46%) and low hydration (0.817), while green glass showed contradictory results, with an increase in portlandite (16.46%) even with a high degree of hydration (0.850), which can be attributed to the low reactivity of the green composition or the presence of impurities that inhibit the pozzolanic reaction [26].
4. Conclusions
Experimental research was conducted using ground-glass powder in cement mortars. Based on the results obtained, the following conclusions can be drawn:
A 15% glass powder content presented mechanical strength performance equivalent to that of the reference series (REF).
Different colors of glass did not cause deleterious changes in the studied properties, presenting behavior similar to that of the REF series.
The reactivity activity of ground glass with different colors was confirmed, and the Ca(OH)2 released during the hydration of Portland cement was reduced in waste glass-added mortars, suggesting the formation of secondary C-S-H compounds.
The color of the ground glass in the samples was found to be a variable, as did the physical properties of the material. This is associated with the metals that make up the chemical structure of the glass used.
It can be concluded that the use of glass waste in cement materials represents a sustainable alternative for the utilization of this industrial waste, contributing to the reduction of environmental impacts and the more rational use of natural resources. However, it is recommended that more in-depth studies be carried out on durability, leaching, and appropriate handling and storage practices, in order to achieve safe application on a large scale.
Author Contributions
Conceptualization, L.C.M.; data curation, C.A.C.; formal analysis, L.C.M.; investigation, L.F.J.; resources, L.F.J.; supervision, L.F.J.; writing—original draft, L.C.M., M.E.A.G., C.A.C., M.H.F.M. and L.F.J.; writing—review and editing, C.A.C. and L.F.J. All authors have read and agreed to the published version of the manuscript.
Funding
This research received no external funding.
Data Availability Statement
The original contributions presented in this study are included in the article. Further inquiries can be directed to the corresponding author.
Conflicts of Interest
The authors declare that they have no known competing financial interests or personal relationships that could have appeared to influence the work reported in this paper.
References
- United Nations Environment Programme (UNEP). Global Waste Management Outlook 2024; United Nations Environment Programme (UNEP): Nairobi, Kenya, 2024. [Google Scholar]
- United Nations Environment Programme (UNEP). Global Waste Management Outlook 2022; United Nations Environment Programme (UNEP): Nairobi, Kenya, 2022. [Google Scholar]
- BRASIL Lei No 12.305, de 2 de Agosto de 2010; Institui a Política Nacional de Resíduos Sólidos: Brasília, Brazil, 2010.
- Cassa, J.C.S.; Carneiro, A.P.; Brum, I.A.S. Reciclagem de Entulho Para Produção de Materiais de Construção; Universidade Federal da Bahia (EDUFBA); Caixa Econômica Federal: Salvador, Brazil, 2001.
- Santos, H.M.M.; Jochem, L.F.; de Matos, P.R.; Casagrande, C.A.; Marinho, É.P.; Szeląg, M.; de Nóbrega, A.C.V. Porcelain Tile Polishing Residue in Concrete as an Additive or Replacement for Portland Cement. Appl. Sci. 2023, 13, 2824. [Google Scholar] [CrossRef]
- Silva, H.R.T.; Santos, W.R.S.; Westerlon, A.A.; Ortiz, P.E.; Zanco, J.J. Resíduo de Lapidação de Vidro: Caracterização e Efeito de Sua Incorporação Na Resistência Mecânica de Uma Argamassa. Braz. J. Bus. 2020, 2, 1504–1517. [Google Scholar] [CrossRef]
- Torres, A.F.R. Gonçalves-Dias Entendendo a Estrutura Da Cadeia Reversa Das Garrafas de Vidro Em São Paulo. In Proceedings of the Cleaner Production for Achieving Sustainable Development Goals, Barranquilla, Colombia, 21–22 June 2018. [Google Scholar]
- Associação Brasileira Das Indústrias De Vidro (ABIVIDRO). Porque o Vidro é a Melhor Opção Para Reciclar! Associação Brasileira Das Indústrias De Vidro (ABIVIDRO): São Paulo, Brazil, 2021. [Google Scholar]
- Guo, P.; Bao, Y.; Meng, W. Review of Using Glass in High-Performance Fiber-Reinforced Cementitious Composites. Composites Cem. Concr. Compos. 2021, 120, 104032. [Google Scholar] [CrossRef]
- Jiang, Y.; Ling, T.C.; Mo, K.H.; Shi, C. A Critical Review of Waste Glass Powder—Multiple Roles of Utilization in Cement-Based Materials and Construction Products. J. Environ. Manag. 2019, 242, 440–449. [Google Scholar] [CrossRef]
- Elaqra, H.A.; Haloub, M.A.A.; Rustom, R.N. Effect of New Mixing Method of Glass Powder as Cement Replacement on Mechanical Behavior of Concrete. Constr. Build. Mater. 2019, 203, 75–82. [Google Scholar] [CrossRef]
- Du, H.; Tan, K.H. Waste Glass Powder as Cement Replacement in Concrete. J. Adv. Concr. Technol. 2014, 12, 468–477. [Google Scholar] [CrossRef]
- Jani, Y.; Hogland, W. Waste Glass in the Production of Cement and Concrete—A Review. J. Environ. Chem. Eng. 2014, 2, 1767–1775. [Google Scholar] [CrossRef]
- Khan, M.N.N.; Saha, A.K.; Sarker, P.K. Reuse of Waste Glass as a Supplementary Binder and Aggregate for Sustainable Cement-Based Construction Materials: A Review. J. Build. Eng. 2020, 28, 101052. [Google Scholar] [CrossRef]
- Jochem, L.F.; Casagrande, C.A.; Onghero, L.; Venâncio, C.; Gleize, P.J.P. Effect of Partial Replacement of the Cement by Glass Waste on Cementitious Pastes. Constr. Build. Mater. 2021, 273, 121704. [Google Scholar] [CrossRef]
- Ahmad, S.A.; Ahmed, H.U.; Rafiq, S.K.; Mahmood, K.O.F.; Rostam, K.J.; Jafer, F.S. A Comprehensive Exploration on the Effect of Waste Glass Powder as a Partial Replacement of Cement in Mortar: A Review, Analysis, and Modeling Investigation. Arab. J. Sci. Eng. 2024, 49, 5721–5748. [Google Scholar] [CrossRef]
- Carsana, M.; Frassoni, M.; Bertolini, L. Comparison of Ground Waste Glass with Other Supplementary Cementitious Materials. Cem. Concr. Compos. 2014, 45, 39–45. [Google Scholar] [CrossRef]
- Lu, J.-X.; Zhan, B.-J.; Duan, Z.-H.; Poon, C.S. Using Glass Powder to Improve the Durability of Architectural Mortar Prepared with Glass Aggregates. Mater. Des. 2017, 135, 102–111. [Google Scholar] [CrossRef]
- Alemu, M.Y.; Yehualaw, M.D.; Nebiyu, W.M.; Nebebe, M.D.; Taffese, W.Z. Marble and Glass Waste Powder in Cement Mortar. Appl. Sci. 2025, 15, 3930. [Google Scholar] [CrossRef]
- Raju, A.S.; Anand, K.B.; Rakesh, P. Partial Replacement of Ordinary Portland Cement by LCD Glass Powder in Concrete. Mater. Today Proc. 2021, 46, 5131–5137. [Google Scholar] [CrossRef]
- Hwang, S.S.; Moreno Cortés, C.M. Properties of Mortar and Pervious Concrete with Co-Utilization of Coal Fly Ash and Waste Glass Powder as Partial Cement Replacements. Constr. Build. Mater. 2021, 270, 121415. [Google Scholar] [CrossRef]
- Kamali, M.; Ghahremaninezhad, A. An Investigation into the Hydration and Microstructure of Cement Pastes Modified with Glass Powders. Constr. Build. Mater. 2016, 112, 915–924. [Google Scholar] [CrossRef]
- Karamberi, A.; Moutsatsou, A. Participation of Coloured Glass Cullet in Cementitious Materials. Cem. Concr. Compos. 2005, 27, 319–327. [Google Scholar] [CrossRef]
- Du, H.; Tan, K.H. Use of Waste Glass as Sand in Mortar: Part II—Alkali–Silica Reaction and Mitigation Methods. Cem. Concr. Compos. 2013, 35, 118–126. [Google Scholar] [CrossRef]
- Idir, R.; Cyr, M.; Tagnit-Hamou, A. Pozzolanic Properties of Fine and Coarse Color-Mixed Glass Cullet. Cem. Concr. Compos. 2011, 33, 19–29. [Google Scholar] [CrossRef]
- Nahi, S.; Leklou, N.; Khelidj, A.; Oudjit, M.N.; Zenati, A. Properties of Cement Pastes and Mortars Containing Recycled Green Glass Powder. Constr. Build. Mater. 2020, 262, 120875. [Google Scholar] [CrossRef]
- Belouadah, M.; Rahmouni, Z.E.A.; Tebbal, N. Influence of the Addition of Glass Powder and Marble Powder on the Physical and Mechanical Behavior of Composite Cement. Procedia Comput. Sci. 2019, 158, 366–375. [Google Scholar] [CrossRef]
- Du, H.; Tan, K.H. Properties of High Volume Glass Powder Concrete. Cem. Concr. Compos. 2017, 75, 22–29. [Google Scholar] [CrossRef]
- Deng, Y.; Yan, C.; Zhang, J.; Yin, L.; Liu, S.; Yan, Y. Preparation and Mechanical Characterization of Engineered Cementitious Composites with High-Volume Fly Ash and Waste Glass Powder. J. Clean. Prod. 2022, 333, 130222. [Google Scholar] [CrossRef]
- Siad, H.; Lachemi, M.; Sahmaran, M.; Mesbah, H.A.; Hossain, K.M.A. Use of Recycled Glass Powder to Improve the Performance Properties of High Volume Fly Ash-Engineered Cementitious Composites. Constr. Build. Mater. 2018, 163, 53–62. [Google Scholar] [CrossRef]
- Mañosa, J.; Calderón, A.; Salgado-Pizarro, R.; Maldonado-Alameda, A.; Chimenos, J.M. Research Evolution of Limestone Calcined Clay Cement (LC3), a Promising Low-Carbon Binder—A Comprehensive Overview. Heliyon 2024, 10, e25117. [Google Scholar] [CrossRef]
- Sales, R.B.C.; Sales, F.A.; Figueiredo, E.P.; dos Santos, W.J.; Mohallem, N.D.S.; Aguilar, M.T.P. Durability of Mortar Made with Fine Glass Powdered Particles. Adv. Mater. Sci. Eng. 2017, 2017, 3143642. [Google Scholar] [CrossRef]
- Wang, Y.; Cao, Y.; Zhang, P.; Ma, Y. Effective Utilization of Waste Glass as Cementitious Powder and Construction Sand in Mortar. Materials 2020, 13, 707. [Google Scholar] [CrossRef] [PubMed]
- NBR 16697; Cimento Portland—Requisitos. Associação Brasileira de Normas Técnicas: Rio de Janeiro, Brazil, 2018.
- ASTM C150/C150M; 19a—Standard Specification for Portland Cement. American Society of Testing Materials: West Conshohocken, PA, USA, 2019.
- NBR 13278; Argamassa Para Assentamento e Revestimento de Paredes e Tetos: Determinação Da Densidade de Massa e Do Teor de Ar Incorporado. Associação Brasileira de Normas Técnicas: Rio de Janeiro, Brazil, 2005.
- ASTM C185; Test Method for Air Content of Hydraulic Cement Mortar. American Society of Testing Materials: West Conshohocken, PA, USA, 2020.
- NBR 13276; Argamassa Para Assentamento e Revestimento de Paredes e Tetos—Determinação Do Índice de Consistência. Brazilian. Association of Technical Standards: Rio de Janeiro, Brazil, 2005.
- ASTM C1437; Test Method for Flow of Hydraulic Cement Mortar. American Society of Testing Materials: West Conshohocken, PA, USA, 2020.
- NBR 13279; Argamassa Para Assentamento e Revestimento de Paredes e Tetos—Determinação Da Resistência à Tração Na Flexão e à Compressão. Associação Brasileira de Normas Técnicas: Rio de Janeiro, Brazil, 2005.
- ASTM C348; Test Method for Flexural Strength of Hydraulic-Cement Mortars. American Society of Testing Materials: West Conshohocken, PA, USA, 2021.
- ASTM C349; Test Method for Compressive Strength of Hydraulic-Cement Mortars (Using Portions of Prisms Broken in Flexure). American Society of Testing Materials: West Conshohocken, PA, USA, 2024.
- NBR 9778; Argamassas e Concreto Endurecidos—Determinação Da Absorção de Água, Índice de Vazios e Massa Específica. Associação Brasileira de Normas Técnicas: Rio de Janeiro, Brazil, 2005.
- ASTM C642; Test Method for Density, Absorption, and Voids in Hardened Concrete. American Society of Testing Materials: West Conshohocken, PA, USA, 2021.
- NBR 13280; Argamassa Para Assentamento e Revestimento de Paredes e Tetos—Determinação Da Densidade de Massa Aparente No Estado Endurecido. Associação Brasileira de Normas Técnicas: Rio de Janeiro, Brazil, 2005.
- de Matos, P.R.; Sakata, R.D.; Gleize, P.J.P.; de Brito, J.; Repette, W.L. Eco-Friendly Ultra-High Performance Cement Pastes Produced with Quarry Wastes as Alternative Fillers. J. Clean. Prod. 2020, 269, 122308. [Google Scholar] [CrossRef]
- Gupta, S.; Kashani, A.; Mahmood, A.H.; Han, T. Carbon Sequestration in Cementitious Composites Using Biochar and Fly Ash—Effect on Mechanical and Durability Properties. Constr. Build. Mater. 2021, 291, 123363. [Google Scholar] [CrossRef]
- Althoey, F.; Zaid, O.; Majdi, A.; Alsharari, F.; Alsulamy, S.; Arbili, M.M. Effect of Fly Ash and Waste Glass Powder as a Fractional Substitute on the Performance of Natural Fibers Reinforced Concrete. Ain Shams Eng. J. 2023, 14, 102247. [Google Scholar] [CrossRef]
- Lee, H.; Hanif, A.; Usman, M.; Sim, J.; Oh, H. Performance Evaluation of Concrete Incorporating Glass Powder and Glass Sludge Wastes as Supplementary Cementing Material. J. Clean. Prod. 2018, 170, 683–693. [Google Scholar] [CrossRef]
- Patel, D.; Tiwari, R.P.; Shrivastava, R.; Yadav, R.K. Effective Utilization of Waste Glass Powder as the Substitution of Cement in Making Paste and Mortar. Constr. Build. Mater. 2019, 199, 406–415. [Google Scholar] [CrossRef]
- Jochem, L.F.; Rocha, J.C. Potential Use of the Prewetting of Recycled and Lightweight Aggregates to Improve Cement Pastes for Residue Solidification/Stabilization Systems with Chromium and Zinc. J. Mater. Civ. Eng. 2021, 33, 1–15. [Google Scholar] [CrossRef]
- Soliman, N.A.; Tagnit-Hamou, A. Partial Substitution of Silica Fume with Fine Glass Powder in UHPC: Filling the Micro Gap. Constr. Build. Mater. 2017, 139, 374–383. [Google Scholar] [CrossRef]
- Ramadan, M.; El-Gamal, S.M.A.; Selim, F.A. Mechanical Properties, Radiation Mitigation and Fire Resistance of OPC-Recycled Glass Powder Composites Containing Nanoparticles. Constr. Build. Mater. 2020, 251, 118703. [Google Scholar] [CrossRef]
- Casagrande, C.A.; Jochem, L.F.; Repette, W.L. Analysis of the 3-Glycidoxypropyltrimethoxysilane (GPTMS) Hydrolysis by Infrared Spectroscopy. Matéria 2020, 25, e-12811. [Google Scholar] [CrossRef]
- Heikal, M.; Ismail, M.N.; Ibrahim, N.S. Physico-Mechanical, Microstructure Characteristics and Fire Resistance of Cement Pastes Containing Al2O3 Nano-Particles. Constr. Build. Mater. 2015, 91, 232–242. [Google Scholar] [CrossRef]
- Franco-Luján, V.A.; Ramírez-Arellanes, S.; Gomez-Sanchez, A.; Pérez-Ramos, A.E.; Cruz-García, E.S.; Cruz-Martínez, H. Properties of Fresh and Hardened Cement-Based Materials with Waste Glass as Supplementary Cementitious Material: A Review. J. Build. Eng. 2024, 95, 110137. [Google Scholar] [CrossRef]
- Li, Q.; Qiao, H.; Li, A.; Li, G. Performance of Waste Glass Powder as a Pozzolanic Material in Blended Cement Mortar. Constr. Build. Mater. 2022, 324, 126531. [Google Scholar] [CrossRef]
- Du, Y.; Yang, W.; Ge, Y.; Wang, S.; Liu, P. Thermal Conductivity of Cement Paste Containing Waste Glass Powder, Metakaolin and Limestone Filler as Supplementary Cementitious Material. J. Clean. Prod. 2021, 287, 125018. [Google Scholar] [CrossRef]
- Oliveira, R.; de Brito, J.; Veiga, R. Reduction of the Cement Content in Rendering Mortars with Fine Glass Aggregates. J. Clean. Prod. 2015, 95, 75–88. [Google Scholar] [CrossRef]
- Maraghechi, H.; Shafaatian, S.M.H.; Fischer, G.; Rajabipour, F. The Role of Residual Cracks on Alkali Silica Reactivity of Recycled Glass Aggregates. Cem. Concr. Compos. 2012, 34, 41–47. [Google Scholar] [CrossRef]
- Figueira, R.B.; Sousa, R.; Coelho, L.; Azenha, M.; de Almeida, J.M.; Jorge, P.A.S.; Silva, C.J.R. Alkali-Silica Reaction in Concrete: Mechanisms, Mitigation and Test Methods. Constr. Build. Mater. 2019, 222, 903–931. [Google Scholar] [CrossRef]
- Ali, E.E.; Al-Tersawy, S.H. Recycled Glass as a Partial Replacement for Fine Aggregate in Self Compacting Concrete. Constr. Build. Mater. 2012, 35, 785–791. [Google Scholar] [CrossRef]
- Casagrande, C.A.; Jochem, L.F.; Repette, W.L.; Hotza, D. Evaluation of Nano-TiO2 on Properties of Cementitious Mortars. Rev. Matéria 2020, 25, 15. [Google Scholar] [CrossRef]
- Mohamed, O.A.; Hazem, M.M.; Mohsen, A.; Ramadan, M. Impact of Microporous γ-Al2O3 on the Thermal Stability of Pre-Cast Cementitious Composite Containing Glass Waste. Constr. Build. Mater. 2023, 378, 131186. [Google Scholar] [CrossRef]
- Rahim, N.L.; Che Amat, R.; Ibrahim, N.M.; Salehuddin, S.; Mohammed, S.A.; Abdul Rahim, M. Utilization of Recycled Glass Waste as Partial Replacement of Fine Aggregate in Concrete Production. Mater. Sci. Forum 2014, 803, 16–20. [Google Scholar] [CrossRef]
- El Gindy, A.A.; Gomaa, E.A.; Abdelkader, H.I.; Mohsen, A.; Habib, A.O. The Effect of a Sulfonated Naphthalene-Based Polymer on Redox Reaction Data, Potassium Ferrocyanide Complexation, and the Compressive Strength of Portland Cement Paste. J. Mol. Liq. 2022, 356, 119000. [Google Scholar] [CrossRef]
- Shwita, F.; El-Faramawy, N.; Ramadan, W.; Ramadan, M. Investigation of the Mechanical Properties, Morphology and the Attenuation Behavior of Gamma Rays for OPC Pastes Mingled with Two Different Glass Wastes. Constr. Build. Mater. 2021, 313, 125475. [Google Scholar] [CrossRef]
- Žižková, N. Recycled Waste Glass Powder as a Partial Cement Replacement in Polymer-Modified Mortars. Int. J. Civ. Environ. Eng. 2016, 10, 1632–1635. [Google Scholar]
- XIN, Q.; LI, Z.; LU, S.; SHAO, P.; Zhang, M. The Synergistic Effect of Recycled Glass Fiber Reinforced Plastic and Silica Fume on Cement Mortar Properties. J. Build. Eng. 2024, 94, 110055. [Google Scholar] [CrossRef]
- Tang, P.; Chen, W.; Xuan, D.; Zuo, Y.; Poon, C.S. Investigation of Cementitious Properties of Different Constituents in Municipal Solid Waste Incineration Bottom Ash as Supplementary Cementitious Materials. J. Clean. Prod. 2020, 258, 120675. [Google Scholar] [CrossRef]
- Bueno, E.T.; Paris, J.M.; Clavier, K.A.; Spreadbury, C.; Ferraro, C.C.; Townsend, T.G. A Review of Ground Waste Glass as a Supplementary Cementitious Material: A Focus on Alkali-Silica Reaction. J. Clean. Prod. 2020, 257, 120180. [Google Scholar] [CrossRef]
- Ali-Boucetta, T.; Behim, M.; Cassagnabere, F.; Mouret, M.; Ayat, A.; Laifa, W. Durability of Self-Compacting Concrete Containing Waste Bottle Glass and Granulated Slag. Constr. Build. Mater. 2021, 270, 121133. [Google Scholar] [CrossRef]
- Raydan, R.; Khatib, J.; Jahami, A.; El Hamoui, A.K.; Chamseddine, F. Prediction of the Mechanical Strength of Concrete Containing Glass Powder as Partial Cement Replacement Material. Innov. Infrastruct. Solut. 2022, 7, 311. [Google Scholar] [CrossRef]
- Rodier, L.; Savastano, H. Use of Glass Powder Residue for the Elaboration of Eco-Efficient Cementitious Materials. J. Clean. Prod. 2018, 184, 333–341. [Google Scholar] [CrossRef]
- Magni Darwich Higuchi, A.; Gorett dos Santos Marques, M.; Farias Ribas, L.; Pereira de Vasconcelos, R. Use of Glass Powder Residue as an Eco-Efficient Supplementary Cementitious Material. Constr. Build. Mater. 2021, 304, 124640. [Google Scholar] [CrossRef]
- Shi, C.; Zheng, K. A Review on the Use of Waste Glasses in the Production of Cement and Concrete. Resour. Conserv. Recycl. 2007, 52, 234–247. [Google Scholar] [CrossRef]
- Casagrande, C.A.; Repette, W.L. Monitoramento Da Hidrólise/Condensação Do Tetraetoxisilano Em Solução Com Baixo Teor Alcoólico Por Análises de Espectroscopia de Infravermelho. Matéria 2018, 23, e12237. [Google Scholar] [CrossRef]
- Pereira-De-Oliveira, L.A.; Castro-Gomes, J.P.; Santos, P.M.S. The Potential Pozzolanic Activity of Glass and Red-Clay Ceramic Waste as Cement Mortars Components. Constr. Build. Mater. 2012, 31, 197–203. [Google Scholar] [CrossRef]
- Hamada, H.; Alattar, A.; Tayeh, B.; Yahaya, F.; Thomas, B. Effect of Recycled Waste Glass on the Properties of High-Performance Concrete: A Critical Review. Case Stud. Constr. Mater. 2022, 17, e01149. [Google Scholar] [CrossRef]


Disclaimer/Publisher’s Note: The statements, opinions and data contained in all publications are solely those of the individual author(s) and contributor(s) and not of MDPI and/or the editor(s). MDPI and/or the editor(s) disclaim responsibility for any injury to people or property resulting from any ideas, methods, instructions or products referred to in the content. |
© 2025 by the authors. Licensee MDPI, Basel, Switzerland. This article is an open access article distributed under the terms and conditions of the Creative Commons Attribution (CC BY) license (https://creativecommons.org/licenses/by/4.0/).