Article

Perception of Child-Friendly Streets and Spatial Planning Responses in High-Density Cities Amidst Supply–Demand Disparities

1
College of Landscape Architecture and Art, Fujian Agriculture and Forestry University, Fuzhou 350100, China
2
Faculty of Engineering and Information Technology, University of Technology Sydney, Sydney 2007, Australia
*
Author to whom correspondence should be addressed.
Buildings 2025, 15(21), 3908; https://doi.org/10.3390/buildings15213908
Submission received: 19 September 2025 / Revised: 18 October 2025 / Accepted: 21 October 2025 / Published: 29 October 2025
(This article belongs to the Special Issue Urban Wellbeing: The Impact of Spatial Parameters—2nd Edition)

Abstract

As urbanization accelerates, the growing needs of children have led to a significant imbalance between supply and demand in urban spaces. Creating child-friendly environments is crucial for enhancing urban resilience and promoting sustainable development. However, there is currently a lack of sufficient quantitative methods to assess child-friendliness and analyze the complex interactions between children’s perceptions and spatial factors. This study uses the central area of Xiamen as a case study to explore how different street environment characteristics influence perceptions of child-friendliness. This study integrates empathy-based stories (MEBS), street scene image analysis, XGBoost machine learning, and GeoSHapley spatial analysis to explore children’s perceptions of urban spaces. The study reveals that: (1) The child-friendly resources in the central urban area of Xiamen are concentrated in the northeastern and Huli districts, while a supply–demand mismatch exists in Siming District, which has a higher population density; (2) Greenness and pavement coverage are critical in shaping child-friendliness, with greenness having the greatest positive impact; (3) Some areas with child-friendly renovations have a lower child-friendliness index, whereas regions like Guanyinshan, which did not undergo renovations, scored higher; (4) The interaction between greenness and openness positively influences perceptions, while enclosure and visual complexity have a negative effect. Building on the need for child-friendly environments, this study develops a spatial analysis framework to quantify the alignment of child-friendly supply and demand in Xiamen’s central urban area, identify regions with mismatched supply and demand, and offer spatial decision support to improve urban environmental quality and promote sustainable development.

1. Introduction

Most Chinese cities are transitioning to high-density development, which is gradually severing the physical connection between people and nature. Technological advancements have shifted traditional educational and entertainment methods, leading to reduced interaction between children and nature. High-density urban environments restrict children’s activity spaces [1] and reduce physical activity [2], negatively affecting their physical and psychological well-being. Studies show that children’s growth and psychological development depend on rich, interactive environments [3,4]. By 2025, over 70% of the world’s children will live in urban areas [5], increasing the impact on their health [6,7]. However, the societal and familial focus on intellectual and academic development often neglects mental health and behavioral control, leading to rising behavioral problems among children. This imbalance affects learning, character development, and may contribute to antisocial behavior and complex social issues in the long term [8,9]. Creating child-friendly urban environments, especially informal outdoor public spaces, is crucial for children’s development. Streets and alleys, which serve as primary spaces for children’s activities, are disappearing due to rapid urbanization, and the gap between demand and supply of these spaces is widening [10,11]. This highlights the urgent need to optimize urban planning to meet children’s needs in high-density areas.
With the acceleration of urbanization, building Child-Friendly Cities (CFC) has become an urgent global task to improve urban spaces for children’s changing needs. The concept of CFC, based on the Convention on the Rights of the Child, aims to optimize urban environments for children’s safety, equity, well-being, and development [12]. According to UNICEF, CFC includes not only physically safe spaces but also promotes children’s psychological and emotional development through policies, education, and cultural activities [13,14]. Some countries and cities have already proposed strategies to create a child-friendly social environment [15]. In Finland, municipal authorities have set goals based on child-friendliness assessments, considering children’s rights and welfare data [15]. Germany’s initiative raises public awareness and encourages children’s participation in decision-making. South Korea has localized the global CFC initiative, proposing frameworks with memorandums, action plans, and expert evaluations. In China, the national government has implemented plans, and cities like Shenzhen, Shanghai, and Xiamen have promoted child-friendly environments through children’s rights advocacy, societal participation, positive learning environments, and widespread dissemination of the child-friendly concept [16]. However, China still lacks specific measures to directly improve the social environment for children [4].
In this context, the goal of creating Child-Friendly Cities (CFC) is to optimize urban spaces to meet the diverse needs of children in social, cultural, and physical aspects. According to Gibson’s Affordance Theory, children’s behaviors and activities are influenced by their perception of the physical characteristics of the environment, and the interaction of spatial elements collectively determines whether a space can meet children’s behavioral needs [17]. Maslow’s Hierarchy of Needs theory states that children’s needs evolve from basic physiological and safety needs to higher-level needs, such as social connections, esteem, and self-actualization [18]. However, in high-density urban areas, basic needs such as safe play spaces are often unmet, hindering the fulfillment of higher-level needs [19]. The combination of these two theories forms the “resource allocation—environmental interaction—need fulfillment” framework, providing the theoretical foundation for this study and supporting the scientific approach for evaluating child-friendly spaces in urban environments.
Xiamen, a high-density city on the southeastern coast of China, profoundly reflects the urbanization challenges of the urban-rural gap and the tension in spatial resources, especially to the east of the “Heihe–Tengchong Line,” where rapid urbanization has led to excessive population density and a shortage of public service resources [20]. As a typical high-density island city on the eastern coast of China, Xiamen’s urbanization process is highly representative. According to the Seventh National Population Census, Xiamen’s urbanization rate has reached 89.41%, far exceeding the national average of 63.89%, highlighting the core contradiction between “tight constraints on spatial resources” and “high population concentration [21]. During the urban renewal process, Xiamen faces not only the direct challenge of limited land supply but also needs to resolve the structural conflict between commercial development efficiency and public service guarantees [22]. Against this backdrop, Xiamen faces the pressing issue of how to effectively allocate child-friendly urban spaces, confronting the severe challenges of building child-friendly spaces. This phenomenon is not only widespread within Xiamen but is also common in other high-density cities, highlighting the complexity and urgency of building child-friendly spaces during urbanization.
This study explores the construction and significance of child-friendly streets in high-density urban areas, particularly in the context of the increasing demand for such environments. As urbanization accelerates, especially in China, the creation of child-friendly spaces has become a critical priority. Using Xiamen as a case study, this research analyzes how to balance population density with the allocation of urban resources under high-density urbanization. This study is in line with national policies on child-friendly cities, as outlined in the well-being strategy from the 20th National Congress of the Communist Party of China, which emphasizes sustainable urban development and children’s rights. As a representative example of high-density urbanization, Xiamen provides valuable insights for other Chinese cities. This research aims to optimize the supply and demand for child-friendly spaces within China’s urban context, promote sustainable development, and offer practical solutions for other cities.

1.1. Related Work

Recently, research on child-friendly streets has garnered increasing attention, with urban planning concepts gradually shifting from an “adult-centered” approach to a “child-inclusive” paradigm [23]. Extant research primarily focuses on the physical environmental factors of streets, such as walkability, traffic safety, green space levels, and infrastructure. These elements have been shown to exert a significant influence on the travel behavior and sense of safety experienced by children [24,25]. Secondly, the focus has been on institutional-level policies and governance practices to explore pathways for advancing child-friendly cities across different countries [26,27]. While empirical studies have revealed the potential impact of street environments on children’s well-being [28,29], existing research still exhibits significant limitations that necessitate further methodological breakthroughs.
Early assessments of child-friendly streets primarily employed qualitative methods, with mainstream approaches relying on adult-perspective interviews, questionnaires, or parental feedback. These methods included inferring child-friendliness from parents’ evaluations of community design [30] or constructing subjective indicator systems using fuzzy comprehensive evaluation and the Analytic Hierarchy Process (AHP) [31]. This approach suffers from two core issues. First, it overlooks the distinctiveness of the child’s perspective. Adult perceptions of elements such as pavement coverage rate, texture and enclosure do not serve as a substitute for children’s firsthand experiences. Furthermore, qualitative assessments frequently overlook the nuanced spatial exploration and interaction demand of children [32]. Recent studies have begun to focus on children’s perspectives [33,34], but they still suffer from limitations such as relying solely on visual perception dimensions and failing to incorporate spatial effects to analyze regional variations in child-friendliness. Secondly, evaluations are highly subjective, with research scales predominantly focused on the community or city level, lacking in-depth analysis of micro-level street characteristics [35,36]. Existing research predominantly focuses on static cross-sectional analysis, lacking tracking studies on dynamic supply and demand. A paucity of research on the subject of supply thresholds has resulted in an absence of a precise basis for supply side design. However, the practical applicability of research findings remains limited. Existing studies have yet to provide concrete solutions tailored to the high-density urban characteristics of Xiamen’s central urban area, resulting in theoretical outcomes on supply–demand alignment being difficult to directly translate into practical guidance. Concurrently, the absence of an evaluation framework for aligning supply and demand in tools integrating urban planning and landscape design hinders the direct application of theoretical findings in practical contexts.
Large-scale perceptual analysis based on deep learning provides new avenues for acquiring children’s perception data. This is particularly valuable in handling complex nonlinear relationships and spatial interactions. Machine learning methods such as XGBoost are widely used due to their efficiency and strong expressiveness [37]. However, the “black-box” nature of XGBoost limits its interpretability, making it difficult to provide sufficient mechanistic explanations. In contrast, traditional statistical models like the Geographical Detector [38] and Geographically Weighted Regression [39] have limitations when dealing with complex spatial effects and tend to oversimplify these relationships.
To address these issues, this study integrates XGBoost with GeoSHapley to form the “XGBoost-GeoSHapley” framework. XGBoost is a machine learning tool that helps predict outcomes more accurately by combining several models to improve performance. It is particularly suited to handling complex data with multiple features, effectively capturing the impact of various street environment factors on children’s perceptions of child-friendliness. On the other hand, GeoSHapley improves the interpretability of the model, particularly in explaining responses to specific spatial locations. This combination allows the model to maintain high accuracy while offering meaningful explanations in assessing child-friendliness. XGBoost effectively captures nonlinear patterns, while GeoSHapley introduces coordinate variables (X, Y) to estimate spatial effects, thereby precisely identifying street-level drivers. Compared to other methods, the XGBoost-GeoSHapley framework better handles spatial features and nonlinear factors, providing more accurate and transparent explanations. This approach is particularly suitable for evaluating the child-friendliness of urban streets and offers practical decision-making support for policymakers [40].

1.2. Research Objectives

To address the supply–demand mismatches in child-friendly street construction in high-density urban areas, this study uses Xiamen’s central area as a case study. It adopts a child-centered approach, combining streetscape data and environmental features to understand children’s perceptions of the urban environment. The specific objectives The study will employ Shapley game theory and spatial overlay analysis to quantify supply–demand balance, identify mismatch areas, and explore spatial effects in imbalances. To overcome limitations of traditional methods, machine learning and spatial explainability techniques will be integrated, using the XGBoost model and GeoSHapley method. This framework addresses two key limitations of traditional SHAP (Shapley Additive Explanations) methods in spatial analysis: (1) difficulty capturing complex spatial interactions; and (2) treating geographic features independently, ignoring joint effects. The study will explore how street environmental features interact and shape children’s perceptions of urban child-friendliness.
The research aims to answer three core questions: (1) Which street environmental features significantly affect child-friendliness in Xiamen’s central area? (2) How are supply–demand mismatches spatially distributed in different street environments? (3) How can child-friendly street planning be optimized based on supply–demand analysis to address high-density urban challenges?

2. Data and Methods

2.1. Study Area

In May 2023, Xiamen was formally designated a National Child-Friendly City, becoming part of the second batch of such cities. As the only Special Economic Zone (SEZ) in Fujian Province and one of China’s seven major SEZs, Xiamen faces significant demographic challenges alongside its economic development. This study focuses on the central urban districts of Xiamen (Siming and Huli Districts, excluding Gulangyu Island) as its core research area (Figure 1). The study area covers 158 square kilometers, accounting for 9% of the city’s total area, yet it is home to around 50% of the permanent resident population [41]. This area concentrates the majority of urban resources, public facilities, and the population. Xiamen’s permanent residents aged 0–14 currently account for 17.16% of the total population—approximately 886,000 people https://tjj.xm.gov.cn/zcjd/202107/t20210720_2624123.htm (accessed on 14 February 2025) encompassing all nine pilot areas for child-friendly development https://www.xmtv.cn/xmtv/2024-04-28/ae053eb40141aa5b.html (accessed on 14 February 2025). Certain community streets in Xiamen have implemented child-friendly designs, providing conditions for comparative research. The key significance of this area lies in the fact that it concentrates the typical opportunities and challenges faced by China’s high-density urban core districts when implementing child-friendly city policies in the context of persistently low fertility rates and spatially intensive development. This makes it a highly representative sample for exploring sustainable, livable cities.

2.2. Theoretical Framework

This study combines innovative methods, including MEBS, image semantic segmentation, XGBoost (eXtreme Gradient Boosting), and GeoSHapley, to enhance the precision and interpretability of child-friendly perceptions of street environments. XGBoost captures the nonlinear relationships between street environment factors and child-friendliness, while GeoSHapley improves spatial interpretability. MEBS incorporates children’s emotional feedback, and High-Resolution Network (HRNet) is used for semantic segmentation of street images, enabling a comprehensive analysis of child-friendly perceptions in urban environments.
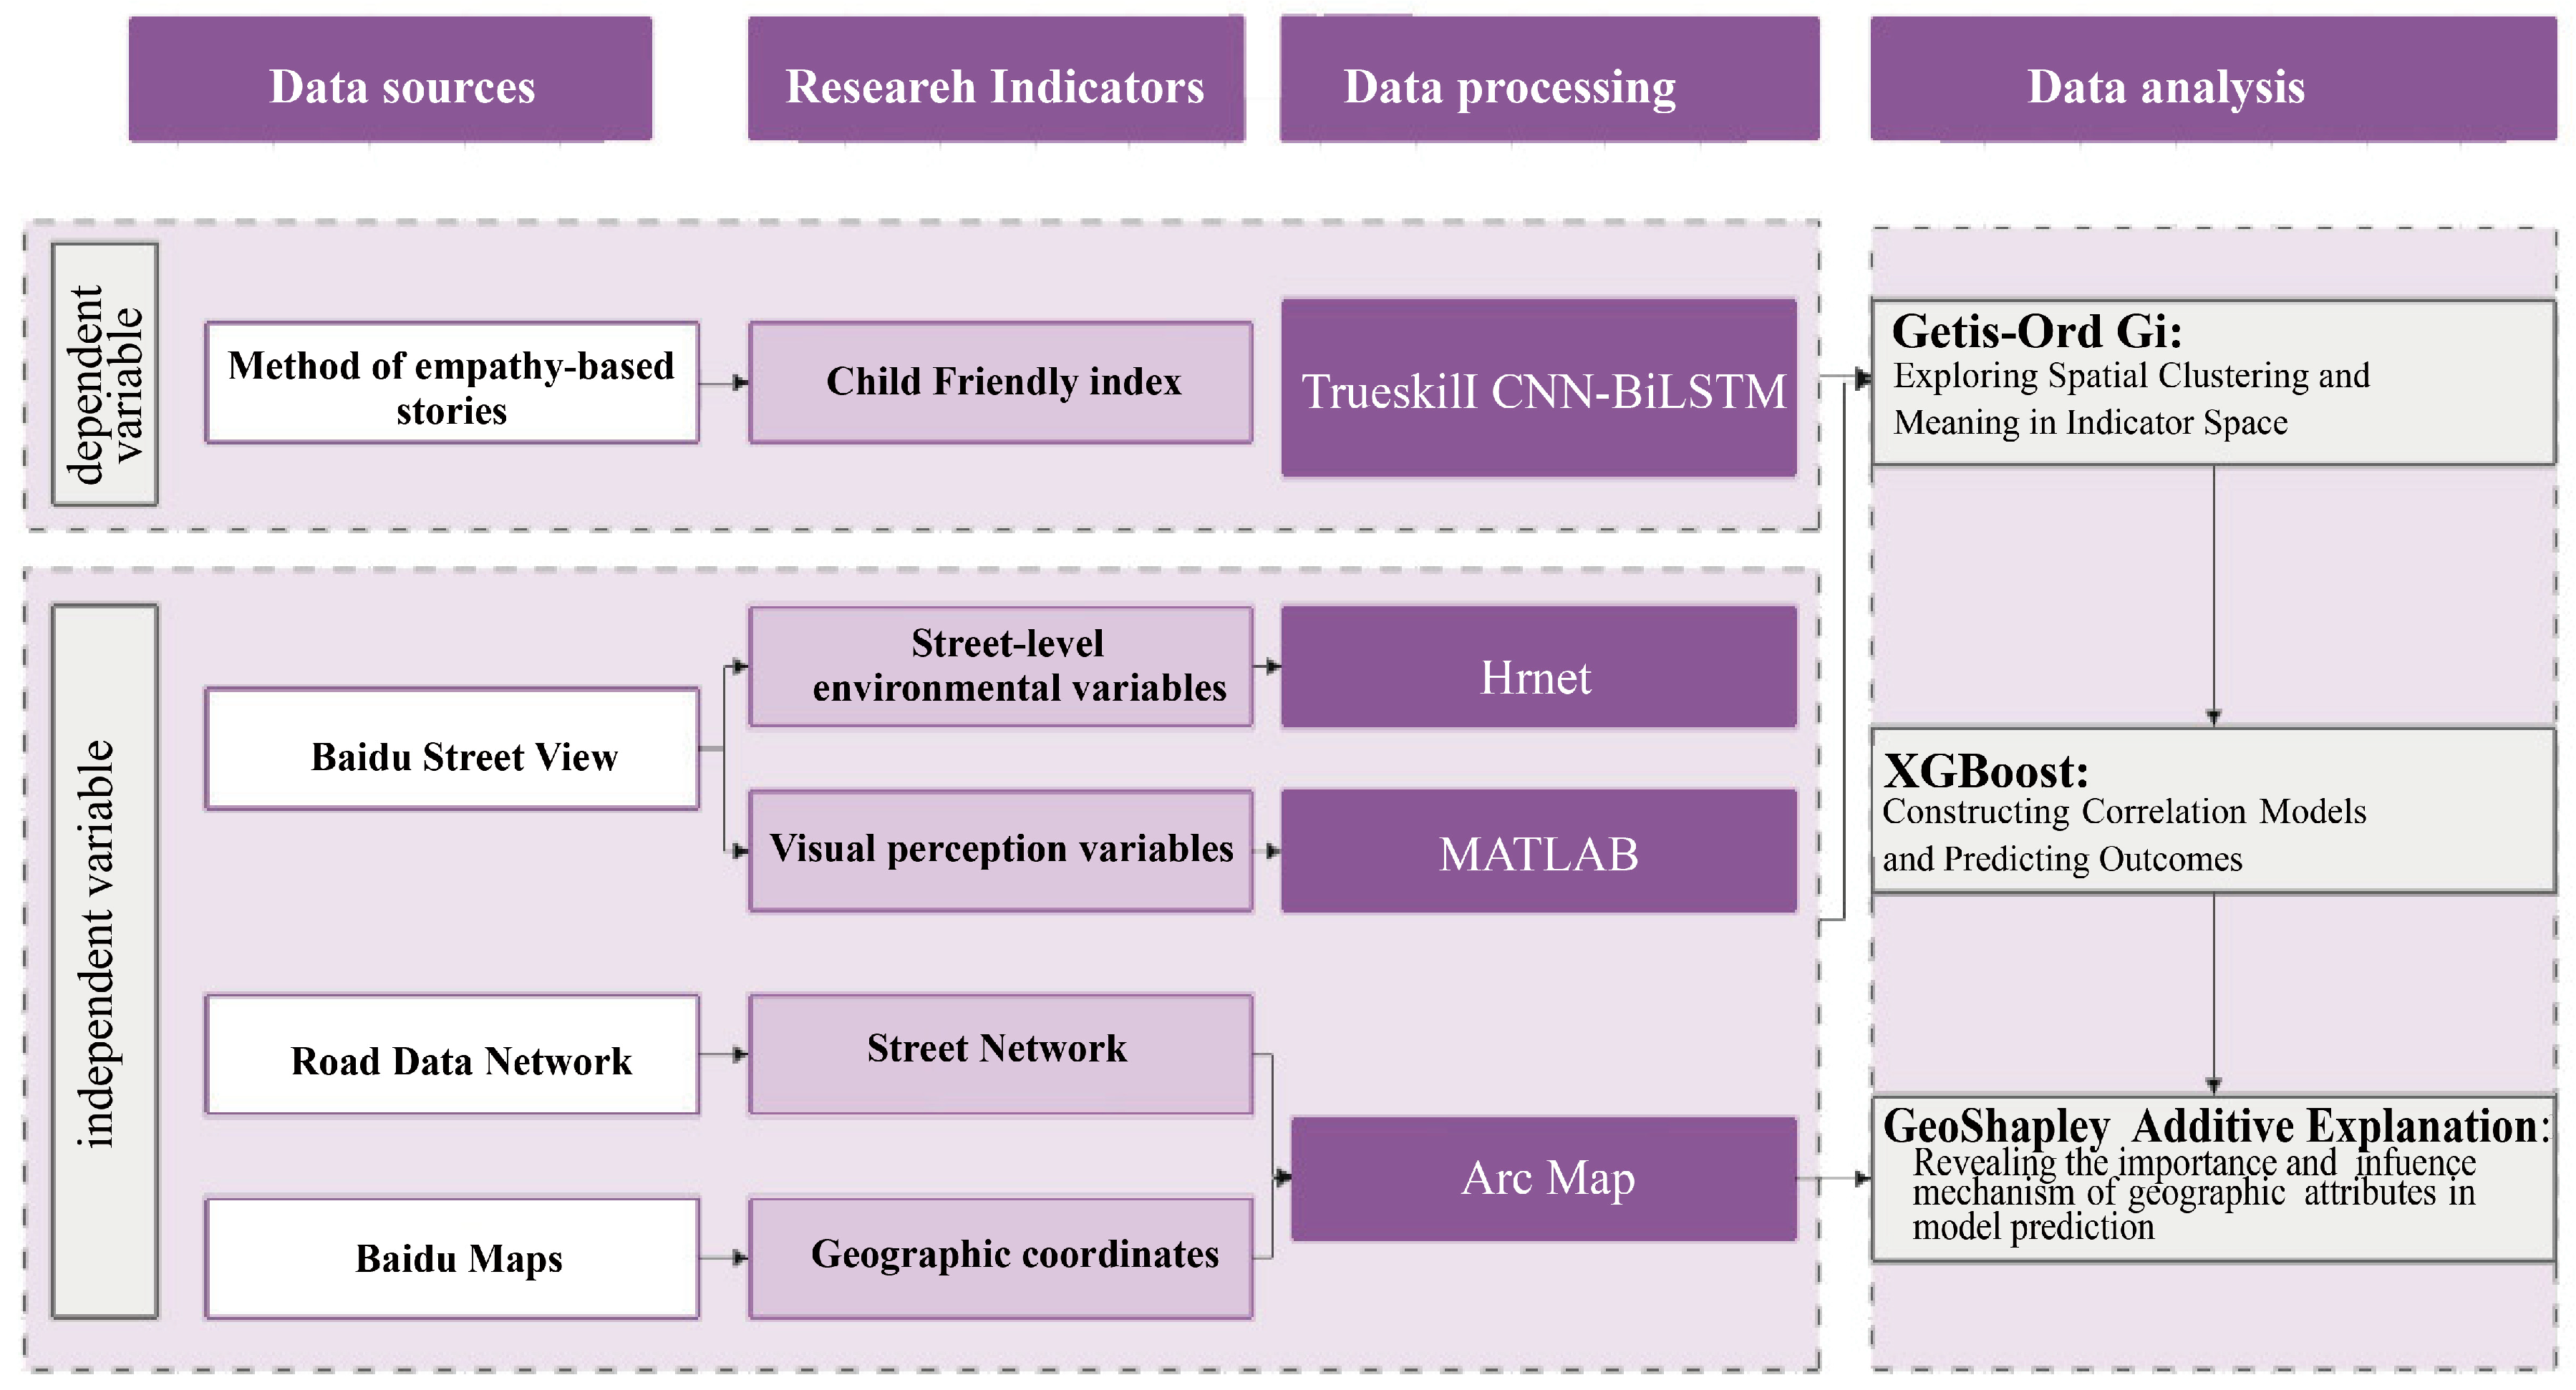
The study follows three phases: (1) Data collection, combining child-friendliness perception questionnaires and urban street imagery; (2) Indicator calculation, applying machine learning models to extract landscape and visual perception indicators; (3) Data analysis, where the XGBoost-GeoSHapley model is used to assess the marginal effects and contributions of various variables. SHAP feature importance analysis and partial dependence plots explore the interactive relationships between street environments and child-friendliness. The process consists of four stages: data collection, indicator acquisition, processing, and analysis (Figure 2).
(1)
Data collection: Street view data for this study was sourced from Baidu Street View, covering the road network in the central urban area of Xiamen. A total of 14,870 sampling points were set every 50 m using ArcGIS 10.2, with panoramic photos taken at each point and cropped into four sections: 0°, 90°, 180°, and 270° (2560 × 1440 pixels, 24-bit depth). After excluding incomplete images, 44,002 images were used. The Street network and building vector data were sourced from OpenStreetMap https://www.openstreetmap.org/#map=6/46.45/2.21 (accessed on 3 January 2025) and verified using the latest satellite imagery and field survey data. For the Children’s Street-Level Child-Friendly Perception index, a formal survey was conducted from 20 March to 2 April 2025. Using the MEBS method, children selected images that matched provided descriptions, and ranking scores were generated based on their choices. The data from 200 children assessed five main indicators: safety, hygiene, education, entertainment, and child participation. These indicators were quantified based on children’s intuitive ratings. The TrueSkill algorithm was used for webpage ranking and scoring, which was integrated into tablet terminals to create an easy-to-use assessment system. In the competition module, children selected images based on descriptions, and the results were used to calculate ranking scores, with the average score determining the final child-friendliness rating. The CNN-BiLSTM model was then used to predict the remaining urban street images, and ArcGIS spatial analysis tools were applied to overlay the data, generating a quantified child-friendliness index. From 20 to 25 May 2025, seven experts scored the importance of each indicator, and the Analytic Hierarchy Process (AHP) was used to calculate the weight of each factor (CR = 0.08 < 0.1). Values were assigned to each factor based on children’s physical and psychological characteristics (Table 1).
(2)
Indicator computation: After pre-training, the TrueSkill/CNN-BiLSTM model was used to perform child-friendliness indicator perception calculation [42] quality and landscape perception metrics were extracted from images using HRNet and MATLAB R2023b. ArcMap 10.6 was then used to verify the autocorrelation between variables and spatial regions through spatial autocorrelation and hotspot analyses, ensuring result visibility and interpretability.
(3)
Data analysis: SHAP analysis and interaction value analysis further explored how different street environment factors influence children’s perceptions of child-friendliness. XGBoost is used to capture complex nonlinear relationships, analyzing how various environmental features impact child-friendliness, while GeoSHapley enhances the model’s spatial interpretability by calculating the marginal effects of variables on children’s perceptions of child-friendliness, clearly identifying the impact of different spatial locations on child-friendliness.

2.3. Variable Selection

The issue of supply–demand imbalance in child-friendly streets in high-density urban environments is becoming increasingly prominent. Rapid urban development and the growing child population have led to a significant gap between supply and demand. In this study, supply refers to the overall capacity of the urban environment to meet children’s needs, including safety, hygiene, education, entertainment, child participation, as well as street landscape and visual elements. These factors collectively form the core components of a child-friendly environment. Demand, on the other hand, consists of two dimensions: social demand and material demand. Social demand reflects the number of children in a specific area, while material demand reflects the impact of urban development on children’s expectations of urban streets, including the quantity of public facilities such as medical, cultural, entertainment, sports, dining, and Scenic Spot. These directly affect children’s quality of life and activity space (Table 1).
Table 1. Child Supply and Demand Table.
Indicator CategoryResearch IndicatorsChild Applicability Indicator ExplanationQuantitative MethodsWeight
SupplyChild-Friendly Index
(Safety, Hygiene, Education, Entertainment, Child Participation)
Child-Friendly Index for Urban StreetsTrueSkill/CNN-BiLSTM0.1175
OpennessThe proportion of sky features in the image, along with its openness, provides children with opportunities for exploration and engagement
[34,43].
HRNet0.0885
GreennessVarious vegetation features in an image, along with multi-level vegetation density, create a sense of depth for children [43].HRNet0.1315
Pavement coverage rateThe proportion of paved surfaces in the image meets the requirements for safe pedestrian access for children
[34].
HRNet0.1016
EnclosureThe proportion of enclosed elements in the image affects their sense of safety and exploration space
[44,45].
HRNet0.0828
SidewalkThe proportion of sidewalk elements in the image impacts the safety and autonomy of children’s activities
[34].
HRNet0.1185
Fence rateThe proportion of fencing elements in the image affects children’s independent mobility and social interaction [46]HRNet0.0958
Traffic flowThe proportion of motor vehicles in the image quantifies the varying threat weights different vehicle types pose to child pedestrian safety
[44].
HRNet0.1266
Color ComplexityThe diversity of colors in images makes children more susceptible to color-related influences [47].MATLAB0.0655
Visual complexityImage entropy values: Children are more susceptible to visual complexity factors [48]MATLAB0.0717
DemandPopulation density of children aged 0–14Expressed in terms of population per square kilometer, this directly reflects the demand of children [49].ArcGIS0.2594
Number of cultural facilitiesCultural and educational venues support cognitive development, creativity, and social participation opportunities for children [50].ArcGIS0.2123
Number of medical facilitiesMedical accessibility ensures timely healthcare, reducing parental safety concerns and improving the overall livability for children [51].ArcGIS0.2087
Number of Entertainment facilitiesEntertainment facilities provide diverse play options that enhance children’s physical, emotional, and social development [52].ArcGIS0.0915
Number of Sports FacilitiesSports facilities promote physical exercise and peer interaction, contributing to children’s physical health and the development of teamwork skills [53].ArcGIS0.1116
Number of Scenic Spot FacilitiesScenic areas enrich children’s natural experiences and aesthetic needs [54].ArcGIS0.0392
Number of dining facilitiesA wide variety of dining options are available, providing convenience for children’s travel needs [55].ArcGIS0.0773
The core demands of child-friendliness are rooted in the UNICEF evaluation framework based on the Convention on the Rights of the Child, covering play, participation, safety or protection, health, and educational resources [56,57]. In existing research, child-friendly theory suggests five factors to assess environmental friendliness: safety, hygiene, entertainment, education, and child participation. “Safety”, a key dimension in child-friendly design, involves physical protection and psychological comfort through environmental elements, creating a perceived safe space for children. Compared to adults, children require more intuitive safety signals to reduce cognitive load [58]. To enhance accuracy, this study introduces the Collision Aggressiveness Index (CAI), which differentiates threats to pedestrians from various vehicle types, ensuring precise safety assessments, especially in high-density urban areas where traffic congestion and spatial compression increase safety risks [59,60,61,62]. “Hygiene”, for example, building walls can effectively reduce dust and garbage accumulation, and green walking routes have a positive impact on children’s health [44], promoting cognitive and behavioral development [63]. Environmental issues like graffiti and litter also make children feel unsafe [60,64], which is reflected in factors such as waste accumulation and Greenness. “Entertainment” impacts children’s cognitive development, learning abilities, physical development, and overall health [65]. Free play is crucial for children’s growth. Street node diversity, interface color variety, and spatial complexity are key to facilitating children’s play activities [63]. Enhancing the accessibility of child-friendly facilities and infrastructure guarantees that every child can derive benefits from the local environment [66]. The “Education” dimension incorporates design approaches like expansive green spaces, which encourage interaction with nature and foster learning engagement [66]. As noted in [67], public urban spaces function as co-educators-this highlights their role in children’s socialization, while also emphasizing the necessity of continuous assessment to clarify how such spaces influence children’s social development, civic awareness, and community involvement. “Child participation” allows children to engage independently, freely, and equally in the research and development of child-friendly streets, transforming “research on children” into “research with children”. This helps children assert their identity in the street as a living space and revitalizes the street as a public space [68].
For high-density urban streets, environment perception indicators such as Greenness reflecting natural interaction supply, Pavement coverage rate ensuring safety, enclosure balancing safety and exploration, and sidewalk supporting independent activities are extracted using the HRNet model from street images, accurately quantifying spatial supply in high-density environments. Visual quality indicators, including color and visual complexity, assess the street environment’s visual experience for children, avoiding negative impacts from information overload or monotony [69]. Traffic features such as traffic flow and fencing rate reflect the conflict between traffic flow and children’s activity spaces, measuring safety supply levels. Detailed indicators for each dimension are provided in Table 1. This study focuses on landscape visual features, excluding compatibility indicators.
This study focuses on the quantitative assessment of child-friendliness, prioritizing core indicators that are clearly associated with perceptions of child-friendliness. Some scholars have examined factors such as land use, road configuration, and blue visibility rates in semi-developed areas to explore perceptions of child-friendliness [44]. However, there are still significant limitations overall. For example, research scales predominantly focus on the community or city level, with little in-depth analysis of micro-level street characteristics. Secondly, research perspectives are often led by adults and based predominantly on small-scale studies. This makes it difficult to fully reflect the genuine demand of children regarding the urban environment. In order to address this issue, this study uses visual and landscape perception data to quantify the environmental features of streets in the urban core of Xiamen. It explores the nonlinear relationship between street environments and child-friendliness, providing empirical evidence to inform the planning of child-friendly streets that better align with children’s demand.

2.4. Data Collection and Processing

2.4.1. MEBS-Based Perceptual Data Collection in Children

This study employs the MEBS to assess children’s perceptions, emotions, and interactions within urban spaces [70,71]. By integrating animated characters and narrative scenarios into street view images and combining children’s emotional feedback with street environment data, the authenticity of the data is enhanced, making the perception data more aligned with children’s emotional and behavioral characteristics [72] (Table 2). The figure of “Nezha”, a widely recognized character in Chinese culture, was validated through a preliminary study with 30 children on 22 February 2025. A formal survey was conducted from 20 March to 20 April 2025, involving 200 children aged 6–14 and 79 parents. Gender balance was achieved with 105 boys (52.5%) and 95 girls (47.5%), and independent t-tests confirmed no significant gender differences in the perception results [73] (Table S1). The sample covered children in the transitional stage (6–14 years) as defined by the WHO, which is critical for their development and connection to the environment. To reduce familiarity bias, participants with varying lengths of residence were included, and random selection ensured sample representativeness (Table S2). In total, 600 valid questionnaires were collected, with each street view image receiving feedback from three children. The reliability coefficients (α values: 0.725–0.784) and KMO and Bartlett’s tests (KMO = 0.748, χ2 = 747.062, p < 0.001) confirmed the questionnaire’s reliability and validity (Table 3). The Child-Friendly Index was calculated and classified into five levels: Extremely Low (Level 1), Low (Level 2), Moderate (Level 3), High (Level 4), and Extremely High (Level 5), providing a refined multi-dimensional evaluation of child-friendliness across the regions.

2.4.2. High-Resolution Networks for Semantic Segmentation (HRNet)

The HRNet model is widely recognized for its strong generalization ability and stable performance in semantic segmentation tasks, particularly in analyzing landscape elements in images. Model 75 has improved the accuracy and efficiency of segmentation by combining high-resolution and low-resolution convolutions. HRNet has achieved state-of-the-art results on several benchmarks, including urban landscapes and the PASCAL Context dataset, consistently outperforming advanced models like DeepLabV3+ and PSPNet, especially in urban scenes. This demonstrates HRNet’s exceptional capability in processing complex visual data. Additionally, HRNet is efficient in handling semantic segmentation tasks with relatively low computational demands, making it ideal for large-scale datasets. In this study, HRNet successfully extracted key landscape indicators such as openness, greenness, pavement coverage rate, and building enclosure. These metrics were computed using the framework outlined in [74], with the specific method detailed in Equation (1):
L P = P l a n d s c a p e   p e r c e p t i o n P T o t a l × 100 %
In the Formula (1), LP represents the amount of landscape visible in the image, Plandscape perception is the number of pixels that are identified as landscape, and PTotal is the total number of pixels in the selected image region. These metrics form the foundation for quantifying the relationship between street characteristics and children’s perceptions of child-friendliness. During training of the CNN-BiLSTM model, a subset of image datasets was used. Combined with the TrueSkill algorithm, the model generates a Child-Friendly Index.

2.4.3. Image Computation Method Based on Matching Mechanism (TrueSkill) and Convolutional Neural Network-Bidirectional Long Short-Term Memory (CNN-BiLSTM) Prediction

This study uses the TrueSkill algorithm to annotate the training samples to construct a relatively stable and unified training dataset. TrueSkill is a Bayesian rating system that produces overall ranking scores based on the cumulative results of head-to-head matches. Scores are updated after each two-player match to produce new rankings of winners and losers [75].
This study uses the MEBS to collect children’s perceptions of urban street environments (Figure 3). In the questionnaire, children select images that match descriptions provided, and the system generates ranking scores based on their comparisons. After each round, the system updates scores based on image selection and calculates the average score to derive child-friendliness data. To combine children’s perceptions with spatial features, we use a machine learning model called CNN-BiLSTM, which is trained on 8800 randomly selected street images, with 20% used for testing. The model’s performance is evaluated using Mean Absolute Error (MAE) and R2, with R2 values ranging from 0.841 to 0.964 and MAE values ranging from 0.040 to 0.109. These results demonstrate that the model effectively extracts spatial features from street images and integrates them with children’s perception scores, ultimately generating a Child-Friendly Index for Xiamen’s central urban area. This method combines children’s perception data with spatial features to create a quantitative evaluation metric that reflects children’s subjective experiences, providing valuable support for urban planning and helping planners optimize spaces for children’s activities.

2.4.4. MATLAB Visual Complexity and Color Complexity Calculation

In this experiment, MATLAB R2023b software, known for its high compatibility, was used to calculate visual entropy and color complexity in image data. Visual entropy is commonly employed in landscape visual perception research to quantify the overall complexity of an image, while color complexity evaluates how color distribution in landscapes affects human perception. The calculation principles for visual entropy and color complexity are defined by Formulas (2) and (3) [76].
H x = i = 1 n P ( a i ) * log P ( a i )
In the Formula (2), n represents the number of regions with distinct boundaries, and i refers to each partitioned region. P(ai) is the occurrence probability of region ai and the information content, H(x), signifies the total information generated by the visual object consisting of n regions.
C k = i = 1 m n i log n i N
Formula (3) defines color complexity, where C(k) represents the complexity of the color space distribution, M is the number of connected regions, ni is the number of pixels in region i; and N is the total number of pixels for that color. MATLAB serves as the core tool in this study, offering data support through these calculations. Visual entropy provides insights into how spatial perception influences children’s emotions, while color complexity quantifies the role of color distribution in landscapes, helping assess its impact on children’s perceptions. Through these metrics, MATLAB enables the exploration of the bidirectional impact of spatial perception on children’s emotional states [77].

2.4.5. Hotspot Analysis (Getis-Ord Gi*)

The Getis-Ord Gi* statistic is used to evaluate the statistical significance of variations in child-friendliness between regions Getis. Hotspot analysis visualizes the geographical distribution of data and identifies patterns of spatial clustering in hot and cold zones. Following spatial autocorrelation validation, Gi* further analyzes the clustering or dispersion of the Child-Friendly Street Index. Its calculation Formula (4) is as follows:
G i = j = 1 n ω i , j x j X ¯ j = 1 n ω i , j S n / ( n 1 ) j = 1 n ω i , j 2 1 / ( n 1 ) j = 1 n ω i , j 2
In the formula, x j represents the quantity or sentiment value of sample j ; ω i , j denotes the spatial weight between events i and j ; n is the total number of samples; and x and S denote the mean and standard deviation of the samples, respectively. We assess the spatial clustering intensity of high or low values by examining the z-scores and p-values. Higher z-scores indicate tighter clustering of hotspots, while lower negative z-scores signify tighter clustering of cold spots. The Getis-Ord Gi* statistic helps analyze the spatial distribution of child-friendly facilities. By calculating z-scores and p-values, it reveals clustering patterns of high and low child-friendliness areas, providing data support for urban planning and helping improve child-friendly infrastructure.

2.4.6. XGBoost-GeoSHapley Additive Explanation Model

XGBoost is an efficient machine learning technique based on gradient boosting, which improves prediction accuracy by sequentially constructing multiple decision trees, where each tree corrects the errors made by the previous one. XGBoost has strong generalization ability and is widely applied in machine learning tasks [78]. SHAP is a tool for explaining machine learning predictions by breaking down the importance of each input feature, offering both local and global interpretations of the model’s outputs [79]. SHAP helps us understand which features have the most significant impact on the model’s predictions.
This study uses the XGBoost regression algorithm to construct a predictive model and optimizes hyperparameters through cross-validation to ensure the model’s robustness. First, five-fold cross-validation is used to tune the hyperparameters of the XGBoost model, enhancing its generalization ability and effectively preventing overfitting. Then, we compare XGBoost with traditional spatial statistical models to validate its stability and consistency in capturing spatial effects [40]. To further ensure the accuracy of the model and avoid bias, SHAP values are used to explain the model’s predictions, quantifying the contribution of each feature to the predicted outcomes. Additionally, bootstrap is applied to calculate the 95% confidence intervals (CIs) of the SHAP values, evaluating the model’s robustness and uncertainty.
In the analysis of different dimensions, the average R2 values for safety, hygiene, education, entertainment, and child participation are 0.806 (95% CI [0.78–0.83]), 0.876 (95% CI [0.85–0.89]), 0.906 (95% CI [0.88–0.92]), 0.856 (95% CI [0.83–0.88]), and 0.873 (95% CI [0.84–0.90]), respectively. The relatively narrow confidence intervals (approximately ±0.02–0.03) indicate stable predictive performance across the dimensions. However, the variability in the child participation dimension is slightly higher, suggesting that subjective perception data may introduce additional uncertainty. Therefore, this should be considered when applying the results to practical urban design or policy recommendations (Table 4). Additionally, the article also uses common validation metrics such as R2 and RMSE to further ensure the model’s prediction ability under different data conditions. These validation methods provide a comprehensive evaluation of the model’s performance, ensuring its stability and broad applicability in practical applications, while effectively avoiding potential biases from data splitting.
In this study, XGBoost is used to handle the complex nonlinear relationships between street environment factors and child-friendly perceptions, enabling the extraction of important features from high-dimensional data and making predictions. GeoSHapley, on the other hand, extends traditional Shapley values by incorporating geographic coordinate variables, enhancing our understanding of the interrelationships of features in space. GeoSHapley overcomes the limitation of treating spatial features as independent, capturing the spatial dependencies between features, and providing an analysis of the impact of each spatial location on child-friendly perceptions. This helps better understand the importance of spatial attributes in model predictions [80]. The method is implemented in the GeoSHapley Python 3.8 library, and its calculation formula is shown below (Formula (5)).
ϕ i = S F { i } | S i | ! ( | F | | S | 1 ) ! | F | ! [ f ( S { i } ) f ( S ) ]
In the Formula (5), ϕ i denotes the GeoShapley value of feature i ; S stands for a feature subset that does not include i , and F is the entire feature set; | S | represents the number of features in subset S , while | F | represents the total number of features in set F ; f ( S ) is the model’s prediction when only subset S is used, and f ( S { i } ) is the prediction when feature i is included.

3. Result

3.1. Child-Friendliness of Streets

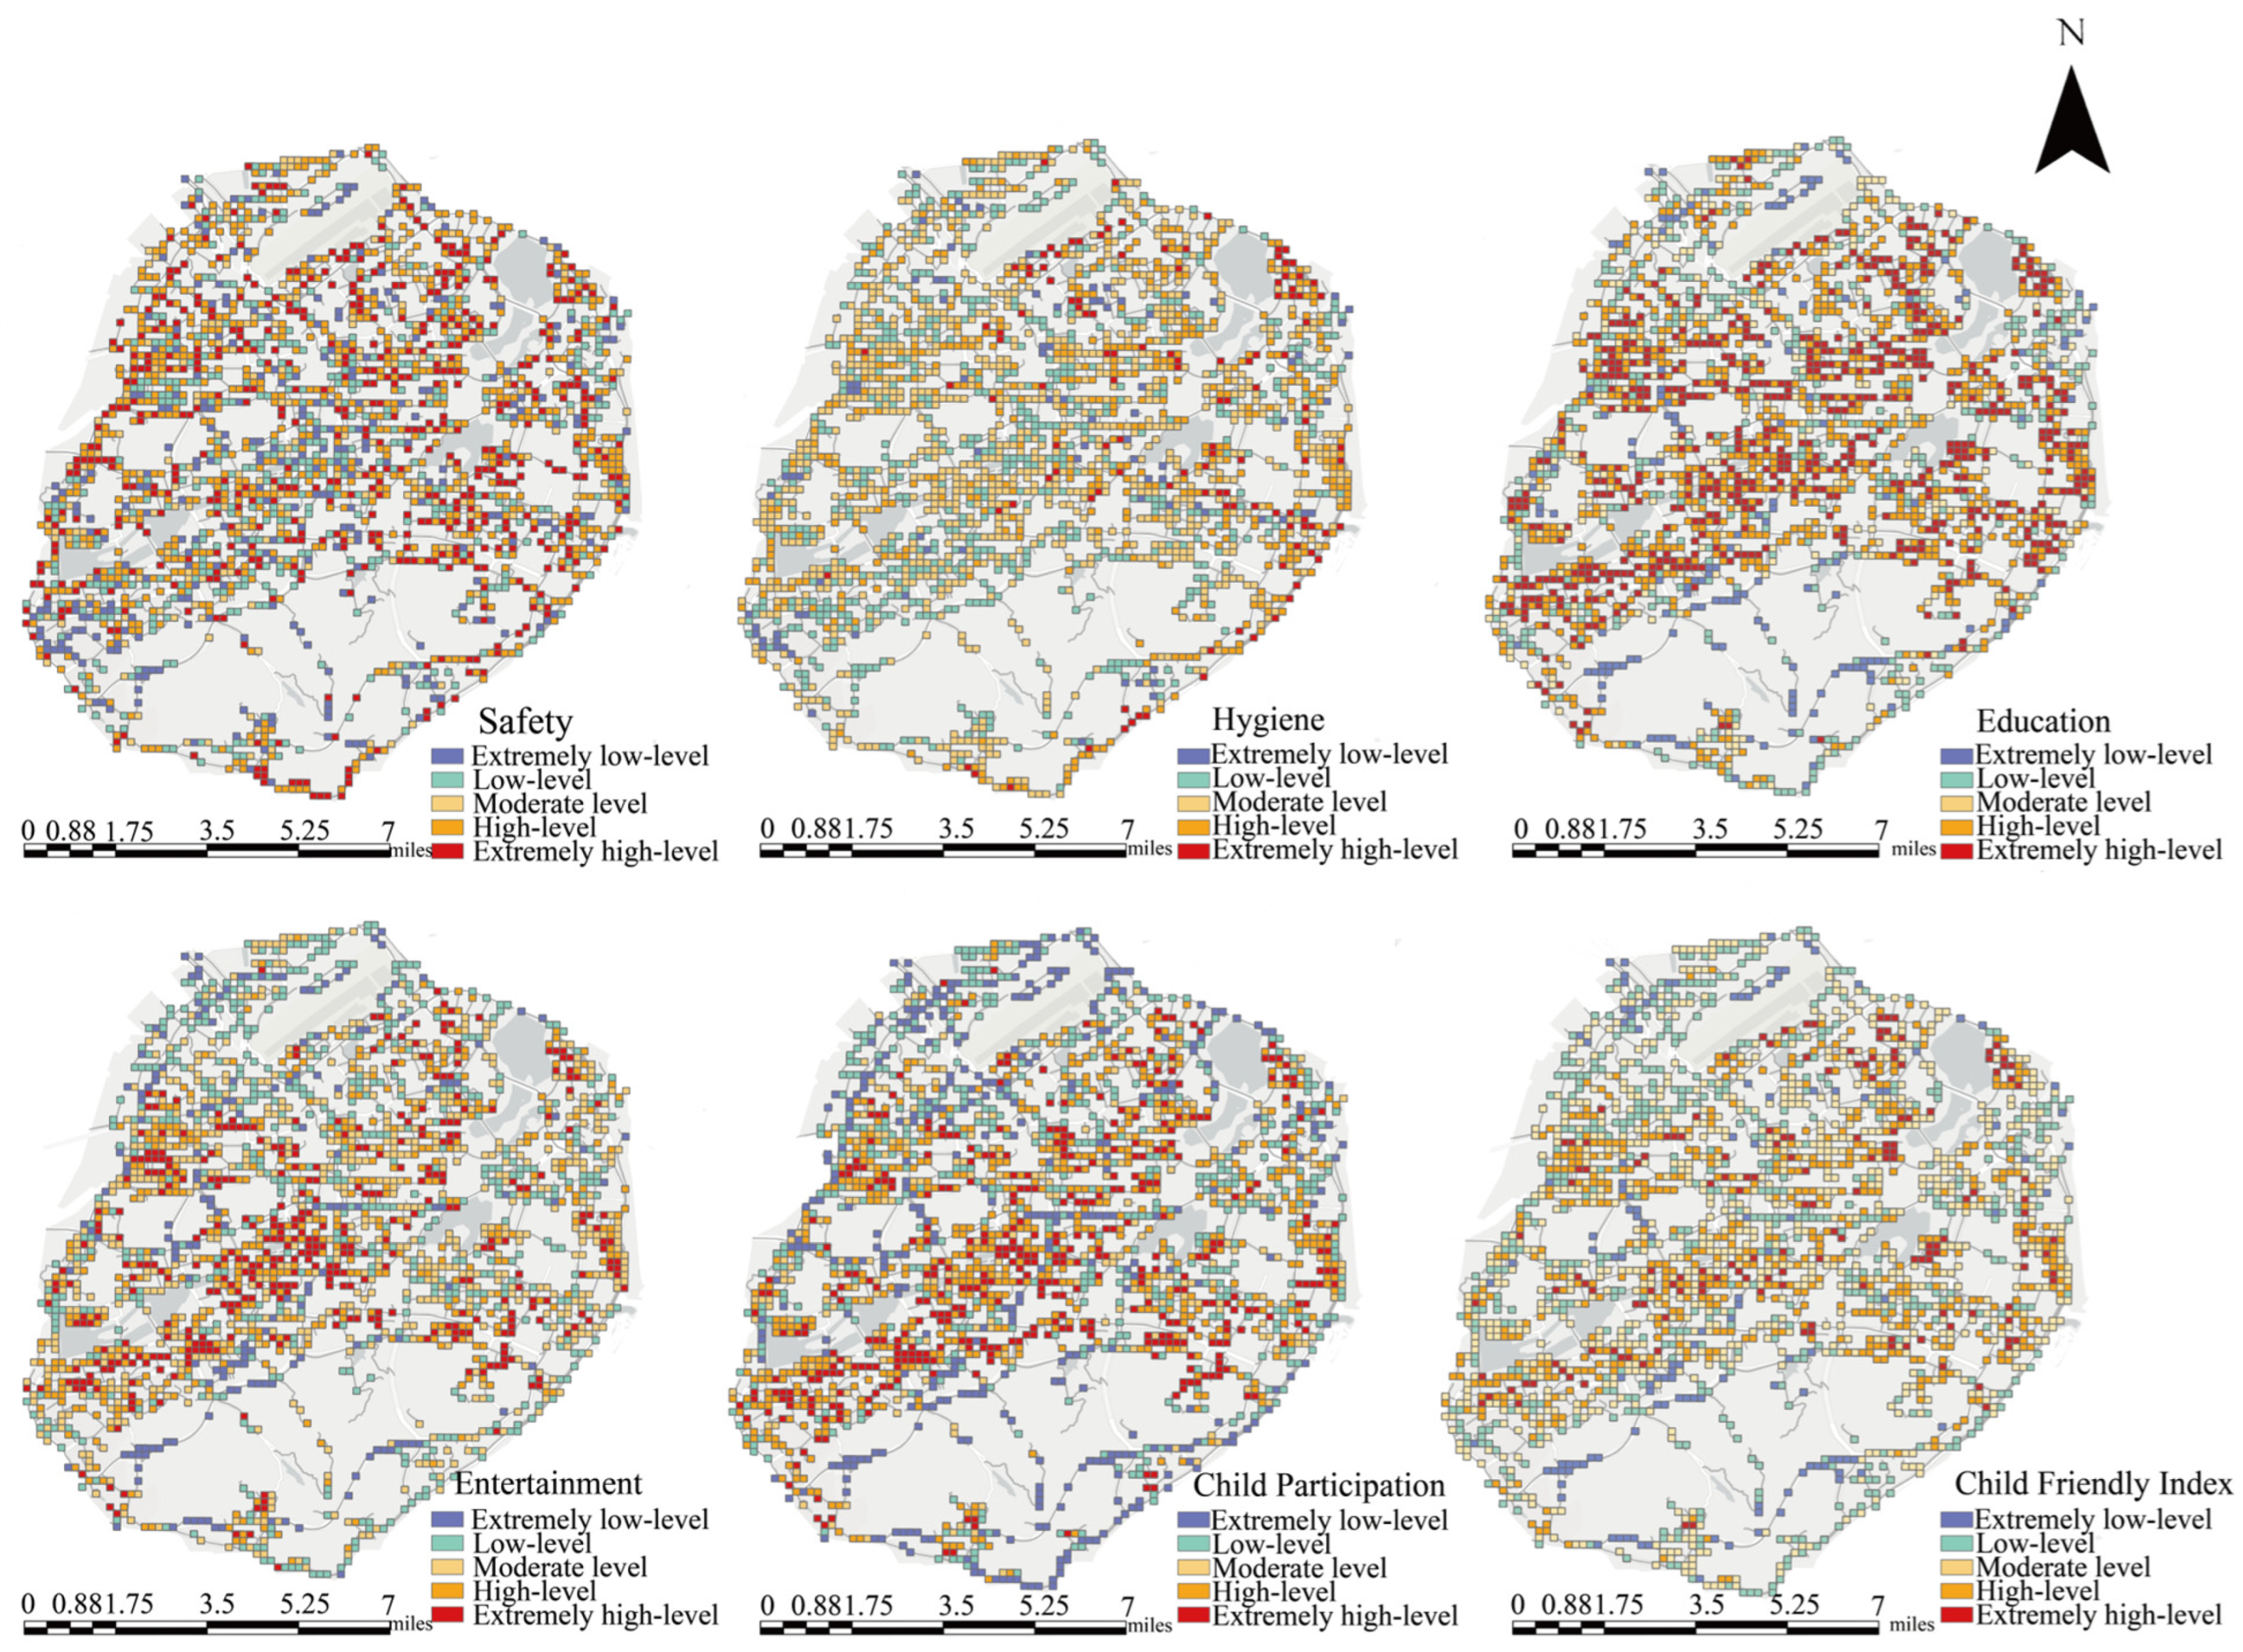
This study shows significant differences in how child-friendly area are perceived (Figure 4). In terms of safety, 42.85% of streets were rated as extremely safe, while 23.12% were rated as very unsafe are spread across the area, showing that there are safety issues and no clear trend in development. While some streets demonstrate strong safety performance, in others, children face elevated risks.
Notably, high hygiene levels are mainly found in the Huli District. In terms of education, 50.31% of streets are rated as high, while 12.61% are rated low. High-rated streets tend to cluster, with more high-rated streets and fewer low-rated ones, which is a relative strength. However, attention must be paid to isolated areas lacking educational facilities. In terms of entertainment, 48.75% of streets were rated ‘high,’ while 34.23% were rated ‘low.’ High-rated entertainment streets are usually near parks or city centers. By contrast, low-rated ones are mostly in busy traffic areas or city outskirts—this leads to uneven distribution of entertainment facilities. In terms of children’s participation, 47.41% of streets reached an ‘extremely high’ level, while 25.42% remained ‘extremely low.’ High-participation streets are concentrated in city centers, but in urban edges and some suburban areas, children’s opinions are mostly ignored. Several factors influence a street’s child-friendliness. While progress has been made in creating a child-friendly environment in Xiamen, more balanced development is still needed (Table 5).

3.2. Cluster Analysis of Child-Friendly Spaces in Urban Districts

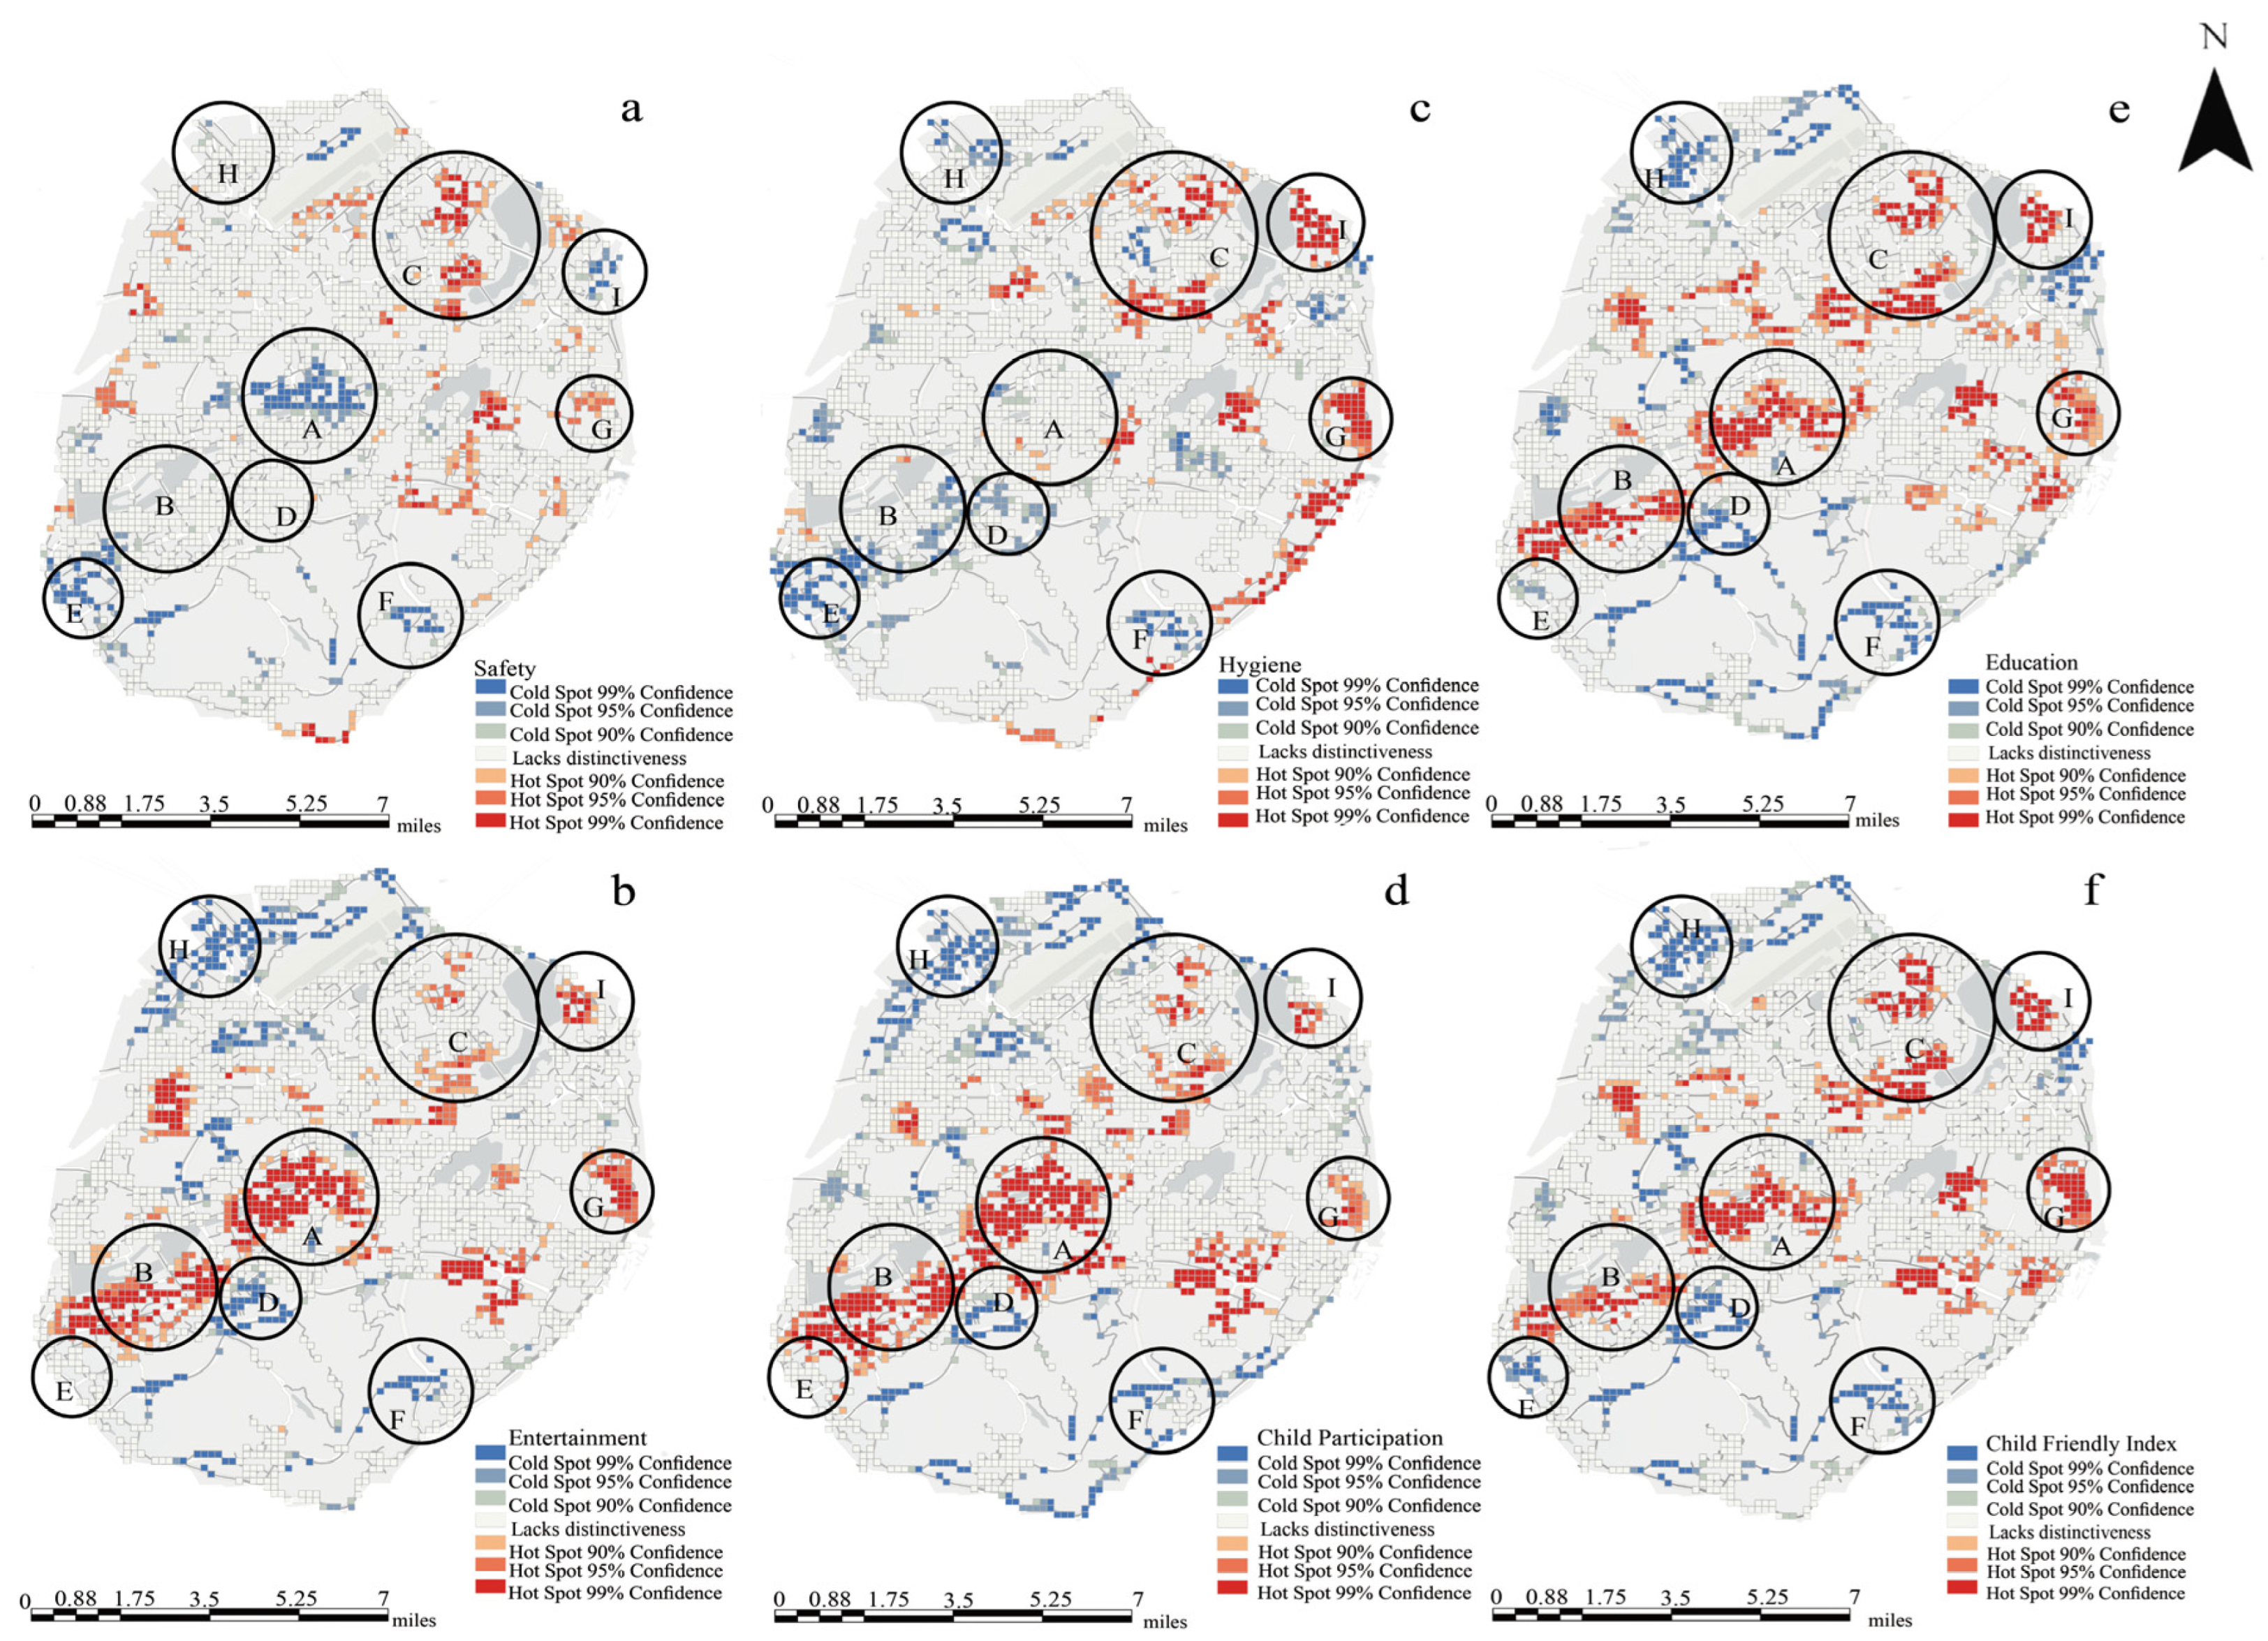
This study performs a hotspot analysis to identify areas with high and low values for each indicator (Figure 5). We assign confidence levels (90%, 95%, or 99%) based on how significant the clusters are, with higher confidence levels showing stronger patterns. In terms of safety, areas with fewer child-friendly features were identified near Areas A (Jiangtou Street), E (Zhongshan Street and Kaiyuan Street), F (Yunding South Street), and I (Xiang’an Avenue). Significant hotspots were found in Areas C (Wuyuan Bay) and G (Guanyinshan Street), both located near Wuyuan Bay Street. In terms of health, significant cold spots were primarily found near Zones E, B (Bailuzhou Park), D (Jinshan Street), F, and H (Jimei Avenue), while significant hotspots were observed near Zones C and G around Wuyuan Bay in Huli Subdistrict. In terms of education, significant hotspots were found in Zones A, B, C, and G, while significant cold spots were identified near Zones D, E, F, and H. In terms of entertainment, significant hotspot clusters were found in Zones A, B, C, I, and G. Significant cold spots were observed near Zones D, F, and H. In terms of children’s participation, significant hotspots were found in Zones A, B, C, E, I, and G, while significant cold spots were observed near Zones F and H. The Child-Friendly Index reveals significant hotspot clusters in Zones A, B, C, D, I, and G, as well as notable cold spots near Zones D, E, F, and H. The central areas of the city lack enough safety and hygiene for children, failing to meet their basic needs. The impact of different landscape metrics on child-friendliness is a topic that warrants further research.

3.3. Spatial Distribution of Child-Friendly Supply and Demand Levels

This study divides ‘demand for child-friendly spaces’ into two types: social demand and material demand. Social demand is based on the number and location of children aged 0–14, showing how much need there is for child-friendly environments in different areas. Material demand refers to infrastructure, like the locations of schools, playgrounds, and hospitals, which affects how easy it is for children to access activity spaces. Supply refers to how well the urban environment meets children’s needs, including safety, hygiene, education, entertainment, participation, and the local landscape. Factors like greenness, traffic safety, and facilities affect how children see the area. The study classifies supply and demand into high, medium, and low levels to analyze their relationship and identify mismatched areas. Quantitative indicators support urban planning for optimizing children’s activity spaces. By combining AHP weights for supply and demand allocation with spatial characteristics and demographic data, the study quantifies the differences between urban supply and demand.
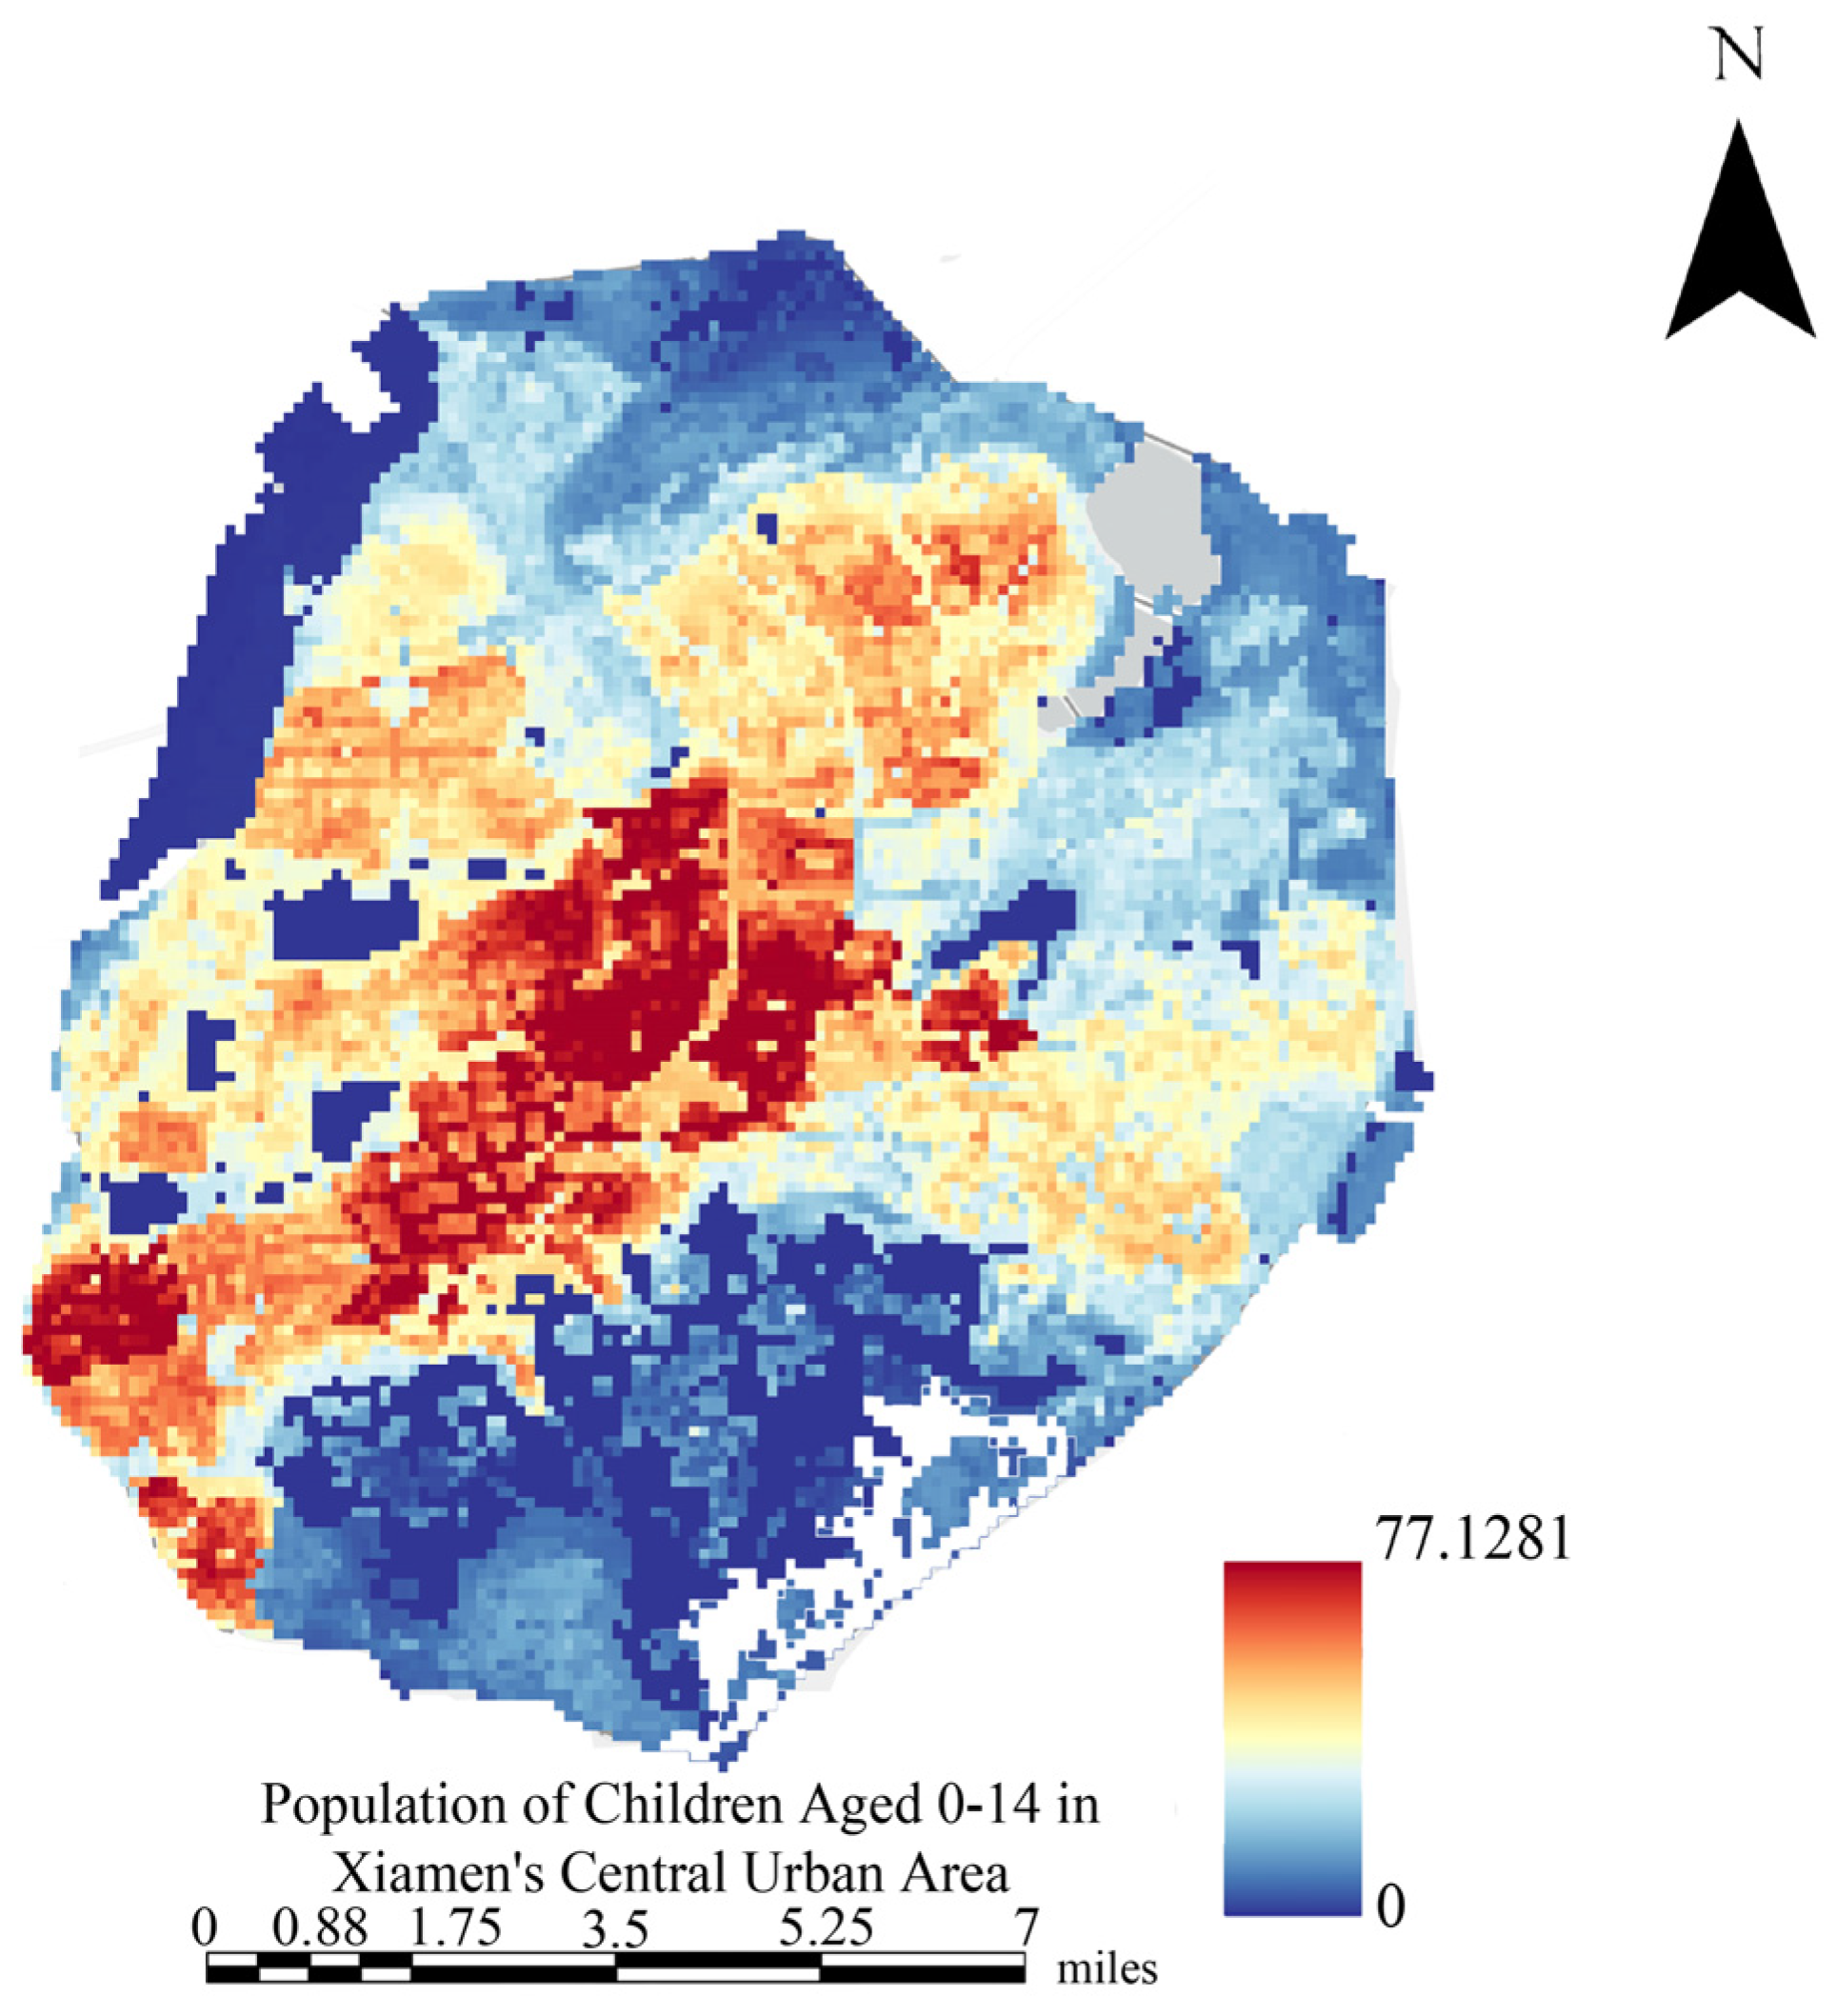
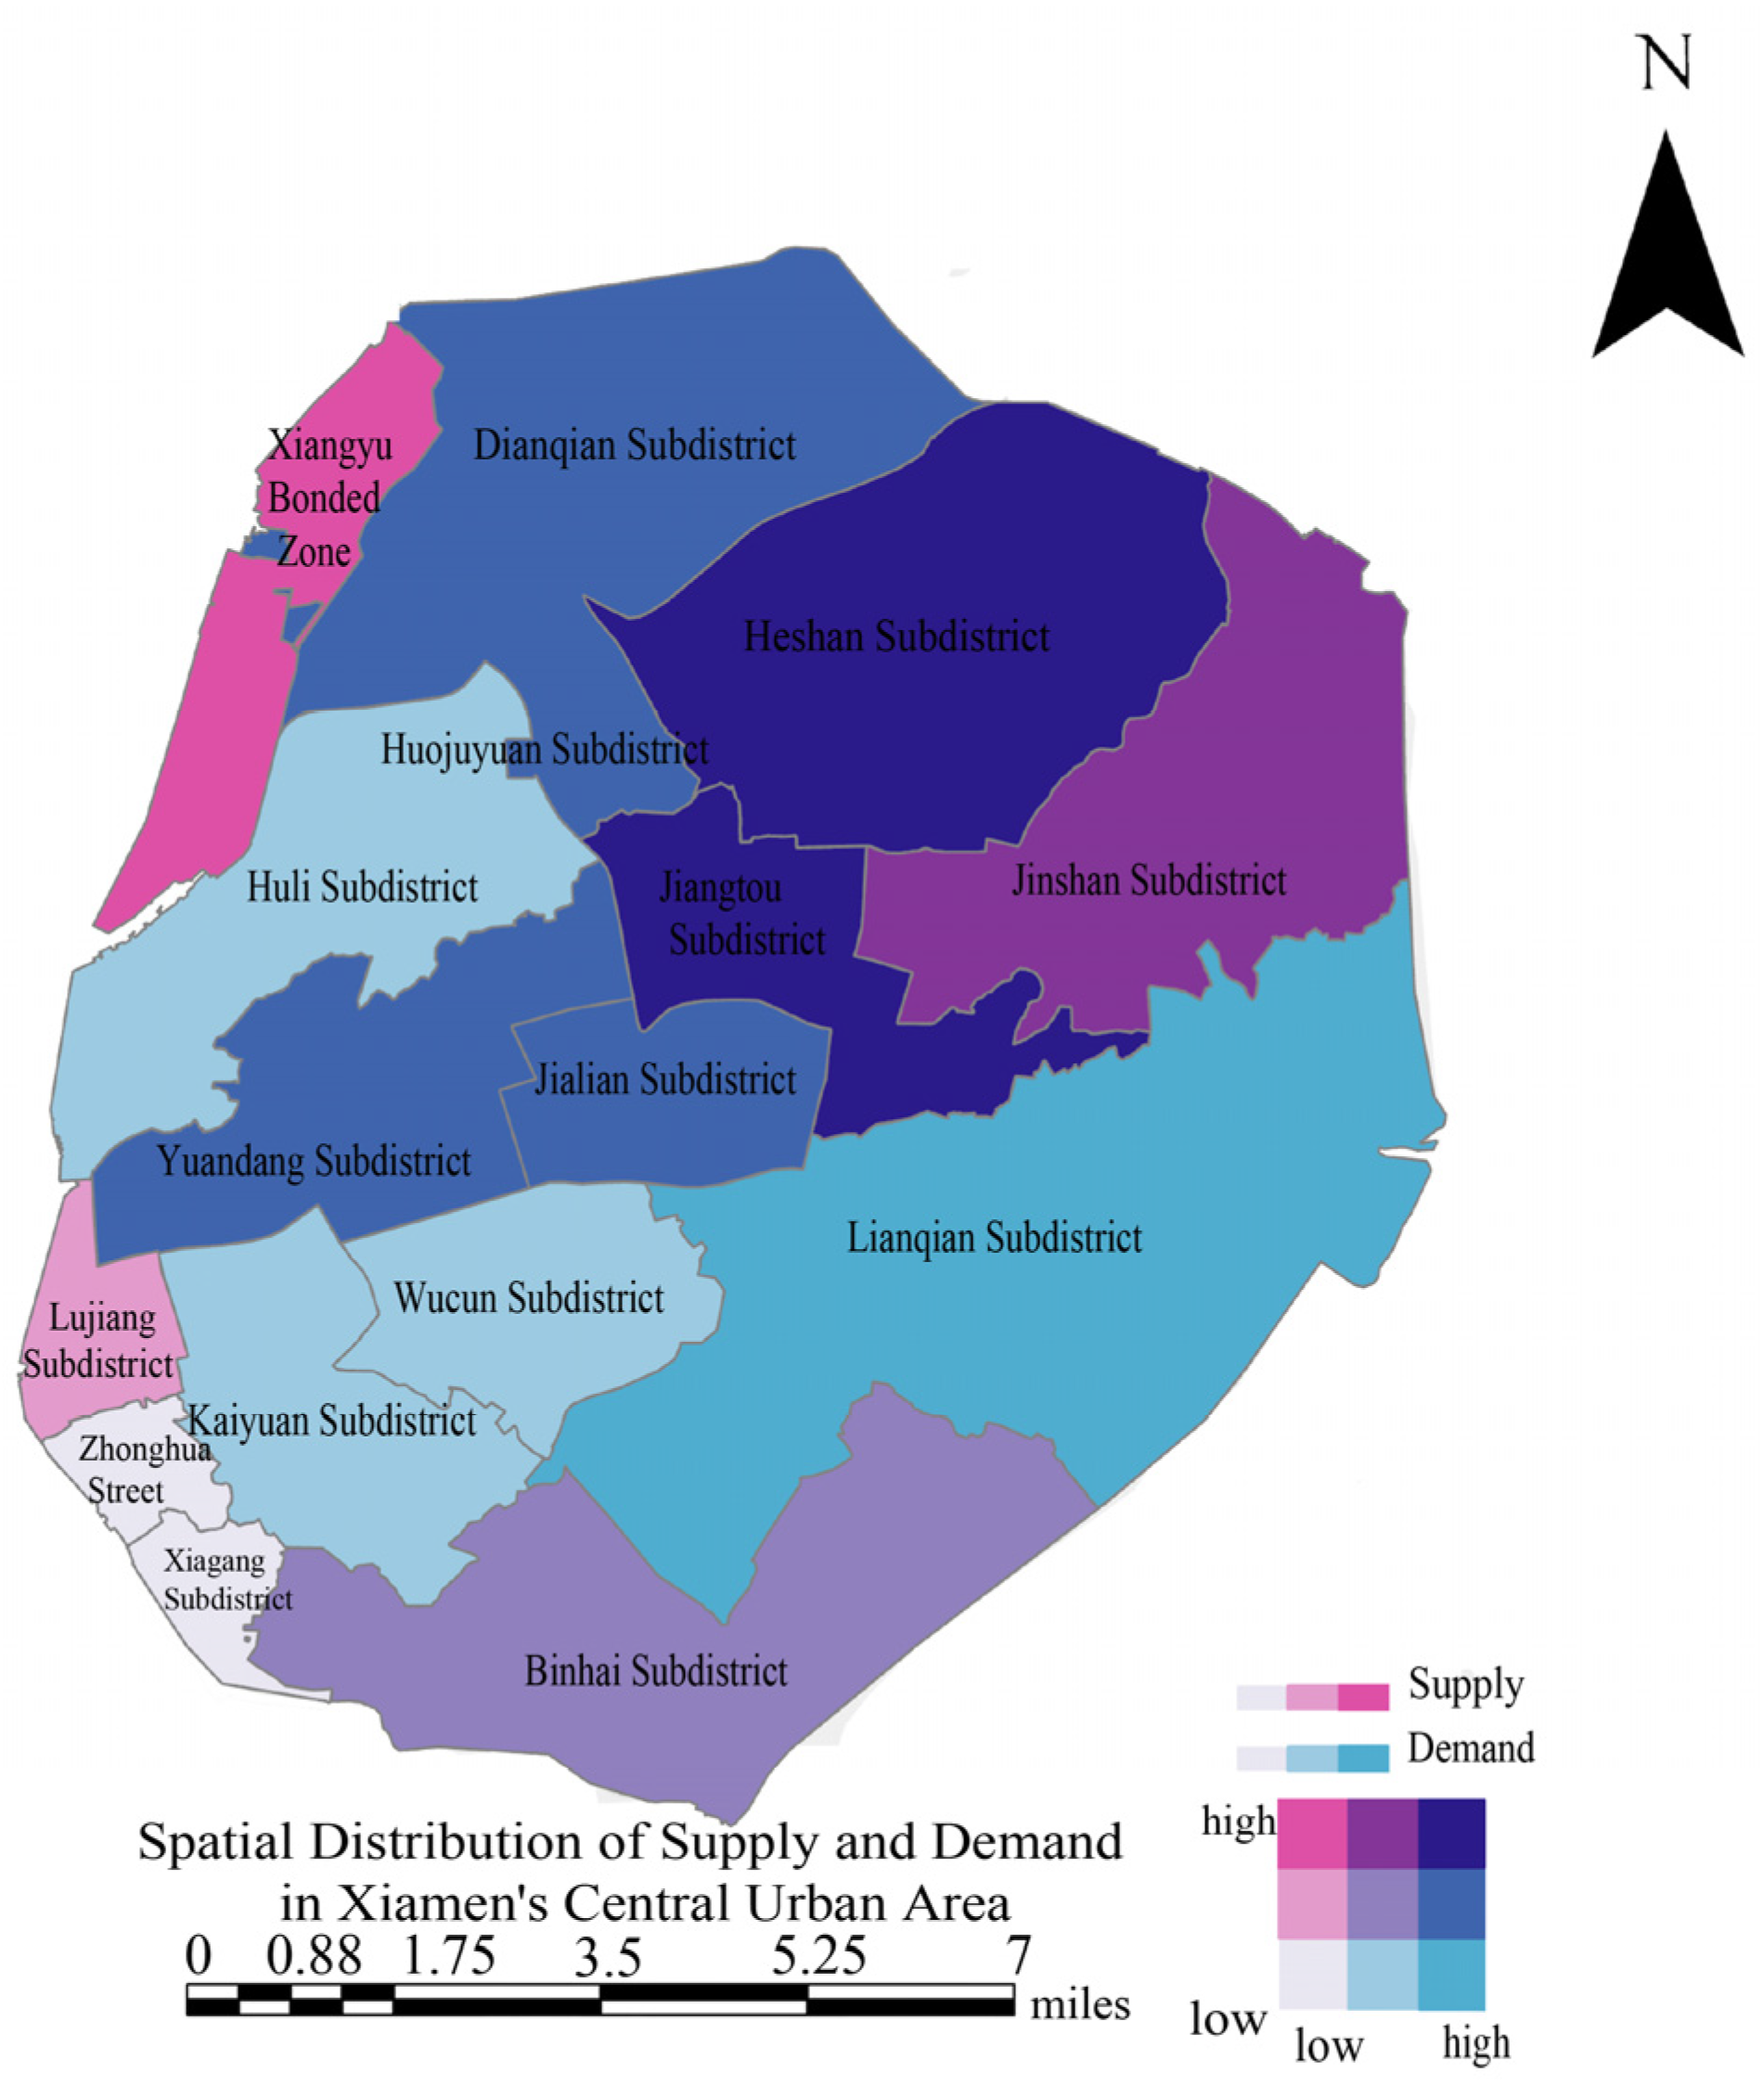
Xiamen’s central urban area exhibits a significant disparity between supply and demand. Figure 6 shows the population density distribution of children aged 0–14 (Figure 6), and Figure 7 shows the spatial distribution of supply and demand (Figure 7). Huli Subdistrict stands out as a high-value area with good supply and demand, featuring high demand concentration. Heshan and Jiangtou Subdistricts represent high supply–high demand zones, with high greenness (14.06%), openness (36.95%), subdistrict safety (45.67%), and hygiene (53.55%), showing an ideal supply–demand match. Jinshan Subdistrict, a high supply–medium demand area, has comprehensive infrastructure and a high pavement coverage rate (71.67%) but lower population density (14.12 people/hectare), maintaining a good match. Xiangyu Bonded Zone, a high supply–low demand area, has adequate facilities, especially entertainment, but low population density limits demand. In areas with medium service supply but high demand, such as Dianqian, Huojuyuan, Jialian, and Yuandang Subdistricts, the supply of facilities does not meet high demand, especially in entertainment and education. For instance, Huojuyuan Subdistrict has few entertainment facilities, heavy traffic, and narrow sidewalks (0.66%), which limits the space available for children’s activities. Binhai Subdistrict is a medium supply–medium demand area with high greenness (20.65%) and Visual complexity (88.48%), yet its facilities fall short. Lujiang Subdistrict, with medium supply–low demand, has visual complexity (91.73%) and high greenness (3.88%), offering some natural scenery, but the demand remains low. Lianqian Subdistrict is a low supply–high demand area with insufficient facilities, especially in dining and entertainment, failing to meet high demand. Kaiyuan, Huli, and Wucun Subdistricts are low supply–medium demand areas with high greenness and openness but issues with subdistrict safety and traffic flow, leaving facilities inadequate to meet demand. Xiagang and Zhonghua Subdistricts are low supply–low demand areas; although safety and sanitation are good, insufficient child-friendly facilities limit their potential.
Overall, the supply–demand spatial model of Xiamen reflects regional development characteristics. Siming District faces a high demand-supply imbalance due to its historical function. Zhonghua and Xiagang Subdistricts show poor supply–demand matching and unmet demand, which may increase over time. Areas like Lianqian and Xiagang Subdistricts with mismatched supply and demand should be prioritized for resource optimization. Learning from Heshan and Jiangtou Subdistricts, which promote a positive cycle between the spatial environment, perceived livability, and population demand, will help improve Xiamen’s child-friendly environment. The next section presents the GeoSHapley contribution model analysis results using the XGBoost framework, examining how different indicators influence the child-friendliness index and exploring the complex relationships among variables.

3.4. GeoSHapely Contribution Plots for XGBoost Model: Spatial Effects, Nonlinear Effects, and Interaction Effects

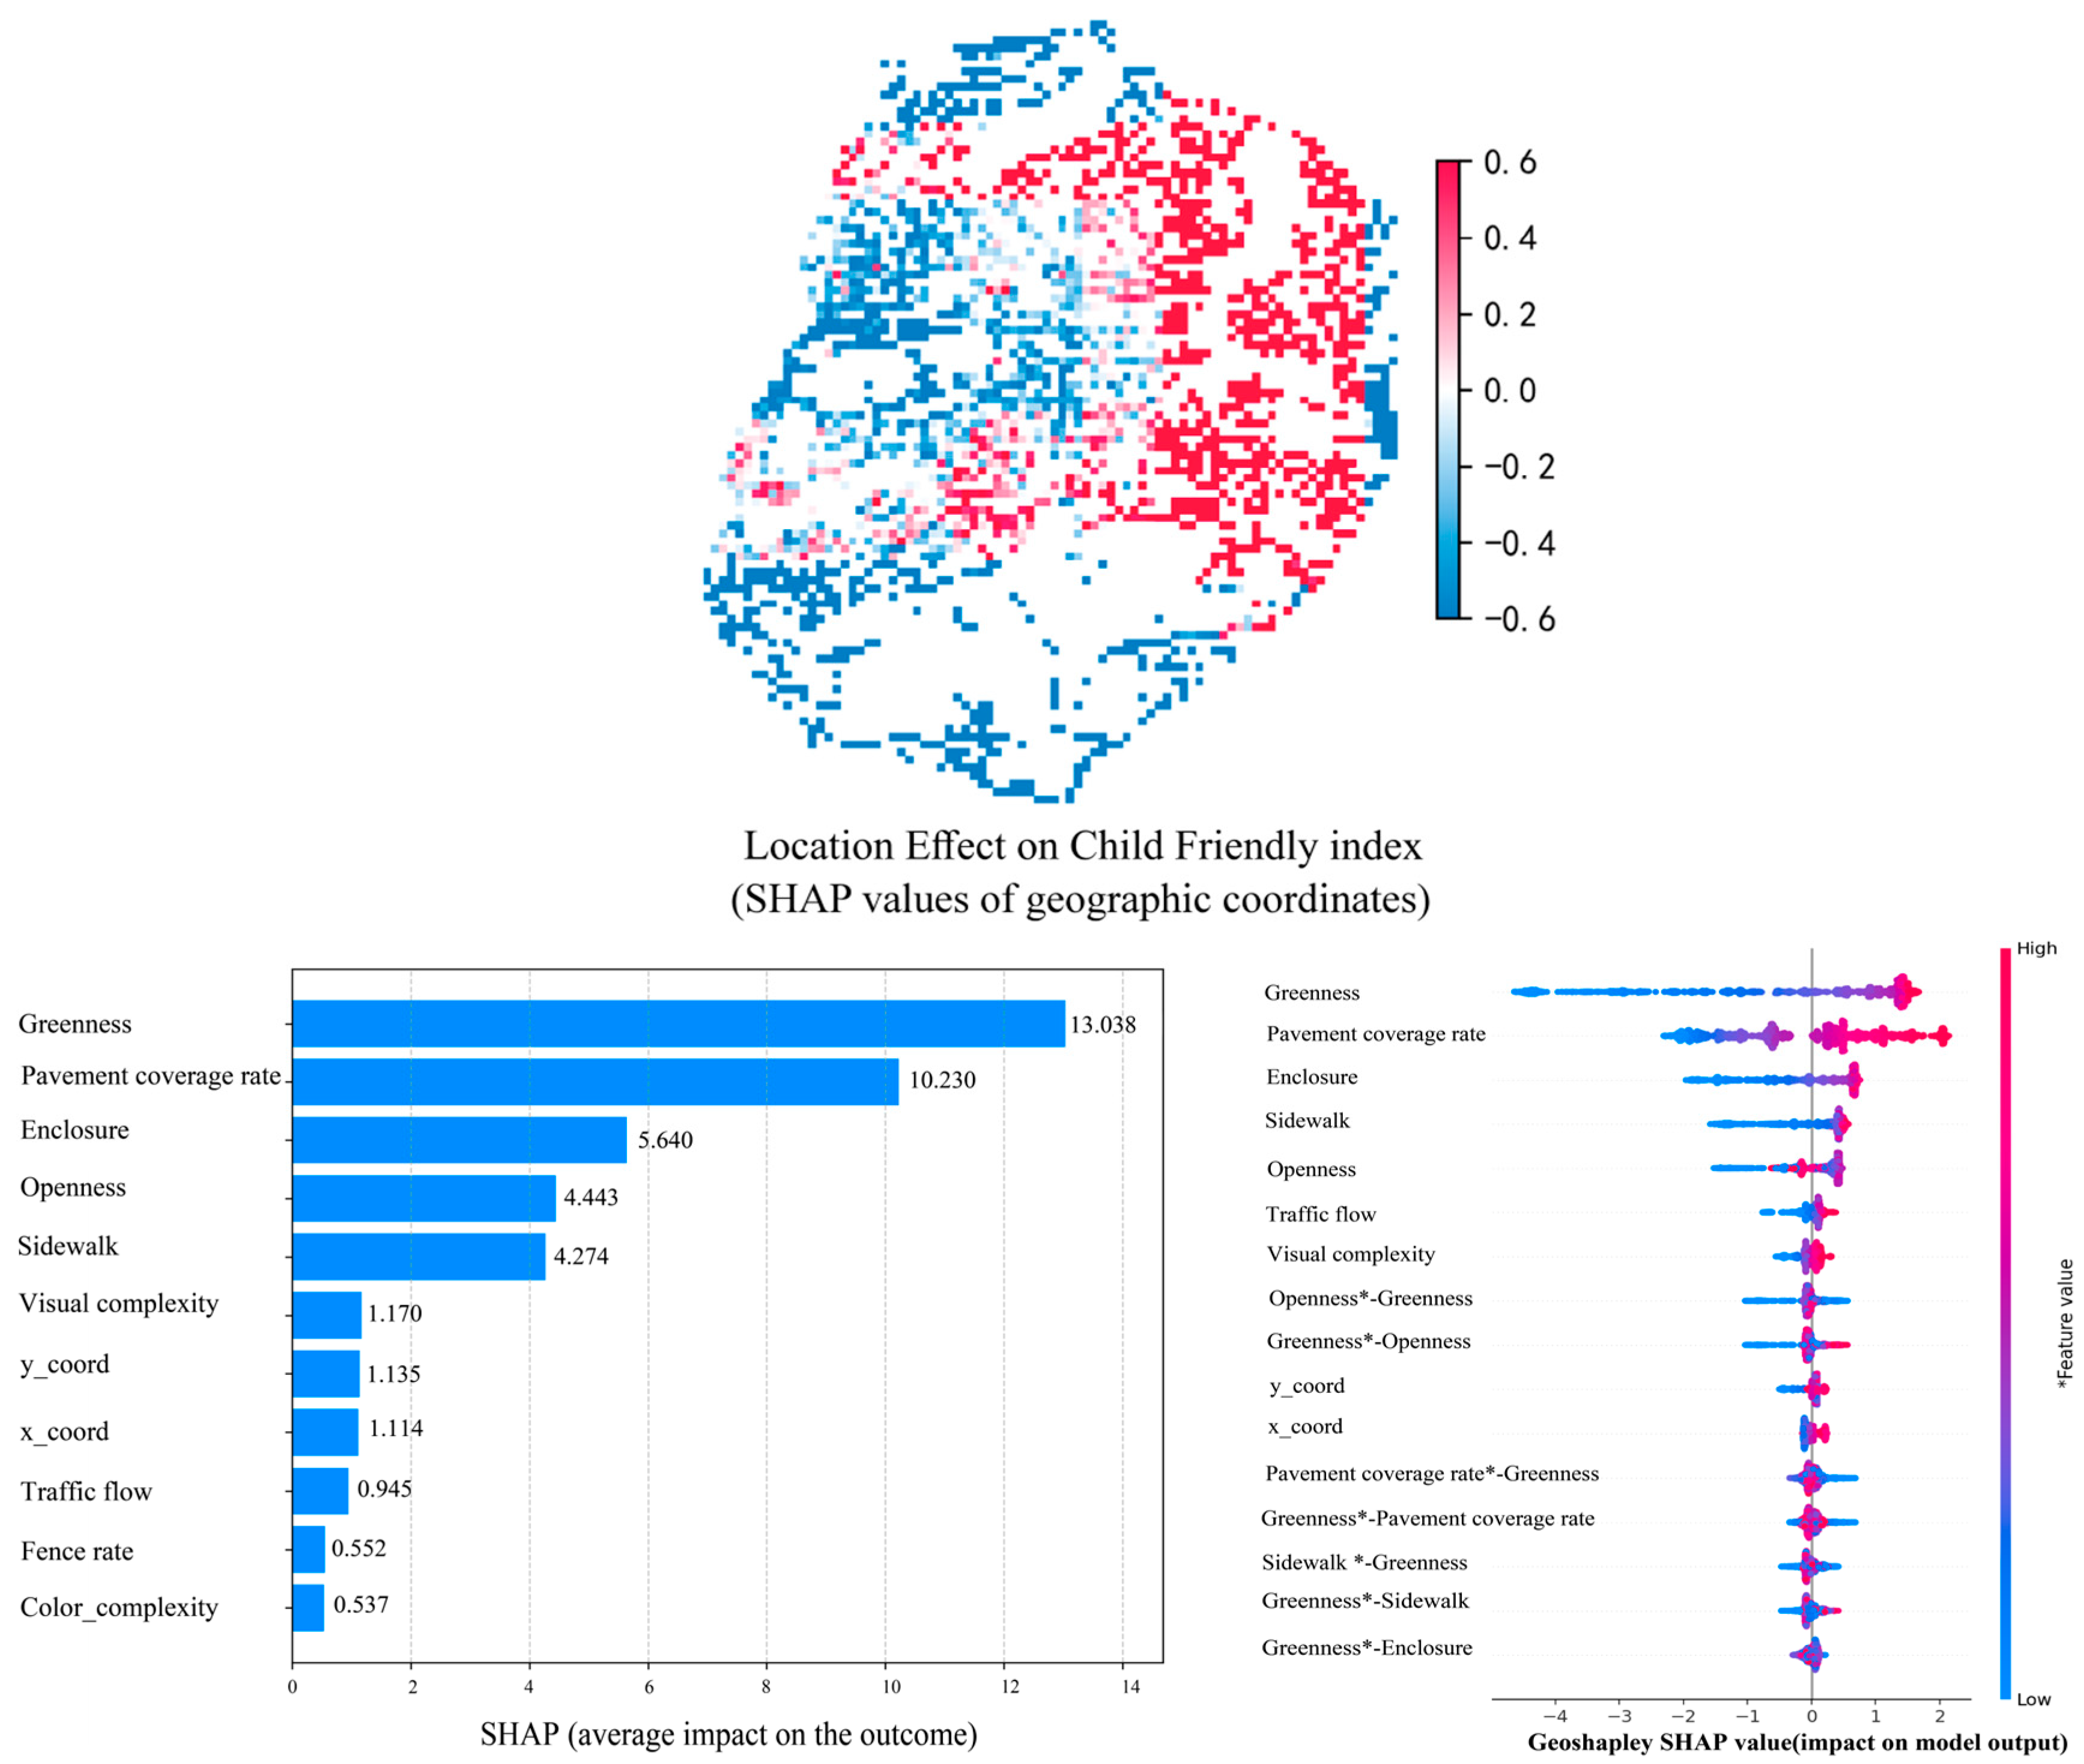
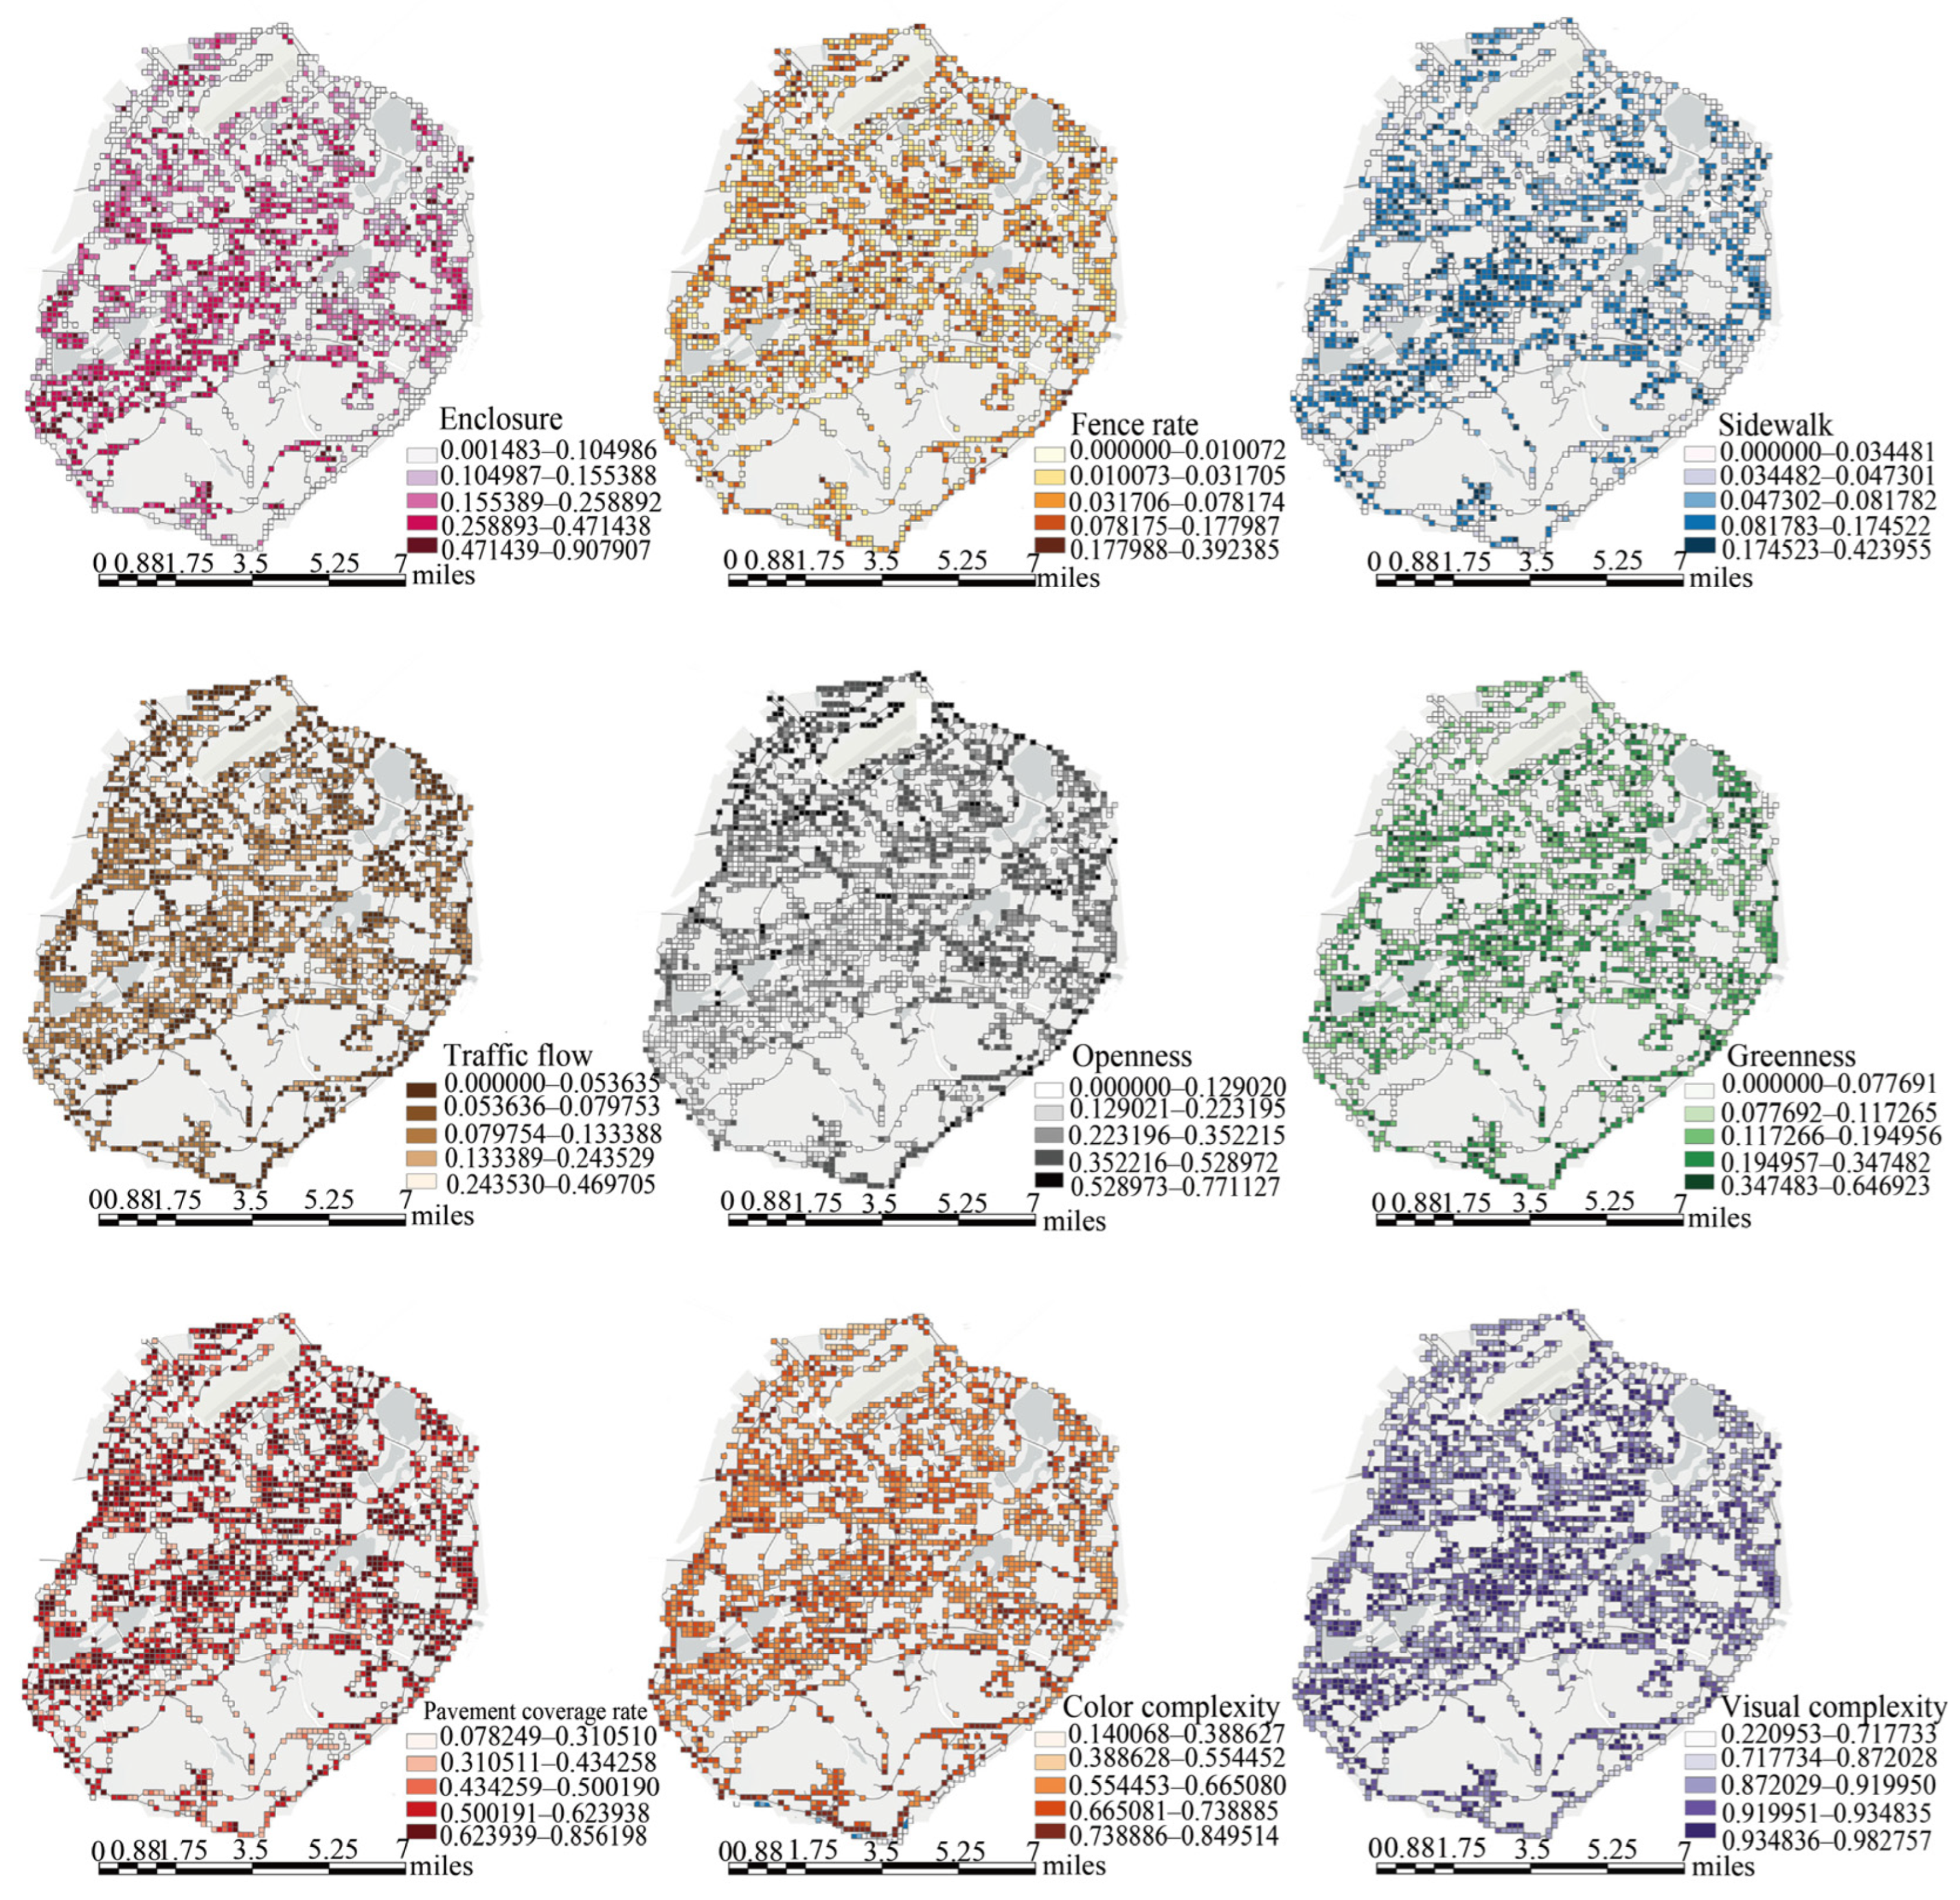
This section uses two techniques, GeoSHapley and XGBoost, to examine the factors that make urban streets safer and more child-friendly. These techniques help highlight the most important factors using clear charts. Figure 8 illustrates the significance of each feature and its spatial distribution. Figure 9 highlights the spatial arrangement of various street elements. The lower section of the figure displays a blue bar chart, which indicates the average contribution of each feature to the model’s outcome. The x-axis represents SHAP values, with colors indicating the raw values of each feature. On the right side of the figure, a color-coded plot visually emphasizes the most influential factors, where red represents higher values and blue represents lower values. This color scheme helps to easily identify the factors that have the greatest impact on the results. Analysis of the average contribution of the selected independent variables, as well as the geographic coordinates X and Y, to the supply and demand of children indicates that greenness is the most significant factor in influencing their basic demand. Its marginal effect is increasing, suggesting that improving Greenness can effectively promote perceptions of child-friendliness. To incorporate spatial characteristics, the study included the X and Y coordinates of ZCTA centroids as joint location features in the model. This approach explores the spatial interaction between features and location and how this influences perceptions of child-friendliness in the street environment.
The analysis shows how location affects child-friendliness, with red areas indicating places that improve it, and blue areas showing where it is worse. The northeastern area of Xiamen’s central urban district makes a significant positive contribution, while the southwestern region generally shows lower location-driven demand. The lower section of the figure shows that Greenness (13.038) and Pavement coverage rate (10.23) are the main indicators of child-friendliness in street environments, with importance scores significantly higher than other metrics. Enclosure (5.64) has a relatively minor impact, while the remaining indicators are ranked by contribution as follows: openness (4.443), visual complexity (1.17), x coordinate (1.114), y coordinate (1.135), traffic flow (0.945), fence rate (0.552), and color complexity (0.537). Additionally, significant differences were observed between greenness rates and color complexity scores. This disparity is presumed to stem from the complex colors and information overload of excessive street advertisements. When lacking visual balance, these advertisements may increase children’s psychological burden and even impact their behavior when crossing the road and their visual attention [81].
In global feature importance, there is a notable difference in the significance scores between the y-coordinate (1.135) and x-coordinate (1.114), with the GeoSHapley contribution value for the y-coordinate being higher. This suggests a significant north–south variation in the Child-Friendly Index. The southern part of Siming District, characterized by high-density built-up areas, experiences concentrated population and traffic flow. In contrast, the northern part of Huli District has lower development intensity, with fewer high-density residential areas. The map further reveals that the northeastern and central regions of Xiamen have the highest contributions, where, despite lower child population densities, the supply–demand match in densely populated areas remains low. This indicates a misalignment between the distribution of child-friendly resources and actual population concentrations. The discrepancy between areas with high resource availability and areas with high demand underscores the need for better spatial alignment in urban planning to match child-related resource allocation with population distribution.
In the diagram on the right, the points shift to the right and spread out more when there is higher pavement coverage. This shows that it has a stronger influence on the results. While more pavement coverage usually has a negative effect, high levels of pavement coverage can have a positive effect. The analysis indicates that changes in greenness can have a strong negative effect on child-friendliness, making the results less stable. It is important to minimize these fluctuations in the model design to make it more reliable. Openness exerts a relatively balanced influence on child-friendliness, mitigating instability. Analysis of interactions reveals a pronounced synergistic effect between the greenness and openness (Figure 8), amplifying the perceived child-friendliness. The synergistic effect between the visibility rate of pavement coverage rate and greenness, as well as the visibility rate of pavement coverage rate and greenness, shows a sharp decline (Figure 8). Despite increased paving coverage, issues such as tree roots damaging the pavement coverage rate and causing ground bulges, green belts encroaching onto children’s play areas, and low shrubs obstructing pavement coverage rate visibility can still lead to a sudden drop in the perception of the area as child-friendly. Simultaneously, there is a negative interaction between greenness and enclosure as greenness increases and enclosure expands, scores for child-friendliness decline. This is because dense greenery combined with high enclosure obstructs visibility, making children feel insecure. However, when the Greenness is below 0%, the impact of increased enclosure on the child friendly index is relatively balanced.

3.5. Nonlinear Marginal Effects

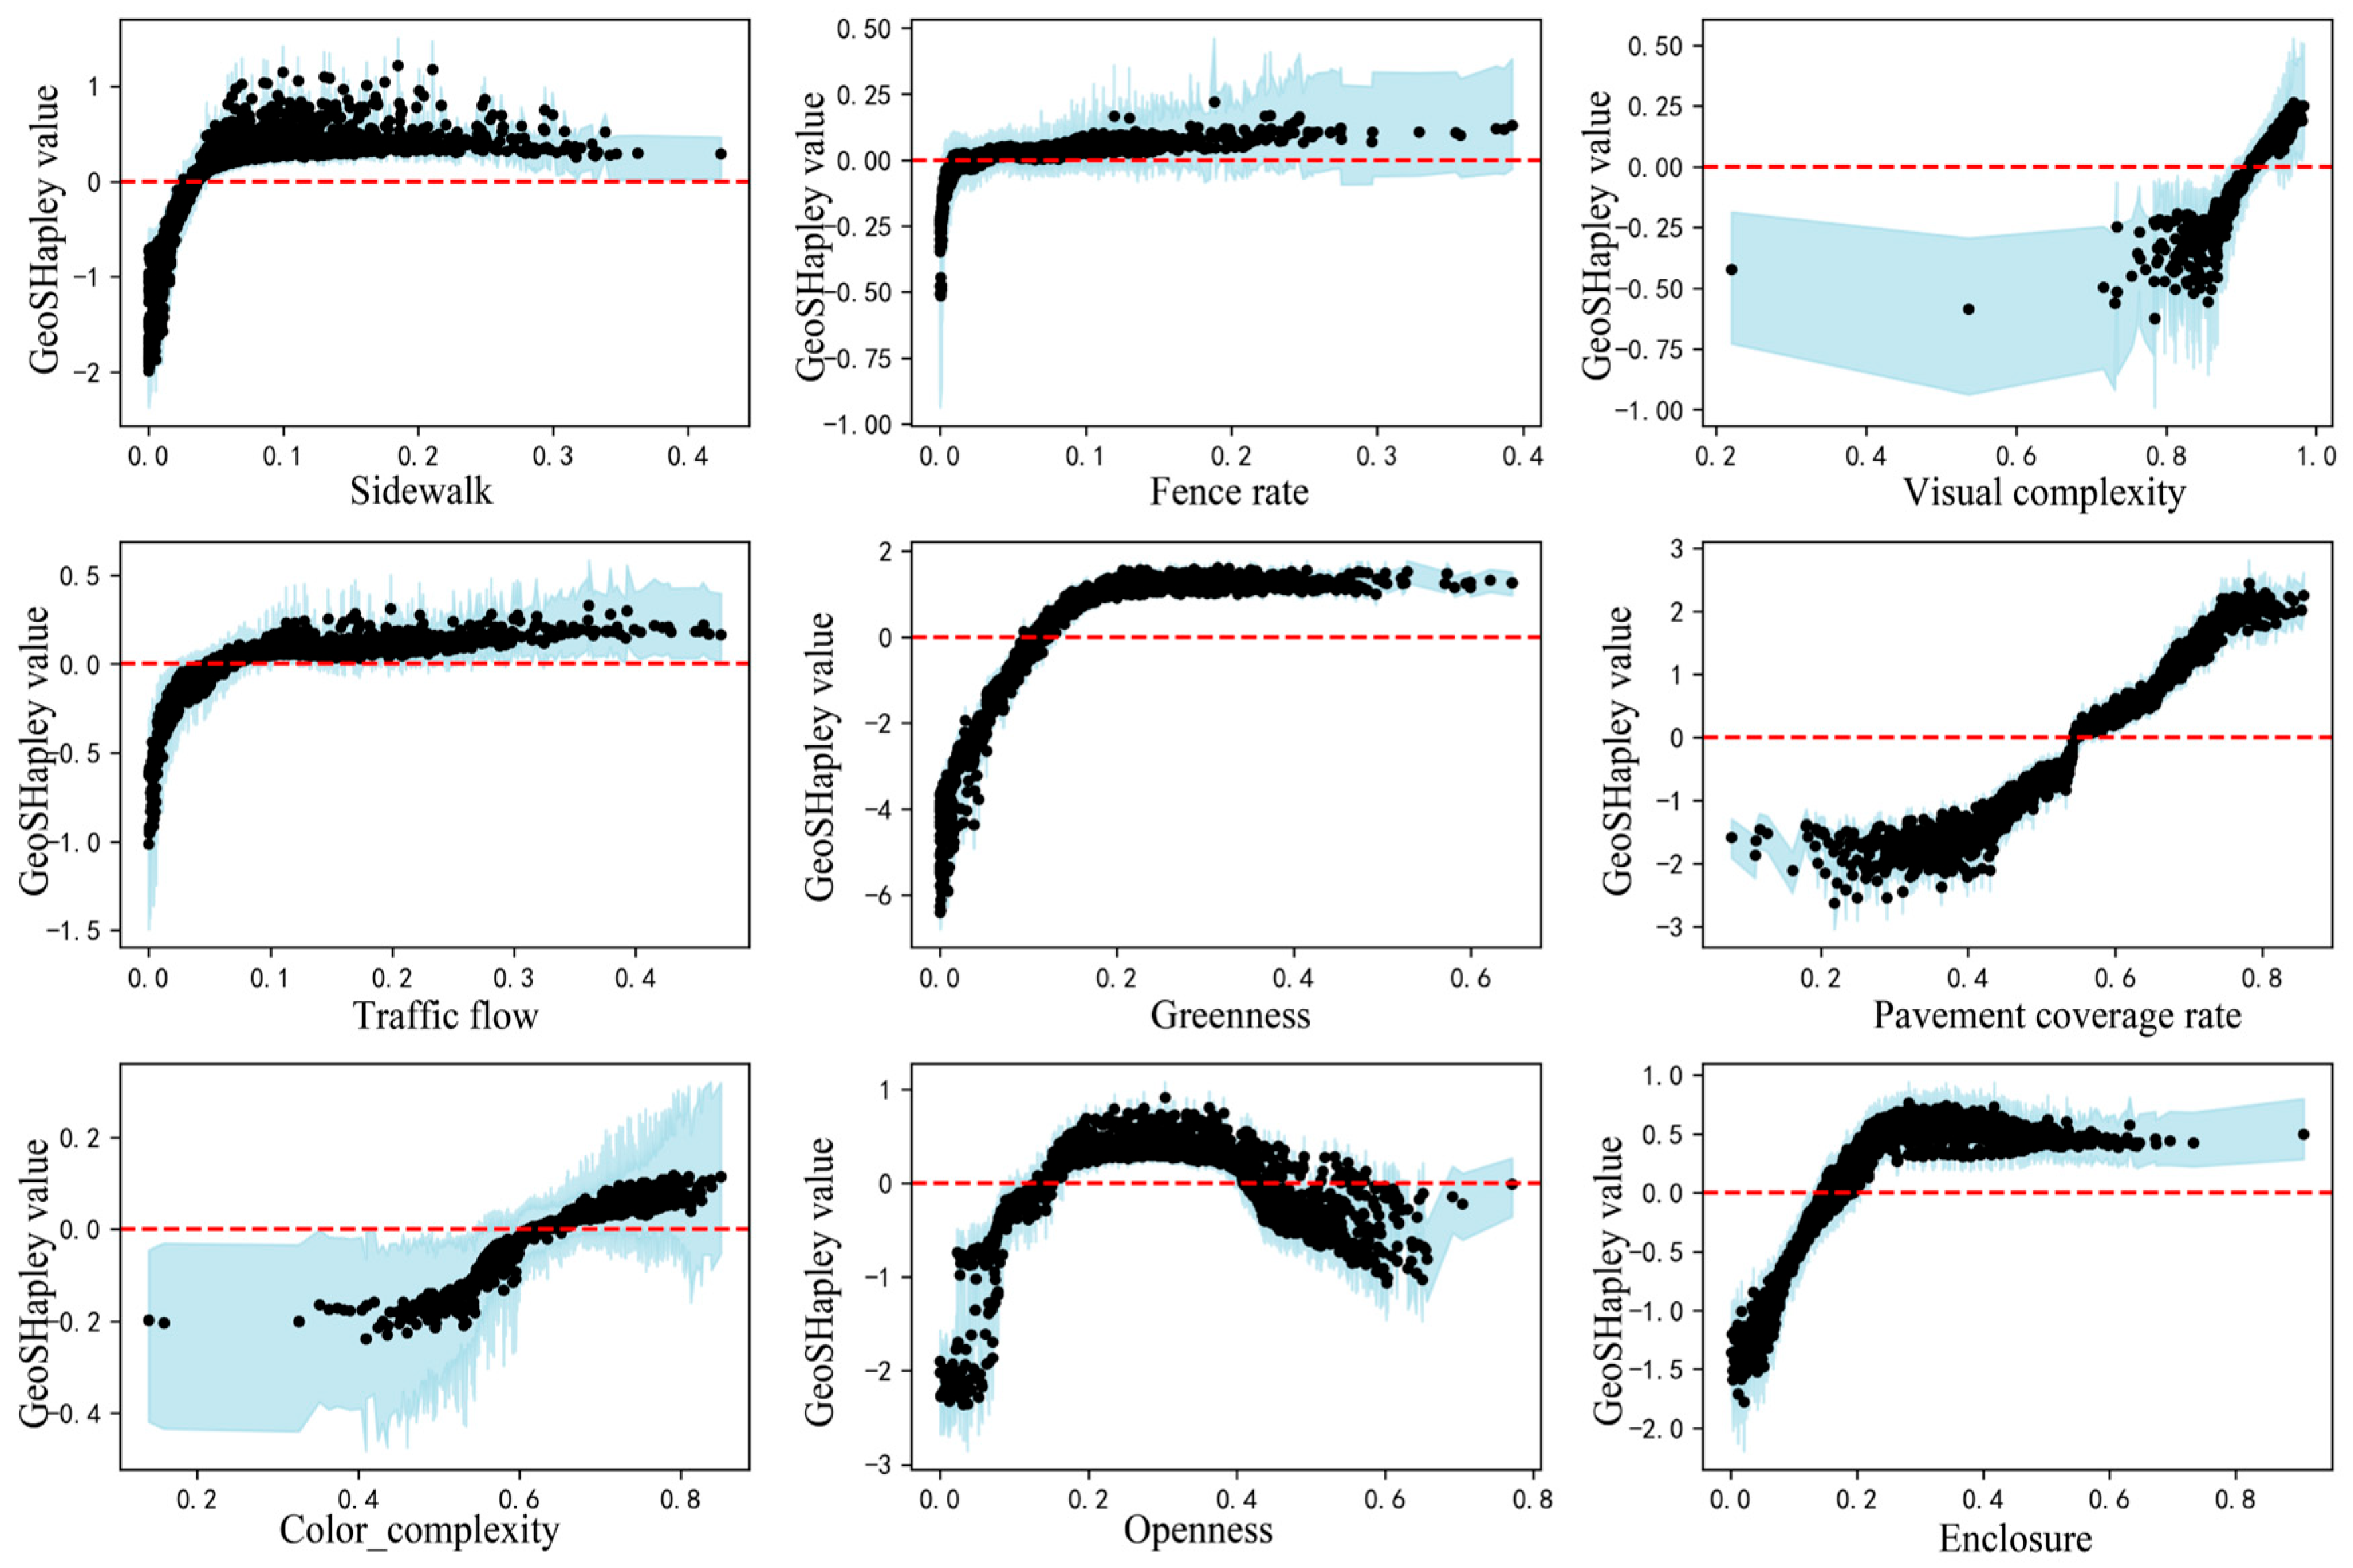
Previous studies have not fully looked at how nonlinear effects from different variables impact our understanding of child-friendly spaces. This study shows that each factor affects child-friendliness in different ways (Figure 10).
For example, as pavement coverage increases, it gradually has a bigger impact on child-friendliness. Once the pavement coverage exceeds 50%, the effect stabilizes. This phenomenon is because sidewalks are typically closely correlated with road classification wider Pavement coverage rate are commonly found alongside primary and secondary arterial roads, which children are less likely to choose for active commuting [82]. Higher traffic flow volumes on major roads pose safety risks and psychological stress for children walking or crossing these routes. Factors like fences, visual complexity, traffic flow, and greenery usually make a space more child-friendly. However, too many fences can have the opposite effect and make a place feel less welcoming. When there is no greenery, increasing it a little makes a big difference in how child-friendly the area feels. However, after a certain point, adding more greenery does not improve child-friendliness as much. This indicates that a moderate and continuous greening layout contributes more effectively to enhancing children’s sense of safety and pleasure than excessive vegetation density. Excessive greenery can block visibility, reduce functionality, and create hidden areas that hinder a child-friendly environment. These visual blind spots provide physical spaces conducive to potential illegal activities [83]. The positive contribution of fencing to child-friendliness increases gradually. Excessive traffic safety measures can create environmental hazards, visual clutter, and a sense of dependence on safety measures, which can confuse children and hinder their exploration of the external environment. Furthermore, the overly formal atmosphere created by these facilities discourages children from exploring the environment due to its complexity and diversity.
Openness has a diminishing effect on children’s perception of safety. When the SHAP value for openness reaches 0.3, this indicates that increased openness significantly enhances children’s perception of safety within this range. However, beyond this value, openness may reflect sky visibility, which is closely related to children’s comfort level at eye level [84]. When the openness index exceeds 0.3, perceptions of child-friendliness steadily decline. Higher sky ratios typically indicate lower urban density [85], which suggests that there are excessive open areas, a factor that contributes to reduced perceptions of child-friendliness.
Furthermore, this model addresses the limitations of traditional linear regression when it comes to setting variable relationship weights. For example, Ref. [34] used traditional linear regression without considering the interaction effects between two variables. When analyzing the synergistic effects of Greenness and openness, the GeoSHapley interaction contribution value was found to be 17.481. This revealed a nonlinear synergistic mechanism whereby an increase in greenness, space and openness enhances the perception of a space as being child-friendly. Meanwhile, traditional hierarchical analysis methods struggle to capture complex nonlinear relationships and spatial coupling mechanisms because they rely on the experience of experts [86]. By incorporating nonlinear modelling techniques, this research methodology enables more objective quantification of the actual contributions of each variable and their interactions. This overcomes the limitations of traditional approaches when handling complex spatial dynamics.

4. Discussion

4.1. Overall Child-Friendliness Level of Urban Streets

The child-friendliness of streets in Xiamen is generally low, with 51% of streets categorized as extremely low or low levels. This indicates that the child-friendliness of these streets demands significant improvement. This phenomenon may be due to current urban street planning not fully addressing the demands of children. Many planning decisions prioritize transportation and commercial development, leading to insufficient and poorly distributed child-friendly facilities [87]. The lack of child participation and feedback mechanisms is also a key factor [88]. The average perceived score for street entertainment facilities is extremely low, at 5.28%. This suggests that these areas face disorganized environmental conditions, which could result from public space being allocated in favor of economic interests, with commercial projects often occupying areas intended for children’s recreational facilities [89]. Even when children’s entertainment facilities are present, they often suffer from inadequate maintenance and management, adversely affecting the user experience for children [90]. Education-related facilities score 12.61%, indicating a lack of child-related educational signage and interactive features, making it difficult to encourage children’s participation.
The disparity in spatial distribution between central and peripheral areas further highlights planning-driven biases. Districts near city centers and parks, such as Yuandang Subdistrict, are perceived as highly Child Friendly index (46.74%) due to their ample Greenness (18.3%) and strict traffic controls. In contrast, major thoroughfares such as Lujiang Subdistrict (12.5%) and Wucun Subdistrict (11.5%) suffer from inadequate facilities due to the excessive prioritization of transportation and commercial development, coupled with a lack of child-specific design and participatory mechanisms. The core issue is the marginalization of children’s demand within planning and management, resulting in an imbalanced prioritization of street functions where commercial and transport interests encroach upon children’s activity spaces.
When analyzed across five dimensions, the education and child participation dimension exhibits high maturity, reaching an extremely high level of over 47%. However, the entertainment and safety dimensions show significant shortcomings, at low and extremely low levels of 34.23% and 23.12%, respectively. The hygiene dimension shows spatial distribution imbalances. Jiangtou Subdistrict, which has a population density of 45.125 people per hectare, has a significant hygiene facility gap (37.46%) due to failing to prioritize children’s activity demand. This reflects an absence of precise matching mechanisms between facility supply and population density, representing a classic example of inadequate demand responsiveness in planning and design.

4.2. Mechanisms of How Different Street Elements Influence Child-Friendliness

The impact of streetscape elements on child-friendliness shows significant positive and negative effects, reflecting structural flaws in the configuration of environmental factors. Among the positive elements, factors such as pavement coverage rate, density, fence rate, and greenness rate enhance the perception of friendliness by improving safety and exploration opportunities. Fence rate ensures social safety, and areas with higher levels of fencing tend to have lower crime rates, while areas with an extremely low fence rate often experience higher crime rates [91]. However, streets with extremely low levels of fencing (0.7%) and insufficient Greenness (4.5%) directly limit the satisfaction of children’s social and exploration demand, exposing the inadequacy of targeted environmental factor provision. The diversity of environmental colors enhances familiarity and contributes to a sense of safety and comfort [92]. It is worth noting that while greenery is an important factor in enhancing children’s friendly perceptions, excessive greenery in the Jiangtou Subdistrict area may reduce the sense of safety. This may be due to dense vegetation restricting the line of sight, increasing stress, and reducing children’s activity space [93].
Among the negative elements, excessive openness (average >0.4) results in a lack of safety for children, which is related to the low urban density and spatial design that ignores the scale of children. As previous studies have reported, excessive exposure to the sky can create broad and monotonous visual experiences, leading to negative emotions [94]. Overloaded Traffic flow on Kaiyuan Subdistrict causes spatial chaos. While moderate traffic flow can enhance vitality, in an overloaded state, the absence of a hierarchical control mechanism decreases the sense of safety. The core issue in both of these problems lies in the lack of collaborative optimization of streetscape elements. There is no balance between natural elements such as greenery and spatial openness, nor has a matching rule been established between traffic flow and children’s activities.
At the level of interaction effects, the synergy between greenness and openness must be considered in relation to children’s visual perception of transparency. However, most districts fall into the trap of single-factor optimization, such as increasing greenery without controlling openness, reflecting an insufficient understanding of children’s behavioral characteristics in the planning process. This has prevented the establishment of coordinated design standards that consider multiple factors.

4.3. Spatial Imbalance in Supply and Demand of Child-Friendly Urban Environments in Xiamen and Its Causes

With modern urbanization, developing child-friendly environments has become increasingly important. The imbalance between the supply and demand for urban spaces is a key factor affecting children’s quality of life and activity space. This imbalance reflects not only the differences in the availability of child-friendly facilities across various areas but also has significant implications for both children’s well-being and urban design. From the supply–demand matching perspective, the distribution of supply across Xiamen’s 16 districts shows that Huli District is a high-value area for both supply and demand, with high demand concentrated in this region. The supply and demand are relatively balanced. In contrast, Siming District, due to its historical functional positioning, exhibits a low supply–low demand pattern. Despite having a high concentration of commercial and transportation facilities, child-friendly facilities have not been prioritized.
In the high supply–high demand areas, Heshan Subdistricts and Jiangtou Subdistricts exhibit a relatively ideal supply–demand match. These areas have high greenery and openness, providing good natural environments and open spaces. The streets also score well in terms of safety and hygiene, offering a comfortable and safe environment for children. However, despite the high supply and demand, these areas still face a shortage of educational and sports facilities, highlighting the pressing demand to enhance the provision of child-friendly facilities.
Jinshan Subdistricts belongs to a high supply–medium demand area, with a relatively high pavement coverage rate (71.67%) and good infrastructure. However, due to its low population density (14.12 people/hectare), the demand is relatively low, leading to an excess of facility supply. Xiangyu Bonded Zone is another high supply–low demand area. Although the area has a high greenness (22.99%) and visual complexity (89.25%), and its infrastructure is relatively well-developed, the low population density means that the demand for facilities cannot be effectively met, resulting in an overabundance of facilities with low utilization.
In the medium supply–high demand areas, Dianqian Subdistrict, Huojuyuan Subdistrict, Jialian Subdistrict, and Yuandang Subdistrict face the issue of insufficient facility supply, particularly in entertainment, education, and sports facilities. While these areas have good infrastructure, street safety, hygiene, and greenery, they still cannot meet the demand of high-demand child populations. Notably, Huojuyuan Subdistricts has almost no entertainment facilities, indicating a significant gap in the provision of child-friendly facilities in this high-demand area.
Binhai Subdistricts, Lujiang Subdistricts, and Lianqian Subdistricts belong to different types of areas but generally face supply–demand imbalances. For example, Binhai Subdistricts has a good greenery rate and visual perception, but its traffic flow and street safety are weak, resulting in insufficient facilities for meeting the medium demand of children. Lujiang Subdistricts, with low demand, has good infrastructure but may have an overabundance of facilities, leading to a potential risk of resource wastage. Lianqian Subdistricts, which shows a low supply–high demand trend, faces a severe shortage of facilities, especially in dining and entertainment, and is unable to meet the high demand from children in this area.
The causes of these supply–demand imbalances are multifaceted. First, population density differences play a major role. High-density areas tend to experience higher demand for child-friendly spaces, while low-density areas have less demand, leading to mismatched supply. Secondly, the uneven functional positioning of areas contributes to this imbalance. Some areas prioritized commercial and transportation development in early planning, neglecting child-friendly facilities. Additionally, delays in facility construction have exacerbated supply–demand contradictions. In high-demand areas, rapid population growth has outpaced the development of child-friendly spaces, while in areas with slower population growth, there is an over-supply of facilities, resulting in waste. Future urban planning should optimize resource allocation, aligning child-friendly facility supply with actual demand, particularly in high-demand areas. In low-demand areas, facilities should be scaled back to avoid unnecessary resource expenditure. To achieve sustainable development of child-friendly environments, urban planning must account for regional demand differences and promote a balanced distribution of child-friendly facilities.

4.4. Planning and Design Recommendations for Enhancing Child-Friendly Urban Street Environments and Spatial Planning Benefits

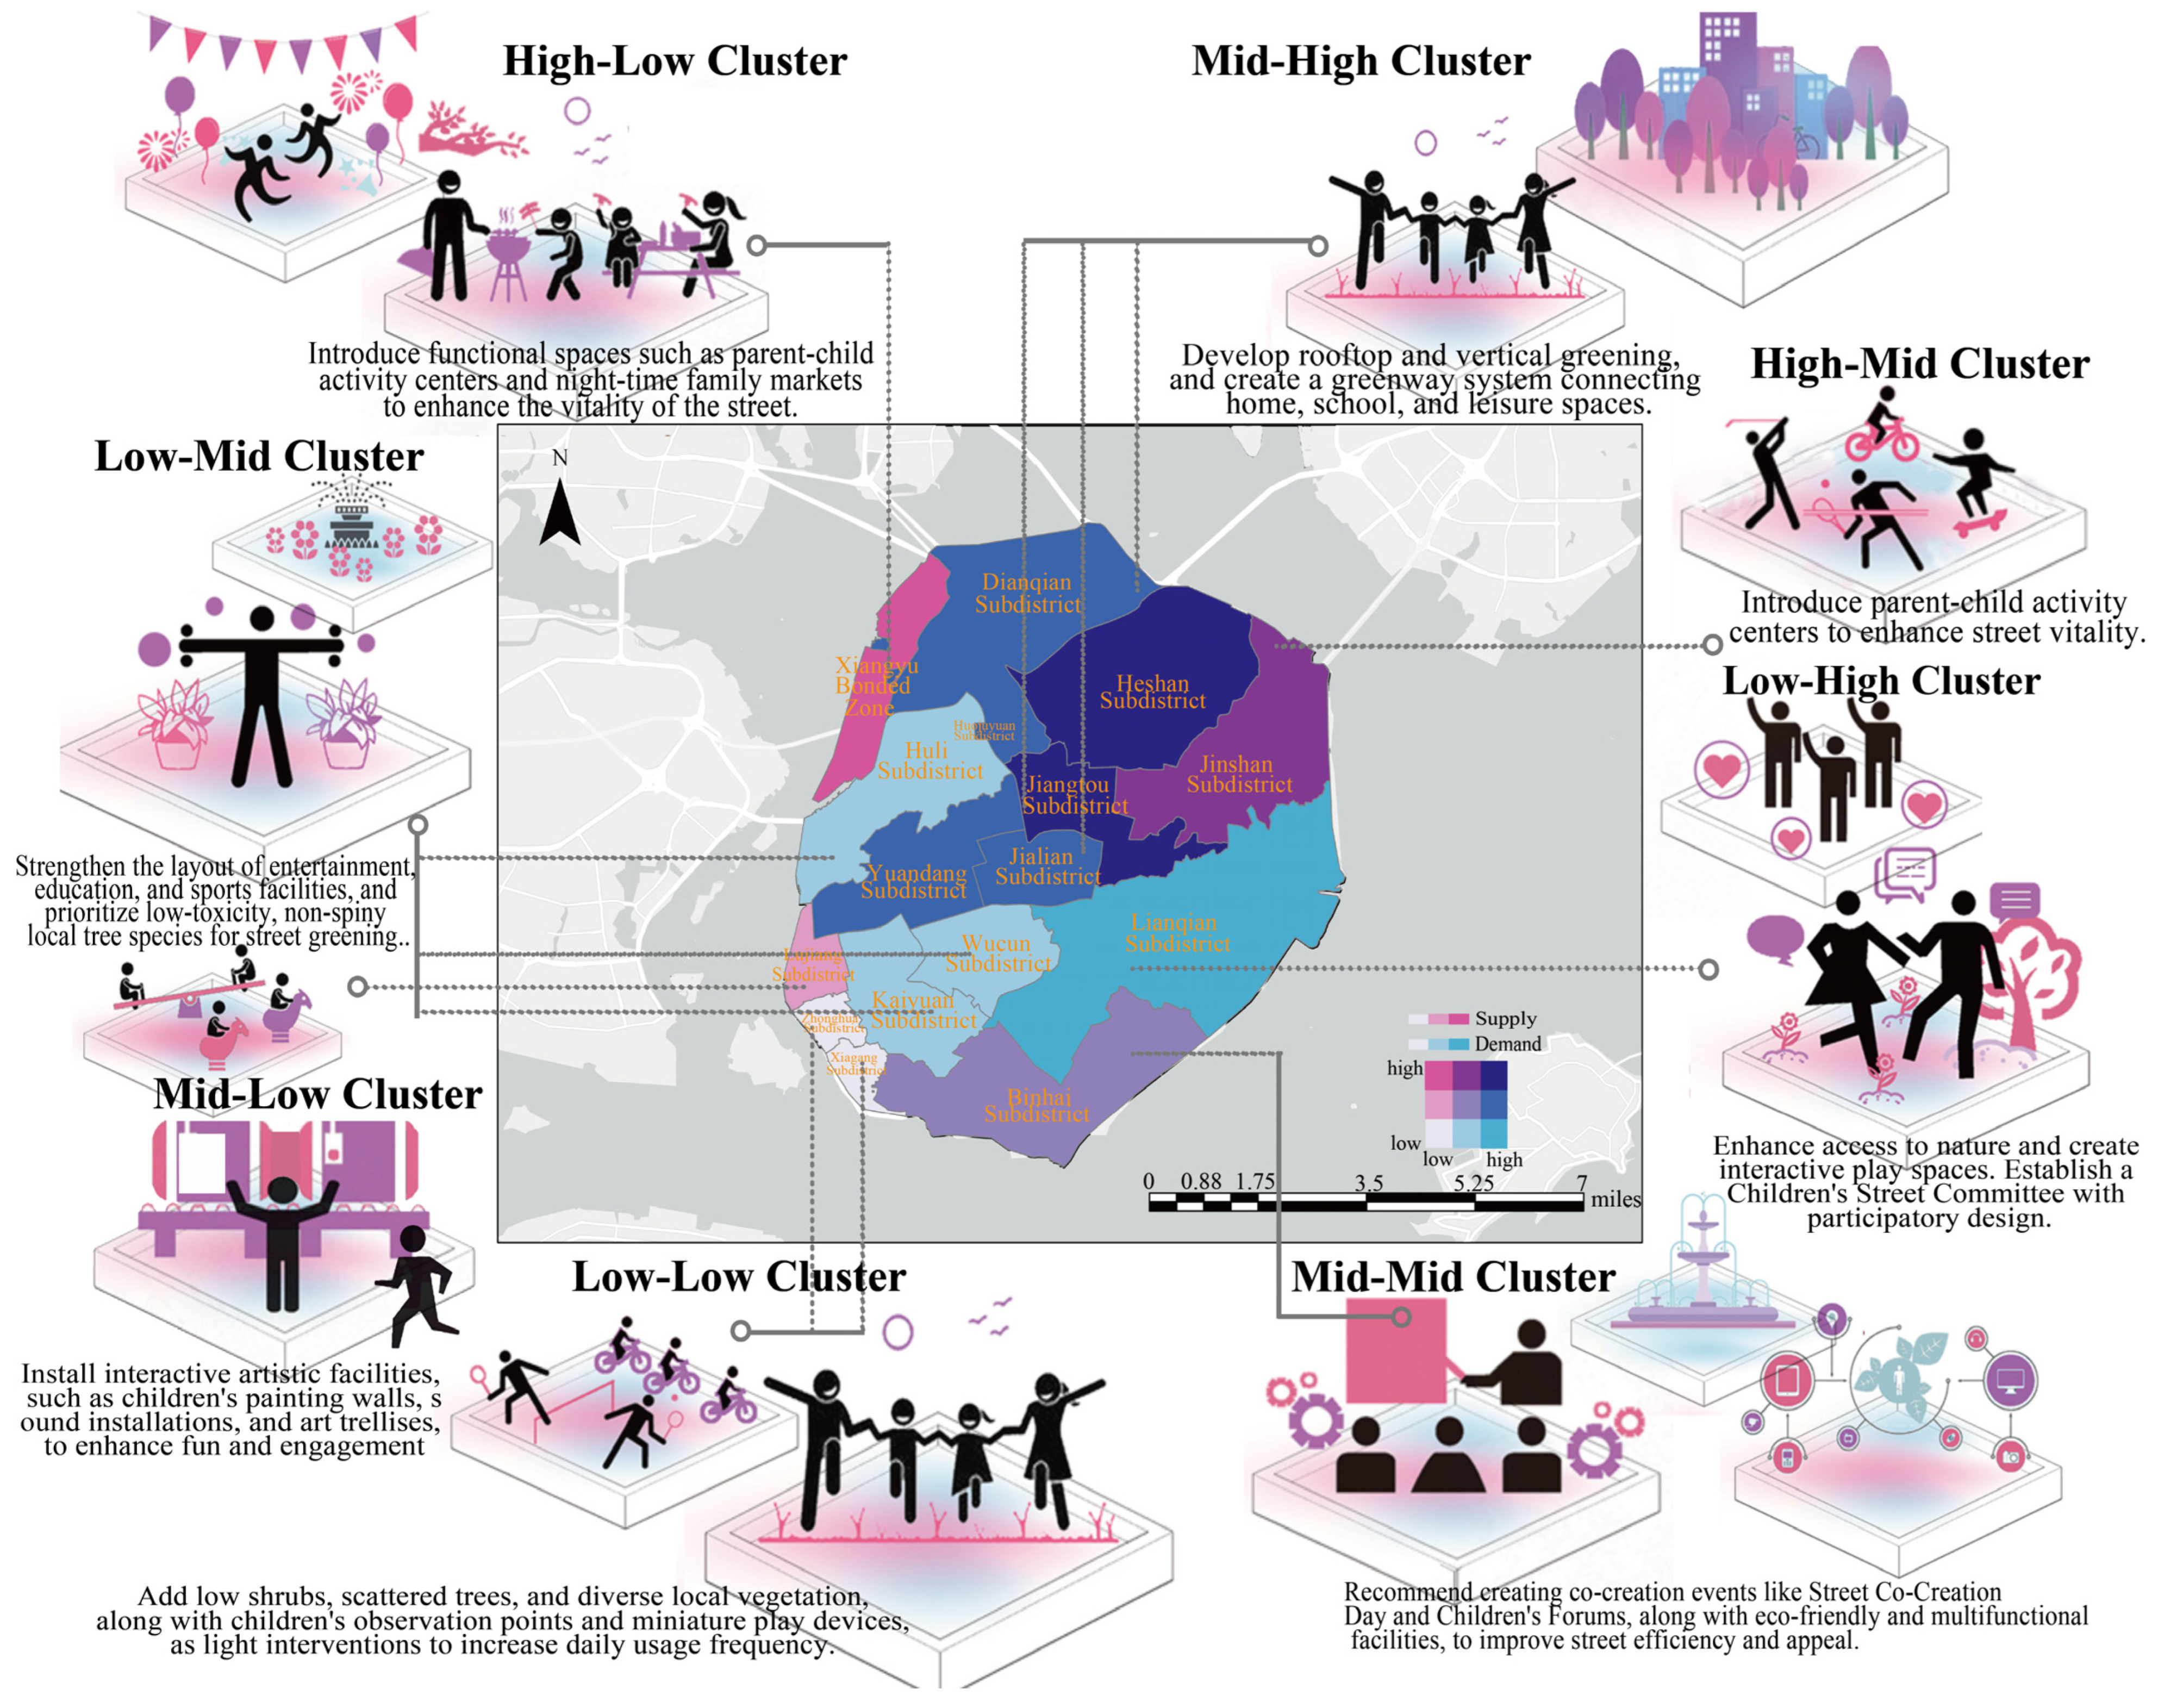
This study examines the supply–demand imbalance of child-friendly streets in Xiamen, highlighting structural causes such as limited land resources, delayed old-town renewal, and weak interdepartmental coordination. The mismatch between children’s facilities, street space attributes, and demand is particularly severe in high-density areas like southern Siming District, reflecting Xiamen’s rapid urbanization. The differences between old and new districts emphasize the neglect of children’s rights in favor of economic development. This paper proposes a “three-dimensional strategic framework” focused on “spatial restructuring, institutional safeguards, and coordination mechanisms” to address Xiamen’s structural problems and broader urbanization challenges (Figure 11).
Low Supply, High Demand Areas. The core issue in this area lies in the structural conflict between Xiamen’s limited island land resources and the rapid influx of population. As a key area for population intake in Siming District [95], the annual growth rate of urban land expansion exceeds the population growth rate by more than twice, leading to a severe supply shortage. In addition, early planning failed to include children’s facilities as a precondition for land transfer, resulting in a vicious cycle of “dense population, scarce facilities” [96]. To address this issue, it is recommended to focus on the concept of “activating” existing island space, setting a mandatory green space baseline of 25%, and releasing open space through measures such as “removing walls and activating corner spaces”. Furthermore, it is suggested to establish a ‘Child-Friendly Street Assessment Committee’ and use participatory design to fill the institutional gap caused by the disconnect between early planning and actual demand. For example, ecological trails could be planned around Dongping Mountain Park and the Botanical Garden, integrating natural education nodes and utilizing stock “optimization” instead of incremental expansion [97].
Low Supply, Medium Demand Areas. The lag in facilities in these areas stems from the dual structural bias: on one hand, old-town renewal focuses on buildings while neglecting functionality; on the other hand, transportation planning prioritizes motor vehicles over children’s safety. Currently, facility updates in these areas mainly focus on building facades, with a lack of recreational and sports facilities. Additionally, transportation planning gives priority to industrial logistics, overlooking children’s safety. To address these issues, it is recommended to configure green belts at least 1.5 m wide in the old town according to the Urban Green Space Design Specifications (GB 50420-2007) [98], prioritizing the planting of native low-growing plants such as Osmanthus and Azalea. This will not only solve safety risks related to “poor visual permeability,” but also transform the green belts into educational spaces through “ecological markers + plant science popularization.” Furthermore, it is suggested to collaborate with the traffic police department to establish a “child-priority slow traffic zone” on Huli Street to restructure the traffic system and ensure children’s safety.
Low Supply, Low Demand Areas. Although these areas have a high child population density, the facility usage rate is low, reflecting a structural gap in Xiamen’s early community planning, where there were no mandatory child-friendly indicators. The facility designs in these areas did not consider children’s activity demand, and with the increase in the aging population, children’s activity demand has become implicit, leading to a mismatch between existing demand and facilities. To address this issue, it is recommended to add low shrubs in old communities to create “micro children’s green spaces.” Additionally, it is suggested to set up infrared usage counters and regularly generate demand reports to provide data support for future facility planning.
Medium Supply, High Demand Areas. The overcrowding of facilities in these areas reflects a spatial structural conflict between “high land use intensity in the core urban area and the expansion of children’s facilities.” Currently, the land development intensity in these areas has reached 70%, leaving almost no space for new facilities, and the usage of facilities fluctuates greatly. To alleviate this issue, it is recommended to promote rooftop greening and vertical greening, and make children’s facilities a mandatory part of municipal project reviews. A “facility emergency deployment list” should also be established to allow for the flexible deployment of modular facilities during peak usage periods to address the mismatch between dynamic demand and static configuration.
Medium Supply, Medium Demand Areas. The utilization rate of facilities in these areas fluctuates significantly, stemming from a structural mismatch between “facility construction and community population structure.” For example, Binhai Street has rich ecological resources, but the proportion of children is low, and the existing facilities do not meet the demand for family activities in coastal communities. To improve facility matching, it is recommended to adjust the facility functions through “street co-creation days” and “children’s review workshops.” Additionally, leveraging the ecological advantages of the coastal area to develop a “coastal natural education corridor” and “edible landscape gardens” will transform ecological resources into spaces for children’s activities.
Medium Supply, Low Demand Areas. Although the greening coverage in this area is high, the facility usage rate is low, reflecting the dual structural issue of “uneven distribution of public service resources between the island and the mainland.” Lujing Street hosts a large number of migrant children, but the existing facilities are not adapted to the demand of mobile children. To address this issue, it is recommended to set up child-priority pedestrian signals at busy traffic locations and introduce interactive installations to attract migrant children. Additionally, improving facility provisions will resolve the issue of “existing facilities but misplaced services.”
High Supply, Low Demand Areas. The supply–demand ratio in these areas is imbalanced due to a structural bias in Xiamen’s urban planning—“planning functional zones focusing on industry while neglecting the quality of life.” The Xiangyu Free Trade Zone is primarily designed for industrial functions, lacking living facilities. To address this issue, it is recommended to use spatial heat maps to identify underutilized facilities and relocate them to high-demand areas. Additionally, in line with Xiamen’s night economy plan, “family night markets” and “children’s handicraft markets” can be set up around unused facilities to transform the industrial zone into family-oriented social spaces.
The development of child-friendly streets in Xiamen requires addressing three structural issues: spatial structure optimization, institutional gaps, and governance restructuring. With the island land constraints and dual spatial structure, solutions include activating existing spaces, preemptively providing facilities, and ensuring that children’s demand is included in land transfer conditions. Establishing a “Children’s Council” and a feedback platform will help shift to a model of “designing with children,” promoting a rights-based approach. These recommendations, addressing the structural roots of the imbalance, can provide a replicable model for other island cities and areas facing similar urbanization challenges.

4.5. Research Contributions and Limitations

4.5.1. Research Contributions

This study uses an innovative framework to identify disparities in the supply and demand for child-friendly features in urban street environments. It suggests strategies for optimizing child-friendliness while avoiding the spatial inequalities caused by traditional approaches that simply increase the number of facilities. By integrating the MEBS with Street View big data and machine learning, we can accurately predict child-friendliness and track its evolution to obtain more authentic data. MEBS uses contextualized animated characters and narrative scenarios to encourage emotional engagement with Street View imagery among children, providing optimization data with enhanced emotional dimensions. Furthermore, integrating XGBoost with GeoSHapley improved model interpretability, overcoming the limitations of traditional SHAP methods in geographic modelling. Compared to single-line traditional linear regression and the hierarchical analysis method [34], it reveals structural characteristics and dynamic changes in the child-friendliness of urban districts, providing more insightful support for decision-making. While the study focuses on Xiamen City, the proposed methodology has broad applicability to child-friendly street planning in other urban areas.

4.5.2. Research Limitations

Firstly, evaluations of children’s perceptions predominantly depend on visual indicators, while other sensory factors, such as sound, which exerts a notable impact on overall perception [99], are not included in the analysis. Future studies ought to incorporate a more extensive array of sensory components to deliver a more comprehensive assessment of children’s perceptual experiences. Furthermore, the questionnaire survey was limited to elementary school students aged 6–14, thus failing to cover the full child population as defined by UNICEF, which classifies children as individuals under 18 years of age [100]. Consequently, future research should expand the age range and adopt assessment approaches tailored to different age groups. This will facilitate the development of more comprehensive child-friendly urban planning and renewal strategies, thereby providing support for the sustainable development of cities.

5. Conclusions

This study proposes a framework combining the MEBS method, street scene analysis, various environmental indicators, and the XGBoost-GeoShapley model to assess child-friendliness. It builds a quantification system for street friendliness based on children’s perspectives, covering safety, health, education, entertainment, and participation. This method overcomes adult-centered limitations, linking children’s micro-perceptions with macro spatial elements, offering a new approach for building child-friendly cities.
(1)
The research results show that children’s perceptions of friendliness show significant spatial variation, particularly in high-density areas, where supply and demand mismatch for facilities. GeoSpatial analysis reveals a north–south difference in perceptions, with higher population density in the southern part of Siming District, while the northern part of Huli District has lower development intensity. Despite high spatial contribution in the northeast and central regions, these areas have lower child population density, while higher density areas show lower supply–demand matching.
(2)
Further analysis shows that variables such as greening rate, pavement coverage rate, and openness contribute nonlinearly in the GeoSHapley model. Their interactions significantly affect children’s sense of safety and willingness to engage with the street space. This finding strengthens the theories of visual permeability and accessibility-perceived safety in environmental psychology and provides decision-making references for participatory micro-updates at the street level.
(3)
From a policy perspective, the research results offer evaluation tools and optimization paths for the localized implementation of the Child-Friendly City (CFC) framework, with great potential for application in urban renewal, old community renovation, and child participation mechanism design. The study supports the creation of a child-centered urban space evaluation system and emphasizes incorporating children into the daily planning process to address issues such as spatial compression and loss of activity spaces caused by urbanization.
(4)
The XGBoost-GeoSHapley framework is more capable of revealing the collaborative mechanisms of spatial variables than traditional models such as geographical detectors and geographically weighted regression. It improves explanatory transparency and resolves issues related to spatial feature interactions and geographical location contribution differences, which were challenging for previous models. Its interpretability advantage helps promote the shift from prediction-oriented to explanation- and operability-oriented spatial modeling.
(5)
Although this study has made significant progress in both theoretical and empirical aspects, there are some limitations. One key limitation is that the model’s application was based on cross-sectional data, which limits the ability to explore dynamic changes over time. Future research should incorporate longitudinal data to conduct dynamic analyses, exploring the trends in children’s perceptions of child-friendly environments. Additionally, cross-regional validation in different urban forms and cultural contexts will further test the applicability of this framework in various urban environments. Lastly, integrating deep participatory design methods and enhancing the linkage between the evaluation framework and real behavior data from children will make the framework more refined and comprehensive in practical applications.
In conclusion, this study emphasizes the value of a child-centered perspective in urban space governance, providing a scalable quantification framework for creating inclusive, healthy, and sustainable urban children’s spaces. Future research can further validate this framework in other cities, promoting child-centered planning methods. The integration of longitudinal data, cross-regional validation, and participatory design will further enhance the robustness and applicability of the proposed framework.

Supplementary Materials

The following supporting information can be downloaded at: https://www.mdpi.com/article/10.3390/buildings15213908/s1, Table S1: Independent t-test. Table S2: Survey Data on the children Population.

Author Contributions

C.S. and Y.C.; methodology, S.C.; software, Y.C.; validation, C.S., Y.C. and S.C.; formal analysis, W.L.; investigation, K.N.; resources, Z.D.; data curation, C.S.; writing—original draft preparation, C.S.; writing—review and editing, S.C.; visualization, W.L.; supervision, Z.D.; project administration, Z.D.; funding acquisition, Z.D. All authors have read and agreed to the published version of the manuscript.

Funding

This study was funded by the Special Funding Project of the China Agriculture and Forestry University Design Art Alliance (Grant Number 111900050).

Institutional Review Board Statement

This study was conducted in accordance with the Declaration of Helsinki and approved by the Institutional Review Board of Fujian Agriculture and Forestry University (Agreement No.: FAFUIRB-2024-09202, Approval Date: 20 September 2024).

Informed Consent Statement

Informed consent was obtained from all participants involved in the study.

Data Availability Statement

Data are contained within the article. The data presented in this study can be requested from the authors.

Acknowledgments

We sincerely appreciate the editor and all anonymous reviewers for their constructive comments, which greatly improved the quality of the manuscript. We also appreciate the organizations that provided valuable data for this study.

Conflicts of Interest

The authors declare no conflicts of interest.

References

  1. Witten, K.; Kearns, R.; Carroll, P. Urban inclusion as wellbeing: Exploring children’s accounts of confronting diversity on inner city streets. Soc. Sci. Med. 2015, 133, 349–357. [Google Scholar] [CrossRef]
  2. Bringolf-Isler, B.; De Hoogh, K.; Schindler, C.; Kayser, B.; Suggs, L.S.; Dössegger, A.; Probst-Hensch, N.; Group, S.S. Sedentary behaviour in Swiss children and adolescents: Disentangling associations with the perceived and objectively measured environment. Int. J. Environ. Res. Public Health 2018, 15, 918. [Google Scholar] [CrossRef]
  3. Ergler, C.; Smith, K.; Kotsanas, C.; Hutchinson, C. What makes a good city in pre-schoolers’ eyes? Findings from participatory planning projects in Australia and New Zealand. J. Urban Des. 2015, 20, 461–478. [Google Scholar] [CrossRef]
  4. Chu, M.; Fang, Z.; Lee, C.-Y.; Shang-Kuan, C.-H.; Mao, L.; Chiang, Y.-C. Building a child-friendly social environment from the perspective of children in China based on focus group interviews. Curr. Psychol. 2025, 44, 2001–2017. [Google Scholar] [CrossRef]
  5. Sheng, K.; Liu, L.; Wang, F.; Li, S.; Zhou, X. An eye-tracking study on exploring children’s visual attention to streetscape elements. Buildings 2025, 15, 605. [Google Scholar] [CrossRef]
  6. Patel, J.; Katapally, T.R.; Khadilkar, A.; Bhawra, J. The interplay between air pollution, built environment, and physical activity: Perceptions of children and youth in rural and urban India. Health Place 2024, 85, 103167. [Google Scholar] [CrossRef]
  7. Taylor, M.P.; Camenzuli, D.; Kristensen, L.J.; Forbes, M.; Zahran, S. Environmental lead exposure risks associated with children’s outdoor playgrounds. Environ. Pollut. 2013, 178, 447–454. [Google Scholar] [CrossRef] [PubMed]
  8. Dong, W.; Liu, Y.; Bai, R.; Zhang, L.; Zhou, M. The prevalence and associated disability burden of mental disorders in children and adolescents in China: A systematic analysis of data from the Global Burden of Disease Study. Lancet Reg. Health–West. Pac. 2025, 55, 101486. [Google Scholar] [CrossRef] [PubMed]
  9. Zhang, M.; Nie, Q.; Ye, W.; Wang, Y.; Yang, Z.; Teng, Z. Longitudinal dynamic relationships between videogame use and symptoms of gaming disorder and depression among Chinese children and adolescents. J. Youth Adolesc. 2025, 54, 426–438. [Google Scholar] [CrossRef] [PubMed]
  10. Zhu, Y.; Zhang, G. Research on informal outdoor public space in cities for urban children based on the LBS big data. Mod. Urban Res. 2019, 1, 31–35. [Google Scholar]
  11. Zhai, B.; Zhu, W. Analysis on spatial-temporal characteristics of children’s outdoor activities in big cities: A case study of shanghai. City Plan Rev. 2018, 42, 87–96. [Google Scholar]
  12. Nations, U. Convention on the Rights of the Child; OHCHR: Geneva, Switzerland, 1989. [Google Scholar]
  13. Cordero-Vinueza, V.A.; Niekerk, F.F.; van Dijk, T.T. Making child-friendly cities: A socio-spatial literature review. Cities 2023, 137, 104248. [Google Scholar] [CrossRef]
  14. Palmas, S.; Beise, J.; George, T.; You, D. Advantage and paradox—Inequalities for children in urban settings. In Urban Inequalities: A Multidimensional and International Perspective; Springer: Berlin/Heidelberg, Germany, 2024; pp. 201–220. [Google Scholar]
  15. The UNICEF. Explore Child Friendly Cities Initiatives Around the World. 2024. Available online: https://www.unicef.org/childfriendlycities/initiatives?f%5B0%5D=local_terms_facet_2%3Af327a9d6-a3f6-4fd0-b6d4-712332911ee5#in-page-search (accessed on 19 May 2024).
  16. Nan, F. Policy innovation on building child friendly cities in China: Evidence from four Chinese cities. Child. Youth Serv. Rev. 2020, 118, 105491. [Google Scholar] [CrossRef]
  17. Gibson, J.J. The Ecological Approach to Visual Perception: Classic Edition; Psychology Press: Oxfordshire, UK, 2014. [Google Scholar]
  18. McLeod, S. Maslow’s hierarchy of needs. Simply Psychol. 2007, 1, 3–4. [Google Scholar]
  19. Simons, J.A.; Irwin, D.B.; Drinnien, B.A. Maslow’s hierarchy of needs. Psychol. Rev. 1987, 9, 222. [Google Scholar]
  20. Morán Uriel, J.; Camerin, F.; Córdoba Hernández, R. Urban Horizons in China: Challenges and Opportunities for Community Intervention in a Country Marked by the Heihe-Tengchong Line. In Diversity as Catalyst: Economic Growth and Urban Resilience in Global Cityscapes; Siew, G., Allam, Z., Cheshmehzangi, A., Eds.; Springer Nature: Singapore, 2024; pp. 105–125. [Google Scholar] [CrossRef]
  21. Bureau of Statistics. Xiamen Statistical Yearbook 2023. 2023. Available online: http://tjj.xm.gov.cn/tjzl/tjsj/tqnj/ (accessed on 19 May 2024).
  22. Wang, X.; Xiong, F.; Wang, Z.; Chen, S.; Zhang, Z.; Peng, L. Planning and layout of facilities for the elders based on POI and machine learning: A case study of Wuhan. Econ. Geogr. 2021, 41, 49–56. [Google Scholar]
  23. Tayefi Nasrabadi, M.; García, E.H.; Pourzakarya, M. Let children plan neighborhoods for a sustainable future: A sustainable child-friendly city approach. Local Environ. 2021, 26, 198–215. [Google Scholar] [CrossRef]
  24. Torres, J.; Cloutier, M.-S.; Bergeron, J.; St-Denis, A. ‘They installed a speed bump’: Children’s perceptions of traffic-calming measures around elementary schools. Child. Geogr. 2020, 18, 477–489. [Google Scholar] [CrossRef]
  25. D’Haese, S.; Vanwolleghem, G.; Hinckson, E.; De Bourdeaudhuij, I.; Deforche, B.; Van Dyck, D.; Cardon, G. Cross-continental comparison of the association between the physical environment and active transportation in children: A systematic review. Int. J. Behav. Nutr. Phys. Act. 2015, 12, 145. [Google Scholar] [CrossRef]
  26. Moore, K.A. Developing an indicator system to measure child well-being: Lessons learned over time. Child Indic. Res. 2020, 13, 729–739. [Google Scholar] [CrossRef]
  27. Wang, X.; Huang, J.; Qin, Z.; Gan, W.; He, Z.; Li, X. Is the Children’s 15-Minute City an Effective Framework for Enhancing Children’s Health and Well-Being? An Empirical Analysis from Western China. Buildings 2025, 15, 248. [Google Scholar] [CrossRef]
  28. Krishnamurthy, S. Reclaiming spaces: Child inclusive urban design. Cities Health 2019, 3, 86–98. [Google Scholar] [CrossRef]
  29. Van Vliet, W.; Karsten, L. Child-friendly cities in a globalizing world: Different approaches and a typology of children’s roles. Child. Youth Environ. 2015, 25, 1–15. [Google Scholar] [CrossRef]
  30. Oliver, M.; Witten, K.; Kearns, R.A.; Mavoa, S.; Badland, H.M.; Carroll, P.; Drumheller, C.; Tavae, N.; Asiasiga, L.; Jelley, S. Kids in the city study: Research design and methodology. BMC Public Health 2011, 11, 587. [Google Scholar] [CrossRef]
  31. Zhang, L.; Xu, X.; Guo, Y. The impact of a child-friendly design on children’s activities in urban community pocket parks. Sustainability 2023, 15, 10073. [Google Scholar] [CrossRef]
  32. Egli, V.; Villanueva, K.; Donnellan, N.; Mackay, L.; Forsyth, E.; Zinn, C.; Kytta, M.; Smith, M. Understanding children’s neighbourhood destinations: Presenting the Kids-PoND framework. Child. Geogr. 2020, 18, 420–434. [Google Scholar] [CrossRef]
  33. Zhou, Y.; Wang, M.; Lin, S.; Qian, C. Relationship between children’s independent activities and the built environment of outdoor activity space in residential neighborhoods: A case study of Nanjing. Int. J. Environ. Res. Public Health 2022, 19, 9860. [Google Scholar] [CrossRef] [PubMed]
  34. Yang, Y.; Wang, Q.; Wu, D.; Hang, T.; Ding, H.; Wu, Y.; Liu, Q. Constructing child-friendly cities: Comprehensive evaluation of street-level child-friendliness using the method of empathy-based stories, street view images, and deep learning. Cities 2024, 154, 105385. [Google Scholar] [CrossRef]
  35. Carroll, P.; Witten, K.; Kearns, R. Housing intensification in Auckland, New Zealand: Implications for children and families. Hous. Stud. 2011, 26, 353–367. [Google Scholar] [CrossRef]
  36. Kyttä, M. Children’s independent mobility in urban, small town, and rural environments. In Growing up in a Changing Urban Landscape; Van Gorcum: Gorinchem, The Netherlands, 1997; pp. 41–52. [Google Scholar]
  37. Ma, X.; Yang, J.; Zhang, R.; Yu, W.; Ren, J.; Xiao, X.; Xia, J. XGBoost-based analysis of the relationship between urban 2-D/3-D morphology and seasonal gradient land surface temperature. IEEE J. Sel. Top. Appl. Earth Obs. Remote Sens. 2024, 17, 4109–4124. [Google Scholar] [CrossRef]
  38. Chen, L.; Li, H.; Zhang, C.; Chu, W.; Corcoran, J.; Wang, T. Dynamic analysis of landscape drivers in the thermal environment of Guanzhong plain urban agglomeration. Int. J. Appl. Earth Obs. Geoinf. 2024, 134, 104239. [Google Scholar] [CrossRef]
  39. Zhao, J.; Guo, F.; Zhang, H.; Dong, J. Mechanisms of non-stationary influence of urban form on the diurnal thermal environment based on machine learning and MGWR analysis. Sustain. Cities Soc. 2024, 101, 105194. [Google Scholar] [CrossRef]
  40. Li, Z. Extracting spatial effects from machine learning model using local interpretation method: An example of SHAP and XGBoost. Comput. Environ. Urban Syst. 2022, 96, 101845. [Google Scholar] [CrossRef]
  41. Li, H.; Chen, C.; Yuan, Y.; Xia, X.; Huang, Q.; Ye, L.; Huang, Z. Equity analysis of bus network balance from the perspective of spatial morphology and service capability. Sci. Rep. 2025, 15, 2339. [Google Scholar] [CrossRef]
  42. Allouche, O.; Tsoar, A.; Kadmon, R. Assessing the accuracy of species distribution models: Prevalence, kappa and the true skill statistic (TSS). J. Appl. Ecol. 2006, 43, 1223–1232. [Google Scholar] [CrossRef]
  43. Hartig, T.; Korpela, K.; Evans, G.W.; Gärling, T. A measure of restorative quality in environments. Scand. Hous. Plan. Res. 1997, 14, 175–194. [Google Scholar] [CrossRef]
  44. Broberg, A.; Kyttä, M.; Fagerholm, N. Child-friendly urban structures: Bullerby revisited. J. Environ. Psychol. 2013, 35, 110–120. [Google Scholar] [CrossRef]
  45. Benjamin-Neelon, S.E.; Platt, A.; Bacardi-Gascon, M.; Armstrong, S.; Neelon, B.; Jimenez-Cruz, A. Greenspace, physical activity, and BMI in children from two cities in northern Mexico. Prev. Med. Rep. 2019, 14, 100870. [Google Scholar] [CrossRef] [PubMed]
  46. Rooney, T. Higher stakes–The hidden risks of school security fences for children’s learning environments. Environ. Educ. Res. 2015, 21, 885–898. [Google Scholar] [CrossRef]
  47. Leung, K.Y.; Loo, B.P. Determinants of children’s active travel to school: A case study in Hong Kong. Travel Behav. Soc. 2020, 21, 79–89. [Google Scholar] [CrossRef]
  48. Wang, R.; Cao, M.; Yao, Y.; Wu, W. The inequalities of different dimensions of visible street urban green space provision: A machine learning approach. Land Use Policy 2022, 123, 106410. [Google Scholar] [CrossRef]
  49. Yang, Y.; Jiang, L.; Ma, X.; Liu, S.; Wang, L. A Comprehensive Approach to Identifying the Supply and Demand of Urban Park Cultural Ecosystem Services in the Megalopolis Area of Shanghai, China. Land 2025, 14, 455. [Google Scholar] [CrossRef]
  50. Pang, R.; Xiao, J.; Yang, J.; Sun, W. Spatial Distribution Characteristics and Influencing Factors of Public Service Facilities for Children—A Case Study of the Central Urban Area of Shenyang. Land 2025, 14, 1485. [Google Scholar] [CrossRef]
  51. Lilford, R.J.; Daniels, B.; McPake, B.; Bhutta, Z.A.; Mash, R.; Griffiths, F.; Omigbodun, A.; Pinto, E.P.; Jain, R.; Asiki, G. Supply-side and demand-side factors affecting allopathic primary care service delivery in low-income and middle-income country cities. Lancet Glob. Health 2025, 13, e942–e953. [Google Scholar] [CrossRef] [PubMed]
  52. Bao, K.; Wu, S.; Oubibi, M.; Cai, L. Internet Gaming Disorder Among Rural Left-Behind Children in China: A Sociological Qualitative Study. Psychol. Res. Behav. Manag. 2025, 18, 387–403. [Google Scholar] [CrossRef]
  53. Li, Z.; Xie, S.; Chen, W. The influence of environment on adolescents’ physical exercise behavior based on family community and school micro-systems. Sci. Rep. 2025, 15, 12024. [Google Scholar] [CrossRef]
  54. Liu, W.; Wang, W. A Study on the Assessment of Tour–Art–Learning Quality in Urban Parks from a Child-Friendly Perspective: A Case Study of Shaheyuan Park in Chengdu. Sustainability 2025, 17, 684. [Google Scholar] [CrossRef]
  55. Altıntepe, B.; Altay, B. Restaurant inclusivity: Parents’ and children’s perspectives. Int. J. Hosp. Manag. 2025, 128, 104153. [Google Scholar] [CrossRef]
  56. Hart, R.; Wridt, P.; Giusti, D. The Child Friendly Community Assessment Tools. In A Facilitator’s Guide to the Local Assessment of Children’s Rights; UNICEF (Innocenti Research Centre): Florence, Italy; Childwatch International: Oslo, Norway, 2011. [Google Scholar]
  57. Taechaboonsermsak, S.P. Factors affecting the capabilities of family development centre staff regarding promotion of pre-school language learning amongst parents in Thailand Warunsicha Supprasert, Piyatida Khajornchaikul, Kitiphong Harncharoen, Pimsurang. J. Health Res. 2019, 33, 43–56. [Google Scholar]
  58. Vijay, N.C.; Rokade, S.; Bivina, G. Towards safer streets: A review of child pedestrian behavior and safety worldwide. Transp. Res. Part F Traffic Psychol. Behav. 2024, 103, 638–660. [Google Scholar] [CrossRef]
  59. Adams, S.; Savahl, S.; Florence, M.; Jackson, K. Considering the natural environment in the creation of child-friendly cities: Implications for children’s subjective well-being. Child Indic. Res. 2019, 12, 545–567. [Google Scholar] [CrossRef]
  60. Carroll, P.; Witten, K.; Kearns, R.; Donovan, P. Kids in the City: Children’s use and experiences of urban neighbourhoods in Auckland, New Zealand. J. Urban Des. 2015, 20, 417–436. [Google Scholar] [CrossRef]
  61. Eyler, A.A.; Brownson, R.C.; Doescher, M.P.; Evenson, K.R.; Fesperman, C.E.; Litt, J.S.; Pluto, D.; Steinman, L.E.; Terpstra, J.L.; Troped, P.J. Policies related to active transport to and from school: A multisite case study. Health Educ. Res. 2008, 23, 963–975. [Google Scholar] [CrossRef] [PubMed]
  62. Haikkola, L.; Pacilli, M.G.; Horelli, L.; Prezza, M. Interpretations of urban child-friendliness: A comparative study of two neighborhoods in Helsinki and Rome. Child. Youth Environ. 2007, 17, 319–351. [Google Scholar] [CrossRef]
  63. Buczyłowska, D.; Zhao, T.; Singh, N.; Jurczak, A.; Siry, A.; Markevych, I. Exposure to greenspace and bluespace and cognitive functioning in children–a systematic review. Environ. Res. 2023, 222, 115340. [Google Scholar] [CrossRef] [PubMed]
  64. Malone, K. “The future lies in our hands”: Children as researchers and environmental change agents in designing a child-friendly neighbourhood. Local Environ. 2013, 18, 372–395. [Google Scholar] [CrossRef]
  65. Kemple, K.M.; Oh, J.; Kenney, E.; Smith-Bonahue, T. The power of outdoor play and play in natural environments. Child. Educ. 2016, 92, 446–454. [Google Scholar] [CrossRef]
  66. Qiu, L.; Zhu, X. Housing and community environments vs. independent mobility: Roles in promoting children’s independent travel and unsupervised outdoor play. Int. J. Environ. Res. Public Health 2021, 18, 2132. [Google Scholar] [CrossRef]
  67. De Visscher, S.; Bouverne-De Bie, M. Recognizing Urban Public Space as a Co-Educator: Children’s Socialization in Ghent. Int. J. Urban Reg. Res. 2008, 32, 604–616. [Google Scholar] [CrossRef]
  68. Bodén, L. On, to, with, for, by: Ethics and children in research. Child. Geogr. 2021, 1–16. [Google Scholar] [CrossRef]
  69. Kanuri, V.K.; Hughes, C.; Hodges, B.T. Standing out from the crowd: When and why color complexity in social media images increases user engagement. Int. J. Res. Mark. 2024, 41, 174–193. [Google Scholar] [CrossRef]
  70. Shu, X.; Mesimäki, M.; Kotze, D.J.; Wales, M.; Xie, L.; Benicke, R.; Lehvävirta, S. Needs and expectations of German and Chinese children for livable urban green spaces revealed by the method of empathy-based stories. Urban For. Urban Green. 2022, 68, 127476. [Google Scholar] [CrossRef]
  71. Posti-Ahokas, H. Empathy-based stories capturing the voice of female secondary school students in Tanzania. Int. J. Qual. Stud. Educ. 2013, 26, 1277–1292. [Google Scholar] [CrossRef]
  72. Särkelä, E.; Suoranta, J. The method of empathy-based stories as a tool for research and teaching. Qual. Rep. 2020, 25, 399–415. [Google Scholar] [CrossRef]
  73. Zhou, Y.; Xiong, Y. The influence of civil society’s economic status on environmental protection behaviors from the perspective of environmental sociology. Sci. Rep. 2025, 15, 24137. [Google Scholar] [CrossRef]
  74. Wu, C.; Ye, Y.; Gao, F.; Ye, X. Using street view images to examine the association between human perceptions of locale and urban vitality in Shenzhen, China. Sustain. Cities Soc. 2023, 88, 104291. [Google Scholar] [CrossRef]
  75. Minka, T.; Cleven, R.; Zaykov, Y. Trueskill 2: An Improved Bayesian Skill Rating System; Technical Report Number MSR-TR-2018-8; Microsoft Research: Redmond, WA, USA, 2018. [Google Scholar]
  76. Zhou, B.; Xu, S.; Yang, X.-X. Computing the color complexity of images. In Proceedings of the 2015 12th International Conference on Fuzzy Systems and Knowledge Discovery (FSKD), Zhangjiajie, China, 15–17 August 2015; pp. 1898–1902. [Google Scholar]
  77. Qiu, Y.; Liu, Y.; Liu, Y.; Li, Z. Exploring the linkage between the neighborhood environment and mental health in Guangzhou, China. Int. J. Environ. Res. Public Health 2019, 16, 3206. [Google Scholar] [CrossRef]
  78. Kumari, P.; Toshniwal, D. Extreme gradient boosting and deep neural network based ensemble learning approach to forecast hourly solar irradiance. J. Clean. Prod. 2021, 279, 123285. [Google Scholar] [CrossRef]
  79. Yang, C.; Zeng, W.; Yang, X. Coupling coordination evaluation and sustainable development pattern of geo-ecological environment and urbanization in Chongqing municipality, China. Sustain. Cities Soc. 2020, 61, 102271. [Google Scholar] [CrossRef]
  80. Li, Z. GeoShapley: A game theory approach to measuring spatial effects in machine learning models. Ann. Am. Assoc. Geogr. 2024, 114, 1365–1385. [Google Scholar] [CrossRef]
  81. Tapiro, H.; Oron-Gilad, T.; Parmet, Y. Pedestrian distraction: The effects of road environment complexity and age on pedestrian’s visual attention and crossing behavior. J. Saf. Res. 2020, 72, 101–109. [Google Scholar] [CrossRef] [PubMed]
  82. Zhong, Q.; Li, B.; Chen, Y. How do different urban footpath environments affect the jogging preferences of residents of different genders? Empirical research based on trajectory data. Int. J. Environ. Res. Public Health 2022, 19, 14372. [Google Scholar] [CrossRef] [PubMed]
  83. Sreetheran, M.; Van Den Bosch, C.C.K. A socio-ecological exploration of fear of crime in urban green spaces–A systematic review. Urban For. Urban Green. 2014, 13, 1–18. [Google Scholar] [CrossRef]
  84. Kim, S.; Woo, A. Streetscape and business survival: Examining the impact of walkable environments on the survival of restaurant businesses in commercial areas based on street view images. J. Transp. Geogr. 2022, 105, 103480. [Google Scholar] [CrossRef]
  85. Wang, R.; Lu, Y.; Zhang, J.; Liu, P.; Yao, Y.; Liu, Y. The relationship between visual enclosure for neighbourhood street walkability and elders’ mental health in China: Using street view images. J. Transp. Health 2019, 13, 90–102. [Google Scholar] [CrossRef]
  86. Fu, Y.; Wang, S. Constructing an evaluation framework for child-friendly city: A case study of outdoor recreation spaces in Shenyang City, China. J. Asian Archit. Build. Eng. 2025, 1–22. [Google Scholar] [CrossRef]
  87. McAllister, C. Child friendly cities and land use planning: Implications for children’s health. Environments 2008, 35, 45. [Google Scholar]
  88. Echendu, A.J. Urban planners’ perspectives of public participation in planning in Nigeria. SN Soc. Sci. 2023, 3, 33. [Google Scholar] [CrossRef]
  89. Creutzig, F.; Javaid, A.; Soomauroo, Z.; Lohrey, S.; Milojevic-Dupont, N.; Ramakrishnan, A.; Sethi, M.; Liu, L.; Niamir, L.; Bren d’Amour, C. Fair street space allocation: Ethical principles and empirical insights. Transp. Rev. 2020, 40, 711–733. [Google Scholar] [CrossRef]
  90. Pawlikowska-Piechotka, A. Child-friendly urban environment and playgrounds in Warsaw. Open House Int. 2011, 36, 98–110. [Google Scholar] [CrossRef]
  91. Deng, M.; Yang, W.; Chen, C.; Liu, C. Exploring associations between streetscape factors and crime behaviors using Google Street View images. Front. Comput. Sci. 2022, 16, 164316. [Google Scholar] [CrossRef]
  92. Nasar, J.L. Urban design aesthetics: The evaluative qualities of building exteriors. Environ. Behav. 1994, 26, 377–401. [Google Scholar] [CrossRef]
  93. Yu, Y.; Huang, G.; Sun, D.; Lyu, M.; Bart, D. Exploring the Impact of Waterfront Street Environments on Human Perception. Buildings 2025, 15, 1678. [Google Scholar] [CrossRef]
  94. Wang, L.; Han, X.; He, J.; Jung, T. Measuring residents’ perceptions of city streets to inform better street planning through deep learning and space syntax. ISPRS J. Photogramm. Remote Sens. 2022, 190, 215–230. [Google Scholar] [CrossRef]
  95. Yuan, Y.; Ye, L.H.; Li, H.; Huang, Z.C.; Chen, C.; Xia, X.H.; Huang, Q.Y. Analysis of Spatial Patterns and Urban Road. In Proceedings of the Second Global Forum on Space Information for Sustainable Development: GFSISD 2024, Guangzhou, China, 25–28 September 2024; Springer Nature: Berlin/Heidelberg, Germany, 2024; p. 129. [Google Scholar]
  96. Zhang, T.; Foliente, G.; Xiao, J.; Tang, L. Exploring the driving factors of land use change and spatial distribution in coastal cities: A case study of Xiamen city. Sustainability 2025, 17, 941. [Google Scholar] [CrossRef]
  97. Xiong, R.; Zhao, H.; Huang, Y. Spatial heterogeneity in the effects of built environments on walking distance for the elderly living in a mountainous city. Travel Behav. Soc. 2024, 34, 100693. [Google Scholar] [CrossRef]
  98. GB 50420-2007; Code for Design Specifications for Urban Green Spaces. Ministry of Construction of the People’s Republic of China: Beijing, China, 2007.
  99. Gori, M.; Chilosi, A.; Forli, F.; Burr, D. Audio-visual temporal perception in children with restored hearing. Neuropsychologia 2017, 99, 350–359. [Google Scholar] [CrossRef]
  100. Detrick, S. The origins, development and significance of the United Nations Convention on the Rights of the Child. In Proceedings of the United Nations Convention on the Rights of the Child, New York, NY, USA, 20 November 1989; pp. 19–30. [Google Scholar]
Figure 1. The research area.
Buildings 15 03908 g001
Figure 2. Theoretical framework.
Buildings 15 03908 g002
Figure 3. TrueSkill algorithm interface.
Buildings 15 03908 g003
Figure 4. Child-Friendly Rating Distribution Chart.
Buildings 15 03908 g004
Figure 5. Cluster Analysis Map of Child-Friendly Spaces in Urban Areas (af).
Buildings 15 03908 g005
Figure 6. Population Density Distribution Map of Children Aged 0–14.
Buildings 15 03908 g006
Figure 7. Supply-Demand Spatial Distribution.
Buildings 15 03908 g007
Figure 8. Importance Distribution Map, Swarm Map, and Spatial Distribution of Contributions (The asterisk (*) indicates the primary effect in the interaction).
Buildings 15 03908 g008
Figure 9. Spatial Distribution of Street Environmental Factors.
Buildings 15 03908 g009
Figure 10. Nonlinear Marginal Effects Plot (The blue area represents the degree of dispersion. The red dashed line denotes the zero baseline.).
Buildings 15 03908 g010
Figure 11. Patial Planning Map.
Buildings 15 03908 g011
Table 2. Questionnaire based on the method of empathy-based stories to assess child-friendly cities.
DimensionQuestionAnswer 1Answer 2
SafetyHey kids! Which of these options better meets the requirements for a safe play area and will help Nezha to successfully complete his first patrol mission?This area is flat and free of hazards, ensuring that children can play safely and meeting Nezha’s safety inspection standards.There are construction barriers in place here, and the ground is uneven. Take care when playing to avoid tripping up or bumping into things.
HygieneNezha is searching for the perfect spot to build his secret hideout. It must have fresh air, plenty of sunlight, and be clean. Which of the locations shown in the pictures is more suitable?This clean, green space is especially comfortable for children to rest in.This place is covered in rubbish and dead leaves, which makes it unpleasant to look at.
EntertainmentHey kids! Nezha and Ao Bing have agreed to find a place to play together. Can you help them pick which picture shows the spot that’s more suitable?Here you’ll find climbing frames, bumper cars, and a wide variety of other activities. Children can have a wonderful time here, and the entertainment area meets all of Nezha’s inspection requirements.I find this place boring.
EducationHey kids! Master Taiyi told Nezha and Ao Bing to seek new knowledge, and now they’re searching for places to discover it! Which card contains the knowledge you want to learn? Pick one!These are mobile bookcases and knowledge display stands. This is some of what I would like to know.I don’t want to know anything here.
Child ParticipationHey kids! Nezha and Ao Bing are searching for a place where they can work with their friends. Choose the best option!I find this place fascinating!I find this place boring.
Table 3. Test on reliability and validity ("***" indicates statistical significance at the p < 0.001 level).
Statistical IndicatorSafetyHygieneEducationEntertainmentChild Participation
Cronbach’s Alphas0.7840.7540.7260.7250.752
KMO value0.748
Approximate chi-square747.062
DF15
p value0.000 ***
Table 4. XGBoost model training results.
R2MAERMSE
Safety0.8060.8561.14
Hygiene0.8760.8731.05
Education0.9060.9100.97
Entertainment0.8560.8831.10
Child Participation0.8730.8600.97
Table 5. Scores of the streets across dimensions of child-friendliness.
Street LevelSafetyHygieneEducationEntertainmentChild ParticipationChild-Friendly Index
Extremely High-Level streets42.85%26.32%50.31%48.75%47.41%20.41%
High-Level streets21.93%4.32%20.42%11.21%21.53%1.19%
Medium-Level streets7.42%33.45%5.62%0.53%3.57%27.40%
Low-Level streets4.68%21.79%11.04%34.23%2.07%40.46%
Extremely Low-Level streets23.12%14.27%12.61%5.28%25.42%10.54%
Disclaimer/Publisher’s Note: The statements, opinions and data contained in all publications are solely those of the individual author(s) and contributor(s) and not of MDPI and/or the editor(s). MDPI and/or the editor(s) disclaim responsibility for any injury to people or property resulting from any ideas, methods, instructions or products referred to in the content.