Abstract
Artificial Intelligence (AI) has emerged as a transformative force in the field of architectural design. This study aims to systematically analyze the influence mechanisms of Artificial Intelligence-based Architectural Design (AIAD) by constructing a comprehensive hybrid model that integrates the Analytic Hierarchy Process (AHP), Decision-Making Trial and Evaluation Laboratory (DEMATEL), Interpretive Structural Modeling (ISM), and Cross-Impact Matrix Multiplication Applied to Classification (MICMAC). Based on the previous quantitative literature review, 6 primary categories and 18 secondary influencing factors were identified. Data were collected from a panel of fifteen experts representing the architecture industry, academia, and computer science. Through weighting analysis, causal mapping, hierarchical structuring, and driving–dependence classification, the study clarifies the complex interrelationships among influencing factors and reveals the underlying drivers that accelerate or constrain AI adoption in architectural design. By quantifying the hierarchical and causal influence of factors, this research provides theoretical findings and practical insights for design firms undergoing digital transformation. The results extend previous meta-analytical studies, offering a decision-support system that bridges academic research and real-world applications, thereby guiding stakeholders toward informed adoption of artificial intelligence for future cultural tourism development and regional spatial innovation.
1. Introduction
As a revolutionary technology, artificial intelligence holds the potential to foster economic growth and enhance productivity [1], profoundly influencing multiple industries, including the construction industry and the architectural design field addressed in this study. Serving as a bridge between the physical and virtual worlds [2], artificial intelligence plays a significant role in advancing the intelligence and digitalization of the architectural design process. Over the years, researchers have conducted studies on artificial intelligence tailored to architectural design. The adoption of artificial intelligence technologies in this field not only directly reduces economic costs and improves efficiency but also offers multiple potential advantages.
Therefore, both academia and industry in the architectural design field require a multidimensional analytical model and a set of feasible solutions to enhance productivity while addressing existing challenges in the industry. However, current research remains limited, often focusing on narrow applications or specific artificial intelligence methods, or being substantially influenced by subjective biases, lacking comprehensive analyses capable of responding to the fundamental transformations brought about by artificial intelligence in the construction sector. This study seeks to broaden the perspective, conducting a thorough and multifaceted investigation and exposition to examine the mechanisms of influence, adoption intentions, and implementation strategies of artificial intelligence in the field of architectural design.
On the basis of identification and summarization of the influencing factors of AI-based architectural design, this research will further study the relationship between the influencing factors, and analyze the potential complex relationships between weight ranking, causal relationship, hierarchical structure, driving force and dependence. Meanwhile, the importance of each factor is evaluated, so as to quantify the influence of current AI technologies at the level of influencing mechanism and clarify the influencing mechanism in the field of AI-based architectural design.
The remainder of this paper is organized as follows. Section 2 presents a comprehensive literature review, establishing the theoretical foundations from both architectural and computer science perspectives. Section 3 defines the research questions and aims. Section 4 introduces the integrated methodological framework combining Analytic Hierarchy Process (AHP), Decision-Making Trial and Evaluation Laboratory (DEMATEL), Interpretive Structural Modeling (ISM), and Cross-Impact Matrix Multiplication Applied to Classification (MICMAC). Section 5 reports the analysis results, while Section 6 discusses the methodological implications and key findings. Finally, Section 7 concludes the study and outlines directions for future research.
This study makes a meaningful contribution by creating a hybrid multi-criteria decision-making (MCDM) framework that in a systematic way combines AHP, DEMATEL, ISM, and MICMAC to assess the influence mechanisms of Artificial Intelligence-based Architectural Design (AIAD). Previous studies highlighted carefully selected drivers based on either single-factor or qualitative analyses, whereas this study provides a quantitative causal–hierarchical model that outlines distinctive driving and dependent factors contributing to contextual AI adoption in Architectural practice. This study’s contribution expands the existing AIAD literature by unifying meta-analytical literature with data-rich decisional models informed by AIAD tendencies.
Emerging artificial intelligence technologies are transforming the traditional architectural design industry. Whether in terms of technology, design processes, personnel management within design firms, or project collaborations with upstream and downstream enterprises, the potential influence of AI technologies is evident. Therefore, analyzing the factors influencing AI-based architectural design has become particularly important. Given that AI technologies are currently in a stage of rapid development, with fast-paced iterations, there has not yet been a systematic analysis of the mechanisms influencing the specific domain of architectural design. Hence, it is necessary to identify and determine the influencing factors from the perspective of architectural design firms and architects, and further analyze the relationships among these factors. At the same time, the impact of AI technologies on architectural design also faces obstacles and challenges. Accordingly, it is essential to further investigate the driving factors and potential complex relationships, assess the importance of the factors along with their causes and consequences, and thereby quantify the influence of AI technologies at the level of impact mechanisms.
This study addresses the following main research questions (RQs):
RQ1: What are the influencing factors of AI technologies on architectural design at the level of impact mechanisms?
RQ2: How are these identified factors interrelated?
RQ3: How can potential mechanisms—such as weight ranking, causal relationships, hierarchical structures, driving forces, and dependencies—be analyzed?
This study will conduct an in-depth investigation into the following issues: identifying and summarizing the influencing factors of AI-based architectural design; analyzing the relationships among these factors; establishing a hierarchical structure diagram of the influencing factors and explaining their causal links; assessing the importance of the factors and their causal relationships; and clarifying the attributes of the driving factors.
This study constructs an impact mechanism framework for Artificial Intelligence-based Architectural Design (AIAD) through the integrated Analytic Hierarchy Process (AHP), Decision-Making Trial and Evaluation Laboratory (DEMATEL), Interpretive Structural Modeling (ISM), and Cross-Impact Matrix Multiplication Applied to Classification (MICMAC) model, revealing the causal relationships and hierarchical structures among technological, organizational, and environmental factors. The significance of this research lies in extending and deepening the outcomes of Artificial Intelligence-based Architectural Design (AIAD): A Meta-Analysis as Quantitative Literature Review (MQLR), transforming a macro-level literature review into an operational causal network and mechanism framework. Building upon this, the study closely connects with Artificial Intelligence-based Architectural Design (AIAD): An Empirical Study on Adoption Intention Based on the TOE-UTAUT Integrated Framework with SEM: the latter translates the causal relationships and mechanism framework developed here into observable variables and empirically validates them in real-world enterprise contexts through surveys and structural equation modeling, thereby testing the effectiveness of the impact mechanisms. At the same time, the causal structures and influence pathways identified in this study also provide essential inputs for Artificial Intelligence-based Architectural Design (AIAD): Dynamic Modeling and Simulation Analysis Using the System Dynamics (SD) Approach), which extends the mechanism logic into a dynamically simulatable system capable of predicting AIAD’s evolutionary trends under different scenarios.
In summary, this research serves a key function in the entire research series, acting as a deepening of the previous review and a strong structural foundation for the later empirical and simulation studies. In addition to the connections to architectural design practice, the exploration of Artificial Intelligence-based Architectural Design (AIAD) also has broader implications for cultural and tourism development. As the connections between architecture, culture, and experience design continue to merge, AI-based design intelligence can create new avenues for interpreting regional identity, enhancing spatial vitality and visitor engagement, and creating adaptive and data-informed environments. Therefore, the findings of this research will provide theoretical contribution and practical direction for the future integration of AI technologies into a sustainable development strategy for cultural tourism spaces and the regional innovation ecosystem.
2. Literature Review
2.1. Theoretical Foundations from an Architectural Perspective: Architectural Design Automation Theory
The theoretical origins of architectural design automation are often traced back to Christopher Alexander and his works A Pattern Language and The Timeless Way of Building. Alexander employed the concept of Pattern Language to describe places characterized by consistent cultural activities, while reflecting on the developmental dilemmas of architecture and planning from the perspectives of architecture, design, and philosophy. His approach provided simple, structured, and humanistic solutions for complex design challenges [3] (Figure 1). This method of generating diverse forms and unique layouts implied the possibility of automation in architectural design. Christopher Alexander’s work and design knowledge were represented as modular, reusable patterns—conceptually similar to the ‘datasets’ used in machine learning today. This early typological approach provides a foundational analogy for AIAD, illustrating how design automation evolved from human-curated pattern systems to algorithmically generated solutions.
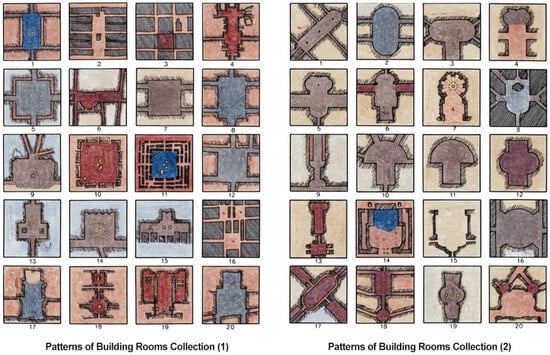
Figure 1.
Patterns of Building Rooms: A Typology-based Dataset for Architectural Design Solutions (Source: Original concept from the literature by Christopher Alexander [3], re-drawn by the author).
Since the 1960s, the application of computers in architectural design has begun to develop in an exploratory manner. As architects realized that design and interaction problems were becoming increasingly complex, they sought assistance from computers. In the Sydney Opera House project, Arup pioneered the use of computers for simulation and calculation, pushing beyond the limits of design and engineering technology at the time. In 1963, Sketchpad (also known as Robot Draftsman), developed by Ivan Sutherland, was recognized as the first program system capable of generating line drawings on a computer [4], marking the beginning of Human–Computer Interaction (HCI). This technological breakthrough, capable of representing realistic graphic information, overcame the limitations imposed by insufficient computer power and inspired the development of many subsequent creative applications and computer-aided architectural design software.
During the same period, from the 1960s to the 1970s, knowledge engineering—represented by the knowledge base—provided new tools for the field of computer-aided architectural design. It was capable of addressing the core issue of integrating automation and semi-automation [5], thereby expanding the role of computers in design and enhancing the efficiency of architects and designers.
2.2. Theoretical Foundations from a Computer Science Perspective: Artificial Intelligence Technology
In the 1960s, the focus of artificial intelligence research was on creating symbolic artificial intelligence capable of simulating human intelligence. John Haugeland referred to this as “GOFAI,” or Good Old-Fashioned Artificial Intelligence [6]. GOFAI was primarily based on symbolic operations such as manual coding, rules, and logical reasoning, bearing strong resemblance to modern programming [7]. It executed tasks automatically according to predefined rules, but its limitation lay in handling ambiguity and uncertainty. Early artificial intelligence systems were restricted to specific tasks, such as playing chess or solving mathematical equations. By the 1990s, neural networks emerged as a new approach to artificial intelligence, capable of learning from experience and effectively addressing problems involving fuzzy and uncertain data.
Since September 2022, technologies for AI-Generated Content (AIGC) have rapidly proliferated in design, creative, and content industries, undergoing iteration at an extremely fast pace. The refinement of deep learning models, the efforts of open-source communities, and cultural explorations have all acted as driving forces for the development of AI-generated content. In the field of architectural design, AIGC also demonstrates its technical advantages and unique value. For instance, when users input descriptive prompts into Midjourney or DALL·E, the platforms automatically generate architectural renderings consistent with the descriptions for users to select from. This illustrates AIGC’s advantage of rapidly and cost-effectively producing large volumes of content.
2.3. Summary of Industry Paradigm Shift Trends
The world’s first digital electronic computer, ENIAC, was invented in 1946 as part of a military collaborative research project. In its early stage, computer equipment was highly complex to acquire and operate, serving only companies with military contracts or large research institutions. Today, big data, computing power, and artificial intelligence have evolved and converged, organically integrating into a range of intelligent solutions. As a branch of computer science, artificial intelligence possesses the capacity to interpret external data [8]. It involves the development of general-purpose programs to accomplish tasks requiring human intelligence, including learning, perception, problem-solving, language understanding, and logical reasoning. Artificial intelligence is rapidly opening new frontiers in the discipline of sustainable development [2], accelerating multiple digital revolutions [9], and influencing broader global sustainability trends [2].
In his research, Manzoor describes artificial intelligence as a distributed, statistical, and symbolic technology designed to simulate human behavior or thought in order to complete specific tasks [2]. Bostrom and others classified artificial intelligence into three types: Artificial Super Intelligence (ASI), Artificial Narrow Intelligence (ANI), and Artificial General Intelligence (AGI) [10,11,12]. ASI is defined as “intelligence that vastly surpasses the human brain in practical applications,” ANI demonstrates intelligent functionality only within a specific domain, while AGI attains and surpasses human-level intelligence with the capacity for rapid learning and reasoning.
In recent decades, interdisciplinary teams of designers, computer scientists, and developers have implemented a variety of AI-based automated design algorithms, some of which remain theoretical while others have been successfully industrialized and commercialized. Scholars have summarized the applications of artificial intelligence in design processes, which primarily include concept design, functional specification, geometric modeling, structural consistency and code checking, optimization, collaborative workflow management, and creative design.
To analyze and address increasingly complex problems and challenges in architectural design, artificial intelligence has been introduced into the field [13]. Computer scientist Herbert Simon, focusing on intelligent design research, proposed the theory of “Design Science” [14]. He argued that design science should be a clearly organized, rational, and fully systematic design approach, rather than a body of simple scientific knowledge manufactured by humans. Design science must follow three principles: how designers work and think; how to establish an appropriate structure for the design process; and how to apply and develop design knowledge. Consequently, many scholars and architects have regarded design as a complex “decision-making process” [15,16,17]. Artificial intelligence technologies are now exploring new paradigms for analysis and seeking innovative solutions within complex systems.
With the widespread application of artificial intelligence, the entire construction industry is undergoing transformation, leveraging digitalization and intelligent innovations to enhance productivity. Disciplines and fields related to architectural design, such as construction engineering and management, are also experiencing rapid digital transformation, with AI-based solutions becoming a research focus [18]. In addition, Manzoor et al. explored the intersection of urbanization, cultural development, and artificial intelligence [2]. Thus, interdisciplinary research in the era of artificial intelligence is essential. It fosters collaboration and exchange across different disciplines, advances the application and development of AI technologies, and thereby creates greater economic and social value.
2.4. Identified Influencing Factors for AIAD
Through the extensive review of the literature, a range of influencing factors that pertain to AI adoption in architectural design has been examined and organized. These factors were acquired through the examination of several peer-reviewed studies pertaining to technological, organizational, human, educational, project-related, and economic dimensions. To support transparency and traceability, Table 1 presents the prominent factors that emerged from the examined literature, accompanied by their representative sources and thematic categories. This synthesis provides the empirical backing for the subsequent quantitative assessment and modeling procedures.

Table 1.
Summary of Identified Influencing Factors from Literature (Source: Drawn by the author).
Past research on the use of artificial intelligence in architecture has mainly highlighted conceptual exploration or thing-based examples without providing a common theoretical model to explain the ways AI technologies interact with aspects of design thinking, adaptations of the organization, and project management. Most of the literature reflects a descriptive or technology-centered view, emphasizing the function of a tool rather than the ways in which human, technological, and institutional variables crop up in the way architecture’s design process alters due to technology. This limited scope fails to show how technology, human, and institutional factors work together to contribute to the evolution of architectural design processes. This paper contrasts this narrow focus with a conceptual model that positions Artificial Intelligence-based Architectural Design (AIAD) as a socio-technical system at play. This model combines design theory studies, innovation diffusion, and technology adoption studies to broaden the conversation from tool use to mechanism interpretation. This shift from tool use to mechanism makes it possible for AIAD to transcend disciplinary boundaries, framing a theoretical model to evaluate AI’s role in innovation and organizational change in architecture.
Most of the previous literature on AI as a design agent in architecture methodologically depended on singular analytical techniques such as qualitative case studies, a factor survey, and even multi-criteria decision-making (MCDM) modeling. While those can be effective methods of analysis, they fundamentally focus on only one or two dimensions of the underlying ecology of dynamic and interdependent factors on agents’ willingness to embrace AI technologies used for design. We advance the methodological considerations of AI as a design agent by proposing a unified hybrid MCDM framework that is composed of AHP, DEMATEL, ISM, and MICMAC approaches that include quantifying weight, causal mapping, hierarchical structuring, and various levels of dependency classification. This hybrid MCDM approach offers an improvement to analytical qualities, and we were able to use it to cross-validate the findings from one model against another, decreasing subjectivity in evaluation and improving interpretation. In addition, providing a linked hybrid MCDM framework allows for a larger consideration of the theoretical tenets of the AIAD framework, which implies that our findings advance the understanding of AI mechanisms in design practices holistically, as compared to relying on past studies that either a model or framework devoted to one or the other. Overall, in relation to previous studies, the contribution offers methodological rigor and theoretical robustness, which enables further methodological advancement through empirical validation of structural equation modeling and potential system dynamics simulations.
3. Research Design and Framework
This study employed a systematic design, combining qualitative analysis with quantitative reasoning. By integrating artificial intelligence with architectural design, the study explored the impact mechanism of the project. The overall logic, from concept to empirical modeling, organically combined expert evaluation with measured data. This research was based on a previously validated literature-based survey. This study uses a hybrid multi-criteria framework to examine the hierarchical relationships and causal relationships between these factors. This approach maintains conceptual and theoretical coherence while ensuring the rigor of this current research, thereby bridging the gap between theory and practice in AI-assisted architectural design.
The overall analysis process consists of three stages. First, in our previous literature review research, we identified six major influencing factors and 18 minor influencing factors. Second, this study applied a hybrid decision model, which includes four frameworks. Finally, after neutralizing these research results, a unified influencing mechanism framework was constructed to identify the key driving factors of artificial intelligence application in architectural design. The data was collected through professionals from the fields of architecture, computer science and artificial intelligence. This integration of theory with measurable evidence provides depth of explanation and quantitative accuracy. Therefore, this research established a coherent logical foundation for the application and dissemination of complex interrelationships that define the adoption and diffusion of AI technologies in architectural design.
4. Research Methodology and Data Collection
4.1. Research Design and Process
This section aims to analyze the influencing mechanisms and interrelationships among the factors influencing the AI-based architectural design via the establishment of a combined AHP-DEMATEL-ISM-MICMAC model (Figure 2). The four models, AHP, DEMATEL, ISM and MICMAC, are commonly used as Multiple Criteria Decision Making (MCDM) methods to evaluate the best decision options or summarize the analysis based on multiple criteria. The combination of these four methods can make the research process more complete, rational and scientific. The purpose of the AHP method is to establish the basic and comprehensive weights of each factor, and DEMATEL is used to analyze the relationship between various factors and construct a matrix. ISM is adopted to build a multi-layer recursive structure model to further analyze the hierarchical structure and overall influencing relationship among the influencing factors. MICMAC is used to identify the driving factors for the adoption of AI technologies, as well as to provide the basis for subsequent analysis and implementation strategies.
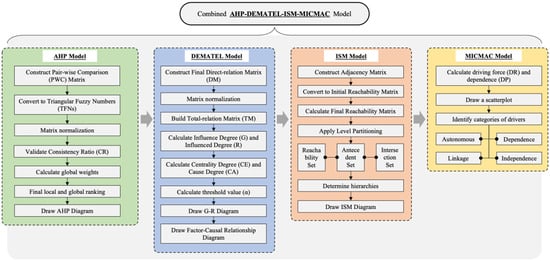
Figure 2.
Analysis process of a combined AHP-DEMATEL-ISM-MICMAC model (Source: drawn by the author).
Within the combined model, the results of the four models complement each other and are intrinsically related and complementary. For example, DEMATEL complements the scope of the AHP research object, while the MICMAC analysis is based on the ISM calculations. The subsequent research in this study will also be conducted based on the results of the four combined models.
It is also used to identify influencing factors that influence the implementation of AI-based architectural design. In this section, with a meta-analytic quantitative literature review as the basis, 6 primary influencing factor groups and 18 secondary influence factor groups are divided, as shown in Figure 3. The set of influencing factor indicators used in this study was derived from a systematic literature review conducted by the authors, which involved literature collection, screening, and thematic synthesis following PRISMA guidelines. Detailed procedures and source references are provided in a companion review article currently under submission. These established indicators serve as the theoretical and empirical foundation for the quantitative modeling presented in Figure 3.
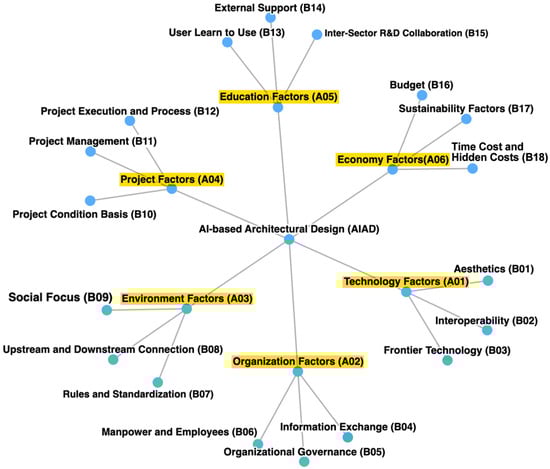
Figure 3.
AHP Hierarchy Tree and Influencing Factor Indicators (Source: Drawn by the author).
4.2. Method of Data Collection
The data for this study was collected from a group of 15 experts representing different fields, including the architectural design industry, academia, and the computer and internet industry. The experts were divided into three groups based on their professional domains. Group 1 consisted of experts from the architectural design industry, Group 2 comprised academic experts, and Group 3 comprised experts from the computer and internet industry.
In Group 1, the architectural design industry experts held positions such as Deputy General Manager, Project Manager, Director of Equipment, Chief Architect, and Creative Director. They had an average of 24 years of experience in their respective fields. Group 2 included academic experts from universities and research institutions, with positions ranging from Associate Professor to Professor and Institute Director. Their average years of experience were around 25 years. Group 3 consisted of experts from the computer and internet industry, holding positions such as Project Manager, Technical Lead, Digital Marketing Manager, Software Architect, and Senior Development Manager. They had an average of 28 years of experience.
The diverse expertise and extensive experience of these experts make them valuable contributors to the study. They bring a wealth of knowledge and insights from their respective domains, which will help in understanding the factors influencing AI adoption in architectural design. The inclusion of experts from different industries ensures a comprehensive and holistic analysis of the topic, considering various perspectives and potential interrelationships between factors. The composition of the expert group reflects a well-rounded representation of relevant domains, ensuring the credibility and reliability of the study’s findings. The insights provided by these experts will contribute to developing data-driven strategies for architecture firms undergoing digital transformation and addressing the knowledge gap in AI adoption within the architecture industry. The consistency checks will be completed as part of the AHP in Section 5.1.
Based on the professional field of decision makers, the expert group is further divided into three groups, with each consisting of five members. In this part, the Likert Scale and Structural Self-Interaction Matrix (SSIM) are adopted to design the scale and questionnaire.
In this section, the Likert Scale and the Structural Self-Interaction Matrix (SSIM) method were selected for the design of the scales and questionnaires. The Likert Scale is a rating tool used to measure attitudes or opinions, consisting of a series of statements to which respondents indicate their level of agreement using numerical scales or shorthand codes. For the AHP and DEMATEL sections, scores from 1 to 5 correspond to: (1) Equal Importance (EQI), (2) Moderate Importance (MI), (3) Strong Importance (SI), (4) Very Strong Importance (VSI), and (5) Extreme Importance (EXI). In the DEMATEL section, differing from the “importance” comparisons in the AHP part, data are collected to analyze the “degree of influence” among the factors. Scores from 0 to 5 correspond to: (0) No Influence (NI), (1) Low Influence (LI), (2) Moderate Influence (MOI), (3) High Influence (HI), (4) Very High Influence (VHI), and (5) Extreme Influence (EI). The advantage of using the Likert Scale is that it allows respondents to maintain a neutral stance when completing the questionnaire, without immediately expressing opinions that could bias the analysis results. At the same time, it does not compel participants to take a position on a specific topic, allowing them to respond with varying degrees of agreement. For the ISM section, the SSIM-VAXO method of the Structural Self-Interaction Matrix is employed for questionnaire design. These responses are easily quantifiable, thereby enhancing the reliability of subsequent data analysis results.
4.3. Construction of Combined AHP-DEMATEL-ISM-MICMAC Model
4.3.1. The Construction Process of AHP
AHP is a method proposed by Saaty to analyze complex decisions [99,100]. AHP has the ability to quantify the evaluation results of influencing factors into numbers to evaluate different alternatives and to determine the relevance of various elements considered in the analysis. The hierarchy established by the AHP determines the weights of the influencing factors, thus providing decision-making suggestions for the subsequent qualitative and quantitative analysis. The flow chart of the AHP model is shown in Figure 4. To determine the parameter weights via AHP, the following steps need to be followed:
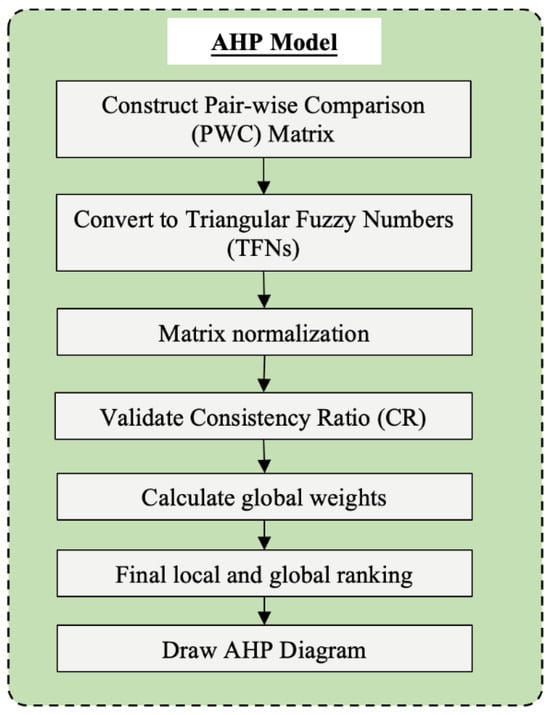
Figure 4.
AHP analysis process (Source: drawn by the author).
Step 1: a Pair-wise Comparison (PWC) matrix is established according to Equation (1) . represents the number of parameters used for PWC. stands for the decision elements of the pair-wise matrix shown. To obtain the final pair-wise comparison matrix, it is necessary to introduce fuzzy theory.
First of all, the experts give their opinions on comparison of primary influencing factors and other influencing factors. After describing the initial paired comparison matrix, showing the qualitative paired comparison. Then the scale will be quantified into Crisp Numeric Values, and the next step is to convert the values into Triangular Fuzzy Numbers (TFNs).
Then, the three original paired comparison matrices obtained by the three expert groups are merged into a paired comparison matrix, thus a summarized fuzzy paired comparison matrix is formed. Following the defuzzification step, the final paired comparison matrix is obtained. The following steps are used to carry out AHP analysis to determine the parameter weights. Equations (1)–(9) of this part of the model come from Saaty and his research work [101,102]. These include the pairwise comparison matrix, normalization procedure, eigenvector computation, and consistency ratio (CR) calculation.
In the paired comparison matrix, if the value of a cell is , the corresponding value in the table cell is . For example, the relationship between cells and in Equation (1) can be reflected by and respectively.
Step 2: The paired comparison matrix is normalized via the use of Equation (2). represents the influencing factors in the normalized matrix.
Step 3: The Priority Vector of each influencing factor is calculated via the use of Equation (3). If the Consistency Ratio (CR) condition is met after the consistency is checked, the Priority Vector can be considered as the final weight of the influencing factors, and represents the weights of each parameter.
Step 4: The last step of AHP is to calculate the CR value and check whether it is within CR ≤ 0.1 or 10%. The following are the steps to perform the consistency checking process.
First, the Weighted Sum matrix is calculated according to Equation (4).
Then, the Consistency () of each factor is determined.
The average consistency () is calculated by taking the average value of all consistencies calculated in the previous step.
Equation (7) is used for calculating the value of Consistency Index (CI).
Finally, Equation (8) is used to calculate the CR value.
RI stands for random index, which can be obtained from Table 2 according to the number of influencing factors considered in AHP analysis. If the CR value is less than 0.1 or 10%, the paired comparison matrix created in step 1 is consistent, and the weight calculated in step 3 via the use of Equation (3) can be finally determined as the influencing factor weight. If the CR value exceeds 0.1, it is necessary to return to step 1 to reconstruct the judgment matrix and paired comparison matrix until the CR value is limited to 0.1. For the complete AHP analysis of the 6 primary influencing factors, see Section 4.1 for details.
Table 2.
Random index (RI) values (Source: drawn by the author).
Step 5: After that, the Global Weights of the parameters need to be calculated. The weights obtained from pairwise comparisons in AHP analysis are usually Local Weights. The concepts of Global Weights and Local Weights are applied to the secondary influencing factors, and the Global Weights are calculated using Equation (9).
The Global Weights of each secondary influencing factor can be obtained if the primary influencing factor weight is multiplied by the respective local secondary influencing factor . While the following conditions must be met:
Condition 1:
Condition 2:
Condition 3:
Here, x represents the number of primary influencing factors and y stands for the number of secondary influencing factors within the primary influencing factors. It is important to note that the three conditions stated resolve under the assumption of hierarchical independence and consistent judgment matrices. For instance, the same secondary influencing factor may have overlap between different primary categories, which may have a smaller effect on the overall weight accuracy. Furthermore, as attention is put on the experts to make comparisons using the AHP method, the resulting weights may have subjectivity, of a considerable amount when increasing the number of comparisons and level of comparisons. This study will address those limitations by applying fuzzy logic transformation and expert group averaging to increase consistency and eliminate some subjectivity. Finally, the AHP method can be used to calculate the weights of primary and secondary influencing factors, including local weights, local ranking, global weights, and global ranking, all of which are shown in Table 3 below.
Table 3.
Final AHP calculation results (Source: drawn by the author).
Step 6: The local and global influencing factors are ranked according to the results of the calculated weights, as shown.
4.3.2. The Construction Process of Decision-Making Trial and Evaluation Laboratory (DEMATEL)
DEMATEL is an analytical method used to analyze the interaction among factors in complex systems and identify the core influencing factors. After the basic weight and comprehensive weight of each influencing factor are established, it is necessary to further analyze the relationship between these factors and identify the key ones. Different from AHP in which the “importance” of influencing factors is analyzed, DEMATEL is mainly used to analyze the “influencing degree” between various factors. The relationship between factors is bidirectional. DEMATEL method needs to be supplemented by Fuzzy Set theory to solve the problems of insufficient data clarity and subjective judgment of respondents [103]. It has been widely used in many fields. DEMATEL technology, based on graph theory, helps decision makers analyze multiple measurement standards into causal groups, thus producing simpler causal relationships [102]. Equations (10)–(18) follow the standard formulation established by Gabus & Fontela [104], with methodological refinements referenced from Ocampo et al. and Chen & Chen [101,103]. Figure 5 are the steps of DEMATEL method:
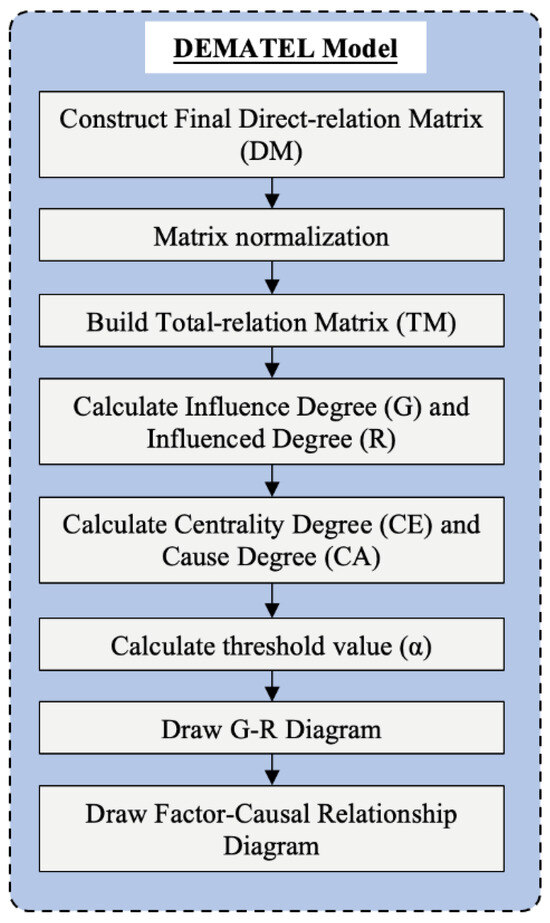
Figure 5.
Diagram of DEMATEL analysis process (Source: drawn by the author).
Step 1: A Direct-relation Matrix is constructed based on Equation (10). represents the influencing degree of the I-th factor on the J-th factor. Based on the scale in Table 4, the three direct influence matrices of the three expert groups are quantized, and then converted into triangular fuzzy numbers, and summarized to obtain the Fuzzy Direct-relation Matrix. Finally, defuzzification is performed to obtain the Final Direct-relation Matrix.
Table 4.
Linguistic-based importance conversion scale (Source: drawn by the author).
In Equation (10), the diagonal elements of the direct influence matrix are set to be zero. If there are k (number) decision makers, the final direct influence matrix is considered as the average value of all elements provided by the k decision makers, as shown in Equations (4)–(11) .
Step 2: The direct influence matrix D is normalized via Equation (13). Before normalization, it is necessary to calculate the sum of values in each row and column, find the largest number-s in the summation elements according to Equation (12), and then normalize the direct influence matrix according to Equation (13).
Step 3: A Combined Influence Matrix is established according to Equation (14), and the Total-relation Matrix is represented by Equation (15). Represents the total-relation elements of matrix .
Here I is the Identity Matrix of an n-matrix . All diagonal elements are 1, and the other elements are equal to 0, as shown in Equation (16).
Step 4: The Influence Degree () and Influenced Degree () for each influencing factor are calculated according to Equation (17). The Gi is obtained by the summing of values in each row of the combined influence matrix, while the is calculated by the summing of values in each column.
Step 5: After the Gi and the are confirmed, the Centrality Degree (CE) and Cause Degree (CA) will be calculated. The Centrality Degree (CE) and Cause Degree (CA) will be determined via Equation (18), and both reflect the causal relationship among influencing factors. The calculation results about the CE and CA for each influencing factor are listed in Equation (16).
Centrality Degree value indicates the importance of this factor in the whole system. The higher the value is, the more important the influencing factor is. Cause Degree value indicates the causal relationship, indicating the influence of an influencing factor on other factors. If , the corresponding factor is a causal factor that has a strong influential effect on other factors. If , the corresponding factor belongs to a result factor, indicating that the factor is susceptible to the influence of other factors. Based on the calculation results, the centrality is ranked, and the factor attributes are determined by the positive and negative values of the Cause Degree. With the Centrality Degree as the horizontal axis and the Cause Degree as the vertical axis, the “Cause-effect Diagram” is drawn eventually.
Step 6: The “Cause-effect Diagram” drawn in the previous step labels the influencing factors as points on the Cause Degree-Centrality Degree axis. In order to visualize the relationship between parameters, a Digraph in the section will be constructed in the form of arrows to a more visualized presentation. Therefore, it is necessary to calculate the threshold value (α) by using Equation (19) to calculate the average values of all elements of the Total-relation Matrix (T).
At this time, the importance of influencing factors is determined based on the threshold value, and the total relation elements in the Total-relation Matrix (T) that are greater than the threshold (α) are used to construct the DEMATEL diagram. The directional arrows in the Section 5.2 indicate the intervention direction and are superimposed on the “Factor-Causal Relationship Diagram” drawn in the previous section to show the strong and weak causal relationship between different influencing factors more intuitively.
4.3.3. The Construction Process of Interpretative Structural Modeling (ISM)
Since AHP-DEMATEL can only judge the relationship between the primary influencing factors of a complex system or the relation between all the secondary influencing factors under the independent primary influencing factors. While it cannot judge the relationship between the secondary influencing factors under across-level influencing factors. For example, it cannot judge the relationship between aesthetics (B01) under technological factor (A01) and information exchange (B04) under organizational factor (A02). Meanwhile, it is impossible to divide the structural relationship between influencing factors. Therefore, in order to clearly analyze the hierarchical relationship among the influencing factors in the system and identify the basic influencing factors in the system, the Interpretive Structural Modeling (ISM) and Cross-Impact Matrix Multiplication Applied to Classification (MICMAC) are combined to solve the problem that the importance of each influencing factor in the system cannot be identified. ISM can be used to solve complex system problems, and it is also suitable for system analysis with many variables and unclear structural relationships. The hierarchical relationship diagram obtained by ISM shows the ultimate goal of the system at the top, with the lower hierarchies, respectively, showing the causes of the upper hierarchies. This method makes the analysis results not only intuitive but also precise and reasonable, and it facilitates the understanding and identification of the direct and indirect relationships between specific projects. Equations (19)–(22) are derived from Warfield’s original system-structure modeling framework [104]. The ISM steps are described in Figure 6 as follows:
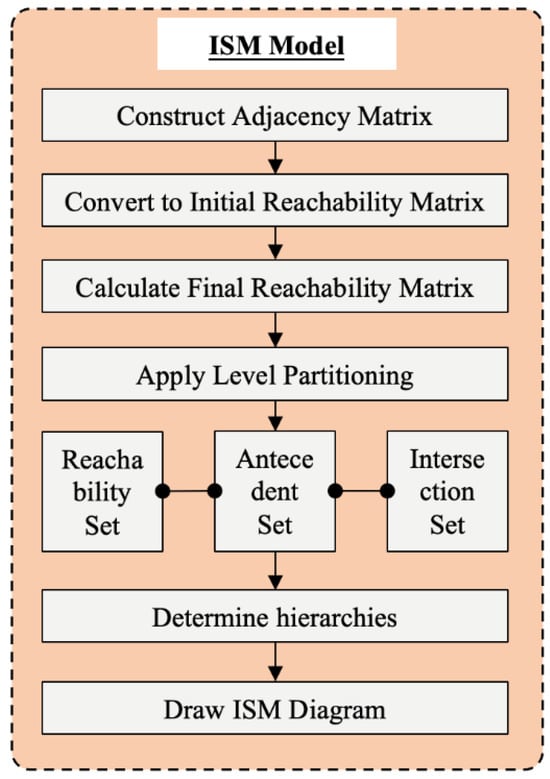
Figure 6.
ISM steps (Source: drawn by the author).
Step 1: According to the four influence relationships of V, A, X and O given, a Structural Self Interaction Matrix (SSIM) is made, namely the Adjacency Matrix. The Adjacency Matrix in ISM is basically the same as the direct influence matrix in DEMATEL. The main difference is that in ISM, the adjacency matrix determines whether there is any influence relationship between factors, while in DEMATEL, the direct influence matrix indicates the degree of influence between influencing factors according to the scale given in Table 4. Equation (20) shows an example of adjacency matrix.
In Equation (20), the diagonal element of SSIM is set to be 1, and the upper triangular elements are replaced by four letters, V, A, X and O.
Step 2: The SSIM is converted into an Initial Reachability Matrix by replacing the letters on the upper triangle with binary digits 0 or 1. Similarly, the binary digits in the lower triangle element can be determined according to the four letters determined by the upper triangle edge. The value of each cell in the Reachability Matrix is 1 or 0, indicating that there is a connection between two node pairs. It means that one node can be reached from another node in the binary relationship of the graph.
Step 3: The final Reachability Matrix is generated by the application of the transformation laws shown in Equation (21). The conversion principle is that if any factor A relates to or influences factor B, and factor B relates to factor C, factor A will automatically relate to or influence factor C according to the Boolean algebra algorithm. The Transitivity Elements are marked as 1*.
In Equation (21), the diagonal element of the final Reachability Matrix is set to be 1, and the other elements are assigned to be 1 or 0 accordingly.
Step 4: After that, the Level Partitioning method is used to construct the hierarchy partitions and assign a hierarchy to each variable in the hierarchical structure. The Reachability Matrix needs to be decomposed to divide the areas of influencing factors. Based on the Reachability Matrix , the Reachability Set, Antecedent Set and Intersection Set are calculated. Reachability Set represents the set of all factors in which the factor can be reached in ; Antecedent Set implies the set of all factors in which the factor can be reached in ; and Intersection Set means the intersection of Reachability Set and Antecedent Set. The Reachability Set represents a factor set composed of the enabling factor itself and other parameter sets that contribute to the realization of other factors. All parameter sets with binary digit 1 in the corresponding row in the final Reachability Matrix are considered. In addition, Antecedent Set is a factor set composed of contributing factor itself and other parameter sets that may be influenced by other factors. All parameter sets with binary digit 1 in the final Reachability Matrix are considered. The Intersection Set consists of all the common elements of the Reachability Set and the Antecedent Set. With the Reachability Matrix as the cardinal number, one factor is selected from each possibility set, which has the same elements as the Intersection Set. When the Intersection Set and the Reachability Set are perfectly matched, the corresponding factors will be assigned to their respective hierarchies, and these factors will be eliminated in subsequent iterations. After the stratified factors are removed, this operation will be repeated for the remaining factors, and all the first-hierarchy factors are ignored until all the factors are classified into different hierarchies. The iterative process continues until all factors are assigned to a certain hierarchy in the ISM, and the complete stratification result is finally obtained.
Step 5: The diagram described in Figure 6 shows the different hierarchies in the ISM structure, with the top factors mainly influenced by the bottom factors. The directed arrows show the direct and indirect influences between the considered factors.
4.3.4. The Construction Process of Cross-Impact Matrix Multiplication Applied to Classification (MICMAC)
Cross-Impact Matrix Multiplication Applied to Classification (MICMAC) means the principle of multiplication of influence matrix is applied to make the influence matrix reach a stable state. In the first part, the hierarchy and logical relationship between influencing factors are understood through the ISM. Based on the ISM Reachability Matrix, the influencing factors can be classified by using MICMAC analysis method, so as to further clarify the role of each factor in the system and the relationship between the factors, and finally calculate the dependence and driving force of the influencing factors. The MICMAC method can be used to identify the driving force and dependence of the influencing factors, so as to make recommendations in a more targeted manner. The analytical structure and classification equations are based on Godet [105], Figure 7 shows the flow chart of MICMAC analysis, and the result of this section is the analysis chart of driving force-dependence classification, with the following steps:
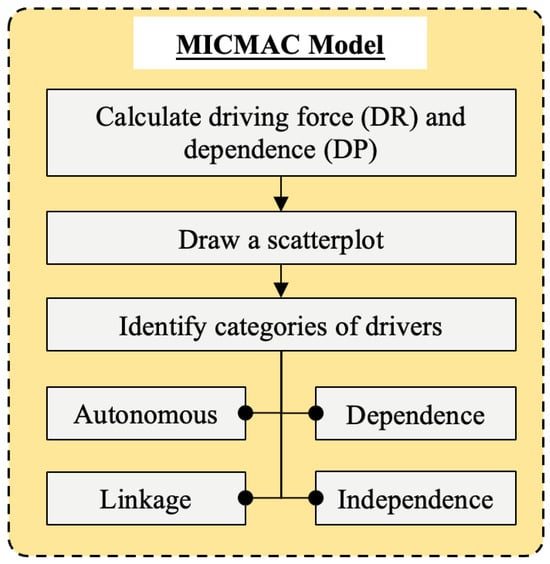
Figure 7.
MICMAC analysis process (Source: drawn by the author).
Step 1: The driving force () and dependence () in the Reachability Matrix are calculated according to Equation (22). The driving force of influencing factors represents the sum of all binary digits-1 in the rows, while dependence is the sum of all binary digits 1 in the columns. Driving force indicates the degree to which one influencing factor drives other influencing factors. As the Reachability Set of each variable, it indicates the number of variables it can reach. The driving force indicates the degree to which the solution to this factor can help solve other factors. A greater driving force means more other factors can be solved. Dependence indicates the degree of dependence of other factors on one influencing factor, as well as the number of variables reaching it. The dependence represents the dependence of the solution to this factor on the solutions to other factors. A greater dependence means a greater dependence on the solutions to other factors. The influencing factors are classified according to driving force and dependence. Those ranking high in the list of driving forces have a strong ability to drive other factors, signifying that they have a greater influence on other factors. Those ranking high in the list of dependences are factors mainly depending on or slightly driven by other factors, meaning that the influencing factor is more dependent on other influencing factors.
Step 2: The calculation result data of driving force and dependence are visualized in the form of scatter diagram in Figure 8. The coordinate system is divided into four quadrants, corresponding to autonomous cluster, dependence cluster, linkage cluster and independent cluster, respectively. With the driving force as the ordinate and the dependence as the abscissa, the driving-dependence power coordinate diagram based on the influencing factors of AI-based architectural design is drawn as followed:
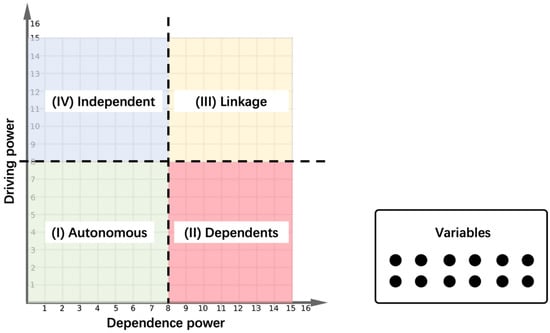
Figure 8.
Coordinate system of driving force-dependence power (Source: drawn by the author).
5. Results and Data Analysis
Based on the definition and identification of 18 influencing factors, this study invited a panel of 15 experts to participate in the survey and evaluate the factors in order to analyze the impact mechanisms of AI-based architectural design. According to their professional fields and career backgrounds, the 15 experts were divided into three groups, each comprising five members. All participating experts have over 20 years of experience in their respective fields. The first group consisted of members from the architectural design industry, including architecture, design, engineering, and rendering professionals who have had exposure to AI technologies. The second group consisted of faculty and researchers from universities and research institutions, associated with architectural disciplines. The third group comprised professionals from the computer and internet industries, with extensive experience in software development and commercial applications of AI.
To ensure internal consistency, reliability testing was conducted using Cronbach’s α. The coefficient for the combined expert questionnaire was 0.892, indicating strong reliability and consistency among expert evaluations. Prior to distribution, the questionnaire was reviewed by three external experts to assess content validity, ensuring that each influencing factor and corresponding linguistic scale accurately represented the intended conceptual dimension.
In the AHP and DEMATEL sections, each pairwise comparison matrix and direct-influence matrix was evaluated three times. Figure 9 illustrates the membership functions and bounded values for triangular and trapezoidal fuzzy numbers. To capture the fuzziness inherent in expert decision-making, all crisp numeric values were further converted into Triangular Fuzzy Numbers (TFNs) according to Figure 9. The figure also presents all linguistic assessment phrases along with their corresponding quantitative values and the converted fuzzy values. Beyond prioritizing each decision-maker’s evaluation results, unclear or ambiguous situations were also accounted for using fuzzy logic, thereby enhancing the accuracy and reliability of the results.
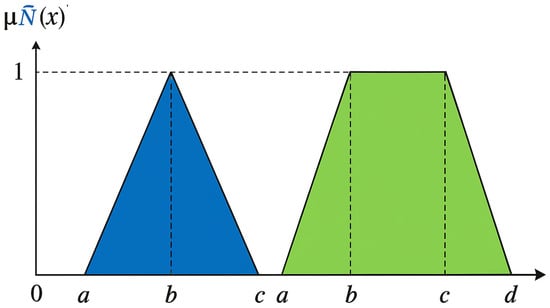
Figure 9.
Conversion Method of Triangular Fuzzy Numbers (TFNs) (Source: Drawn by the author).
The abscissa in Figure 10 represents a normalized linguistic scale used in the fuzzy conversion process. It is dimensionless, corresponding to the expert-assigned influence levels ranging from 0 (no influence) to 5 (extreme influence). The ordinate indicates the membership degree of each linguistic term, ranging from 0 to 1, denotes a triangular fuzzy number, and denotes a trapezoidal fuzzy number. For the triangular fuzzy number , represents the lower bound value, represents the intermediate value, and represents the upper bound value. In the case of the trapezoidal fuzzy number , and represent the lower and upper bound values, respectively. In Figure 10, the trapezoidal fuzzy number has two intermediate bounds, denoted as and . Equations (23) and (24) describe the triangular fuzzy number and trapezoidal fuzzy number, respectively.
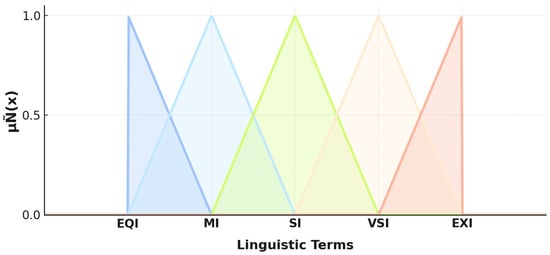
Figure 10.
Conversion of Linguistic Terms and Triangular Fuzzy Numbers (Source: Drawn by the author).
If there are two triangular fuzzy numbers, such as and , the calculation method between these two TFNs is as follows:
Among them, Equations (25)–(30) represent the addition, subtraction, multiplication, division, reciprocal operations between triangular fuzzy numbers, and the defuzzification calculation of fuzzy numbers, respectively. The resulting value is the defuzzified value. If there are k decision-makers expressing their opinions, the fuzzy numbers can be aggregated as follows:
5.1. Weighting and Hierarchical Ranking of Influencing Factors
In the AHP, a paired comparison matrix is used to describe the relative importance of each assessed indicator based on the scale provided in Table 4. In the analysis of this part, the local and global weights of all the influencing factors are derived through the AHP. The weights of the 6 primary influencing factors and the weights of 3 secondary influencing factors within each primary influencing factor are determined first. In addition, the global weights of all 18 secondary influencing factors are also calculated, resulting in an overall ranking. Table 5 demonstrates the final results of the AHP analysis and describes the weight and corresponding ranking of the primary influencing factors and shows the data visually in Figure 11.
Table 5.
Total-relation Matrix (Source: drawn by the author).
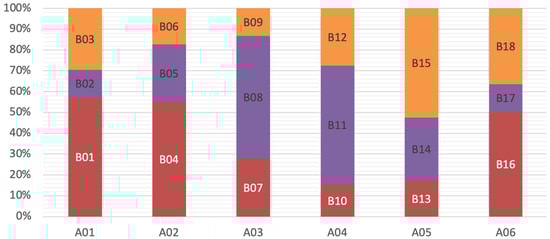
Figure 11.
18 Local weight distribution of secondary influencing factors in primary influencing factors (Source: drawn by the author).
According to the previous steps of calculating primary influencing factors of AHP, the triangular fuzzy numbers in the paired comparison matrix are standardized according to the matrix structure of “Expert decision-making panel 1”. In addition, the weights of related secondary influencing factors are calculated, and whether the consistency is within the allowable range is checked. According to the analysis results, the consistency ratio of the pairing matrix of all secondary influencing factors is within the limit of 0.1 or 10%. The global weights of the influencing factors are evaluated based on Equation (9), and Table 5 shows the weights and rankings of all primary and secondary influencing factors, as well as the local and global weights. Figure 11 and Figure 12 depict the local and global rankings and weight distributions of each influencing factor.
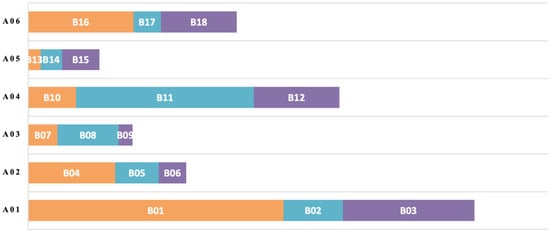
Figure 12.
Global weight distribution of secondary influencing factors among primary influencing factors (Source: drawn by the author).
5.2. Causal Relationship of Influencing Factors
In DEMATEL, the degree of influence of each influencing factor on other factors is evaluated via the comparative scale in Table 4. Three expert panels express their own opinions in language and text and then convert these opinions into quantitative numerical values and triangular fuzzy numbers.
DEMATEL is used to determine the causal relationship of the selected influencing factors. With the primary influencing factor A01 as an example, the calculation process of DEMATEL is as follows: The opinions about influence of a single influencing factor evaluated by three expert panels on another factor are quantified into numerical values, and then fuzzy transformation is performed based on the scale described in Table 4.
The final step of DEMATEL is to calculate the Total-relation Matrix-T based on Equation (14), as shown in Table 5. The Total-relation Matrix (T) can be used to determine the influencing and influenced parties of each factor, thus ultimately helping to find the causal relationship between the influencing factors. Equation (17) is used to calculate the Influenced Degree (G) and the Influenced Degree (R) for each influencing factor. Then Equation (18) is adopted to calculate the Centrality Degree (CE) and Cause Degree (CA), and all the calculated values are shown in Table 5.
Table 5 shows the causal relationship between the three secondary influencing factors in the primary influencing factors A01. G + R indicates the importance of each parameter and also, represents the degree of association of a particular influencing factor with other secondary influencing factors A higher G + R value indicates that the influencing factor has a stronger or more significant relationship with other influencing factors, while a lower G + R value indicates that the influencing factor has a weaker or less significant relationship with other influencing factors. In this case, B03 has the largest G + R value, making it the most important secondary influencing factor among the primary influencing factor A01, and it also has a stronger relationship with the other influencing factors B01 and B02.
On the other hand, G − R indicates the type of relationship between an influencing factor and other influencing factors. When the G − R number is positive, it shows the cause group; when it is negative, it represents the result group. Table 6 shows that the influencing factors B01 and B03 belong to the cause group, implying that these two factors influence the factor B02. Similarly, B02 belongs to the result group, indicating that it is influenced by the other two factors B01 and B03.
Table 6.
Final results of DEMATEL (Source: drawn by the author).
The threshold value (α) is similarly obtained by averaging all values of the Total-relation Matrix via the use of Equation (19). In Table 6, values greater than the threshold value are marked in bold font. Based on these values greater than (α), a “Factor-Causal Relationship Diagram” can be created for all 6 primary influencing factors, as shown in Figure 13. The same method and calculation process can be used to calculate the remaining five primary influencing factors separately. Table 5 shows the final DEMATEL results for all 6 primary influencing factors. Figure 14 depicts the scatter plots of G + R and G − R for the 6 primary influencing factors to indicate the degree of influence and effect. The results presented in Table 6 are based on deterministic MCDM computations. Traditional statistical significance tests and confidence intervals are not applicable. However, consistency ratio validation (CR ≤ 0.1) and cross-model verification among AHP, DEMATEL, ISM, and MICMAC ensure the robustness and reliability of these results.
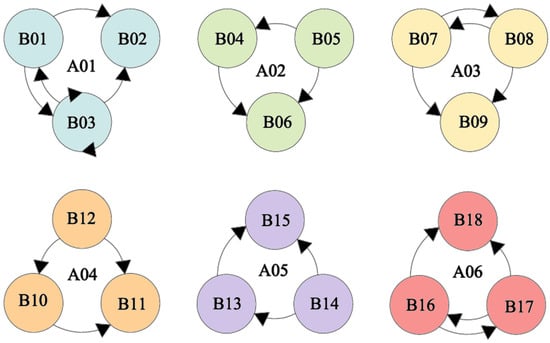
Figure 13.
Factor-Causal Relationship Diagram of DEMATEL model (Source: drawn by the author).
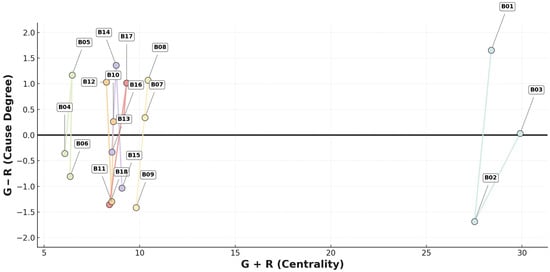
Figure 14.
DEMATEL centrality, causality and causal analysis (Source: drawn by the author).
5.3. Hierarchy Diagram of Influencing Factors
The ISM is used to analyze the hierarchical linkages among the influencing factors. First, the interviewed panelists expressed their assessments with the letters V, A, X, and O. Table 7 explains the meaning of these letters in detail. On this basis, a Structural Self Interaction Matrix (SSIM) is developed to determine the types of interrelationships between the parameters. After the results of the SSIM questionnaire are obtained, the Plurality Rule is used to construct the final SSIM pairwise comparison matrix. The Plurality Rule is different from the Simple Majority Method. According to it, the occurring frequency of each element in the original SSIM pairwise comparison matrix is used as the statistical index, and the symbol with the highest number of occurrences is used as the corresponding element in the final SSIM pairwise comparison matrix. The basis for the SSIM procedure is the 18 secondary influencing factors that have been defined, and the relationship between them is shown in Figure 15.
Table 7.
Symbols and their meanings in the ISM model (Source: drawn by the author).
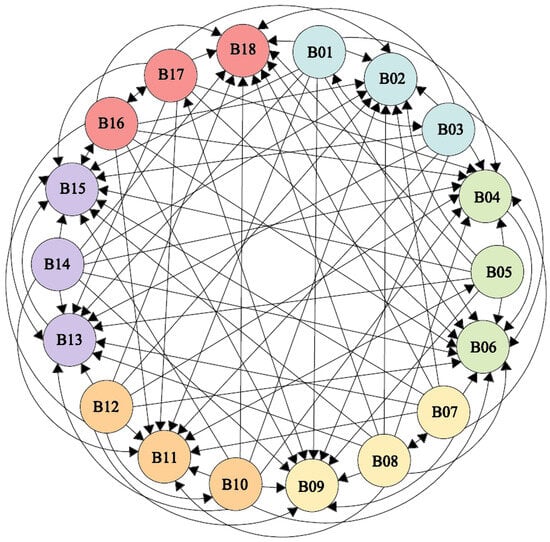
Figure 15.
Relationship between the 18 secondary influencing factors of the ISM (Source: drawn by the author).
After the relationship of 18 secondary influencing factors of the ISM has been identified, the next step is to replace the letters with numerical values 1 and 0 to convert the SSIM into a binary matrix (Figure 16 and Figure 17). Binary digits can be placed according to the following rules.
- V′ means that the entry for the cell at the upper triangular edge is 1, and the entry for the opposite cell at the lower triangular edge is 0.
- A′ means the entry for the cell at the upper triangle edge is 0, and the entry for opposite cell at the lower triangle edge is 1.
- X′ indicates that the entry for the cell at the upper triangular edge is 1, and the entry for the cell at the lower triangle edge is also 1.
- O′ implies the entry for the cell at the upper triangular edge is 0, and the entry for the cell at the lower triangular edge is also 0.

Figure 16.
8 Final SSIM pairwise comparison matrix (Source: drawn by the author).
Figure 16.
8 Final SSIM pairwise comparison matrix (Source: drawn by the author).


Figure 17.
Initial Reachability Matrix (Source: drawn by the author).
Figure 17.
Initial Reachability Matrix (Source: drawn by the author).

According to this rule, all letters in Figure 16 are replaced by binary digits to obtain the initial Reachability Matrix depicted in Figure 17.
The transformation principles discussed in the previous theoretical analysis section should be applied to calculate the final Reachability Matrix described in Figure 18. Among them, 0 is replaced by 1 *, which means that if A influences B and B influences C, A will automatically influence C.
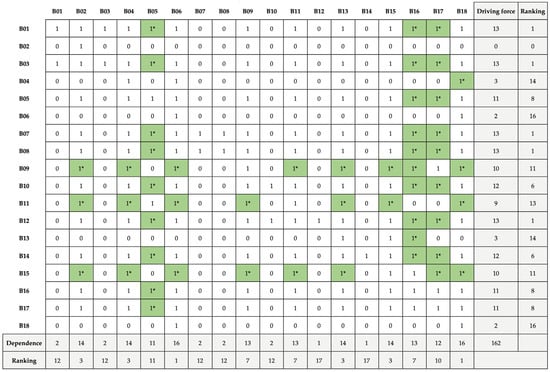
Figure 18.
Final Reachability Matrix (Source: drawn by the author).
The hierarchy operation is performed to determine the level of each factor. In this step, the Reachability Set and the Antecedent Set are determined. The Reachability Set includes the factors it may influence and itself, while the Antecedent Set involves all factors that can reach the factor and itself. Table 5, Table 6, Table 7 and Table 8 depicts the division about the first hierarchy and the first iteration. Afterwards, an ISM hierarchical structure diagram is established based on all iteration results and hierarchical division, as shown in Figure 19. B02, B06, B13, and B18 are at the top of the hierarchy, and these four factors do not influence or promote other factors but are influenced by lower-hierarchy factors. In addition, the low-hierarchy factor B12 is the most critical factor among all factors that directly or indirectly influence other parameters above it.
Table 8.
Calculation results of combined AHP-DEMATEL-ISM-MICMAC model (Source: drawn by the author).
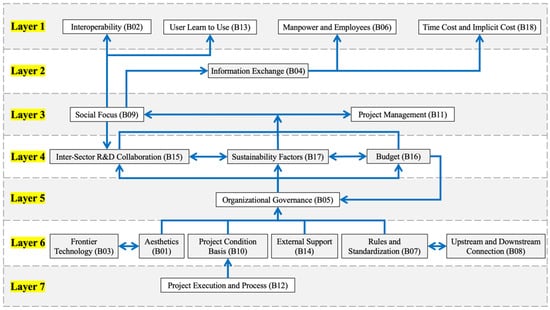
Figure 19.
ISM hierarchical structure (Source: drawn by the author).
5.4. Analysis of Driving Force-Dependence of Influencing Factors
MICMAC analysis helps to classify and identify factors based on their driving force and dependence. Figure 17 calculates the driving force and dependence of all 18 factors via Equation (22). Driving force determines the potential of a factor to influence or promote other factors, while dependence determines the dependence of a factor on other factors. Figure 17 shows the scatter plot of MICMAC analysis based on driving force and dependence, with the horizontal axis representing dependence and the vertical axis representing driving force.
The horizontal and vertical axis boundaries separating the four quadrants shown in Figure 20 are determined based on the driving force and dependence values of the influencing factors. In this research, the boundary is set at the midpoint between the maximum driving force and the dependent force value. According to the calculation of the ISM step, the maximum driving force is 13, so the horizontal axis of the coordinate remains at the midpoint 6.5. Similarly, the maximum dependent force is 16, so the vertical axis of the coordinate remains at the midpoint 8.
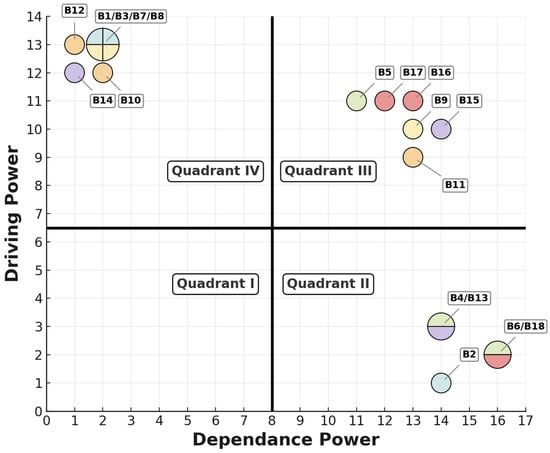
Figure 20.
Scatter plot of MICMAC analysis results (Source: drawn by the author).
The scatter plot in Figure 20 is divided into four quadrants, indicating the properties of each selected factor. The first quadrant represents an autonomous cluster of influencing factors, and no factor fits this group, indicating that all selected factors have contributed to the influencing mechanism of research on AI-based architectural design. The elements in the dependent cluster (second quadrant) have high dependence, but the driving force there is low. In this case, B02, B04, B06, B13, and B18 are easily influenced by other parameters. Similarly, B05, B09, B11, B15, B16, and B17 are factors of linkage cluster with the high driving force and high dependence (third quadrant). Finally, B01, B03, B07, B08, B10, B12, and B14 are in independent cluster (fourth quadrant), indicating that these elements are independent and have high driving force, but low dependence.
The outcomes from AHP, DEMATEL, ISM, and MICMAC assessments are interconnected and jointly display the multi-dimensional processes of AI adoption in architectural design. The AHP assessments deliver quantitative weightings and relative importance of influencing factors to build the base for causal assessment. The DEMATEL analysis identifies the directionality of these factors, identifying the cause-and-effect groups. The ISM model converts the relationships into a hierarchy that makes it clear the multi-level dependencies in the system. Finally, the MICMAC confirms and refines these relationships by clustering the factors into four groups based on their driving and dependence power. Together, these sequential approaches create a cohesive causal–hierarchical framework that both quantifies and interprets the interdependencies of the technological, organizational, human, and economic agents of AI-based architectural design.
6. Discussion
The research in this section starts with the construction of the combined AHP-DEMATEL-ISM-MICMAC model to determine the influencing mechanism of AI-based architectural design. The four multi-standard decision-making methods applied serve different objectives, and the interrelationships between various influencing factors are analyzed from different perspectives. Finally, the conclusions are drawn. Through the integration of AHP, DEMATEL, ISM, and MICMAC, a unified hybrid MCDM framework was established to quantify both the hierarchical importance and causal dynamics among influencing factors of AI-based architectural design. The AHP results provided clear quantitative weighting and ranking; DEMATEL identified cause-and-effect relationships and clarified the driving mechanisms; ISM constructed a hierarchical structural model linking multi-level factors; and MICMAC classified factors by driving power and dependence. Together, these methodological results validate the framework proposed in the Introduction and demonstrate that the combined model can reveal interrelationships and dependencies that single analytical methods fail to capture. This integration thus confirms the robustness, interpretability, and empirical potential of the AIAD influence mechanism framework (Figure 21 and Figure 22).
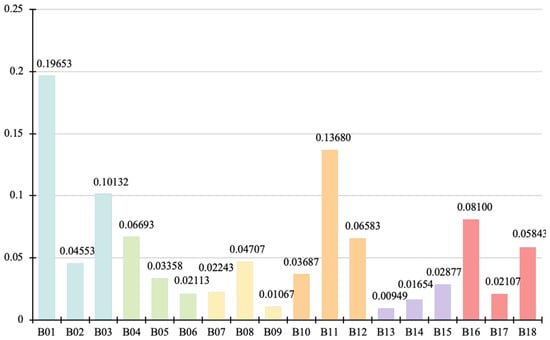
Figure 21.
Global weight data visualization (Source: drawn by the author).
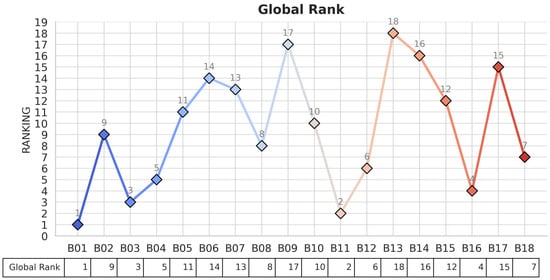
Figure 22.
Global ranking data visualization (Source: drawn by the author).
The AHP method is used to determine the importance of influencing factors. According to Table 5, the technological factor (A01) has the highest weight of 34.338%, followed by the project factor (A04) with a weight of 23.951%, indicating that the technological factor is the most relevant parameter among the 6 primary influencing factors. Education factor (A05) is the least important factor among the primary influencing factors, with a weight of 5.48%. Similarly, AHP analysis is also used to determine the most basic secondary influencing factors among each major factor. The local rankings shown in Table 5 and Figure 20 illustrate the most important and least important secondary influencing factors among each primary influencing factor. According to the global weight ranking shown in Table 5, aesthetics (B01) and user learning (B13) are, respectively, the most important indicator and least important indicator overall among the 18 secondary influencing factors. In addition, based on the local weights calculated by AHP in Table 5, the influencing factors are divided into three groups, namely high priority factors, intermediate priority factors, and low priority factors. The influencing factors with weights between 0.45 and 0.6 belong to the top priority group; those with weights between 0.25 and 0.40 belong to the intermediate priority group, while those with weights between 0.1 and 0.2 belong to the low priority group. Figure 23 describes the graphic representation of factors, which are divided into three local weight groups and specifically shown in Figure 24.
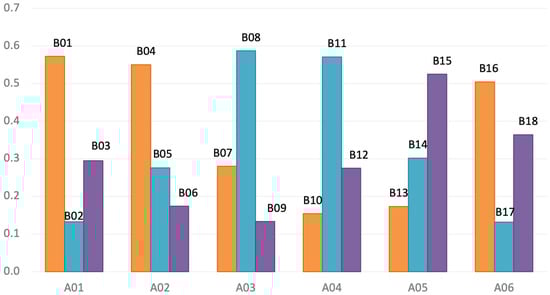
Figure 23.
Local ranking of secondary influencing factors among primary influencing factors (Source: drawn by the author).
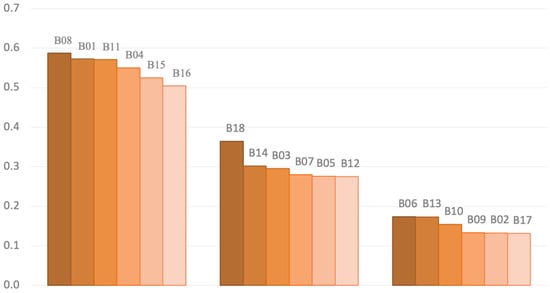
Figure 24.
Local Weight Categories in AHP Analysis (High Priority Group–Intermediate Group–Low Priority Group) (Source: drawn by the author).
The DEMATEL method is used to determine the causal relationship between the features shown in Table 5. The influence degree is determined via the calculation of the Influence Degree (G) and the Influenced Degree (R). Centrality (G + R) is used to identify the correlation between influencing factors, while causality (G − R) is used to determine the type of influence. If an influencing factor has a high G value and a high R value, it indicates that the factor has a strong potential to influence other factors and also a strong tendency to be influenced by other factors. Similarly, when the values of Influence Degree (G) and Influenced Degree (R) decrease, the ability to influence other factors and the likelihood of being influenced by other factors also decrease. A positive Cause Degree (G − R) value means that the ability to influence other factors is greater than the tendency to be influenced by other factors, so it belongs to the cause group. A negative Cause Degree (G − R) value indicates that the tendency to be influenced by other factors is greater than the ability to influence other factors, and therefore it belongs to the result group. Table 5 shows that cutting-edge technology (B03) has the highest centrality (G + R) value of 29.90502, followed by aesthetics (B01), with the second highest centrality (G + R) value of 28.38925. Thus, aesthetics (B01) and cutting-edge technology (B03) are of substantial importance in the field of architectural design, and these two factors also influence other factors. From the calculation results of the Cause Degree G − R value, project management (B11) has the smallest Cause Degree G − R value, so it has the greatest tendency to be influenced by other factors, followed by interoperability (B02), whose Cause Degree G − R value is the second lowest. On the other hand, project execution and process optimization (B12) are the most robust influencing factors in this group, with the highest Cause Degree (G − R) value, making it the least influenced by other factors, followed by aesthetics (B01), with a Cause Degree (G − R) value of 1.65263, ranking second. The Cause Degree (G − R) values are displayed in descending order, as shown in Figure 17. The influencing factors on the positive side of the coordinates in Figure 17 belong to the cause group, while the influencing factors on the negative side belong to the result group.
The ISM method is used to establish the relationship between the influencing factors at each hierarchy described in Figure 16. The results show that project execution and process optimization (B12) are at the bottom of the hierarchy, while interoperability (B02), manpower and employees (B06), user learning (B13), as well as time costs and hidden costs (B18) are at the top. The arrows in Figure 16 indicate that the factors of project execution and process optimization (B12) have a direct or indirect influence on all other factors above its hierarchy, making it one of the basic influencing factors that must be addressed in AI-based architectural design in order to optimize other indicators. Moreover, the influencing factors included in the sixth hierarchy have the same characteristics as project execution and process optimization (B12), and most elements starting from the fifth hierarchy are directly or indirectly controlled by the 6 parameters in the sixth hierarchy. On the other hand, the elements in the first and second hierarchies are the most sensitive, and they are seriously influenced by the factors below their hierarchy in the hierarchical structure. The parameters at the intermediate hierarchies, namely the third, fourth, and fifth hierarchies, have the characteristics of influencing others and are also influenced by other influencing factors.
MICMAC analysis is closely related to ISM analysis. It is used to determine the driving force and dependence of influencing factors. The ability to influence or drive other factors is represented by driving force, while dependence represents the tendency to be influenced or dependent on other parameters. The scatter plot in Figure 17 shows that none of the influencing factors belong to autonomous cluster, as there are no factors in the first quadrant. It means that there are no parameters with weak driving force and dependence. Similarly, the dependence clusters in the second quadrant are variable interoperability (B02), information exchange (B04), manpower and employees (B06), user learning (B13), and time costs and hidden costs (B18), indicating low driving force and high dependence of these five parameters. The organizational governance (B05), social attention (B09), project management (B11), inter-departmental R&D cooperation (B15), budget (B16) and sustainability and intensification factors (B17) in the third quadrant are the linkage clusters with strong driving force and strong dependence, while aesthetics (B01), cutting-edge technology (B03) and industrial laws and regulations (B17), connection between industrial upstream and downstream enterprises (B08), project condition basis (B10), project execution and process optimization (B12), and external support (14) in the fourth quadrant in independent clusters with high potential of being driven and low dependence. Figure 25 visualizes the flow of influence from MICMAC quadrants to ISM hierarchical layers and down to secondary factors (B01–B18). Link widths correspond to AHP global weights, providing an integrated view that connects classification (MICMAC), structure (ISM), and importance (AHP). The visualized relationship for the MICMAC-ISM distribution of secondary factors is shown in Figure 26 by a form of Sankey Diagram.
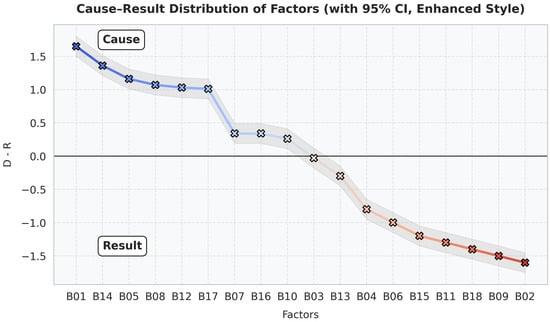
Figure 25.
Factors divided into Cause Zone and Result Zone (with 95% CI) (Source: drawn by the author).
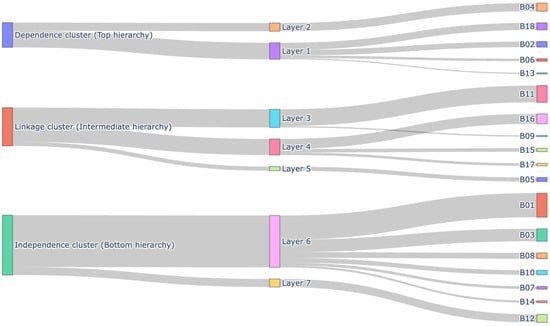
Figure 26.
Sankey Diagram of MICMAC Quadrants → ISM Layers → Secondary Influencing Factors (Source: drawn by the author).
From the combination of the four models as a whole, it can be seen that according to AHP analysis, the most important influencing factor is aesthetics (B01) based on global weights, while aesthetics (B01) also has the second highest centrality (G + R) value in DEMATEL analysis. In addition, the cutting-edge technology (B03) obtained the largest centrality (G + R) value in the DEMATEL analysis, although it ranked third in the AHP priority list. Project execution and process optimization (B12) occupies the lowest hierarchy in the ISM and is used to drive other factors above its hierarchy. Therefore, in DEMATEL, the D-R value of the project execution and process optimization (B12) factor is the highest, indicating its potential of strong driving force and low dependence. In MICMAC analysis, the factors of project execution and process optimization (B12) are also described in a similar manner, as they belong to the fourth quadrant and imply the same results. The 6 influencing factors located at the sixth hierarchy in the ISM have a positive Cause Degree (G − R) value in DEMATEL and occupy the fourth quadrant in MICMAC analysis, indicating that these factors are independent clusters with excellent driving potential. When the ISM hierarchy rises to the fifth hierarchy, it can be seen that the influential factor of organizational governance (B05) is moved to the third quadrant, indicating that it has a high driving force and dependence, and also has a positive Cause Degree (G − R) value in DEMATEL analysis. As the ISM hierarchy continues to rise, the driving power of influencing factors decreases with the increase in dependence trend. Therefore, the parameters at the top hierarchy of the ISM hierarchical structure are dependent and occupy the second quadrant of the MICMAC graph. On the other hand, the types at the lowest hierarchy of the ISM hierarchical structure are independent and occupy the fourth quadrant in MICMAC analysis.
For the first two ISM hierarchies, all 5 influencing factors are dependent on other factors below their hierarchy, so these factors occupy the second quadrant and have a negative Cause Degree (G − R) value, indicating that they have strong dependence and poor driving potential. The two factors in the third hierarchy, social attention (B09) and project management (B11), are located in the third quadrant, indicating that these two factors are highly dependent on other factors and have excellent driving force. The intermediate four hierarchies of the ISM have three parameters: cross departmental R&D cooperation (B15), budget (B16), and sustainability and intensification factors (B17), all of which have significant driving force and dependence. Therefore, the third quadrant is suitable for them in the MICMAC analysis chart. Thus, the final results of the applied methods are relatively close, demonstrating the high accuracy and precision of the research conclusions. Table 8 provides an overview of the entire analysis results.
7. Conclusions
This study primarily analyzes the factors and mechanisms influencing artificial intelligence (AI) technology in the architectural design industry, exploring the inherent relationships between these factors. Based on the influencing factors identified in the quantitative literature review, this part constructed a hybrid AHP-DEMATEL-ISM-MICMAC model and applied it to the collected data. First, the AHP method was used to implement global weighting and ranking to identify the most relevant factors and their contributions to the analysis. Next, DEMATEL was used to determine the causal relationships among the influencing factors. Based on this, the ISM was used to construct a hierarchical structure diagram. Finally, MICMAC was used to identify the driving forces and dependencies of the considered factors. The results of this study will help architectural design firms better explore and analyze the mechanisms influencing AI technology and serve as a foundation for subsequent research.
From a theoretical perspective, this study enriches the theoretical framework for the interdisciplinary integration of architectural design theory and computer artificial intelligence technology and furthers the empirical research and dynamic simulation of AI adoption intentions in the architectural design field. Using bibliometric and qualitative analysis methods, this study further develops the theoretical framework for the influencing mechanisms of AI technology in architectural design, including relationships among influencing factors, hierarchical structure diagrams, causal relationships, impact strength, importance ranking, and factor attributes. These findings can serve as a theoretical foundation for this research direction and drive further research.
From a practical perspective, the research is not only instructive to the architectural design industry in understanding drivers and barriers to the adoption of artificial intelligence, but also useful for understanding the integration of AI in areas of cultural tourism and regional spatial innovation. Using AI driven integrated design intelligence, firms can maximise creativity, optimise resource use, and balance technical efficiency with cultural historicity. This research presents informed strategic and educational references for sustainable experience environments and exemplifies an economic and social application of AI in future-oriented tourism-based architectural space design.
Although this research provides a systematic and integrated understanding of the influential mechanisms of AI adoption within the architectural design domain, the study does have some limitations that should be acknowledged. First, although the expert participant sample size was reasonably small, it was sufficient to conduct the AHP and the DEMATEL analysis, which may limit the generalizability of the findings. Future research may expand the sample base to incorporate a variety of stakeholders, including policymakers, practitioners, and researchers in various locations. Second, the hybrid MCDM framework used in this study is all-inclusive, but utilizing MCDMs is still a subjective assessment procedure, as pairwise comparisons and expert scores provide a basis for personal bias despite the reports of consistency ratios and cross-method validation. Finally, the study is mostly cross-sectional in design, and longitudinal or dynamic modeling methods such as System Dynamics (SD) and Structural Equation Modeling (SEM) are proposed for use in future studies to validate and model the temporal evolution of AI adoption mechanisms.
Author Contributions
Conceptualization, X.W. and Y.Z.; methodology, Y.Z.; software, X.S. and Y.Z.; validation, Y.Z.; formal analysis, X.X. and Y.Z.; investigation, W.Z. and Y.L.; resources, R.X.; data curation, X.X., Y.S. and X.L.; writing—original draft preparation, Y.Z.; writing—review and editing, X.W. and Y.Z.; visualization, X.X.; supervision, Y.Z.; project administration, X.W. All authors have read and agreed to the published version of the manuscript.
Funding
This research received no external funding.
Data Availability Statement
The data that support the findings of this study are available from the corresponding author upon reasonable request.
Acknowledgments
We thank all the support from the research team members, as well as the intangible help from their affiliations. The authors have reviewed and edited the output and take full responsibility for the content of this publication. The authors wish to express their thanks to the editors and reviewers for their contributional comments. This research was inspired by the transformative power of Artificial Intelligence and its profound impact on the field of architectural design. Over the past years, and even now, AI has reshaped the boundaries of this industry. The designers, even the tourism planners have been rethinking the new relationship with the computational logic.
Conflicts of Interest
The authors declare no conflicts of interest.
Abbreviations
The following abbreviations are used in this manuscript:
| AIAD | Artificial Intelligence-based Architectural Design e |
| AI | Artificial Intelligence |
| AHP | Analytic Hierarchy Process |
| DEMATEL | Decision-Making Trial and Evaluation Laboratory |
| ISM | Interpretive Structural Modeling |
| MICMAC | Cross-Impact Matrix Multiplication Applied to Classification |
References
- Hartl, A.; Peterka, J. Germany’s Human-Centred Approach to AI is Inclusive, Evidence-Based and Capacity-Building. Available online: https://oecd.ai/en/wonk/germany-takes-an-inclusive-and-evidence-based-approach-for-capacity-building-and-a-human-centred-use-of-ai (accessed on 18 May 2021).
- Manzoor, B.; Othman, I.; Durdyev, S.; Ismail, S.; Wahab, M.H. Influence of artificial intelligence in Civil engineering toward sustainable development—A systematic literature review. Appl. Syst. Innov. 2021, 4, 52. [Google Scholar] [CrossRef]
- Alexander, C. A Pattern Language: Towns, Buildings, Construction; Oxford University Press: Oxford, UK, 1977. [Google Scholar]
- Sutherland, I.E. Sketchpad a man-machine graphical communication system. Simulation 1964, 2, R-3–R-20. [Google Scholar] [CrossRef]
- Gero, J.S. Chapter 9—An overview of knowledge engineering and its relevance to CAAD. In Computer-Aided Architectural Design Futures; Pipes, A., Ed.; Butterworth-Heinemann: Oxford, UK, 1986; pp. 107–119. [Google Scholar] [CrossRef]
- Haugeland, J. Mind Design II: Philosophy, Psychology, and Artificial Intelligence; MIT Press: Cambridge, UK, 1997. [Google Scholar]
- Mehmood, M.U.; Chun, D.; Han, H.; Jeon, G.; Chen, K. A review of the applications of artificial intelligence and big data to buildings for energy-efficiency and a comfortable indoor living environment. Energy Build. 2019, 202, 109383. [Google Scholar] [CrossRef]
- Harapan, A.; Indriani, D.; Rizkiya, N.F.; Azbi, R.M. Artificial Intelligence in Architectural Design. Int. J. Des. (INJUDES) 2021, 1, 1–6. [Google Scholar] [CrossRef]
- Kusters, R.; Misevic, D.; Berry, H.; Cully, A.; Le Cunff, Y.; Dandoy, L.; Díaz-Rodríguez, N.; Ficher, M.; Grizou, J.; Othmani, A.; et al. Interdisciplinary Research in Artificial Intelligence: Challenges and Opportunities. Front. Big Data 2020, 3, 577974. [Google Scholar] [CrossRef] [PubMed]
- Bostrom, N. How long before superintelligence? Int. J. Futures Stud. 1998, 2, 1–9. [Google Scholar]
- Gottfredson, L.S. Mainstream science on intelligence: An editorial with 52 signatories, history, and bibliography. Intelligence 1997, 24, 13–23. [Google Scholar] [CrossRef]
- Strelkova, O. Three Types of Artificial Intelligence. Ph.D. Thesis, Khmelnitsky National University, Khmelnytsky, Ukraine, 2017. [Google Scholar]
- Cichocka, J.M.; Browne, W.N.; Rodriguez, E. Optimization in the architectural practice. In Proceedings of the 22nd International Conference of the Association for Computer-Aided Architectural Design Research in Asia (CAADRIA), Suzhou, China, 5–8 April 2017; pp. 387–396. [Google Scholar]
- Simon, H.A. The science of design: Creating the artificial. Des. Issues 1988, 4, 67–82. [Google Scholar] [CrossRef]
- Gidel, T.; Gautier, R.; Duchamp, R. Decision-making framework methodology: An original approach to project risk management in new product design. J. Eng. Des. 2005, 16, 1–23. [Google Scholar] [CrossRef]
- Hatchuel, A. Towards design theory and expandable rationality: The unfinished program of Herbert Simon. J. Manag. Gov. 2001, 5, 260–273. [Google Scholar] [CrossRef]
- Simon, H.A. The logic of heuristic decision making. In Models of Discovery; Springer: Cham, Switzerland, 1977; pp. 154–175. [Google Scholar]
- Pan, Y.; Zhang, L. Roles of artificial intelligence in construction engineering and management: A critical review and future trends. Autom. Constr. 2021, 122, 103517. [Google Scholar] [CrossRef]
- Darko, A.; Chan, A.P.C.; Adabre, M.A.; Edwards, D.J.; Hosseini, M.R.; Ameyaw, E.E. Artificial Intelligence in the AEC Industry: Scientometric Analysis and Visualization of Research Activities. Autom. Constr. 2020, 112, 103081. [Google Scholar] [CrossRef]
- Casey, R.M. Other Experts: Disciplinary and Aesthetic Impacts of Artificial Intelligence. Archit. Des. 2020, 90, 14–21. [Google Scholar]
- Ekici, B.; Kazanasmaz, Z.T.; Turrin, M.; Taşgetiren, M.F.; Sariyildiz, I.S. Multi-Zone Optimisation of High-Rise Buildings Using Artificial Intelligence for Sustainable Metropolises. Part 2: Optimisation Problems, Algorithms, Results, and Method Validation. Sol. Energy 2021, 224, 309–326. [Google Scholar] [CrossRef]
- Li, Y.; Chen, H.; Yu, P.; Yang, L. A review of artificial intelligence in enhancing architectural design efficiency. Appl. Sci. 2025, 15, 1476. [Google Scholar] [CrossRef]
- Liu, F.; Deng, K. AI knows Aesthetics: AI-Generated Interior design Identification using Deep Learning Algorithms. IEEE Access 2025, 13, 87621–87639. [Google Scholar] [CrossRef]
- Ullah, Z.; Al-Turjman, F.; Mostarda, N.; Gagliardi, R. Applications of Artificial Intelligence and Machine Learning in Smart Cities. Comput. Commun. 2020, 154, 313–323. [Google Scholar] [CrossRef]
- ADIO-MOSES, D.A.; Sunday, O. Artificial Intelligence for Sustainable Development of Intelligent Buildings. In Proceedings of the 9th CIDB Postgraduate Conference, Cape Town, South Africa, 2–4 February 2016; pp. 1–4. [Google Scholar]
- Tamke, M.; Nicholas, P.; Zwierzycki, M. Machine Learning for Architectural Design: Practices and Infrastructure. Int. J. Archit. Comput. 2018, 16, 123–143. [Google Scholar] [CrossRef]
- Vardhan, R. Machine Learning (Artificial Intelligence) in Architecture Design Process. Int. J. Archit. Des. Manag. 2020, 3, 45–56. [Google Scholar]
- Monlezun, D.J.; Sotomayor, C.; Girault, M.I.; Garcia, A.; Gallagher, C. From data interoperability to ‘moral interoperability’in the global health data architecture: Integrated use case of AI-driven computational ethical analysis with Bayesian-propensity score and cost-benefit analyses optimizing efficiency and equity in colorectal cancer. Med. Ética 2024, 35, 990–1054. [Google Scholar]
- El-Khouly, T.; Abdelhalim, O. Preserving conceptual design integrity: Strategies for enhancing interoperability in architectural digital design workflows. Sci. Rep. 2024, 14, 30595. [Google Scholar] [CrossRef] [PubMed]
- Kindratenko, V. A Comparison of the Accuracy of an Electromagnetic and a Hybrid Ultrasound-Inertia Position Tracking System. Presence 2001, 10, 657–663. [Google Scholar] [CrossRef]
- Oxman, R.E. Expert System for Generation and Evaluation in Architectural Design. Ph.D. Thesis, Technion—Israel Institute of Technology, Haifa, Israel, 1988. Available online: http://papers.cumincad.org/cgi-bin/works/paper/45b7 (accessed on 1 October 2025).
- Currie, K.; Tate, A. O-Plan: The Open Planning Architecture. Artif. Intell. 1991, 52, 49–86. [Google Scholar] [CrossRef]
- Wang, K.; Zhao, Y.; Gangadhari, R.K.; Li, Z. Analyzing the adoption challenges of the Internet of things (Iot) and artificial intelligence (ai) for smart cities in china. Sustainability 2021, 13, 10983. [Google Scholar] [CrossRef]
- Karadağ, D.; Ozar, B. A new frontier in design studio: AI and human collaboration in conceptual design. Front. Archit. Res. 2025; in press. [Google Scholar] [CrossRef]
- Scotta, P.J.; Lawson, B.R.; Ryu, J. An Intelligent Tutorial System for Computer Aided Architectural Design. In Artificial Intelligence in Design ’91; Gero, S., Ed.; Butterworth-Heinemann: Oxford, UK, 1991. [Google Scholar] [CrossRef]
- Rane, N.; Choudhary, S.; Rane, J. Integrating Building Information Modelling (BIM) with ChatGPT, Bard, and similar generative artificial intelligence in the architecture, engineering, and construction industry: Applications, a novel framework, challenges, and future scope. SSRN Electron. J. 2023. [Google Scholar] [CrossRef]
- Merhej, J.; Harb, H.; Abouaissa, A.; Idoumghar, L. Toward a new era of smart and secure healthcare information exchange systems: Combining blockchain and artificial intelligence. Appl. Sci. 2024, 14, 8808. [Google Scholar] [CrossRef]
- Wang, S.; Du, G.; Dai, S.; Miao, M.; Zhang, M. Efficient information exchange approach for medical IoT based on AI and DAG-enabled blockchain. Heliyon 2025, 11, e41617. [Google Scholar] [CrossRef]
- Balachandran, M.; Rosenman, M.A.; Gero, J.S. A Knowledge-Based Approach to the Automatic Verification of Designs from CAD Databases. In Artificial Intelligence in Design ’91; Gero, J.S., Ed.; Butterworth-Heinemann: Oxford, UK, 1991. [Google Scholar] [CrossRef]
- Igor, S. DDS-Distributed Design System: A Paradigm for Modeling Conceptual Architectural Design. In Proceedings of the InterSymp ’94, Advances in Computer-Based Design Systems, Baden-Baden, Germany, 8 August 1994; The International Institute for Advanced Studies in Systems Research and Cybernetics: Baden-Baden, Germany, 1994; pp. 79–88. Available online: https://www.researchgate.net/profile/Igor-Svetel/publication/324113817_DDS-Distributed_Design_System_A_Paradigm_for_Modeling_Conceptual_Architectural_Design/links/5abe6c7e0f7e9bfc0459a2d1/DDS-Distributed-Design-System-A-Paradigm-for-Modeling-Conceptual-Architectural-Design.pdf (accessed on 1 October 2025).
- Hakimi, M.; Zarinkhail, M.S.; Musawi, S.Z. Exploring the fusion of enterprise architecture, Blockchain, and AI in digital governance: A systematic review. Int. J. Softw. Eng. Comput. Sci. (IJSECS) 2024, 4, 497–511. [Google Scholar] [CrossRef]
- Fahlevi, M.; Moeljadi; Aisjah, S.; Djazuli, A. Corporate Governance in the Digital Age: A Comprehensive Review of Blockchain, AI, and Big Data Impacts, Opportunities, and Challenges. In Proceedings of the 8th International Conference on Energy, Environment, Epidemiology and Information System (ICENIS 2023), Semarang City, Indonesia, 8–9 August 2023; EDP Sciences: Les Ulis, France, 2023; Volume 448. [Google Scholar]
- Dhar, R.; Vaidhyanathan, K.; Varma, V. Leveraging generative AI for architecture knowledge management. In Proceedings of the 2024 IEEE 21st International Conference on Software Architecture Companion (ICSA-C), Hyderabad, India, 4–8 June 2024; IEEE: Piscataway, NJ, USA, 2024. [Google Scholar]
- Kolbjørnsrud, V. Designing the Intelligent Organization: Six principles for Human-AI collaboration. Calif. Manag. Rev. 2024, 66, 44–64. [Google Scholar] [CrossRef]
- Jin, S.; Tu, H.; Li, J.; Fang, Y.; Qu, Z.; Xu, F.; Liu, K.; Lin, Y. Enhancing architectural education through artificial intelligence: A case study of an AI-assisted architectural programming and design course. Buildings 2024, 14, 1613. [Google Scholar] [CrossRef]
- Pallavi, J.; Tripathi, V.; Malladi, R.; Khang, A. Data-Driven Artificial Intelligence (AI) Models in the Workforce Development Planning. Designing Workforce Management Systems for Industry 4.0; CRC Press: Boca Raton, FL, USA, 2023; pp. 159–176. [Google Scholar]
- Krishnan, P. An integrated strategic architectural framework for AI-augmented HRM. Int. J. Sci. Res. (IJSR) 2024, 13, 183–192. [Google Scholar] [CrossRef]
- Morandini, S.; Fraboni, F.; De Angelis, M.; Puzzo, G.; Giusino, D.; Pietrantoni, L. The impact of artificial intelligence on workers’ skills: Upskilling and reskilling in organisations. Informing Sci. 2023, 26, 39–68. [Google Scholar] [CrossRef] [PubMed]
- Torricelli, M.C. Architectural design and regulation: A troubled but necessary relationship. TECHNE—J. Technol. Archit. Environ. 2024, 27, 21–26. [Google Scholar] [CrossRef]
- Li, Z.; Zhao, Y.; Suman, S.K.; Bardhan, A. Stochastic simulation of microenvironment comfort and greenhouse gas emission of residential building using Monte-Carlo and hybrid intelligence paradigms. Environ. Dev. Sustain. 2025, 1–43. [Google Scholar] [CrossRef]
- Mehta, P. Intelligence Workflow for Architectural Design Process. In Advancements in Architectural, Engineering, and Construction Research and Practice: Integrating Disruptive Technologies and Innovation for Future Excellence; Springer International Publishing AG: Cham, Switzerland, 2024; p. 53. [Google Scholar]
- Oveisi, S.; Gholamrezaei, F.; Qajari, N.; Goodarzi, M.; Moin, M.-S. Review of artificial intelligence-based systems: Evaluation, standards, and methods. Adv. Stand. Appl. Sci. 2024, 2, 4–29. [Google Scholar]
- Kafle, V.P.; Hirayama, T.; Miyazawa, T.; Jibiki, M.; Harai, H. Network control and management automation: Architecture standardization perspective. IEEE Commun. Stand. Mag. 2021, 5, 106–114. [Google Scholar] [CrossRef]
- Cihon, P. Standards for AI Governance: International Standards to Enable Global Coordination in AI Research & Development; Future of Humanity Institute, University of Oxford: Oxford, UK, 2019; Volume 40, pp. 340–342. [Google Scholar]
- Lund, B.; Orhan, Z.; Mannuru, N.R.; Bevara, R.V.K.; Porter, B.; Vinaih, M.K.; Bhaskara, P. Standards, frameworks, and legislation for artificial intelligence (AI) transparency. AI Ethics 2025, 5, 3639–3655. [Google Scholar] [CrossRef]
- Fischer, G.; Nakakoji, K. Empowering Designers with Integrated Design Environments. In Artificial Intelligence in Design ’91; Gero, J.S., Ed.; Butterworth-Heinemann: Oxford, UK, 1991. [Google Scholar] [CrossRef]
- Płoszaj-Mazurek, M.; Ryńska, E.; Grochulska-Salak, M. Methods to Optimize Carbon Footprint of Buildings in Regenerative Architectural Design with the Use of Machine Learning, Convolutional Neural Network, and Parametric Design. Energies 2020, 13, 5289. [Google Scholar] [CrossRef]
- Fang, C.; Lai, Y.; Wen, Z. Research on Key Technologies of Intelligent Integrated System for Architectural Design Enterprises. In Proceedings of the 6th International Conference on Environmental Science and Civil Engineering, Nanchang, China, 4–5 January 2020; Volume 455, p. 012209. [Google Scholar]
- McDermid, J.; Jia, Y.; Habli, I. Upstream and Downstream AI Safety: Both on the Same River? arXiv 2024, arXiv:2501.05455. [Google Scholar]
- Zandi-Nia, A. TOPGENE: An Artificial Intelligence Approach to a Design Process. 1993. Available online: https://repository.tudelft.nl/record/uuid:b89db6aa-6ace-4f01-a663-9aeeed26537a (accessed on 1 October 2025).
- Kurcjusz, M.; Stefańska, A. Transformative integration of Artificial Intelligence in architectural design. Architectus 2025, 1, 89–99. [Google Scholar] [CrossRef]
- Kurmann, D. Sculptor—A Tool for Intuitive Architectural Design. In The Global Design Studio, Proceedings of the Sixth International Conference on Computer-Aided Architectural Design Futures, Singapore, 24–26 September 1995; Centre for Advanced Studies in Architecture, National University of Singapore: Singapore, 1995; pp. 323–330. ISBN 9971-62-423-0. Available online: http://papers.cumincad.org/cgi-bin/works/Show_id=caadria2010_003/paper/fa87 (accessed on 1 October 2025).
- Zheng, H.; Yuan, P.F. A Generative Architectural and Urban Design Method through Artificial Neural Networks. Build. Environ. 2021, 205, 108178. [Google Scholar] [CrossRef]
- Banz, G. An Iterative Approach to Computer-Aided Architectural Design. J. Archit. Plan. Res. 1985, 2, 187–200. [Google Scholar]
- Wang, K.; Ying, Z.; Goswami, S.S.; Yin, Y.; Zhao, Y. Investigating the role of artificial intelligence technologies in the construction industry using a Delphi-ANP-TOPSIS hybrid MCDM concept under a fuzzy environment. Sustainability 2023, 15, 11848. [Google Scholar] [CrossRef]
- Zabala-Vargas, S.; Jaimes-Quintanilla, M.; Jimenez-Barrera, M.H. Big data, data science, and artificial intelligence for project management in the architecture, engineering, and construction industry: A systematic review. Buildings 2023, 13, 2944. [Google Scholar] [CrossRef]
- Rafsanjani, H.N.; Nabizadeh, A.H. Towards human-centered artificial intelligence (AI) in architecture, engineering, and construction (AEC) industry. Comput. Hum. Behav. Rep. 2023, 11, 100319. [Google Scholar] [CrossRef]
- Rane, N.; Choudhary, S.; Rane, J. Artificial Intelligence (Ai) and Internet of Things (Iot)–based sensors for monitoring and controlling in architecture, engineering, and construction: Applications, challenges, and opportunities. Engineering, and Construction: Applications, Challenges, and Opportunities (November 20, 2023). SSRN Electron. J. 2023. [Google Scholar]
- Hanafy, N.O. RETRACTED: Artificial intelligence’s effects on design process creativity: A study on used AI Text-to-Image in architecture. J. Build. Eng. 2023, 80, 107999. [Google Scholar] [CrossRef]
- Cortiços, N.D.; Zheng, X.; Duarte, C.C. The Impact of Artificial Intelligence on Architecture: A Comprehensive Analysis of AI Software Tools and Their Global Adoption. In Proceedings of the International Conference on Building Materials and Construction, Okinawa, Japan, 21–24 February 2025; Springer Nature: Singapore, 2025. [Google Scholar]
- Mulesa, O.; Horvat, P.; Radivilova, T.; Sabadosh, V.; Baranovskyi, O.; Duran, S. Design of mechanisms for ensuring the execution of tasks in project planning. arXiv 2025, arXiv:2501.01255. [Google Scholar] [CrossRef]
- Bhatt, M.; Suchan, J.; Schultz, C.; Kondyli, V.; Goyal, S. Artificial Intelligence for Predictive and Evidence Based Architecture Design. In Proceedings of the Thirtieth AAAI Conference on Artificial Intelligence, Phoenix, AZ, USA, 12–17 February 2016. [Google Scholar]
- Zeytin, E.; Kösenciğ, K.Ö.; Öner, D. The role of AI design assistance on the architectural design process: An empirical research with novice designers. J. Comput. Des. 2024, 5, 1–30. [Google Scholar] [CrossRef]
- Amer, N.A. Architectural design in the light of AI concepts and applications. MSA Eng. J. 2023, 2, 628–646. [Google Scholar] [CrossRef]
- Dall’Asta, J.C.; Marco, G.D. AI Machine Learning in Creative Architectural Design Processes. xArch–Creativity in the Age of Digital Reproduction Symposium; Springer Nature: Singapore, 2023. [Google Scholar]
- Ho, Y.-F.; Wang, H.-L.; Liu, C.-C. System Dynamics and Genetic Artificial Neural Network Models for the Monitoring and Early Warning of Urban Housing Market. Retrieved from System Dynamics Society Website. 2012. Available online: https://proceedings.systemdynamics.org/2012/proceed/papers/P1234.pdf (accessed on 1 October 2025).
- Reffat, R. Utilization of artificial intelligence concepts and techniques for enriching the quality of architectural design artifacts. In Proceedings of the 1st International Conference in Information Systems, Philadelphia, PA, USA, 8–10 December 1981; pp. 1–13. [Google Scholar]
- Yeh, I.-C.; Hsu, T.-K. Building Real Estate Valuation Models with Comparative Approach through Case-Based Reasoning. Appl. Soft Comput. 2018, 65, 260–271. [Google Scholar] [CrossRef]
- Yu, J.-B.; Yu, Y.; Wang, L.-N.; Yuan, Z.; Ji, X. The Knowledge Modeling System of Ready-Mixed Concrete Enterprise and Artificial Intelligence with ANN-GA for Manufacturing Production. J. Intell. Manuf. 2016, 27, 905–914. [Google Scholar] [CrossRef]
- Allison James, T.; Cardin, M.-A.; McComb, C.; Ren, Y.; Selva, D.; Tucker, C.; Witherell, P.; Zhao, Y. Artificial Intelligence and Engineering Design. J. Mech. Des. 2022, 144, 1–6. [Google Scholar] [CrossRef]
- Hafner, M.; Rajšter, D.; Žibert, M.; Tušar, T.; Ženko, B.; Žnidaršič, M.; Fuart, F.; Vladušič, D. Artificial Intelligence Support for Tunnel Design in Urban Areas. In Tunnels and Underground Cities: Engineering and Innovation Meet Archaeology, Architecture and Art; CRC Press: Boca Raton, FL, USA, 2019. [Google Scholar]
- Idi, D.B.; Khaidzir, K.A.M. Critical Perspective of Design Collaboration: A Review. Front. Archit. Res. 2018, 7, 544–560. [Google Scholar] [CrossRef]
- Januszkiewicz, K.; Paszkowska, N. Climate Change Adopted Building Envelope for the Urban Environment. In A New Approach to Architectural Design, Proceedings of the International Multidisciplinary Scientific GeoConference: SGEM 3, Albena, Bulgaria, 28 June–7 July 2016; ProQuest: Ann Arbor, MI, USA, 2016; pp. 515–522. [Google Scholar]
- Özel, G. Interdisciplinary AI: A Machine Learning System for Streamlining External Aesthetic and Cultural Influences in Architecture. In Architectural Intelligence; Springer: Berlin/Heidelberg, Germany, 2020. [Google Scholar]
- Özel, G.; Ennemoser, B. Interdisciplinary AI. In ACADIA 2019: Ubiquity and Autonomy; Acadia Publishing Company: Mount Pleasant, SC, USA, 2019. [Google Scholar]
- Zielińska-Dąbkowska, K.; Barbara, B. Creating a More Conscious Built Environment for Day-and Night-Time Setting through Interdisciplinary Collaboration. In Proceedings of the PLDC 6th Global Lighting Design Convention in Paris/FR, Paris, France, 1–4 November 2017. [Google Scholar]
- Ali, A.K.; Lee, O.J. Facade Style Mixing Using Artificial Intelligence for Urban Infill. Architecture 2023, 3, 258–269. [Google Scholar] [CrossRef]
- Steenson, M.W. Why architecture and artificial intelligence? In XRDS: Crossroads, The ACM Magazine for Students; ACM Digital Library: London, UK, 2018; Volume 24, pp. 16–19. [Google Scholar]
- Hu, H.; Jiang, S.; Goswami, S.S.; Zhao, Y. Fuzzy integrated Delphi-ISM-MICMAC hybrid multi-criteria approach to optimize the artificial intelligence (AI) factors influencing cost management in civil engineering. Information 2024, 15, 280. [Google Scholar] [CrossRef]
- Wang, Y.; Chen, L. Architectural and Landscape Garden Planning Integrated with Artificial Intelligence Parametric Analysis. Secur. Commun. Netw. 2022, 2022, 8577269. [Google Scholar] [CrossRef]
- Wei, L. AI Concepts in Architectural Design. IOP Conf. Ser. Mater. Sci. Eng. 2018, 392, 062016. [Google Scholar] [CrossRef]
- Zhao, Y.; Genovese, P.V.; Li, Z. Intelligent thermal comfort controlling system for buildings based on IoT and AI. Future Internet 2020, 12, 30. [Google Scholar] [CrossRef]
- Bikulčiūtė, G. Timber Upward Extension: Exploration of the Use of Parametric Modelling and Machine Learning for Initial Building Extension Design. Master Thesis, Delft University of Technology, Delft, The Netherlands, 2021. [Google Scholar]
- Arora Jasbir, S.; Baenziger, G. Uses of Artificial Intelligence in Design Optimization. Comput. Methods Appl. Mech. Eng. 1986, 54, 303–323. [Google Scholar] [CrossRef]
- Dan, R.; Ghantous, K.; Otani, R.K. Performance Measures from Architectural Massing Using Machine Learning. In Proceedings of the IASS Annual Symposia, Amsterdam, The Netherlands, 17–20 August 2015; pp. 1–12. [Google Scholar]
- Tang, B.; Chen, Z.; Hefferman, G.; Pei, S. Incorporating Intelligence in Fog Computing for Big Data Analysis in Smart Cities. IEEE Trans. Ind. Inform. 2017, 13, 2140–2150. [Google Scholar] [CrossRef]
- Jiang, P.; Wang, T.; Han, B.; Gao, X.; Zhang, J.; Wen, C.-K.; Jin, S.; Li, G. Artificial Intelligence-Aided OFDM Receiver: Design and Experimental Results. arXiv 2018, arXiv:1812.06638. [Google Scholar]
- Mohammadpour, A.; Karan, E.; Asadi, S. Artificial Intelligence Techniques to Support Design and Construction. ISARC. Proc. Int. Symp. Autom. Robot. Constr. 2019, 36, 1282–1289. [Google Scholar]
- Saaty, T.L. Decision making with the analytic hierarchy process. Int. J. Serv. Sci. 2008, 1, 83–98. [Google Scholar] [CrossRef]
- Wind, Y.; Saaty, T.L. Marketing applications of the analytic hierarchy process. Manag. Sci. 1980, 26, 641–658. [Google Scholar] [CrossRef]
- Chen, J.-K.; Chen, I.-S. Using a novel conjunctive MCDM approach based on DEMATEL, fuzzy ANP, and TOPSIS as an innovation support system for Taiwanese higher education. Expert Syst. Appl. 2010, 37, 1981–1990. [Google Scholar] [CrossRef]
- Gabus, A.; Fontela, E.; Gabus, S. World Problems, An Invitation to Further Thought Within the Framework of DEMATEL; Battelle Geneva Research Center: Geneva, Switzerland, 1972; Volume 1, pp. 12–14. [Google Scholar]
- Ocampo, L.A.; Himang, C.M.; Kumar, A.; Brezocnik, M. A novel multiple criteria decision-making approach based on fuzzy DEMATEL, fuzzy ANP and fuzzy AHP for mapping collection and distribution centers in reverse logistics. Adv. Prod. Eng. Manag. 2019, 14, 297–322. [Google Scholar] [CrossRef]
- Warfield, J.N. Developing interconnection matrices in structural modeling. IEEE Trans. Syst. Man Cybern. 2010, 1, 81–87. [Google Scholar] [CrossRef]
- Godet, M. From Anticipation to Action: A Handbook of Strategic Prospective; Unesco Publishing: Paris, France, 1994. [Google Scholar]


Disclaimer/Publisher’s Note: The statements, opinions and data contained in all publications are solely those of the individual author(s) and contributor(s) and not of MDPI and/or the editor(s). MDPI and/or the editor(s) disclaim responsibility for any injury to people or property resulting from any ideas, methods, instructions or products referred to in the content. |
© 2025 by the authors. Licensee MDPI, Basel, Switzerland. This article is an open access article distributed under the terms and conditions of the Creative Commons Attribution (CC BY) license (https://creativecommons.org/licenses/by/4.0/).