Abstract
Over the last couple of decades, significant efforts have been made to develop structural health monitoring solutions. The growing need for the dynamic characterization of structures supports the implementation of condition assessments, maintenance, and monitoring strategies for existing and new civil engineering structures, and to provide increased safety for the public. Wireless monitoring systems are still being improved as the technology is finding a wider use for the monitoring of civil engineering structures, thanks to their easier installation and reduced costs when compared to the wired counterparts. In this context, this paper presents a new wireless network system for the dynamic characterization of civil engineering structures, whose distinguishing features comprise combining cutting-edge accelerometers, excellent signal synchronization, low battery consumption nodes, and a cloud-based framework to support the monitoring operations. The performance characteristics are validated through laboratory tests and are demonstrated on a newly constructed 211 m tall building.
1. Introduction
The dynamic characterization of structures has been gaining popularity over the last couple of decades for the condition assessment, maintenance, and structural health monitoring (SHM) of a wide range of structural systems, including strategic infrastructure, buildings, and bridges, with the aim of providing increased safety for the public. The growing adoption of these dynamic techniques has been largely facilitated by recent technological advancements in electronics and information technology, which have enhanced the performance and reliability of sensing and data acquisition systems while simultaneously reducing their costs (e.g., [1,2,3,4,5]). These advancements have also been supported by continued scientific research and funding in this field (e.g., [6]).
Structural dynamic characterization involves the assessment of modal properties, including resonance frequencies, mode shapes, and damping ratios, both during the routine day-to-day operations of a structure (e.g., [7,8,9]) as well as when the structure is exposed to specific environmental conditions, such as earthquakes (e.g., [10,11,12,13]), typhoons (e.g., [14,15]), and slope movements or settlements (e.g., [16,17]). This technique has also proven to be a valuable tool in structural assessment of structures during the construction phase, at the completion of the structure by performing a dynamic proof test, or following significant structural interventions, particularly those related to seismic retrofitting (e.g., [18,19]).
Research in the field of dynamic characterization and monitoring is continuously evolving, with significant advancements in areas such as operational modal analysis methodologies [20], optimal sensor placement strategies [21,22], model updating techniques based on vibration dynamics [23,24], and the integration of artificial intelligence [25] and deep reinforcement learning [26]. These efforts also focused on gaining a deeper understanding of the parameters influencing modal response [27], continuous monitoring [28], and the automation of operational modal analysis [29]. As a result, a range of dynamic characterization and monitoring tools have been developed and refined over the years (e.g., [30,31]). More recently, design specifications have begun to incorporate and codify requirements for the dynamic characterization and monitoring of structures [32]. For instance, Italian guidelines [33] mandate dynamic testing and characterization for newly constructed bridges, while also encouraging (though not mandating) the use of dynamic characterization for all types of structures [34,35]. The sensing and data acquisition technology commonly used for dynamic characterization typically relies on wired systems, as these ensure the synchronization of multiple measured signals, which is essential for effective post-processing of modal responses (e.g., [36,37,38,39]). The deployment of wired systems in real-world structures presents significant challenges in terms of equipment and resource management. This involves careful organization and planning for the handling of long cables, sensors, dataloggers, computers, internet connections, and the repositioning of these components throughout the structure to capture dynamic responses for all the sensing placement scenarios required by the testing plan. In this context, wireless sensing systems have gained increasing popularity due to their ease of deployment and reduced hardware requirements. Wireless systems offer significant advantages over wired systems, including faster instrumentation placement and greater flexibility in sensor positioning. Different from the case of wired systems, the deployment of wireless solutions is not constrained by cable length, routing constraints, or the feasibility of running electrical cables, which are usually dependent on the geometry and layout of the structure (e.g., [2,40,41,42,43,44,45]).
Over the past two decades, the performance of wireless sensors has seen significant improvements. However, some of the technologies developed to date rely on node components (i.e., the individual units within the wireless system that possess both sensing and communication capabilities) that are now considered obsolete and no longer available in stock [46]. Despite this, several wireless systems are still in use, with some referenced in [46,47,48,49,50]. However, most wireless sensors are unable to capture low-level structural vibrations. The highest-performing sensing systems published to date primarily rely on a version of the Epson accelerometer [51] (with noise density of 0.2 µg/√Hz) or its earlier iterations (e.g., [41,46,50]), depicted by their very low noise level and wide frequency range. Furthermore, most recent developments of wireless technology are based on a wide range of sensors with different performance characteristics [52,53,54,55,56,57]. For example, some of the accelerometers considered include the MPU-6050 sensor [52] with a noise performance density expressed by 400 µg/√Hz [58], the TDK IIM-42351 sensor [53] with a 70 µg/√Hz noise density [59], and the ADXL354/ADXL355 sensors [56,57] with a 22.5 µg/√Hz noise density [60].
Wireless sensors have found widespread application in the monitoring of civil engineering structures, including stadiums [61], bridges [62,63,64], wind turbines [65], metro stations [66], retractable roofs [67], and high-rise buildings [68,69,70]. One of the primary challenges associated with wireless sensors for structural health monitoring (SHM) is their limited battery life, which necessitates strategies to minimize energy consumption. To address this, techniques such as event-triggered and scheduled-based acquisition approaches have been implemented (e.g., [71,72]), with careful attention paid to ensuring system fidelity to prevent data loss (e.g., [73,74]).
Ongoing research efforts are focused on enhancing the efficiency and functionality of wireless systems [75,76,77,78,79,80,81]. For instance, edge computing capabilities are being explored to support operations during sensing, data acquisition, and post-processing [82,83]. Additionally, advancements in time synchronization techniques [84,85], real-time data acquisition [86], decentralized data processing [87], cloud computing [88], and long-term reliability of wireless smart networks [89] are all areas of active development.
The main contribution of this paper relies on the introduction of a novel wireless monitoring system aimed at the dynamic monitoring of civil engineering structures, whose particularity is to combine cutting-edge accelerometers, excellent signal synchronization, low battery consumption nodes, and a cloud-based framework to support monitoring operations. In particular, the sensing technology is implemented by means of the Epson M-A352AD accelerometer [51], which offers low noise (0.2 µg/√Hz), high sensitivity, an exceptionally low minimum measurable frequency, and no saturation when exposed to high accelerations—issues commonly faced by traditional low-noise wired sensors. The firmware implementation has been conceived to minimize the energy consumption of the sensors’ nodes for a possible extended duration of autonomous structural monitoring. Another important feature of the proposed technology relies on excellent signal synchronization, required for effective dynamic characterization of structures. The effectiveness of the technology is validated through structural monitoring tests conducted in both a laboratory setting and on a case study that is formed by a tall building.
In the first part of the paper, the proposed technology is presented by describing its key components and functionalities. This is followed by a series of tests performed in the laboratory environment on a simple structural component to demonstrate the ease of use and to validate the performance of the proposed wireless network, including its ability to provide the excellent synchronization required for effective dynamic characterizations. The final part of the paper describes the dynamic characterization of a newly constructed 211 m tall 67-story building located in Parramatta, Australia. In all tests, the performance of the proposed wireless solution is validated by measurements collected with low-noise wired accelerometers that are widely used for the dynamic characterization of structures.
2. Proposed Wireless Sensor Network (WSN) Architecture Supporting Wireless MEMS Accelerometers
2.1. Overview of Key Characteristics
The proposed technology is articulated within a wireless sensor network (WSN) in which nodes and gateways provide the required connectivity to the cloud to communicate with accelerometers and transfer their recorded measurement data. A diagram of the articulated framework is illustrated in Figure 1, and it highlights the multi-cluster nature of the proposed approach in which each cluster, also denoted in the following as a measurement cluster, is formed by a gateway and one or more nodes. Each cluster is arranged in a star network where each gateway is connected to its nodes through a specified radio range. The key features of the node and gateway are now briefly introduced.
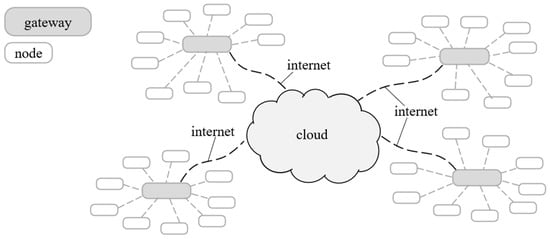
Figure 1.
Diagram of the proposed WSN formed by nodes, gateways, and the cloud.
The individual node (Figure 2) is managed by a microcontroller unit (MCU) that controls the digital accelerometer, a radio transceiver to communicate with the gateway, a flash memory, and a battery. The accelerometer is the Epson M-A352AD [51] that is well-suited for SHM applications and whose characteristics are summarised in Table 1. The main advantages of this sensor are that it possesses low noise and high sensitivity, extremely low minimum measurable frequency, and no saturation issues when subjected to very high accelerations (this aspect is typically a problem with low-noise wired sensors). The firmware loaded into the MCU has been developed to minimize the power consumption of all peripherals. An overview of the gateway is presented in Figure 3, which highlights the dependency of the proposed wireless system on accessing the GNSS signal. For this purpose, the proposed wireless architecture is not applicable to underground infrastructure in which the gateways cannot access the GNSS.

Figure 2.
Diagram of the setup of an individual node [51,90].

Table 1.
Characteristics of the adopted accelerometer Epson M-A352AD [51].

Figure 3.
Diagram of the setup of an individual gateway [90].
2.2. WSN Communication
The proposed technology relies on a proprietary, ultra-low power, LoRa-based Radio ISM protocol that supports the low energy consumption of the nodes and supports the communication between the gateways and nodes. With this approach and by using low self-discharge batteries, it is possible to have nodes running without the need for human intervention for long periods of time, even several years, depending on the types and numbers of batteries specified. For the purpose of this study, six primary D cell LiSoCl2 3.6 V 20 Ah batteries have been considered in each node with an ultra-low quiescent current DC-DC converter transforming the series batteries’ voltage of 7.2 V to the 3.3 V needed by the node’s electronics.
The energy consumption at the node is minimized by ensuring that the node is fully powered only during periods of acquisitions of the accelerations or during the processing of radio commands and data transfer. During the remaining times, the node is set to remain in a sleeping mode to maintain a low power consumption. In this low-power state, the LoRa receiver at the node is switched on (RX-ON) for 10 ms every 450 ms to verify whether and when the gateway, through its LoRa concentrator, issues a request to fully power the node. In the remaining 440 ms, the LoRa receiver is kept off (RX-OFF) with a low energy consumption. In particular, when a gateway needs to switch one or more nodes within its cluster from the sleeping mode to a fully powered mode, its LoRa concentrator sends a LoRa packet to the node/s with a long preamble of 450 ms duration. Figure 4 highlights that, with the adopted preamble duration (see top row in the figure for time durations), the node is able to detect the packet (captured when the preamble detection is true) and to keep its LoRa receiver on to receive the entire LoRa packet that includes also the header and payload components.
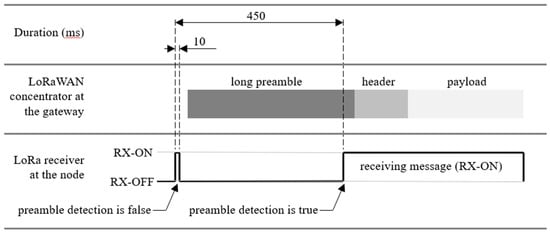
Figure 4.
Diagram highlighting the communication protocol to switch the node from sleeping mode to fully powered mode.
Average node power absorption per hour measured with the power profiler PPK2 from Nordic semiconductor, measured at the output of the series cells (at 7.2 V), is 1.7 mW in sleeping mode, 223.2 mW during acquisition, and 1267.2 mW during data transfer, respectively. The power measurements have been carried out under normal ambient conditions. The higher absorption exhibited during the acquisition is produced by the memorization of the accelerometer’s output on the internal flash memory, in which every sample is formed by 16 bytes, i.e., 4 bytes for the acceleration in each of the X, Y, and Z directions, 2 bytes for a counter, 1 byte for recording header and 1 byte for the recording footer. An example is now considered to highlight the use of the proposed sensors for the long-term monitoring of a structure by performing, on average, an acquisition of 1 h every week. Such a scenario is suitable, for example, for a structure that has undergone an initial thorough dynamic characterization and for which variations of its dynamic response are sought over time. The acquisition at 100 Hz for 1 h generates a 5.49 MB file and consumes 223.2 mWh. Once the acquisition is complete, the node enters sleep mode until either a new acquisition begins or a request to transfer the recorded data is received. If a data transfer is requested, the node transmits the measured data files at a speed of about 24 kB/sec. Transmitting the 5.49 MB file previously considered is expected to take about 4 min and to consume about 84.48 mWh. Therefore, the total energy consumed by the node during a 1 h acquisition (recording three accelerations simultaneously) and the subsequent transmission of the recorded data is 307.68 mWh.
In a site monitoring scenario, the node is expected to perform without the need for any battery maintenance for about 12.5 years, with a scheduled acquisition of 1 h every week, and is based on the six D cell LiSoCl2 3.6 V 20 Ah batteries previously introduced. This consumption also accounts for the energy consumed during the sleeping periods of the sensor and for a 90% energy efficiency of the batteries.
In the proposed architecture, the LoRa concentrator is regarded as an energy-consuming device as it needs to transmit long preambles when required to wake up one or more sleeping nodes. In particular, the concentrator module operates in two states: RX-ON (reception mode) when it receives messages from the nodes and in TX-ON (transmission mode) when it sends messages to the nodes.
2.3. Synchronization of the Acceleration Measurements
The proposed wireless technology has been developed for dynamic characterizations and SHM applications of buildings and infrastructure. In this context, the measured accelerations need to be synchronized to accomplish the required dynamic characterization, for example, by means of operational model analysis (OMA) analyses, e.g., [32,33,34,35].
With the proposed approach, the sensor network and acquisition are controlled and managed by a remote cloud platform. The latter provides the users with a web graphical user interface (GUI) to specify different tasks, including the setup of the wireless sensor network, the acquisition schedules, the acquisition controls, the management of the data measured by each node, and the alignment of the data recorded by the nodes of all measurement clusters.
Once the acquisition is requested to start through the online GUI, the gateways are contacted over the internet to start the recording within each measurement cluster. This is performed by each gateway by broadcasting a radio message to its cluster’s nodes to switch from the sleeping mode to the fully powered status and to start the measurements and recording of the accelerations to their flash memory. After the recording starts, the gateway sends periodic broadcasting messages, i.e., beacon messages, that contain the timestamp of the embedded PC synchronized to the GNSS receiver to support the synchronization for the entire acquisition period. Upon reception of a beacon message, the node records the timestamp present in it together with the number of measurement bytes acquired from the beginning of the acquisition and the time elapsed from the last acquired measurement data byte. This information is collected to enable the alignment of all acquired accelerations. The time clocks of the gateways are kept synchronized using the pulse-per-second service provided by their GNSS receivers.
3. Validation Tests Carried out in a Laboratory Environment
3.1. Description of Validation Tests
The ease of use and the performance characteristics of the proposed wireless technology have been validated through laboratory experiments carried out for the dynamic characterization of the simply supported reinforced concrete beam depicted in Figure 5a. In particular, the beam has a length of 6 m and a rectangular cross-section with a width and height of 280 mm and 165 mm, respectively. The end supports consist of roller supports placed at 150 mm from the beam ends, as shown in Figure 5b.
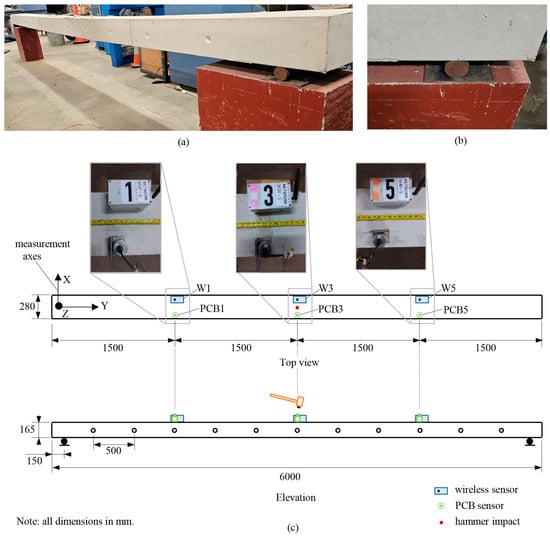
Figure 5.
Overview of the validation tests performed in the laboratory environment: (a) Reinforced concrete beam sample, (b) roller support, and (c) arrangement of the sensors and impact hammer location.
Two typologies of validation tests have been considered and performed in this study for the dynamic characterization of the beam. These consist of (i) an impact load test (ILTs), in which a hammer is used to excite the beam, and (ii) an ambient vibration test (AVT) that relies on the environmental noise present at the beam location. In both test typologies, particular attention has been placed on the validation of the synchronization of the proposed wireless technology by using a wired and very low-noise solution for benchmarking purposes.
The wired accelerometers used for the validation consist of the monoaxial piezoelectric accelerometers PCB model 393B31 (that possess a high sensitivity of 10 V/g, frequency range (±5%) of 0.1–200 Hz, and spectral noise of 0.06 µg/√Hz (for 1 Hz) and 0.01 µg/√Hz (for 10 Hz)) [91] connected by coaxial cables to a three-channel dynamic signal acquisition module NI-9230 mounted on a USB chassis NI cDAQ9178.
The instrumentation layout is presented in Figure 5c and highlights how the wireless and wired sensors have been placed at the quarter points along the beam length on the two sides of the cross-section. With this arrangement, the wired (monoaxial) accelerometers measure the vertical dynamic response (in the Z direction) while the wireless (triaxial) accelerometers capture the dynamic behavior in the vertical, horizontal, and longitudinal directions of the beam (in the X, Y, and Z directions). For ease of reference, the wired sensors located at the three-quarter points are denoted as PCB1, PCB3, and PCB5, respectively. The wireless sensors placed at the same locations are referred to as W1, W3, and W5, respectively. The directions of the measurement axes, i.e., X, Y, and Z, are also specified in Figure 5c. The three wireless accelerometers are connected to three different gateways to test the worst scenario for the synchronization of the measured signals by the proposed system. The acquisition rate specified in the laboratory tests is 100 Hz for the wireless system and 1024 Hz for the wired PCB system.
3.2. Impact Load Tests (ILTs)
The impact load tests (ILTs) have been carried out several times to confirm the repeatability of the dynamic characterization. A hammer is used to excite the beam during the ILTs at its mid-span, and the resulting oscillations are recorded until they are fully damped. Throughout this process, care is taken to control the impact force applied by the hammer to avoid exceeding the measurement threshold of the wired PCB sensors. The ILTs were performed multiple times to ensure the repeatability of the dynamic characterization.
The representative results are presented in Figure 6. The comparison between measurements recorded over time with the wired and wireless sensors allows an evaluation of the level of synchronization, also reported in Figure 6. This assessment is carried out by comparing the shifts between the signals (considered in the time domain) between the signals recorded with the same sensing technology. As expected, the amplitudes vary as they are also a function of the sensors’ locations. These comparisons have been carried out by considering the vertical accelerations (i.e., in the Z direction specified in Figure 5c) because the wired sensors have only been placed to detect the vertical oscillations. The time history enlargements show a very good synchronization of the vertical acceleration signals recorded by the three wireless sensors (i.e., sensors W1, W3, and W5), with a maximum time shift of about 10−5 s that is not visually perceptible in the figure. The latter is very low and is usually regarded as acceptable for the dynamic identification of civil structures.
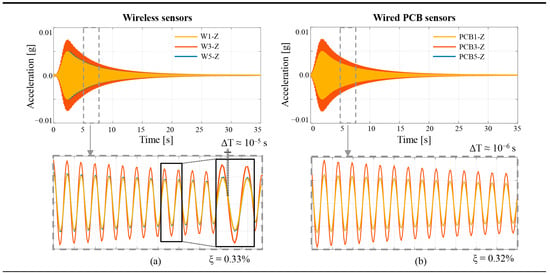
Figure 6.
Vertical acceleration time histories recorded with the wireless and wired PCB sensors during the ILTs: (a) Wireless sensors and (b) wired PCB sensors.
By analyzing the decreasing part of the acceleration signals, it is also possible to estimate the structural damping, calculated here with the well-known logarithmic decrement method as:
where ui is the amplitude of the acceleration at the i-th cycle. The damping ratios estimated based on the signals recorded with the wireless and wired sensors are nearly identical, i.e., 0.33% evaluated with the wireless sensors vs. 0.32% with the wired PCB sensors.
3.3. Ambient Vibration Tests (AVTs)
The ambient vibration tests (AVTs) measure the accelerations induced on the beam sample by the ambient noise that, in this case, is mainly due to microtremors occurring due to earth tremors and anthropic activities around (or within) the laboratory. This test has been included in this study to explore the performance of the proposed wireless technology when exposed to low (ambient) accelerations. For this purpose, attention has been placed on performing the laboratory dynamic tests on a quiet day to minimize the excitations induced by other laboratory activities. Different dynamic histories have been recorded with a duration of 10 min, and representative results of the measurements obtained from both wireless and wired systems are plotted in Figure 7.
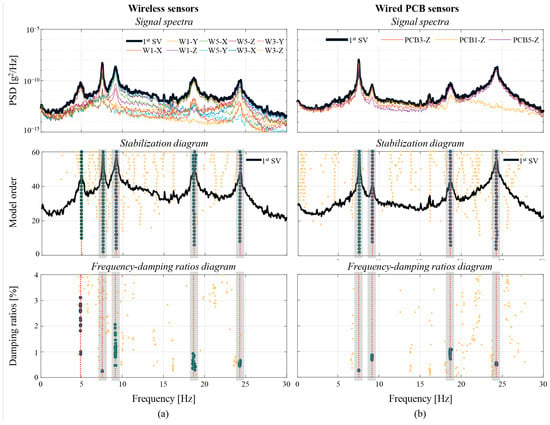
Figure 7.
Results of the modal identification SSI-COV method from the AVTs: (a) Wireless sensors and (b) wired PCB sensors.
The accelerations recorded during the AVTs are used to identify the modal parameters, i.e., natural frequencies, mode shapes, and damping ratios, that characterize the dynamic behavior of the specimen. Modal identification is performed by using the operational modal analysis (OMA), which consists of an output-only identification technique used when only the output (acceleration) is measured. In this type of test, the input is not measured, and it is assumed to possess a flat spectrum that excites all modes in the same manner within the frequency range of interest. In particular, the modal parameters of the beam are identified by adopting the Covariance-driven Stochastic Subspace Identification (SSI-COV) output-only technique. First, the Power Spectral Densities (PSDs) of all the recordings are calculated, together with the first singular value (SV), and these are plotted on the top graphs of Figure 7. The identification with the SSI-COV method is then performed based on the stabilization diagram (shown on the second row of graphs in Figure 7). In these diagrams, the yellow circles represent the solution of the dynamic system, increasing the model order, and a stable mode is identified when these dots are vertically aligned. The selection of these stable modes is performed with the support of a hierarchical cluster that groups solutions with similar modal parameters. With this approach, the selected modes are those represented by dark gray circles. Among these, those placed behind the light gray shadow are those that contain vertical oscillation components and, because of this, have been able to be detected also by the wired PCB system (reading only vertical vibrations; i.e., those in the Z direction).
The first four stable modes clearly identified by both the wireless and wired sensors are depicted in Figure 7 (as shaded in light gray for ease of reference). In particular, the mode characterized by the highest peak of the spectrum (f = 7.56 Hz) corresponds to the canonical 1st mode of a simply supported beam, while the second canonical mode is that at f = 24.25 Hz. The two middle modes (i.e., f = 9.16 Hz and f = 18.68 Hz) are two transverse modes containing flexural and torsional components. As the latter are very low with respect to the transverse components, comparisons between the wireless and wired PCB systems here are focused on the flexural modes mentioned above.
The first mode captured by the wireless system does not contain any vertical component oscillations (i.e., in the Z direction) and cannot be compared to the data collected with the wired PCB system (only recording oscillations in the Z direction). This mode occurs at f = 4.92 Hz, and it represents an almost pure longitudinal mode.
The bottom row of Figure 7 presents the frequency-damping ratio graphs, and as occurred for the stabilization diagrams, the dark gray circles denote the damping ratios of each selected mode. The damping distributions obtained from both identifications (wireless and wired systems) are very similar, with a slightly greater dispersion, even if not significant, of calculated values for modes 1 and 3 obtained from the measurements with the wireless sensors.
Figure 8 collects all the modal parameters (including mode shapes) of the two canonical modes of the simply supported beam, i.e., the modes governed by the flexural oscillations. The mode shape of the 1st canonical mode is characterized by a single concavity with null vertical displacements at the end supports and with the maximum value in correspondence of the mid-span. The 2nd canonical mode shape has two concavities, with null vertical displacements at the supports and in the mid-span, while reaching maximum values along the beam length at about L/4 and 3L/4. The comparisons between the frequencies identified from the wireless and wired sensors show a perfect match, as outlined in Table 2, and very similar considerations can also be provided for the values of the damping ratios.

Figure 8.
Mode shapes obtained from OMA for measurements obtained with the wireless and wired PCB sensors: (a) Mode shape at 7.56 Hz and (b) mode shape at about 24.2 Hz.

Table 2.
Comparison between the modal properties of the laboratory specimen identified starting from wireless and wired PCB sensors using the SSI-COV method.
The qualitative comparisons between mode shapes, previously presented graphically in Figure 8, are now reconsidered quantitatively by means of the Modal Assurance Criterion (MAC) index. This index depicts the similarities (or orthogonality) that exist between two mode shapes, i.e., the closer the MAC index is to 1, the higher the resemblance of the two mode shapes. The comparison shows an almost perfect match between mode shapes identified from both wireless and wired sensors, which reflects the excellent synchronization of the signals recorded by wireless sensors.
The measurements recorded with the wireless and wired sensors were also compared with the enhanced frequency domain decomposition (EFDD) method, as shown in Table 3. These results confirmed the adequacy of using the wireless sensors in the dynamic characterization of the laboratory reinforced concrete beam sample.

Table 3.
Comparison between the modal properties of the laboratory specimen identified starting from wireless and wired PCB sensors using the EFDD method.
4. Validation Tests Carried out on a Tall Building
4.1. Overview of the Selected Case Study
The proposed wireless technology is suitable for deployment in civil engineering structures, and because of this, it is important to verify its performance in a real structural system. For the purpose of this study, a newly constructed 67-story building in Parramatta, Australia, has been considered and whose location is representative of a typical urban scenario of a typical Australian city. The ambient conditions present during the validation tests are representative of days in which no extreme weather conditions were present. An overview of the building is shown in Figure 9a, and a typical floor layout is presented in Figure 9b.
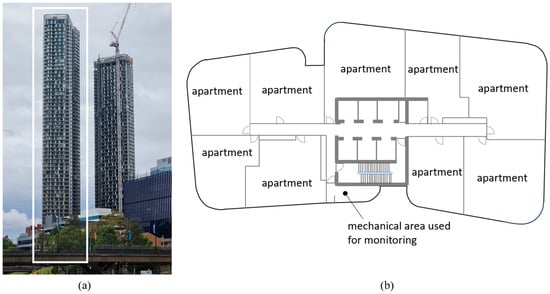
Figure 9.
Tall building in Parramatta, Australia: (a) Overview of the building, (b) typical floor layout, and area used for the monitoring carried out in this study.
4.2. Test Series 1: Ambient Vibration Tests (AVTs) T1 and T2
As carried out in the laboratory validation tests, the key focus of the work is to validate the dynamic characterisation obtained from the wireless technology against the measurements and identification achieved with the wired PCB model 393B31 sensors [91] by placing particular attention on the synchronization performance between the two sensing systems. The validation process involved seven ambient vibration tests (AVTs), organized into two test series as outlined in Table 4. The first series, Test Series 1, is focused on directly comparing measurements obtained with the wireless and wired PCB sensors. In this series, the sensors are placed on the same floor level of the building—on floor 57 for test T1 and on floor 42 for test T2. The second series, Test Series 2, is designed to characterize the dynamic modal properties of the building using data recorded by the wireless system. This series includes five additional tests, labeled T3 through T7.

Table 4.
Measurement configurations and acquisition parameters used for the AVTs.
The arrangement of the sensors for tests T1 and T2 is illustrated in Figure 10. An overview of a typical sensor’s placement is shown in Figure 11. In particular, three wired PCB 393B31 sensors are specified to capture the oscillations in the plane of the floor in the two orthogonal directions at point A (also denoted as PCB-AX and PCB-AY in Figure 10a) and in the direction perpendicular to the building envelope at point B (referred to as PCB-BX in Figure 10a). This sensor’s arrangement can well capture the in-plane modal displacements of the floor under the assumption of floor in-plane non-deformability, acceptable for the building under consideration. Under these conditions, the three modal displacements per floor, i.e., the two translational and orthogonal at A (PCB-AX and PCB-AY) as well as the translational one at B (PCB-BX), to capture the possible twisting component of the oscillation, are sufficient to reconstruct the in-plane modal rigid displacements of the floor. The vertical modal displacements of floors are assumed to be negligible with respect to the horizontal and torsional ones.
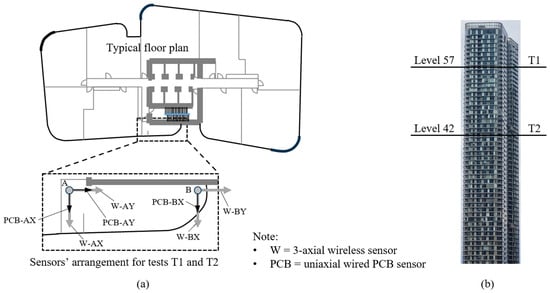
Figure 10.
Arrangement of sensors for Test Series 1: (a) Location of sensors within the floor and (b) identification of tested floors.
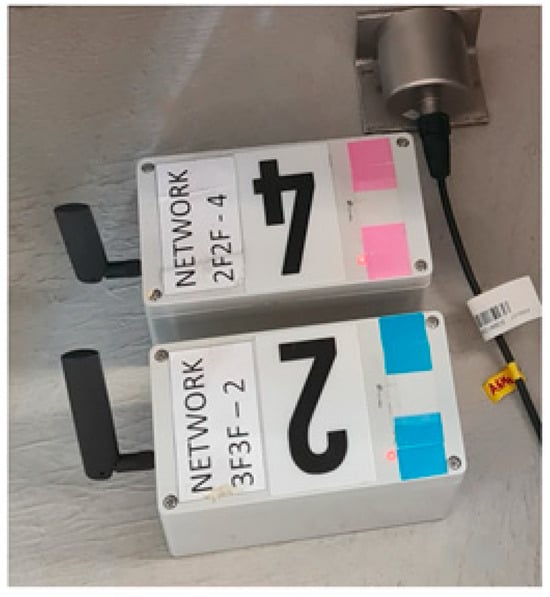
Figure 11.
Overview of the actual sensors’ placement in the building at one of the testing locations.
Two wireless (triaxial) sensors are placed next to the wired PCB sensors; i.e., one at A (measuring the oscillations along W-AX and W-AY, as depicted in Figure 10a) and one at B (measuring the oscillations along W-BX and W-BY, as shown in Figure 10a, even if only W-BX is required for the comparison against the wired PCB system). The two wireless sensors have been connected to two different gateways to test the entire proposed system. Each AVT is performed by adopting a frequency sampling of 100 Hz for the wireless system and 1024 Hz for the wired PCB system, as reported in Table 4.
Tests T1 and T2 have been carried out at floors 57 and 42, respectively, as highlighted in Figure 10b. The two floor levels are selected because the floor levels affect the magnitude of the accelerations to be recorded, i.e., accelerations at level 42 are expected to be lower than those measured at level 57. For representative purposes, the results of test T2 (being at a lower level and with a lower acceleration magnitude than those of test T1) are reported in Figure 12 by showing the graphs of the PSD of the acceleration signals as well as the first singular value (SV). The amplitudes and the definitions of the peaks in the two graphs in the top row of Figure 12 for the wireless and wired PCB sensors are very similar, demonstrating a good signal-to-noise ratio in both cases that enabled a clear identification of the spectra peaks. In the SSI-COV modal identification, the stabilization diagrams obtained from both sensors (plotted in the graphs in the second row of Figure 12) show the same dot columns in correspondence with the same peaks, demonstrating that the wireless sensors identify the same modes depicted by the wired PCB sensors. The same considerations are applicable to the frequency-damping graphs (graphs in the bottom row of Figure 12), where it is possible to note that for some modes (especially the 2nd and the 6th modes), the dispersion in damping estimation is even greater for the wired sensors’ measurements.
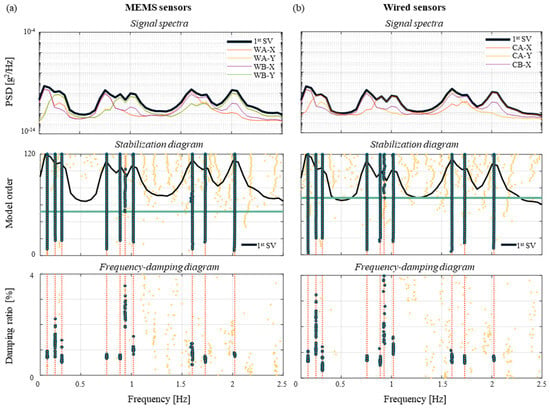
Figure 12.
Results of the modal identification for test T2: (a) Wireless sensors and (b) wired PCB sensors.
The identified modal parameters obtained from the measurements of tests T1 and T2 are summarized in Table 5, highlighting the values identified by using both wireless and wired PCB sensors. For the top 10 global vibration modes considered here, the comparisons are presented in terms of differences in frequencies (f), mode shapes (MAC), and by considering the Modal Complexity Factor (MCF) as an indicator of the complexity of the measurements. The MCF provides an indication of the synchronization of the measurements achieved by the sensors: the higher the MCF, the worse the sensor synchronization. Very good agreement is observed for the comparisons of the measurements recorded with the wireless and wired PCB sensors in test T2 (at level 42). Very similar considerations are applicable to the analysis and results for test T1 (at level 57). The MCF calculated by considering the wireless sensor measurements is very low and very similar to those calculated for the wired PCB system. Only for a few higher modes (e.g., sixth mode), the calculated MCF value appears to be slightly larger, and this occurs for both wireless and wired PCB acquisitions.

Table 5.
Frequency and damping ratios obtained from the modal analysis performed on the measurements recorded with the wireless and wired PCB sensors.
4.3. Test Series 2: Ambient Vibration Tests (AVTs) T2 Through to T7
Test Series 2 is carried out to determine the modal characterization of the building. For this purpose, dynamic measurements are performed over six floors distributed along the height of the building, as depicted in Figure 13b. The selection of the number of floors has been carried out with the idea of obtaining reasonably refined mode shapes. In particular, the six AVTs included in Test Series 2 (which consists of test T2 through to test T7, as shown in Table 4) involve the dynamic testing of two floors at the same time based on the proposed wireless technology. For each test, a reference wireless sensor is maintained at level 42 at location point A, while the two other wireless sensors are moved through different levels of the building at location points A and B, as detailed in Figure 13. The use of the reference sensor is required to support the reconstruction of the global mode shapes based on non-contemporary measurement data. For the modal characterization of the entire building, the results of the wireless sensors obtained during test T2 are combined and post-processed with those obtained during tests T3–T7 that involve the use of only wireless sensors (Table 4).
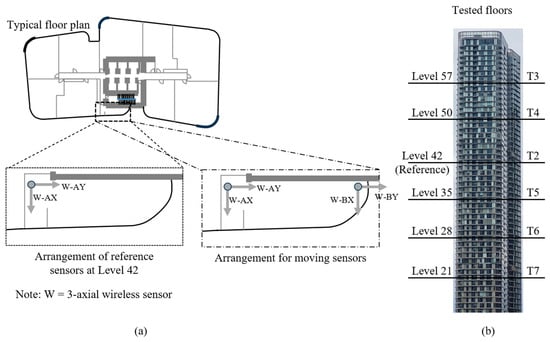
Figure 13.
Arrangement of sensors for Test Series 2: (a) Location of sensors within the floor and (b) identification of tested floors.
In this case, the three wireless sensors, i.e., one sensor at the reference level and the two sensors moving through different floors, have been connected to three different gateways to create the worst scenario to be tested for the proposed wireless technology.
The acceleration time histories are post-processed with the SSI-COV identification method. For each AVT, resonance frequencies, mode shapes, and damping ratios related to each measured floor are obtained and then combined to obtain the global modal parameters of the structure. In particular, the frequencies and damping ratios of the 10 identified modes are calculated as the average of those identified for each test, and the results are listed in Table 6. The 10 modes have frequencies included within the small range 0.17–2.02 Hz that denotes the presence of very close-spaced modes. To have an indication about the variability of results obtained from the six different AVTs (i.e., tests T2-T7), the standard deviations are calculated for the frequencies () and damping ratios (), as shown in Table 6. The two standard deviations, i.e., and , remain very small in all instances (within about 1%). The global mode shapes are obtained by scaling the modal displacements exhibited for each measured floor with respect to the modal displacements determined from the reference sensor located at level 42 based on the PoSER technique.

Table 6.
Frequency and damping ratios obtained from Test Series 2.
The Modal Assurance Criterion (MAC) calculated among all identified modes, denoted as AutoMAC, is reported in graphical form in the AutoMAC matrix of Figure 14. This index provides an indication of the decoupling between two modes at the time and how close their identified modes are to each other. For illustrative purposes, the ten global mode shapes identified are plotted in Figure 15.
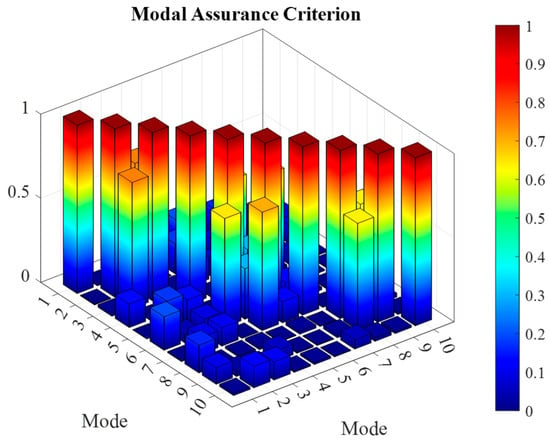
Figure 14.
AutoMAC matrix obtained considering the mode shapes identified during Test Series 2.
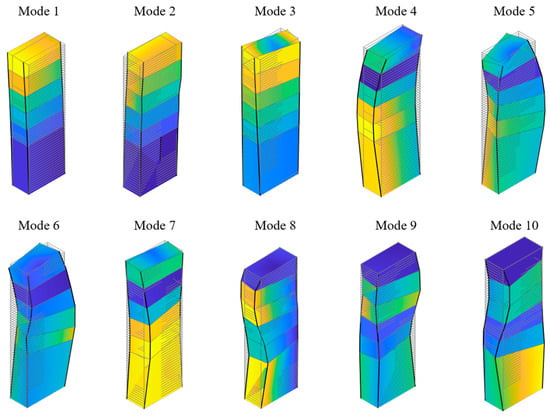
Figure 15.
First ten identified mode shapes obtained from Test Series 2 (Note: displacements are exaggerated for clarity).
5. Conclusions
This paper introduces a new wireless network system that is designed for the dynamic characterization of civil engineering structures. The key features of the proposed technology rely on the combination of cutting-edge accelerometers, excellent signal synchronization, low battery consumption nodes, and a cloud-based framework to support the monitoring operations. The proposed technology requires access to the GNSS signal for synchronization and, as such, is not applicable for deployment in areas in which this signal is not available, such as in underground structures.
This paper begins with a detailed description of the technology, followed by two sets of validation tests: One conducted in a laboratory environment and the other on a tall building, both aimed at evaluating the key performance characteristics of the system.
In the laboratory validation, tests were conducted on a simply supported reinforced concrete beam using two types of dynamic excitation: One that was generated by an impact hammer and another that was based on ambient vibrations. The latter test was performed during a quiet laboratory day to avoid the excitations coming from typical laboratory activities.
The validation process involved comparing the dynamic measurements obtained with the proposed wireless sensors to those recorded by wired monoaxial piezoelectric accelerometers (PCB model 393B31). These wired sensors have high sensitivity (10 V/g), a frequency range of 0.1–200 Hz, and low spectral noise (0.06 µg/√Hz at 1 Hz and 0.01 µg/√Hz at 10 Hz) [91]. Across all tests, the wireless system produced results comparable to those from the wired sensors, further confirming the excellent synchronization of the wireless technology that is required when performing dynamic structural characterizations.
For real-world validation, tests were conducted on a newly constructed 67-story building (with a height of 211 m) in Parramatta, Australia. Two test series were carried out, and these demonstrated how the wireless system was able to provide measurements equivalent to those collected with the wired PCB system, as well as demonstrating its excellent synchronization. The second test series aimed at the dynamic characterization of numerous modes of the building together with its frequencies and damping ratios. The results of this test series highlighted the ability of the proposed wireless technology to successfully perform the dynamic characterization of the building.
In all validation tests, i.e., in the laboratory and on the tall building, each wireless sensor was connected to a separate gateway to create the worst scenario to be tested for the proposed technology. Overall, it has been demonstrated that the proposed wireless technology is suitable for deployment in real civil engineering structures for their dynamic characterization.
Author Contributions
Conceptualization, F.G., A.C., R.D.D., F.S. and G.R.; data curation, F.G., A.C., R.D.D., F.S. and G.R.; formal analysis, F.G., A.C., R.D.D., F.S. and G.R.; methodology, F.G., A.C., R.D.D., F.S. and G.R.; resources, F.G., A.C., R.D.D., F.S. and G.R.; software, F.G., A.C., R.D.D., F.S. and G.R.; supervision, F.G. and G.R.; validation, F.G. and G.R.; visualization, F.G. and G.R.; writing—original draft preparation, F.G., A.C., R.D.D., F.S. and G.R.; writing—review and editing, F.G., A.C., R.D.D., F.S. and G.R. All authors have read and agreed to the published version of the manuscript.
Funding
This research received no external funding.
Data Availability Statement
The datasets presented in this article are not available due to privacy and ethical restrictions.
Acknowledgments
The authors would like to acknowledge the kind contributions provided by Meriton Group in supporting the project and in giving access to the building case study in Parramatta.
Conflicts of Interest
The authors declare no conflicts of interest.
References
- Wang, G.; Ke, J. Literature Review on the Structural Health Monitoring (SHM) of Sustainable Civil Infrastructure: An Analysis of Influencing Factors in the Implementation. Buildings 2024, 14, 402. [Google Scholar] [CrossRef]
- Sabato, A.; Niezrecki, C.; Fortino, G. Wireless MEMS-based accelerometer sensor boards for structural vibration monitoring: A review. IEEE Sens. J. 2017, 17, 226–235. [Google Scholar] [CrossRef]
- Abdulkarem, M.; Samsudin, K.; Fokhani, F.Z.; Rasid, M.F.A. Wireless sensor network for structural health monitorting: A contemporary review of technologies, challenges and future direction. Struct. EHalth Monit. 2020, 19, 693–735. [Google Scholar] [CrossRef]
- Mishra, M.; Lourenco, P.B.; Ramana, G.V. Structural health monitoring of civil engineering structures by using the internet of things: A review. J. Build. Eng. 2022, 48, 103954. [Google Scholar] [CrossRef]
- Laflamme, S.; Ubertini, F.; Di Matteo, A.; Pirrotta, A.; Perry, M.; Fu, Y.; Li, J.; Wang, H.; Hoang, T.; Glisic, B.; et al. Roadmap on measurement technologies for next generation structural health monitoring systems. Meas. Sci. Technol. 2023, 34, 093001. [Google Scholar] [CrossRef]
- Hoff, I.; Alovisi, I.; Vliet, A.B.-V.; Darò, P.; Fliegel, F.; Koler, J.; Liljefors, F.; Cuerva Navas, S.; Scibilia, E.; Straus, A.; et al. Analyses of barriers, trends and best practices for better monitoring and maintenance of European transport infrastructure. Transp. Res. Procedia 2023, 72, 343–350. [Google Scholar] [CrossRef]
- Ruggieri, S.; Bruno, G.; Attolico, A.; Uva, G. Assessing the dredging vibrational effects on surrounding structures: The case of port nourishment in Bari. J. Build. Eng. 2024, 96, 110385. [Google Scholar] [CrossRef]
- Garcia-Macias, E.; Ubertini, F. Automated operational modal analysis and ambient noise deconvolution interferometry for the full structural identification of historic towers: A case study of the Sciri Tower in Perugia, Italy. Eng. Struct. 2020, 215, 110615. [Google Scholar] [CrossRef]
- Fu, S.; Wu, J.; Zhang, Q.; Xie, B. Automated identification and long-term tracking of modal parameters for a super high-rise building. J. Build. Eng. 2024, 95, 110141. [Google Scholar] [CrossRef]
- Pentaris, F.P.; Stonham, J.; Makris, J.P. A cost effective wireless structural health monitoring network for buildings in earthquake zones. Smart Mater. Struct. 2014, 23, 105010. [Google Scholar] [CrossRef]
- Giordano, P.F.; Iacovino, C.; Quqa, S.; Limongelli, M.P. The value of seismic structural health monitoring for post=earthquale building evacuation. Bull. Go Earthq. Eng. 2022, 20, 4367–4393. [Google Scholar]
- Lorenzoni, F.; Caldon, M.; da Port Francesca Modena, C.; Aoki, C. Post-earthquake controls and damage detection through structural health monitoring: Applications in L’Aquila. J. Civ. Struct. Health Monit. 2018, 8, 217–236. [Google Scholar] [CrossRef]
- Zhou, J.; Li, H.-W.; Wang, Y.-W.; Ni, Y.-Q. Comparative study of earthquake effects on the Canton Tower based on full-scale measurements. J. Build. Eng. 2024, 96, 110430. [Google Scholar] [CrossRef]
- Zhou, K.; Duan, M.-G.; Wu, Z.-L.; Zhi, L.-H.; Hu, F. Dynamic behavior monitoring of twin supertall buildings during Super Typhoon Soksuri using social sensing data. J. Build. Eng. 2024, 95, 110119. [Google Scholar] [CrossRef]
- Wang, Y.-W.; Ni, Y.-Q. Full-scale monitoring of wind effects on a supertall structure during six tropical cyclones. J. Build. Eng. 2022, 45, 103507. [Google Scholar] [CrossRef]
- Yi, Z.; Jinshen, G.; Xu, W. Intelligent settlement monitoring system of high-speed railway bridge. J. Civ. Struct. Health Monit. 2019, 9, 307–323. [Google Scholar] [CrossRef]
- Machelski, C.; Hildebrand, M. Efficiency of monitoring stem of cable-stayed bridge for investigation of live loads and pier settlements. J. Civ. Struct. Health Monit. 2015, 5, 1–9. [Google Scholar] [CrossRef]
- Nicoletti, V.; Arezzo, D.; Carbonari, S.; Gara, F. Dynamic monitoring of buildings as a diagnostic tool during construction phases. J. Build. Eng. 2022, 46, 103764. [Google Scholar] [CrossRef]
- Carbonari, S.; Nicoletti, V.; Martini, R.; Gara, F. Dynamics of bridges during proof load tests and determination of mass-normalized mode shapes from OMA. Eng. Struct. 2024, 310, 118111. [Google Scholar] [CrossRef]
- Liu, W.; Yang, N.; Bai, F.; Law, S.-S.; Abruzzese, D. An improved automated framework for operational modal analysis with multi-stage clustering and modal quality evaluation. Mech. Syst. Signal Process. 2024, 212, 111235. [Google Scholar] [CrossRef]
- Nicoletti, V.; Quarchioni, S.; Amico, L.; Gara, F. Assessment of different optimal sensor placement methods for dynamic monitoring of civil structures and infrastructures. Struct. Infrastruct. Eng. 2024. [Google Scholar] [CrossRef]
- Zhou, G.-D.; Yi, T.-H.; Xie, M.-X.; Li, H.-N.; Xu, J.-H. Optimal wireless sensor placement in structural health monitoring emphasizing information effectiveness and network performance. J. Aerosp. Eng. (ASCE) 2021, 34, 04020112. [Google Scholar] [CrossRef]
- Ereiz, S.; Jimenez-Alonso, J.F.; Gallegos-Calderon, C.; Duvnjak, I.; Limongelli, M.P. Vibration based single-objective finite element model updating using cooperative game theory approach. Mech. Syst. Signal Process. 2024, 212, 111316. [Google Scholar] [CrossRef]
- Ciambella, J.; Ranzi, G.; Romeo, F. The Pier Luigi Nervi’s concrete structure of Palazzetto dello Sport: Modeling and dynamic characterization. Struct. Concr. 2024, 1–13. [Google Scholar] [CrossRef]
- Hernandez-Gonzalez, I.A.; Garcia-Macias, E.; Costante, G.; Ubertini, F. AI-driven blind source separation for fast operational modal analysis of structures. Mech. Syst. Signal Process. 2024, 211, 111267. [Google Scholar] [CrossRef]
- Jiang, C.; Chen, W.; Chen, X.; Zhang, S.; Xiao, W. Deep reinforcement learning approach with hybrid action space for mobile charging in wireless rechargeable sensor networks. Expert Syst. Appl. 2024, 249, 123752. [Google Scholar] [CrossRef]
- Reuland, Y.; Martakis, P.; Chatzi, E. A Comparative Study of Damage-Sensitive Features for Rapid Data-Driven Seismic Structural Health Monitoring. Appl. Sci. 2023, 13, 2708. [Google Scholar] [CrossRef]
- Ruccolo, A.; Gentile, C.; Canali, F. Monitoring an iconic heritage structure with OMA: The Main Spire of the Milan Cathedral. Smart Struct. Syst. Int. J. 2021, 27, 305–318. [Google Scholar] [CrossRef]
- Rosso, M.M.; Aloisio, A.; Parol, J.; Marano, G.C.; Quaranta, G. Intelligent automatic operational modal analysis. Mech. Syst. Signal Process. 2023, 201, 110669. [Google Scholar] [CrossRef]
- Pasca, D.P.; Aloisio, A.; Rosso, M.M.; Sotiropoulos, S. PyOMA and PyOMA GUI: A Python module and software for Operational Modal Analysis. SoftwareX 2022, 20, 101216. [Google Scholar] [CrossRef]
- Garcia-Macias, E.; Ubertini, F. MOVA/MOSS: Two integrated software solutions for comprehensive Structural Health Monitoring of structures. Mech. Syst. Signal Process. 2020, 143, 106830. [Google Scholar] [CrossRef]
- Moreu, F.; Li, X.; Li, S.; Zhang, D. Technical specifications of structural health monitoring for highway bridges: New Chinese structural health monitoring code. Front. Built Environ. 2018, 4, 10. [Google Scholar] [CrossRef]
- Italian Ministry of Infrastructures and for the Sustainable Mobility (MIMS). Adjournment of «Technical Code for Constructions»; NTC2018. Decree 17/01/2018; Italian Ministry of Infrastructures and for the Sustainable Mobility (MIMS): Rome, Italy, 2018; n. 42. (In Italian) [Google Scholar]
- Italian Ministry of Infrastructures and for the Sustainable Mobility (MIMS). Guidelines for the Risk Classification and Management, Safety Assessment and Monitoring of Existing Bridges; Guidelines 2022. Decree 1/07/2022; Italian Ministry of Infrastructures and for the Sustainable Mobility (MIMS): Rome, Italy, 2022; n. 204. (In Italian) [Google Scholar]
- Italian National Agency for Railway, Road and Motorway Infrastructure Safety (ANSFISA). Operative Instructions for the Application of the Guidelines on Risk Classification and Management, Safety Assessment and Monitoring of Existing Bridges; Italian National Agency for Railway, Road and Motorway Infrastructure Safety (ANSFISA): Rome, Italy, 2022. (In Italian) [Google Scholar]
- Avitabile, P. Modal Testing: A Practitioner’s Guide; Wiley: Hoboken, NJ, USA, 2017. [Google Scholar]
- Brincker, R.; Ventura, C. Introduction to Operational Modal Analysis; Wiley: Hoboken, NJ, USA, 2015. [Google Scholar]
- Ewins, D.J. Modal Testing: Theory, Practice and Application, 2nd ed.; Wiley: Hoboken, NJ, USA, 2000. [Google Scholar]
- Rainieri, C.; Fabbrocino, G. Operational Modal Analysis in Civil Engineering Structures; Springer: Berlin/Heidelberg, Germany, 2014. [Google Scholar]
- Zhu, L.; Fu, Y.; Chow, R.; Spencer, B.F., Jr.; Park, J.W.; Mechitov, K. Development of a high-sensitivity wireless accelerometer for structural health monitoring. Sensors 2018, 18, 262. [Google Scholar] [CrossRef]
- Nagayama, T.; Spencer, B.F., Jr.; Rice, J.A. Structural health monitoring utilising Intel’s Imote2 wireless sensor platform. Proc. SPIE 2007, 6529, 652943–652953. [Google Scholar]
- Bocca, M.; Eriksson, L.M.; Mahmood, A.; Jantti, R.; Jullaa, J. A synchronised wireless sensor network for experimental modal analysis in structural health monitoring. Comput. Aided Civ. Infrastruct. Eng. 2011, 26, 452–499. [Google Scholar] [CrossRef]
- Yu, X.; Fu, Y.; Li, J.; Mao, J.; Hoang, T.; Wang, H. Recent advances in wireless sensor networks for structural health monitoring of civil infrastructure. J. Infrastruct. Intell. Resil. 2024, 3, 100066. [Google Scholar] [CrossRef]
- Sofi, A.; Jane Regita, J.; Rane, B.; Lau, H.H. Structural health monitoring using wireless smart sensor network—An overview. Mech. Syst. Signal Process. 2022, 163, 108113. [Google Scholar] [CrossRef]
- Hassani, S.; Dackermann, U. A Systematic Review of Advanced Sensor Technologies for Non-Destructive Testing and Structural Health Monitoring. Sensors 2023, 23, 2204. [Google Scholar] [CrossRef] [PubMed]
- Fu, Y.; Mechitov, K.; Hoang, T.; Kim, J.R.; Lee, D.H.; Spencer, B.F., Jr. Development and full-scale validation of high-fidelity data acquisition on a next-generation wireless smart sensor platform. Adv. Struct. Eng. 2019, 22, 3512–3533. [Google Scholar] [CrossRef]
- BeanAir. BeanDevice WILOW AX-3D, Product Data Sheet; BeanAir: Berlin, Germany, 2024. [Google Scholar]
- Microstrain. G-Link-200: Ruggedized Wireless Triaxial Accelerometer Node Product Data Sheet; MicroStrain HBK: Williston, VT, USA, 2024. [Google Scholar]
- Adler, R.; Flanigan, M.; Huang, J.; Kling, R.; Kushalnagar, N.; Nachman, L.; Wan, C.-Y.; Yarvis, M. Intel mote 2: An advanced platform for demanding sensor network applications. In Proceedings of the 3rd International Conference on Embedded Networked Sensor Systems, San Diego, CA, USA, 2–4 November 2005; ACM: New York, NY, USA, 2005; p. 298. [Google Scholar]
- Shajihan, S.A.V.; Chow, R.; Mechitov, K.; Fu, Y.; Hoang, T.; Spencer, B.F., Jr. Development of synchronised high-sensitivity wireless accelerometer for structural health monitoring. Sensors 2020, 20, 4169. [Google Scholar] [CrossRef]
- M-A352AD10; High Accuracy Three Axis Accelerometer, Datasheet. Epson: Suwa, Japan, 2022.
- Lee, J.; Bang, G.; Lee, Y.; Heo, G. Design and validation of the MANTiS-32 wireless monitoring system and real-time performance-based structural assessment. Appl. Sci. 2025, 15, 8394. [Google Scholar] [CrossRef]
- Zanelli, F.; Debattisti, N.; Mauri, M.; Argentino, A.; Belloli, M. Development and field validation of wireless sensors for railway bridge model identification. Appl. Sci. 2023, 13, 3620. [Google Scholar] [CrossRef]
- Pei, Q.; Qi, P.; Lu, Y.; Qin, L. Development and verification of wireless vibration sensors. Buildings 2023, 13, 1648. [Google Scholar] [CrossRef]
- Prabatama, N.A.; Hornych, P.; Mariani, S.; Laheurte, M. Development of a Zigbee-based wireless sensor network of MEMS accelerometers for pavement monitoring. Eng. Proc. 2023, 58, 29. [Google Scholar]
- Crognale, M.; Rinaldi, C.; Potenza, F.; Gattulli, V.; Colarieti, A.; Franchi, F. Developing and testing high-performance SHM sensors mounting low-noise MEMS accelerometers. Sensors 2024, 24, 2435. [Google Scholar] [CrossRef] [PubMed]
- Bono, F.M.; Polinelli, A.; Radicioni Benedetti, L.; Castelli-Dezza, F.; Cinquemani, S.; Belloli, M. Wireless accelerometer architecture for bridge SHM: From sensor design to system development. Future Internet 2025, 17, 29. [Google Scholar] [CrossRef]
- InvenSense. MPU-6000 and MPU-6050 Product Specification Revision 3.4; Document Number PS-MPU-6000A-00; InvenSense: San Jose, CA, USA, 2013. [Google Scholar]
- TDK InvenSense. IIM-42351 Datasheet; Document Number DS-000441; TDK InvenSense: San Jose, CA, USA, 2022. [Google Scholar]
- Analog Devices. ADXL354/ADXL355 Data Sheet; Analog Devices: Wilmington, MA, USA, 2024. [Google Scholar]
- Phanish, D.; Garver, P.; Matalkah, G.; Landes, T.; Shen, F.; Dumond, J.; Abler, R.; Zhu, D.; Dong, X.; Wang, Y.; et al. A wireless sensor network for monitoring the structural health of a football stadium. In Proceedings of the 2015 IEEE 2nd World Forum on Internet of Things (WF-IoT), Milan, Italy, 14–16 December 2015; IEEE: New York, NY, USA, 2015; pp. 471–477. [Google Scholar] [CrossRef]
- Bedon, C.; Bergamo, E.; Izzi, M.; Noè, S. Prototyping and validation of MEMS. accelerometers for structural health monitoring—The case study of the Pietratagliata cable-stayed bridge. J. Sens. Actuator Netw. 2018, 7, 30. [Google Scholar] [CrossRef]
- Hu, X.; Wang, B.; Han, J. A Wireless Sensor Network-Based Structural Health Monitoring System for Highway Bridges. Comput. Aided Civ. Infrastruct. Eng. 2013, 28, 193–209. [Google Scholar] [CrossRef]
- Lynch, J.P.; Wang, Y.; Loh, K.J.; Yi, J.-H.; Yun, C.-B. Performance monitoring of the Geumdang Bridge using a dense network of high-resolution wireless sensors. Smart Mater. Struct. 2006, 15, 1561. [Google Scholar] [CrossRef]
- Jeong, S.; Kim, E.-J.; Shin, D.H.; Park, J.W.; Sim, S.H. Data fusion-based damage identification for a monopile offshore wind turbine structure using wireless smart sensors. Ocean Eng. 2020, 195, 106728. [Google Scholar] [CrossRef]
- Luo, Y.-Z.; Shen, Y.-B.; Fu, W.; Yun, C.B.; Liu, D.; Yang, P.; Yang, G.; Zhou, G. Implementation of SHM system for Hangzhou East Railway Station using a wireless sensor network. Smart Struct. Systems. Int. J. 2021, 27, 19–33. [Google Scholar] [CrossRef]
- Xu, W.; Zheng, X.; Shen, Y.; Luo, Y. Dynamic wireless sensor network-based structural health monitoring system for retractable roof structure. J. Build. Eng. 2024, 98, 111302. [Google Scholar] [CrossRef]
- Yang, Y.; Xu, W.; Gao, Z.; Yu, Z.; Zhang, Y. Research Progress of SHM System for Super High-Rise Buildings Based on Wireless Sensor Network and Cloud Platform. Remote Sens. 2023, 15, 1473. [Google Scholar] [CrossRef]
- Kurata, N.; Suzuki, M.; Saruwatari, S.; Morikawa, H. Application of ubiquitous structural monitoring system by wireless sensor networks to actual high-rise building. In Proceedings of the of the 5th World Conference on Structural Control and Monitoring (5XCSCM), Tokyo, Japan, 12–14 July 2010. [Google Scholar]
- Hu, W.-H.; Xu, Z.-M.; Bian, X.-H.; Tang, D.-H.; Lu, W.; Li, C.; Teng, J.; Cunha, A. Operational modal analysis and continuous dynamic monitoring of high-rise building based on wireless distributed synchronized data acquisition system. Struct. Control Health Monit. 2022, 29, e3063. [Google Scholar] [CrossRef]
- Popovic, N.; Feltrin, G.; Jalsan, K.-E.; Wojtera, M. Event-driven strain cycle monitoring of railway bridges using a wireless sensor network with sentinel nodes. Struct. Control Health Monit. 2017, 24, e1934. [Google Scholar] [CrossRef]
- Sarwar, M.Z.; Saleem, M.R.; Park, J.-W.; Moon, D.-S.; Kim, D.J. Multimetric event-driven system for long-term wireless sensor operation for SHM applications. IEEE Sens. 2020, 20, 5350–5359. [Google Scholar] [CrossRef]
- Fu, Y.; Zhu, L.; Hoang, T.; Mechitov, K.; Spencer, J.-B. Demand-based wireless smart sensors for earthquake monitoring of civil infrastructure. In Proceedings of the Sensors and Smart Structures Technologies for Civil, Mechanical, and Aerospace Systems, Denver, CO, USA, 27 March 2018; pp. 1–7. [Google Scholar] [CrossRef]
- Lin, J.-F.; Li, X.-Y.; Wang, J.; Wang, L.-X.; Hu, X.-X.; Liu, J.-X. Study of building safety monitoring by using cost-effective MEMS accelerometers for rapid after-earthquake assessment with missing data. Sensors 2021, 21, 7327. [Google Scholar] [CrossRef] [PubMed]
- Spencer, B.F.; Sim, S.-H.; Kim, R.E.; Yoon, H. Advances in artificial intelligence for structural health monitoring: A comprehensive review. KSCE J. Civ. Eng. 2025, 29, 100203. [Google Scholar] [CrossRef]
- Lawal, O.; Shajihan, S.A.V.; Mechitov, K.; Spencer, B.F. Edge integration of artificial intelligence into wireless smart sensor platforms for railroad bridge impact detection. Sensors 2024, 24, 5633. [Google Scholar] [CrossRef]
- Hidalgo-Fort, E.; Blanco-Carmona, P.; Munoz-Chavero, F.; Torralba, A.; Castro-Triguero, R. Low-cost. low-power edge conputing system for structural health monitoring in an IoT framework. Sensors 2024, 24, 5078. [Google Scholar] [CrossRef]
- Bhatta, S.; Dang, J. Use pf IoT for structural health monitoring of civil engineering structures: A state-of-the-art review. Urban Lifeline 2024, 2, 17. [Google Scholar]
- Wang, T.; Cui, T.; Qi, X.; Huan, X. Urban viaduct structural health monitoring: A review of wireless sensor approaches. Buildings 2025, 15, 1619. [Google Scholar] [CrossRef]
- Lorusso, A.; Guida, D. IoT System for Structural Monitoring. In New Technologies, Development and Application V; Karabegović, I., Kovačević, A., Mandžuka, S., Eds.; NT 2022. Lecture Notes in Networks and Systems; Springer: Cham, Switzerland, 2022; Volume 472. [Google Scholar] [CrossRef]
- Casillo, M.; Cecere, L.; Colace, F.; Lorusso, A.; Santaniello, D.; Tucker, A. Machine Learning Techniques for Structural Health Monitoring. In Intelligent Sustainable Systems; Nagar, A., Jat, D.S., Mishra, D., Joshi, A., Eds.; Worlds4 2024. Lecture Notes in Networks and Systems; Springer: Singapore, 2025; Volume 1178. [Google Scholar] [CrossRef]
- Park, J.W.; Sim, S.H.; Jung, H.J.; Spencer, J.-B.F. Development of a wireless displacement measurement system using acceleration responses. Sensors 2013, 13, 8377–8392. [Google Scholar] [CrossRef]
- Hoang, T.; Fu, Y.; Mechitov, K.; Gomez Sanchez, F.; Kim, J.R.; Zhang, D.; Spencer, B.F. Autonomous end-to-end wireless monitoring system for railroad bridges. Adv. Bridge Eng. 2020, 1, 17. [Google Scholar] [CrossRef]
- Perez-Solano, J.J.; Soriano-Asensi, A.; Felici-Castel, S.; Segura-Garcia, J. Improving the precision of time synchronization protocols in ultra-wideband networks estimating the time of flight of the radio signal. Comput. Commun. 2024, 223, 44–54. [Google Scholar] [CrossRef]
- Fu, Y.; Mechitov, K.; Hoang, T.; Kim, J.R.; Memon, S.A.; Spencer, B.F. Efficient and high-precision time synchronization for wireless monitoring of civil infrastructure subjected to sudden events. Struct. Control. Health Monit. 2020, e2643. [Google Scholar] [CrossRef]
- Hu, X.; Olgun, G.; Assaad, R.H. An intelligent BIM-enabled digital twin framework for real-time structural health monitoring using wireless IoT sensing, digital signal processing, and structural analysis. Expert Syst. Appl. 2024, 252, 124204. [Google Scholar] [CrossRef]
- Tronci, E.M.; Nagabuko, S.; Hieda, H.; Feng, M.Q. Long-range low-power multi-hop wireless sensor network for monitoring the vibration response of long-span bridges. Sensors 2022, 22, 3916. [Google Scholar] [CrossRef]
- Martín, C.; Garrido, D.; Llopis, L.; Rubio, B.; Díaz, M. Facilitating the monitoring and management of structural health in civil infrastructures with an Edge/Fog/Cloud architecture. Comput. Stand. Interfac. 2022, 81, 103600. [Google Scholar] [CrossRef]
- Srivastava, A.; Bharti, M.R. Hybrid machine learning model for anomaly detection in unlabelled data of wireless sensor networks. Wirel. Pers. Commun. 2023, 129, 2693–2710. [Google Scholar] [CrossRef]
- Icons. Available online: www.flaticon.com (accessed on 20 October 2025).
- PCB Piezotronics. Sensors for Seismic Testing; Series 393; PCB Piezotronics: Depew, NY, USA, 2021. [Google Scholar]
Disclaimer/Publisher’s Note: The statements, opinions and data contained in all publications are solely those of the individual author(s) and contributor(s) and not of MDPI and/or the editor(s). MDPI and/or the editor(s) disclaim responsibility for any injury to people or property resulting from any ideas, methods, instructions or products referred to in the content. |
© 2025 by the authors. Licensee MDPI, Basel, Switzerland. This article is an open access article distributed under the terms and conditions of the Creative Commons Attribution (CC BY) license (https://creativecommons.org/licenses/by/4.0/).