Abstract
The need to strengthen existing load-bearing elements (slabs, girders, columns, etc.) is often encountered in practice mainly because existing reinforced concrete structures were previously designed according to provisions and standards that were valid decades ago and no longer comply with currently valid Eurocodes, which provide new load levels and cross-section resistance calculations and, thus, a new level of reliability. Another reason is that the purpose behind the use of existing structures is changing, with these structures often now needing to withstand greater loads than were considered during the design. Many methods of strengthening elements stressed by axial force (pressure, tension), bending, shear, and their combination exist, with a common one being the addition of a new, more load-bearing layer of concrete, fibreconcrete, or ultra-high-performance concrete (UHPC). This experimental study focuses on the point of contact between two concrete surfaces and their modification to increase the bearing capacity of the bonded concrete-to-concrete cross-section. To strengthen the cross-section of the reinforced concrete (RC), a decisive condition is contact between individual layers, which is dependent on the resistance of the new, strengthened member. Connection occurs at the cross-section when the elements placed on top of each other are prevented by any suitable method from moving at the level of their contact surface. In this study, experimental tests were carried out to determine shear resistance using beams with dimensions of 100 × 100 × 300 mm, which consisted of two parts connected diagonally at an angle of 30°. To compare the increase in bearing capacity, the modifications of the contact surfaces and the characteristics of the material used for individual added layers were taken into account. The contact surfaces were either untreated, such as stamping from formwork, or smooth surfaces soaked in water for 48 h. For the modified surfaces, modifications included notches, indents, the use of an adhesive layer, and modifications of surface roughness using a steel brush. All base layers were concreted with the same class of concrete and processed according to the mentioned modifications. Different recipes were used for the upper (over-concreted) layer (part). The most effective processing methods were determined from the obtained results, and the coefficient of cohesion was determined through reverse calculation for individual surface treatments and subsequently compared with the Eurocode values.
1. Introduction
In recent decades, many researchers have studied ways to effectively and easily strengthen structures [1,2,3,4] that are no longer able to carry the load placed on them and do not meet the requirements for the Ultimate Limit States (ULSs) and Serviceability Limit States (SLSs) [5,6,7,8]. Those structures have to be strengthened during their design service life as they contain faults that could have occurred both in the design phase and during construction. These imperfections can arise from a bad concept, a bad solution to certain problems, or insufficient mechanical properties of the concrete or reinforcement. Concrete is an elastic–plastic (nonlinear–elastic) material and cannot behave plastically without partial tensile failure, which is why cracks form when a load is applied. An important characteristic is the location of failures on the structure [9,10,11,12]. Failures can be permissible if they do not reduce the durability and serviceability of the structure, or if they are partial (limiting) failures that reduce the durability or serviceability of the structure, depending on the extent. Another large group of defects is failures from a static point of view. Additionally, the last group of failures includes serious failures, which are failures that cause the structure to be immediately put out of service because it can no longer be used. The most serious failures are so-called emergency failures; these failures belong to the very serious group, and their occurrence is a threat to the resistance and stability of the structure [13,14]. In practice, failures of building materials often occur as a result of adverse, mostly long-term, external and internal factors, such as high (fire) or low (frost) temperatures, as well as by overloading the structure. If the structure loses its resistance and becomes unreliable, i.e., the structure ceases to fulfill its function for which it was designed, it must be rehabilitated, reconstructed (including through possible strengthening), or replaced [15,16,17,18,19]. Reconstructing (including strengthening) the structure attempts to increase the resistance (load-bearing capacity), durability, and remaining service life of the given element or a structure, as shown in Figure 1 [5,20,21,22].
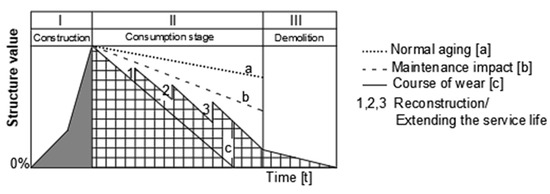
Figure 1.
Change in the value of the object (structure) during its service life. Stage I—construction of the structure; Stage II—use of the structure; Stage III—reconstruction, increasing the service life of the structure.
Numerous methods exist for strengthening concrete structures. However, not every method is economically advantageous. The actual technological realization of strengthening is also decisive. This means that, for damaged structures, one needs to take into account the method of strengthening [23,24,25]; in particular, to achieve the required level of reliability, the strengthening method must be chosen correctly. The choice of method for strengthening the structure or its parts results from the following requirements:
- -
- The need to increase the load-bearing capacity or seismic resistance of the structure due to an increase in the load for which the original structure was not designed;
- -
- The design or constructional failures;
- -
- The failures during operation (e.g., failure of concrete or reinforcement due to corrosion, fire, or other extraordinary loads [26]).
Basic methods to strengthen an element or a structure involve increasing the element’s cross-section, using prestressing, replacing the element with a new one of higher quality, or changing the support system [27,28,29,30]. To strengthen a concrete horizontal load-bearing element in particular, the basic methods include concreting (adding a new layer of concrete), adding reinforcements or new elements, changing the static system, and a combination of the mentioned methods. Moreover, a modern method to strengthen horizontal and vertical elements is to use FRP materials [22,24,25,31,32]. However, the most common method of strengthening (for example, the slabs) is concreting with a new additional layer of concrete in the upper part. In compression, this layer serves as an additional compressed part of the concrete, while in tensile areas above the supports, it serves as a layer for the insertion of additional reinforcement [32,33,34,35]. The newly added concrete of this new layer should be of at least the same class as the original structure or one concrete class higher. When strengthening a slab using a concrete overlay (a new layer), the resulting effect and the resulting degree of strengthening mainly depend on the contact between the new and old concrete (connecting the new and old parts). The bond is ensured using steel stud connectors (reinforcement) or bolts and anchors in concrete [36,37]. In this case, the full interaction between the original and new concrete layers is considered. Thus, full bonding is considered to be the state when the tension is transferred to the compressed concrete by means of shear forces [38,39,40,41]. Therefore, the resistance of the element depends on the concrete-to-concrete connection (contact) [42,43,44]. Additional connectors (reinforcement and bolts) act only after the shear resistance of the concrete-to-concrete contact has been exceeded [45,46,47]. Shear resistance is an essential component of the load-bearing capacity in reinforced elements with concreting. However, with such a cross-section, the bond is considered to be the weakest point. The shear resistance in the bond is capable of transmitting the shear forces up to a certain level of resistance [48,49,50,51,52,53,54]. Up to that level, the cross-section’s resistance is ensured by the action of several factors, such as the strength of individual materials, technological procedures, or structural arrangement. When strengthening concrete structures with a concrete layer, three factors contribute to shear resistance:
- -
- Cohesion;
- -
- Friction;
- -
- Shear reinforcement (connectors).
These factors act together, but after a certain level of stress, cohesion is overcome, after which the element does not collapse, but the amount of stress is reduced in the cross-section, which means that the element can no longer be considered to be one piece.
The key factor is to obtain a monolithic layered system made of cement composite. Cohesion is the ability of two surfaces in contact to resist shear stress up to the moment of mutual slippage [54,55]. Thus, cohesion is the stress that the contact surface is able to transfer without a pressure force, i.e., without the action of a frictional force, as shown in Figure 2a,b. Cohesion always acts together with frictional force [50,56]. This means that, if the point of contact is affected by a compressive force, both the frictional force and the cohesion c need to be exceeded to overcome the shear resistance. Figure 2c shows the dependence of the shear stress τ on the magnitude of the normal stress σ (ft is the tensile strength of concrete, and tg α is its friction coefficient).
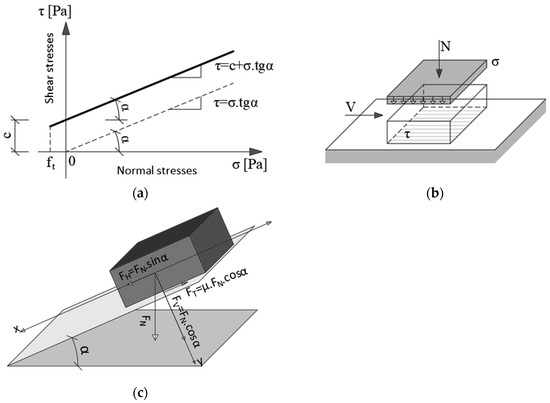
Figure 2.
Dependence of cohesion c on friction. (c—cohesion, τ—shear stress, V—shear force, σ—normal stress, N—normal force, ft is the tensile strength of concrete, and tg α is its friction coefficient).
The cohesion coefficient c is determined through experimental measurements and methods. The cohesion depends on the type of surface. Standard STN EN 1992-1-1 [6] recommends coefficients of cohesion according to the type of surface, from smooth to indented surfaces. Table 1 shows the values of cohesion for individual types of surfaces, as well as the corresponding years of introduction, for a comparison of the reduction in coefficients of cohesion.

Table 1.
Cohesion coefficients for individual surface treatments.
Table 1.
Cohesion coefficients for individual surface treatments.
| Type of Modification | c [MPa] STN EN 1992-1-1 (2004) [57] | c [MPa] STN EN 1992-1-1 (2015) [6] | c [MPa] prEN 1992-1-1 (2023) [58] |
|---|---|---|---|
| Very smooth | 0.25 | 0.025 | 0.0095 |
| Smooth | 0.35 | 0.20 | 0.075 |
| Rough | 0.45 | 0.40 | 0.19 |
| Indented | 0.50 | 0.50 | 0.37 |
The mechanisms ensuring cohesion of the cement composite can be divided into three main groups:
- -
- Mechanical bonding;
- -
- Physical bonding;
- -
- Chemical bonding.
Regarding load-bearing capacity, the most important bonds are mechanical bonds [59,60]. These bonds arise due to the porosity of the surface. It is impossible to create a perfectly smooth surface. Each surface contains pores, coarse cement paste particles, and filler particles, as shown in Figure 3, where a 3D digital profile of the surface is drawn in detail [38]. In the case of mechanical bonds, these deficiencies are filled with cement binder. In addition, the wedged aggregate grains contribute to shear resistance, where the so-called locking of contact surfaces occurs.
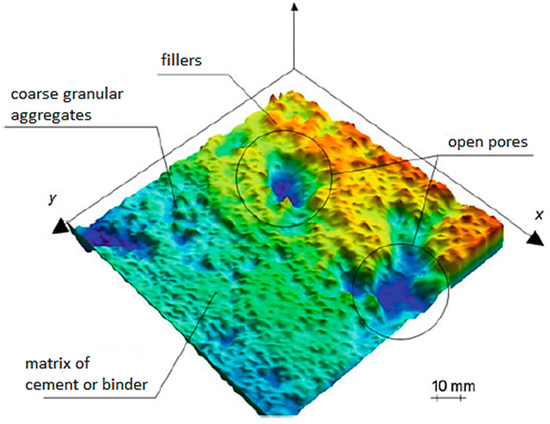
Figure 3.
Representative isometric view of the three-dimensional morphology of the concrete substrate surface.
Another important parameter is friction. The essence of friction is the interaction of atoms on the surface of touching solids. As can be seen from Formula (1), the frictional force FT is directly proportional to the compressive force FN, and its value is dependent on the coefficient of shear friction μ, the value of which in ordinary concrete structures ranges from 0.5 to 0.9. Friction is mainly caused by the roughness of a surface, on which the value of the coefficient μ also depends [61]. The coefficient of shear friction is a dimensionless quantity representing the angle at which the body moves along an inclined plane, so we assume that the friction force is equal to the value of the sliding component:
where
- FT is the frictional force parallel to the sliding surface [kN];
- μ is the coefficient of shear friction [-];
- FN is the pressing force perpendicular to the sliding surface [kN].
The abovementioned aspects influence the conceptual design of methods for strengthening existing load-bearing elements. Thus, it is very important that the new structure meets the requirements for load-bearing capacity and usability. Strengthening concrete structures allows for technical interventions to increase the load-bearing capacity, service life, or functionality of existing structures. Based on this study, it can be concluded that shear resistance without bond elements can show a higher load-bearing capacity than is given by the standard for individual surface treatments.
2. Experimental Program
The aim of this experimental program was to carry out shear tests to determine surface resistance. Based on practice and research, it is concluded that if the connection between the individual layers is not perfect, slippage occurs. Very often, the design considers a surface treatment that does not correspond to reality, and the structure may be damaged, meaning that correctly determining the boundary conditions is very important. To determine the shear resistance at the point of contact, different surface modifications between layers were tested. The tests themselves were performed on beam-shaped samples (prisms) with dimensions of 0.1 × 0.1 × 0.3 m (Figure 4a and Figure 5a), which consisted of two parts (concreted at different times) diagonally connected at an angle of 30°. The angle of 30° was chosen based on existing experiments [48]. Without a more detailed analysis, it is very difficult to say how this angle will affect the load-bearing capacity. However, with a larger inclination, the shear force increases and the compressive force decreases, which affects the friction after the chemical bond is crossed. Five types of concrete recipes were used for the upper part of concrete samples. The first recipe used Portland blended cement (PBC) (the recipe is denoted in the paper as MBE; see Table 2), and the second used Portland slag cement (PSC) (the recipe is denoted in the paper as ZBE; see Table 2). Portland blended cement (PBC) consists of admixtures in volumes up to 21–35% such as blast furnace slag (BFS), silica fume (SF), pozzolans (P), and fly ash (FA). Using this type of cement increases the hardening time. Based on the used cement and the composition of the cement mixture, higher load-bearing capacities occur in the joint. This affects the values of the coefficients of friction and cohesion, as well as the amount of added reinforcement in the joint. The third formula used bagged concrete C 16/20 (the manufacturer’s designation is B20), with a guaranteed cube compressive strength fck,cube after 28 days of 20 MPa. This concrete was also used to manufacture the bottom part of the samples in each series. The fourth recipe used bagged concrete (the manufacturer’s designation is WU) with a guaranteed cube compressive strength of 37 MPa (concrete class C 30/37). The compositions of the mixtures for B20 and WU concrete were not known, since the guaranteed strengths are declared by the manufacturer. The last recipe was identical to the MBE recipe, except with the addition of wires, meaning that it was fibreconcrete with steel fibres. Dramix 3D 45/30 GG steel wires were used to increase the tensile strength of the fibreconcrete. Class 3D fibres are recommended for high-stress constructions. They are steel wires that are not subject to corrosion, as the GG designation means galvanizing and gluing. The length of the fibre is 30 mm, and they are finished through mechanical modification such that they are better anchored in the cement matrix [62]. In all cases (five recipes, five series), cubes were made to check the properties of fck,cube. The number of cubes in each series (recipes) and the average compressive strength values of the cubes are given in Table 3. A total of 30 cubes were tested. The compressive strength of each cube was measured on the day of the test, so a 28-day curing period for the samples was observed.
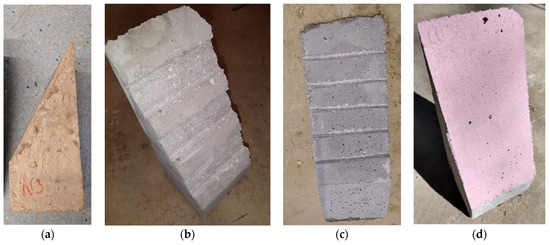
Figure 4.
Experimental samples (prisms—bottom parts). Surface modifications: (a) smooth surface, (b) notches, (c) indents, and (d) adhesive layer.
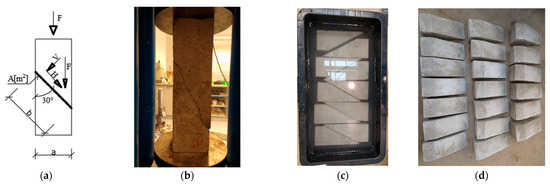
Figure 5.
Samples for testing: (a) loaded samples, (b) samples in a hydraulic jack, (c) water bath, (d) prepared samples.
Table 2.
Design of the mixtures.
Table 3.
Cube compressive strength fck,cube of individual recipes and the number of samples in each series.
The composition of the concrete mixture for the upper concreted parts was based on previous research [48,63]. The design of the concrete mixture was based on real conditions, i.e., the mixture needed to be able to be produced under normal production conditions and not only in laboratories. The influence of fibre volume was also taken into account for perfect mixing. In the experiment for reinforced concrete, a wire volume of 60 kg/m3 was considered.
To compare the shear resistance, the contact surfaces of the base samples (bottom parts) were modified, i.e., a smooth surface from the formwork, a smooth surface cleaned with a steel brush (Figure 4a), notches, indents, and an adhesive layer on a smooth surface were applied. The width of the notches was 25 mm, and the depth of the notches was 5 mm (Figure 4b); three notches were in contact with the new layer on the contact surface. The basic dimensions of the indents were 10 mm across the interface, the depth of the indent was 5 mm (rectangular cross-section), and the spacing of the indents was 25 mm (Figure 4c). In total, the five indents were used to transmit the shear force. For comparison, another series of samples with a different indent shape was also created, V-shaped indents, where the indent’s depth was 15 mm, the width was 15 mm, and the angle in the indent was approximately 67°. The last alternative for surface treatment was using an adhesive layer (Figure 4d): a Den Braven adhesive layer on a smooth surface. It is a strengthening coating intended for use as the first coating of all absorbent building materials. The coating was exposed to air for at least 4 h to harden. Microstructural measurements were not performed on the samples at this stage of the experiment. The experiment still focused on the maximum shear resistance of the various surfaces.
After concreting the lower part, the samples were treated for 4 days and set aside for hardening for another 24 days. Subsequently, the bottom part of the samples was processed according to the type of contact surface and cleaned of dust particles. The samples with smooth surfaces, which were supposed to simulate water-soaked concrete, were placed in a water bath for 48 h (Figure 5c). The moisture content of the contact surface was not measured (due to laboratory conditions), and the contact surface was moistened before concreting to avoid removing moisture from the fresh concrete. After surface treatment, the samples were placed in the formwork and subsequently covered with concreting mixture. To determine the homogeneity of the concrete mixture, an Abrams cone settlement test was performed. The compaction test was performed due to the expulsion of air bubbles from concrete, which adversely affected the shear resistance. The degree of settling was set at S5, so the mixture was liquid. As part of the concreting process, samples were taken and cube strengths were determined (Table 3). Eleven series of samples were made, and the series denotations and number of samples in the series are given in Table 4. A total of 57 pieces were cast for the shear tests, as well as 30 pieces for determining cube strength (Table 3; Figure 5d).
Table 4.
Denotation of series of samples depending on surface treatment and the recipes used.
Moreover, for the concrete mix using the steel fibres (fibreconcrete), one beam sample was also cast. The basic dimensions of the beam were 150 × 150 × 700 mm. The beam was used to determine the properties of fibreconcrete, such as tensile strength in bending.
Each sample was again treated for 4 days to prevent evaporation of water from the fresh concrete mix. Subsequently, the samples were allowed to harden for the required period of 28 days. After hardening, the samples were still ground to prevent mechanical wedging due to overflow of the fresh concrete mixture outside the formwork. The samples prepared in this way were placed in a hydraulic jack, where they were loaded with axial force until failure.
3. Results of the Experimental Measurements
The prepared samples were placed into the hydraulic jack, where they were loaded with an axial force. During loading, the maximum force at failure was measured. The average values of the maximum forces Fmax at failure of the samples in individual series are shown in Table 5. Each surface modification consisted of at least five or six samples, from which an arithmetic mean value was calculated.
Table 5.
Average values of the maximum forces at failure of the samples in individual series.
The results show that the best surface modification is notches, where mechanical wedging occurs until the tensile strength of the weaker concrete is exhausted. The extensive use of indents also produced satisfactory results.
For the bottom part of the samples in series 1, 2, 3, 4, and 6 to 11 (Table 4), concrete C 16/20 (denoted as B20) was used. B20 concrete served as the main comparison parameter for individual samples. The composition of concrete greatly influences its chemical and mechanical resistance. Depending on the composition, perfect chemical bonds between individual concretes may or may not occur. This concrete was chosen since the load-bearing members of structural or base layers do not always have high strength. In the case of series 5 only, concrete of a higher strength class (C 30/37, denoted as WU) was used. The failure mechanism of samples after loading, depending on the surface treatment of the contact between the two parts, is shown in Figure 6. In the case of samples with indents, the indents from the upper part of the samples were always broken. For the samples with notches, failure occurred due to failure of the notches in both the bottom and upper parts of the samples.
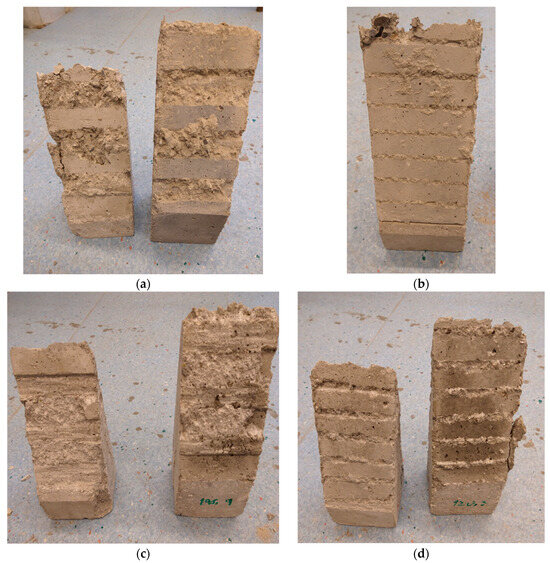
Figure 6.
Failure mechanism of samples after loading, depending on the surface treatment of the contact: (a) notched (series 7—ZZM), (b) indented (series 3—ZRM), (c) notched (series 8—ZZZ), (d) indented (series 4—ZRW).
The failure mechanism of the samples in which the upper part was made of fibreconcrete (series 9—DRPL) is shown in Figure 7. Using the fibreconcrete enabled the sample to carry the shear load even after the tensile strength of the concrete was overcome. Contact failure occurred at notches in the fibreconcrete (formation of a crack in the notches in the upper part of the samples, in all cases), so that the residual shear stress was transmitted by the fibres in the crack (the notches were wedged in the lower part of the sample).
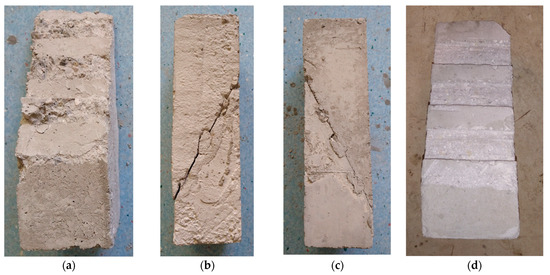
Figure 7.
Samples concreted with fibreconcrete in the upper part (series 9—DRPL). (a) Upper part after failure, (b,c) samples after failure as a whole, (d) bottom part of the samples (before concreting the upper part).
Based on the shear resistances obtained from the experimental measurements (the maximum failure force Fmax), cohesion coefficients c for individual series of samples were calculated according to Equation (2). To determine the coefficient of cohesion c, the coefficient of friction μ was also needed. Standard values taken from code STN EN 1992-1-1 (2015) [6] were considered. The experimentally obtained values of the coefficient of cohesion ccal for individual series of samples were subsequently compared with the recommended standard values given in code STN EN 1992-1-1 [6] (comparison in Table 6 and Figure 8). Statistical evaluation was only performed using the mean value of the maximum force at sample failure. No other statistical evaluation was performed.
Note: the denotation of individual quantities given in Formulas (2)–(4) is provided in Figure 4a.
Table 6.
Comparison of the experimentally obtained coefficient of cohesion ccal with standard values ccode.
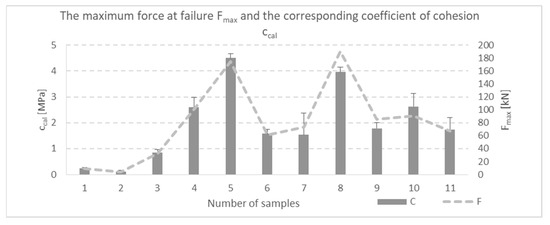
Figure 8.
Comparison of surface modifications and cohesion coefficients.
4. Evaluation of the Experimental Program and Discussion
4.1. Smooth Surface
Samples that have a smooth surface or a surface pressed by the formwork had an average force of 8.798 kN (series 1—N). The concreted upper part was made of concrete C 16/20 (B20). The sample failed suddenly due to a slip after reaching the maximum force Fmax. No significant cracks outside the contact between the lower and upper parts developed in the samples. The samples’ surfaces were not specially modified or impregnated. The series of samples that were in the water bath (2—NW) only transferred a force of 4.045 kN on average. Compared with samples concreted on a dry base (series 1—N), only 45.97% resisted failure (54.03% less). A detailed examination of the samples stored in the water bath showed no overhydration of the samples that were in contact. As seen in the comparison of the coefficients of cohesion c (Table 6), the coefficient of cohesion for the samples that were in the water bath showed significantly lower values: only 55% of the values given in the code [6] and only 45.83% of the experimentally determined values with a dry base. Therefore, base layers that are soaked (wetted) do not have as high coefficients of cohesion as stated in STN EN 1992-1-1 [6], i.e., a value of 0.20.
The lower values of the water-soaked sample can be influenced by several factors. The influence of humidity can dilute the cement mixture, thereby leaching out fine particles that do not form a mechanical bond. It can also be caused by the surface tension of water, where the cement mixture does not reach all the pores.
By using the adhesive bridge, an increase in load capacity was obtained to an average value of 90.88 kN. In comparison with the load capacity between smooth surfaces, the increase in load capacity is 82.09 kN, which is an increase of 933%. The adhesive bridge created an intermediate layer between the individual surfaces that resisted failure until the tensile strength of the adhesive bridge was exhausted, which can also be seen in Figure 9.
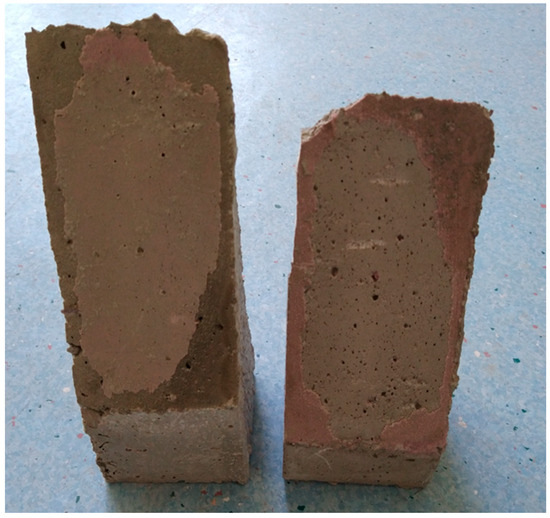
Figure 9.
Sample after the test with modification using an adhesive bridge.
Figure 10 shows the individual results of the samples subjected to the test.
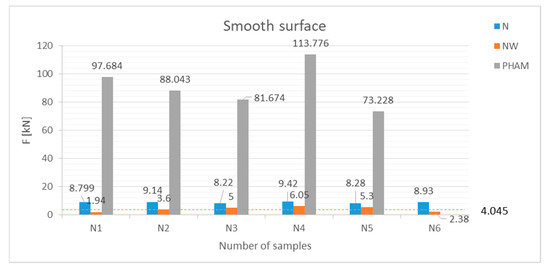
Figure 10.
Maximal resistance of individual samples in the smooth surface series.
4.2. Indents
To compare the surface treatment using indents, the samples were tested with different mixtures. The first recipe used Portland cement mix (MBE), the second recipe used Portland slag cement (ZBE), and the third recipe used bagged WU concrete. Comparing these recipes showed how strength affects shear resistance. Using MBE, the cube strength of the concrete was determined to be 21.08 MPa, which is a lower-quality concrete. Using this formula, lower shear resistance results were obtained (series ZRM), as the samples transferred an average force of only 32.55 kN. In comparison, for the ZBE recipe, the average cube strength was determined to be 29.71 kN, and the samples transferred an average shear force of 61.17 kN, i.e., 46.79% more than the MBE recipe (series ZRZ). Local overhydration of the samples of the original concrete by the new concrete was noted during a detailed examination. Mechanical wedging of the indents also occurred between the individual layers, and the shear capacity was affected by the tensile strength of the new concrete (upper part), as also seen in the results. To compare the bearing capacity of the cutting method, additional samples were made. The bottom part of the samples was made of WU concrete, i.e., the average cube compressive strength was 37.49 MPa, and the upper part of a layer of the ZBE recipe (series ZRZW). Using a higher strength class for the bottom part of the samples (a base layer) resulted in an increase in shear resistance to an average value of 174.48 kN. The ZRW specimens, which had an average shear force of 101.21 kN, were damaged in the same manner as the ZRZW specimens. However, the base layer had lower resistance than the ZRZW samples, where the average compressive strength of the base concrete was 37.49 MPa, compared with the base layer for ZRW, where the compressive strength was 29.82 MPa. Figure 11 shows the individual results for the samples.
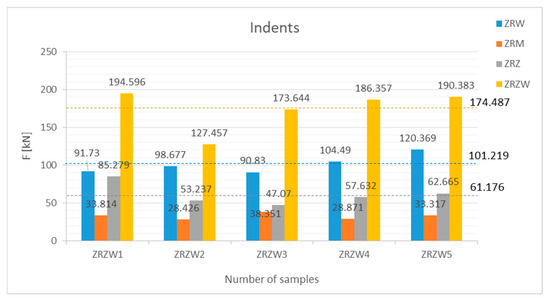
Figure 11.
Maximal resistance of individual samples in series for the indent modification.
4.3. Notches
Another series of samples for comparison was samples that were notched. This modification consisted of three notches that were each 50 mm wide and 5 mm deep. Three mixtures were used for the upper part of the samples (Table 1, Table 2 and Table 3): ZBE (denoted as series ZZZ), MBE (denoted as series ZZM), and MBE + steel fibres Dramix 3D (denoted as DRPL). Table 4 and Table 5 show that the samples in series ZZZ had the highest shear resistance, which had an average shear value of 190.44 kN. Using the MBE recipe, the samples transferred a shear force of 73.55 kN. When comparing samples and mixtures between ZZM and ZZZ, the ZZM mixture was found not to be overhydrated with the sample to a large extent, and the use of cement for this mix design did not achieve as high results as the ZBE mixture (Figure 12).
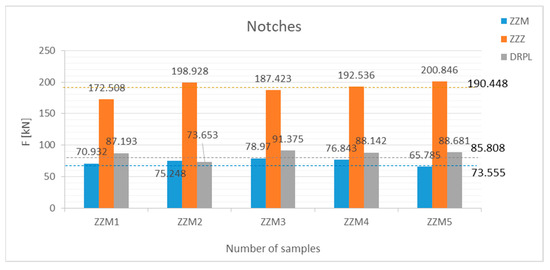
Figure 12.
Maximal resistance of individual samples in the notched series.
4.4. Fibreconcrete—Notches
The last alternative was to use steel fibres in the fresh concrete mixture. In the case of shear tests, the maximum average shear resistance for the notches was 85.80 kN. After closer inspection of the failure samples, the fibres were found to pass the cracks that arose, which were caused by exhaustion of the concrete’s tensile strength (Figure 13c). Additionally, when fibreconcrete was used, no sudden slippage of the upper concreted part occurred, but shear resistance gradually decreased (Figure 12). After disassembling the samples, the fibres were clearly found to have passed the created crack until they were pulled out of the cement matrix (Figure 13a,b). The use of reinforced concrete (steel fibres) favourably increased shear resistance. The maximum average force (85.81 kN—DRPL series) is about 16.65% greater than without the use of steel fibres (maximum average force 73.56 kN—ZZM series (Figure 12)). However, as it turned out, a higher quality of concrete (ZZZ series) has a greater impact. Steel fibres increase resistance, but not to the same extent as the use of higher-strength concrete.
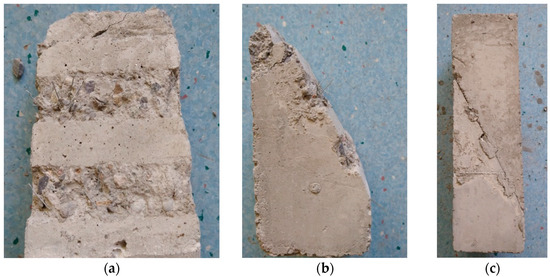
Figure 13.
Detailed views of fibre-reinforced samples: front view, side view, whole sample. ((a) view of the contact surface of the damaged sample; (b) side view of the damaged sample; (c) overall view of the sample).
5. Conclusions
Contact between the original and newly added layers is very important in terms of the resistance of the whole cross-section. To establish the resistance of a new composite element, the method of substrate layer (contact) modification to prevent slippage needs to be properly determined. In the experiment, five methods of modification were compared: a smooth surface, notches, two types of indents, and a smooth surface with an adhesive layer. Using a smooth surface, only small shear resistances were obtained, and no overhydration occurred between the new and original layers. From the reverse calculation, the coefficient of cohesion was determined to be 0.248. To compare the smooth surface, samples were created in a water bath for 48 h to verify this effect. In this comparison, lower shear resistance occurred. Compared with the dry sample, the cohesion coefficient was smaller, i.e., 0.11.
Another surface treatment was indents. For this alternative, the effects of different types of recipes (mixtures) were compared. Depending on the strength of the upper (over-concreted) part, different shear resistance results were obtained. When using the MBE concrete mixtures, the smallest average shear force and cohesion coefficient of 0.83 was obtained compared with higher-quality concrete, where the cohesion coefficient results exceeded 4.5. The shear resistance results for the notched surface modification were the highest. For this modification, tests were also carried out for different mixtures. The results varied depending on the strength of the upper part of the samples. The coefficients of friction were, in some cases, several times higher than those stated in STN EN 1992-1-1 [6]. As can be seen from the measured results, after cohesion and friction were exhausted, the notches engaged until the tensile strength of the concrete was also exhausted. The failure mode was identical, meaning that the tensile strength of the concrete was exceeded, and the elements slipped. Differences will only be apparent if higher-strength concretes are used. The shear values were exceeded due to overhydration of fresh concrete with the original, where chemical bonding occurred. Of course, this phenomenon is not included in the EN calculations and is difficult to account for, as clearly seen in Figure 6.
In most cases, the connection is influenced by chemical bonding, meaning that the concrete prehydrates with the original concrete and forms a single, as if cast, element.
Moreover, to compare the shear resistance results, samples were made using fibreconcrete. Dramix 3D steel fibres 30 mm in length were used for reinforced concrete. As can be seen from the results, the fibres passed the crack and thereby transmitted the tensile stresses. The fibres did not have such a significant effect on the shear resistance; instead, they had an effect on the toughness of the entire sample. In cases where concrete has a lower tensile strength and a crack occurs, the fibres bridge the crack and transmit the stress. However, this stress may not be as great as the tensile strength of higher-strength concrete. The use of concrete with higher strength had a greater impact.
Regarding the recipes (mixtures), the use of the MBE recipe resulted in lower compressive strengths. For shear resistance, this is due to the composition of the cement and, where no such overhydration occurred, such as when using the ZBE cement, due to the content of Portland clinker, since it contains up to 94% in cement from the ZBE formula.
In conclusion, the use of concrete with a consistency of S4 or higher (according to the Abrams test) is recommended. A thinner mixture causes clogging of small pores, thereby creating mechanical bonds that affect overall shear strength.
Author Contributions
Conceptualization, M.V. and P.K.; methodology, M.V. and P.K.; validation, M.F., P.K., M.V., and A.A.-B.; formal analysis, M.V. and P.K.; investigation, M.V. and A.A.-B.; resources, P.K.; data curation, M.V.; writing—original draft preparation, M.V. and P.K.; writing—review and editing, M.F.; visualization, M.V.; supervision, P.K.; project administration, P.K. All authors have read and agreed to the published version of the manuscript.
Funding
This research is supported by the Slovak Research and Development Agency under contract No. APVV-23-0626 and by Research Project No. 1/0321/24 of the Slovak Grant Agency.
Data Availability Statement
The data presented in this research are available and can be obtained from the corresponding author on request.
Acknowledgments
The financial support provided through the research fund is greatly appreciated. We also thank the journal experts who edited this paper and appreciate the constructive suggestions and comments on the manuscript from the reviewers and editors.
Conflicts of Interest
The authors declare no conflicts of interest.
References
- Maulana, H.; Thamrin, R.; Kurniawan, R.; Haris, S.; Nabila, W.U.; Syaifa, L. Seismic Behavior of Reinforced Concrete Beam-Column Joints Strengthened with Varied Installation Length of CFRP Sheets. Civ. Environ. Eng. 2025, 21, 409–426. [Google Scholar] [CrossRef]
- Sbahieh, S.; Rabie, M.; Ebead, U.; Al-Ghamdi, S.G. The Mechanical and Environmental Performance of Fiber-Reinforced Polymers in Concrete Structures: Opportunities, Challenges and Future Direction. Buildings 2022, 12, 1417. [Google Scholar] [CrossRef]
- Nguyen, H.Q.; Kim, J.K. A Theoretical and Numerical Approach to Ensure Ductile Failure in Strengthened Reinforced Concrete Slabs with Fiber-Reinforced Polymer Sheets. Buildings 2025, 15, 831. [Google Scholar] [CrossRef]
- Qassim, H.J.; Mashrei, M.A. Flexural Strength of RC Continuous Beams Strengthened by CFRP Using EBR and EBROG Methods: Experimental and Analytical Study. Civ. Environ. Eng. 2024, 20, 580–592. [Google Scholar] [CrossRef]
- Prignc, S.; Bahleda, F. Strengthening of Concrete Members, 1st ed.; Technical University of Košice: Košice, Slovakia, 2007. [Google Scholar]
- STN EN 1992-1-1 (73 1201); Design of Concrete Structures—Part 1-1: General Rules and Rules for Buildings. SUTN: Bratislava, Slovakia, 2015.
- Hasan, A.T.; Mashrei, M.A.; Makki, J.S. Behavior of Circular Reinforced Concrete Columns Strengthened by Different Techniques Subjected to Axial Loading. Civ. Environ. Eng. 2024, 20, 319–331. [Google Scholar] [CrossRef]
- Kolchunov, V.I.; Fedorova, N.V.; Savi, S.Y.; Kaydas, P.A. Progressive Collapse Behavior of a Precast Reinforced Concrete Frame System with Layered Beams. Buildings 2024, 14, 1776. [Google Scholar] [CrossRef]
- Valašík, A.; Benko, V.; Strauss, A.; Täubling, B. Reliability assessment of slender concrete columns at the stability failure. In Proceedings of the Computer Methods in Mechanics (CMMM 2017), 22nd International Conference on Computer Methods in Mechanics, Lublin, Poland, 13–16 September 2017; Volume 1922, p. 130010. [Google Scholar]
- Tomica, V.; Sokolík, A.; Zemko, Š. Maintenance and Reconstruction of Bridges, 1st ed.; ALFA: Bratislava, Slovakia, 1992. [Google Scholar]
- Kralovanec, J.; Moravcik, M. Experimental measurements in the field of prestressing force monitoring. Civ. Environ. Eng. 2022, 18, 104–110. [Google Scholar] [CrossRef]
- Brindha, U.; Maheswaran, J.; Chellapandian, M.; Arunachela, N. Quantitative Assessment of Strengthening Strategies and Design Recommendations for the Repair of Corrosion-Damaged Reinforced Concrete Member. Buildings 2023, 13, 1080. [Google Scholar] [CrossRef]
- Dongyun, L.; Wang, C.; Gonzalez-Libreros, J.; Tong, G.; Cao, J.; Youngming, T.; Lennart, E.; Gabriel, S. A review of concrete properties under the combined effect of fatigue and corrosion from a material perspective. Constr. Build. Mater. 2023, 369, 130489. [Google Scholar] [CrossRef]
- Han, T.; Ji, J.; Dong, Z.; Zhu, H.; Wu, G. Compression behavior of concrete columns strengthened by a hybrid BFRP/HDPE tube coupled with a crumb rubber concrete cladding layer. Constr. Build. Mater. 2023, 364, 129969. [Google Scholar] [CrossRef]
- Moravčík, M.; Kraľovanec, J. Determination of prestress losses in existing pre-tensioned structures using Bayesian approach. Materials 2022, 15, 3548. [Google Scholar] [CrossRef]
- Koteš, P.; Prokop, J.; Farbák, M.; Vavruš, M.; Gago, F.; Zahuranec, M. Report on Bridge Diagnostics in Lučenec—Bridge Diagnostics for Pedestrians MRO—Lučenec Rúbanisko II; Faculty of Civil Engineering, University of Žilina: Žilina, Sovakia, 2021. [Google Scholar]
- Koteš, P.; Vičan, J. Reliability-based evaluation of existing concrete bridges in Slovakia according to Eurocodes. In Proceedings of the Fourth International fib Congress 2014, Improving Performance of Concrete Structures”, Mumbai, India, 10–14 February 2014; pp. 227–229. [Google Scholar]
- Jiang, B.; Qian, Z.; Gu, D.; Pan, J. Repair concrete structures with high-early-strength engineered cementitious composites (HES-ECC): Material design and interfacial behavior. J. Build. Eng. 2023, 68, 106060. [Google Scholar] [CrossRef]
- Li, X.; Wang, M.; Zheng, D.; Fang, H.; Wang, F.; Wan, J. Study on the failure mechanism between polyurethane grouting material and concrete considering the effect of moisture by digital image correlation. J. Build. Eng. 2023, 67, 105948. [Google Scholar] [CrossRef]
- Saud, D.I.; Habra, S.I. Behavior of Lightweight Reinforced Concrete Concavely-Curved Soffit Beams Strengthened with CFRP. Civ. Environ. Eng. 2025, 21, 91–108. [Google Scholar] [CrossRef]
- Jo, M.S.; Kim, H.G.; Kim, D.H.; Choi, J.H.; Kim, K.H. Prediction of Flexural Strength of RC Circular Columns Considering Lateral Confinement Effects of FRCM and Transverse Steel Reinforcement. Buildings 2023, 13, 2361. [Google Scholar] [CrossRef]
- Dewi, S.H.; Thamrin, R.; Haris, S.; Yastari, F.P. Tensile Forces Behavior on Longitudinal Reinforcement and CFRP Strips on Circular Hollow Reinforced Concrete Columns. Civ. Environ. Eng. 2024, 20, 86–97. [Google Scholar] [CrossRef]
- Vavruš, M.; Koteš, P. Numerical comparison of concrete columns strengthened with layer of fibre concrete and reinforced concrete. Transp. Res. Procedia 2019, 40, 920–926. [Google Scholar] [CrossRef]
- Koteš, P.; Farbák, M. Investigation of dynamically loaded RC T-beams strengthened with CFRP lamellas and sheets. In Proceedings of the 7th International Conference on FRP Composites in Civil Engineering (CICE 2014), Vancouver, BC, Canada, 20–22 August 2014. [Google Scholar]
- Gajdošová, K.; Bilčík, J. Full-Scale Testing of CFRP-Strengthened Slender Reinforced Concrete Columns. J. Compos. Constr. 2013, 17, 239–248. [Google Scholar] [CrossRef]
- Bolina, L.F.; München, M.R.; Lago, D.B.; Kodur, V. A comparative study between ultra-high-performance concrete structures and normal strength concrete structures exposed to fire. Structures 2024, 68, 107197. [Google Scholar] [CrossRef]
- Koteš, P.; Vičan, J.; Nikolič, R. Evaluation of Elder and Historical Bridges. Procedia Eng. 2016, 156, 186–190. [Google Scholar] [CrossRef][Green Version]
- Koteš, P.; Vičan, J. Recommended Reliability Levels for the Evaluation of Existing Bridges According to Eurocodes. Struct. Eng. Int. 2013, 23, 411–417. [Google Scholar] [CrossRef]
- Gocál, J.; Odrobiňák, J. On the Influence of Corrosion on the Load-Carrying Capacity of Old Riveted Bridges. Materials 2020, 13, 717. [Google Scholar] [CrossRef]
- Moravčík, M.; Bahleda, F.; Jošt, J. Application of Indirect Methods for Determining State of Prestressing in the Structure. In Proceedings of the Conference: Concrete Days 2018, Prague, Czech Republic, 8–9 November 2018. (In Slovak). [Google Scholar]
- Hameed, M.O.; Daud, R.A. Behavior of Fatigue Damaged Reinforced Concrete One-Way Slabs Repaired with CFRP Sheets. Civ. Environ. Eng. 2024, 20, 364–376. [Google Scholar] [CrossRef]
- Kotes, P.; Farbak, M.; Kotula, P.; Brodnan, M.; Cavojcova, A. Using CFRP Lamellas for Strengthening of Dynamically Loaded Beams. Procedia Eng. 2013, 65, 302–310. [Google Scholar] [CrossRef]
- Fernandes, H.; Lúcio, V.; Ramos, A. Strengthening of RC slabs with reinforced concrete overlay on the tensile face. Eng. Struct. 2017, 132, 540–550. [Google Scholar] [CrossRef]
- Selejdak, J.; Blikharskyy, Y.; Khmil, R.; Blikharskyy, Z. Calculation of Reinforced Concrete Columns Strengthened by CFRP. In Proceedings of the Advances in Resource-Saving Technologies and Materials in Civil and Environmental Engineering (CEE 2019), 17th International Conference, Algiers, Algeria, 11–13 September 2019; pp. 400–410. [Google Scholar]
- Gago, F.; Valletta, A.; Muzik, J. Formulation of a basic constitutive model for fine-grained soils using the hypoplastic framework. Civ. Environ. Eng. 2021, 17, 450–455. [Google Scholar] [CrossRef]
- Gosztola, D.; Cucuzza, R.; Szép, J.; Domaneschi, M.; Ghodousian, O.; Rad, M.M. Plastic Limited Numerical Modelling on Contact Friction Effect of Steel–Concrete Connection for Composite Bridges. Buildings 2024, 14, 2898. [Google Scholar] [CrossRef]
- Wu, Y.; Hu, S.; Li, M.; Rong, B. Flexural Behavior of Wet Joints with Contact U-Bars. Buildings 2025, 15, 855. [Google Scholar] [CrossRef]
- Pierre-Claude, A. High-Performance Concrete, 1st ed.; CRC Press: Boca Raton, FL, USA, 1998; 624p. [Google Scholar]
- Sadowski, L. Adhesion in Layered Cement Composites, 1st ed.; Springer: Cham, Switzerland, 2019. [Google Scholar]
- Bujnakova, P.; Kralovanec, J.; Perkowski, Z. Verification of Precast Concrete Girder Bridge Under Static Load. Civ. Environ. Eng. 2022, 18, 760–767. [Google Scholar] [CrossRef]
- Kralovanec, J.; Moravcik, M.; Bahleda, F.; Prokop, J. Experimental and Numerical Study of Saw-cut Method on Concrete Beams. In Proceedings of the FIB Symposium 2021, Concrete Structures: New Trends for Eco-Efficiency and Performance, Virtual, 14–16 June 2021. [Google Scholar]
- Alnemrawi, B.R.; Al-Rousan, R. NLFEA Behavior of Heat-Damaged Key Joints in Precast Concrete Segmental Bridge. Buildings 2025, 15, 1890. [Google Scholar] [CrossRef]
- Luu, X.B.; Kim, S.K. Finite Element Modeling of Interface Behavior between Normal Concrete and Ultra-High Performance Fiber-Reinforced Concrete. Buildings 2023, 13, 950. [Google Scholar] [CrossRef]
- El-Khier, M.A.; Morcous, G. Friction and Cohesion Interface Shear Factors of Ultra-High-Performance Concrete (UHPC) Cast on Hardened Conventional Concrete. Buildings 2023, 13, 1253. [Google Scholar] [CrossRef]
- Vavruš, M.; Koteš, P.; Bahleda, F.; Jošt, J. Analysis of shear behavior between old concrete and fiber concrete. Pollack Period. 2019, 16, 77–82. [Google Scholar] [CrossRef]
- Čítek, D.; Huňka, P.; Řeháček, S.; Mandlík, T.; Kolísko, J. Testing of bond behavior of UHPC. In Proceedings of the 11th International Conference on Special Concrete and Composites, Dresden, Germany, 15–18 September 2024; pp. 95–98. [Google Scholar]
- Bonaldo, E.; Barros, J.A.; Lourenco, P.B. Bond characterization between concrete substrate and repairing SFRC using pull-off testing. Int. J. Adhes. Adhes. 2005, 25, 463–474. [Google Scholar] [CrossRef]
- Júlio, E.N.; Branco, F.A.; Silva, V.D.; Lourenço, J.F. Influence of added concrete compressive strength on adhesion to an existing concrete substrate. Build. Environ. 2006, 41, 1934–1939. [Google Scholar] [CrossRef]
- Eduardo, N.B.S.J.; Fernando, A.B.B.; Vítor, D.S. Concrete-to-concrete bond strength. Influence of the roughness of the substrate surface. Constr. Build. Mater. 2004, 18, 675–681. [Google Scholar] [CrossRef]
- Mohamad, M.E.; Ibrahim, I.S.; Abdullah, R.; Rahman, A.B.A.; Kueh, A.B.H.; Usman, J. Friction and cohesion coefficients of composite concrete-to-concrete bond. Cem. Concr. Compos. 2015, 56, 1–14. [Google Scholar] [CrossRef]
- Perez, F.; Morency, M.; Bissonnette, B.; Courard, L. Correlation between the roughness of substrate surface and the debonding risk. In Concrete Repair, Rehabilitation and Retrofitting II; CRC Press: Boca Raton, FL, USA, 2008; pp. 347–356. [Google Scholar] [CrossRef]
- Sadeghain, A.; Shaghaghi, M.T.; Mohammadi, Y.; Taghipoor, H. Performance Assessment of Hybrid Fibre-Reinforced Concrete (FRC) under Low-Speed Impact: Experimental Analysis and Optimized Mixture. Shock. Vib. 2023, 2023, 7110987. [Google Scholar] [CrossRef]
- Afandi, M.E.; Yehia, S.; Landolsi, T.; Qaddoumi, N.; Elchalakani, M. Concrete-to-concrete bond Strength: A review. Constr. Build. Mater. 2023, 363, 129820. [Google Scholar] [CrossRef]
- Adams, R.D.; Drinkwater, B.W. Nondestructive testing of adhesively-bonded joints. NDT E Int. 1997, 30, 93–98. [Google Scholar] [CrossRef]
- Halicka, A. Influence new-to-old concrete interface qualities on the behaviour of support zones of composite concrete beams. Constr. Build. Mater. 2011, 25, 4072–4078. [Google Scholar] [CrossRef]
- Tayeh, B.A.; Bakar, B.A.; Johari, M.M.; Ratnam, M.M. The relationship between substrate roughness parameters and bond strength of ultra high-performance fiber concrete. J. Adhes. Sci. Technol. 2013, 27, 1790–1810. [Google Scholar] [CrossRef]
- STN EN 1992-1-1 (73 1201); Design of Concrete Structures—Part 1-1: General Rules and Rules for Buildings. SUTN: Bratislava, Slovakia, 2004.
- prEN 1992-1-1; Design of Concrete Structure—Part 1-1: General Rules and Rules for Buildings. SUTN: Bratislava, Slovakia, 2023.
- Wall, J.S.; Shrive, N.G. Factors affecting bond between new and old concrete. ACI Mater. J. 2011, 108, 449–456. [Google Scholar] [CrossRef]
- Farouk, A.I.B.; Rong, W.; Zhu, J. Compressive behavior of ultra-high-performance-normal strength concrete (UHPC-NSC) column with the longitudinal grooved contact surface. J. Build. Eng. 2023, 68, 106074. [Google Scholar] [CrossRef]
- Santos, P.M.D.; Julio, E.N.B.S.; Vítor, D.S. Correlation between concrete-to-concrete bond strength and roughness of the substrate surface. Constr. Build. Mater. 2007, 21, 1688–1695. [Google Scholar] [CrossRef]
- Vandewalle, L.; Nemegeer, D.; Balazs, L.; Barr, B.; Barros, J.; Bartos, P.; Banthia, N.; Criswell, M.; Denarie, E.; Di Prisco, M.; et al. RILEM TC 162-TDF (2003): Test and design methods for steel fibre reinforced concrete. σ-ε design method. Final Recommendation. Mater. Struct. 2003, 36, 560–567. [Google Scholar]
- Vítek, J.L.; Smiřinský, S. Interaction of traditional reinforcement and spread reinforcement. BETON-Technol. Konstr. Sanace 2010, 2, 48–52. (In Czech) [Google Scholar]


Disclaimer/Publisher’s Note: The statements, opinions and data contained in all publications are solely those of the individual author(s) and contributor(s) and not of MDPI and/or the editor(s). MDPI and/or the editor(s) disclaim responsibility for any injury to people or property resulting from any ideas, methods, instructions or products referred to in the content. |
© 2025 by the authors. Licensee MDPI, Basel, Switzerland. This article is an open access article distributed under the terms and conditions of the Creative Commons Attribution (CC BY) license (https://creativecommons.org/licenses/by/4.0/).