1. Introduction
In response to mounting environmental concerns and increasing demand for sustainable construction materials, the construction industry is rapidly evolving to adopt more energy-efficient, cost-effective, and eco-friendly building solutions. Among these, Autoclaved Lightweight Concrete (ALC) has gained popularity due to its low density, superior thermal insulation, and reduced dead load. However, conventional ALC production is associated with two critical challenges: (1) long drying times, typically requiring 24–48 h using autoclaves or tunnel dryers, which are energy-intensive and operationally costly, and (2) dependence on high-purity silica sand, which is environmentally unsustainable and increasingly scarce in many regions, including the UAE [
1,
2].
The drying phase in ALC manufacturing not only extends production timelines but also constitutes a major energy burden. Autoclaving, while effective in accelerating hydration reactions and enhancing mechanical properties, requires high-pressure steam and specialized equipment, making it unsuitable for decentralized or small-scale operations. Alternatives such as tunnel and chamber dryers still require significant energy and space and may result in improper moisture removal, leading to cracking, porosity variation, or compromised strength [
3,
4]. Recent studies have investigated advanced solutions, including microwave and infrared drying, that demonstrate potential for significantly reducing curing times while preserving material quality; however, issues of scalability and cost still hinder industrial adoption [
5].
A parallel concern lies in the depletion of high-silica sand, a critical raw material in ALC production. In arid regions like the UAE, most naturally available sand is silica-deficient and often contaminated with salts, clays, and silts, necessitating expensive pre-treatments before use in concrete [
6,
7]. Recent geotechnical studies on Abu Dhabi (AD)’s calcareous sands have highlighted their distinct composition, particle crushability, and dynamic behavior under cyclic and monotonic loading, highlighting the importance of localized characterization for UAE construction applications [
8,
9]. Field-scale investigations further confirmed the effectiveness of in situ ground-improvement methods such as dynamic replacement and rapid impact compaction in optimizing reclaimed calcareous fills [
10]. This growing understanding of regional sand behavior has encouraged research into sustainable alternative silica sources with comparable pozzolanic reactivity. Parallel advances in sustainable soil stabilization have demonstrated the efficacy of incorporating waste-derived materials, such as plastic–cement blends, to enhance strength and reduce environmental footprint [
11].
Recycled glass powder (GP) has attracted attention as one such alternative. When finely ground (<75 μm), GP demonstrates pozzolanic reactivity, consuming calcium hydroxide and forming additional calcium–silicate–hydrate (C-S-H), which improves strength, durability, and chemical resistance [
12]. Incorporating glass powder contributes to circular economy goals by diverting waste from landfills and reducing reliance on virgin raw materials [
13]. Prior investigations report that replacing up to 30% of cementitious content with GP can enhance performance while lowering environmental impact, provided adequate measures are taken to mitigate alkali–silica reaction (ASR) [
14,
15].
In this study, glass powder (GP) was directly utilized as a silica enrichment agent for locally available low-quality desert sands to enhance the pozzolanic activity and overall performance of aerated lightweight concrete. Among various silica-based additives reported in the literature, such as metakaolin, silica fume, and rice husk ash, GP was selected due to its high amorphous silica content, proven reactivity, and local availability as a recyclable waste material. Its inclusion in the experimental work establishes a direct link between the background discussion and the practical methodology adopted in this research.
Despite advancements in drying techniques and raw material substitutions, most existing studies address these issues separately. Very few propose an integrated strategy that simultaneously resolves both the energy burden of drying and the scarcity of silica resources. Furthermore, interactions between accelerated drying methods and GP-enriched sands remain poorly understood, particularly in terms of moisture migration, pore structure evolution, and thermal gradients. This knowledge gap underscores the need for a comprehensive, dual-innovation approach that combines process efficiency with sustainable material design in ALC production.
This study introduces a novel integration of rapid thermal drying with glass-powder silica enrichment of low-quality desert sands for producing aerated lightweight concrete (ALC). The approach simultaneously addresses prolonged curing times and the scarcity of high-silica sand in regions like the UAE. By reducing drying time from 24–48 h to less than one hour and enhancing silica reactivity using recycled glass, the method improves strength and sustainability. This combined strategy has not been previously explored in ALC research and offers distinct advantages in processing time, energy efficiency, and material performance.
Accordingly, this study aims to establish a scalable, low-carbon production pathway for ALC, tailored to environmentally sensitive and resource-limited contexts. The specific objectives are: (i) to reduce ALC drying times from 24–48 h to less than one hour using a rapid, non-autoclave drying technique; (ii) to enhance the silica content of locally available low-quality sand through recycled glass powder enrichment; (iii) to evaluate the resulting ALC blocks in terms of drying kinetics, density, porosity, compressive strength, and thermal conductivity; and (iv) to compare the environmental and economic impacts of this method against conventional practices.
This work introduces a novel dual-faceted framework that unites two critical domains of ALC innovation: process innovation: accelerated drying without autoclaving, reducing curing time to under one hour and cutting energy demand, and material innovation: enriching silica-poor regional sands with recycled glass powder to achieve or exceed the performance of conventional high-silica sand. Unlike prior studies that examine these improvements in isolation, this research integrates them into a unified, experimentally validated production system. The synergy between rapid drying and silica enrichment not only improves mechanical and thermal properties but also aligns with sustainable development goals, circular economy strategies, and regional waste-management priorities. Additionally, the study compares results across multiple UAE sand sources, demonstrating adaptability of the method to local materials. The findings highlight strong potential for industrial scalability using readily available equipment and waste-derived inputs, paving the way for next-generation lightweight concrete systems. Sand samples were collected from both the UAE and the UK to represent two contrasting geological contexts, silica-poor desert sands and silica-rich quartz sands, allowing for an evaluation of the proposed silica-enrichment and rapid-drying methods across diverse mineral compositions.
2. Materials and Methods
2.1. Materials and Mixture Design
ALC was prepared using locally available sands in order to investigate the influence of sand treatment and regional variation on the physical and mechanical performance of the material. Two categories of mixtures were developed. The first category (Set 1) employed untreated sand, while the second category (Set 2) incorporated sand that had undergone pre-processing to enhance its thermal and environmental performance.
Traditionally, ALC is produced by combining cement, fine aggregates, water, and a foaming agent, then curing under high-pressure steam [
13]. While effective, this process is unsustainable due to its reliance on synthetic foaming agents, high-silica sand, and energy-intensive autoclaving [
14]. In this study, an alternative drying unit was used to reduce curing time from almost two days to less than an hour, while waste glass powder was incorporated to enhance silica-poor sands. This dual approach improves material strength, reduces dependence on scarce high-silica sand in regions such as Abu Dhabi and Dubai, and supports circular economy practices by reusing industrial glass waste [
13,
14,
15].
For both Set 1 and Set 2, the mixture proportions were kept constant, consisting of Ordinary Portland Cement (OPC, Type I), calcium hydroxide (Ca(OH)
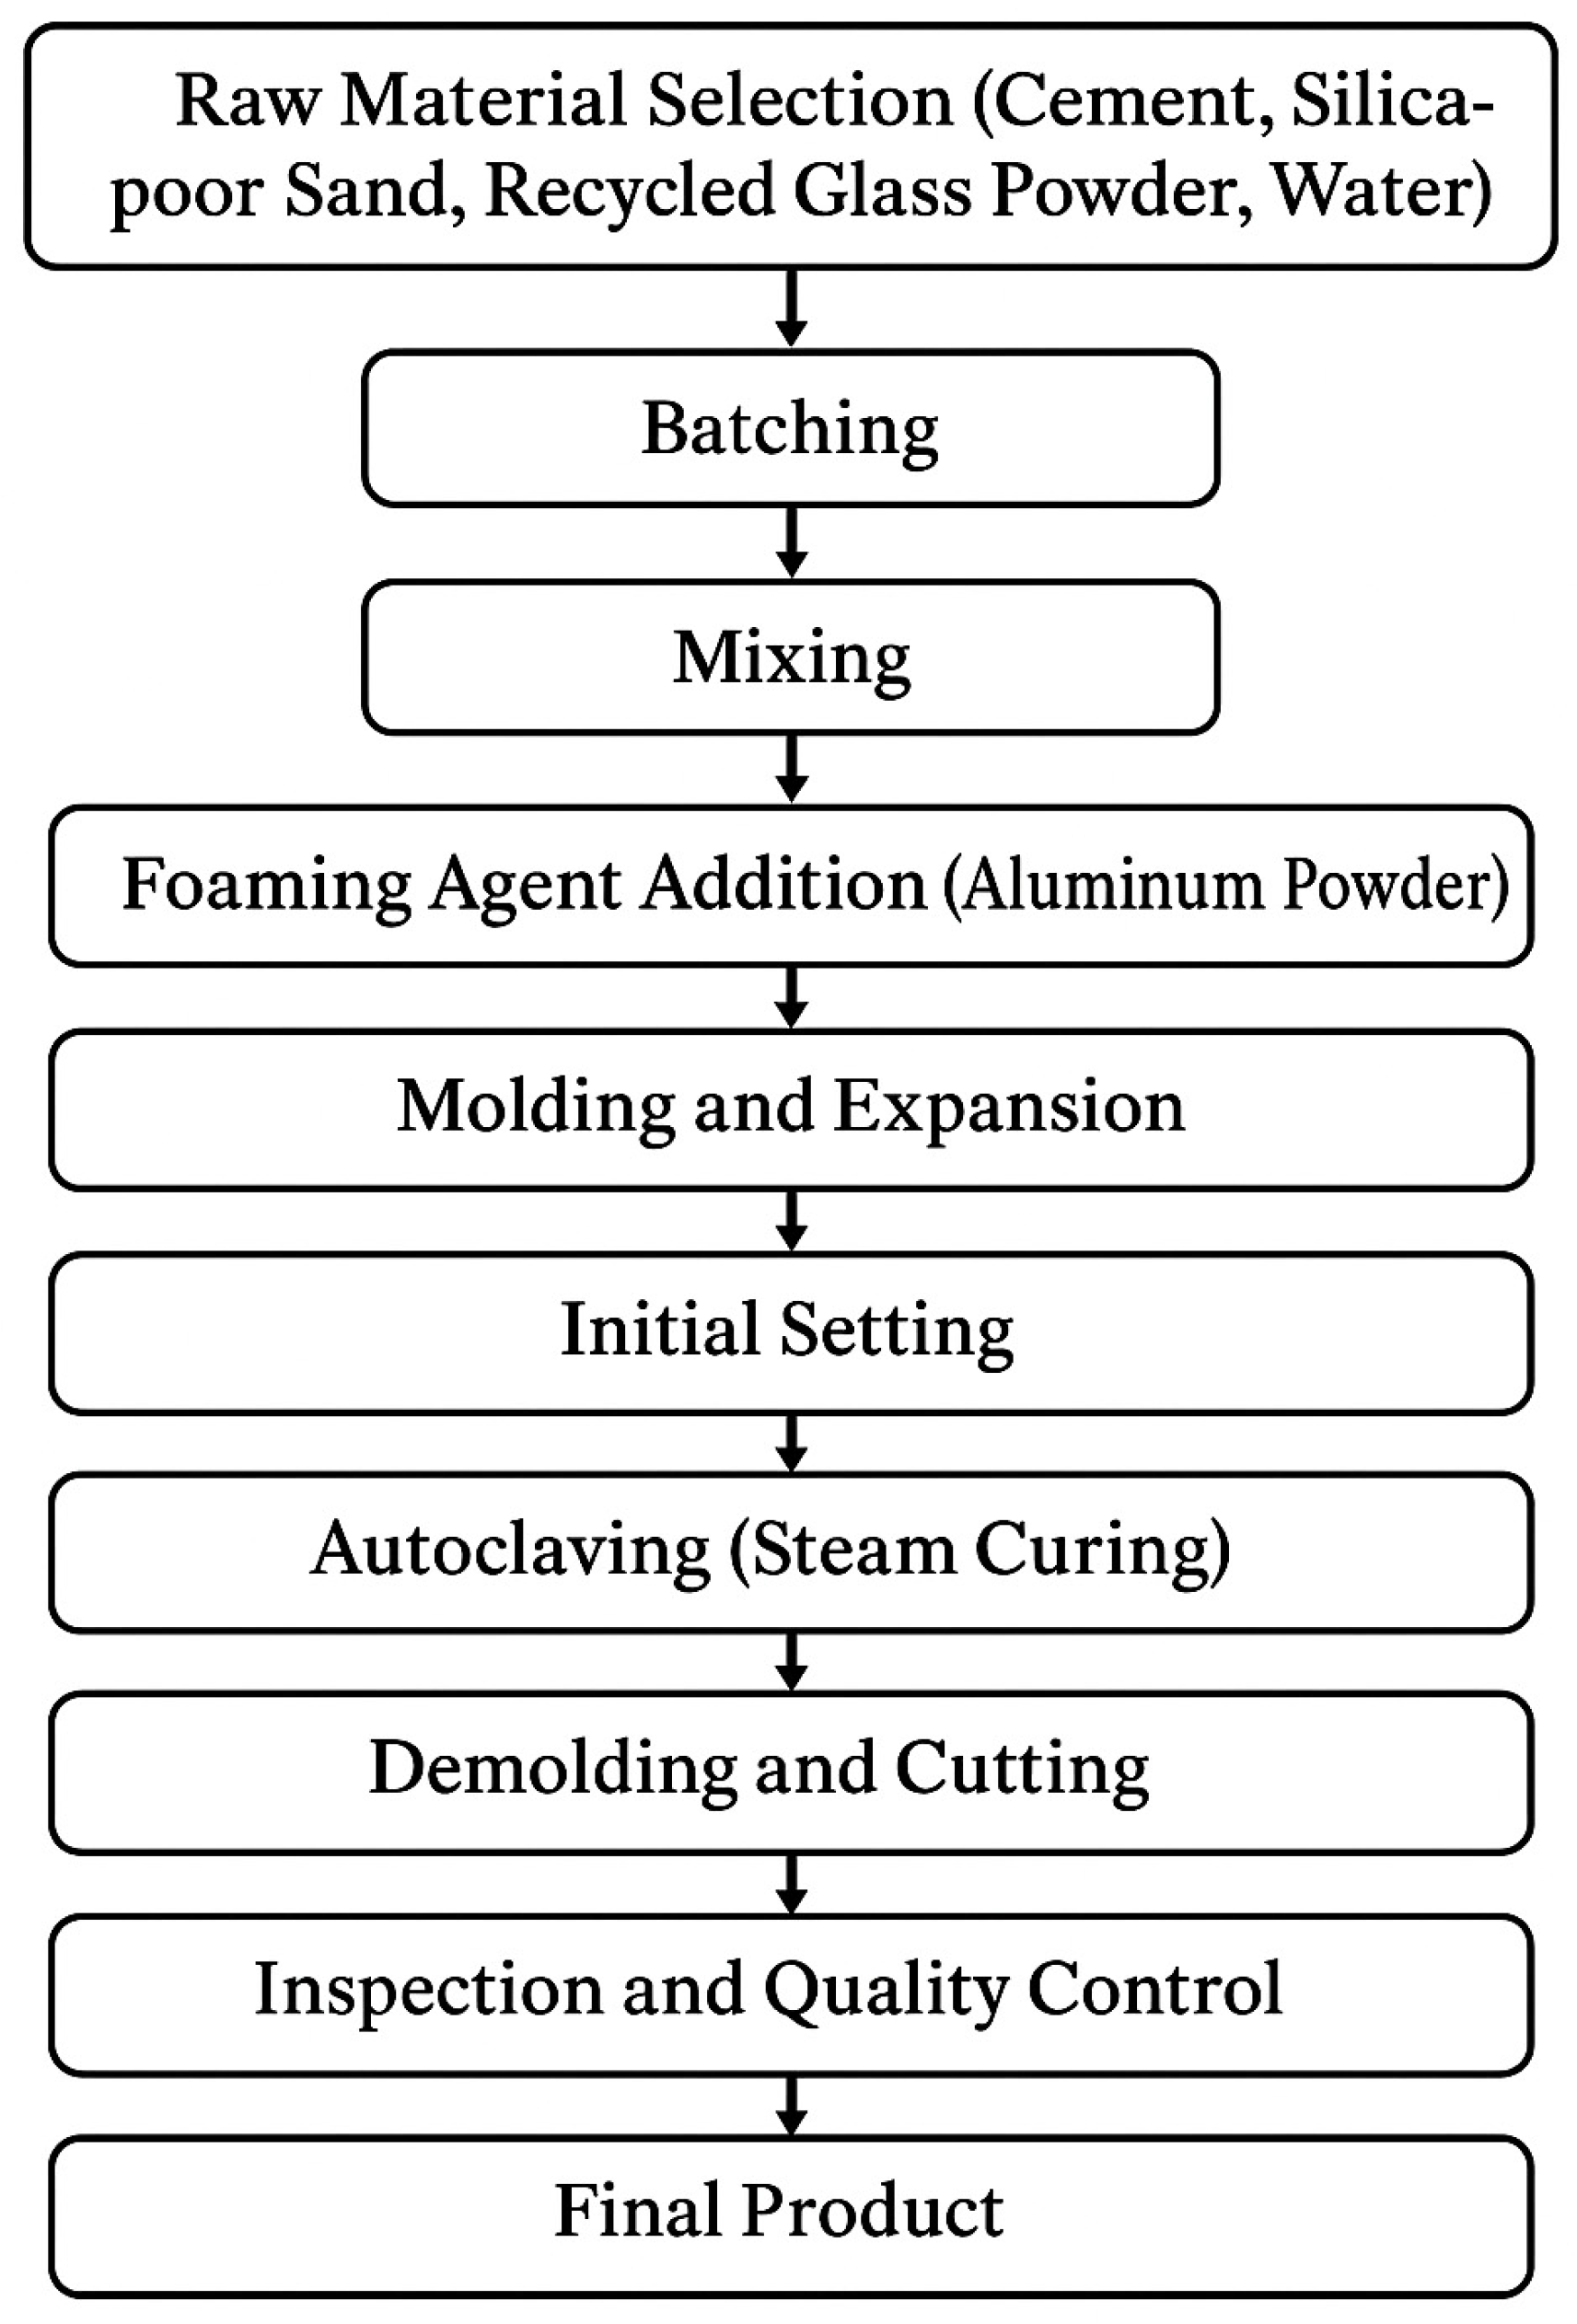
2), calcium oxide (CaO), polyvinyl acetate (PVA) emulsion as a binder that improves foam stability and sand–binder cohesion without affecting cement hydration, aluminum powder as a foaming agent, and water. A commercial foaming agent was initially included in the trials; however, it was subsequently excluded from the procedure after demonstrating negligible influence on the final product properties. The overall process included blending the constituent materials, casting them into lubricated molds, and curing under controlled conditions, during which the aluminum-based foaming reagent ensured pore stability. This enhanced method simultaneously optimized material efficiency and energy consumption, while maintaining the lightweight and insulative properties characteristic of ALC. The steps for ALC production are shown in
Figure 1.
The adopted production procedure emphasized reducing drying time, minimizing environmental impact, and ensuring scalability by incorporating recycled inputs while eliminating the need for energy-intensive curing processes. The final mixture compositions for both sets are summarized in
Table 1. This experimental design facilitated a systematic comparison between untreated and treated sands, enabling evaluation of thermal conductivity, bulk density, porosity, and compressive strength of the resulting ALC blocks.
2.2. Sample Preparation
All raw materials were weighed using a high-precision analytical balance to ensure accurate proportions. The dry components, namely sand, cement, calcium hydroxide (Ca(OH)2), calcium oxide (CaO), and glue, were first homogenized by manual stirring, after which water was gradually introduced and blended using a mechanical mixer until a uniform paste was obtained. The samples were dried at 80 °C for 25 min under airflow velocity of 1.2 m/s and relative humidity of 40% using a Memmert UF110 oven (Memmert GmbH + Co. KG, Schwabach, Germany). Aluminum powder was then incorporated at the final stage of mixing to induce aeration. The fresh mixture was subsequently poured into pre-lubricated molds to prevent adhesion and maintain dimensional stability. Following casting, the specimens were initially air-dried for one to two days before being subjected to short intervals of controlled chamber drying to eliminate residual moisture. Once fully dried, the samples were conditioned for testing; blocks prepared for compressive strength evaluation were further water-cured at 20–25 °C for 14 days prior to mechanical and thermal characterization.
The glass powder used in this study was obtained by grinding post-consumer soda–lime glass bottles and sieving the particles to sizes below 75 µm. SEM-EDS analyses confirmed that the powder was composed primarily of amorphous silica, with minor amounts of Na2O and CaO, consistent with standard soda, lime glass chemistry. The drying process for the aerated lightweight concrete samples was carried out under controlled environmental conditions at a temperature of approximately 80 °C, relative humidity of 40%, and an average airflow velocity of 1.2 m s−1. These controlled parameters ensured uniform moisture removal and reproducibility across all tested specimens.
2.3. Material Characterization
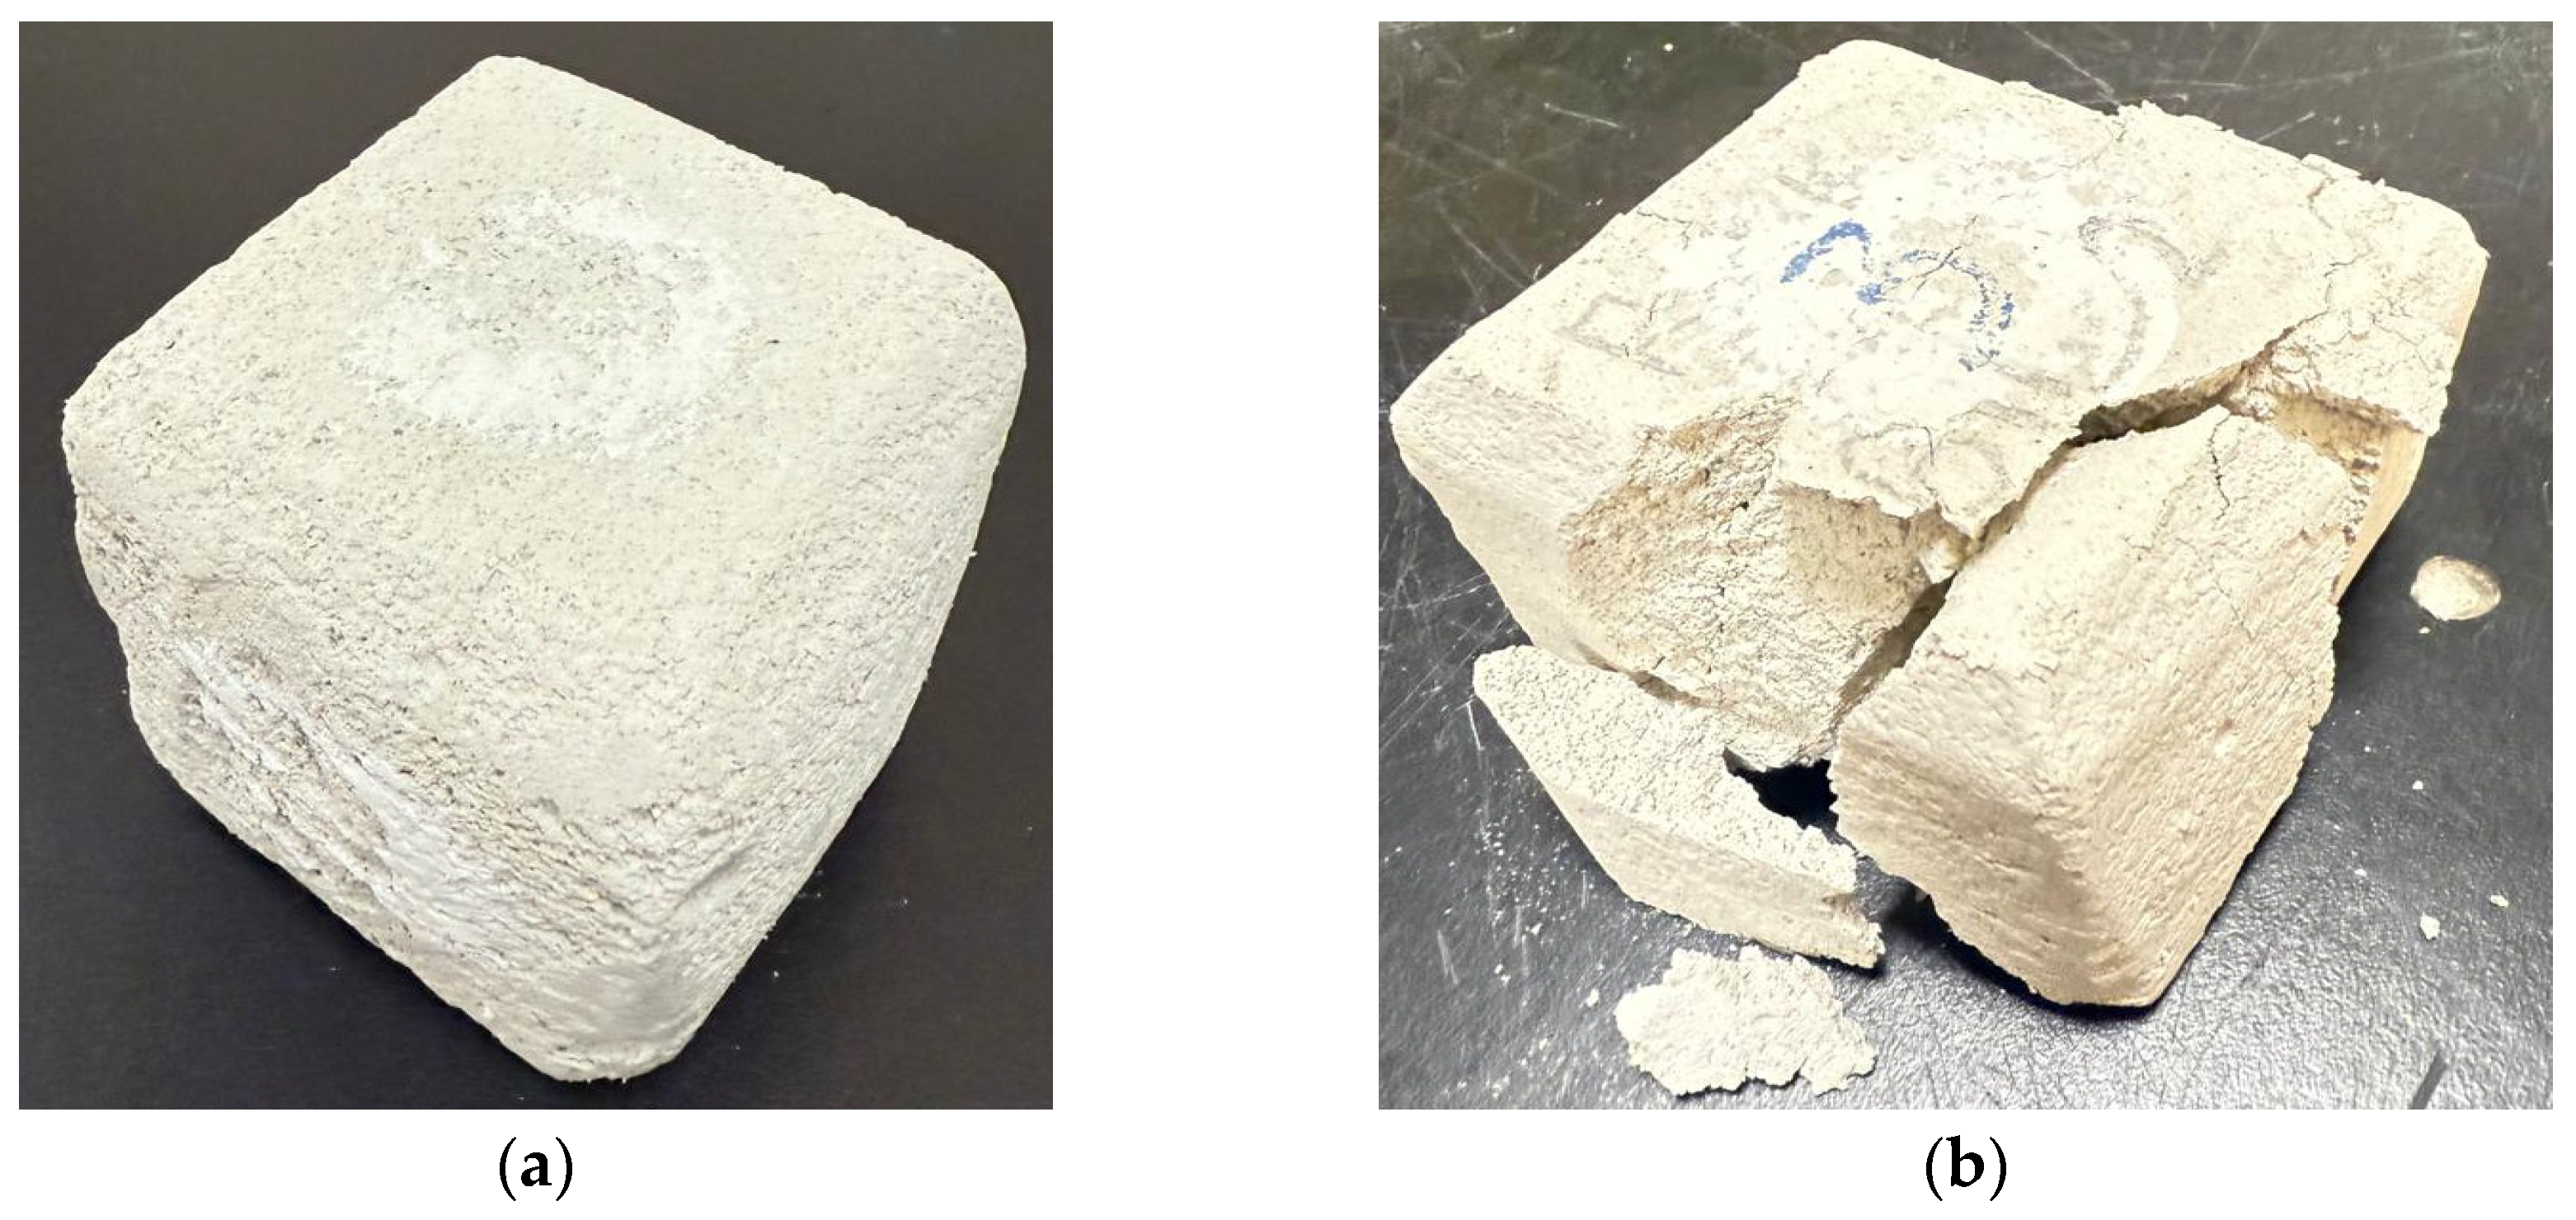
The drying behavior of the aerated concrete blocks was assessed using a laboratory drying unit and an analytical balance to monitor weight loss over time, with constant mass taken as the criterion for complete drying. Density was determined by dividing the mass of each specimen by the corresponding volume derived from mold dimensions. Porosity was evaluated through water absorption, expressed as the percentage increase in mass between the wet and dry states relative to the wet mass. Compressive strength testing was performed using a manual hydraulic compression machine operating on the Brinell Hardness principle, with a steel cylinder of 7 cm diameter employed to ensure uniform load distribution. Strength was calculated as the ratio of the maximum applied load to the cross-sectional area of the specimen. All strength measurements were conducted after 14 days of water curing, a duration sufficient to achieve approximately 85–90 percent of the 28-day strength.
Figure 2a shows the specimen before compression testing, while
Figure 2b illustrates the fractured specimen after testing.
Thermal conductivity was measured using a C-Therm TCI Analyzer (Model TCI-3A) (Fredericton, NB, Canada) following the Modified Transient Plane Source method. To ensure reliable contact between the probe and the specimen, thermal paste was applied, and multiple readings were obtained for each block to improve accuracy. This method proved particularly suitable for porous concrete and enabled robust comparison between treated and untreated sands.
All measurements (density, porosity, compressive strength, and thermal conductivity) were performed in triplicate, and the average values with deviations within ±5% were used to ensure data consistency and reliability.
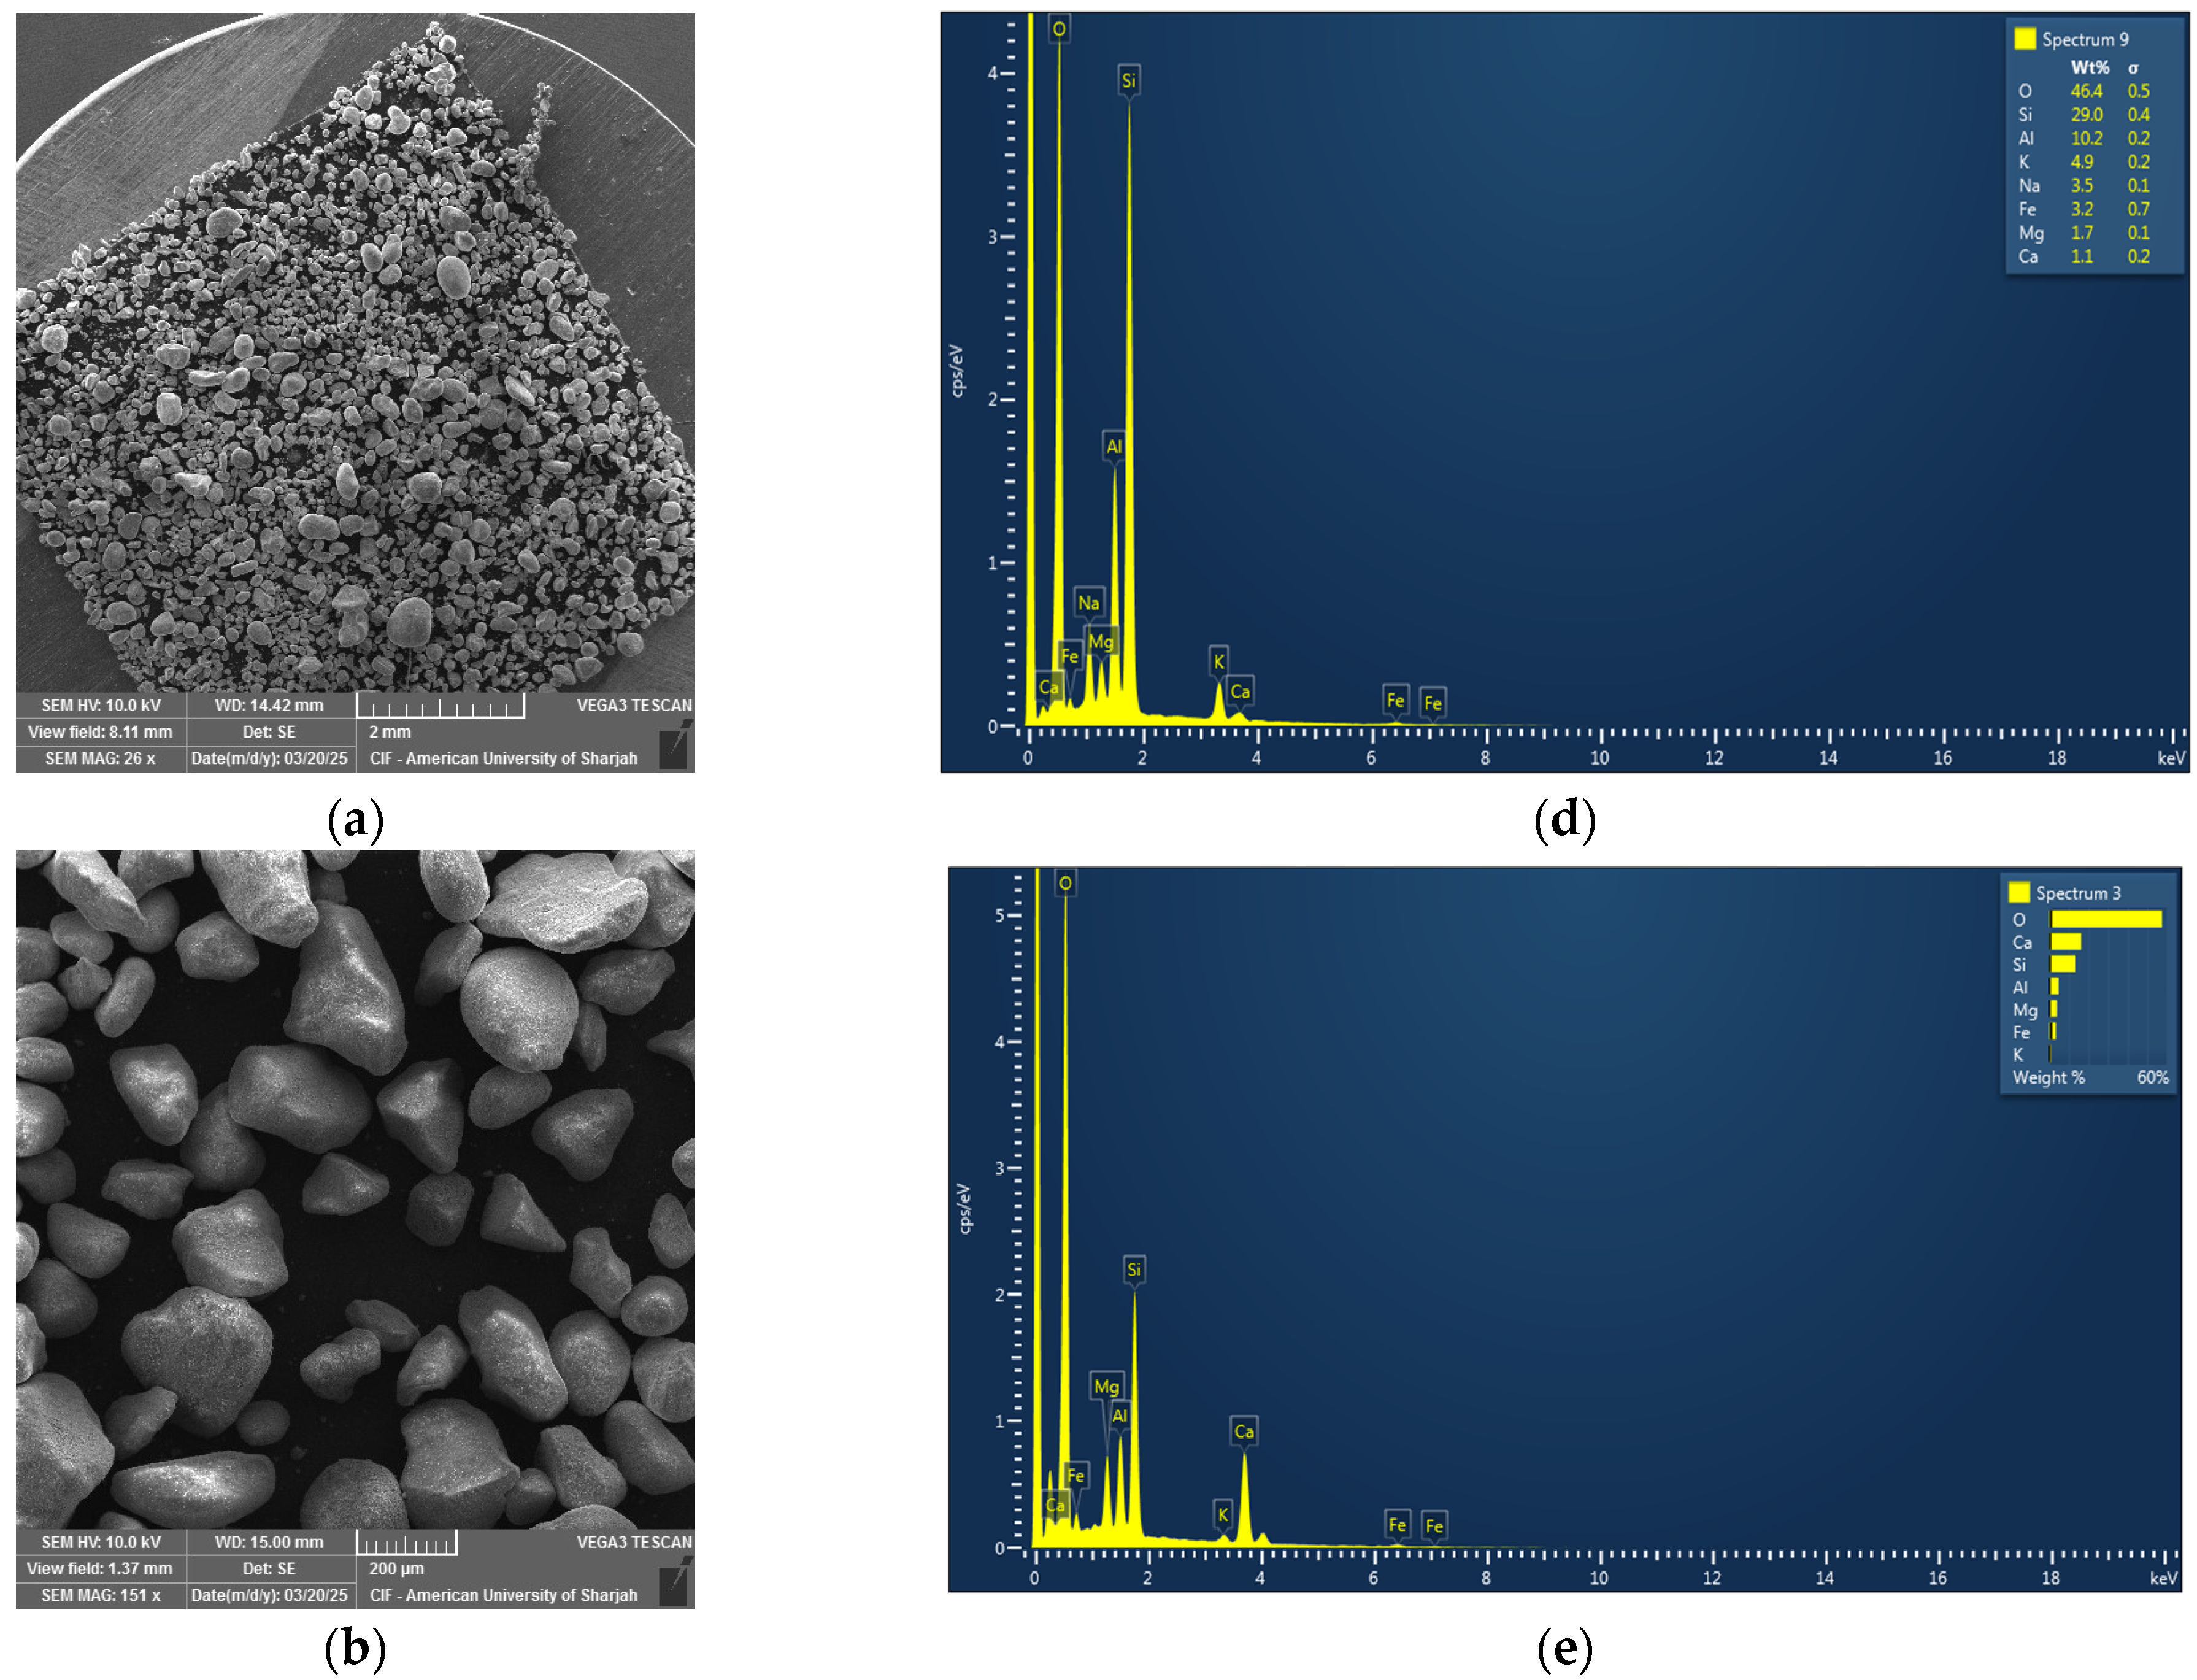
Sand samples were collected from nine locations as follows: UK, Abu Dhabi, Dubai, Sharjah, Ras Al Khaimah, Ajman, Umm Al Quwain, Mleiha, and Al Ain. These samples were characterized using scanning electron microscopy (SEM) in conjunction with energy-dispersive spectroscopy (EDS). The SEM observations revealed variations in particle size and morphology, with angular grains generally indicating higher silica content. Corresponding EDS spectra confirmed that all sands were dominated by silicon (Si) and oxygen (O), verifying silica as the principal constituent; however, minor elemental variations such as calcium (Ca), magnesium (Mg), and sodium (Na) were more evident in the UAE samples, suggesting higher levels of carbonate and salt impurities.
Figure 3a,b illustrates the SEM micrographs of a representative UAE sand sample at magnifications of 26× and 150×, respectively, while
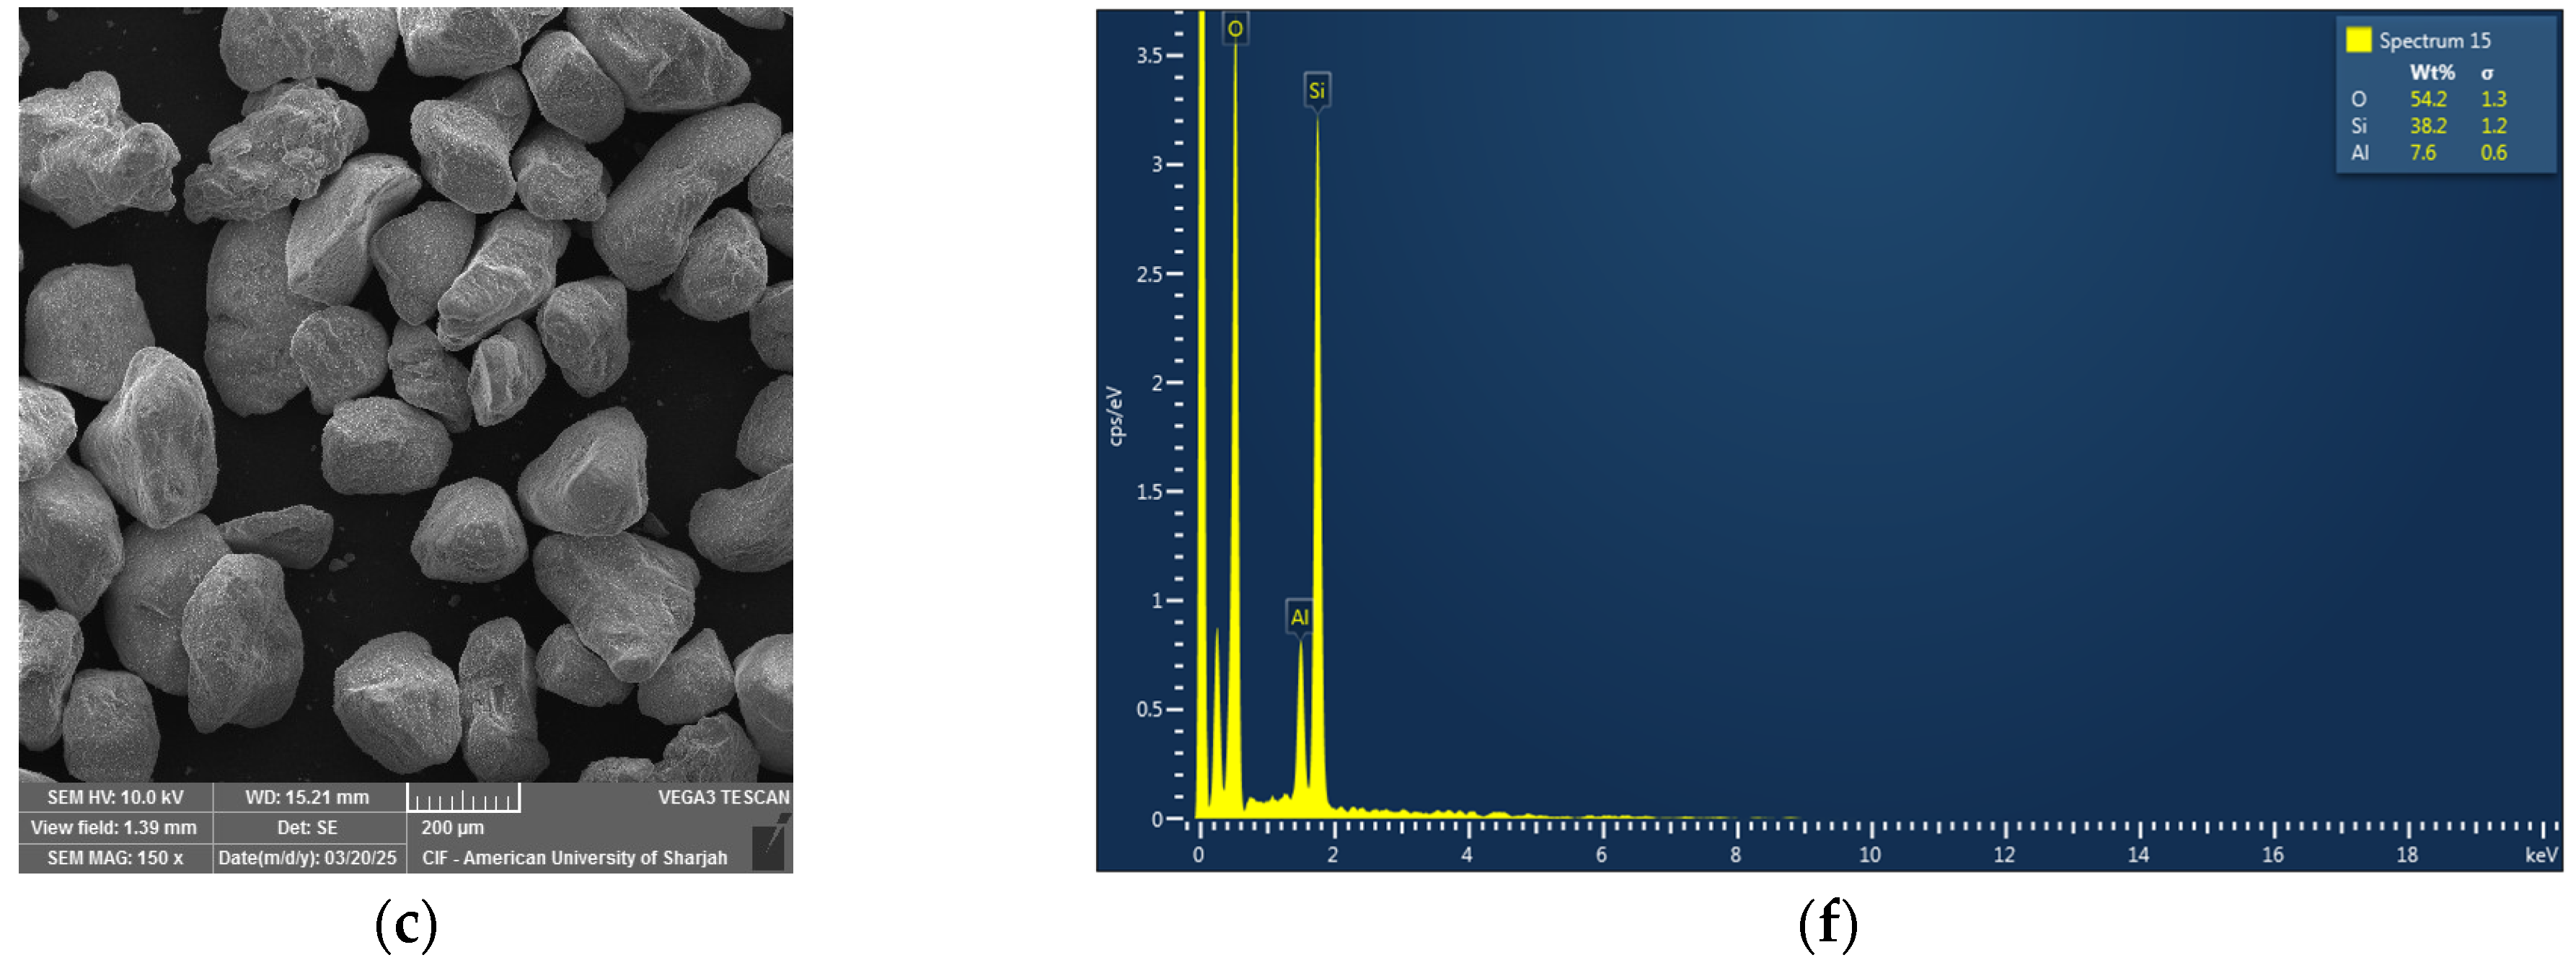
Figure 3c shows the SEM image of the representative UK sand sample.
Figure 3d–f present the corresponding EDS spectra, comparing the elemental compositions of the UAE and UK sands. The inclusion of the UK sample provides a silica-rich benchmark for comparison, enabling evaluation of the modified mix’s adaptability to sands of differing purity and geological origins.
Additionally, to support the discussion on porosity and density variations, SEM analysis of the final ALC product was performed. The observations revealed a well-developed pore network with predominantly spherical voids uniformly distributed throughout the matrix, indicating effective aeration during the formation process. A more detailed discussion and interpretation of these findings are presented in the following section.
3. Results and Discussion
To ensure a coherent interpretation of the experimental findings, this section has been organized to establish clear connections between material origin, processing method, and resulting concrete properties. The presentation of data follows a consistent sequence, beginning with drying behavior, followed by porosity, density, compressive strength, and thermal conductivity. This structure facilitates direct comparison between samples and highlights how regional variations in sand composition and processing conditions influence the overall performance of the aerated lightweight concrete. The research methodology described in
Section 2 provides complete experimental parameters supporting these results, while redundant or ambiguous data were refined to maintain clarity and logical continuity throughout the discussion.
3.1. Drying Rate Analysis
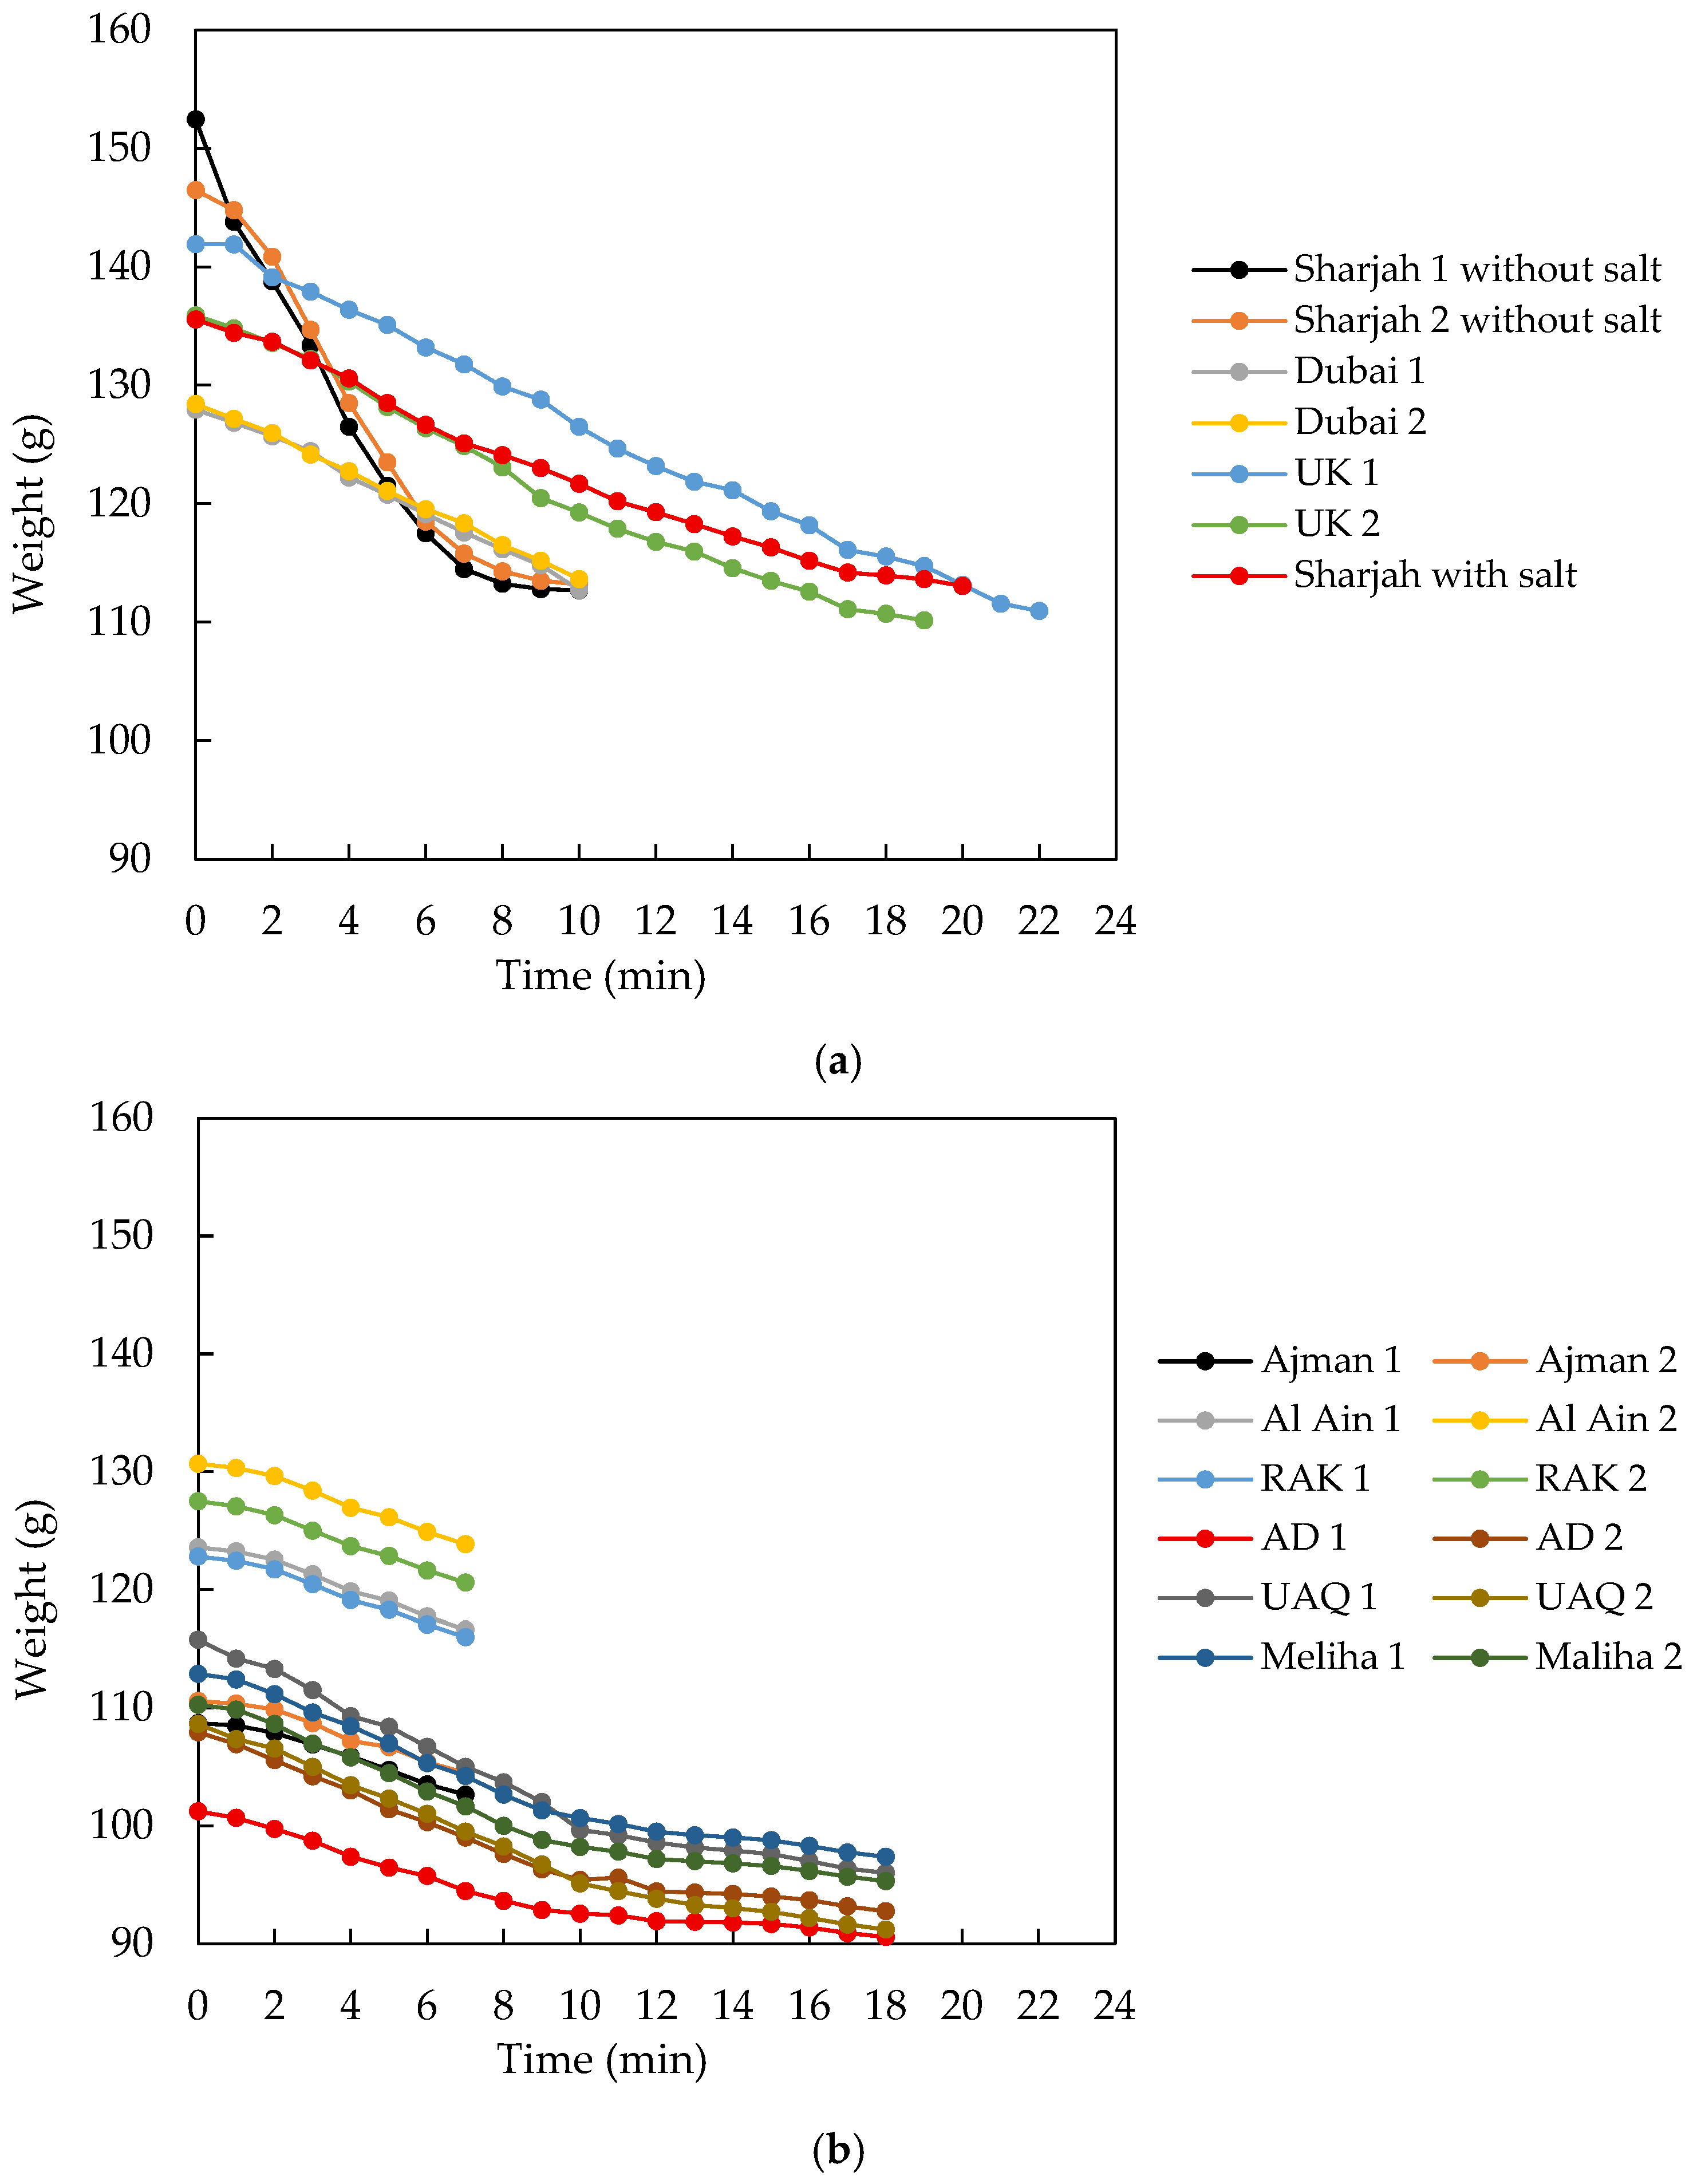
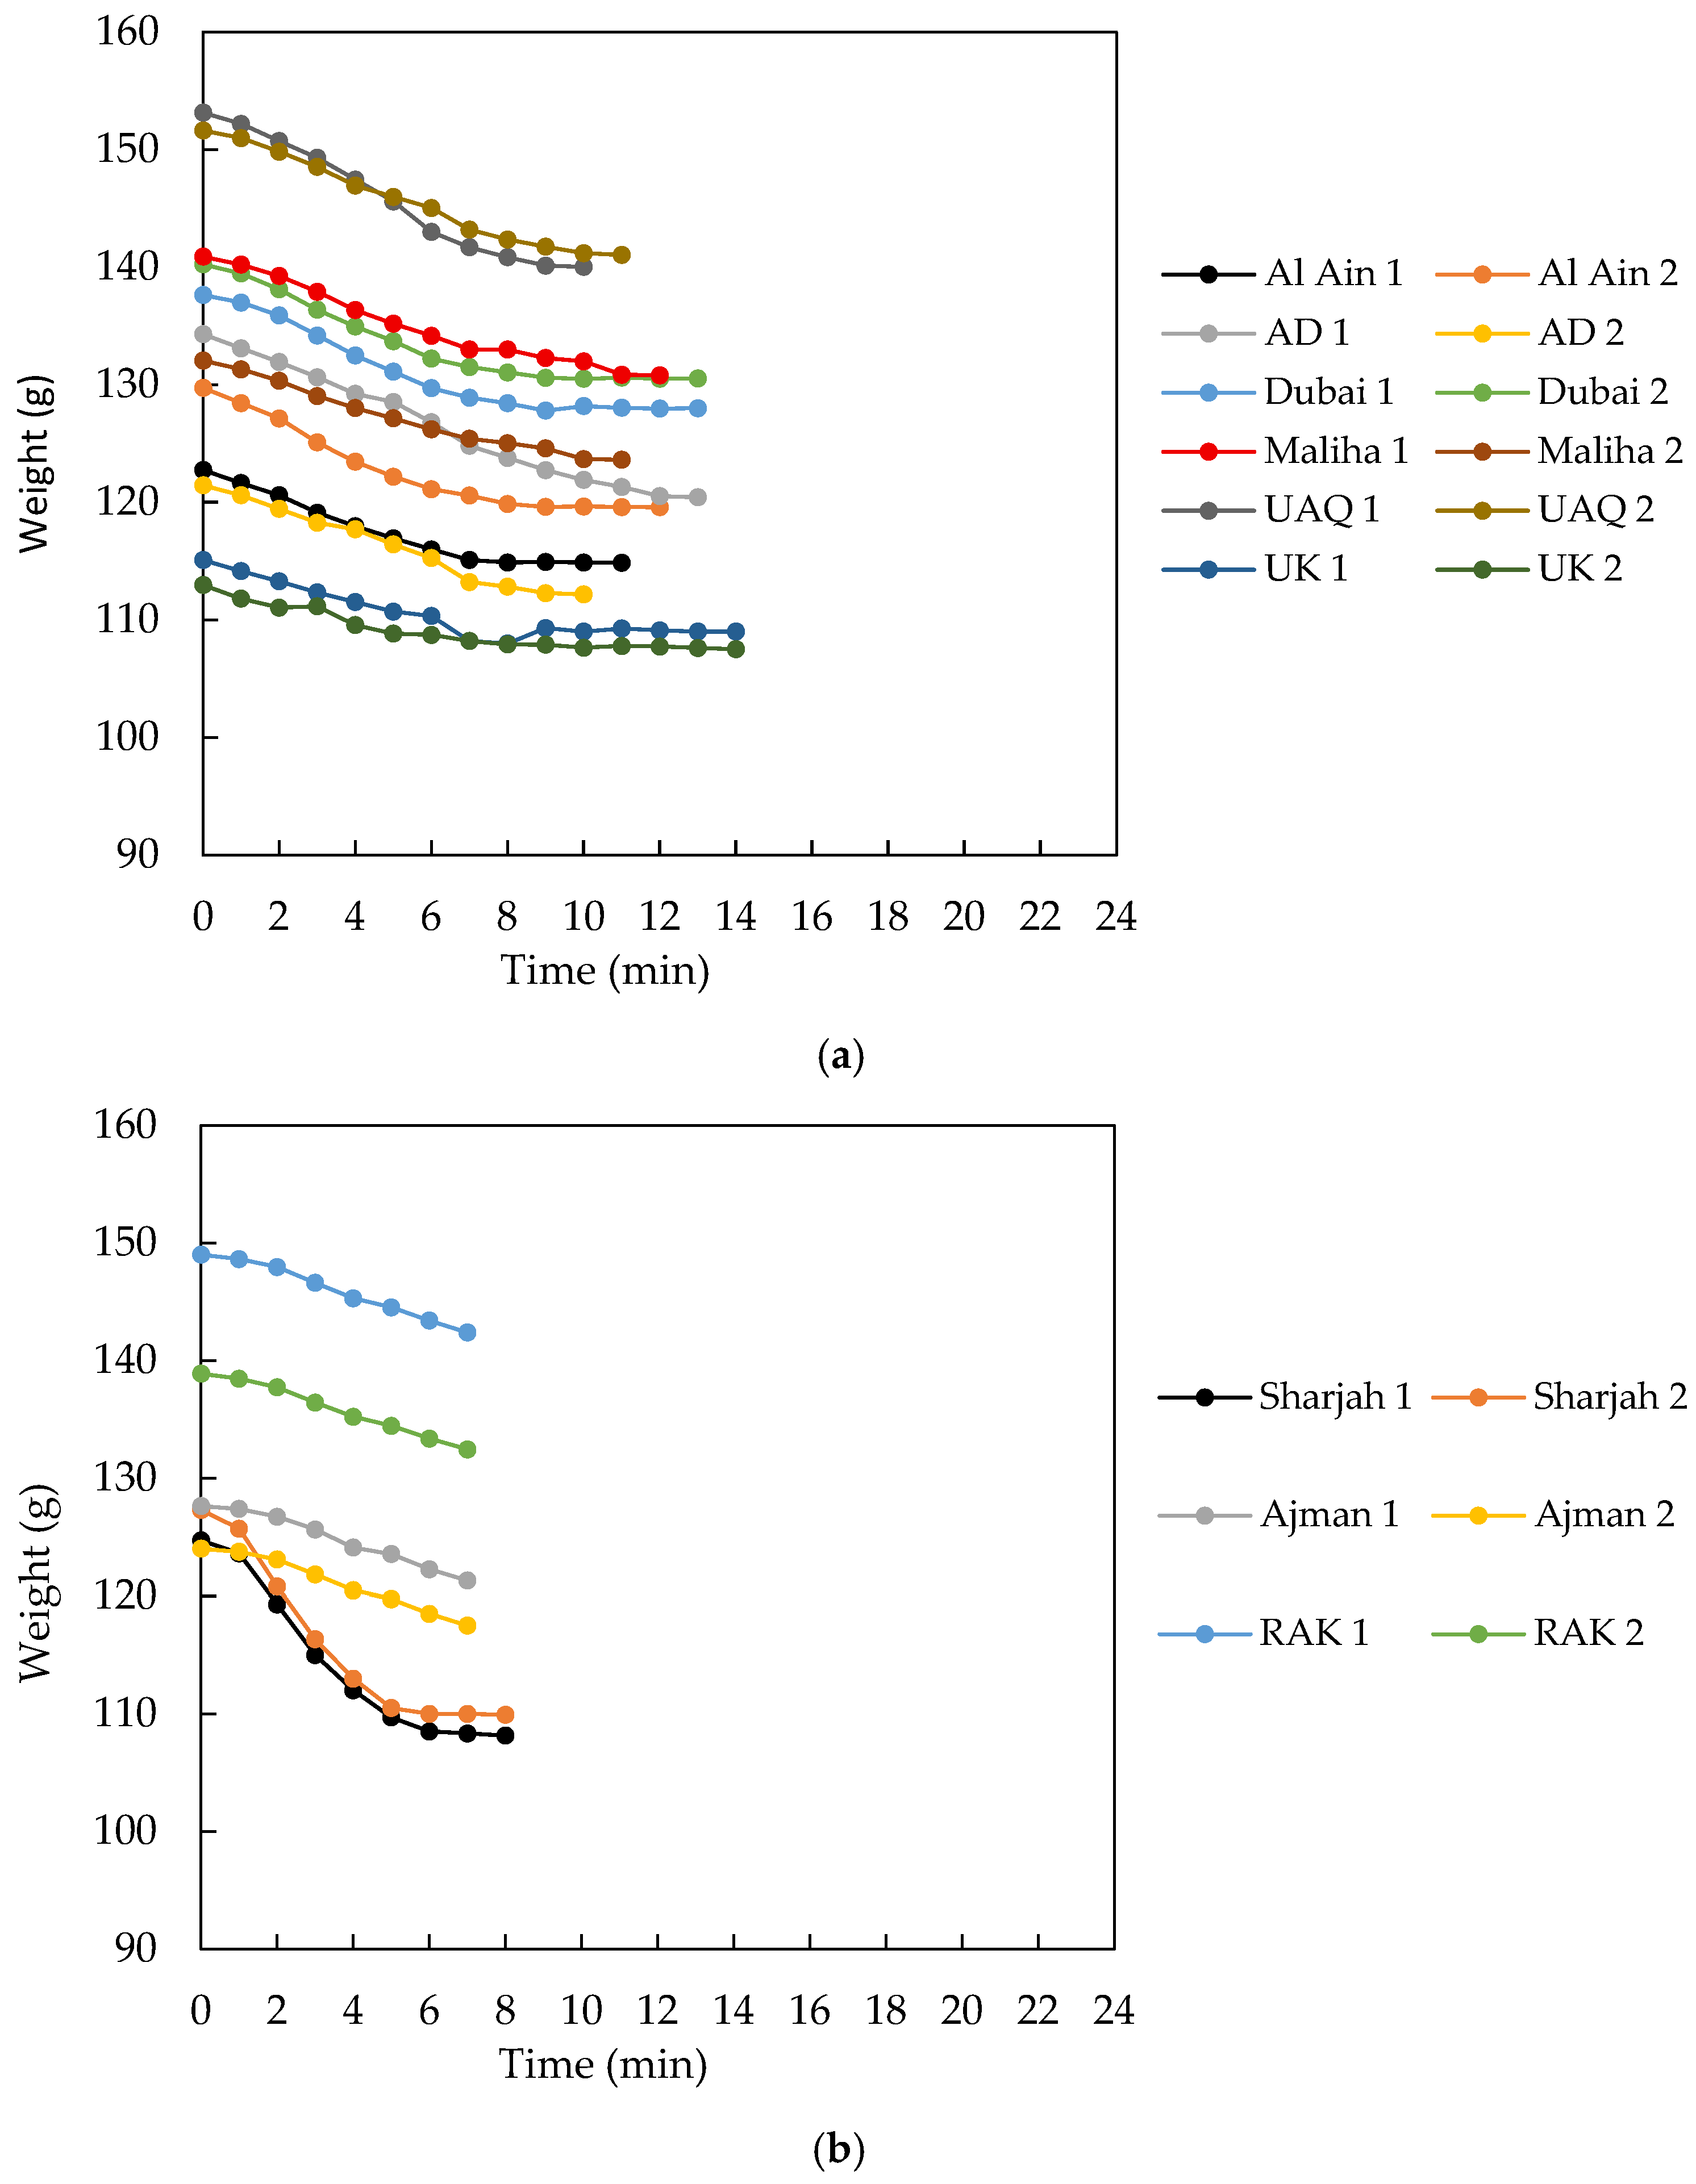
The drying behavior of the aerated concrete blocks was evaluated by monitoring weight reduction over time, as illustrated in
Figure 4 and
Figure 5. In both sets of samples, moisture loss followed the general principles of heat and mass transfer, beginning with migration of water from the material’s interior to the surface, followed by surface evaporation. As expected, higher drying rates reflected faster moisture removal, which was strongly influenced by environmental parameters such as temperature, humidity, and airflow, as well as by the intrinsic properties of the material [
16,
17,
18].
In Set 1, the drying profiles demonstrated typical non-linear behavior, characterized by an initial period of rapid evaporation followed by a slower falling-rate stage [
19]. Sharjah 1 and Sharjah 2 samples (without salt) displayed pronounced early mass loss, decreasing from 152.44 g to 143.79 g and from 146.49 g to 144.78 g, respectively, which indicates rapid surface evaporation during the initial stage. Dubai 1 and Dubai 2 samples dried more quickly compared with Sharjah specimens, likely due to local environmental conditions such as higher ambient temperature and lower humidity [
20]. In contrast, Sharjah Salt samples dried more gradually, with mass decreasing from 135.56 g downward, a trend attributed to the hygroscopic nature of salt, which retains moisture and reduces evaporation efficiency [
21,
22].
Figure 5a,b displays the drying profiles of Set 2 samples from different regions. Set 2 samples exhibited broadly similar drying patterns but with clearer regional distinctions. Al Ain specimens showed slower initial moisture loss (123.58 g to 121.63 g and 130.67 g to 128.43 g), which may be linked to the higher relative humidity typical of this region. RAK samples demonstrated a sharper early drop (149.01 g to 148.63 g), consistent with faster drying under warmer conditions. Sharjah samples once again displayed a more gradual drying trend, with updated measured values (initial mass 126.4 g decreasing to 123.8 g), confirming slower moisture loss compared with Dubai and RAK specimens. Overall, the results from both sets confirm the strong influence of environmental conditions and salt content on drying performance. Dubai and RAK samples consistently achieved faster drying than Sharjah and Al Ain, while the presence of salt delayed evaporation by retaining internal moisture. The drying behavior observed here aligns with established models, which describe a transition from free-water removal at a higher rate to slower bound-water release as drying progresses [
23]. The observed variations in drying behavior among samples can be attributed, in part, to the distinct climatic conditions of the regions from which the sands were collected. The UAE regions generally experience an arid desert climate, characterized by high temperatures (average 32–40 °C), low annual precipitation (<100 mm), and relative humidity ranging from 45% to 65%. Among these, coastal areas such as Dubai, Sharjah, and Umm Al Quwain typically exhibit higher humidity due to marine influence, while inland regions like Al Ain and Mleiha are drier and hotter, promoting faster moisture evaporation. In contrast, the UK has a temperate maritime climate, with moderate temperatures (10–20 °C), frequent rainfall (600–1000 mm annually), and high relative humidity (70–90%). These climatic differences provide context for the observed mass-loss trends in
Figure 4 and
Figure 5, where samples from hotter, drier regions exhibited accelerated drying, whereas those from more humid environments retained moisture for a longer period. Importantly, the modified curing procedure employed in this study reduced total drying time from the conventional 48 h to approximately 25 min. This significant improvement highlights the efficiency and reliability of the proposed approach in achieving rapid and uniform moisture removal across different sand sources and foam concrete compositions.
To provide a clearer quantitative comparison of the drying performance across regions, the percentage weight loss for each sample was calculated based on the data presented in
Figure 4 and
Figure 5. The results showed that samples from hotter and drier regions, such as Dubai and RAK, experienced the greatest moisture reduction, with weight losses typically ranging between 1.5% and 2%. In contrast, samples from more humid regions like Sharjah and Al Ain exhibited smaller decreases, generally below 1.5%. These differences confirm that local climatic conditions significantly influenced drying behavior, with elevated temperature and lower humidity promoting faster moisture evaporation.
3.2. Density Analysis
Density (ρ) is a fundamental physical property that significantly influences the mechanical, thermal, and structural performance of construction materials. In general, higher-density materials exhibit superior compressive strength and thermal mass, whereas lower-density materials offer improved insulation characteristics. The densities of the blocks examined in this study were determined based on a constant sample volume of 125 cm
3 and standardized dimensions of 5 × 5 × 5 cm for Set 1 and Set 2. The measured densities for both sets are displayed in
Table 2.
In Set 1, density values ranged from 0.72448 g/cm3 (AD 1) to 1.01196 g/cm3 (UK 1). In contrast, Set 2 exhibited slightly higher values, ranging from 0.86001 g/cm3 (UK 2) to 1.13912 g/cm3 (RAK 1). This general increase in density in Set 2 may reflect variations in raw material composition, mixing techniques, curing conditions, or compaction methods. For instance, the RAK 1 sample in Set 2 shows a substantial increase in density compared to its Set 1 counterpart (1.13912 g/cm3 vs. 0.92808 g/cm3), likely due to improved compaction or reduced porosity. Similarly, the AD samples exhibited notable differences: AD 1 increased from 0.72448 g/cm3 in Set 1 to 0.96346 g/cm3 in Set 2, suggesting inconsistencies in material formulation or handling.
According to the literature, the density of lightweight concrete typically ranges from 0.8 to 1.4 g/cm
3, while normal-weight concrete falls between 2.2 and 2.4 g/cm
3 [
24]. The values observed in this study confirm that all samples fall within the lightweight category, reinforcing their suitability for non-structural applications such as insulation panels or partition walls where reduced weight is advantageous.
The influence of regional materials is also evident. For example, the presence of salts in the Sharjah samples may have altered water absorption and porosity, thereby impacting overall density. Higher-density samples, such as those from RAK and UAQ in Set 2, suggest a more compact internal structure with potentially enhanced mechanical performance. Conversely, lower-density blocks, like AD 1 in Set 1, imply greater porosity and reduced strength, which might be beneficial in thermal insulation applications. Overall, the results underscore the importance of controlling material sources, mixture proportions, and curing protocols to achieve targeted physical properties in lightweight construction materials.
3.3. Porosity Test Results
Porosity is a critical material property influencing density, strength, water absorption, and thermal performance. It is defined as the percentage of void space within a material and is calculated based on the difference between the wet and dry weights of the sample. Higher porosity typically indicates more open internal structures, which may benefit applications requiring lightweight or absorbent materials but can compromise mechanical strength.
Table 3 and
Table 4 present the porosity values for Set 1 and Set 2, respectively.
The data reveal regional trends. Blocks from UAQ, Meliha, and Sharjah showed consistently high porosity (>22%), indicating more open internal structures, potentially beneficial for insulation or moisture retention. Conversely, RAK and Ajman samples exhibited low porosity (<7%), suggesting higher density and better mechanical strength. Notably, porosity values for UK samples increased significantly from Set 1 to Set 2, possibly due to batch or preparation differences. Overall, porosity variation highlights the influence of raw materials and processing methods on final material properties, supporting tailored use in specific construction applications.
A direct comparison between the results of Set 1 and Set 2 further emphasizes the impact of glass-powder enrichment on pore structure. On average, Set 2 samples exhibited a 15–20% reduction in porosity compared with their Set 1 counterparts, indicating that silica enrichment and improved binder–sand interaction promoted a denser microstructure. This reduction in pore volume is consistent with the enhanced strength and thermal performance observed in subsequent sections, confirming that the modified mix design effectively reduced internal voids and improved overall material compactness. Compared to the UAE samples, the UK sands exhibited notably lower porosity values (
Table 3 and
Table 4), reflecting their higher silica content and minimal salt impurities. These characteristics contributed to denser microstructures and improved strength potential.
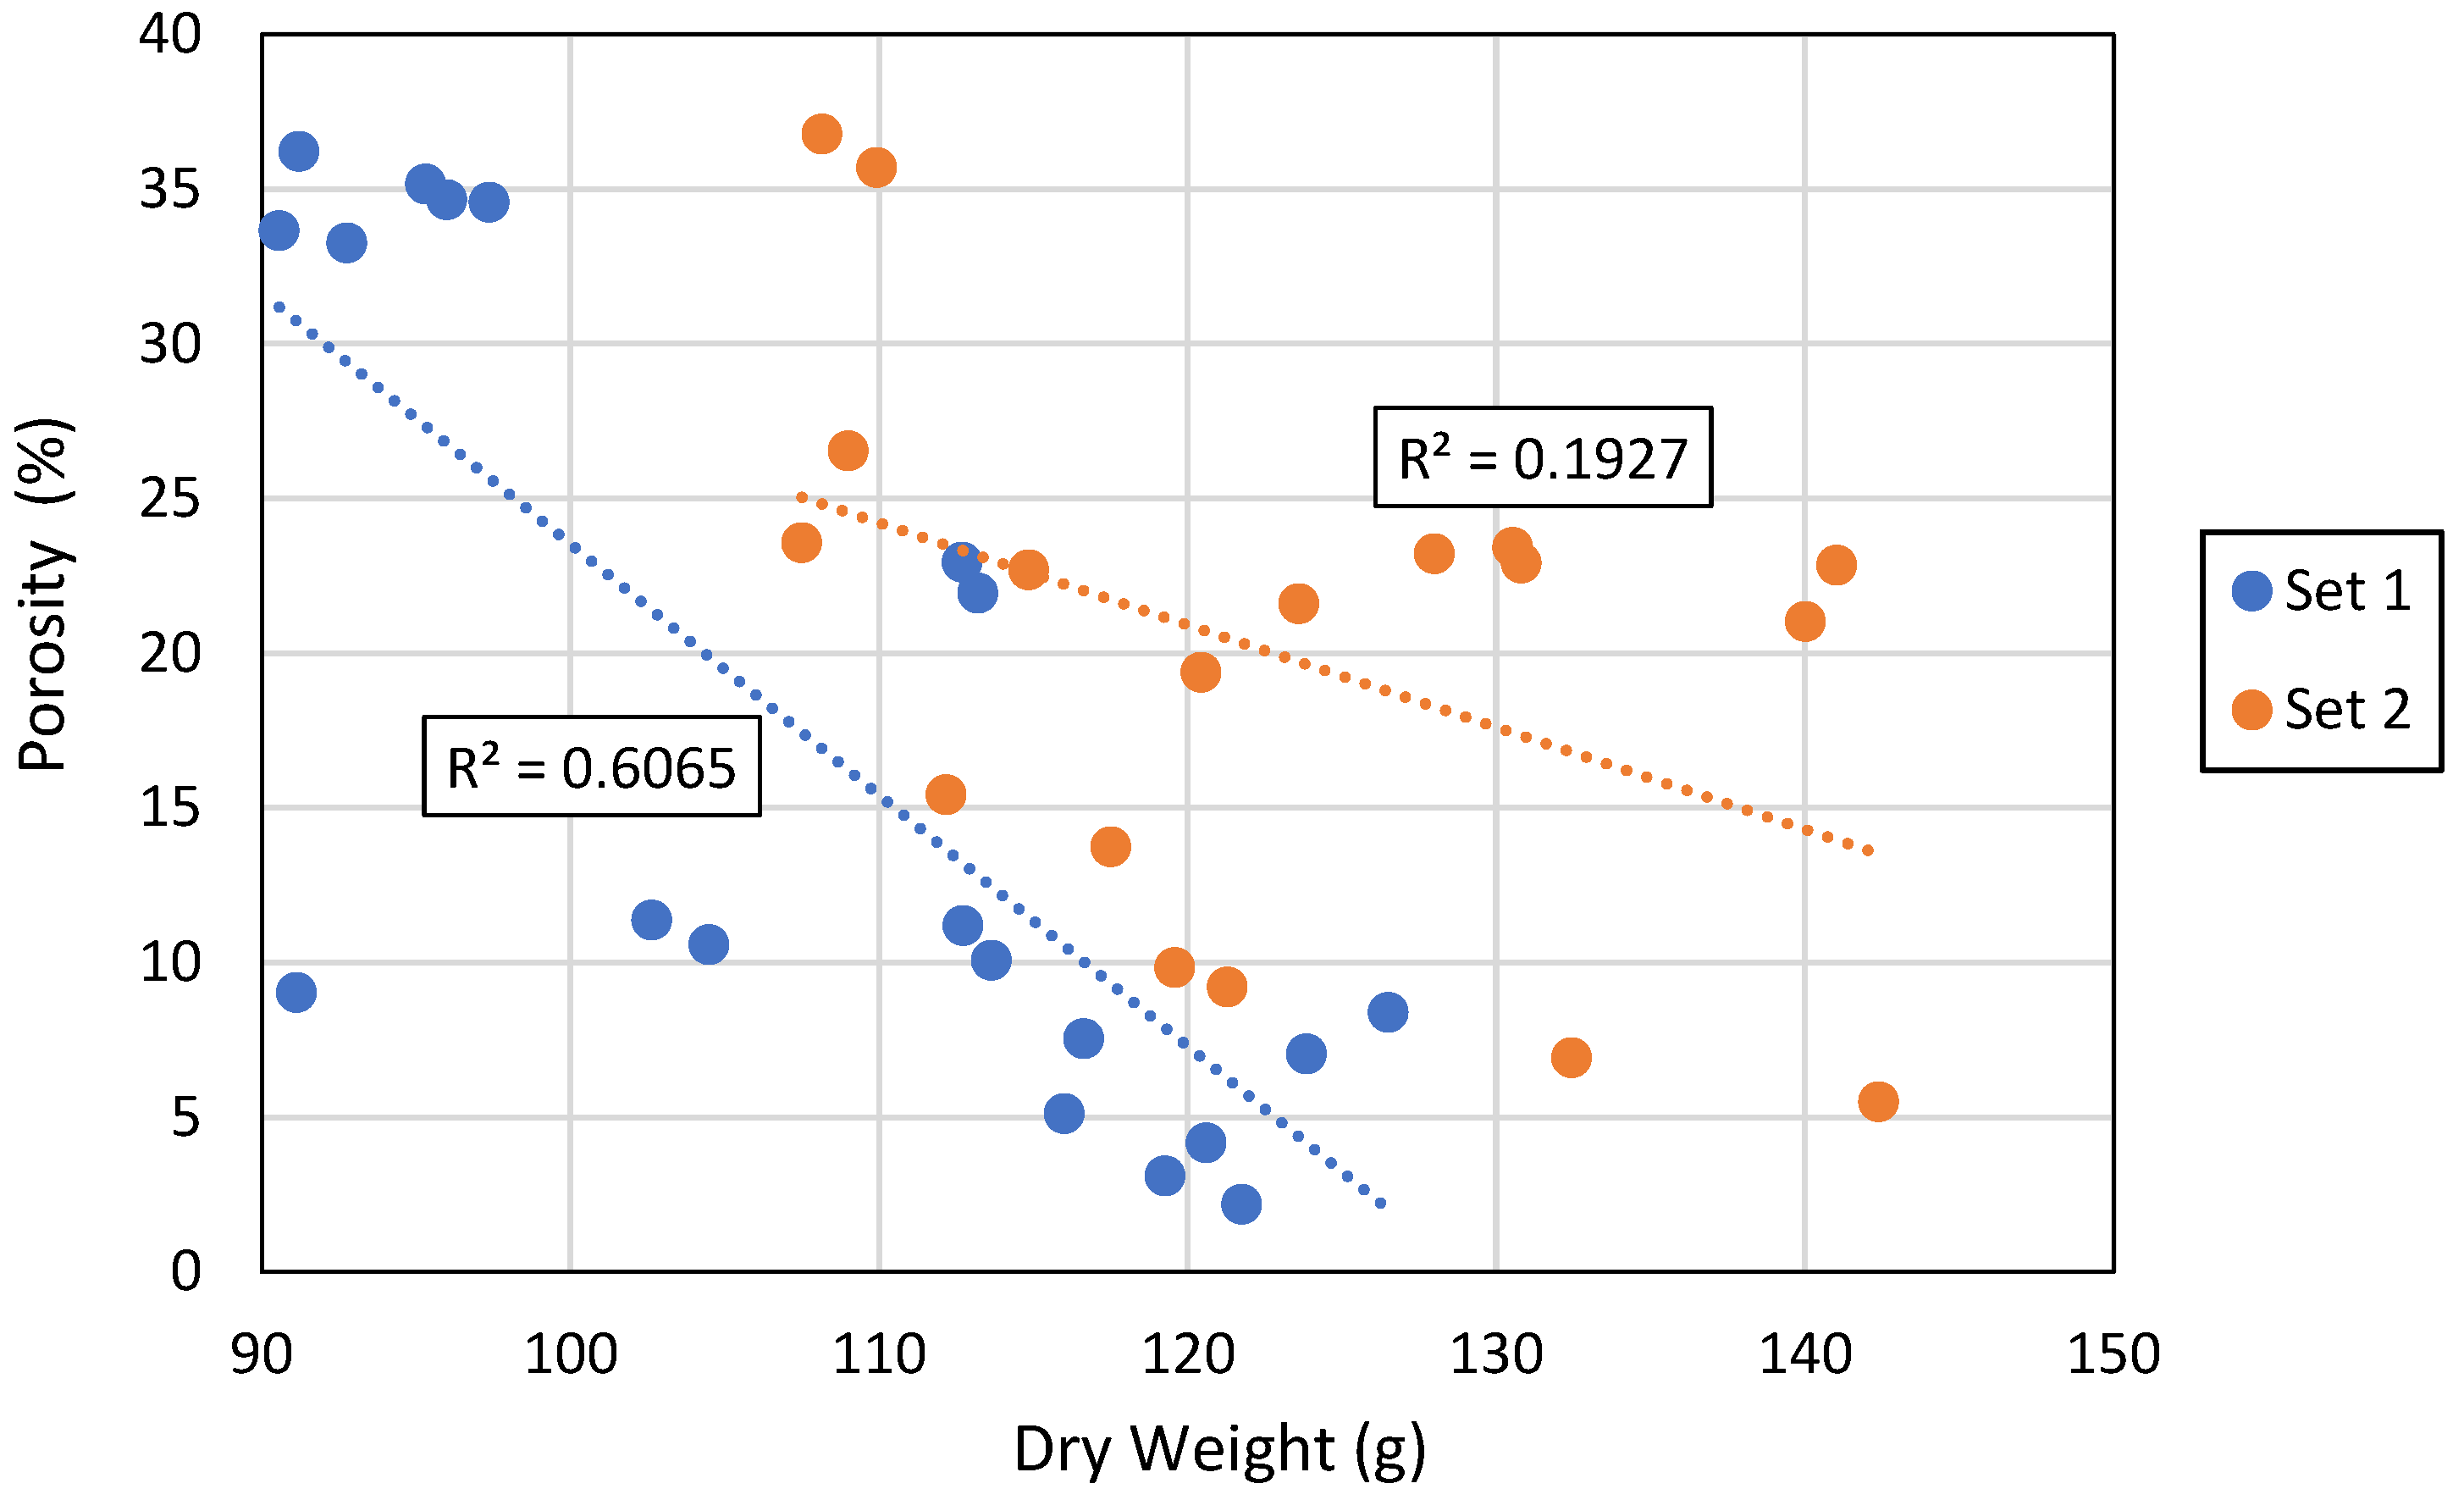
Figure 6 further illustrates the inverse relationship between dry weight and porosity for both Sets 1 and 2. A strong negative correlation (R
2 = 0.61) was observed for Set 1, indicating that as the dry weight increased, the porosity significantly decreased, confirming that denser blocks possessed fewer internal voids. This relationship was less pronounced for Set 2 (R
2 = 0.19), suggesting higher variability likely resulting from the modified mix proportions and foaming consistency. The overall trend reinforces the expected interdependence between mass and pore volume, where higher dry weight corresponds to reduced porosity and improved compactness. Such a pattern aligns with the observed increases in compressive strength and dry density reported in later sections, underscoring that enhanced material densification through optimized foaming control and silica enrichment directly contributes to superior mechanical performance and durability. This inverse relationship between dry density and porosity has been widely reported in the literature, where increased density is associated with reduced pore volume, improved compressive strength, and lower water absorption [
25].
3.4. Compressive Strength Test Results
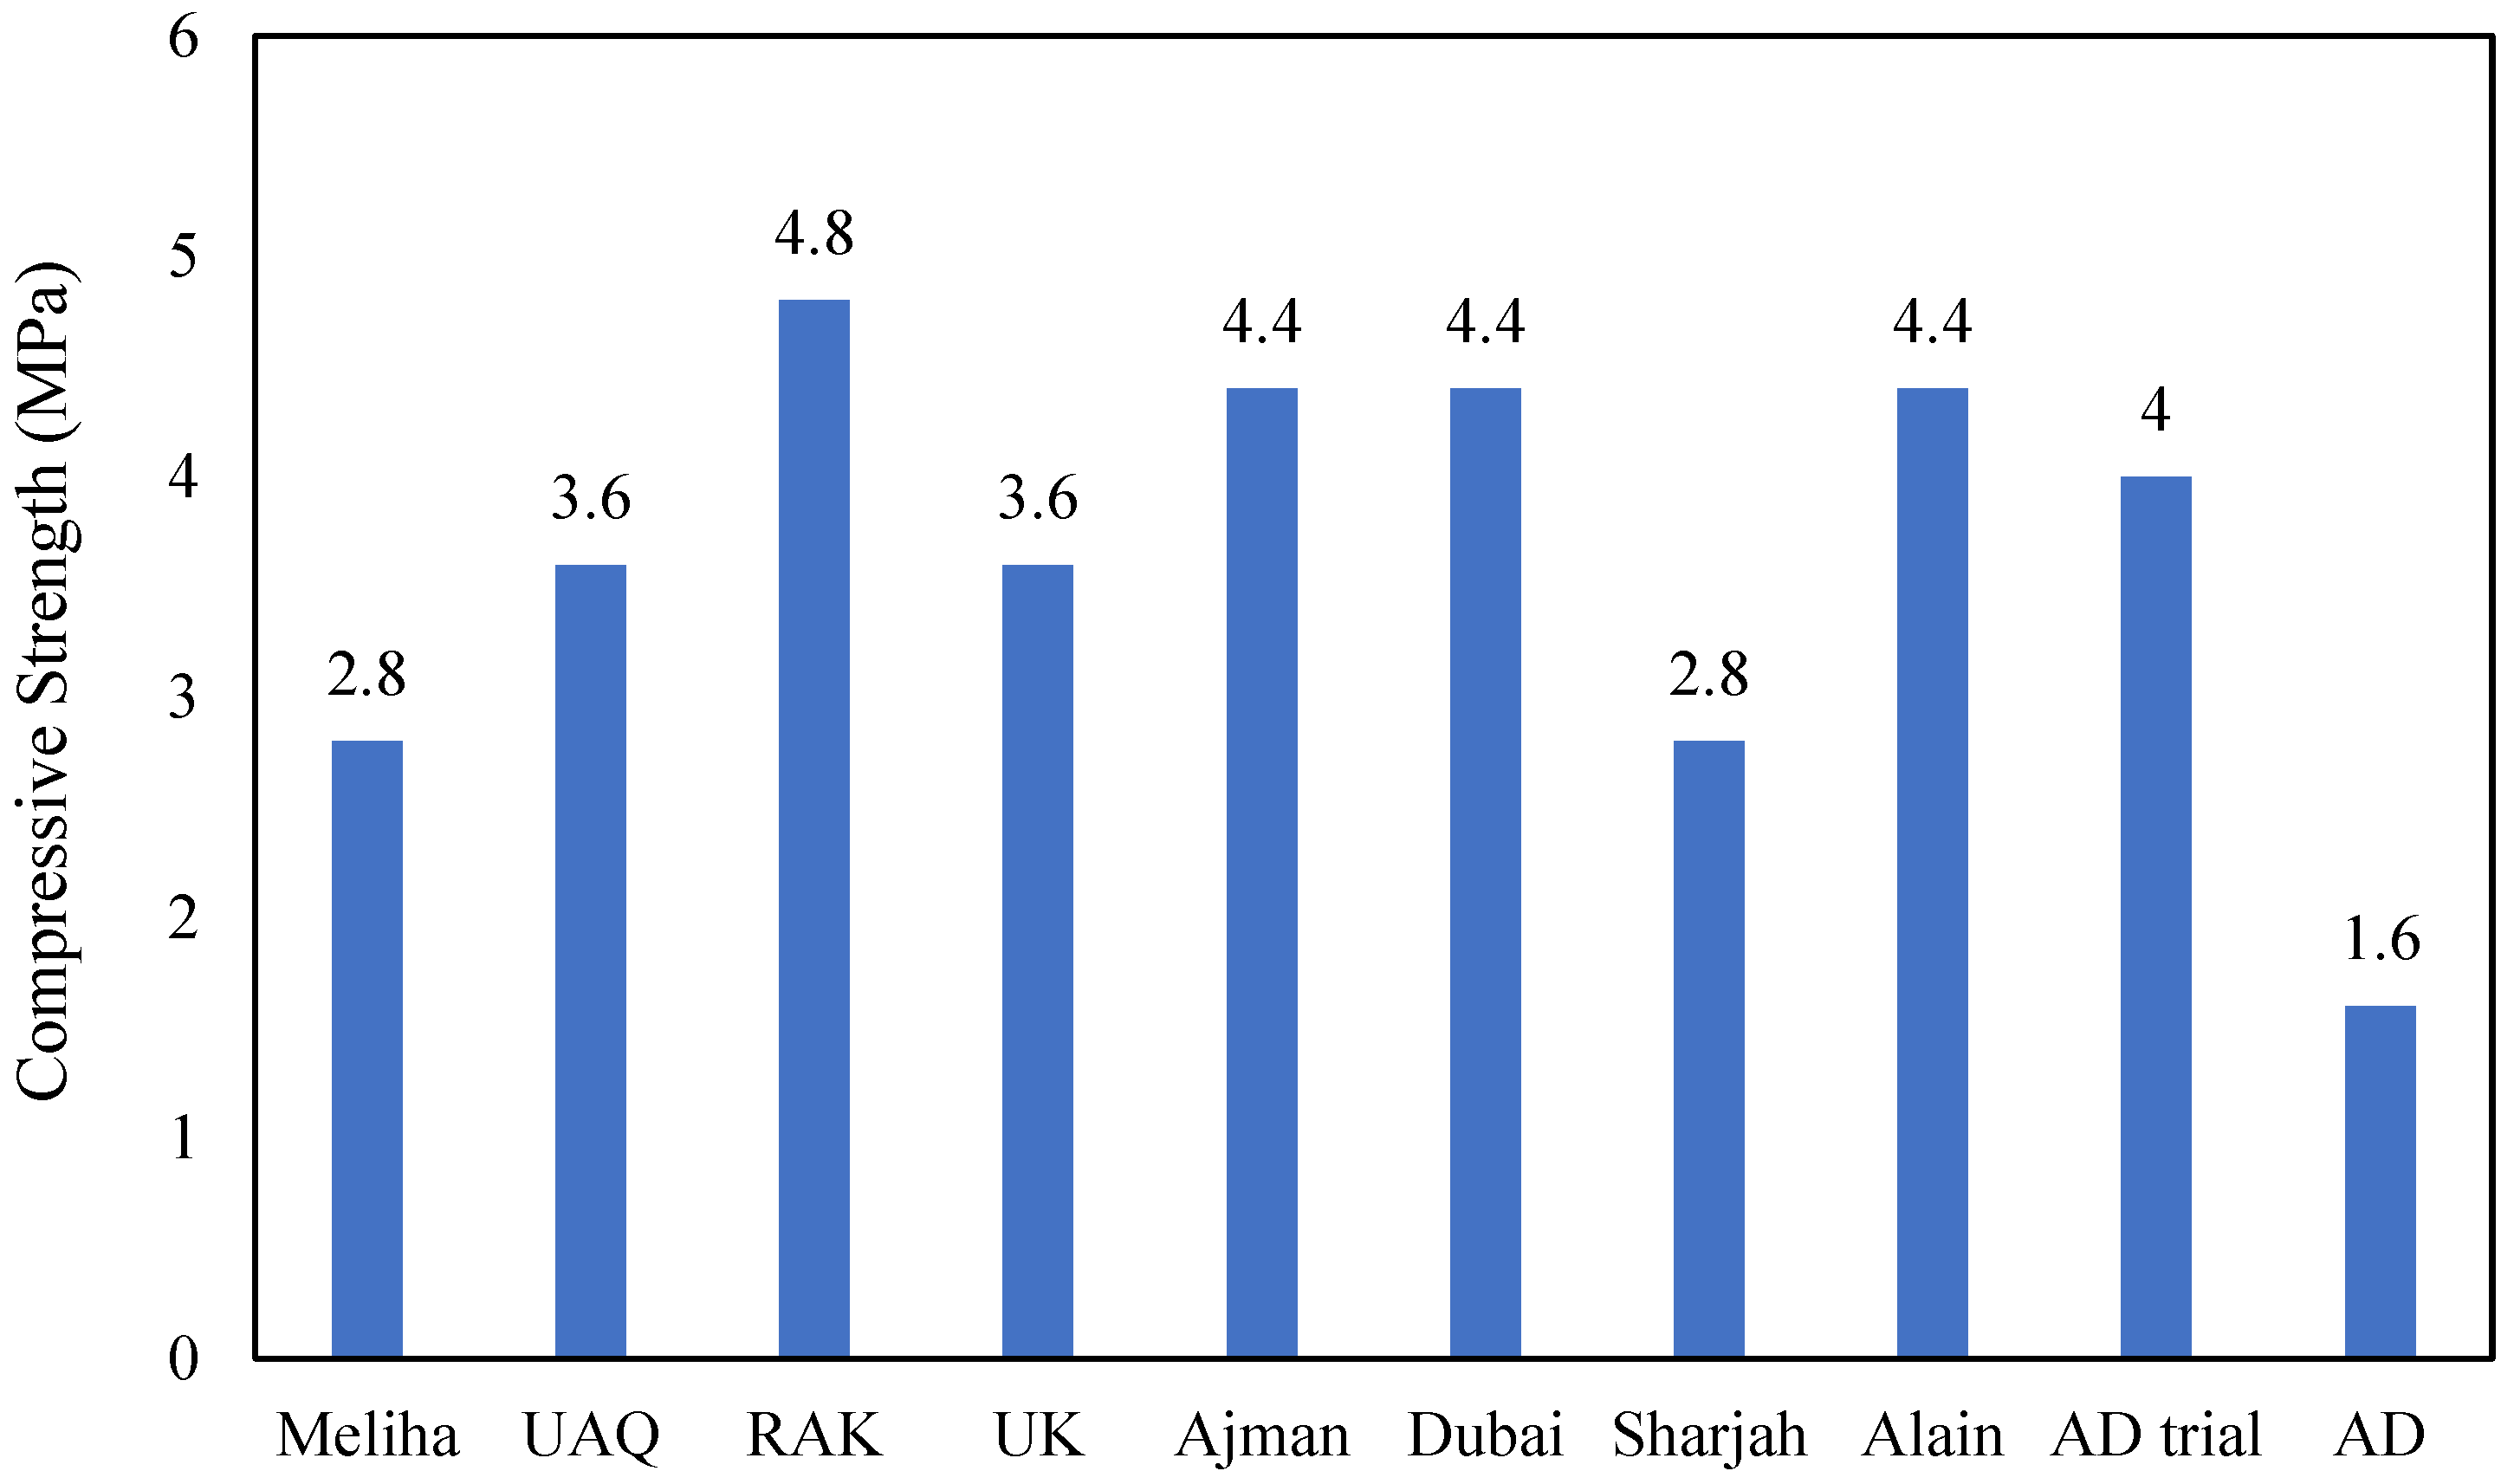
The compressive strength test results for Set 1 and Set 2 are summarized in
Figure 7, showing the compressive strength for each tested sample. The compressive strength values shown in
Figure 7 represent the meaning of three replicates for each region, combining results from both Set 1 and Set 2 to provide a concise comparative overview of regional performance. Compressive strength is a critical parameter for evaluating a material’s structural suitability. It reflects the material’s ability to resist deformation under axial loading and is especially important for applications involving masonry and concrete units.
The foam concrete samples demonstrated compressive strength values ranging from 1.6 MPa to 4.8 MPa. Most samples met or exceeded Dubai Municipality’s minimum standards for lightweight non-load-bearing masonry units (average ≥ 3.2 MPa, individual ≥ 2.6 MPa). RAK recorded the highest strength at 4.8 MPa, while Ajman, Alain, and Dubai followed with consistent values of 4.4 MPa. UK samples also demonstrated competitive compressive strength values, consistent with their high silica content and low impurity levels. Their performance further supports the observed correlation between silica enrichment and mechanical enhancement across all regions. Samples such as Mleiha and Sharjah, both revealing 2.8 MPa, were close to the minimum threshold, showing acceptable performance. The ‘cement with detergent’ mixture, developed during the exploratory phase, achieved 4.0 MPa, indicating the feasibility of using alternative foaming agents. A significant observation was the variation between the “AD” and “AD trial” samples. The control AD sample exhibited the lowest compressive strength at 1.6 MPa, whereas the “AD trial”, produced by reducing the aluminum powder content by 0.3 g, achieved a markedly higher strength of 4.0 MPa. This highlights the importance of optimizing aluminum dosage to control pore structure and enhance mechanical performance.
The proposed method produced a 35% increase in compressive strength, accompanied by a significant reduction in drying time and energy use. The estimated energy consumption dropped by approximately 95%, as the drying duration decreased from 48 h in conventional curing to only 25 min. Moreover, based on the reduced cement demand and shorter thermal-processing time, the embodied CO2 emissions are expected to decrease by 20–25% compared with conventional ALC production. These values demonstrate the practical advantages of the technique and its relevance for sustainable, large-scale construction applications.
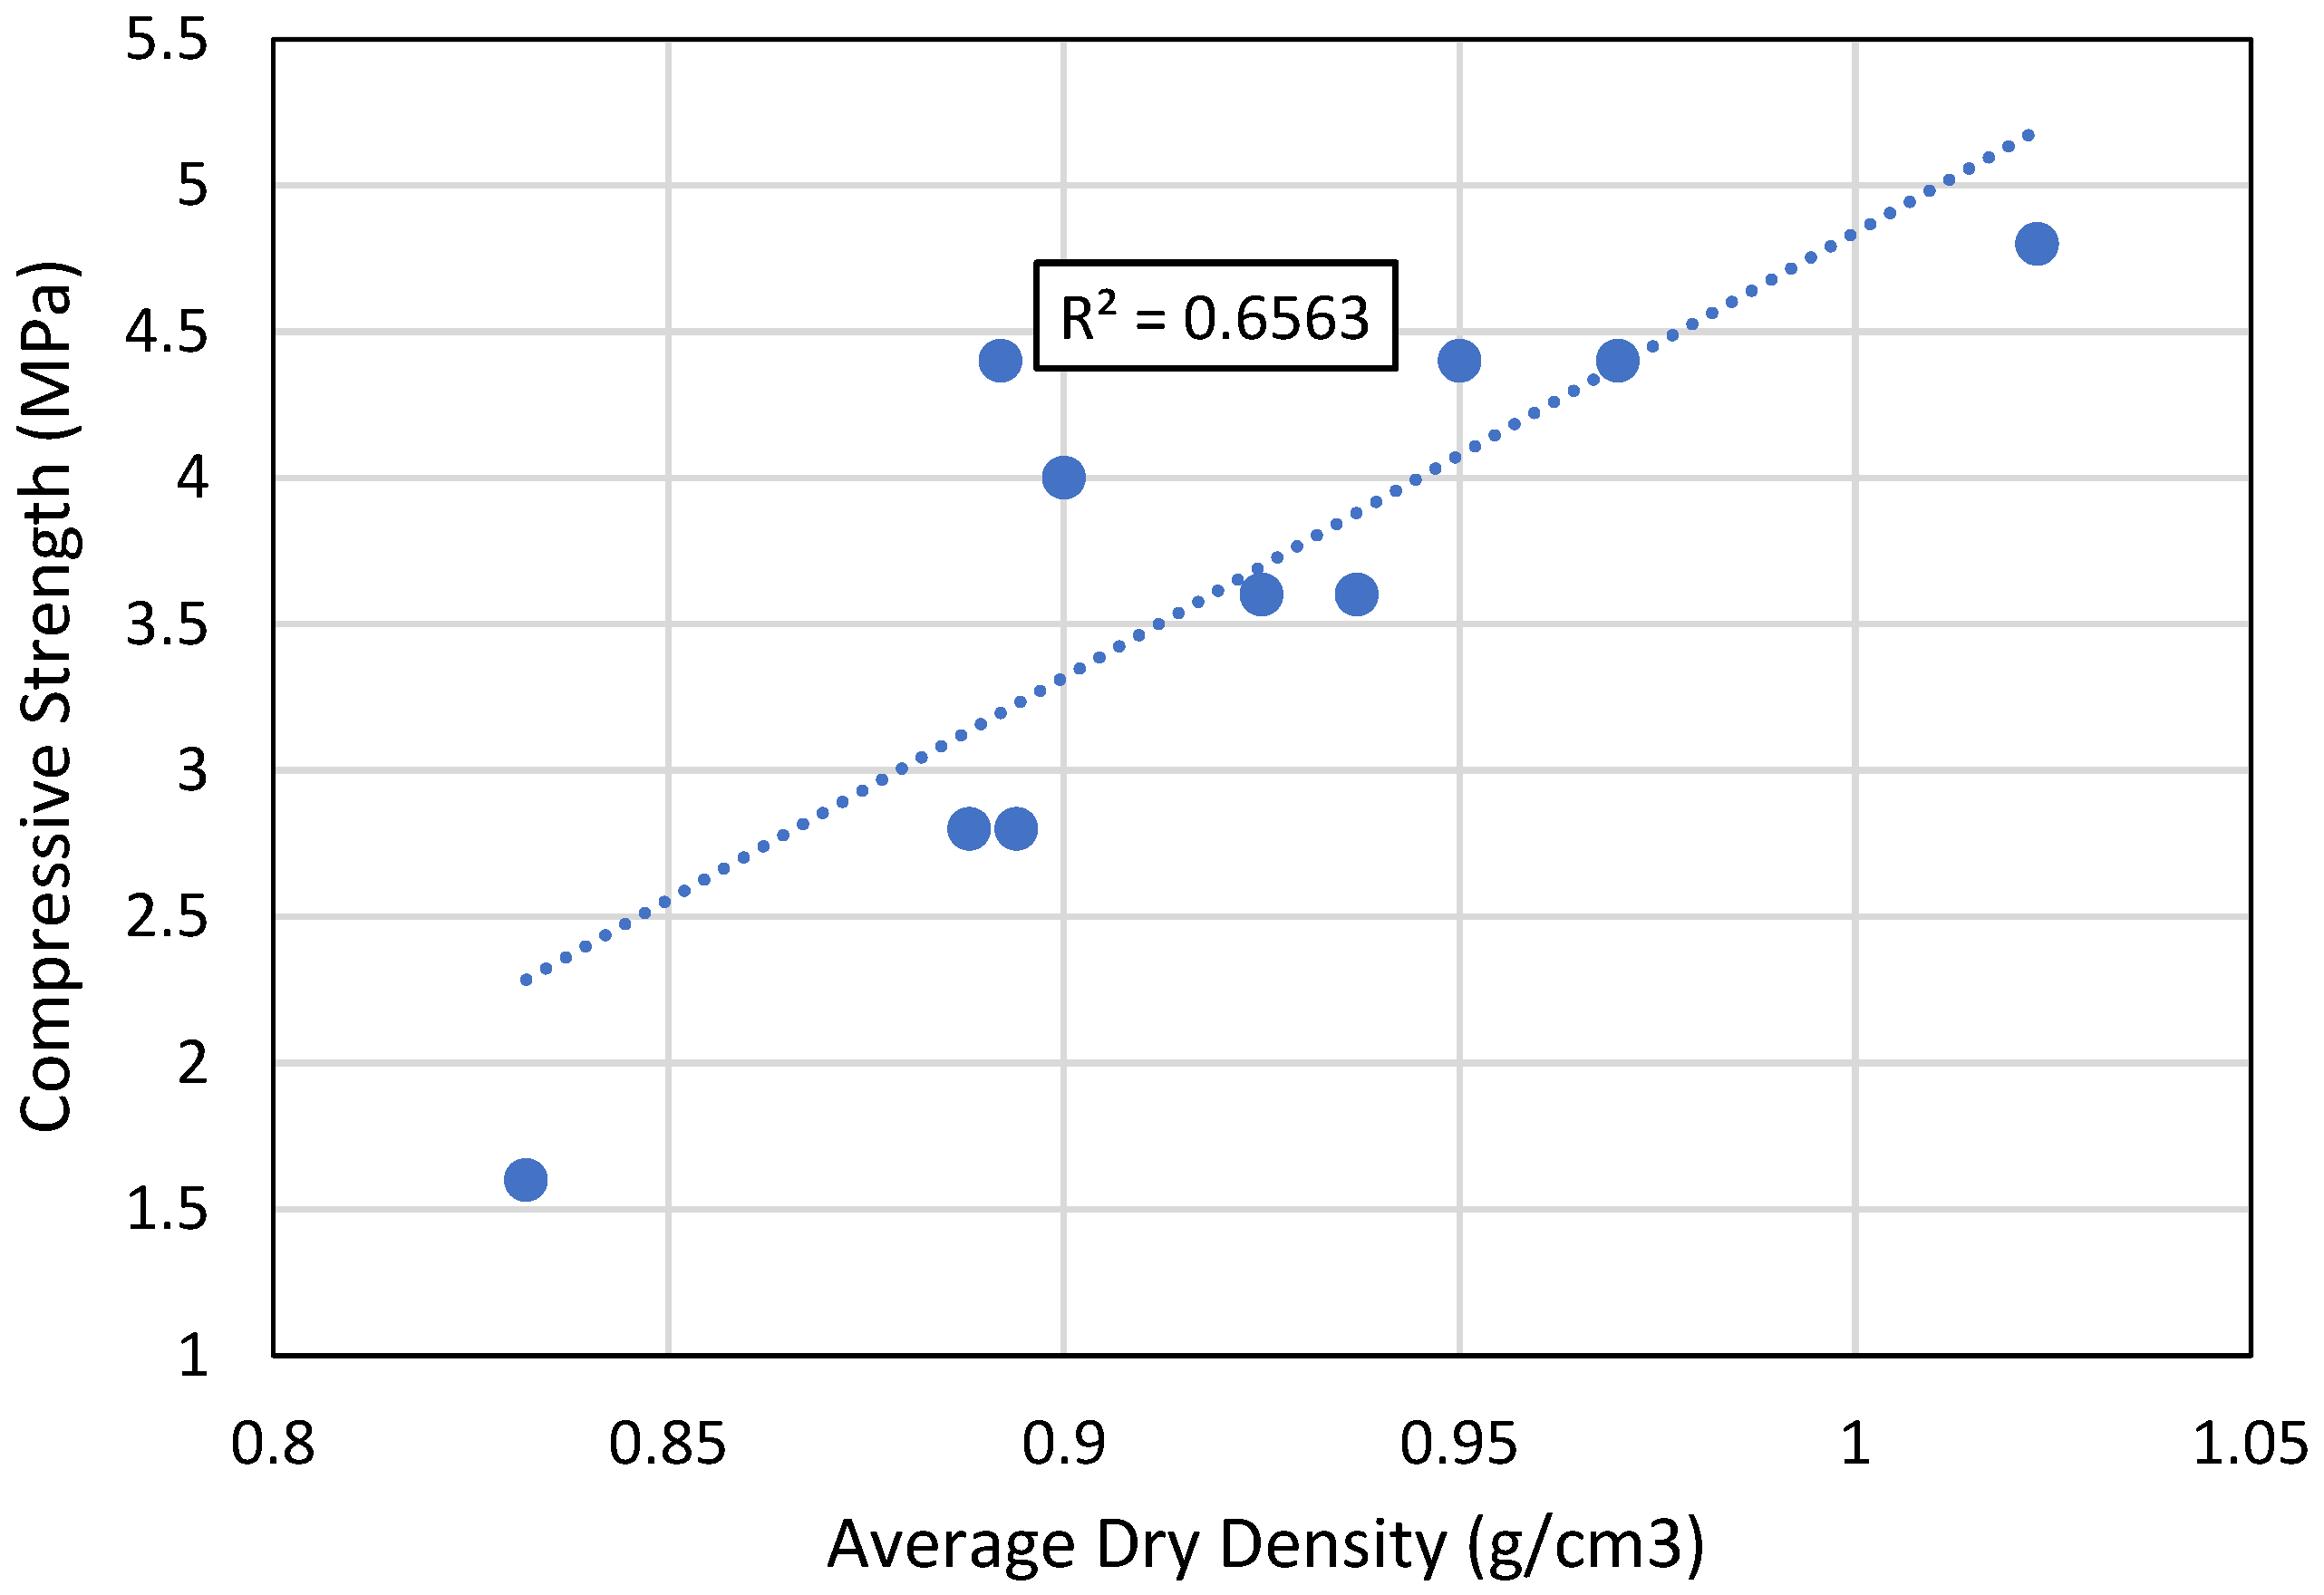
The relationship between compressive strength and dry density is illustrated in
Figure 8. A clear positive correlation (R
2 = 0.66) is observed, indicating that denser foam concrete samples generally exhibit higher compressive strength. This trend suggests that increased dry density reflects improved particle packing and reduced air-void content, leading to enhanced load-bearing capacity. As addressed in previous studies, i.e., ref. [
26], higher dry density results in higher compressive strength due to lower porosity, as denser concrete contains fewer and smaller pores that enhance its mechanical integrity. These results confirm that controlling mix composition and foam stability plays a critical role in optimizing both density and mechanical strength for lightweight concrete applications.
3.5. Thermal Conductivity
Thermal conductivity (k) is a key physical property that characterizes a material’s capacity to conduct heat, which is affected by several factors such as mineral composition, density, porosity, and moisture content. Materials with higher density and lower porosity generally show greater thermal conductivity due to enhanced particle-to-particle is this related to
Section 3.4 (contact and reduced air voids). In contrast, materials with higher porosity trap air, which is a poor heat conductor, resulting in lower k values.
Table 5 summarizes the thermal conductivity values for the tested blocks in both Set 1 and Set 2. Several trends are evident from the data. First, many blocks in Set 2 exhibit higher k values than their Set 1 counterparts, potentially due to improved sample compaction, higher moisture retention, or differences in batch preparation. For example, the thermal conductivity of Ajman 2 increased from 0.022 W/m·K in Set 1 to 0.684 W/m·K in Set 2, and Meliha samples only appear in Set 2, both showing relatively high k values (>0.7 W/m·K), indicating denser microstructures. RAK 2 from Set 1 had the highest measured conductivity at 0.883 W/m·K, followed by Meliha 2 from Set 2 at 0.729 W/m·K. In contrast, very low values (e.g., 0.020 W/m·K for Trial AD 1) suggest a highly porous structure or incomplete curing. Missing data (indicated by “–”) in some cases reflect measurement limitations or sample issues.
These results are in line with previously reported conductivity ranges for natural building materials, typically 0.4–0.7 W/m·K for sandstone and 1.1–1.3 W/m·K for dense limestone, confirming the consistency and reliability of the measurements. The variations observed highlight the critical role of microstructural and processing parameters in influencing thermal performance.
The observed variation in thermal conductivity values can be primarily attributed to differences in porosity, moisture content, and sand type rather than measurement errors. Samples with higher porosity exhibited lower conductivity due to the increased presence of air voids, which act as thermal insulators, while denser and less porous samples showed higher conductivity. Additionally, regional variations in sand composition and moisture retention influenced the heat transfer behavior across specimens. Higher porosity generally leads to lower thermal conductivity in both lightweight and foam concrete, as the air voids within the matrix act as effective insulators, reducing the material’s ability to conduct heat [
27]. For instance, the inclusion of hollow microspheres in ultra-light foamed concrete has been shown to significantly reduce its thermal conductivity [
28]. These factors collectively explain the wide range of measured values and confirm that the differences reflect genuine material characteristics rather than experimental inconsistencies.
3.6. Silica Content Analysis
Silica content plays a fundamental role in determining the mechanical and durability properties of concrete blocks. In the form of silicon dioxide (SiO
2), silica contributes significantly to the development of calcium silicate hydrate (C-S-H) during the cement hydration process, which is the primary binding compound responsible for strength development.
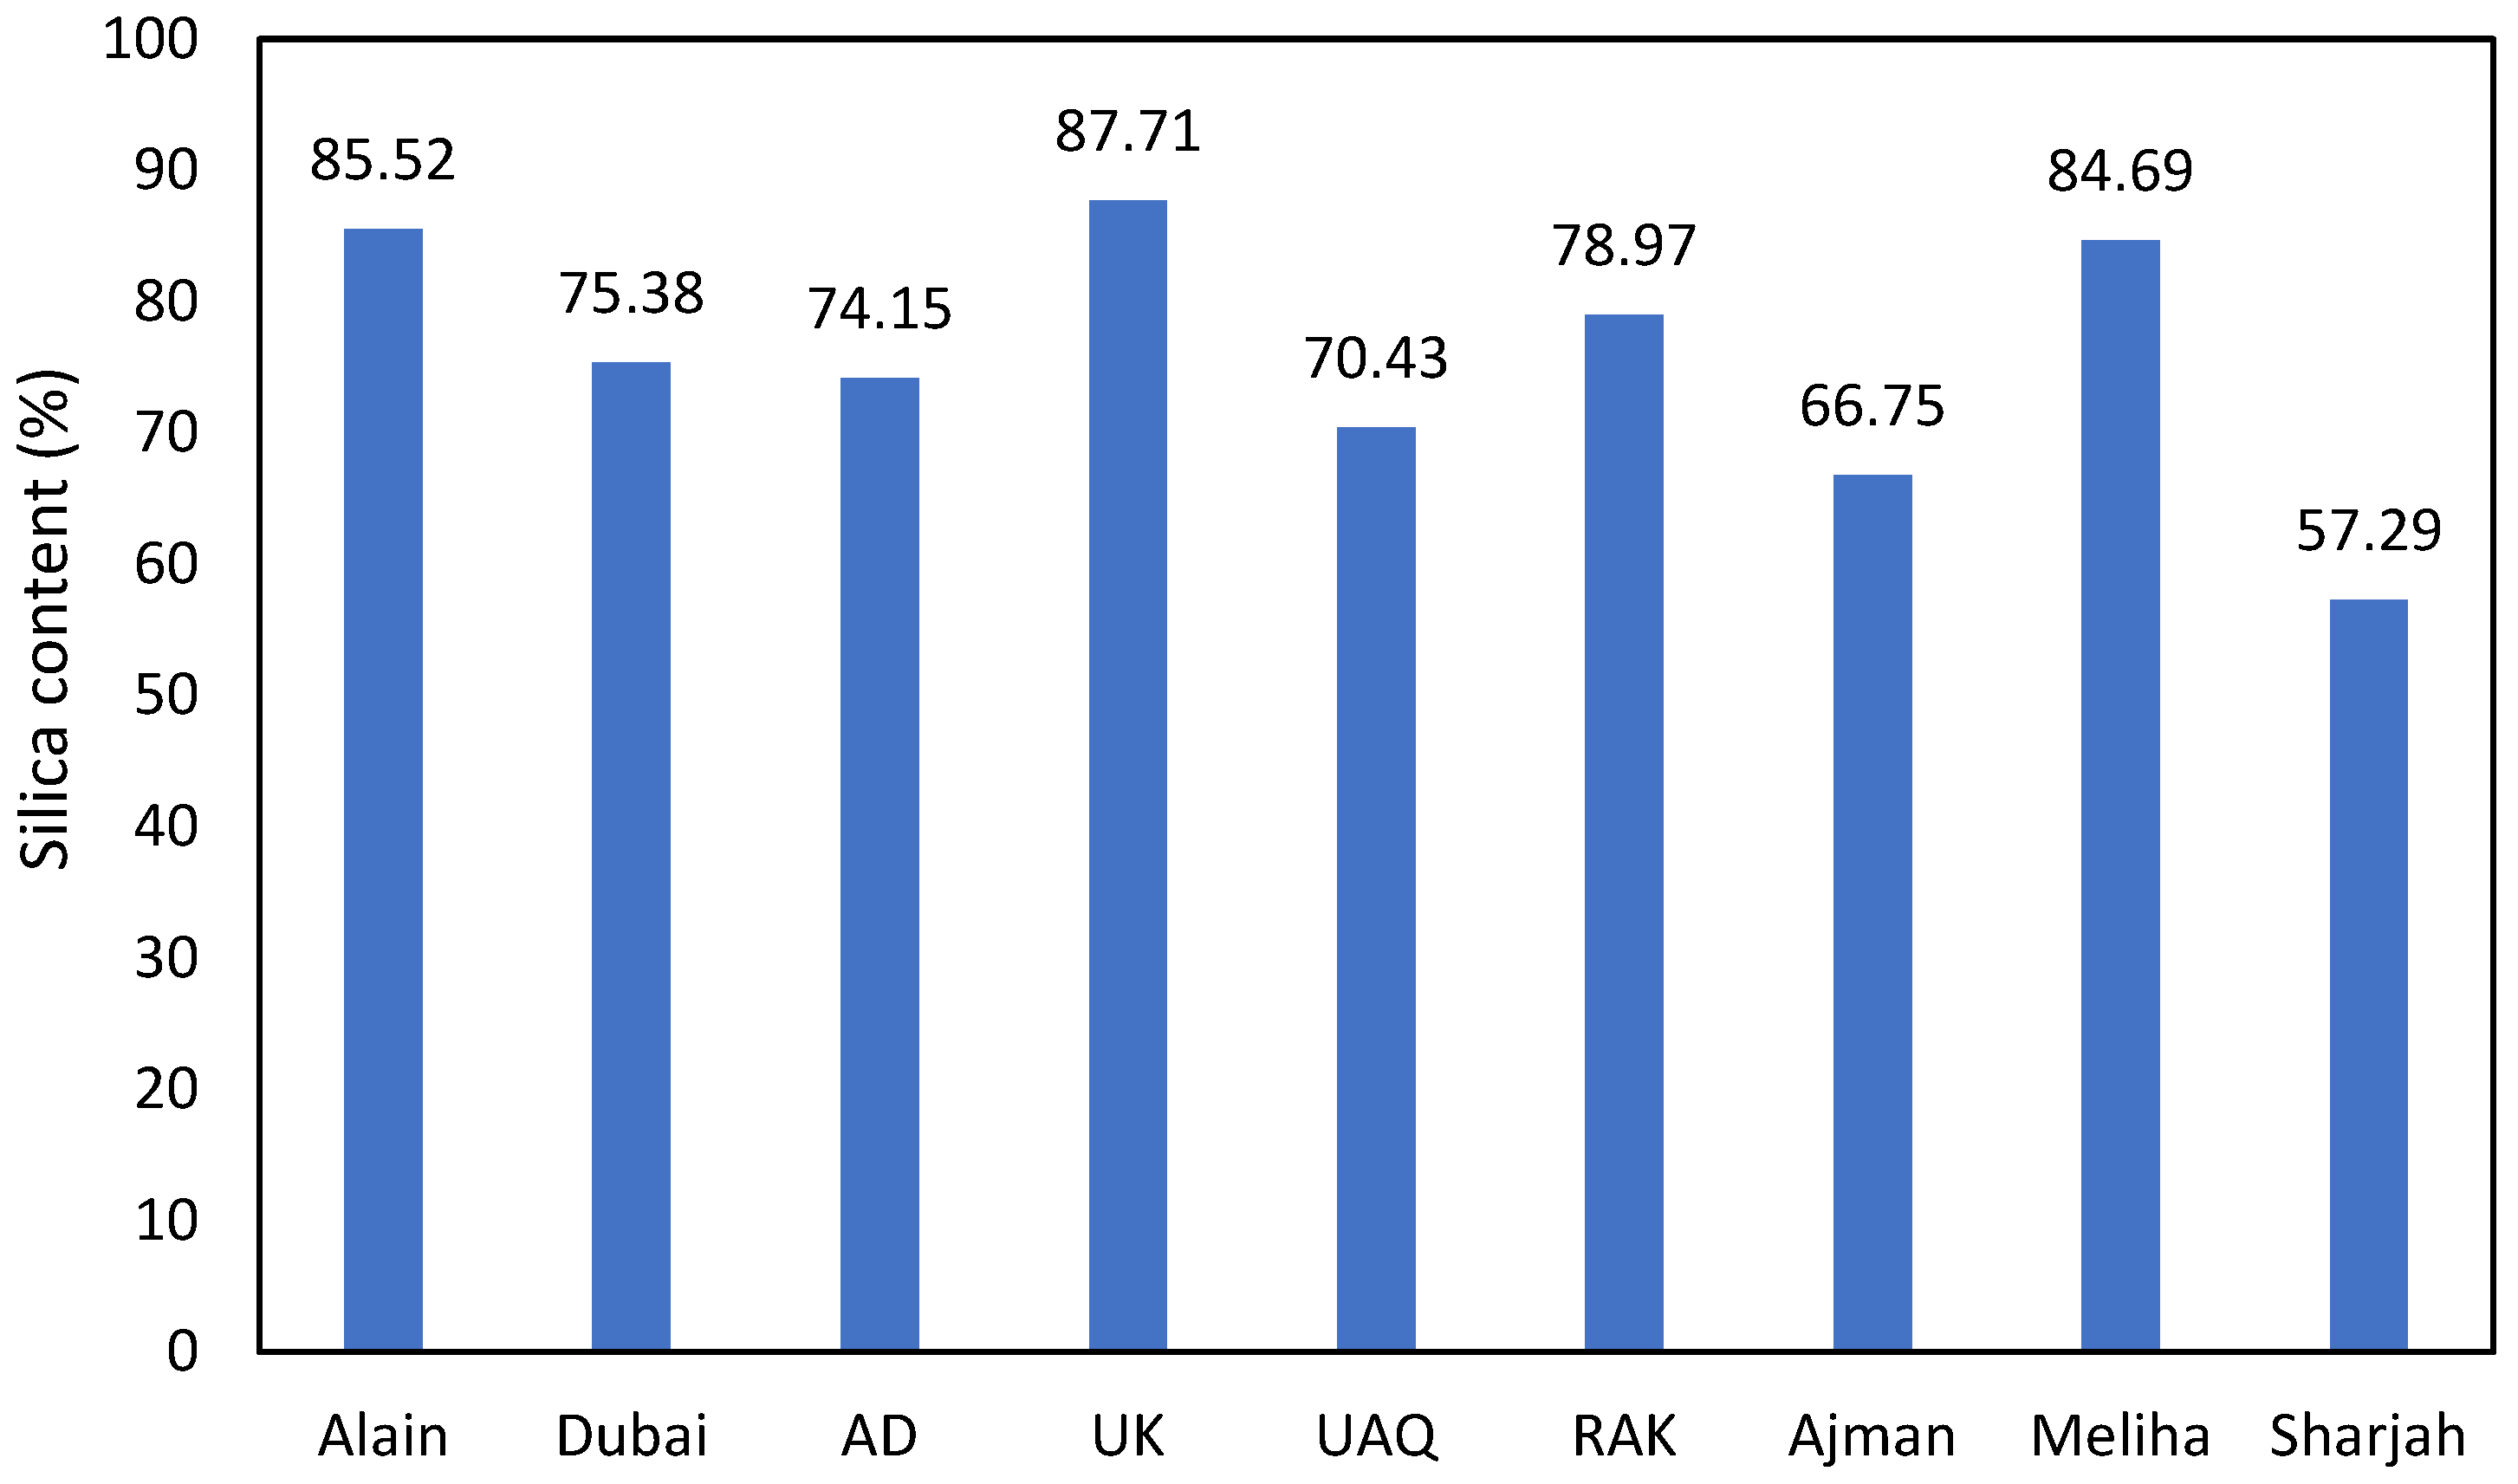
Figure 9 presents the silica content (%) of sand samples collected from various locations, highlighting regional variations in composition.
Samples with high silica content, such as those from the UK and Alain, generally exhibited higher strength and lower porosity due to enhanced pozzolanic reactions. However, the results also show that beyond an optimal silica proportion, further enrichment may slightly increase porosity, as observed in some high-silica samples (
Table 4). This indicates that while silica enhances bonding and densification, excessive amounts can alter the pore structure, leading to marginal increases in overall porosity. These findings align with previous studies on micro-silica (silica fume), which report that incorporating 5–15% silica fume by weight of cement improves compressive and tensile strength, reduces permeability, and enhances durability by refining the pore structure and strengthening the interfacial transition zone [
29,
30,
31]. Such characteristics are critical for applications requiring high strength and resistance to environmental factors, such as in structural components of high-rise buildings, marine structures, and infrastructure exposed to harsh conditions.
Samples with moderate silica levels, including RAK (78.97%), Dubai (75.38%), and AD (74.15%), produced concrete blocks with adequate structural properties for standard applications like walls, pavements, and non-critical load-bearing structures. These materials strike a balance between performance and cost but may show slightly increased porosity and reduced long-term durability compared to higher-silica counterparts. These observations confirm that the relationship between silica content, porosity, and strength is not strictly linear; optimal silica levels yield the best mechanical performance, whereas excessive enrichment can introduce minor increases in void formation.
Lower silica content, as observed in UAQ (70.43%), Ajman (66.75%), and especially Sharjah (57.29%), correlate with weaker concrete properties. These sands are likely to result in blocks with higher porosity, reduced compressive strength, and greater susceptibility to moisture ingress and chemical attack. Their use is generally discouraged in structural or exposed applications unless they are supplemented with pozzolanic materials.
Beyond mechanical benefits, silica-rich sand contributes positively to sustainable construction. High silica content enables the use of supplementary cementitious materials such as fly ash and slag, reducing the demand for Portland cement and lowering carbon emissions. Additionally, the durability of high-silica concrete reduces the need for maintenance and repair, extending service life and minimizing lifecycle costs. Therefore, careful selection of sand based on silica content is essential for optimizing concrete performance and ensuring both structural reliability and environmental sustainability in construction projects.
