Article

Identification and Configuration Optimization of Key Campus Landscape Features Using Augmentation-Based Machine Learning and Configuration Analysis

1
College of Landscape Architecture and Art, Fujian Agriculture and Forestry University, Fuzhou 350002, China
2
College of Economics and Management, Fujian Agriculture and Forestry University, Fuzhou 350002, China
3
Department of Financial and Business Systems, Faculty of Agribusiness and Commerce, Lincoln University, Christchurch 7647, New Zealand
*
Author to whom correspondence should be addressed.
These authors contributed equally to this work.
Buildings 2025, 15(21), 3868; https://doi.org/10.3390/buildings15213868 (registering DOI)
Submission received: 6 October 2025 / Revised: 23 October 2025 / Accepted: 24 October 2025 / Published: 26 October 2025

Abstract

A university campus is a composite built environment integrating research, daily life, culture, and ecological green space. Its landscape elements shape environmental perception and overall spatial quality. This study assesses spatial quality by identifying key features and optimizing their joint effects across three perceptions: safety, comfort, and belonging. Using a Chinese campus, we captured street-view images, applied semantic segmentation to quantify elements (grass, trees, buildings, roads, sidewalks), and used explainable machine learning with data augmentation to identify the features most relevant to these perceptions. This study then employed fuzzy-set Qualitative Comparative Analysis (fsQCA) to reveal configuration pathways that enhance spatial quality. Results show that data augmentation mitigates class imbalance and improves prediction accuracy. Key features include sky, river, bridge, people, grass, and sidewalks, and path analysis indicates that greater sky openness and higher densities of people, roads, sidewalks, and grass, together with fewer buildings, cars, and bare earth, enhance safety, comfort, and belonging. This study delivers globally transferable design rules and a replicable, policy-ready workflow that enables evidence-based campus upgrades across diverse regions.

1. Introduction

In a world increasingly focused on sustainable development and environmental quality, higher education institutions play a vital and growing role. University campuses are not only centers for teaching and research, they also serve as living laboratories for green infrastructure and eco-friendly design. Campus landscape planning is now a key component of the contemporary university environment. As campuses confront climate change and the urban heat island effect, their spatial form strongly shapes microscale adaptation and mitigation, making it an essential pillar of sustainability.
Prior studies show that campus green and blue infrastructure is critical. Natural elements, including vegetation, green spaces, and water bodies, regulate the thermal environment, mitigate urban heat islands, and enhance water cycles and ecosystem services [1,2]. The campus landscape, as a complex system, also supports environmental regulation and biodiversity conservation. Its structural design and functional optimization are crucial for maintaining ecological balance and achieving higher environmental quality.
Beyond their ecological functions, campus landscapes strongly shape users’ psychological experiences. Studies show that building scale, landscape diversity, and amenities in public spaces directly affect students’ mental health and restorative capacity [3]. At the microscale, trees, water, and lawns reduce stress, enhance well-being, and provide restorative experiences [4,5]. Greenness and access to green space are closely linked to emotional health and depression, underscoring the role of landscape design in mental health. Consequently, high-quality landscape structure and natural settings foster pleasant experiences that support study, leisure, and social interaction, which in turn improve overall well-being [6,7]. However, despite extensive research on the ecological and psychological benefits of campus landscapes, little is known about how specific combinations of landscape features jointly shape perceptions of safety, comfort, and belonging. This constitutes the critical research gap that the present study addresses.
To address the limited research on optimizing combinations of campus landscape features, this study focuses on a comprehensive university in China. We combine semantic image segmentation, explainable machine learning with data augmentation, and fuzzy-set Qualitative Comparative Analysis (fsQCA) to examine how campus environments shape perception. First, the Mask2Former model identifies landscape elements such as plants, grass, and rivers. A survey then provides three perception scores: safety, comfort, and sense of belonging. Second, to mitigate class imbalance between high and low score samples, we use a Conditional Tabular Generative Adversarial Network (CTGAN) for data augmentation and train interpretable models to improve prediction of the perception indices. Finally, guided by SHAP-based feature rankings, we apply fsQCA to uncover configuration pathways through which landscape attributes enhance the three perceptions and to offer practical guidance for improving campus spatial quality.
The novelty of this study lies first in its theoretical contribution. By integrating Prospect Refuge Theory and Thermal Comfort Theory, we move beyond purely ecological or aesthetic indicators and evaluate campus spatial quality across three psychological dimensions: perceived safety, environmental comfort, and sense of belonging. This holistic evaluation clarifies how the environment shapes students’ psychological experiences and expands the theoretical framework for campus landscape research.
Second, methodologically, this study combines semantic image segmentation, explainable machine learning with data augmentation, and fuzzy-set qualitative comparative analysis (fsQCA). Segmentation yields high-quality landscape features for empirical analysis. The augmented and interpretable models address the imbalance between high and low perception scores and markedly improve prediction of campus spatial quality. Building on machine learning identification of key features, fsQCA examines configuration pathways that enhance spatial quality. Together, these three methods reinforce one another to achieve the research goal.
Third, regarding findings, this study moves beyond prior work that explained restorative quality with a single landscape feature. We show that greater sky openness, higher crowd density, and moderate reductions in building and bare-earth densities jointly increase perceived campus safety. Grounded in established theory and a systematic configuration approach, the study optimizes campus spatial quality and provides new evidence.
Overall, this study contributes a unified three-tier methodology that links semantic segmentation, interpretable machine learning with data augmentation, and fsQCA into an end-to-end replicable pipeline. It connects perception data to feature attribution and then to configuration rules, moving from prediction to prescription and providing generalizable, implementation-ready guidance for campus design.
The remainder of this paper is organized as follows. Section 2 reviews the relevant literature and outlines the theoretical basis. Section 3 describes the street view image data and the environmental perception scores, and provides a brief introduction to the models used. Section 4 reports the empirical results. Section 5 discusses the findings. Section 6 concludes the study.

2. Literature Review and Theory

2.1. Literature Review

2.1.1. Ecological and Environmental Functions of Campus Landscapes

Campus landscapes serve both aesthetic and cultural roles while also functioning as core ecosystems. Open lawns, water features, and vegetation provide venues for interaction among students and staff, which can foster a sense of belonging and social cohesion [8,9]. Natural settings such as lawns and ponds reduce stress and support recovery through “soft fascination,” restoring directed attention and sustaining focus. Campus studies consistently document these restorative effects in students [10,11].
For stress relief, natural environments offer non-threatening stimuli that reduce sympathetic activation and lower cortisol levels, thereby easing anxiety and stress. Multiple mechanisms have been proposed. Hartig et al. (2003) [12] reviewed how nature regulates physiological stress indicators such as heart rate, blood pressure, and cortisol. Kaplan (1995) [13] argued that the joint action of affective soothing and physiological recovery is the key pathway for stress reduction.
Green spaces deliver core ecosystem services: they improve air quality, reduce particulate matter, regulate the microclimate to temper urban heat islands, and manage stormwater through lawns, trees, and rain gardens [14,15]. On campuses, trees contribute to cleaner air, better thermal comfort, and carbon sequestration [16]. Optimizing green-area configuration strengthens these benefits and improves spatial efficiency [17]. Together, these functions elevate environmental quality and support the physical and mental health of students and staff, underscoring the central role of natural elements in campus design.

2.1.2. Campus Landscapes and Psychological Perception

Campus landscapes strongly shape students’ psychological perceptions and behaviors. Environmental psychology shows that they regulate mood and can influence social interaction and academic performance [6,18]. Perceived restorativeness is a key mediator that links campus green features to restorative experiences [19,20]. Multiple studies support this pathway. Gao et al. (2025) and Felsten (2009) [21,22] found that spatial restorative qualities affect students’ emotions and health through perceived restorativeness, and emphasized that subjective experience is central to recovery.
Sensory dimensions have a direct and stable positive impact on the restorative experience. Mechanistically, Zhang et al. (2024) [23] used structural equation modeling to show that sensory dimensions are not only strongly associated with restoration but also act through the mediating paths of “capacity for solitude” and “perceived restorativeness.” In parallel, Foellmer et al. (2021) [24] reported that students’ subjective perceptions of green space, including their sense of identity and emotional attachment, are closely tied to their physical and mental well-being. At the feature level, spaces with richer water and vegetation, as well as those with cultural symbolism, more effectively elevate positive emotions and reduce negative affect [25,26]. At the behavioral level, Diao et al. (2024) [27] found a significant positive link between students’ subjective ratings of landscape quality and mental health. Although the role of objective indicators remains uncertain, higher visitation frequency clearly strengthens psychological well-being. Hence, as a key setting of daily academic life, campus landscapes shape students’ perceptions and behaviors through multiple pathways.

2.1.3. Research Methods and Emerging Trends in Campus Landscape Research

In recent years, driven by digital technologies, a more profound commitment to sustainability, and user-centered design, campus landscape research has shifted from traditional approaches to interdisciplinary integration. Early studies relied on field mapping, questionnaires, and spatial statistics to quantify greening rate, vegetation structure, and spatial accessibility, and to relate these metrics to students’ behaviors and psychological perceptions [28]. With the adoption of GIS and advanced spatial analytics, researchers can more directly examine the distribution, functions, and configurations of campus green space, providing crucial tools to reveal links between landscape attributes and user experience [29].
Driven by these advances, researchers have begun using remote sensing to conduct multi-scale spatiotemporal analyses that track changes in campus and urban green space. For example, Ma et al. (2022) [30] showed that GIS and spatial statistics can effectively reveal the spatiotemporal evolution of Beijing’s urban green space from 1990 to 2019. This methodological toolkit applies not only to city-scale studies but also provides powerful tools for dynamic analysis, scenario simulation, and forward prediction of campus landscapes.
With the deepening of campus informatization, big data and machine learning are being incorporated into landscape performance assessment. For example, Zhuang et al. (2025) [31] utilized image semantic segmentation and explainable machine learning to assess the restorative quality of university outdoor spaces, employing XGBoost with SHAP to identify key landscape features and optimization options. Chai et al. (2025) [32] proposed a machine-learning-based planning framework that demonstrates how to integrate large datasets with complexity analysis to systematically enhance campus landscape design.
In summary, campus landscape research is shifting from traditional qualitative descriptions and spatial statistics toward fine-grained, data-driven evaluations powered by big data and artificial intelligence. This transition broadens the research perspective and offers new tools and approaches for the scientific design and management of campus landscapes.

2.2. Theoretical Framework

In campus landscape research, students’ psychological and behavioral responses are shaped by environmental features [20]. As a core setting for study and daily life, the campus not only delivers knowledge but also shapes users’ emotions and social identity [33]. Ecological or aesthetic indicators alone cannot capture the full value of campus space.
The conceptual framework in Figure 1 reveals how campus environmental features influence students’ psychological, behavioral, and social responses through three perception dimensions. Sense of security (based on Prospect-Refuge Theory), as the foundational layer, creates the necessary conditions by reducing threats and enhancing spatial safety. Environmental comfort (based on Thermal Comfort Theory), as the intermediary layer, transforms physical and sensory inputs into emotional enhancement and sustained engagement. Sense of belonging (based on Social Identity Theory), as the higher-level layer, strengthens identity recognition and maintenance intentions through repeated exposure and place attachment. The arrows in the figure have been annotated to explain the key mechanisms: sense of security provides the foundation for comfort and belonging, comfort moderates the efficiency of the transition from security to belonging, and belonging generates protective behaviors and long-term resilience. Together, these three dimensions form the path from environmental input to student outcomes, ultimately promoting long-term academic achievement and social well-being.
First, a sense of safety is the fundamental precondition for students’ normal study and life on campus. The Prospect–Refuge Theory suggests that spaces offering both clear outward views and moderate shelter can reduce uncertainty and perceived threats, thereby improving safety experiences [34]. Recent empirical studies have further validated this. Peng et al. (2024) [35] developed a model of day-and-night sense of security in Chinese universities, showing that lighting, visibility, and landscape configuration significantly influence students’ sense of security. Zhu et al. (2023) [36] identified five key environmental factors that affect the sense of security during nighttime walking.
Second, environmental comfort reflects students’ direct experience of the physical and sensory setting. Thermal Comfort Theory provides the foundation, noting that comfort arises from a combination of factors. Beyond temperature and humidity, it also depends on factors such as light, ventilation, noise, and visual landscape quality [37]. In campus contexts, natural elements such as lawns, water, and trees enhance comfort by improving the microclimate, easing heat island effects, and creating a pleasant sensory environment [38]. Specifically, Zhang et al. (2024) [39] assessed the thermal comfort of students in semi-outdoor corridors of universities in hot-humid regions, while Elshabshiri et al. (2025) [40] evaluated the microclimate differences between various urban areas on university campuses.
Ultimately, a sense of belonging reflects the emotional bond and social identification that form between students and the campus environment. Social Identity Theory provides the foundation: individuals construct their identity through interactions with settings and groups, which in turn fosters a sense of belonging [41]. Recent studies have shown that Chang et al. (2025) [42] used structural equation modeling to demonstrate that landscape perception and place attachment can enhance school belonging and promote psychological well-being.

3. Materials and Methods

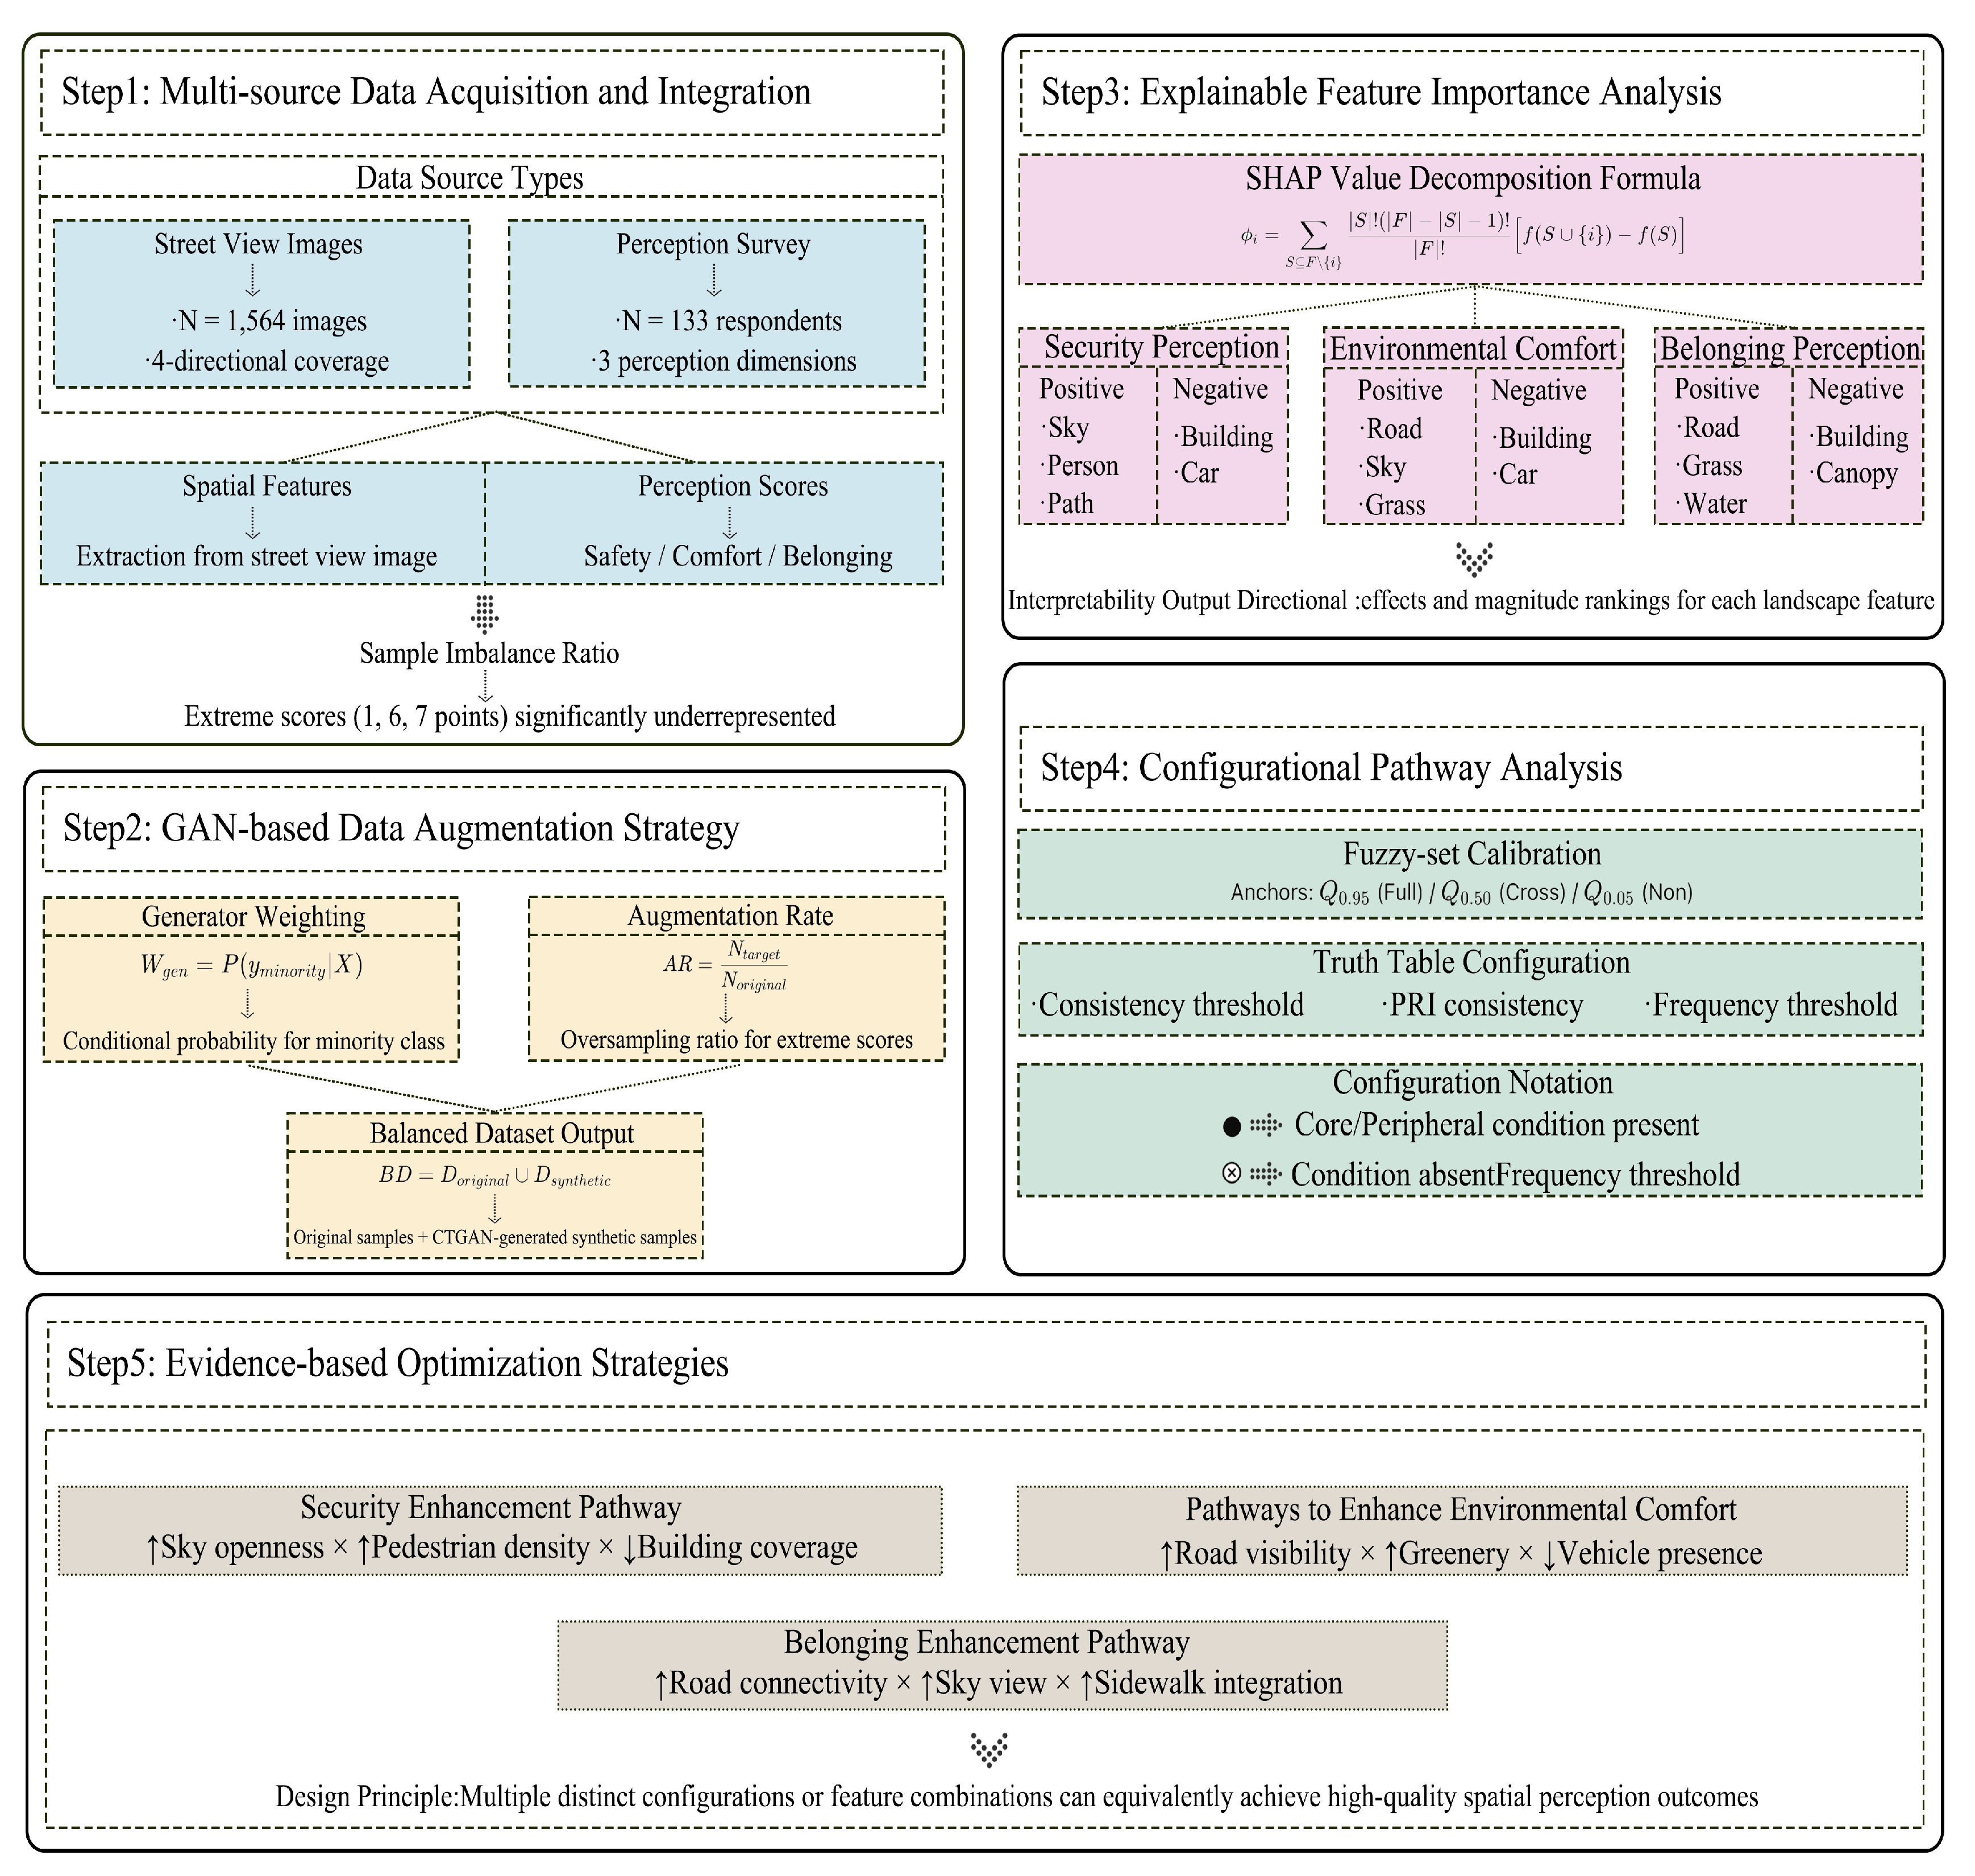
At the data level, this study uses Baidu Maps street-view images and the Mask2Former semantic segmentation model to extract spatial features of landscape elements, including grass, trees, roads, buildings, and water. The overall technical workflow is shown in Figure 2. At the perception level, we conducted a questionnaire survey to collect students’ subjective ratings on three core dimensions: perceived safety, environmental comfort, and sense of belonging (Step 1).
To address the imbalance between high and low scores in the perception indices, we apply a CTGAN model to augment minority extreme-score samples (Step 2). We then combine explainable machine learning to identify key landscape elements that significantly affect safety, comfort, and belonging (Step 3). On this basis, we use fsQCA to explore, from a configurational perspective, how different elements interact to form effective path-ways for campus spatial quality (Steps 4 and 5). In Step 4 of the fuzzy-set Qualitative Comparative Analysis (fsQCA), we conduct variable calibration, truth-table configuration, and the identification of ancillary conditions. Variable calibration is based on the 5th, 50th, and 95th percentiles of each variable.
The 5th, 50th, and 95th percentiles are pragmatic, theory-informed anchors for fsQCA calibration. The 5th percentile marks full nonmembership, reserving a score of 0 for clearly “out” cases and limiting misclassification at the low end. The 95th percentile marks full membership, assigning 1 only to unequivocally “in” cases at the top of the distribution. The 50th percentile serves as the crossover (0.5), the point of maximum ambiguity. Together, these anchors translate interval data into consistent fuzzy scores while remaining open to theoretical justification.

3.1. Data Collection and Feature Quantification

  • Campus street-view acquisition
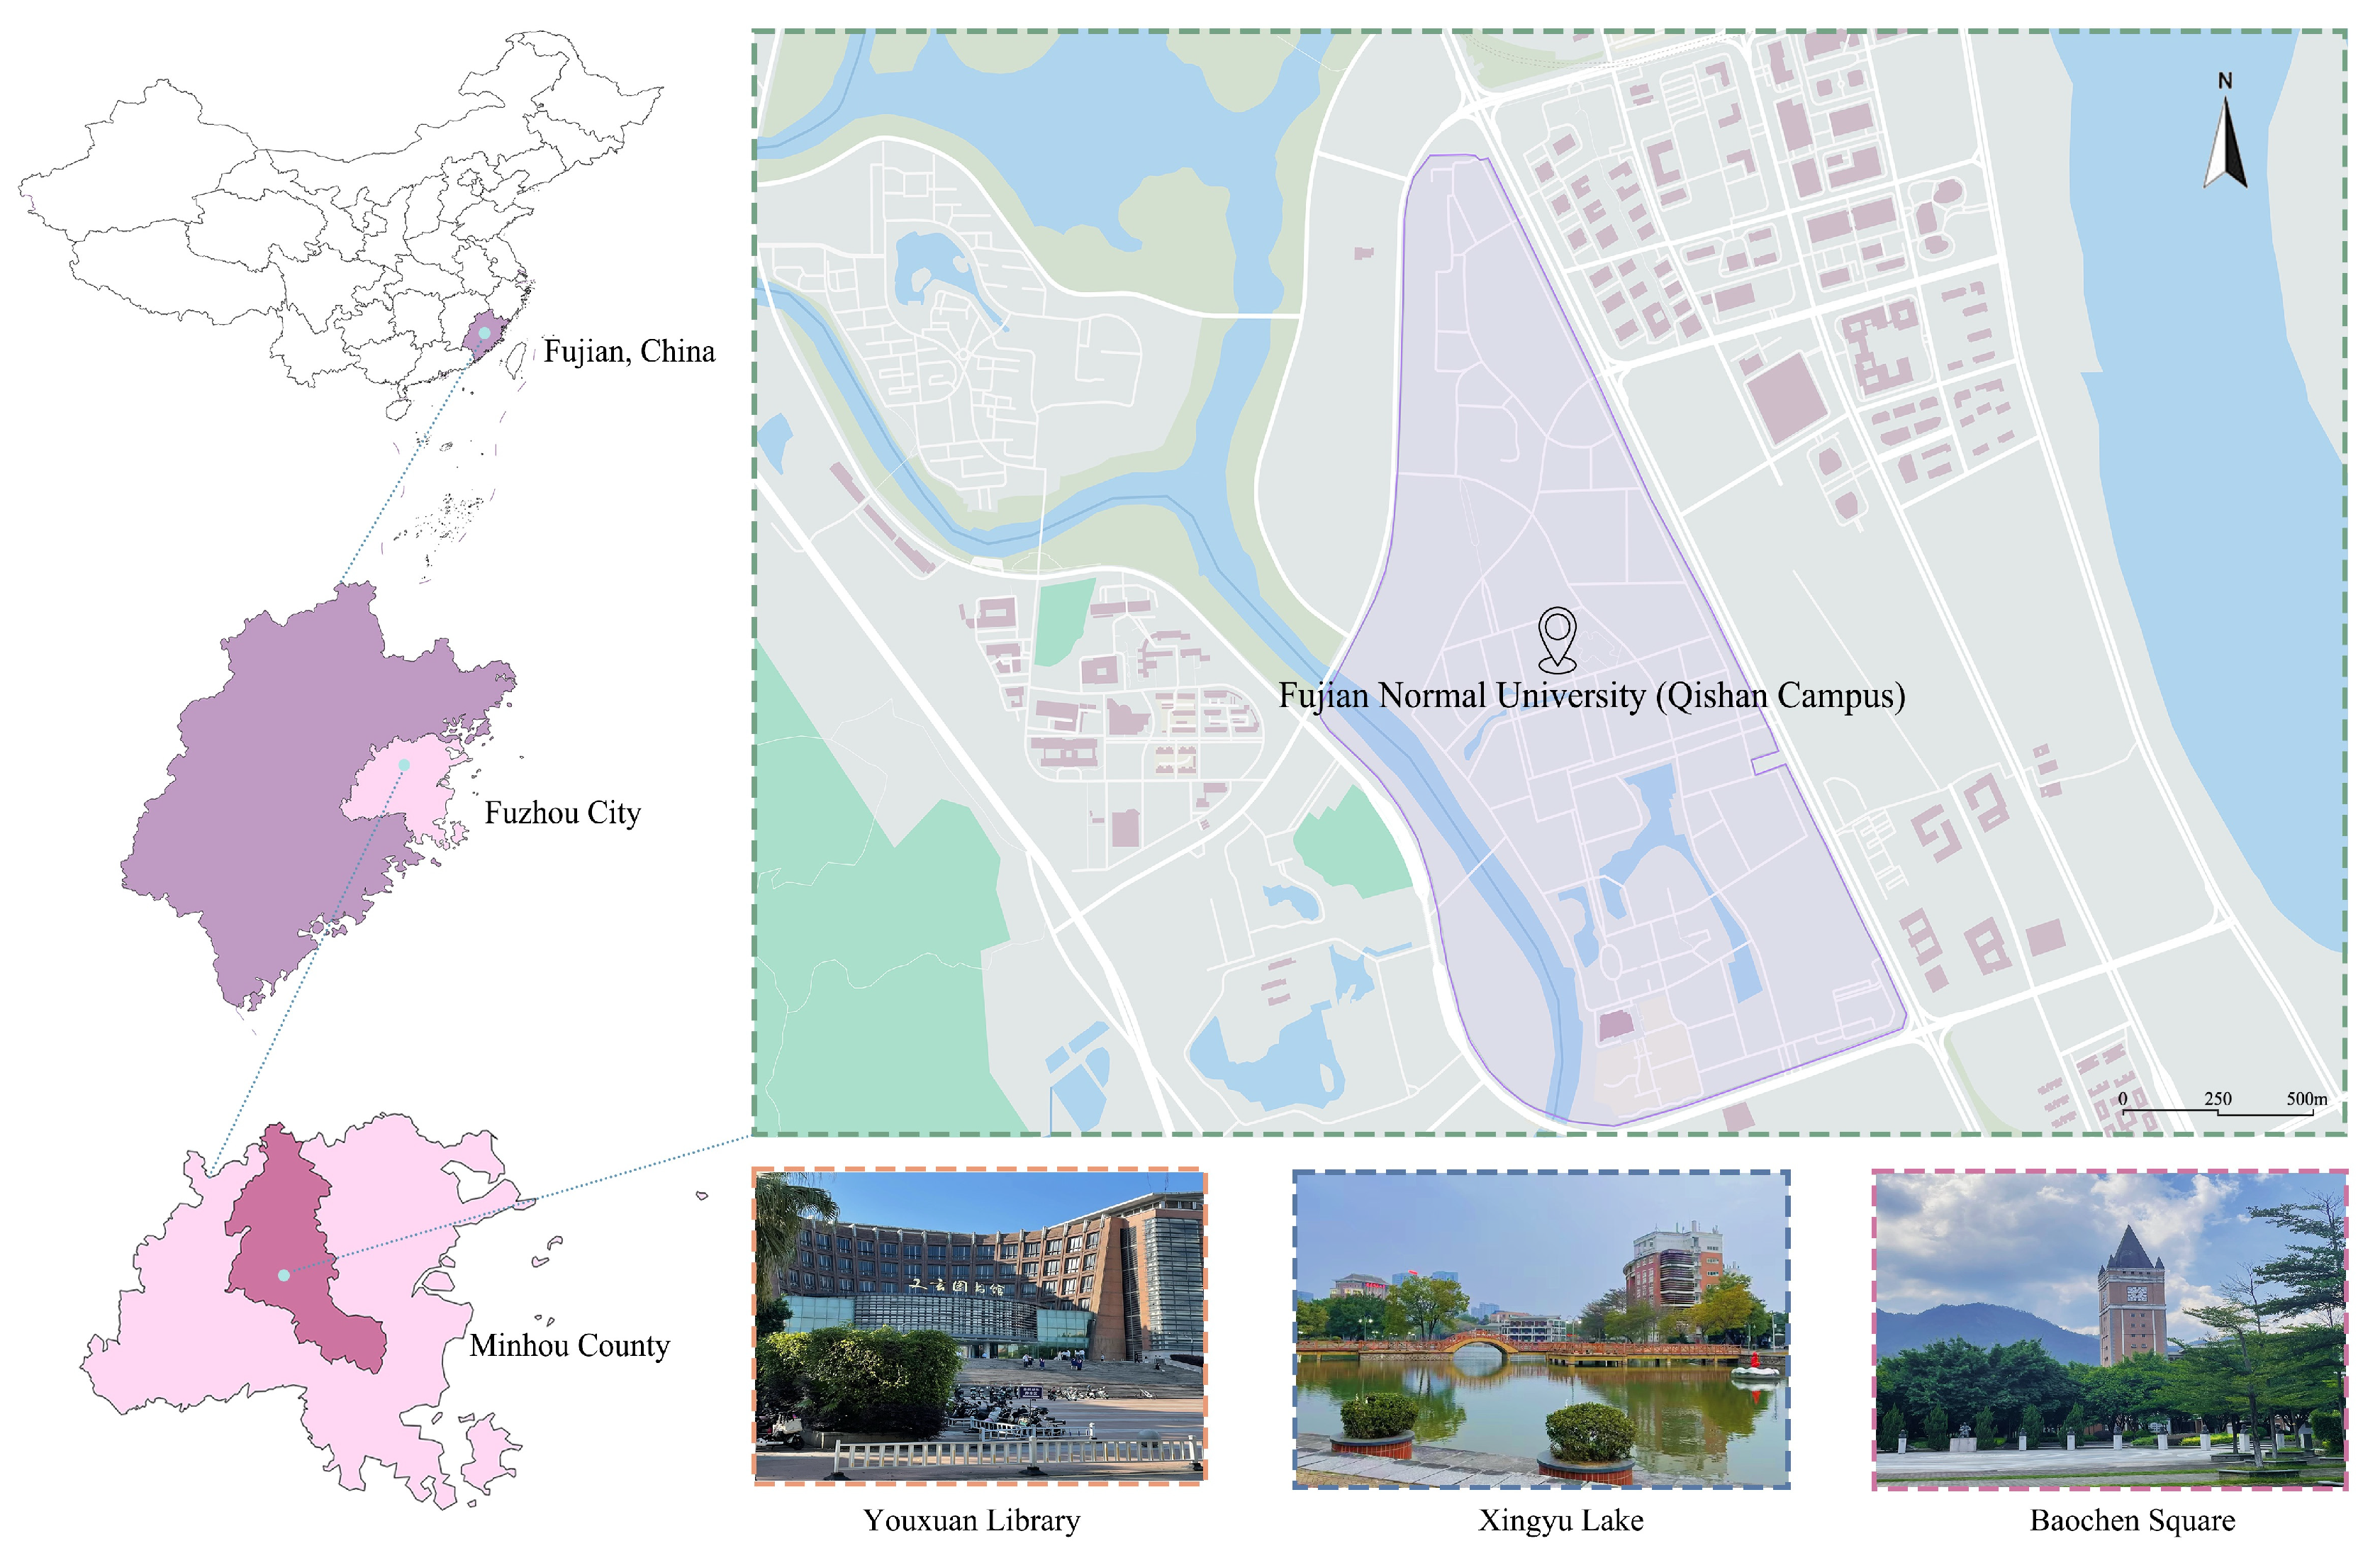
Fujian Normal University (FNU), founded in 1907, is a key provincial university and an early national pilot under the “Program for Training Talents to Meet Special National Needs.” This study focuses on its Qishan Campus, and it can be seen at https://www.openstreetmap.org/relation/12658062 (accessed on 23 October 2025). As shown in Figure 3, the campus is located in the University New District of Shangjie Town, Minhou County, Fuzhou, covering approximately 2800 mu (≈187 hectares). It serves as the main campus and the primary base for teaching and research. The setting is framed by hills and water, with a well-organized internal layout and emblematic nodes such as the Youxuan Library, Xingyu Lake, and Baochen Square.
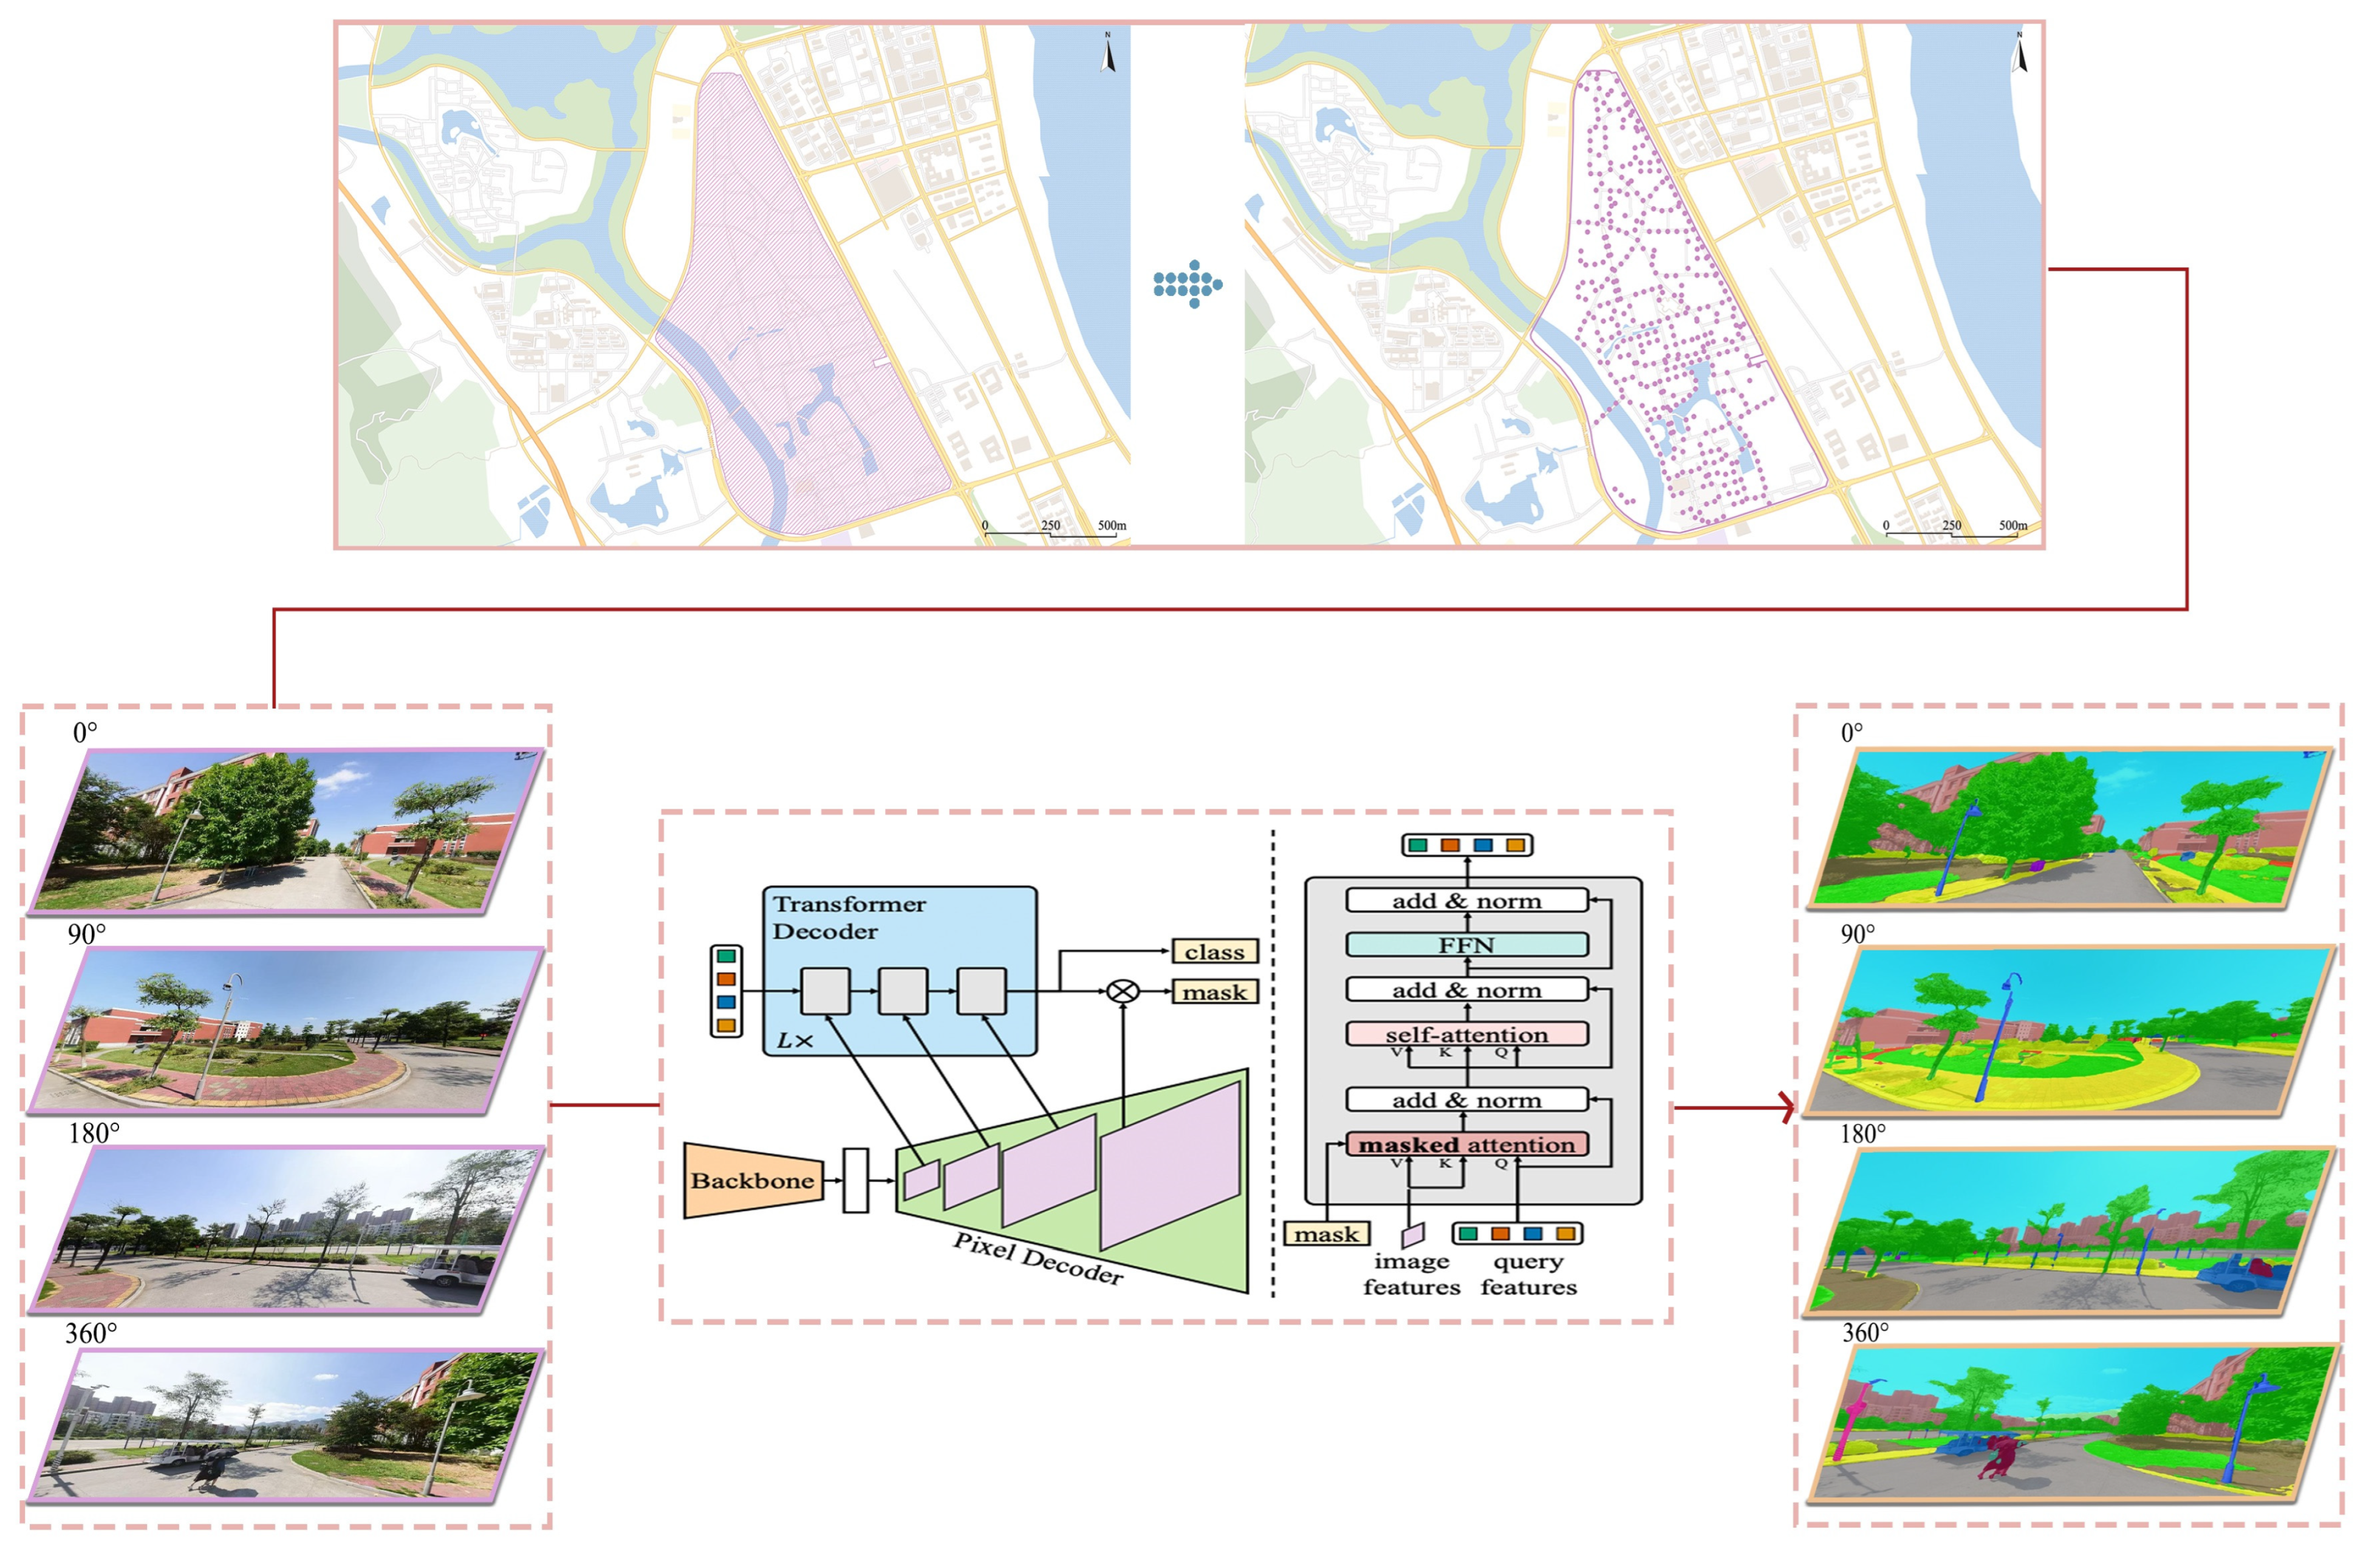
We first obtained campus road data from OpenStreetMap (OSM) and, using QGIS, generated 391 sampling points at 50 m intervals, recording their latitude–longitude coordinates. For each point, with a fixed pitch angle of 0°, we captured street-view images facing 0°, 90°, 180°, and 270° azimuth angles. Each location produced four images, resulting in a total of 1564 images. This dataset provides near-complete coverage of the campus and supplies the data basis for subsequent semantic segmentation and environmental perception modeling [43].
  • Quantification of environmental perception indicators
To evaluate street-view images on three dimensions (perceived safety, environmental comfort, and sense of belonging), we followed the rule “use validated scales when available; otherwise adapt classic items”: (1) Safety: drawing on environmental-psychology research on public-space safety, we integrated lighting, visibility, escape potential, and maintenance, and translated them into items that can be judged directly from images [44,45]. (2) Environmental comfort: based on an outdoor thermal and psychological adaptation framework, we contextualized visual cues for thermal comfort, visual comfort, and ventilation/noise [37,46]. (3) Sense of belonging: using a validated place-attachment scale, we selected representative items from “place identity” and “place dependence,” adapted to the campus context [47].
Table 1 shows example semanticized items for the evaluation. All items used a 7-point Likert scale (1 = “strongly disagree,” 7 = “strongly agree”). Using the FNU Qishan Campus image library, we applied stratified random sampling by road class and spatial zone to select 200 representative images. A total of 133 enrolled students completed online ratings. Note that our focus is subjective visual perception under image conditions, not actual use behaviors. This study assessed the reliability and validity of the questionnaire. The overall Cronbach’s α was 0.995, indicating excellent internal consistency. The KMO measure of sampling adequacy was 0.992, well above the 0.90 threshold, showing that the data are highly suitable for factor analysis. Taken together, the questionnaire demonstrates strong reliability and construct validity, providing a sound statistical basis for subsequent analyses.

3.2. Data Processing Workflow

  • Workflow for semantic information extraction from street-view images
With broad coverage and rich visual detail, street-view images have become an important data source for environmental perception and spatial analysis. Figure 4 presents the Transformer workflow and the resulting semantic segmentation outputs. In this study, we utilize the Mask2Former model to extract semantic features from images. The model is based on a Transformer architecture, which fuses a convolutional backbone with a set-prediction mechanism to jointly optimize semantic and panoptic segmentation tasks [48]. With this approach, key campus elements such as vegetation, pedestrian paths, sky openness, and building contours are identified at the pixel level, providing a solid foundation for subsequent perception modeling.
For Mask2Former on ADE20K, train semantic and panoptic models separately under the same configuration. Use a Swin B backbone pretrained on ImageNet 1K, AdamW with β values 0.9 and 0.999, a base learning rate of 0.0001, weight decay 0.02, and a linear warm up of 1500 steps followed by cosine decay to step 180,000 at an effective batch size of 32. Apply moderate augmentation that includes random resize with scale from 0.8 to 1.6, horizontal flip, random crop 640 × 640, photometric jitter, and Gaussian blur with probability 0.10. Use drop path 0.2, gradient clipping at 1.0, and focal loss with γ equal to 2 for mask classification together with the standard task losses. During inference, keep aspect ratio and resize the long edge to 1024 pixels; for large scenes, use sliding windows of 640 × 640 with a stride of 426 pixels, and optionally apply multi scale testing at 0.75, 1.0, and 1.25 for semantic segmentation. Set 150 queries for semantic runs with Swin B and 250 queries for panoptic runs to stabilize instance grouping without excessive memory use.
  • Application of CTGAN to imbalanced data
In recent years, generative adversarial networks (GANs) have gained importance in handling tabular data and mitigating class imbalance. Xu et al. (2019) [49] introduced CTGAN, which combines conditional generation with mode-specific normalization. It supports both continuous and categorical variables and produces high-quality, diverse samples under multimodal and imbalanced distributions. Subsequent work extended this line of research: Engelmann & Lessmann (2021) [50] proposed a conditional Wasserstein GAN to stabilize oversampling; Zhao et al. (2024) [51] developed CTAB-GAN by adding a classification loss, information-preserving constraints, and improved conditional vectors, which enhanced statistical fidelity and downstream predictions; CTAB-GAN+ further broadened the training scheme to address more complex imbalance patterns [51]. CTGAN models multi-peaked continuous features through mode-specific normalization, and its conditional generator and sampling strategy strengthen learning from minority classes in categorical features. The generator and discriminator are fully connected networks, enabling a unified treatment of both continuous and discrete attributes [52]. In summary, CTGAN-based approaches enhance data quality and mitigate distributional imbalance, providing a robust methodological foundation for modeling and interpreting campus environmental perception data in this study.
  • Fuzzy-Set Qualitative Comparative Analysis (fsQCA)
The core idea of fsQCA is that outcomes arise from configurations of multiple causal conditions. Research should therefore examine the complex causal links between different condition sets and the outcome. In recent years, QCA has seen growing use in management studies. For example, Li et al. (2025) [53] employed fsQCA to investigate how modern agricultural industry systems influence farm household incomes, including their effects on income structure and crowding-out across various dimensions. Wen et al. (2025) [54] applied fsQCA to university public spaces. They found that an environment–facility mix, a static rest pattern, a dynamic activity pattern, and an interaction-driven pattern all foster substantial psychological restoration.
From the perspective of variable adaptability, QCA includes three types: crisp-set (csQCA), multi-value (mvQCA), and fuzzy-set (fsQCA). Compared with the other two, fsQCA offers greater analytical flexibility. It handles categorical variables while also accommodating continuous change and partial membership. By transforming fuzzy-set data into a truth table, fsQCA preserves the strengths of traditional QCA in dealing with qualitative evidence, limited diversity, and configuration simplification, while combining the advantages of qualitative inquiry and quantitative analysis.

4. Empirical Results

4.1. Modeling Results of Augmentation-Based Explainable Machine Learning

Using features derived from semantic segmentation as inputs and students’ perceived safety, comfort, and belonging as targets, we built machine learning models. We first evaluated eXtreme Gradient Boosting (XGBoost), Random Forest (RF), and Gradient Boosting Decision Tree (GBDT) on the test set, as shown in Table 2. For each perceptual dimension, we selected the best single algorithm. On that basis, for scores of 1, 6, and 7 whose counts were below the sample mean, we applied a Conditional Generative Adversarial Network (CTGAN) to augment minority cases, then retrained with the chosen algorithm. Model performance was assessed using mean squared error (MSE), mean absolute error (MAE), and mean absolute percentage error (MAPE). The error indicators in Table 2 show that the CTGAN-enhanced models, paired with XGBoost, RF, and GBDT for safety, comfort, and belonging, respectively, outperformed their single-algorithm baselines.

4.2. Key Semantic Features Influencing Campus Environmental Perception

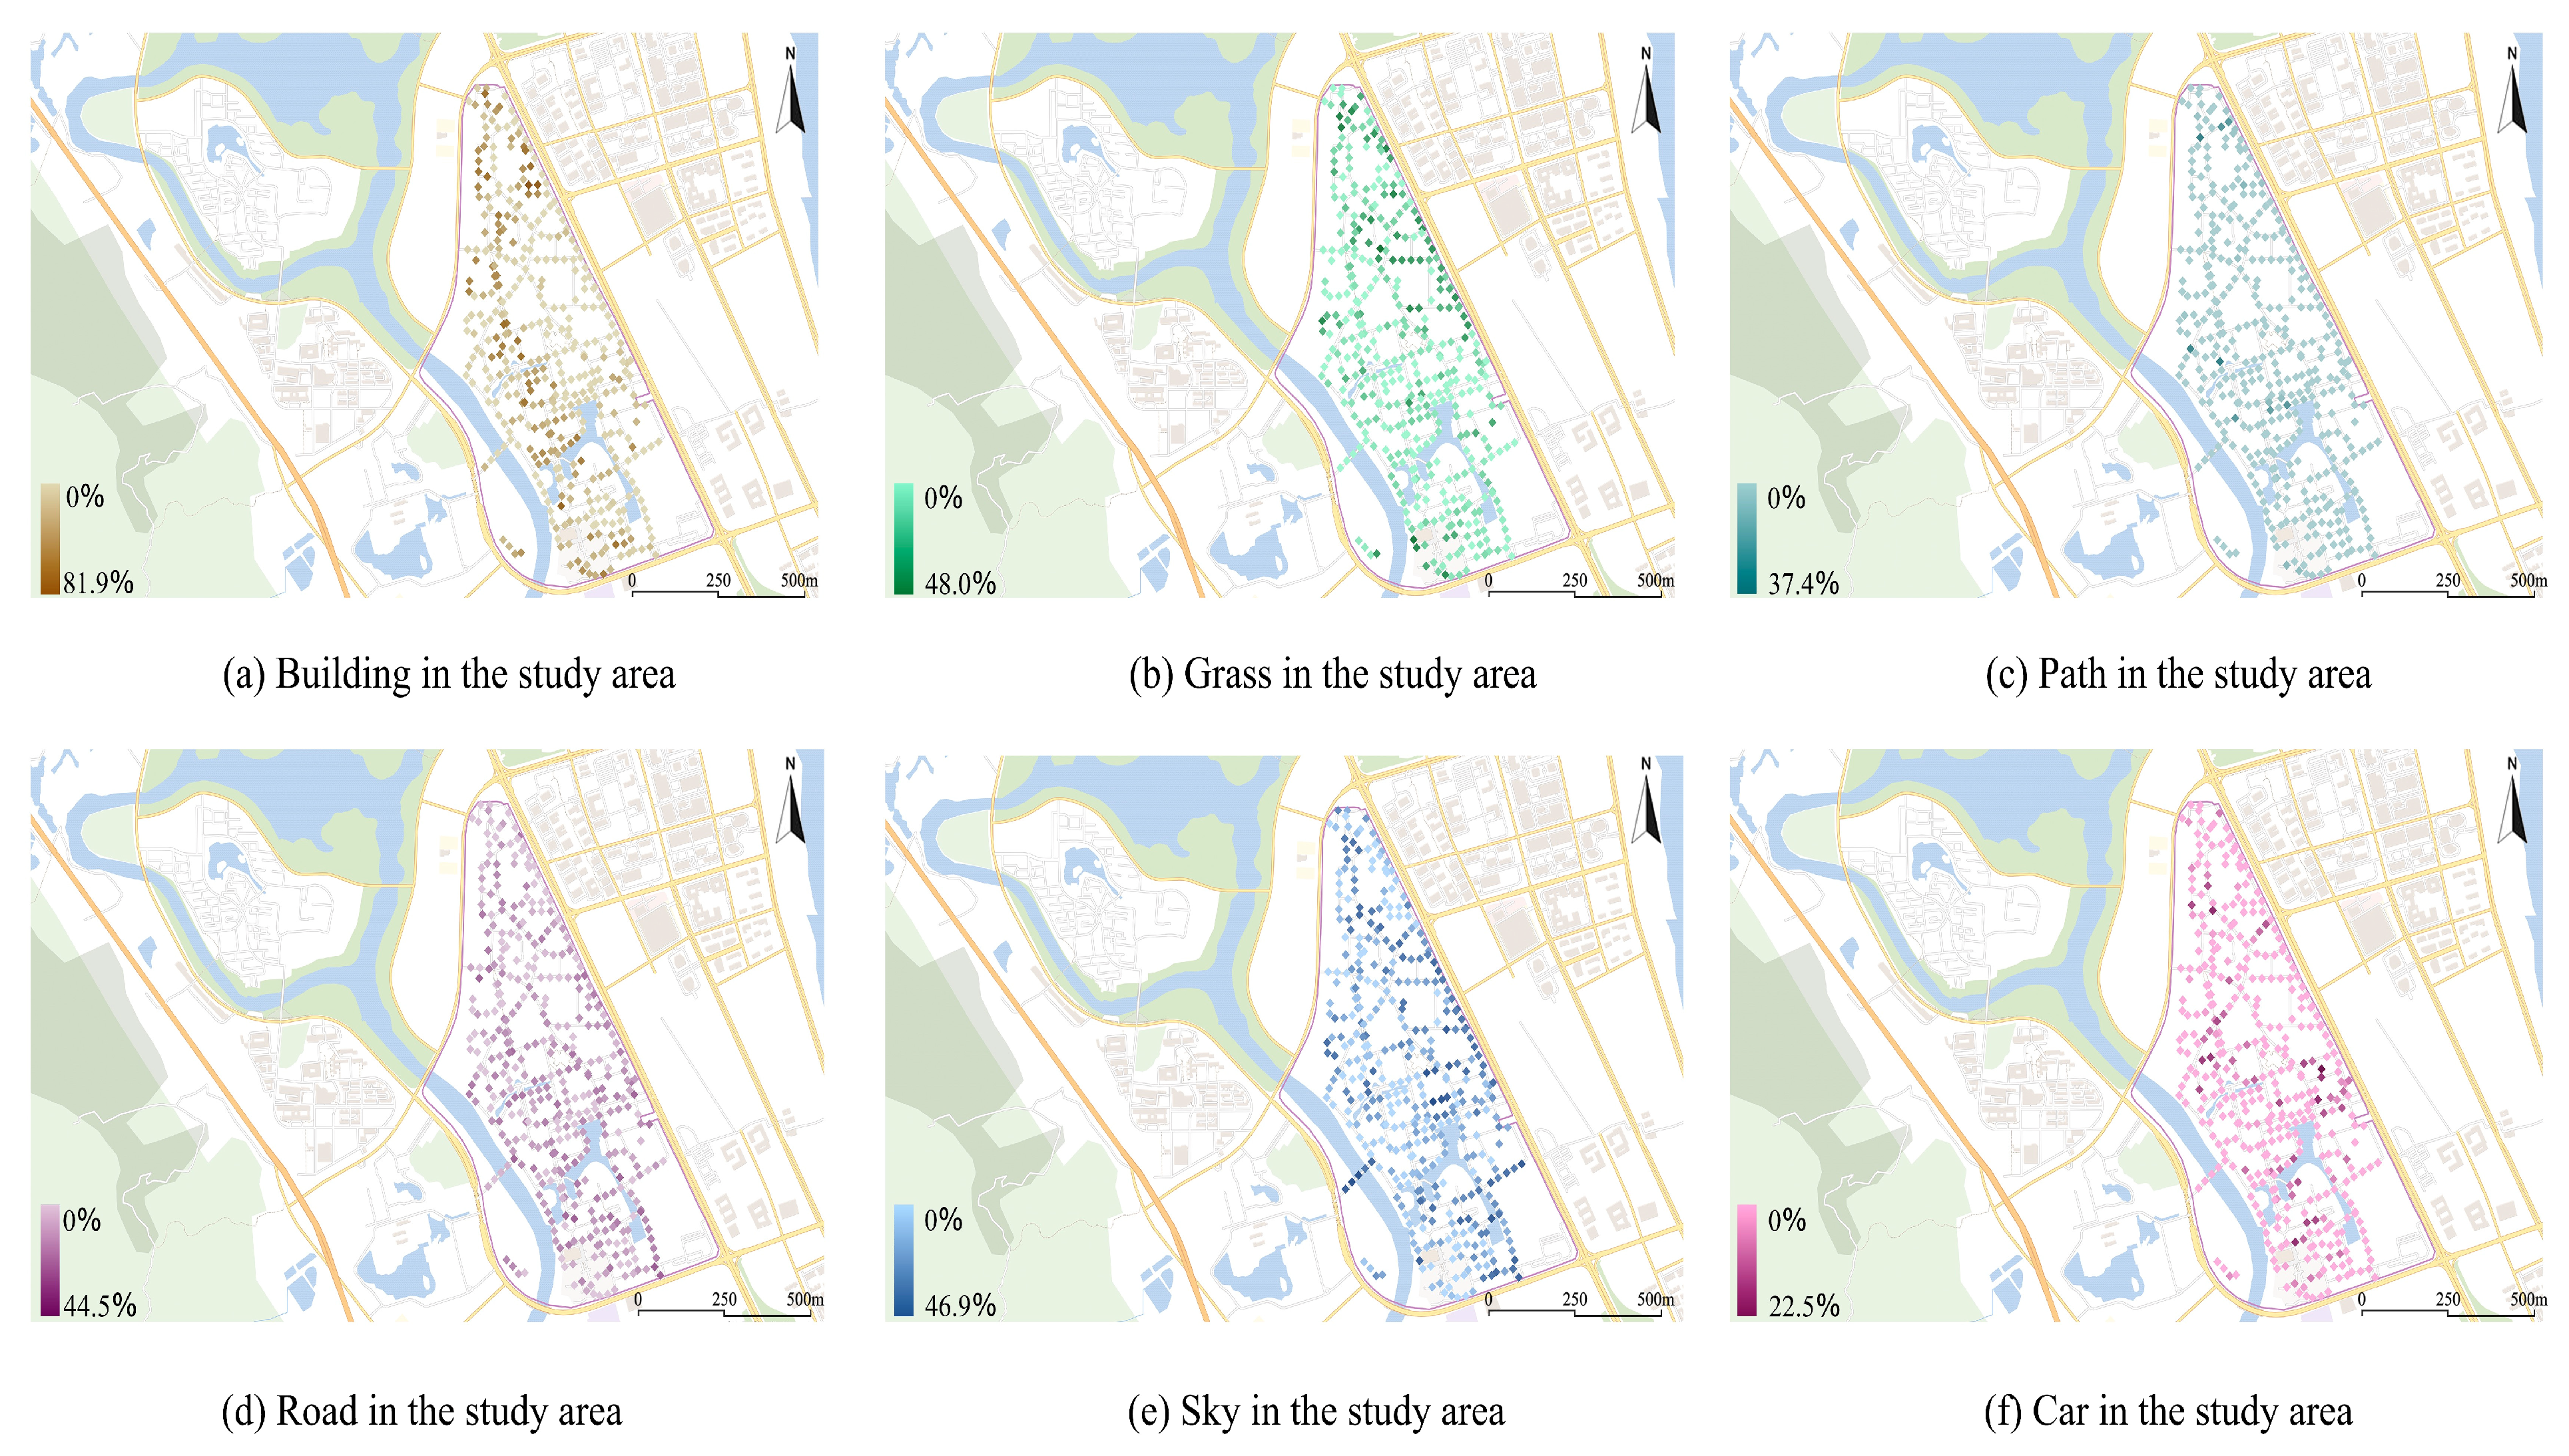
Figure 5 maps the spatial distribution of six key semantic features. Building clusters in core teaching zones and functional precincts, forming a high-density pattern that reflects spatial concentration. Grass is widespread across green areas and ecological buffers, forming the campus’s natural base. The path shows a mesh-like layout that supports walkability and spatial permeability. The road functions as the backbone network, covering the campus and enhancing circulation and spatial organization. Sky appears in open areas and between buildings, enhancing visual openness. Car points are dense along roads and parking areas, indicating traffic activity. Together, these patterns shape campus functions and perceptual experience, offering clear guidance for optimizing landscape structure and environmental quality.
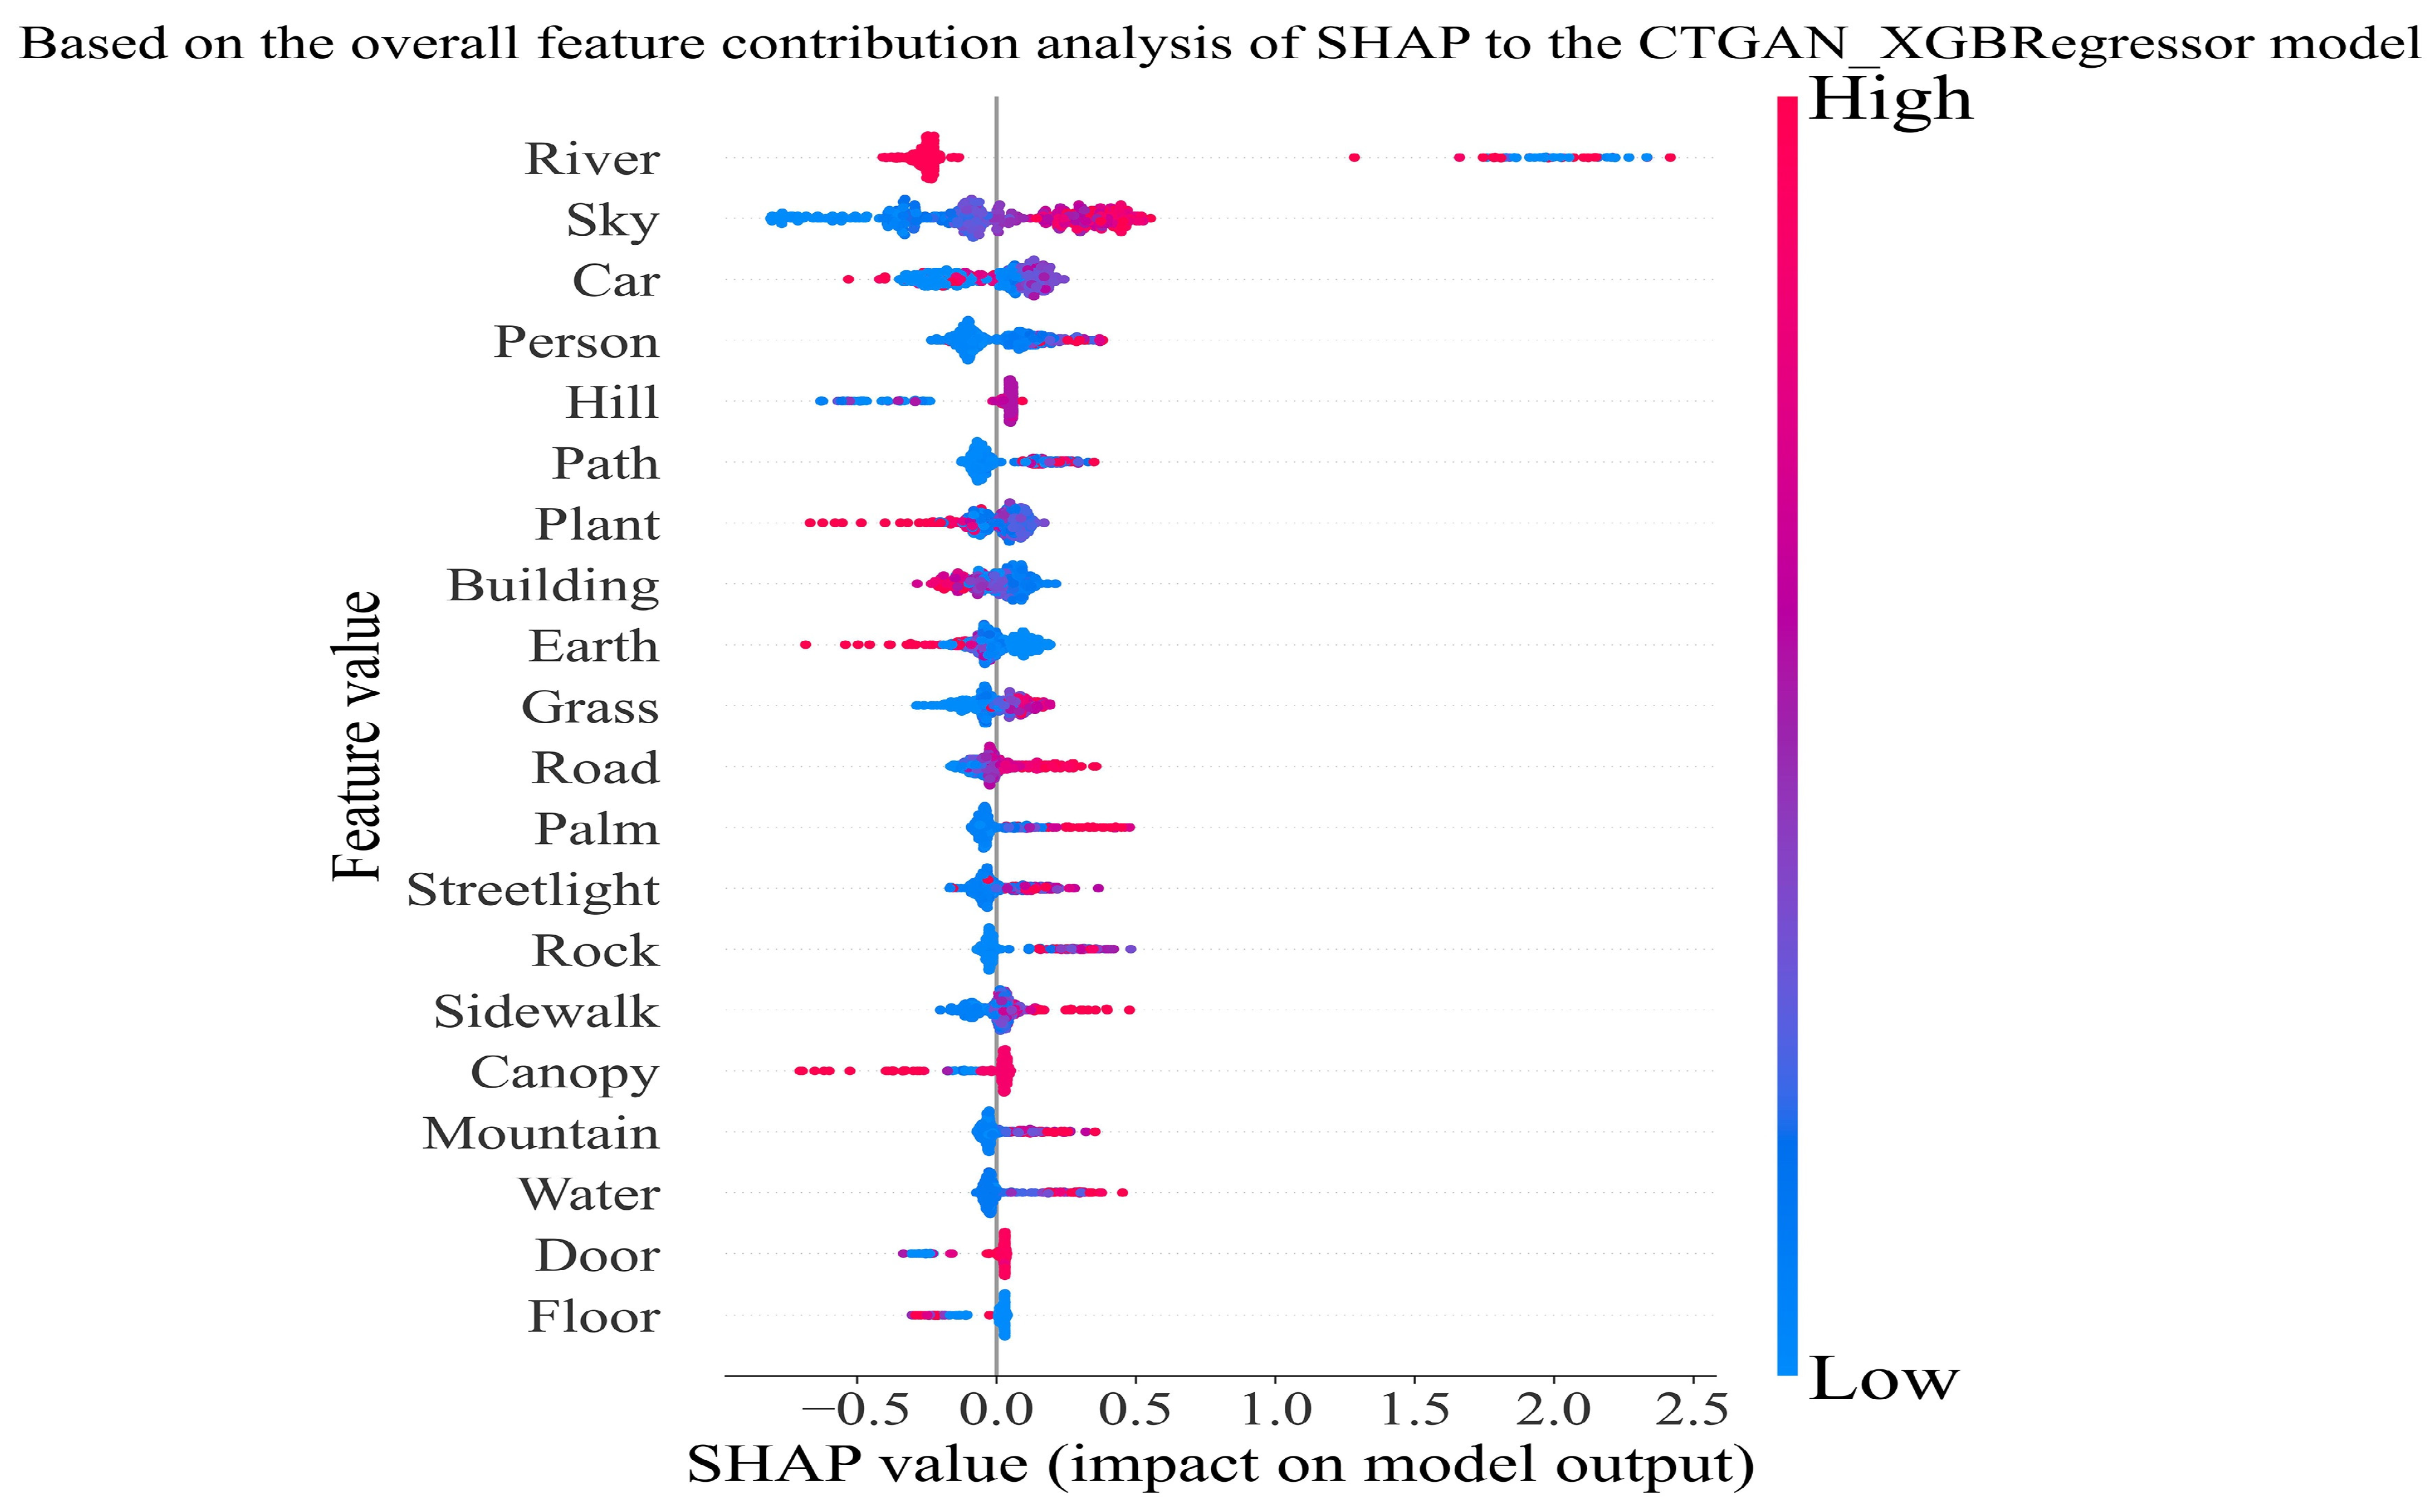
Figure 6 presents the feature-importance results for safety based on the combined CTGAN–XGBoost and SHAP models. Each row displays the SHAP value distribution for a single feature, with most features exhibiting few extremes and many values close to zero. The top six image semantic features affecting campus safety, in order, are River, Sky, Car, Person, Hill, and Path, followed by Plant, Building, and Earth. The SHAP distributions indicate that River contributes mainly to adverse effects on perceived safety. In contrast, higher SHAP values for Sky, Person, Hill, and Path correspond to positive effects on safety. For cars and buildings, Figure 6 indicates a negative effect on perceived safety. Figure 7 and Figure 8 further show that these two landscape features have a significant negative impact on comfort and sense of belonging. In summary, for campus safety, natural features such as rivers and broad sky show stronger negative associations, possibly due to the uncertainty of water and the unease that very open skies may evoke. In contrast, human-presence features (e.g., persons and paths) tend to enhance safety, suggesting that visible, controllable activity benefits students’ sense of security.
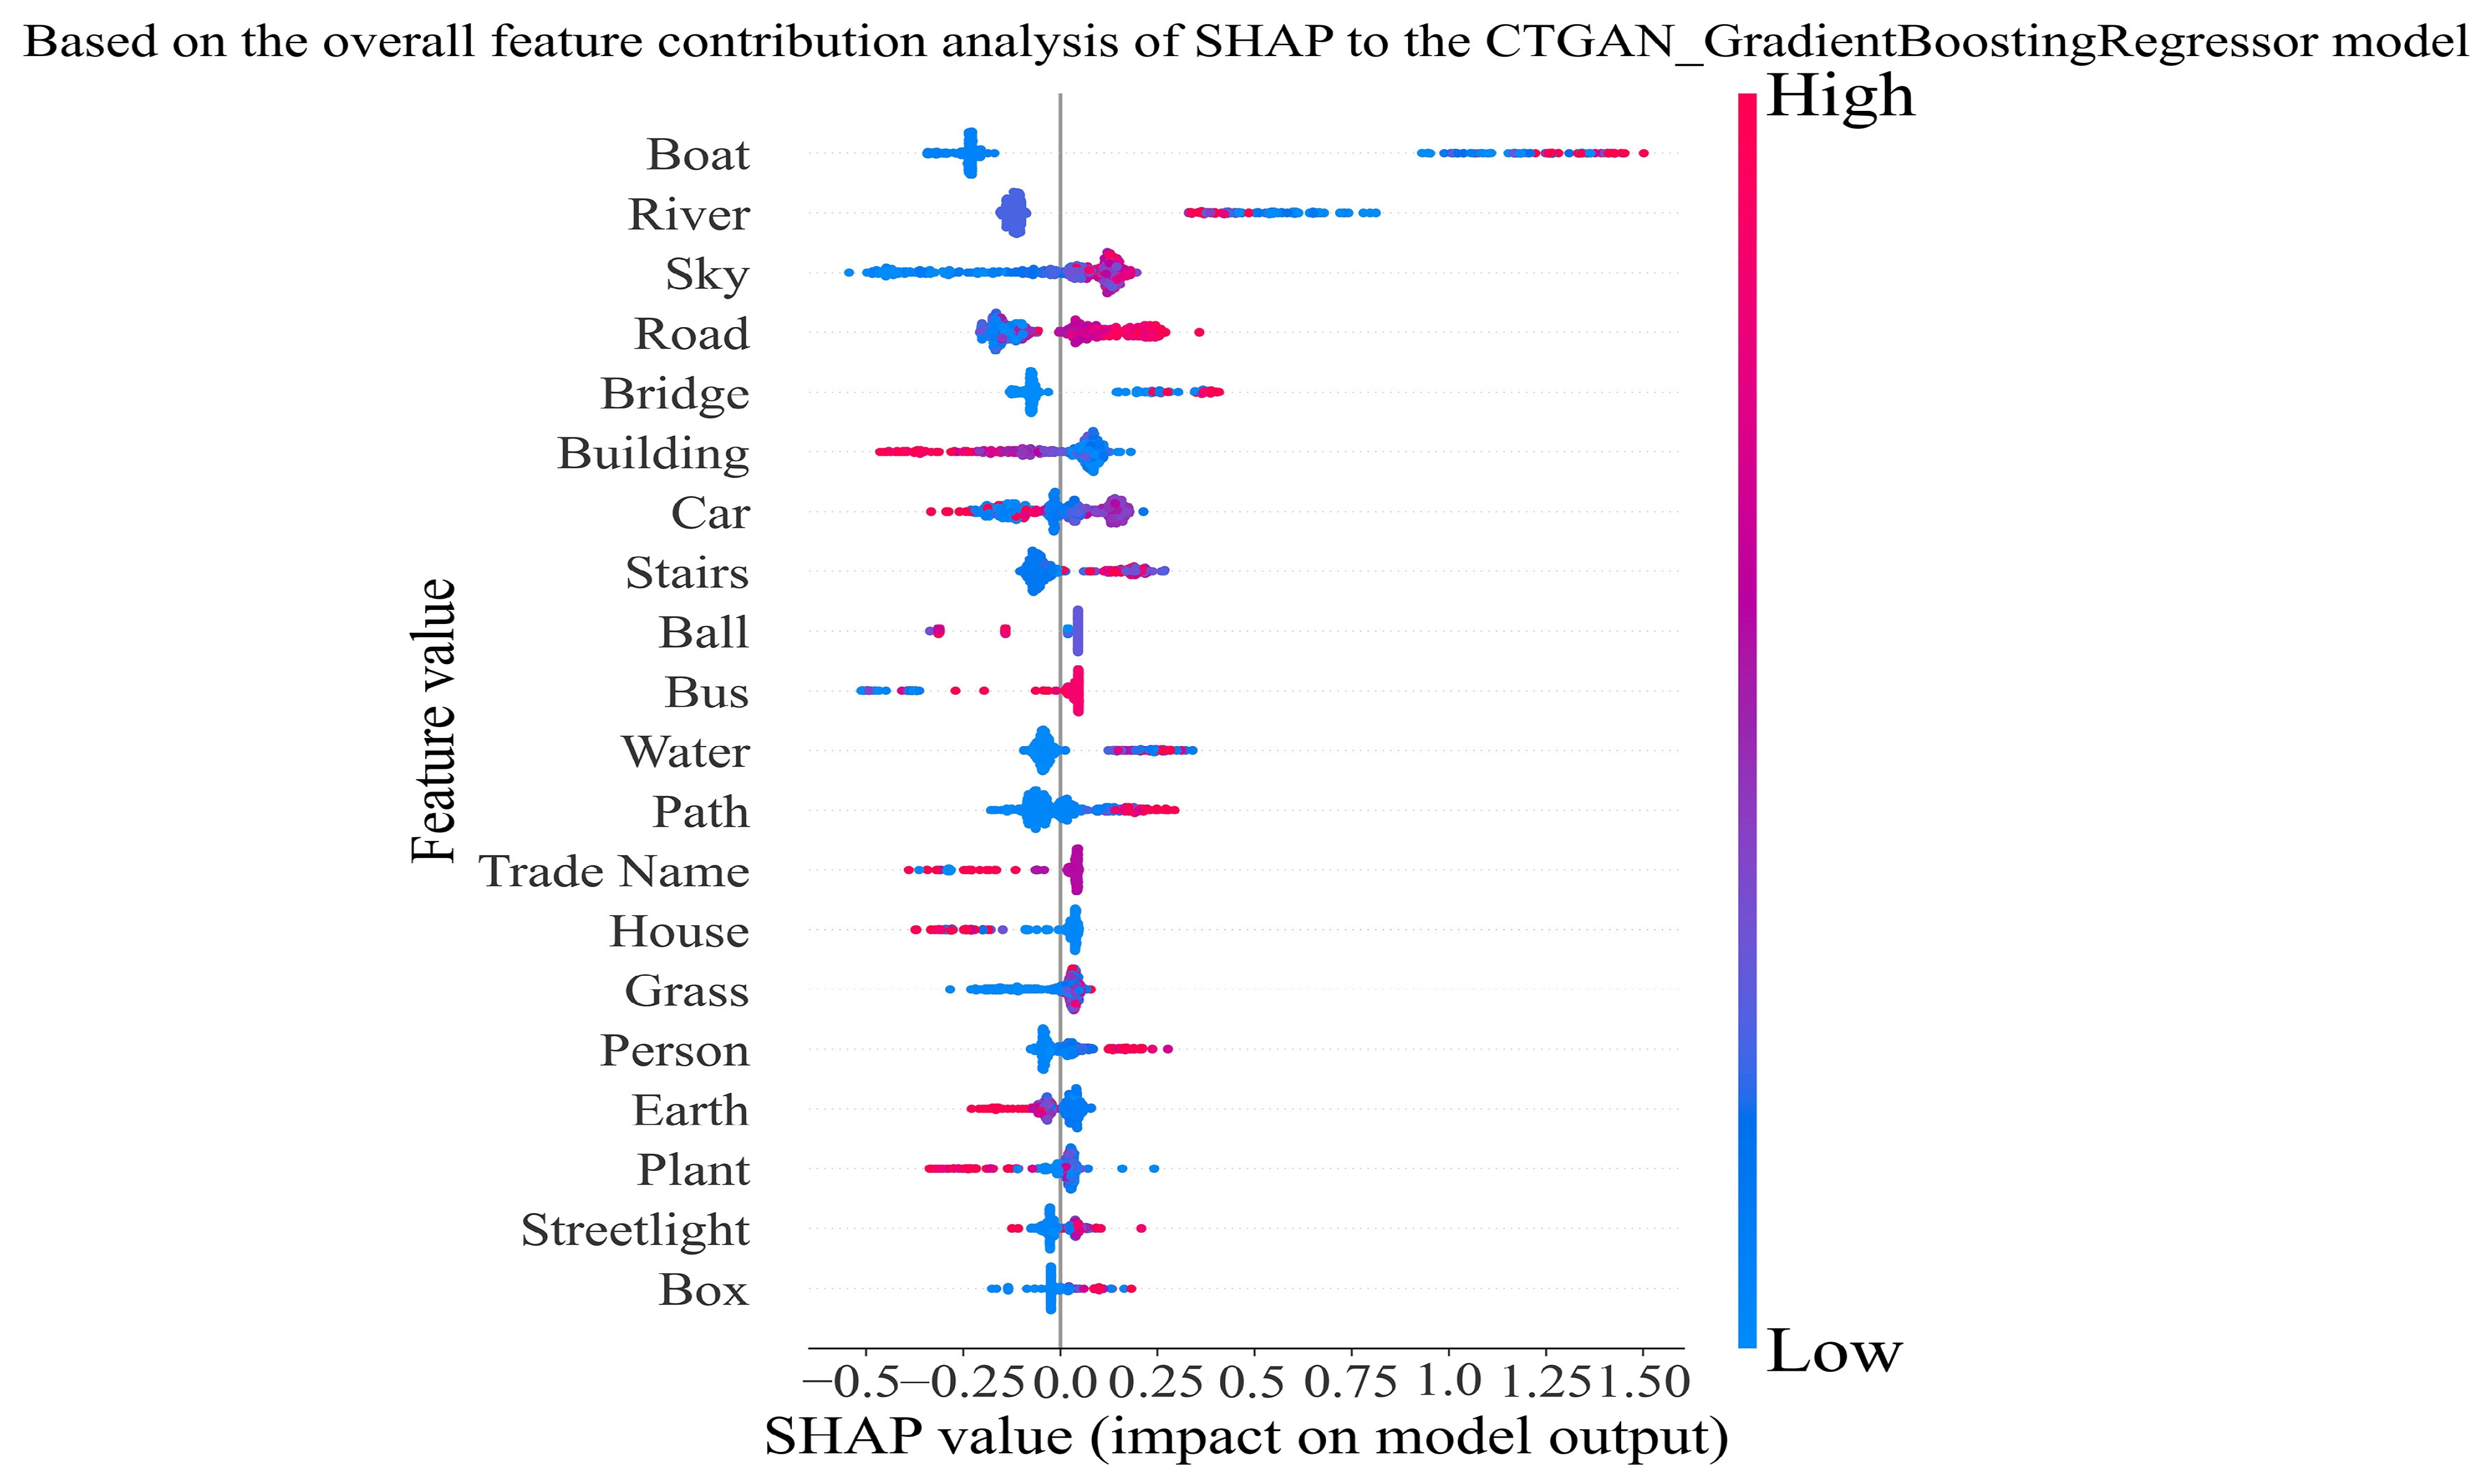
Figure 7 reports feature-importance results for environmental comfort using the combined CTGAN–GBDT and SHAP models. Ranked by importance, the top six image semantic features are Boat, River, Sky, Road, Bridge, and Building, followed by Car, Stairs, and Ball. The SHAP distributions show that for Boat, River, Sky, Road, and Bridge, high SHAP values cluster on the right, indicating mainly positive effects on campus comfort. For Ball, high SHAP values cluster on the left, indicating primarily adverse effects on comfort. Overall, for environmental comfort, the positive effects of Boat, River, Sky, Road, and Bridge imply that water reflections, coherent road layouts, and bridge design create open and pleasant settings that raise comfort. The adverse effects of buildings and cars suggest that dense building clusters and heavy traffic can lead to crowding and noise, thereby reducing overall comfort.
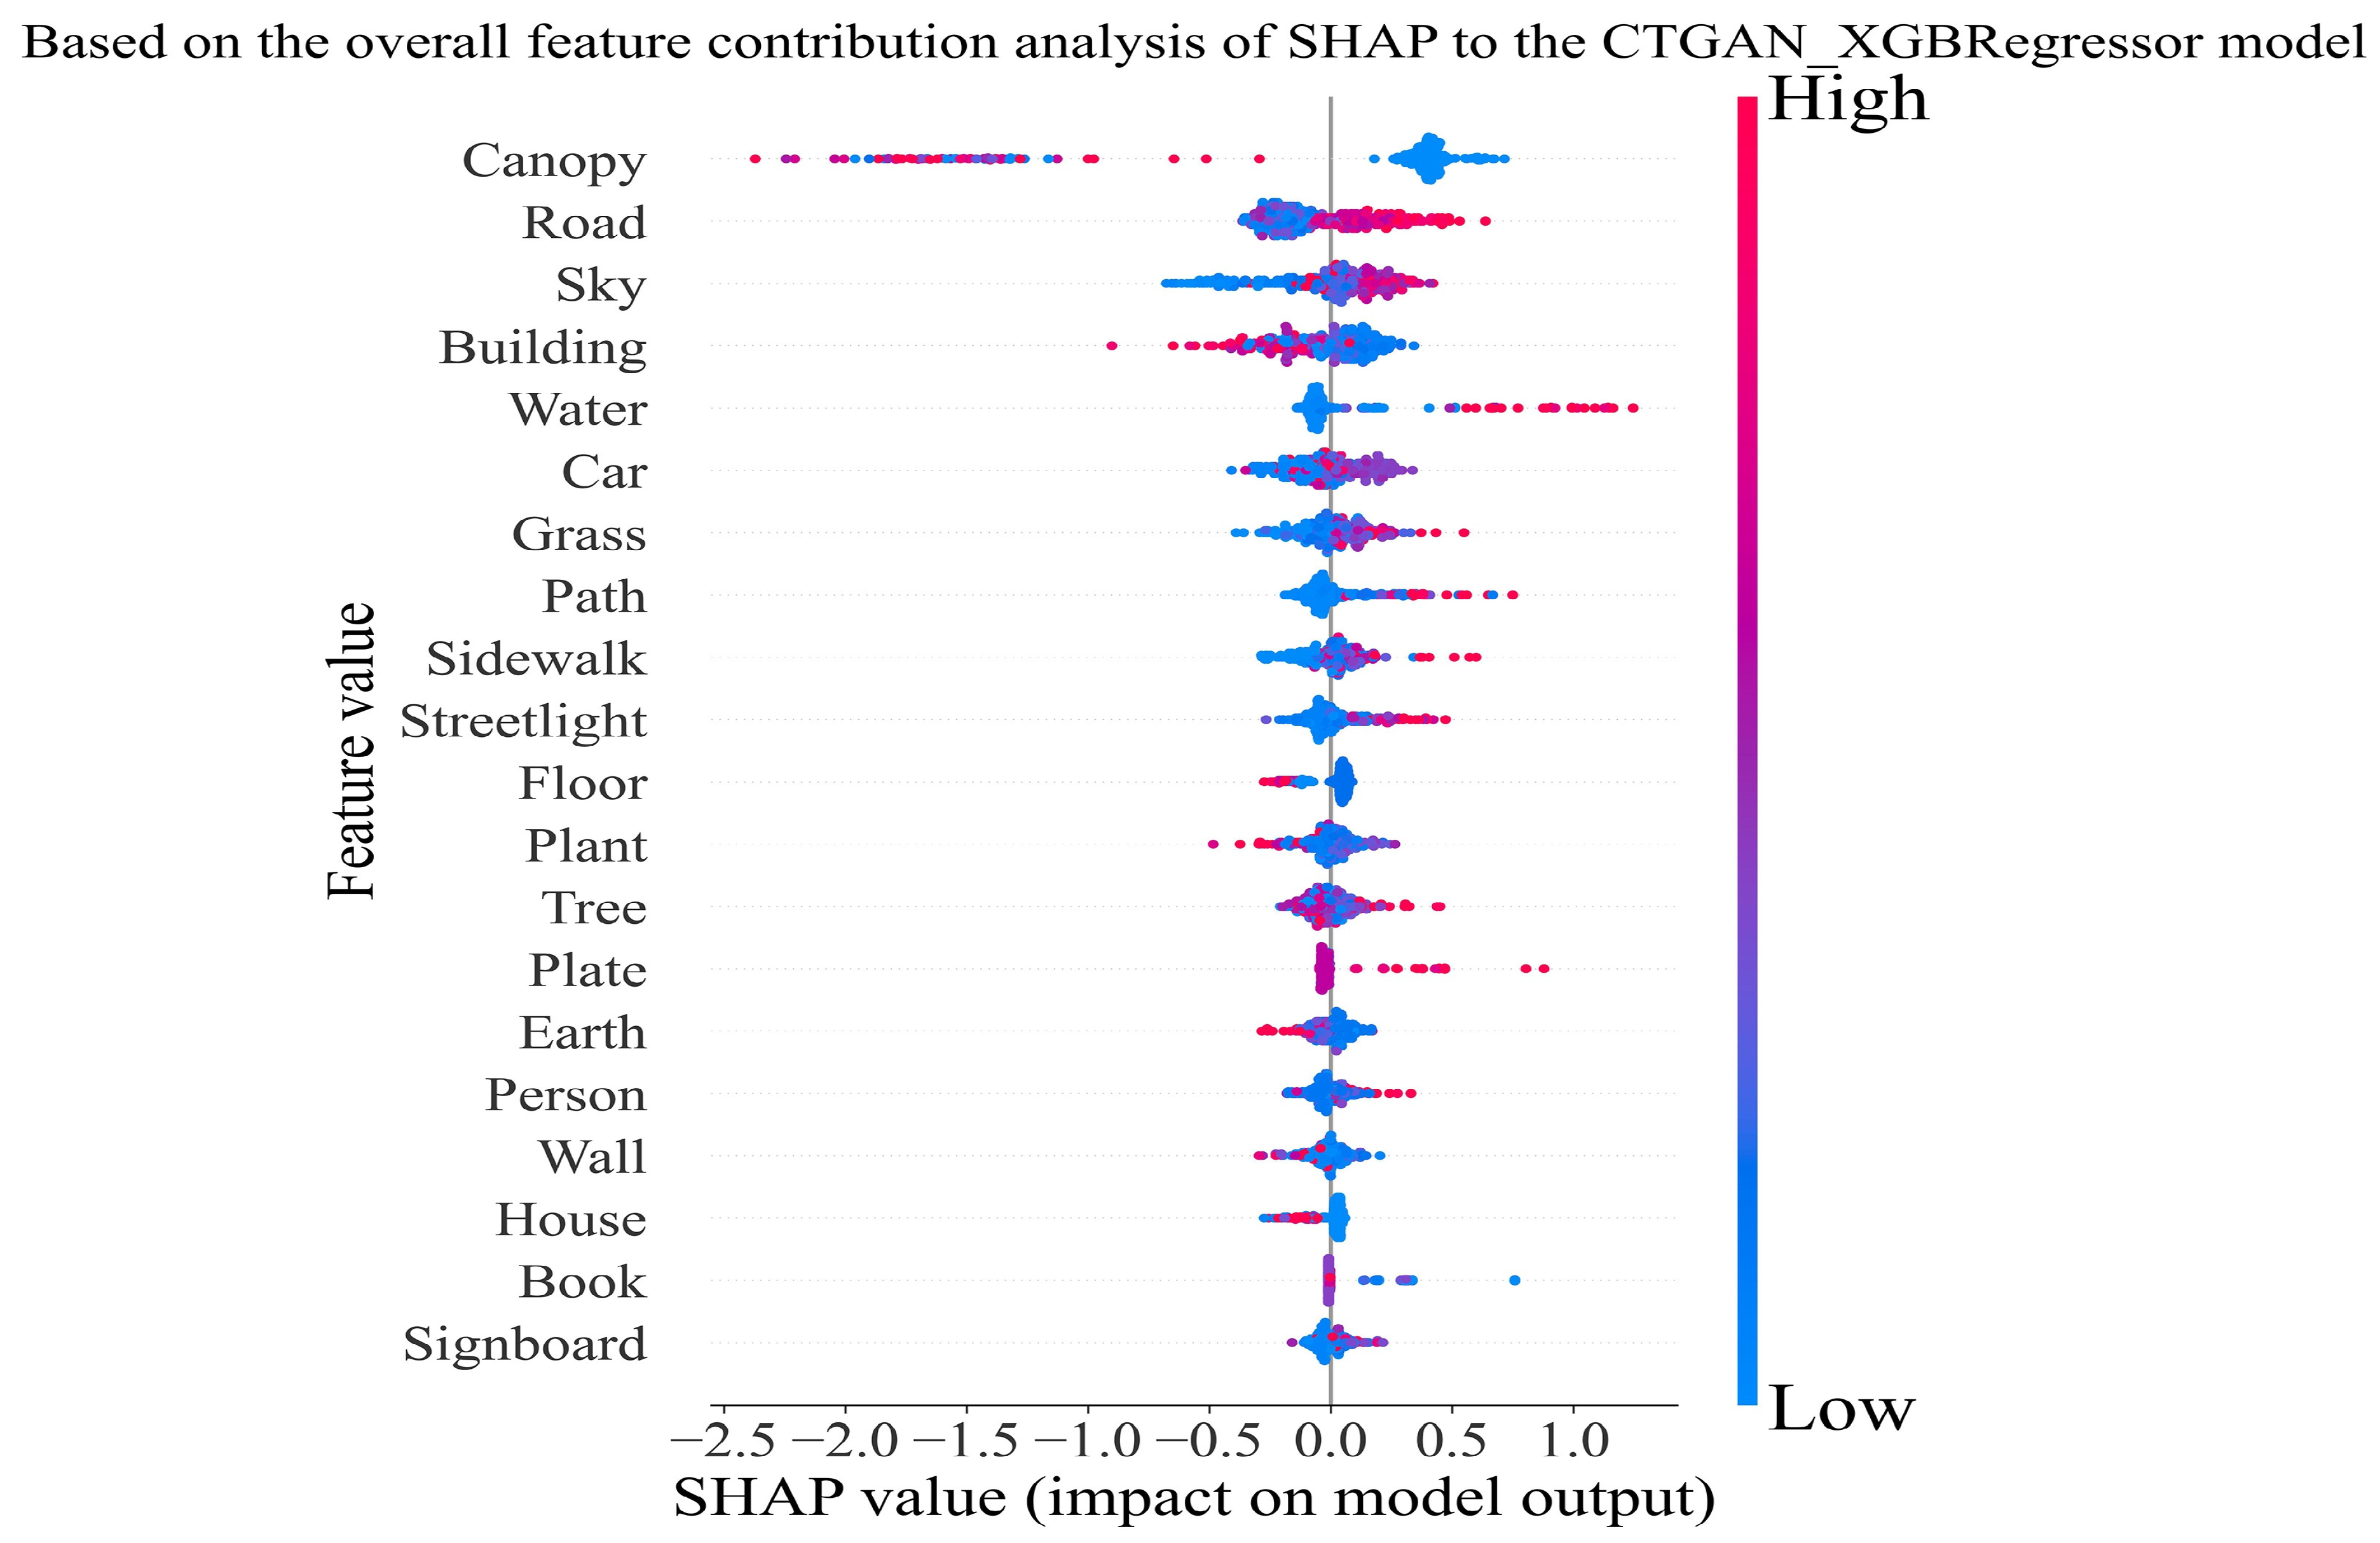
Figure 8 presents feature-importance results for sense of belonging using the combined CTGAN–XGBoost and SHAP models. Ranked by importance, the top six image semantic features are Canopy, Road, Sky, Building, Water, and Car, followed by Grass, Path, and Sidewalk. The SHAP distributions show that for Road, Water, Grass, Path, and Sidewalk, high SHAP values cluster on the right, indicating strong positive effects on belonging. For Canopy and Sky, high SHAP values cluster on the left, indicating pronounced adverse impact on belonging. In conclusion, for a sense of belonging, natural elements foster affinity and attachment, mainly grass and water, which symbolize open and free spaces. By contrast, Canopy, Sky, and Building show negative links that may stem from excessive enclosure and an isolating built context. Such occlusion can induce a feeling of isolation and weaken one’s sense of belonging.

4.3. Configuration Analysis for Enhancing Campus Environmental Perception

We further employ fuzzy-set Qualitative Comparative Analysis (fsQCA) to examine the configuration pathways by which campus landscape features enhance safety, comfort, and a sense of belonging. The recommended number of condition variables is 6–8 [55,56]. Before analysis, we calibrate fuzzy-set membership for both conditions and outcomes [57]. For safety, we initially selected River, Sky, Car, Person, Hill, and Path based on feature importance. The values at the 0.05, 0.25, and 0.50 percentiles for River, Hill, and Path are identical, making variable calibration and subsequent fsQCA analysis unfeasible. This is due to the rarity of these landscape features on campus, leading to their exclusion. Based on the previously mentioned feature importance, we have replaced them with Plant, Building, and Earth. For comfort, the six final features are Sky, Road, Building, Car, Grass, and Person. For belonging, the six final features are Road, Sky, Building, Car, Grass, and Sidewalk. Table 3 reports the full membership, crossover, and full nonmembership anchors for each set of features and the outcome.
Second, we present the necessity analysis for single landscape features, as shown in Table 4. All individual features have consistency below 0.9, indicating that no single feature is a necessary condition for campus safety, comfort, or sense of belonging. This suggests that changes in one feature have limited explanatory power for environmental perception, and that multiple features must act together through configuration and synergy to have a significant impact.
Based on the studies in [53,54,58], the consistency threshold is initially set to 0.75, the PRI consistency to 0.5, and the frequency threshold to 3. Given 391 sampling points (1564 images) and many rare condition combinations, a consistency threshold of 0.75 with a PRI of 0.50 balances substantive sufficiency against overlap, reducing spurious solutions un-der moderately overlapping sets. A frequency cutoff of 3 filters out configurations backed by only one or two cases, which suits this sample size and limited diversity, keeping the final solutions stable and interpretable. The decision to adjust the threshold boundaries was based on the tuning results of the intermediate solutions. Subsequent results show that the valid paths are consistently 2–3, so there is no need to increase the thresholds further to reduce the number of paths.
Panel A of Table 5 reports the fsQCA configuration results for campus safety. In the notation, the presence of a peripheral condition is marked “●”, its absence is marked “⊗”, the presence of a core condition is marked “●”, and the absence of a core condition is marked “⊗”. Interpretation of the optimization pathways should be aligned with the effect directions reported in Section 4.2.
Panel A of Table 5 indicates that Configuration A1 achieves a high level of campus security with high sky density, high crowd density, and low building density as peripheral conditions. Configuration A2 attains the same outcome with high sky density, high crowd density, and low earth density as peripheral conditions, while low car density is not required (some traffic is permitted). Thus, there are two routes to a high level of campus safety: (i) high sky density + high crowd density + low building density; or (ii) high sky density + high crowd density + low earth density, even when traffic is present. The overall consistency is 0.78, indicating strong sufficiency in relation to the standard criteria. Overall coverage is 0.50, meaning that about half of the cases are explained, and the overall PRI is 0.53, indicating moderate discriminating power. The above results suggest that in areas with high building density, enhanced vertical surveillance and crowd management should be prioritized, while in areas primarily for ground activities, focus should be on spatial planning and optimizing traffic flow.
Panel B of Table 5 shows two configurations for a high level of campus comfort. Configuration B1 achieves the outcome with high road density, high pedestrian flow, and low building density as peripheral conditions. Configuration B2 achieves the outcome with high sky density, low vehicle density, high grass density, and high pedestrian flow as peripheral conditions. The two configurations have an overall consistency of 0.85, overall coverage of 0.41, and overall PRI of 0.69. Their shared peripheral condition is high pedestrian flow. Under low building density, B1 attains high comfort by increasing the share of roads. Under low vehicle density, B2 attains high comfort by increasing pedestrian density, sky openness, and grass coverage. Based on the above results, two differentiated practical approaches can be adopted to improve campus comfort: prioritize optimizing network accessibility in areas with sparse buildings, and focus on open space design and green space permeability in areas with traffic restrictions. Both approaches should ensure sufficient support for pedestrian activity.
Panel C of Table 5 identifies three configurations that contribute to a high level of campus belonging. Configuration C1 reaches the outcome with high road density and high sky openness as peripheral conditions. Configuration C2 reaches the outcome with high sky openness and high sidewalk density as peripheral conditions. Configuration C3 reaches the outcome with high road density, high grass density, and high sidewalk density as peripheral conditions. The overall consistency is 0.66, indicating solid sufficiency, and the overall coverage is 0.83, demonstrating broad case coverage. In summary, C1 and C2 share high sky openness, C1 and C3 share high road density, and C2 and C3 share high sidewalk density. This suggests that broader sky views and a dense network of walking paths strengthen students’ sense of belonging to the campus. Therefore, campus planning should focus on enhancing the visual permeability of open spaces and the continuity of pedestrian networks. For example, controlling building heights along main roads and walkways and increasing green visibility can help create a campus environment with a stronger sense of belonging.
The results of this study contribute to campus landscape optimization. For safety management, differentiated strategies should be adopted based on building density and ground activity. In high-density areas, vertical surveillance and crowd guidance should be strengthened, while spatial layout and traffic flow should be optimized in open activity areas. To improve comfort, network accessibility should be prioritized in areas with sparse buildings, and open space design and green permeability in traffic-restricted areas, ensuring a pedestrian-friendly environment. For fostering a sense of belonging, building heights along major roads and walkways should be controlled, while enhancing sky visibility, green experience, and pedestrian network connectivity.

5. Discussion

In the discussion, and in line with prior work, we first employ a multiple linear regression model to examine how the landscape elements in Table 5 influence environmental perception. This step demonstrates that numerous regressions can reveal single-feature effects but cannot provide guidance on optimizing campus spatial quality from the perspective of combined effects across multiple features.
The regression results in Table 6 align closely with the SHAP distributions in Figure 5, Figure 6 and Figure 7. For campus safety (Table 6, Panel A), the estimated coefficients are: Sky = 0.0354, Person = 0.1215, Plant = −0.0263, Building = −0.0109, and Earth = −0.0344. All are significant at the 5% level or higher. The model’s R 2 and F-statistic indicate a good fit. However, Table 6 only reveals the effects of single landscape features on environmental perception; it does not show how multiple features act in combination to enhance campus spatial quality.
In the discussion, we also compare our work with prior studies to highlight its advantages. Table 7, Panel A, shows that explainable machine learning methods, such as tree models with SHAP, can identify key landscape elements and reveal threshold effects; however, they have their limits. A central issue is the accuracy of feature identification. Although [31,42,59] employed explainable machine learning, their predictions were weaker because, as Table 2 indicates, they did not utilize CTGAN to address class imbalance in perception scores, which may have biased their conclusions. In contrast, this study effectively mitigates model bias caused by uneven sample distribution by introducing CTGAN to generate synthetic data. This significantly improves the identification accuracy of key landscape features and the overall predictive stability of the model.
Table 7, Panel B, summarizes the use of multiple linear regression (MLR) in campus landscape studies [60,61,62]. MLR can quantify links between landscape elements and mental health or satisfaction. However, it only captures single-feature effects on environmental perception and cannot uncover the combined effects of multiple features needed to improve perception, which restricts its usefulness. Compared to multiple linear regression, the configurational approach used in this study identifies multiple equivalent pathways leading to high perception results. This explains why similar senses of belonging can emerge under different conditions (e.g., high sky openness with high walkway density or high road density with high greenery). This not only expands the understanding of landscape synergistic effects but also provides a theoretical basis for differentiated planning strategies.
The results of this study contribute to campus landscape optimization. For safety management, differentiated strategies should be adopted based on regional building density and ground activity characteristics. In high-density built areas, vertical surveillance and crowd guidance should be enhanced, while spatial layout and traffic flow should be optimized in open ground activity areas. To improve comfort, network accessibility should be prioritized in areas with sparse buildings, while open space design and green space permeability should be emphasized in traffic-restricted areas, ensuring a pedestrian-friendly environment. For fostering a sense of belonging, attention should be given to controlling building heights along major roads and walkways, enhancing sky visibility and green views, and establishing a coherent pedestrian network.

6. Conclusions

This study investigated the relationship between campus landscape features and environmental perception, specifically examining safety, comfort, and a sense of belonging. By combining semantic image segmentation, augmentation-based explainable machine learning, and fuzzy-set qualitative comparative analysis, we identified key features that shape students’ perceptions and uncovered effective configuration pathways for landscape optimization. The main conclusions are:
(1)
The sense of security is achieved through the combination of high sky openness and high pedestrian traffic, supported by either low building density or low hardscape density. This pathway remains valid even with a certain level of traffic flow.
(2)
The formation of comfort follows two distinct pathways: the first is a combination of high road visibility, high pedestrian traffic, and low building density; the second results from the combined effects of high sky openness, low traffic volume, abundant greenery, and active pedestrian activity.
(3)
The formation of comfort follows two distinct pathways, while the creation of a sense of belonging can be achieved in three ways: the combination of high road density and open sky views, the pairing of sky openness with a clear walkway system, or the synergy of high road density, ample greenery, and well-defined walkways.
This configurational framework, identifying multiple equifinal pathways to positive perceptual outcomes, is replicable and provides a transferable model for evidence-based planning in a wide range of campus and urban environments.
Based on our findings, we propose the following design guidelines. To enhance safety, create open, obvious spaces, moderately control building density, and provide paths with visible pedestrian flow to improve sightlines and a sense of control. For comfort, incorporate natural elements such as green spaces and water, and refine the visual and functional design of roads and bridges to enhance the microclimate, mitigate heat island effects, and provide pleasant areas for rest. For belonging, pair broad sky views with a continuous, accessible walkway system to strengthen legibility and connectivity, encourage community interaction, and deepen students’ identification with the campus.
This study has three limitations. First, the case site is a regular university in China, so the findings may not generalize to other regions or educational settings; future research should include cross-cultural comparisons to test their applicability. Second, some high-ranking SHAP features (e.g., River, Boat, Hill) were excluded from fsQCA because many observations had zero values in the segmentation outputs, which failed the percentile calibration rule. Future work should introduce continuous variables with fewer zeros—such as tree canopy, green space area, light intensity, and road networks—to analyze configuration pathways for optimizing campus spatial quality. Third, we relied on static street-view images, which do not capture temporal and seasonal variation in perception; future studies can use multi-temporal imagery to explore differences across seasons and times of day.

Author Contributions

Conceptualization, X.Z.; Methodology, X.Z., Y.C. and Z.T.; Software, Z.D. and C.G.; Writing—original draft preparation, X.Z.; Writing—review and editing, Y.C. and Z.D.; Supervision, Visualization, Z.D. and C.G.; Funding acquisition, Z.T. and Z.D. All authors have read and agreed to the published version of the manuscript.

Funding

This research work was supported by the National Natural Science Foundation of China under Grant No. 72341030, and the Special Funding Project of the China Agricultural and Forestry University Design Art Alliance under Grant No. 111900050.

Data Availability Statement

The original contributions presented in this study are included in the article. Further inquiries can be directed to the corresponding author.

Conflicts of Interest

The authors declare no conflicts of interest.

References

  1. Demuzere, M.; Orru, K.; Heidrich, O.; Olazabal, E.; Geneletti, D.; Orru, H.; Bhave, A.G.; Mittal, N.; Feliu, E.; Faehnle, M. Mitigating and Adapting to Climate Change: Multifunctional and Multi-Scale Assessment of Green Urban Infrastructure. J. Environ. Manag. 2014, 146, 107–115. [Google Scholar] [CrossRef] [PubMed]
  2. Kumar, P.; Debele, S.E.; Khalili, S.; Halios, C.H.; Sahani, J.; Aghamohammadi, N.; Andrade, M.d.F.; Athanassiadou, M.; Bhui, K.; Calvillo, N.; et al. Urban Heat Mitigation by Green and Blue Infrastructure: Drivers, Effectiveness, and Future Needs. Innovation 2024, 5, 100588. [Google Scholar] [CrossRef]
  3. Guo, W.; Wen, H.; Liu, X. Research on the Psychologically Restorative Effects of Campus Common Spaces from the Perspective of Health. Front. Public Health 2023, 11, 1131180. [Google Scholar] [CrossRef] [PubMed]
  4. Liu, H.; Wang, Y.; He, Q.; Wang, X.; Cui, C.; Gong, Y. Assessing the Restorative Effects of Campus Greenness on Student Depression: A Comparative Study Across Three Distinct University Campus Types in Macau. BMC Public Health 2025, 25, 907. [Google Scholar]
  5. Qi, F.; Parra, A.O.; Block-Lerner, J.; McManus, J. Psychological Impacts of Urban Environmental Settings: A Micro-Scale Study on a University Campus. Urban Sci. 2024, 8, 73. [Google Scholar] [CrossRef]
  6. Gulwadi, G.B.; Mishchenko, E.D.; Hallowell, G.; Alves, S.; Kennedy, M. The Restorative Potential of a University Campus: Objective Greenness and Student Perceptions in Turkey and the United States. Landsc. Urban Plan. 2019, 187, 36–46. [Google Scholar] [CrossRef]
  7. Carrus, G.; Scopelliti, M.; Lafortezza, R.; Colangelo, G.; Ferrini, F.; Salbitano, F.; Agrimi, M.; Portoghesi, L.; Semenzato, P.; Sanesi, G. Go Greener, Feel Better? The Positive Effects of Biodiversity on the Well-Being of Individuals Visiting Urban and Peri-Urban Green Areas. Landsc. Urban Plan. 2015, 134, 221–228. [Google Scholar] [CrossRef]
  8. Speake, M. Campus Landscape and Social Cohesion: The Role of Open Spaces. Urban Des. Int. 2013, 18, 201–210. [Google Scholar]
  9. Sun, S. The Role of Campus Green Spaces in Enhancing Social Interaction and Well-Being. J. Urban Green Spaces 2025, 24, 112–125. [Google Scholar]
  10. Lee, J.; Park, B.; Lee, C. Effects of Green Space on Recovery from Mental Fatigue. Environ. Behav. 2008, 40, 517–540. [Google Scholar]
  11. Berman, M.G.; Jonides, J.; Kaplan, S. The Cognitive Benefits of Interacting with Nature. Psychol. Sci. 2008, 19, 1207–1212. [Google Scholar] [CrossRef] [PubMed]
  12. Hartig, T.; Mang, M.; Evans, G.W. Restorative Effects of Natural Environment Experiences. Environ. Psychol. 2003, 23, 3–14. [Google Scholar] [CrossRef]
  13. Kaplan, R. The Restorative Benefits of Nature: Toward an Integrative Framework. J. Environ. Psychol. 1995, 15, 169–182. [Google Scholar] [CrossRef]
  14. Li, J.; Wang, X.; Zhang, Y. Urban Green Space and Microclimate: Impacts on Thermal Comfort and Urban Heat Island. Landsc. Urban Plan. 2019, 184, 109–118. [Google Scholar]
  15. Wang, Y.; Huang, S.; Li, X. The Role of Green Infrastructure in Urban Water Management: A Case Study of Rainwater Gardens. Ecol. Eng. 2020, 156, 103–112. [Google Scholar]
  16. Wang, J.; Zhang, Z.; Li, X. The Ecological Value of Campus Trees in Urban Areas: A Comprehensive Evaluation. Urban For. Urban Green. 2019, 44, 126–137. [Google Scholar]
  17. Li, L.; Zhang, Y.; Zhao, Q. Optimization of Campus Green Space Layout for Enhancing Ecological Services and Space Utilization. Sustainability 2021, 13, 5141. [Google Scholar]
  18. McFarland, A.L.; Waliczek, T.M.; Zajicek, J.M. The relationship between student use of campus green spaces and perceptions of quality of life. HortTechnology 2008, 18, 232–238. [Google Scholar] [CrossRef]
  19. Malekinezhad, F.; Courtney, P.; bin Lamit, H.; Vigani, M. Investigating the mental health impacts of university campus green space through perceived sensory dimensions and the mediation effects of perceived restorativeness on restoration experience. Front. Public Health 2020, 8, 578241. [Google Scholar] [CrossRef]
  20. Hipp, J.A.; Gulwadi, G.B.; Alves, S.; Sequeira, S. The relationship between perceived greenness and perceived restorativeness of university campuses and student-reported quality of life. Environ. Behav. 2016, 48, 1292–1308. [Google Scholar] [CrossRef]
  21. Gao, W.; Tang, B.M.; Liu, B. Effects of Landscape Characteristic Perception of Campus on College Students’ Mental Restoration. Behav. Sci. 2025, 15, 470. [Google Scholar] [CrossRef]
  22. Felsten, G. Where to take a study break on the college campus: An attention restoration theory perspective. J. Environ. Psychol. 2009, 29, 160–167. [Google Scholar] [CrossRef]
  23. Zhang, J.; Jin, J.; Liang, Y. The Impact of Green Space on University Students’ Mental Health: The Mediating Roles of Solitude Competence and Perceptual Restoration. Sustainability 2024, 16, 707. [Google Scholar] [CrossRef]
  24. Foellmer, J.; Kistemann, T.; Anthonj, C. Academic greenspace and well-being-Can campus landscape be therapeutic? Evidence from a German university. Wellbeing Space Soc. 2021, 2, 100003. [Google Scholar] [CrossRef]
  25. Zhang, P.; He, Q.; Chen, Z.; Li, X.; Ma, J. An empirical study on the promotion of students’ physiological and psychological recovery in green space on campuses in the postepidemic era. Int. J. Environ. Res. Public Health 2022, 20, 151. [Google Scholar] [CrossRef]
  26. Xu, Y.; Wang, T.; Wang, J.; Tian, H.; Zhang, R.; Chen, Y.; Chen, H. Campus landscape types and pro-social behavioral mediators in the psychological recovery of college students. Front. Psychol. 2024, 15, 1341990. [Google Scholar] [CrossRef]
  27. Diao, W.; Li, S.; Zhao, B.; Zhang, F. Estimation of Mediators in the Associations between Campus Green Spaces and Students’ Anxiety: A Case Study in Nanjing. Front. Psychol. 2024, 15, 1396548. [Google Scholar] [CrossRef] [PubMed]
  28. Li, L.; Zhang, Y.; Zhao, Q. Campus open spaces and students’ psychological well-being: A meta-analysis. Buildings 2025, 15, 2835. [Google Scholar] [CrossRef]
  29. Chen, W.Y.; Wang, D.; Zhang, W. Social functional mapping of urban green space using remote sensing and GIS. J. Photogramm. Remote Sens. 2019, 149, 436–452. [Google Scholar]
  30. Ma, Y.; Zheng, X.; Liu, M.; Liu, D.; Ai, G.; Chen, X. Spatio-temporal evolution characteristics analysis and optimization prediction of urban green infrastructure: A case study of Beijing, China. Sci. Rep. 2022, 12, 10702. [Google Scholar] [CrossRef]
  31. Zhuang, X.; Tang, Z.; Lin, S.; Ding, Z. Prediction and Optimization of the Restoration Quality of University Outdoor Spaces: A Data-Driven Study Using Image Semantic Segmentation and Explainable Machine Learning. Buildings 2025, 15, 2936. [Google Scholar] [CrossRef]
  32. Chai, X.; Liu, Y.; Niu, J.; Miao, Y. Landscape Complex Planning in the Big Data Era. Int. J. Agric. Environ. Inf. Syst. 2025, 16, 1–19. [Google Scholar] [CrossRef]
  33. Weaver, B.J. Mission and Place: Strengthening Learning and Community through Campus Design. Rev. High. Educ. 2006, 29, 545–546. [Google Scholar] [CrossRef]
  34. Dosen, A.S.; Ostwald, M.J. Evidence for prospect-refuge theory: A meta-analysis of the findings of environmental preference research. City Territ. Archit. 2016, 3, 4. [Google Scholar] [CrossRef]
  35. Peng, Y.-L.; Li, Y.; Cheng, W.-Y.; Wang, K. Evaluation and Optimization of Sense of Security during the Day and Night in Campus Public Spaces Based on Physical Environment and Psychological Perception. Sustainability 2024, 16, 1256. [Google Scholar] [CrossRef]
  36. Zhu, M.; Teng, R.; Wang, C.; Wang, Y.; He, J.; Yu, F. Key Environmental Factors Affecting Perceptions of Security of Night-Time Walking in Neighbourhood Streets: A Discussion Based on Fear Heat Maps. J. Transp. Health 2023, 32, 101636. [Google Scholar] [CrossRef]
  37. Nikolopoulou, M.; Steemers, K. Thermal comfort and psychological adaptation as a guide for designing urban spaces. Energy Build. 2003, 35, 95–101. [Google Scholar] [CrossRef]
  38. Ambarwati, N.; Faida, L.R.W.; Marhaento, H. The Effects of Green Open Spaces on Microclimate and Thermal Comfort in Three Integrated Campus in Yogyakarta, Indonesia. Geoplan. J. Geomat. Plan. 2023, 10, 37–44. [Google Scholar] [CrossRef]
  39. Zhang, Q.; Li, Y.; Lin, C. A Study on Outdoor Thermal Comfort of College Students in the Outdoor Corridors of Teaching Buildings in Hot and Humid Regions. Buildings 2024, 14, 2756. [Google Scholar] [CrossRef]
  40. Elshabshiri, A.; Aly, M.; Alharbat, R.; Abdalla, M.J.; Alsyouf, L.; Ghanim, A.; Yahia, M.W. Enhancing the microclimate of outdoor campus spaces in hot humid climates: The example of the University of Sharjah. Comput. Urban Sci. 2025, 5, 35. [Google Scholar] [CrossRef]
  41. Liu, X.; Zhao, J. Chinese Migrant Adolescents’ Perceived Discrimination and Psychological Well-Being: The Moderating Roles of Group Identity and the Type of School. PLoS ONE 2016, 11, e0146559. [Google Scholar] [CrossRef]
  42. Chang, Y.; Yang, Y.; Cai, X.; Zhou, L.; Li, J.; Liu, S. How Campus Landscapes Influence Mental Well-Being through Place Attachment and Perceived Social Acceptance: Insights from SEM and Explainable Machine Learning. Land 2025, 14, 1712. [Google Scholar] [CrossRef]
  43. Biljecki, F.; Ito, K. Street view imagery in urban analytics and GIS: A review. Landsc. Urban Plan. 2021, 215, 104217. [Google Scholar] [CrossRef]
  44. Blöbaum, A.; Hunecke, M. Perceived danger in urban public space: The impacts of physical features and personal factors. Environ. Behav. 2005, 37, 465–486. [Google Scholar] [CrossRef]
  45. Nasar, J.L.; Fisher, B. “Hot spots” of fear and crime: A multi-method investigation. J. Environ. Psychol. 1993, 13, 187–206. [Google Scholar] [CrossRef]
  46. Vázquez-Torres, C.E.; Beizaee, A.; Bienvenido-Huertas, D. The Impact of Human Occupancy in Thermal Performance of a Historic Religious Building in Sub-Humid Temperate Climate. Energy Build. 2022, 259, 111912. [Google Scholar] [CrossRef]
  47. Williams, D.R.; Vaske, J.J. The measurement of place attachment: Validity and generalizability of a psychometric approach. For. Sci. 2003, 49, 830–840. [Google Scholar] [CrossRef]
  48. Cheng, B.; Misra, I.; Schwing, A.G.; Kirillov, A.; Girdhar, R. Masked-attention mask transformer for universal image segmentation. In Proceedings of the IEEE/CVF Conference on Computer Vision and Pattern Recognition (CVPR), New Orleans, LA, USA, 18–24 June 2022; pp. 1290–1299. [Google Scholar]
  49. Xu, L.; Skoularidou, M.; Cuesta-Infante, A.; Veeramachaneni, K. Modeling tabular data using conditional gan. In Advances in Neural Information Processing Systems; MIT Press: Cambridge, MA, USA, 2019; Volume 32. [Google Scholar]
  50. Engelmann, J.; Lessmann, S. Conditional Wasserstein GAN-based oversampling of tabular data for imbalanced learning. Expert Syst. Appl. 2021, 174, 114582. [Google Scholar] [CrossRef]
  51. Zhao, Z.; Kunar, A.; Birke, R.; Van der Scheer, H.; Chen, L.Y. CTAB-GAN+: Enhancing Tabular Data Synthesis. Front. Big Data 2024, 6, 1296508. [Google Scholar] [CrossRef]
  52. Lázaro, C.; Angulo, C. Iterative application of UMAP-based algorithms for fully synthetic healthcare tabular data generation. Algorithms 2024, 17, 591. [Google Scholar] [CrossRef]
  53. Li, X.; Zhu, X.; Cao, H.; Huang, W. Research on the Paths of the Modern Agricultural Industrial System Promoting Income Increases and Prosperity for Farmers Based on the fsQCA Method. Sustainability 2025, 17, 2799. [Google Scholar] [CrossRef]
  54. Wen, H.; Lin, H.; Liu, X.; Guo, W.; He, B.-J. Analysis of the characteristics of university common spaces that affect university students’ psychological restoration. Sci. Rep. 2025, 15, 14146. [Google Scholar] [CrossRef]
  55. Guo, X.; Zheng, D.; Huang, D.; Gu, J. Research on Influencing Factors of Digital Transformation of Construction Enterprises Based on SEM and fsQCA Methods. Buildings 2025, 15, 3302. [Google Scholar] [CrossRef]
  56. Zeng, H.; Wang, C.; Chen, J.; Tang, D.; Xu, A. Pathways to tourism industry ecologization: A technology-organization-environment configuration framework. Ecol. Indic. 2023, 156, 111119. [Google Scholar] [CrossRef]
  57. Wang, X.; Zhang, T.; Luo, S.; Abedin, M.Z. Pathways to improve energy efficiency under carbon emission constraints in iron and steel industry: Using EBM, NCA and QCA approaches. J. Environ. Manag. 2023, 348, 119206. [Google Scholar] [CrossRef]
  58. Kumar, S.; Sahoo, S.; Lim, W.M.; Kraus, S.; Bamel, U. Fuzzy-set qualitative comparative analysis (fsQCA) in business and management research: A contemporary overview. Technol. Forecast. Soc. Change 2022, 178, 121599. [Google Scholar] [CrossRef]
  59. Chen, S.; Chen, Z.; Hong, J.; Zhuang, X.; Su, C.; Ding, Z. Exploring the Relationship Between Audio–Visual Perception in Fuzhou Universities and College Students’ Attention Restoration Quality Using Machine Learning. Front. Psychol. 2025, 16, 1572426. [Google Scholar] [CrossRef]
  60. Kim, Y.; Huh, Y. Analysis of Satisfaction and Characteristics of Using University Campus Gardens for Enhancing the Mental Well-Being of University Students. Int. J. Environ. Res. Public Health 2023, 20, 1977. [Google Scholar] [CrossRef]
  61. Qin, J.; Zhang, Y.; Li, X.; Wang, Y. Enhancing Student-Centered Walking Environments on University Campuses: A Streetscape Perception Perspective. PLoS ONE 2025, 20, e0321028. [Google Scholar]
  62. Fu, W. Enhancing University Campus Landscape Design Through Regression Analysis Integrating Ecological and Aesthetic Indicators. Soft Comput. 2023, 27, 11945–11958. [Google Scholar] [CrossRef]
Figure 1. Conceptual framework of this work.
Buildings 15 03868 g001
Figure 2. Technical workflow. Note: In Figure 2, ↑ denotes the increasing of characteristic values, and ↓ denotes the decreasing of characteristic values.
Buildings 15 03868 g002
Figure 3. Geographical location of the study area.
Buildings 15 03868 g003
Figure 4. Workflow of the Transformer model and semantic segmentation results. Note: Workflow of the Transformer model from [48].
Buildings 15 03868 g004
Figure 5. Spatial distribution of six key semantic features in the study area. Note: The legend in the top right corner of Figure 5 represents a compass. The legend in the bottom right corner indicates that one unit corresponds to a distance of 250 m on the map. The legend in the bottom left corner uses a gradient of colors to show the distribution of specific landscape semantic feature values across all coordinate points in this study.
Buildings 15 03868 g005
Figure 6. Feature-importance results for safety based on the combined CTGAN-XGBoost and SHAP models.
Buildings 15 03868 g006
Figure 7. Feature-importance modeling results for environmental comfort based on the combined CTGAN-GBDT and SHAP models.
Buildings 15 03868 g007
Figure 8. Feature-importance modeling results for sense of belonging based on the combined CTGAN-XGBoost and SHAP models.
Buildings 15 03868 g008
Table 1. Example of semantic judgment items for street view image perception evaluation.
Indicators UsedExample of Semantic Judgment Items (Based on Street View Images)
Sense of securityThe street environment, including its lighting and visibility, makes me feel safe and aware of my surroundings.
Sense of comfortThe overall environment, including openness, cleanliness, greenery, and air circulation, makes me feel comfortable and at ease.
Sense of belongingThe campus environment, with its quiet atmosphere, harmonious design, and strong connection to campus life, enhances my overall sense of belonging.
Table 2. The performance of enhanced decision tree algorithms.
Sense of SecuritySense of ComfortSense of Belonging
XGBoostRFGBDTCTGAN-XGBoostXGBoostRFGBDTCTGAN-XGBoostXGBoostRFGBDTCTGAN-XGBoost
MSE1.331.691.511.211.341.211.190.881.561.591.581.00
MAE0.930.980.950.830.950.890.890.721.021.031.020.76
MAPE35.0837.9836.0633.2535.7234.2434.1028.2935.6636.3335.6529.56
Note: The bold entries indicate the best-performing model.
Table 3. Calibration of condition variables and outcome variables in different environmental perception dimensions.
Variable NameFull Membership PointCalibration Crossover PointFull Non-Membership Point
Outcome variableSense of security642
Sense of comfort632
Sense of belonging645
Condition variableSky0.1614.2635.47
Plant01.1011.88
Person00.00461.17
Car03.3411.01
Grass06.1228.02
Sidewalk03.5323.81
Building0.167.0047.72
Earth00.1317.10
Road017.6432.97
Table 4. Results of necessity tests for individual landscape features.
Condition VariableHigh Level of Sense of Security
Overall ConsistencyOverall Coverage
Sky0.770.63
Car0.560.61
Person0.540.62
Plant0.550.55
Building0.550.50
Earth0.490.52
Condition VariableHigh Level of Sense of Comfort
Overall ConsistencyOverall Coverage
Sky0.680.74
Road0.680.74
Building0.530.63
Car0.520.74
Grass0.580.69
Person0.490.75
Condition VariableHigh Level of Sense of Belonging
Overall ConsistencyOverall Coverage
Road0.660.67
Sky0.690.69
Building0.530.59
Car0.490.64
Grass0.590.65
Sidewalk0.570.66
Table 5. Configuration analysis results for high-level environmental perception.
Condition VariablePanel A. High Level of Campus Sense of Security
Configuration A1Configuration A2
Sky
Car
Person
Plant
Building
Earth
Consistency0.810.82
PRI0.570.55
Coverage0.380.35
Unique coverage0.050.04
Overall PRI0.53
Overall consistency0.78
Overall coverage0.50
Condition VariablePanel B. High Level of Campus Sense of Comfort
Configuration B1Configuration B2
Sky
Road
Building
Car
Grass
Person
Consistency0.900.91
PRI0.720.72
Coverage0.250.21
Unique coverage0.010.01
Overall PRI0.69
Overall consistency0.85
Overall coverage0.41
Condition VariablePanel C. High Level of Campus Sense of Belonging
Configuration C1Configuration C2Configuration C3
Road
Sky
Building
Car
Grass
Sidewalk
Consistency0.750.810.86
PRI0.560.640.65
Coverage0.510.420.29
Unique coverage0.020.030.01
Overall PRI0.50
Overall consistency0.66
Overall coverage0.83
Note: ● denotes the presence of a peripheral condition, and ⊗ indicates its absence.
Table 6. Multiple linear regression analysis results.
Panel ASkyCarPersonPlantBuildingEarth R 2 F Statistics
Sense of security0.0354 ***
(0.00)
0.0005
(0.96)
0.1215 **
(0.02)
−0.0263 ***
(0.00)
−0.0109 ***
(0.00)
−0.0344 ***
(0.00)
0.1651.19
Panel BSkyRoadBuildingCarGrassPerson R 2 F Statistics
Sense of comfort0.02 ***
(0.00)
0.0223 ***
(0.00)
−0.0106 ***
(0.00)
0.0041
(0.63)
0.0072 **
(0.05)
0.0639
(0.19)
0.1236.28
Panel CRoadSkyBuildingCarGrassSidewalk R 2 F Statistics
Sense of belonging0.0323 ***
(0.00)
−0.0154 ***
(0.00)
−0.0091 ***
(0.00)
−0.0241 ***
(0.01)
0.0239 ***
(0.00)
0.0374 ***
(0.00)
0.1236.49
Note: ***, ** denote statistical significance at the 1%, 5% levels, respectively.
Table 7. Comparisons with previous research.
Panel A. Application of Explainable Machine Learning Models in Campus Landscape Research
Author (Year)Research Object/Dependent VariableKey Points of Explainable Machine LearningLimitations
Zhuang et al. (2025) [31]Psychological restoration, emotional uplift, and social interactionSHAP identifies key features & thresholds; regression checks hidden significant factorsExplainable machine learning identifies key landscape features and thresholds, but its results depend on feature quality, lack causal interpretability, and have limited generalizability across contexts.
Chang et al. (2025) [42]Psychological well-being via psychosocial pathwaysSHAP reveals threshold & interaction patterns among predictors
Chen et al. (2025) [59]Attention restoration qualitySHAP ranks soundscape & visual metrics; finds interaction/threshold effects
Panel B. Application of Multiple Linear Regression Model in Campus Landscape Research
Author (Year)Research Object/Dependent VariableIndependent Variables (Landscape/Environmental Features)Limitations
Kim & Huh (2023) [60]Students’ Mental Health/Psychological Well-BeingSymbolism, visual beauty, frequency of use, and other factors.Multiple linear regression quantifies relationships between landscape features and perceptions, but it relies on subjective data, struggles with nonlinearities and interactions, and faces issues with multicollinearity and limited explanatory power.
Qin et al. (2025) [61]aesthetics, security, depression, vitalityBuildings, vegetation, grassland, walls, sky openness, etc.
Fu (2023) [62]Campus landscape design quality/aesthetics-ecological balanceEcological Diversity Index, Space Utilization Efficiency, Landscape Aesthetics Indicators.
Disclaimer/Publisher’s Note: The statements, opinions and data contained in all publications are solely those of the individual author(s) and contributor(s) and not of MDPI and/or the editor(s). MDPI and/or the editor(s) disclaim responsibility for any injury to people or property resulting from any ideas, methods, instructions or products referred to in the content.