Article

Optimisation of Interlayer Bond Strength in 3D-Printed Concrete Using Response Surface Methodology and Artificial Neural Networks

by
Lenganji Simwanda
1,*,
Abayomi B. David
2,
Gatheeshgar Perampalam
3,
Oladimeji B. Olalusi
4 and
Miroslav Sykora
1
1
Klokner Institute, Czech Technical University in Prague, Solinova 7, 160 00 Prague, Czech Republic
2
Department of Civil Engineering, Stellenbosch University, Stellenbosch 7602, South Africa
3
School of Computing, Engineering and Digital Technologies, Teesside University, Middlesbrough TS1 3BX, UK
4
Department of Civil Engineering, Durban University of Technology, Pietermaritzburg 3209, South Africa
*
Author to whom correspondence should be addressed.
Buildings 2025, 15(20), 3794; https://doi.org/10.3390/buildings15203794
Submission received: 1 September 2025 / Revised: 6 October 2025 / Accepted: 9 October 2025 / Published: 21 October 2025

Abstract

Enhancing interlayer bond strength remains a critical challenge in the extrusion-based 3D printing of cementitious materials. This study investigates the optimisation of interlayer bond strength in extrusion-based 3D-printed cementitious materials through a combined application of Response Surface Methodology (RSM) and Artificial Neural Networks (ANNs). Using a concise yet comprehensive dataset, RSM provided interpretable main effects, curvature, and interactions, while the ANN captured non-linearities beyond quadratic forms. Comparative analysis revealed that the RSM model achieved higher predictive accuracy ( R 2 = 0.95 ) compared to the ANN model ( R 2 = 0.87 ). Desirability-based optimisation confirmed the critical importance of minimising casting delays to mitigate interlayer weaknesses, with RSM suggesting a water-to-cement (W/C) ratio of approximately 0.45 and a minimal time gap of less than 5 min, while ANN predicted slightly lower optimal W/C values but with reduced reliability due to the limited dataset. Sensitivity analysis using partial dependence plots (PDPs) further highlighted that ordinary Portland cement (OPC) content and W/C ratio are the dominant factors, contributing approximately 2.0 and 1.8 MPa respectively to the variation in predicted bond strength, followed by superplasticiser dosage and silica content. Variables such as water content, viscosity-modifying agent, and time gap exhibited moderate influence, while sand and fibre content had marginal effects within the tested ranges. These results demonstrate that RSM provides robust predictive performance and interpretable optimisation guidance, while ANN offers flexible non-linear modelling but requires larger datasets to achieve stable generalisation. Integrating both methods offers a complementary pathway to advance mix design and process control strategies in 3D concrete printing.

1. Introduction

Additive manufacturing with 3D-printed cementitious (3DPC) materials has matured rapidly over the years, advancing from laboratory demonstrators to on-site deployments, with trial projects worldwide increasingly assessing its viability under real-world conditions [1]. Progress has been driven on three fronts: (i) mix design that optimises the fresh and hardened behaviour of extrusion-based mortars to ensure pumpability, extrudability, and buildability [2]; (ii) upscaled gantry and robotic systems enabling the production of structural elements at an industrial scale [3]; and (iii) reinforcement and interface engineering, such as polymeric meshes and other in-nozzle or near-nozzle strategies to stabilise filaments and enhance layer integration [4]. These advances translate into practical advantages, including free-form fabrication without formwork, cost-efficient reductions in material waste, and shortened construction schedules [5,6]. They also intersect with sustainability priorities, with emerging workflows that utilise alternative binders/aggregates (e.g., soil–cement, recycled streams) and more efficient logistics to reduce embodied impacts [7,8]. Nevertheless, despite this rapid progress, limited research has addressed the optimisation of interlayer bond strength (IBS) using integrated statistical and machine learning approaches. In particular, the combined use of Response Surface Methodology (RSM) and Artificial Neural Networks (ANNs) for predictive modelling and optimisation of IBS in 3DPC remains underexplored, forming the central novelty of this study.
Despite the aforementioned advances and benefits of 3DPC construction, a fundamental challenge faced by researchers and stakeholders is the weak interlayer interface [9,10,11]. Unlike monolithic cast concrete, printed elements are laminated. The interface may act as a cold joint when chemical continuity and mechanical interlocking are insufficient [12], introducing anisotropy and premature failure planes. Among the variables influencing IBS, the time gap between successive layers is consistently identified as a dominant process-dependent factor, while the water-to-cement ratio (W/C) is a dominant material-dependent factor. Longer time gaps often compromise adhesion by allowing surface drying and early structuration of the underlying filament; conversely, short gaps can promote contact and hydration continuity [9,13]. The water-to-cement ratio (W/C) influences rheology, pore structure, and hydration kinetics, where a moderate W/C typically refines the matrix and enhances interface strength, whereas excessively high W/C increases capillary porosity and causes weak zones to develop at the interface [11].
Measuring IBS in 3D-printed concrete remains non-trivial, with direct tension [11] and shear tests [11,14] among the most commonly used protocols to quantify interfacial resistance. Direct tension tests are conceptually straightforward, as they ideally apply normal stress across the interface; however, due to stress concentrations and material heterogeneity in the printed filaments, failure may occur within the adjacent layers rather than along the interface itself. Direct shear tests are more sensitive to adhesion but are experimentally demanding. The lack of harmonised experimental protocols hinders comparison between studies and the consolidation of their findings [15]. Alongside mechanical testing, recent findings on dynamic bonding chemistries and fibre interlocks demonstrate that interface performance arises from the interplay of chemical, rheological, and geometrical factors [16]. Addressing this complexity necessitates data-driven approaches that facilitate predictive modelling and systematic optimisation of the interlayer bond strength, thereby providing a robust framework to enhance performance and inform the design of 3D-printed concrete structures.
In this context, data-driven modelling provides a framework to quantify the coupled chemical, rheological, and geometrical effects at the interlayer interface and to systematically navigate trade-offs between buildability and interlayer bonding. RSM has been widely adopted to structure experimental campaigns and fit second-order polynomials that capture main effects, curvature, and variable-dependent interactions, enabling contour-based optimisation with a limited number of experimental data points [17,18,19]. However, the assumed functional form of the RSM can under-fit strongly non-linear response surfaces and higher-order interactions, typical of fresh-state thixotropy and time-dependent structuration [20]. ANNs complement RSM by learning complex, non-linear mappings directly from data. In cementitious systems and 3DCP, ANN models have achieved high predictive fidelity for workability and strength prediction, and have captured interaction effects that are not adequately modelled by quadratic regressions [21,22,23]. Recent studies in related domains suggest that hybrid strategies can be highly effective, with RSM employed for structuring experimental designs and scoping the search space, and ANNs used for high-fidelity prediction, thereby leveraging the strengths of both approaches [24,25,26].
Despite the critical role of IBS in the structural performance of 3D-printed elements, several key gaps remain. First, direct comparisons of RSM and ANNs for IBS prediction under coupled process–material variations, particularly time gap and W/C, are scarce. Second, existing optimisation frameworks rarely employ desirability functions to reconcile material and process feasibility with strength targets. Third, parameter optimisation frequently overlooks time-dependent rheology and environmental variability, limiting the generalizability of predictions [15,27]. At the same time, multi-objective optimisation and AI-enabled mix design are proving effective in broader concrete research, optimising recycled constituents, strength, and durability simultaneously [28,29,30,31,32]. Motivated by these gaps, this study unifies RSM and ANN approaches to address IBS in extrusion-based 3DCP, providing a timely and actionable framework for predictive modelling and optimisation.
While hybrid approaches combining RSM and ANNs have been explored for other cementitious and construction materials, no prior study has directly benchmarked RSM and ANNs for IBS of 3D-printed concrete under coupled process–material variables. This work integrates desirability-based optimisation with partial dependence plot (PDP)-driven interpretability to translate small but information-rich experimental datasets into actionable 3D printing guidance. The study also provides a reproducible, model-informed parameter map linking W/C ratio and time gap to IBS, enabling process control decisions during 3D printing. These aspects collectively define the novelty and practical value of this study.
This study focuses on optimising interlayer bond strength in extrusion-based 3D-printed cementitious materials by jointly varying W/C, sand–cement ratio (S/C), superplasticiser content (SP), and the interlayer time gap. Based on a concise yet informative experimental dataset, we perform the following:
1.
Build an RSM quadratic model to characterise interpretable main effects, curvature, and interactions, with full ANOVA and diagnostics;
2.
Develop and tune an ANN regressor to capture non-linearities beyond quadratic forms and benchmark its predictive accuracy against RSM;
3.
Perform a comparative evaluation of models using parity plots and coefficient of determination R 2 , and visualise areas of agreement and discrepancy through contour surfaces;
4.
Conduct desirability-based optimisation (single- and bi-factor planes) to identify practically feasible optima in the ( W / C , TimeGap) space;
5.
Perform ANN-based sensitivity analysis using partial dependence plots (PDPs) to identify and rank the relative influence of material and process variables on bond strength;
6.
Provide model-informed guidance for print-process control and mix design specific to interlayer interface performance.
By integrating statistical design, machine learning, and desirability analysis within a unified IBS-focused framework, this study establishes a systematic approach from experimental data to actionable printing guidelines, focusing on improving the critical interlayer interface bond strength in 3D-printed cementitious materials structures.

2. Materials and Methods

2.1. Materials

The experimental dataset used in this study was obtained from a study by Mousavi et al. [33], which investigated the interlayer bond strength of 3D-printed cementitious composites. This dataset was selected because it provides a controlled and comprehensive investigation of IBS, using consistent raw materials from the same supplier to minimise variability, and applying a systematic central composite design (CCD) with multiple mix designs and process variations. The study’s rigorous experimental programme, including careful control of printability and buildability criteria, surface moisture measurements, and interlayer bond tests across varied time gaps, ensures both completeness and reliability of the data [33]. These qualities make it particularly well suited for comparative modelling and optimisation in the present work. The cementitious mixture incorporated CEM I 42.5R Portland cement, natural river sand (fineness modulus 2.6), potable water, a polycarboxylate-based superplasticiser (SP), polyvinyl alcohol (PVA), and a viscosity-modifying agent (VMA). A central composite design (CCD) was applied to evaluate the effects of water–cement ratio (W/C), sand–cement ratio (S/C), SP dosage, and time gap between printed layers (time gap) on splitting tensile bond strength. A total of 21 experimental runs were prepared and printed using a gantry-based extrusion 3D printer with a 20 mm nozzle. The cementitious mixes were printed in two layers, with the interlayer time gap varied according to the CCD plan. Interlayer bond strength was measured after 7 days of curing using the direct splitting tensile method. A complete set of the dataset is given in Table 6 of Mousavi et al. [33].

2.2. Methods

2.2.1. Response Surface Methodology

The RSM approach shown in Figure 1 was implemented using a CCD to study the influence of mix design parameters and printing process variables on splitting tensile bond strength of 3D-printed cementitious composites. CCD was selected over other experimental designs because it efficiently explores linear, interaction, and quadratic effects with relatively few runs, provides good rotatability and uniform precision across the design space, and is widely recommended for optimisation studies in cementitious materials [34,35]. The key independent variables were W/C ratio, S/C ratio, SP dosage, and time gap. Twenty-one experimental runs were generated, including factorial, axial, and centre points. These variables were selected to mirror the controlled parameters in the source experimental campaign [33], ensuring consistency with the available dataset and avoiding extrapolation beyond the tested mix design domain. A second-order polynomial regression model was fitted to the data using ordinary least squares (OLS) [34]. The adequacy of the model was evaluated using the coefficient of determination ( R 2 ), adjusted R 2 , and analysis of variance (ANOVA) [35]. Factor significance is assessed using the F-value, where larger values indicate greater influence on the response. Model and parameter relevance are further verified through the p-value, with values below 0.05 confirming statistical significance. Contour and surface plots were generated to visualise the effect of the factors and to identify the optimum conditions for bond strength.

2.2.2. Artificial Neural Network

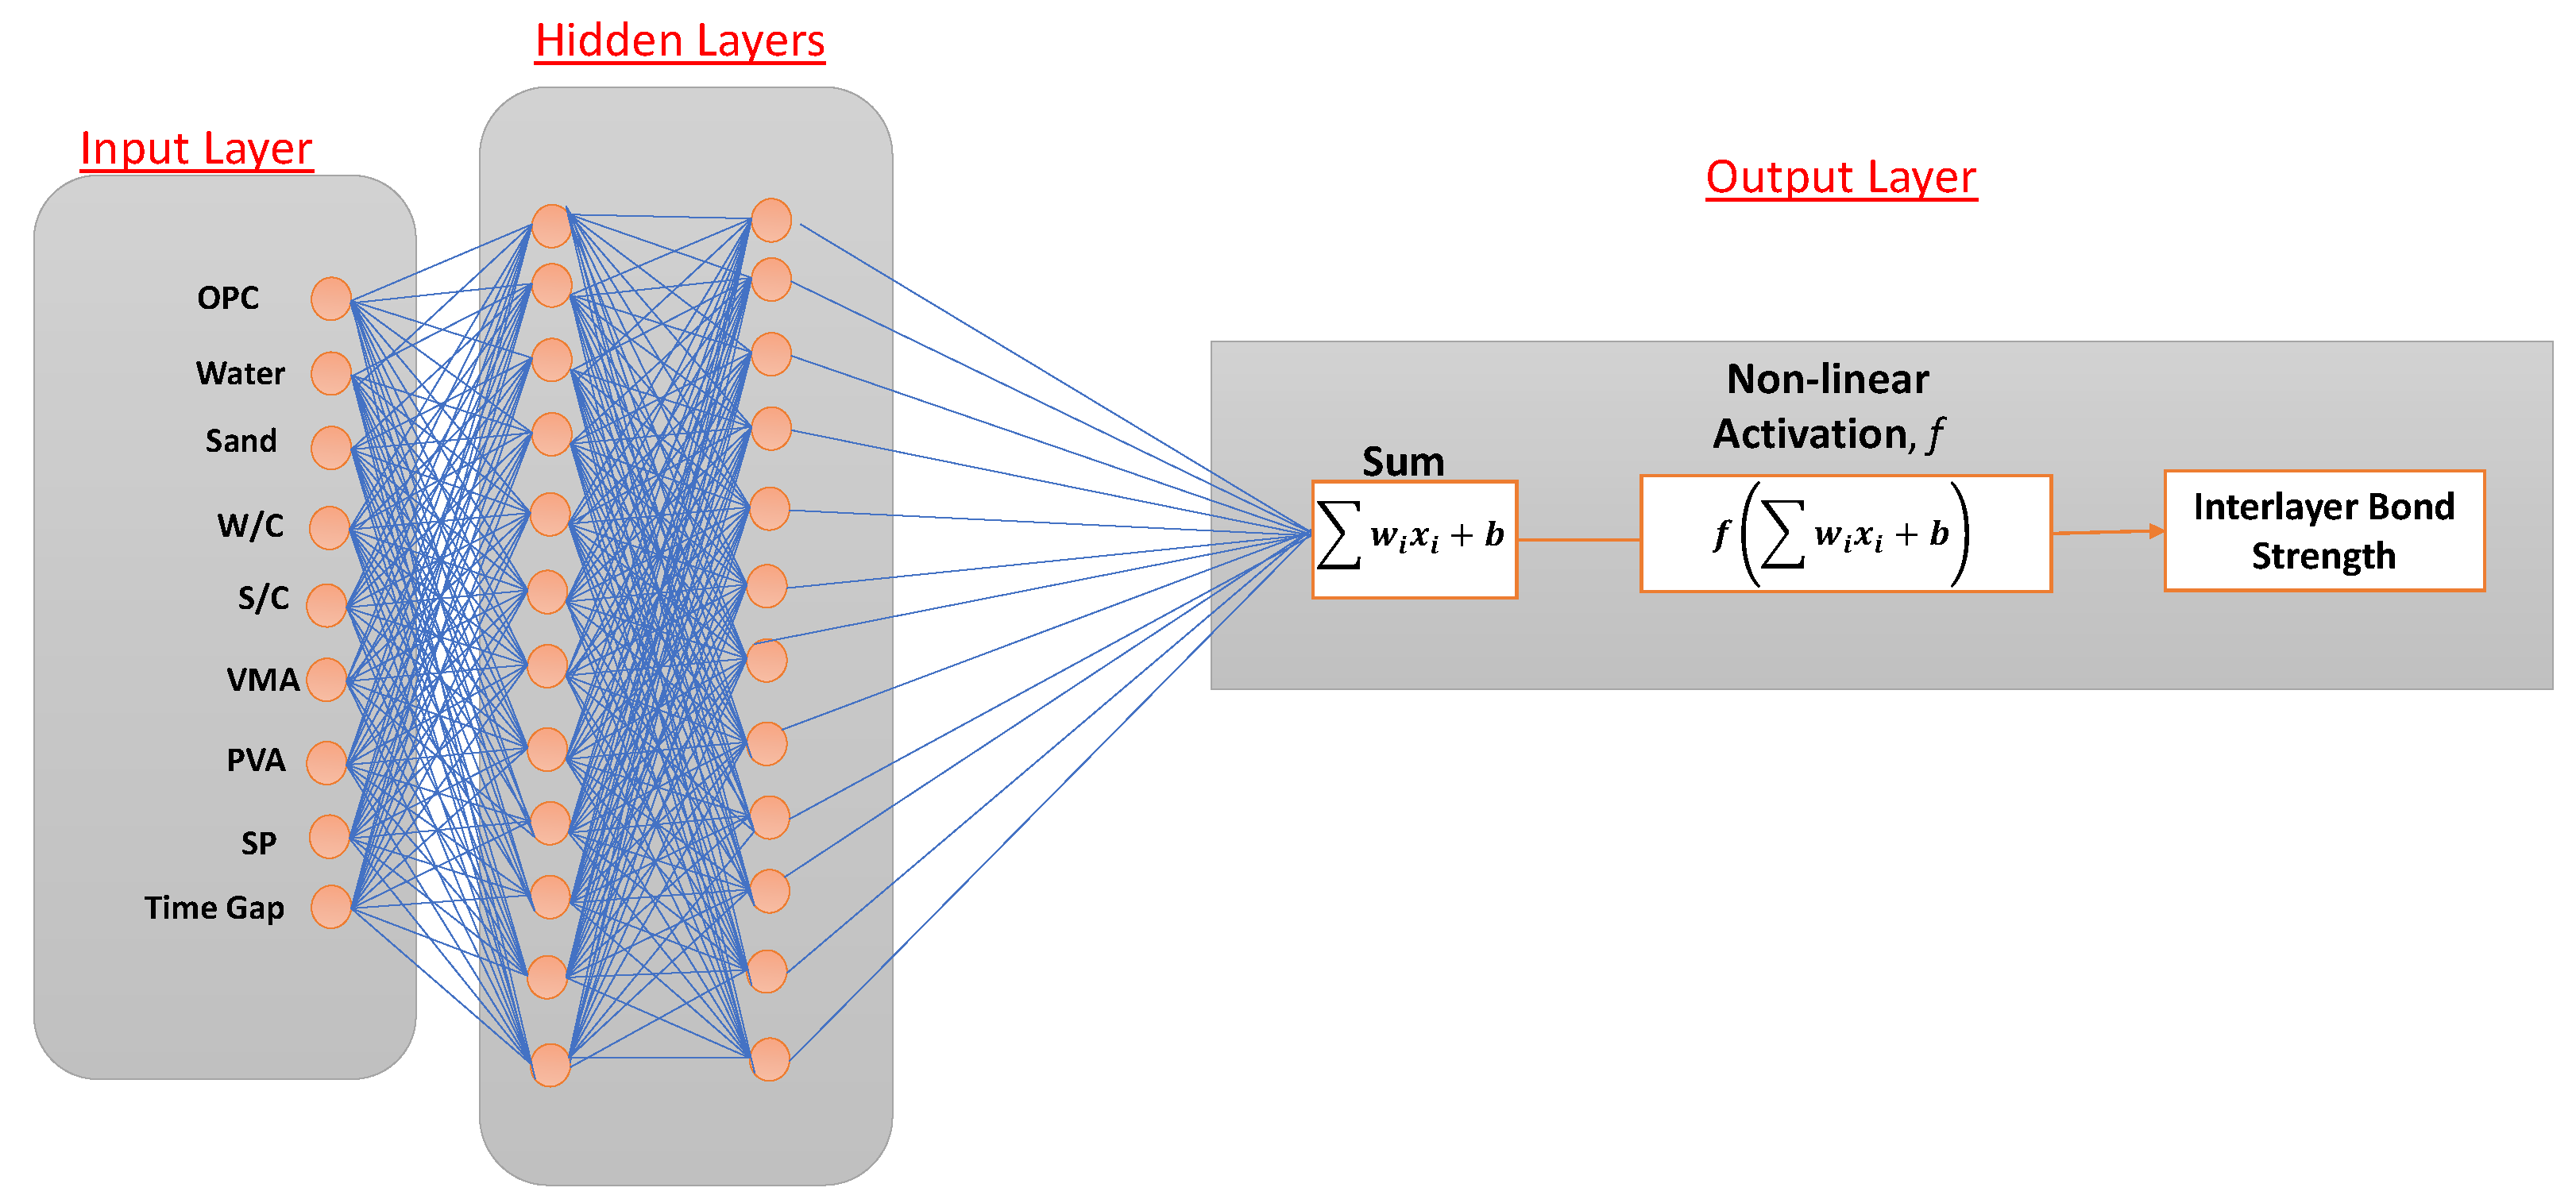
In this study, an ANN model was developed to represent the non-linear interactions among mix and process parameters that influence the splitting tensile bond strength (see Figure 2).
The considered input variables included OPC, Water, Sand, W/C, S/C, VMA, PVA, SP, and time gap. Together, these parameters define a highly interdependent system, where conventional linear approaches often fail to capture the complexity of material behaviour. The strength of ANNs lies in their ability to approximate such non-linear functions with high flexibility, making them particularly well suited for modelling relationships that cannot be expressed in closed form [36,37]. Previous applications across engineering and materials science have demonstrated their effectiveness in forecasting and prediction tasks involving intricate parameter interactions [38]. In line with these findings, the present ANN framework successfully captured the governing patterns between the selected inputs and the resulting bond strength. This outcome reinforces the relevance of neural network approaches as reliable tools for advancing data-driven modelling in cementitious systems, where predictive accuracy is often limited by the inherent complexity of the underlying processes [39]. To reduce overfitting given the compact dataset (21 mixes), 3-fold cross-validation was implemented during Optuna-based hyperparameter tuning [40] and restricted network complexity to the minimum number of hidden neurons yielding stable mean squared error (MSE). The considered hyperparameters included hidden layers, activation, solver, and regularisation.

3. Results and Discussion

The results and discussion presented in this section consolidate the outcomes of the RSM and ANN models, supported by desirability analysis and PDP-based sensitivity assessment, to closely examine the dominant parameters influencing interlayer bond strength in 3D-printed cementitious materials.

3.1. Response Surface Methodology Modelling

A quadratic polynomial model was developed using RSM to capture the relationship between bond strength (B) and four key variables: W/C, S/C, SP, and the time gap between layers. Figure 3 shows the response surfaces of the derived quadratic polynomial in the W/C-time gap, and SP-W/C spaces, respectively. The combinations of W/C, SP, and time gap were chosen because ANOVA identified these factors as statistically significant for bond strength, and visualising them offers the clearest interpretation of main and interaction effects. The experimental design comprised 21 randomised runs without blocking, a standard practice in RSM to minimise the influence of uncontrolled variability [41]. By incorporating main effects, quadratic terms, and two-factor interactions, the model was structured to investigate both the individual and combined contributions of these parameters to bond strength [41,42].
The fitted RSM equation is expressed as
B pred = 6.5391 S C 2 + 41.2671 S C × S P + 0.2170 S C × TimeGap 26.6353 S P 2 + 0.0257 S P × TimeGap + 17.9105 S P × W C 0.0017 TimeGap 2 + 5.9284 W C 2 + 22.1986 W C 0.8445
Equation (1) highlights the non-linear and interaction effects among the studied factors, reflecting the representational capacity of RSM in modelling complex material behaviour [41,42]. The model achieved an R 2 of 0.95 and an adjusted R 2 of 0.89, demonstrating that nearly 95% of the variability in bond strength was explained by the regression. The significant F-statistic (14.49, p = 0.000204 ) further confirms the adequacy of the model [43]. Analysis of variance (ANOVA) results (Table 1) showed that WC ( p = 0.000021 ), SC ( p = 0.000239 ), and SP ( p = 0.000018 ) had highly significant effects. Significant quadratic effects were observed for SC ( p = 0.0095 ), while interactions involving W/C and time gap ( p = 0.0349 ), SC and SP ( p = 0.0371 ), and SC and time gap ( p = 0.0270 ) were also influential. The main effect of time gap alone was not significant ( p = 0.646 ), indicating that its influence is primarily expressed through interactions with the other factors [44].
Diagnostic analysis supported the validity of the model assumptions. Tests for normality (Omnibus p = 0.689 , JB p = 0.942 ) showed no significant deviations, while the Durbin–Watson statistic (2.96) suggested minimal autocorrelation. These results are consistent with a well-fitted model [43]. The very small eigenvalue of the design matrix ( 1.47 × 10 32 ), however, indicated some multicollinearity, a common occurrence in second-order models due to the inclusion of interaction and quadratic terms [41].

3.2. Artificial Neural Network Modelling

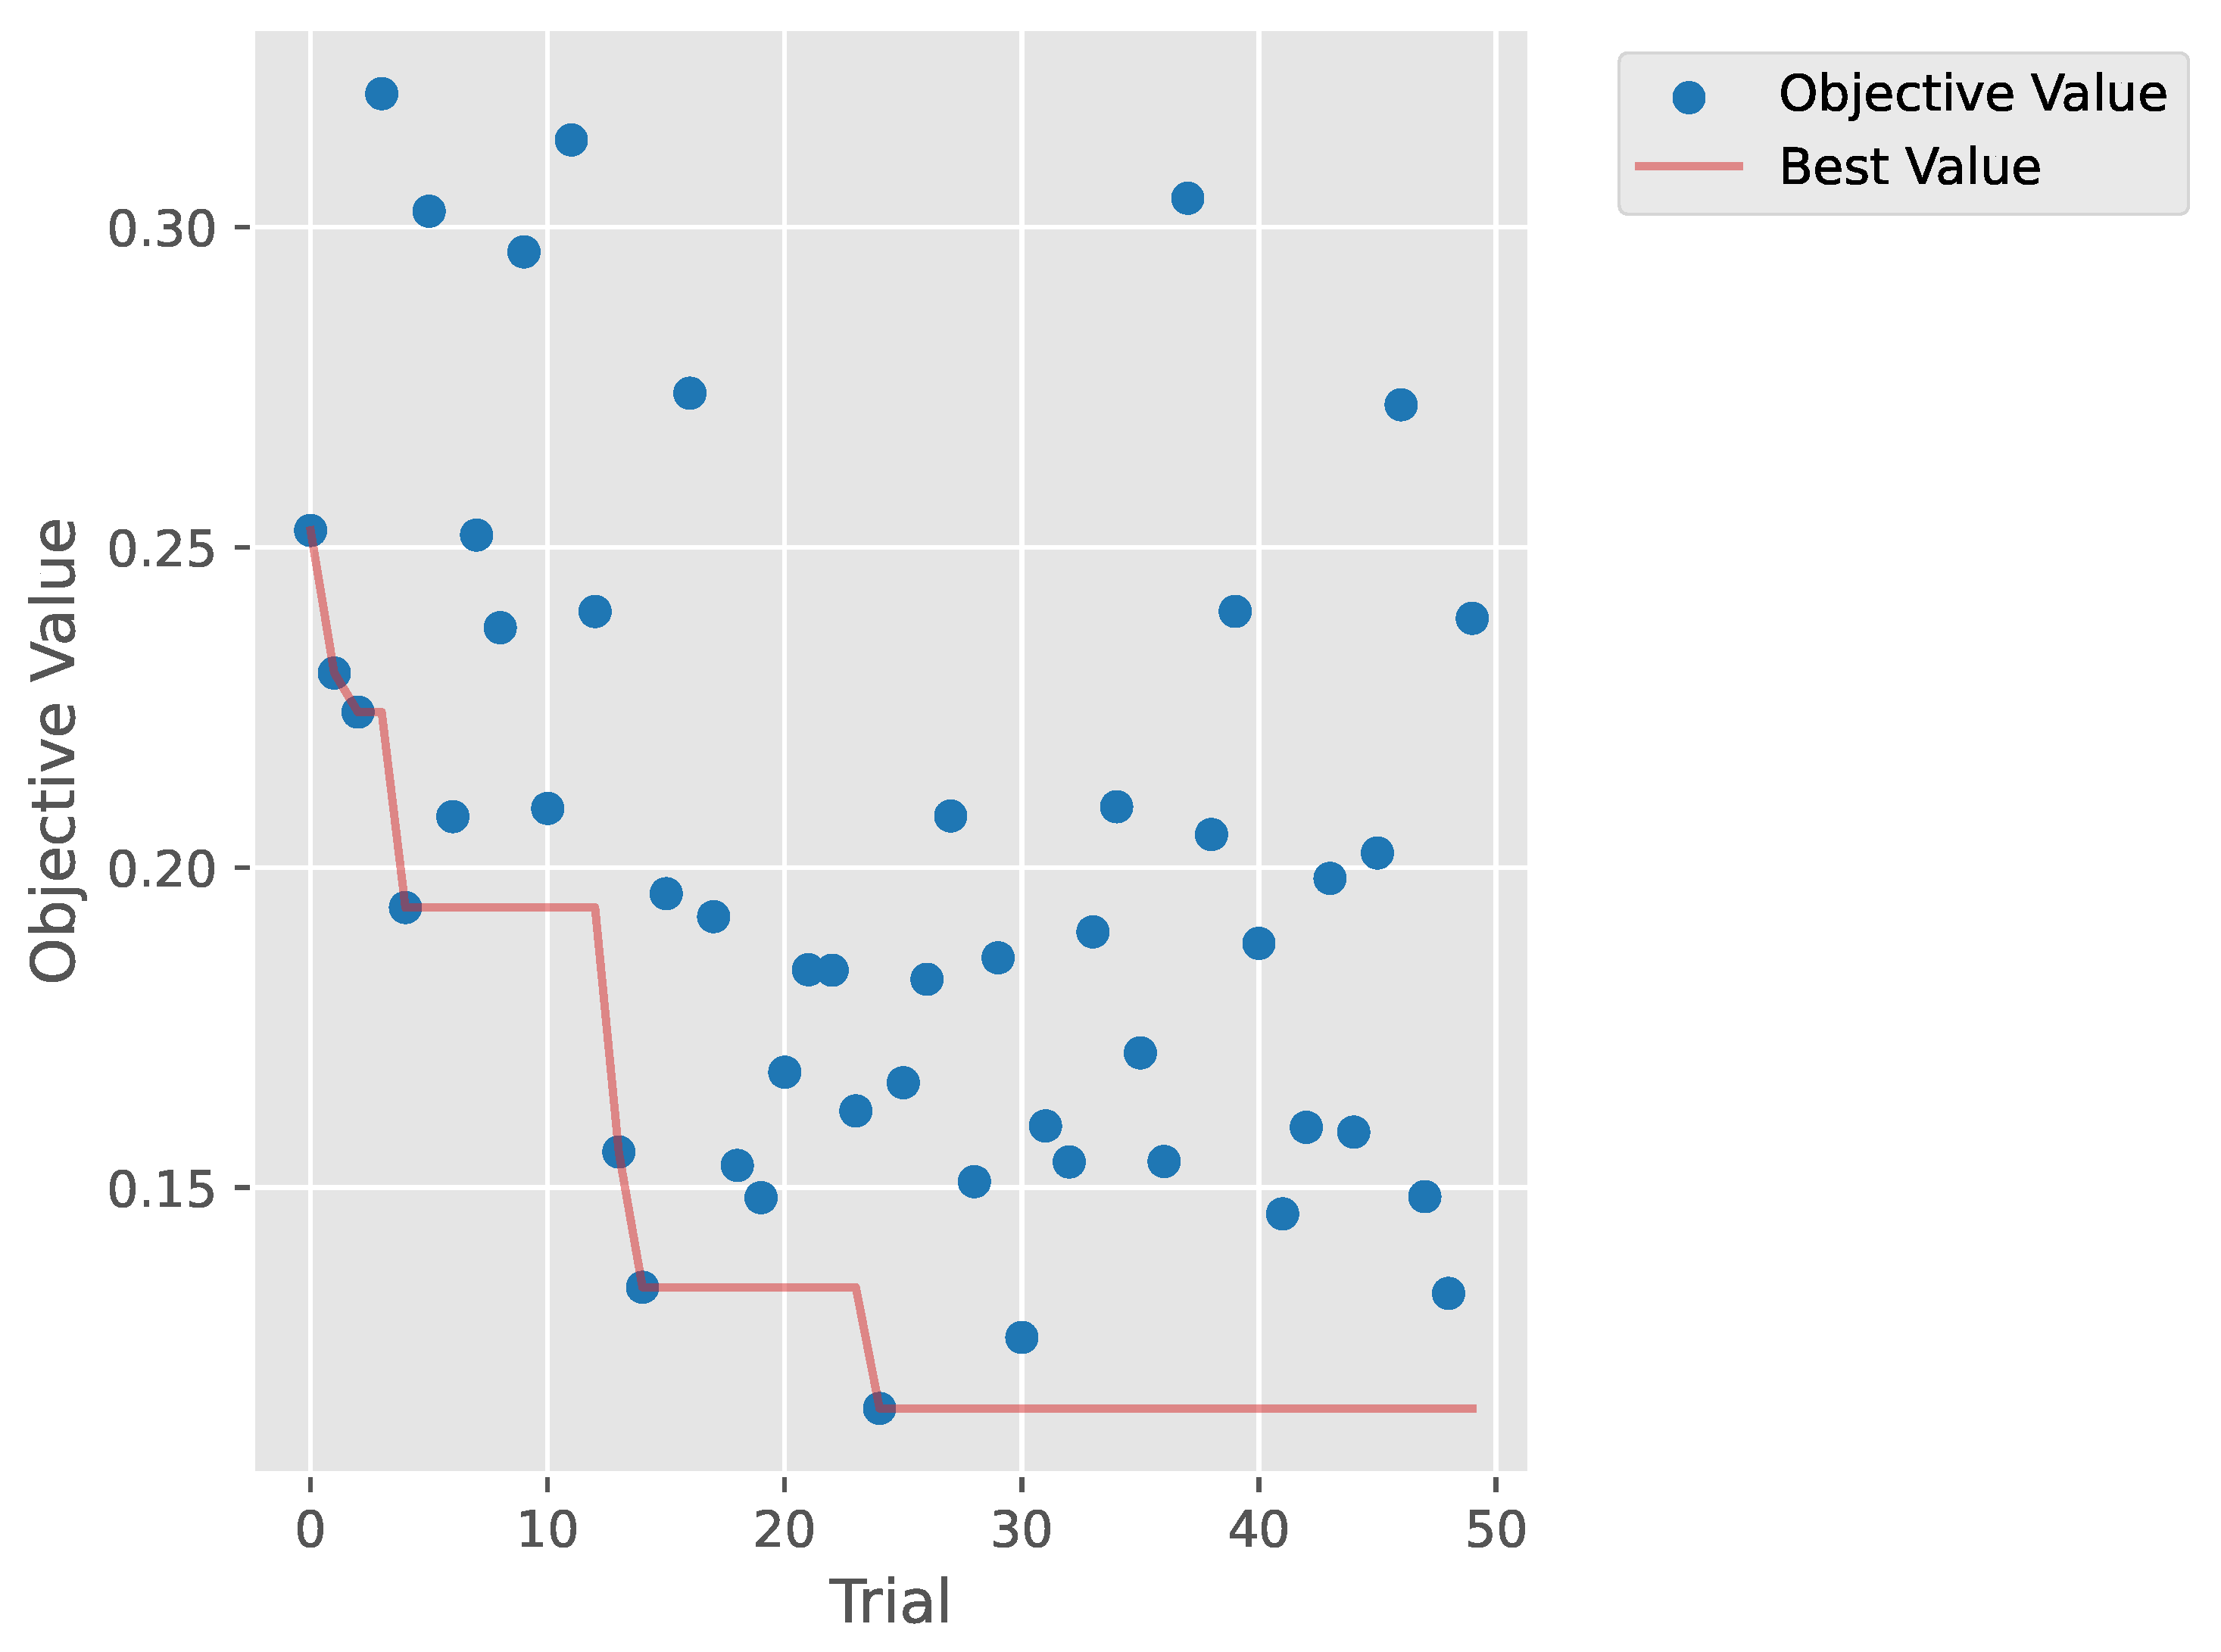
ANN modelling marks a clear improvement over traditional approaches such as RSM. The Multi-Layer Perceptron (MLP) architecture, with its layered structure, is capable of capturing non-linear interactions that are common in cementitious composite behaviour. Hyperparameter tuning through the Optuna framework adds further value by systematically identifying optimal configurations, including layer sizes and learning rates [45]. The ANN model was tuned using Bayesian Optimisation with Optuna [40] in order to reduce MSE across held-out cross-validation folds, and the optimised hyperparameters are shown in Table 2. The optimisation history (Figure 4) further demonstrates rapid convergence towards low MSE values, reflecting the efficiency of automated tuning [45].

3.3. Model Performance Comparison

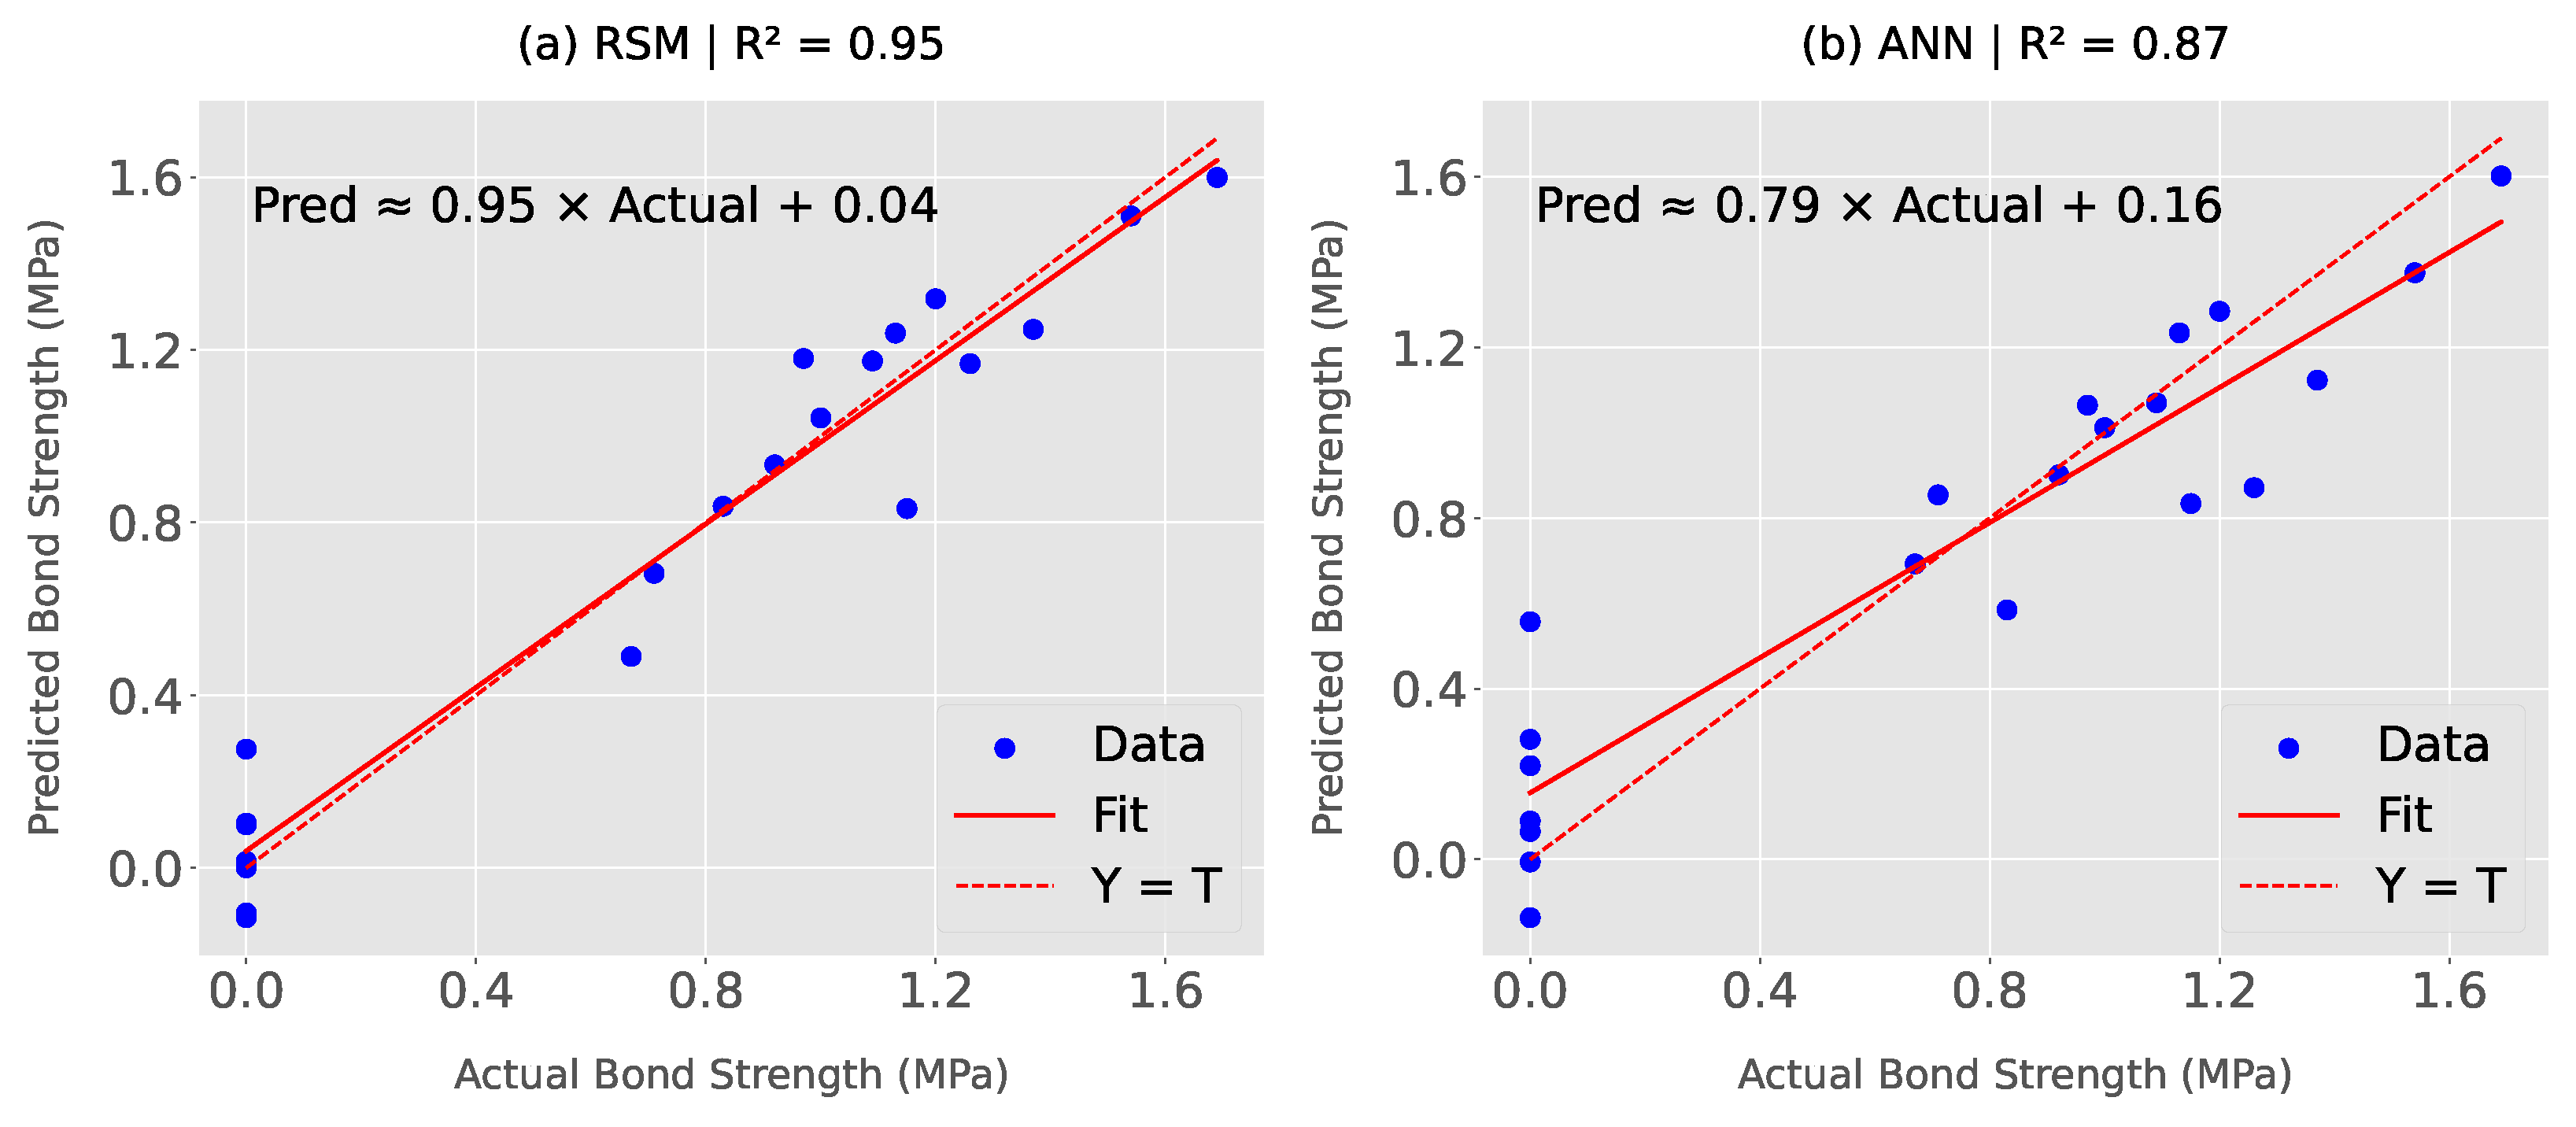
In evaluating the predictive performance of RSM and ANN, the experimental dataset showed distinct differences. The scatter plot (Figure 5) indicates that both models captured the overall trend of the experimental bond strength across the specimens. However, RSM achieved a higher coefficient of determination ( R 2 = 0.95 ), signifying a stronger correlation with the experimental data, while the ANN obtained a lower R 2 = 0.87 , reflecting inferior performance compared to RSM—opposite to trends commonly reported in the literature (e.g., [46]). This outcome can be attributed to the relatively small dataset and the need for more extensive training samples for the ANN to improve generalisation and achieve stable validation across the 3-fold cross-validation used in this study. It is worth noting that applying transfer learning strategies could help overcome data scarcity and enhance ANN performance, but this remains a topic for future research. To gain deeper insight into model errors, residual analysis was performed (Figure 6). The residuals show that ANN performed particularly poorly for specimens with zero initial bond strength (IBS) corresponding to seven days of curing but exhibited comparable error levels to RSM for non-zero bond strength values. This suggests that ANN might achieve better generalisation when applied to datasets dominated by 28-day cured 3DPC specimens, where non-zero bond strengths are expected.
A more detailed comparison of actual and predicted bond strength values for the 21 specimens is given in Table 3. The results clearly show that the RSM model generally achieved smaller absolute errors than the ANN model across most specimens. For instance, in specimens 1 and 3 the RSM absolute errors were 0.12 MPa and 0.02 MPa compared to 0.28 MPa and 0.14 MPa for the ANN, respectively. Similar patterns occurred in specimens 4, 14, and 15, where the ANN deviated more noticeably. These differences reflect the impact of the model structure: RSM, although limited to polynomial forms, can still provide robust approximations when the underlying behaviour is moderately non-linear, while the ANN’s data-driven flexibility may lead to local overfitting or extrapolation errors when training data are sparse and limited [47].
Nonetheless, the ANN remains attractive for problems with stronger non-linearity or larger, well-distributed datasets, where its neural architecture can capture complex interactions beyond polynomial reach [47,48]. Meanwhile, RSM continues to offer an important advantage by producing explicit, interpretable equations that are valuable for optimisation and sensitivity analysis. Considering the present dataset, however, RSM outperformed the ANN in predictive accuracy, confirming that simpler polynomial-based models can remain competitive when the experimental domain is relatively well defined even if small in size [49,50,51].

3.4. Comparison of Response Surfaces and Contour Maps

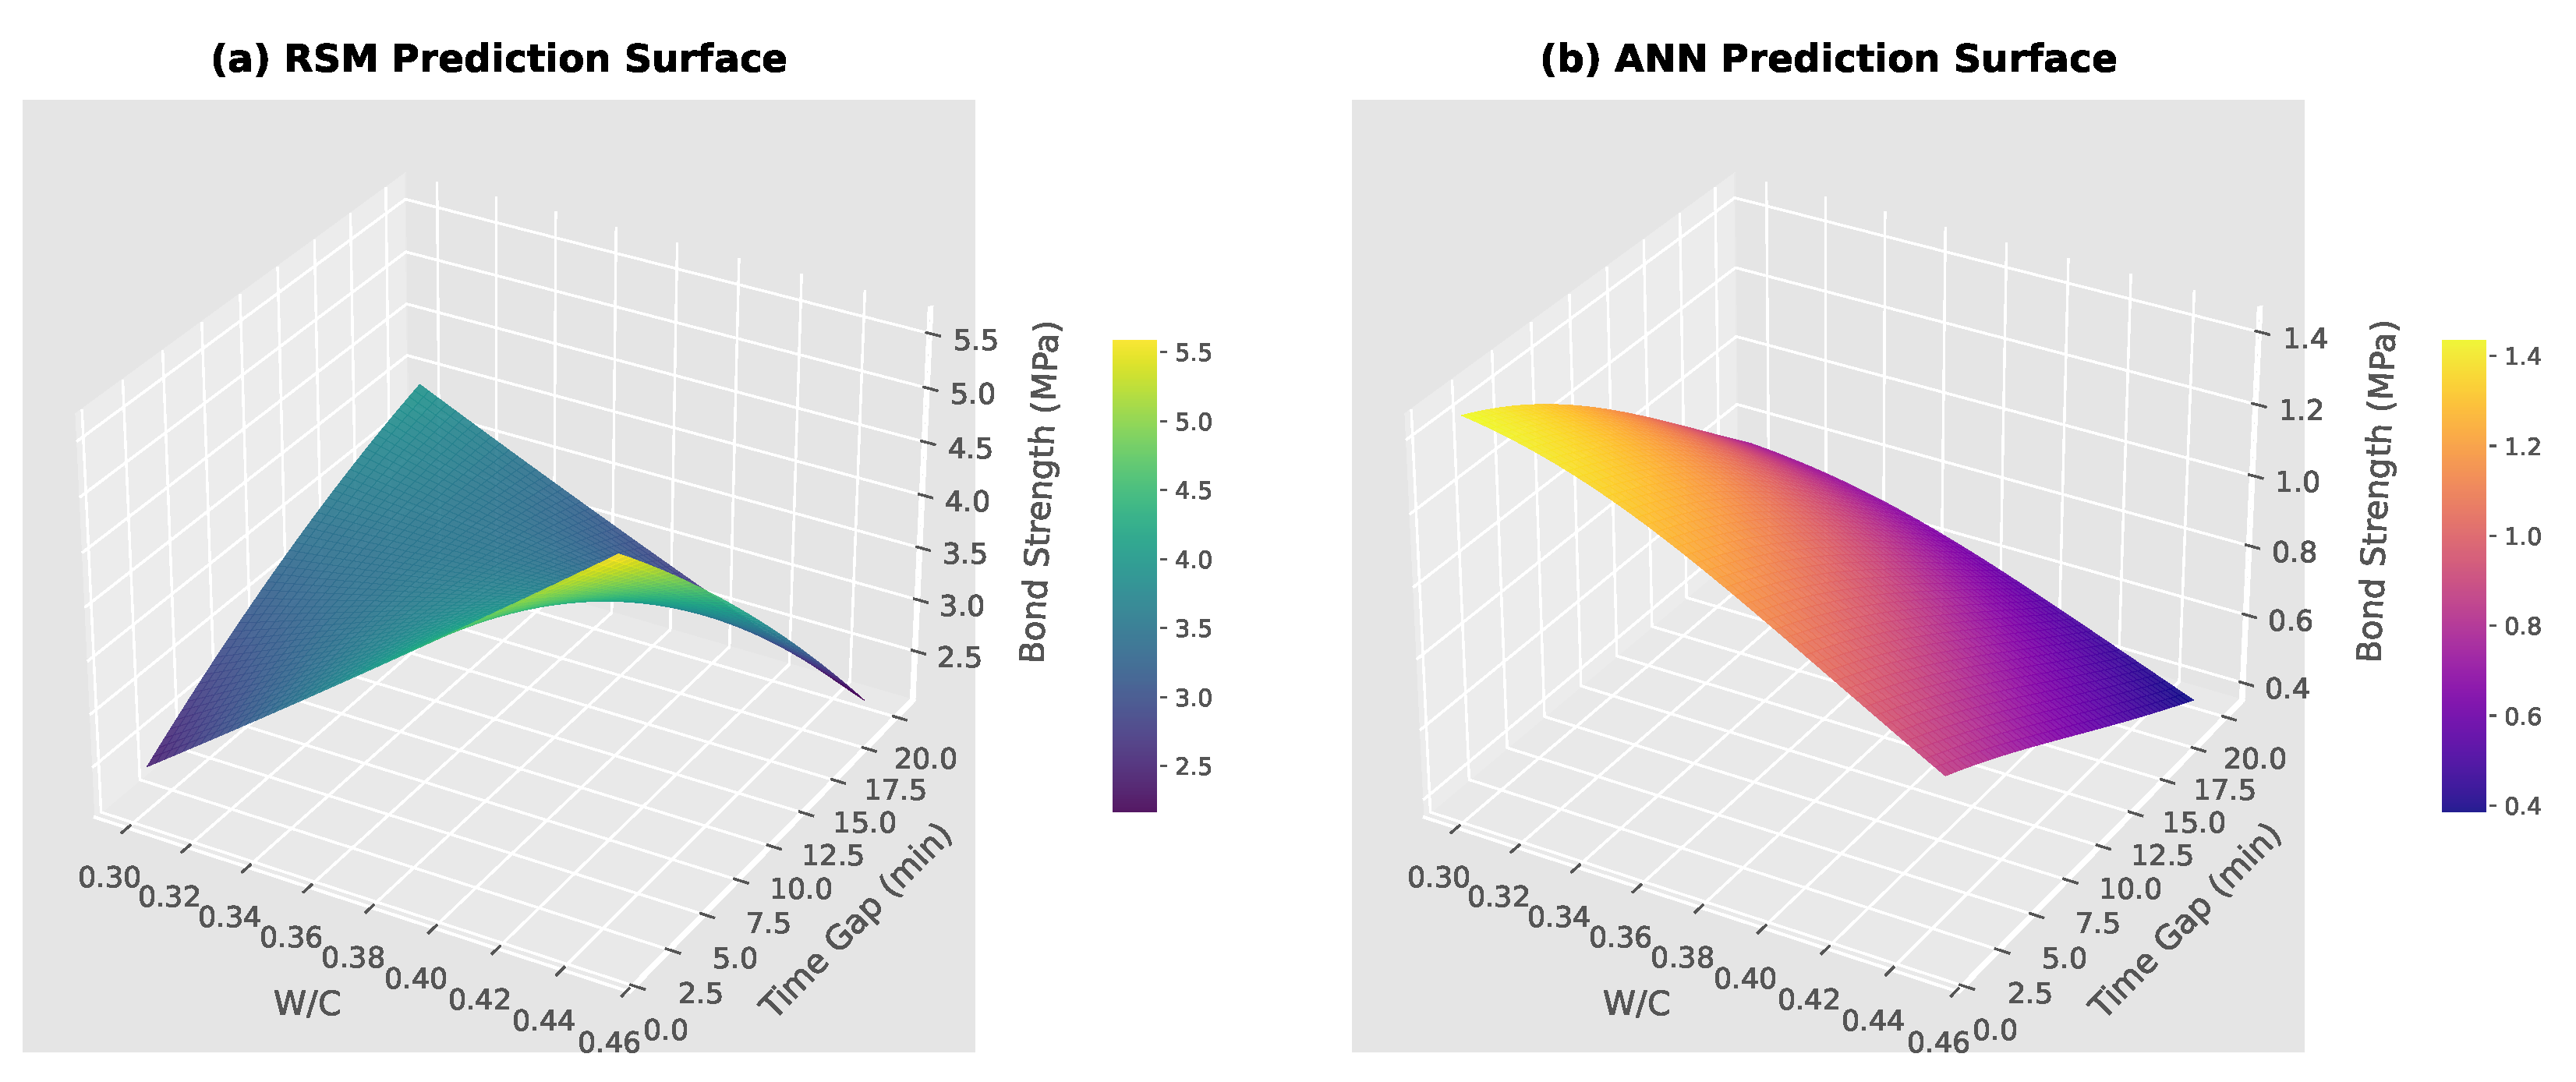
Graphical comparisons in Figure 7 substantiate the need for coupling RSN and ANNs in optimisation. Despite lower generalisation as discussed in Section 3.3, ANN produces a smoother bond strength surface than RSM, which is restricted by polynomial approximations. This flexibility is essential for modelling the combined influence of variables such as the W/C ratio and time gap, both of which strongly affect bond strength [52].
In line with other findings with respect to producing 3D response surfaces, ANN models consistently outperform linear approaches when non-linear behaviour dominates. Unlike RSM, which relies on predefined functional forms, an ANN learns directly from the dataset and adapts to its structure. This adaptability positions the ANN as a reliable tool for reproducing predictive surfaces or search spaces for optimisation in civil engineering and material science [52,53], even in the face of small datasets.
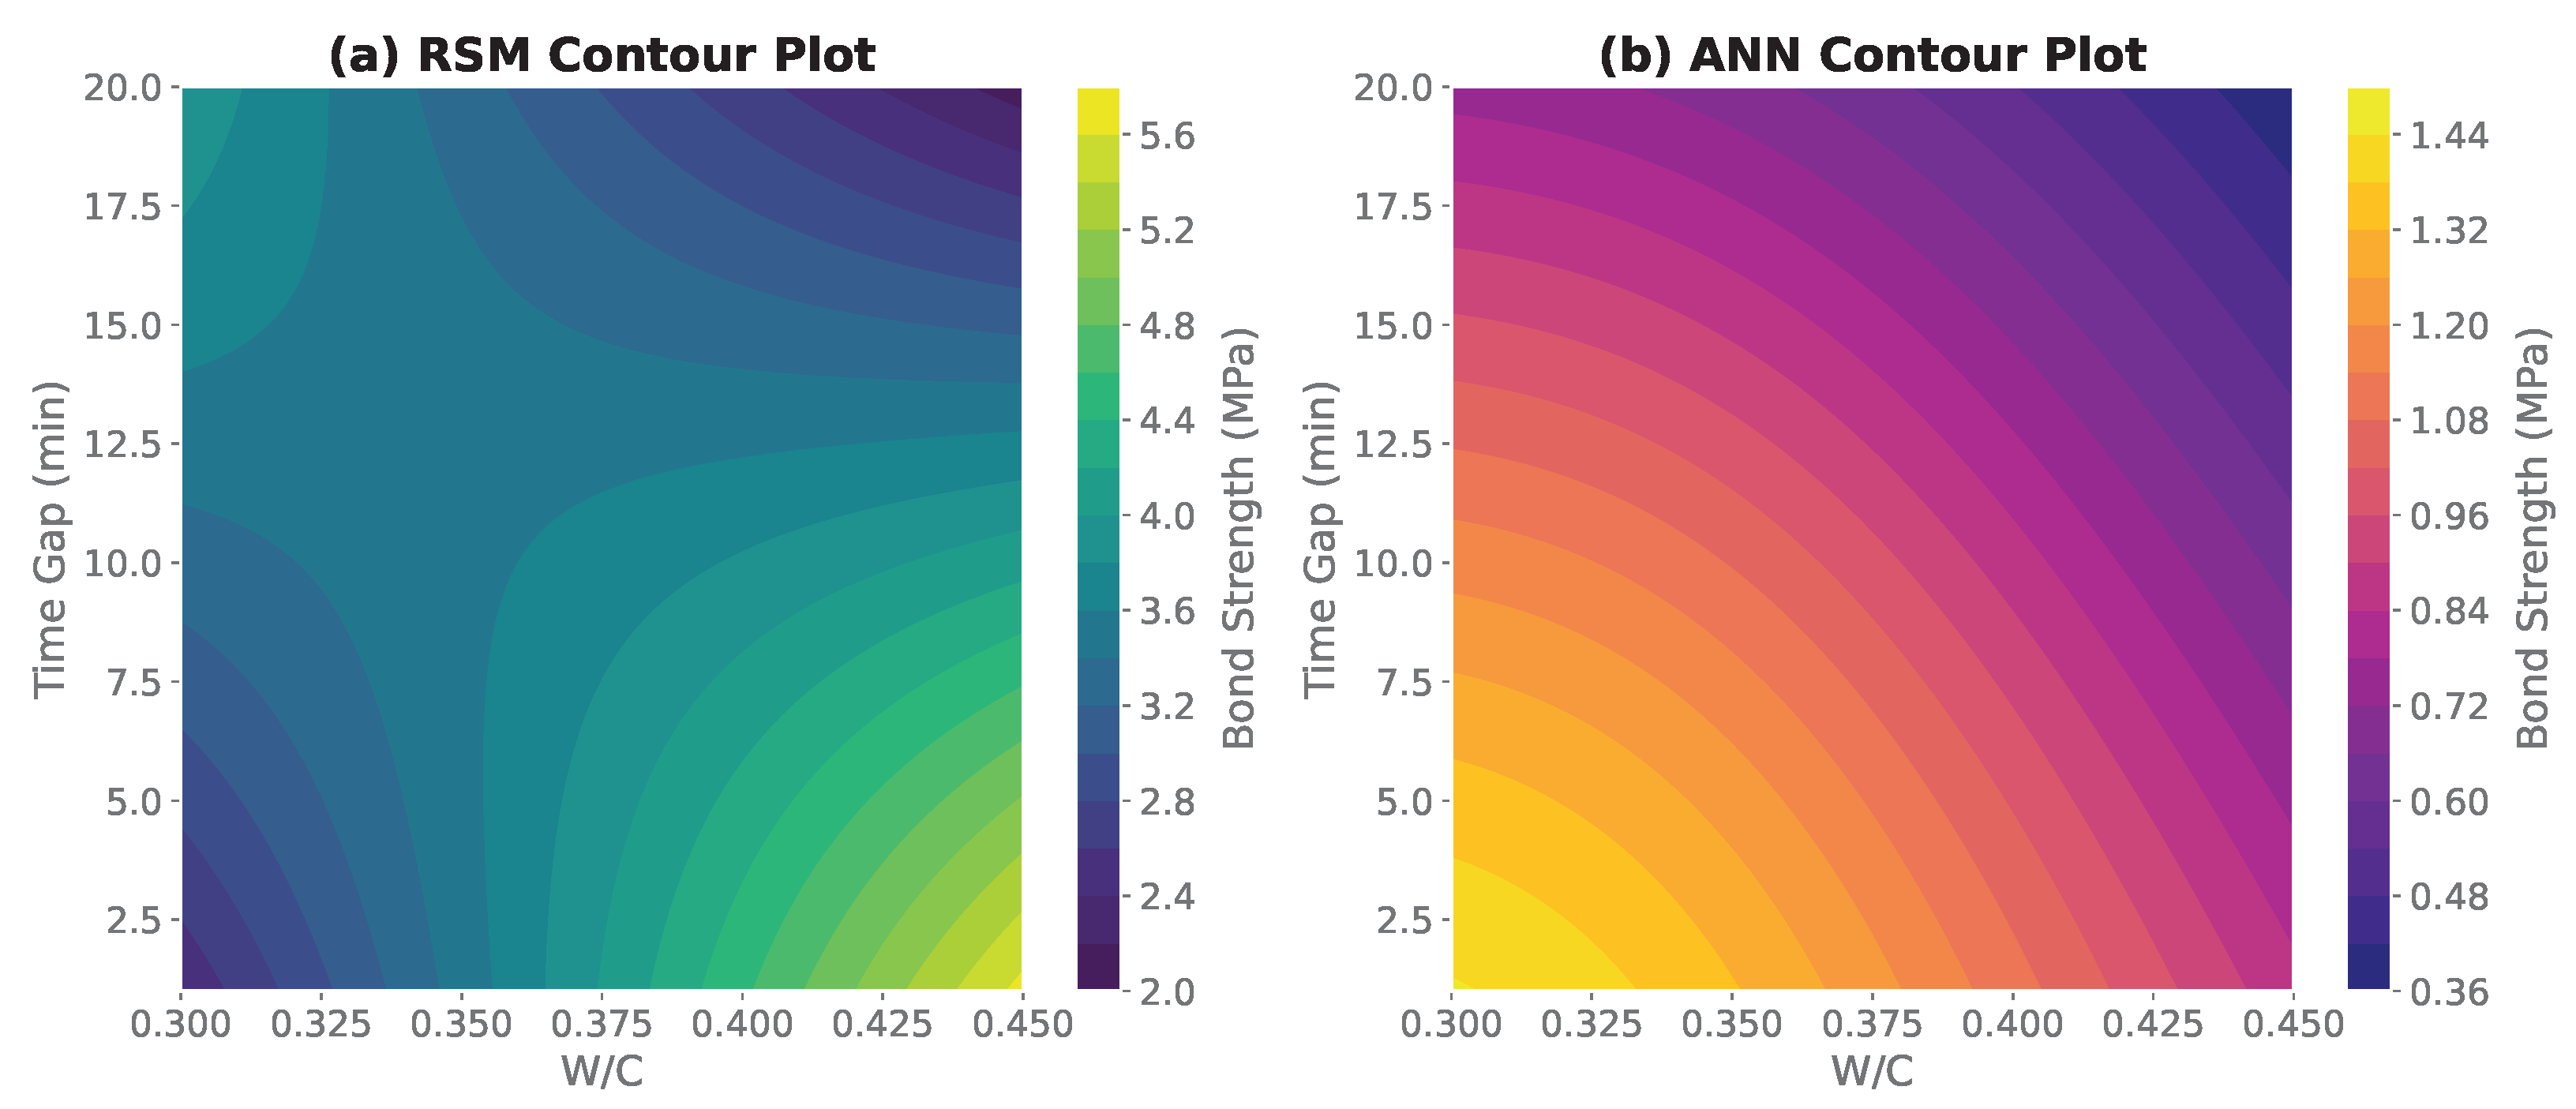
The contour maps in Figure 8 highlight distinct differences in how the RSM and ANN models capture the influence of the W/C and time gap on bond strength. In the RSM plot, the predicted bond strength forms a smooth curved interaction surface, with the optimum located at intermediate W/C ratios and shorter time gaps. This outcome reflects the polynomial structure of RSM, where quadratic interaction terms produce elliptical contour patterns [54].
The ANN contour map, in contrast, presents a more irregular and non-linear gradient. It indicates a sharper decline in bond strength at higher W/C ratios and longer time gaps, as well as subtle variations in regions where RSM predictions remain almost uniform [55]. This suggests that ANN captures localised, non-monotonic behaviours that quadratic models cannot fully represent [56]. These differences illustrate the trade-off between interpretability and flexibility. RSM offers transparency and is well suited to identifying broad patterns, while ANN provides superior adaptability in modelling complex non-linear interactions [57]. In practice, RSM may be advantageous in early design stages for screening and general optimisation, whereas ANN becomes more valuable in advanced stages, where precise fine-tuning of mix proportions and process parameters is vital, and combining with other evolutionary algorithms for pareto optimal search.

3.5. Desirability and Multi-Objective Optimisation

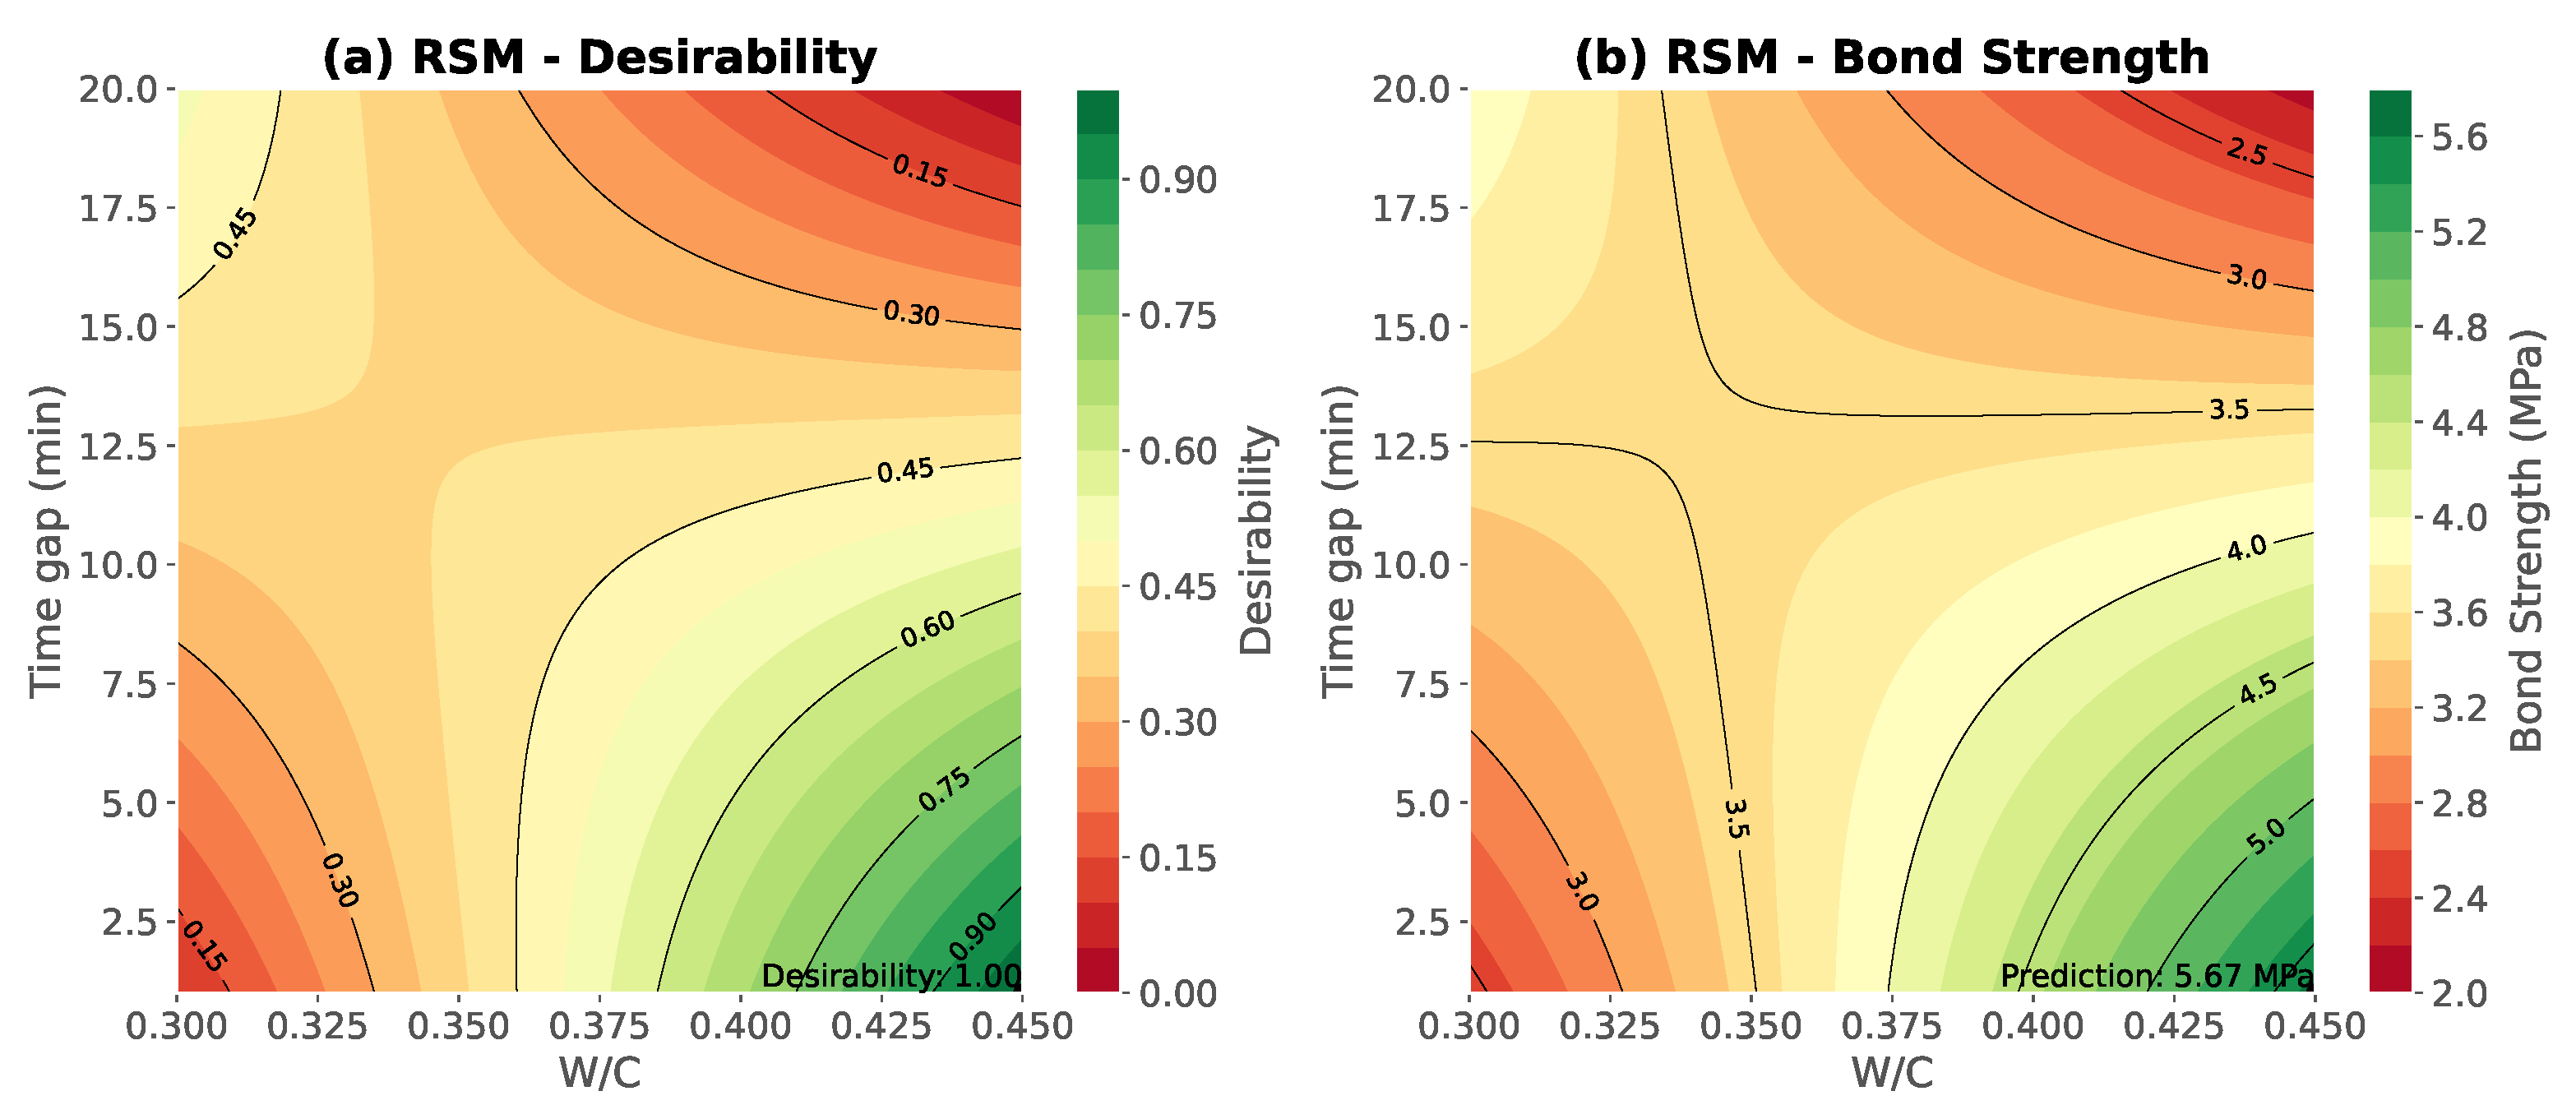
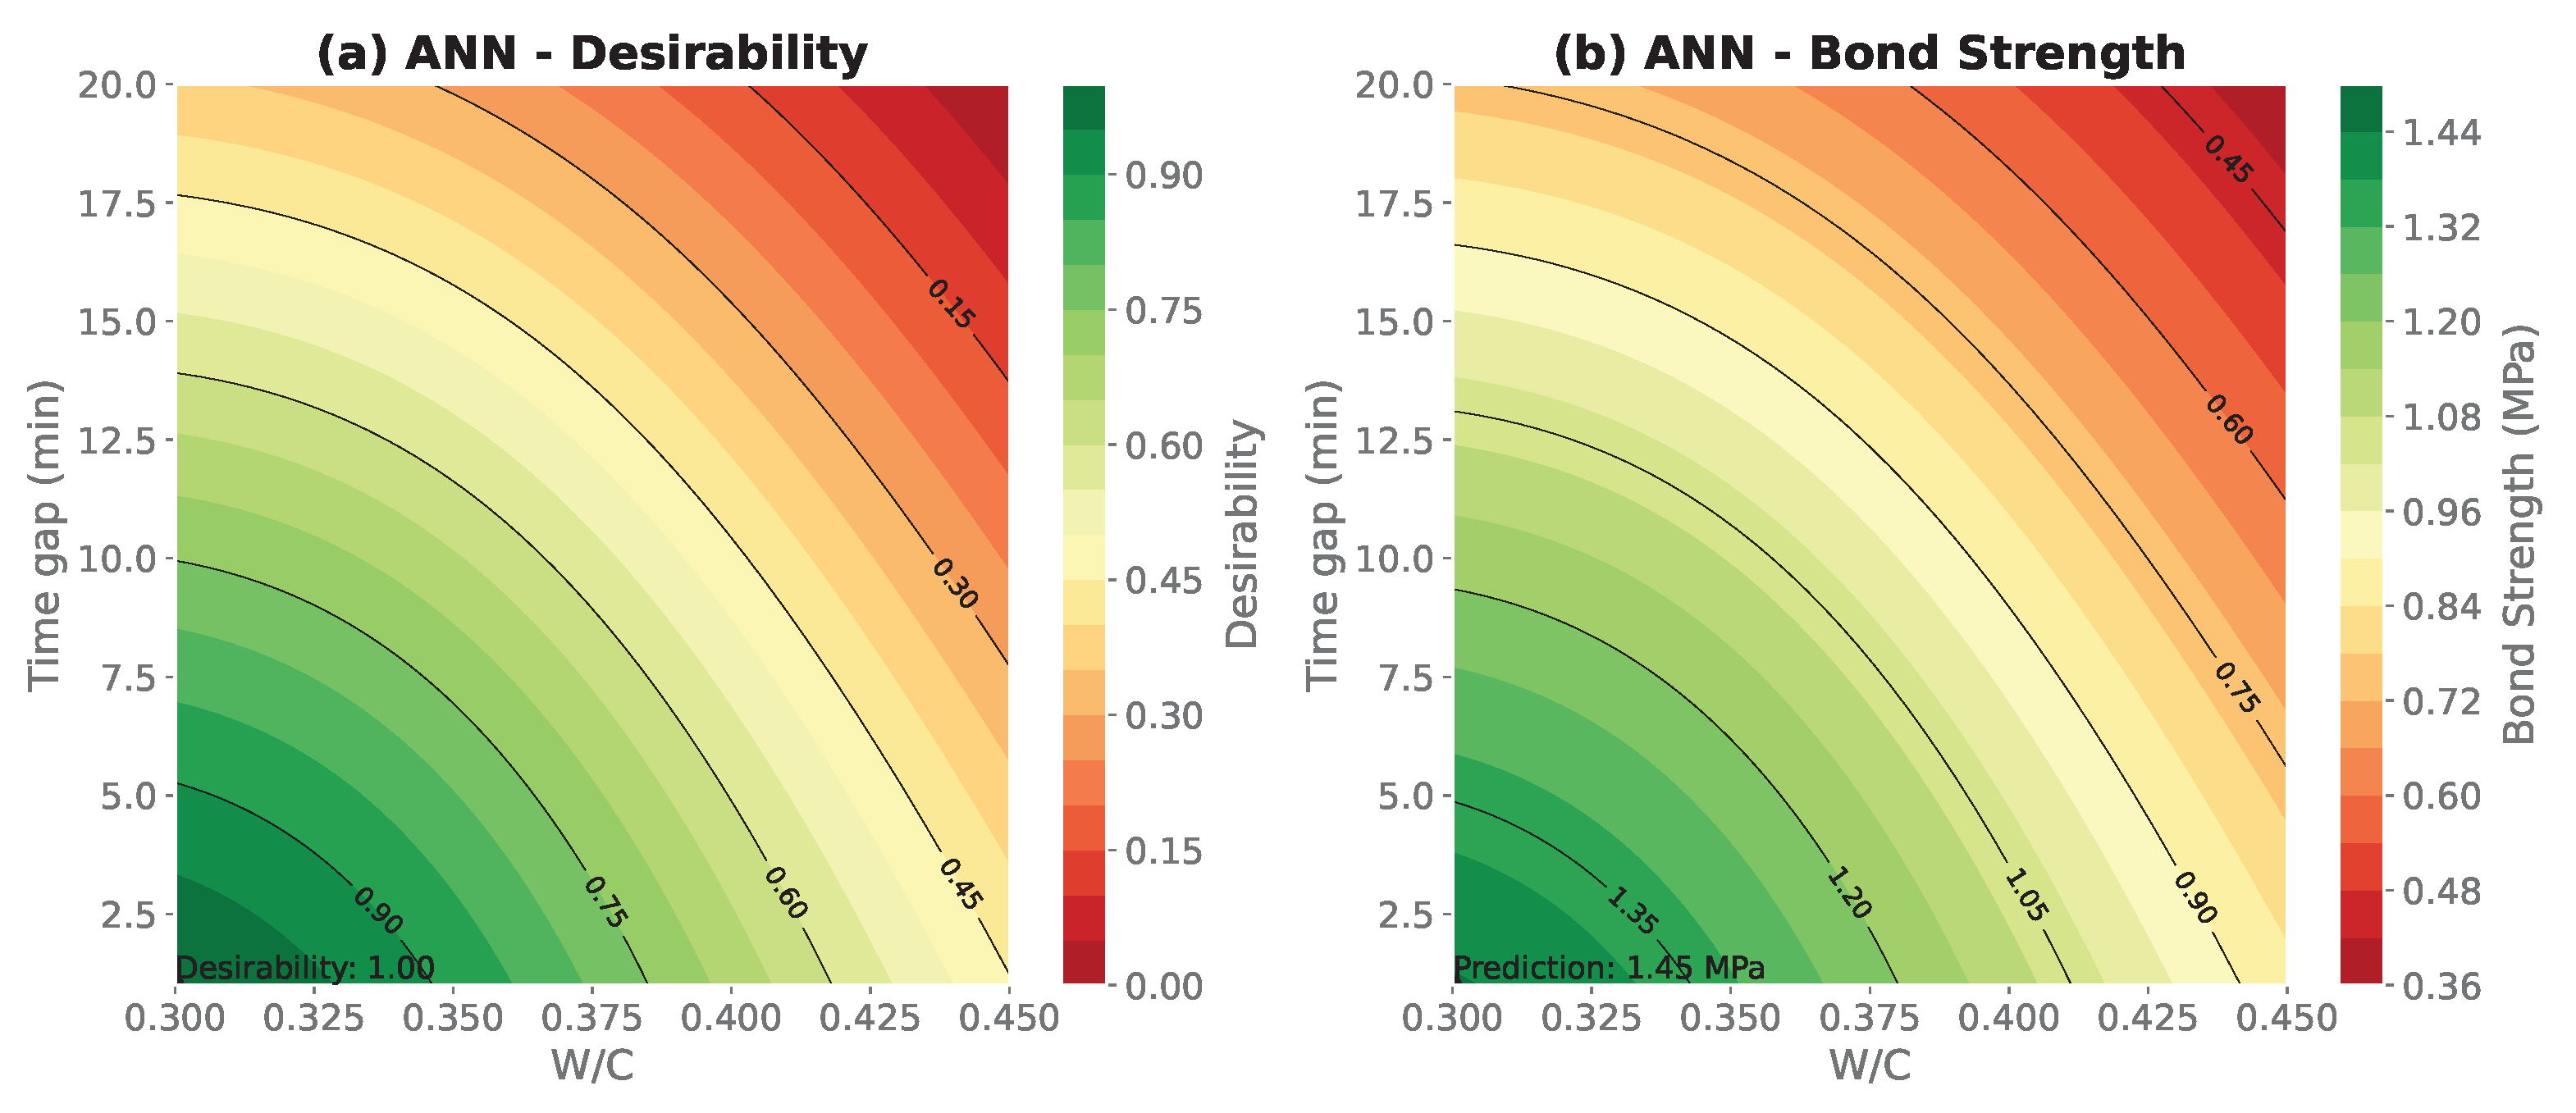
In evaluating the desirability function approach for optimising the W/C ratio and time gap, recent studies emphasise the relevance of multi-objective optimisation techniques such as RSM and ANN. As illustrated in Figure 9, the RSM contours suggest that an optimal configuration can be achieved at a W/C ratio of approximately 0.45 combined with a time gap of less than 5 min, which yields the highest desirability index and predicted bond strength. Although specific bond strength values are not explicitly stated in recent literature, RSM has consistently been demonstrated as an effective tool for identifying optimal process parameters in diverse engineering applications [58]. The emphasis on sustaining a relatively higher W/C ratio while minimising time delays is consistent with the broader understanding that improved hydration enhances bonding performance and reduces the risk of cold joint formation [59]. In contrast, Figure 10 highlights that the ANN model indicates a narrower optimal range for the W/C ratio. Some studies suggest values in the interval of 0.30–0.35, yet these predictions are not strongly supported by empirical data, reflecting ANN’s sensitivity to training datasets and its capacity to capture complex non-linear interactions [60].
From a multi-objective optimisation perspective, considering both RSM and ANN provides complementary insights. Both models agree on the necessity of minimising the time gap to mitigate interface weaknesses, yet they differ regarding the optimal W/C ratio. The RSM framework, with its structured polynomial regression, tends to favour higher W/C ratios, which can indeed enhance bond strength but also introduce practical risks such as bleeding and reduced workability [20]. Conversely, the ANN approach, due to its adaptive flexibility, suggests lower W/C ratios, which may improve handling properties but risk compromising flowability. These discrepancies further reflect the differences in modelling paradigms, with RSM offering structured interpretability and ANN emphasising complex adaptive fitting. Overall, both approaches reaffirm the critical importance of reducing time gaps, yet the selection of an appropriate W/C ratio requires balancing theoretical optimisation outcomes with practical considerations in materials application. A holistic optimisation strategy should therefore account for both strength improvement and buildability, ensuring applicability across real-world construction scenarios.

3.6. Sensitivity Analysis

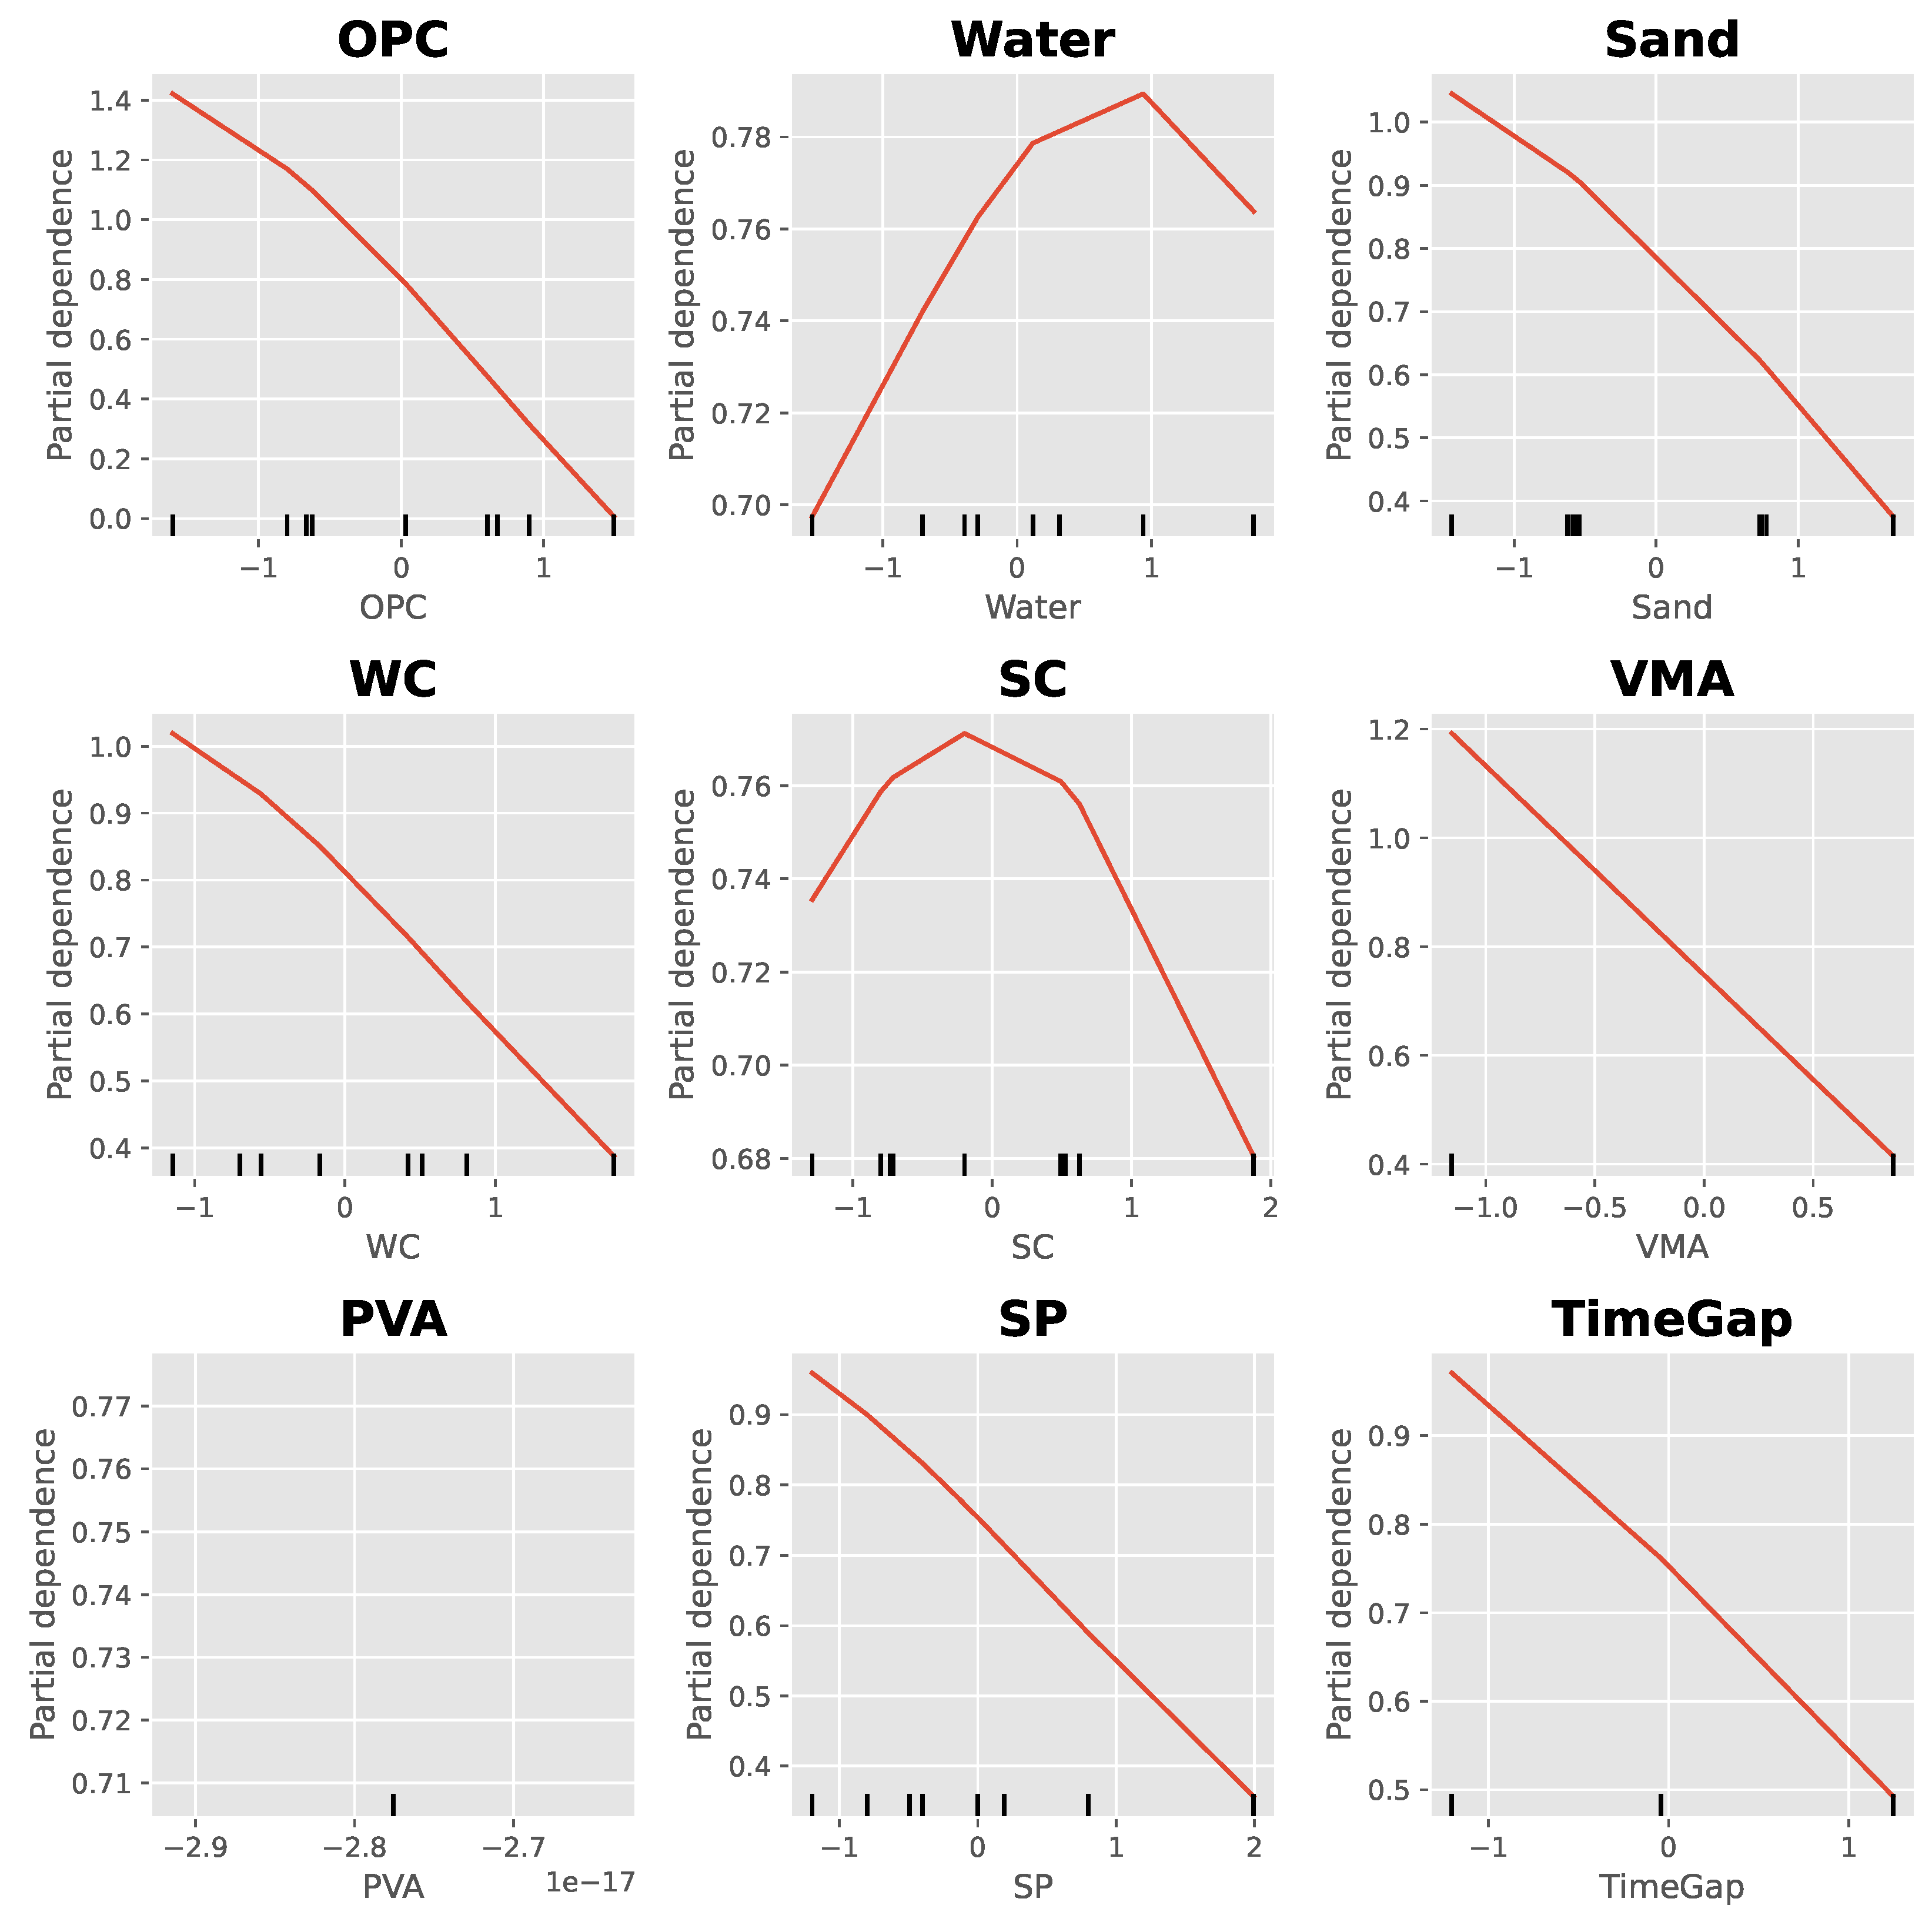
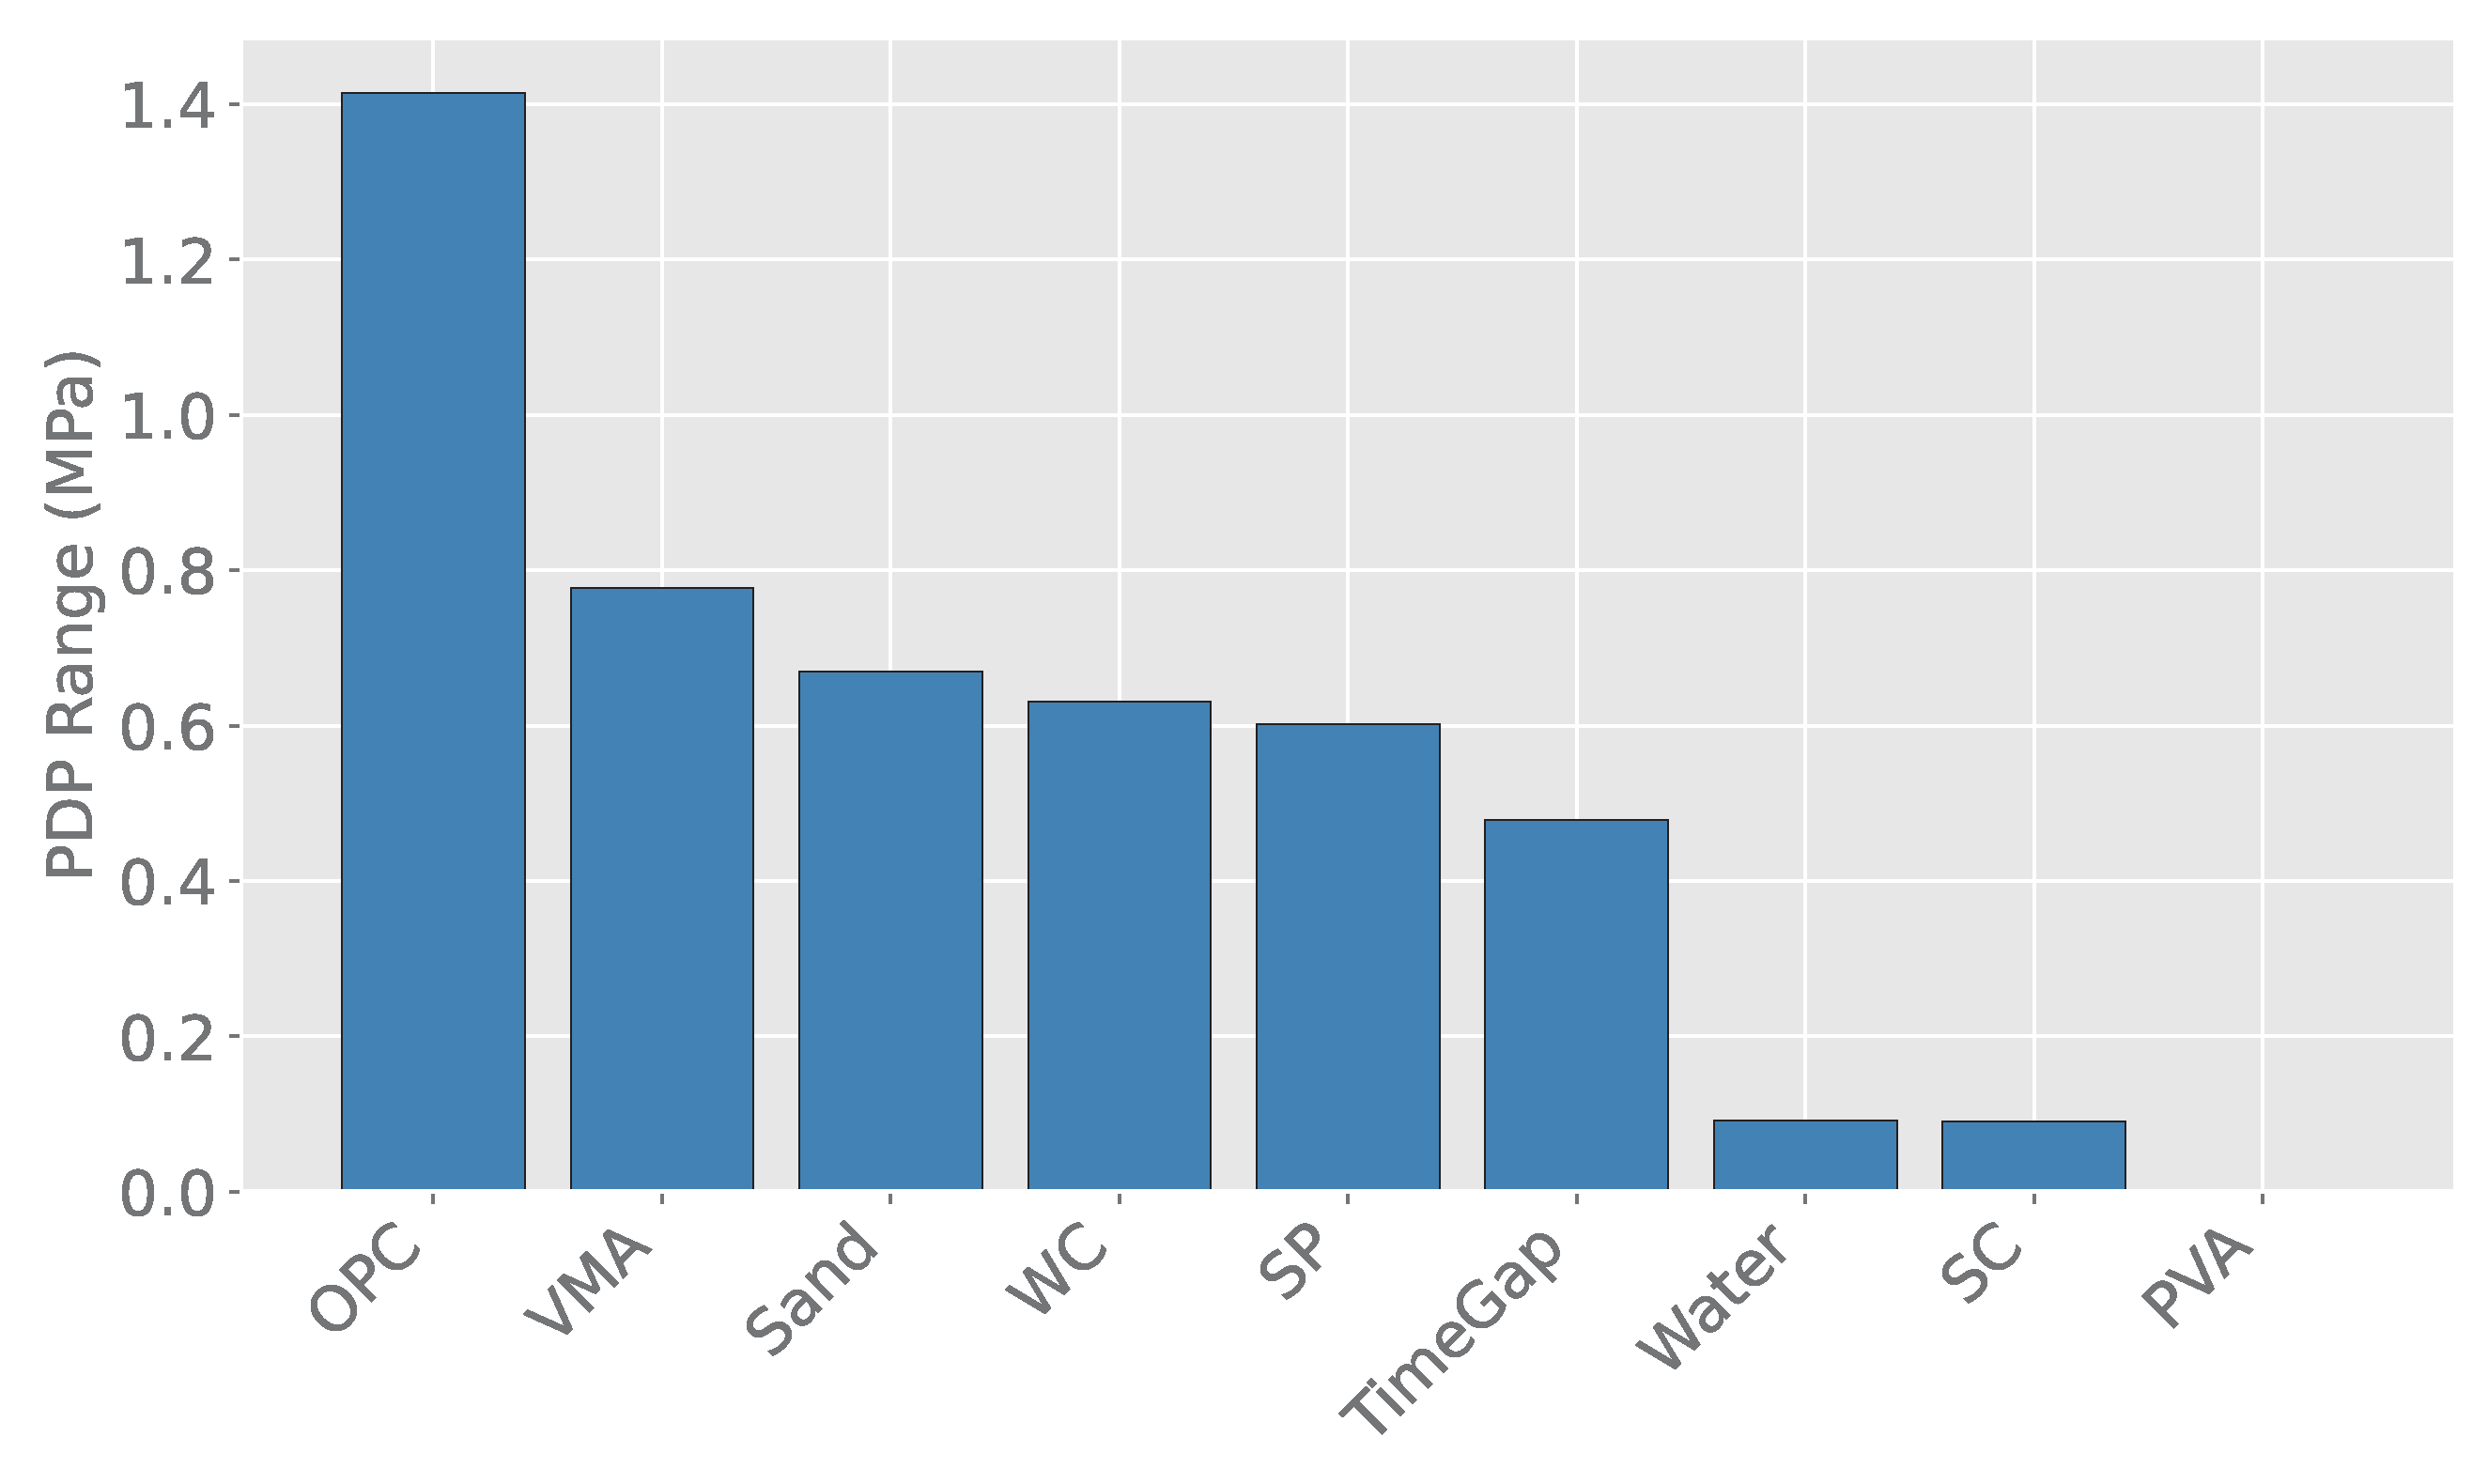
The sensitivity analysis of the ANN model was conducted utilising PDPs [61]. These plots capture the marginal influence of each input variable on the predicted bond strength, providing a clear visualisation of how individual factors contribute while others remain constant. Figure 11 illustrates the PDP curves for all variables, whereas Figure 12 depicts their relative importance based on the PDP range (MPa). The findings revealed that OPC content was the most influential factor, exhibiting the largest PDP range of approximately 2.00 MPa. This outcome aligns with prior studies which demonstrated that increased cement content enhances matrix densification and hydration dynamics, thereby improving stiffness and strength [62]. The W/C followed closely with an impact of 1.80 MPa, consistent with its well-documented control over pore structure, hydration kinetics, and overall mechanical performance in cementitious systems [62].
SP and SC were identified as secondary factors. Their contribution highlights the importance of particle packing and fresh mixture workability. Previous studies confirm that superplasticisers improve molecular interactions within the paste, enhancing flow and strength characteristics [63], while silica fume addition has been shown to promote microstructural refinement and interfacial cohesion [64]. Moderate effects were observed for water content, VMA, and time gap. These results suggest that while rheological stability and interlayer time gap affect bond quality, their influence is less pronounced than cement content or W/C ratio. The importance of rheological control is nevertheless well supported, with evidence that viscosity and yield stress significantly impact strength development in fresh cement-based materials [65]. Sand content and PVA fibres showed the lowest PDP ranges, indicating limited contributions to bond strength within the tested parameter space. This is consistent with prior observations of marginal effects at low fibre content [66].
Collectively, the ANN-based sensitivity analysis is strongly corroborated by mechanistic insights from existing literature on cementitious systems. It reinforces the conclusion that cement content and W/C ratio are the dominant determinants for optimising bond strength, while admixtures and casting practices serve as secondary adjustments. These findings emphasise the value of combining data-driven sensitivity analysis with experimental knowledge to guide optimisation in construction applications.

4. Limitations and Future Work

This study has demonstrated the utility of combining RSM and ANN approaches for optimising interlayer bond strength in 3D-printed cementitious materials. However, several limitations must be acknowledged. The experimental dataset, while compact and information-rich, constrains the generalisability of ANN predictions beyond the tested parameter space [67]. The limited dataset reflects the original CCD of the reference study, which was constructed to cover the factor space efficiently. Combining heterogeneous datasets from other sources would introduce variability due to different binders and admixtures, potentially reducing model reliability. Furthermore, the study focused only on a subset of variables, namely W/C ratio, S/C ratio, SP, and time gap, whereas other potentially influential factors such as printing speed, nozzle geometry, interlayer pressure, and curing regime were not considered [68]. Optimisation was also conducted under controlled laboratory conditions, which may limit the transferability of the findings to field environments subject to equipment variability and environmental influences [69]. Finally, reliance on PDPs for sensitivity analysis assumes marginal independence of variables and may obscure higher-order interactions that are important in complex systems [70].
Future work should prioritise expanding the dataset to enhance model robustness and incorporating additional process parameters into the optimisation framework [70]. Validation at field scale is essential to confirm the relevance of the identified optima under practical printing conditions [71]. There is also scope for extending multi-objective optimisation to balance bond strength with other criteria such as buildability, dimensional accuracy, and long-term durability [72]. In addition, integrating advanced explainable AI techniques, including SHAP (SHapley Additive exPlanations) and LIME (Local Interpretable Model-agnostic Explanations), would enhance interpretability and provide deeper insights into variable interactions [73]. Collectively, these directions will strengthen the reliability, scalability, and practical impact of model-informed mix and process design in extrusion-based 3D concrete printing.
Although the current parameter space (W/C, S/C, superplasticiser dosage, and time gap) was carefully controlled, real-world 3D printing is also influenced by curing regime, ambient temperature and humidity, nozzle geometry, and printing speed. Future work should therefore expand the input space to include these practical variables and validate the framework under field conditions. To enable this, progressively enriching the training dataset with site-specific measurements, incorporating buildability and print quality metrics, and applying explainable AI methods (e.g., SHAP, LIME) could help interpret heterogeneous data. In parallel, generative modelling techniques such as variational autoencoders (VAEs) may be explored to augment limited experimental datasets with synthetic but physically plausible mixes, mitigating overfitting risk and improving model robustness.

5. Conclusions

This study demonstrated the potential of combining RSM and ANNs to model and optimise interlayer bond strength in extrusion-based 3D-printed cementitious materials. Key conclusions are as follows:
1.
The RSM model provided accurate and interpretable predictions of bond strength, achieving a high coefficient of determination ( R 2 = 0.95 ) and low prediction error (maximum absolute errors = 0.16 MPa). ANN captured complex non-linearities but showed reduced predictive stability due to the limited dataset ( R 2 = 0.87 , maximum absolute errors = 0.29 MPa).
2.
Desirability-based optimisation identified that maintaining a low W/C ratio and minimising the interlayer time gap are critical to enhancing interlayer bond strength. Optimal values predicted by RSM suggested a W/C ratio of approximately 0.45 and a time gap below 5 min.
3.
Sensitivity analysis using PDP confirmed that OPC content and W/C ratio are the most influential variables, followed by superplasticiser dosage and silica content, while water content, viscosity-modifying agent, and time gap have moderate effects. Sand and fibre content are less influential within the studied range.
4.
The combined use of RSM and ANN provides complementary benefits: RSM delivers interpretable models for mix design, while ANN offers flexibility for non-linear behaviour when sufficiently large and diverse datasets are available.
These findings support the integration of statistical and machine learning tools to guide data-driven mix design and process control in 3D concrete printing, improving reliability and scalability for practical applications.

Author Contributions

Conceptualisation, L.S. and A.B.D.; Methodology, L.S. and A.B.D.; Software, L.S. and A.B.D.; Validation, G.P. and O.B.O.; Formal analysis, L.S. and A.B.D.; Investigation, L.S. and M.S. Resources, L.S., A.B.D., G.P. and O.B.O.; Data curation, L.S. and A.B.D.; Writing—original draft preparation, L.S. and A.B.D.; Writing—review and editing, G.P. and O.B.O.; Visualisation, O.B.O. and M.S. Supervision, L.S. and M.S. Project administration, L.S. and M.S. Funding acquisition, L.S. and M.S. All authors have read and agreed to the published version of the manuscript.

Funding

The involvement of Dr. Lenganji Simwanda in this research was supported by the Global Postdoc Fellowship Program of the Czech Technical University in Prague, and by the Czech Science Foundation under Grant 24-10892S. The APC was waived by MDPI.

Informed Consent Statement

Not applicable.

Data Availability Statement

All data supporting the findings of this study are contained within the article.

Acknowledgments

During the preparation of this manuscript, the authors used OpenAI’s ChatGPT-5 for assistance with language editing, reference formatting, and clarity improvements. The authors have reviewed and edited the output and take full responsibility for the content of this publication.

Conflicts of Interest

The authors declare no conflicts of interest. The funders had no role in the design of the study; in the collection, analyses, or interpretation of data; in the writing of the manuscript; or in the decision to publish the results.

Abbreviations

The following abbreviations are used in this manuscript:
ANNArtificial Neural Network
ANOVAAnalysis of Variance
MAEMean Absolute Error
OPCOrdinary Portland Cement
PDPPartial Dependence Plot
PVAPolyvinyl Alcohol
RSMResponse Surface Methodology
RMSERoot Mean Squared Error
SCSilica Content
S/CSand–Cement Ratio
SPSuperplasticiser
VMAViscosity-Modifying Agent
W/CWater–Cement Ratio

References

  1. Bos, F.; Menna, C.; Pradena, M.; Kreiger, E.; da Silva, W.L.; Rehman, A.; Weger, D.; Wolfs, R.; Zhang, Y.; Ferrara, L.; et al. The realities of additively manufactured concrete structures in practice. Cem. Concr. Res. 2022, 156, 106746. [Google Scholar] [CrossRef]
  2. Li, Z.; Hojati, M.; Wu, Z.; Piasente, J.; Ashrafi, N.; Duarte, J.; Radlińska, A. Fresh and hardened properties of extrusion-based 3D-printed cementitious materials: A review. Sustainability 2020, 12, 5628. [Google Scholar] [CrossRef]
  3. Shahzad, Q.; Umair, M.; Waqar, S. Bibliographic analysis on 3D printing in the building and construction industry: Printing systems, material properties, challenges, and future trends. J. Sustain. Constr. Mater. Technol. 2022, 7, 198–220. [Google Scholar] [CrossRef]
  4. Pemas, S.; Sougioultzi, K.; Kouroutzidou, C.; Stefanidou, M.; Konstantinidis, A.; Pechlivani, E. Enhancing clay-based 3D-printed mortars with polymeric mesh reinforcement techniques. Polymers 2024, 16, 2182. [Google Scholar] [CrossRef] [PubMed]
  5. Shaw, R.; Maurya, K.; Maity, D. 3D concrete printing: A road map for future of automated construction in India. In Proceedings of the 36th National Convention of Civil Engineers & National Conference on Innovation, Mechanization and Modern Techniques in Civil Engineering, Ranchi, India, 23–24 October 2021. [Google Scholar] [CrossRef]
  6. Satish, S.; Umar, T. Bridging innovation and practice: Assessing the readiness for 3D printing in construction. Eng. Constr. Archit. Manag. 2025. [Google Scholar] [CrossRef]
  7. Firoozi, A.; Firoozi, A. 3D printing in civil engineering: Pioneering affordable housing solutions. J. Civ. Eng. Urban. 2024, 14, 63–75. [Google Scholar] [CrossRef]
  8. Kantaros, A.; Zacharia, P.; Drosos, C.; Papoutsidakis, M.; Pallis, E.; Ganetsos, T. Smart infrastructure and additive manufacturing: Synergies, advantages, and limitations. Appl. Sci. 2025, 15, 3719. [Google Scholar] [CrossRef]
  9. Tay, Y.W.D.; Ting, G.H.A.; Qian, Y.; Panda, B.; He, L.; Tan, M.J. Time gap effect on bond strength of 3D-printed concrete. Virtual Phys. Prototyp. 2018, 14, 104–113. [Google Scholar] [CrossRef]
  10. Lee, H.; Kim, J.; Moon, J.; Kim, W.; Seo, E. Evaluation of the mechanical properties of a 3D-printed mortar. Materials 2019, 12, 4104. [Google Scholar] [CrossRef]
  11. Lee, Y.; Lee, S.; Kim, J.; Jeong, H.; Han, S.; Kim, K. Interlayer bond strength of 3D printed concrete members with ultra high performance concrete (UHPC) mix. Buildings 2024, 14, 2060. [Google Scholar] [CrossRef]
  12. Kloft, H.; Krauss, H.W.; Hack, N.; Herrmann, E.; Neudecker, S.; Varady, P.A.; Lowke, D. Influence of process parameters on the interlayer bond strength of concrete elements additive manufactured by Shotcrete 3D Printing (SC3DP). Cem. Concr. Res. 2020, 134, 106078. [Google Scholar] [CrossRef]
  13. Putten, J.; De Schutter, G.; De Tittelboom, K. Surface modification as a technique to improve inter-layer bonding strength in 3D-printed cementitious materials. RILEM Tech. Lett. 2019, 4, 33–38. [Google Scholar] [CrossRef]
  14. Shahzad, Q.; Li, F. Interfacial bond effects on the shear strength and damage in 3D-printed concrete structures: A combined experimental and numerical study. Eng. Fract. Mech. 2025, 315, 110840. [Google Scholar] [CrossRef]
  15. Hager, I.; Golonka, A.; Putanowicz, R. 3D printing of buildings and building components as the future of sustainable construction? Procedia Eng. 2022, 151, 292–299. [Google Scholar] [CrossRef]
  16. Peng, W.; Xia, H.; Wu, J.; Fang, Z.; Zhang, X. Dynamic boronate ester chemistry facilitating 3D printing interlayer adhesion and modular 4D printing of polylactic acid. Adv. Funct. Mater. 2025, 35, 2503682. [Google Scholar] [CrossRef]
  17. Qi, P.; Wang, Z.; Yu, R.; Pei, Q.; Yang, Q.; Wang, C.; Yang, L. Optimization design and regression model analysis of mechanical properties of 3D printed concrete. J. Build. Eng. 2025, 108, 112998. [Google Scholar] [CrossRef]
  18. Wang, C.; Lian, J.; Fang, Y.; Fan, G.; Yang, Y.; Huang, W.; Shi, S. Rheological optimization of 3D-printed cementitious materials using response surface methodology. Materials 2025, 18, 3933. [Google Scholar] [CrossRef]
  19. Jawad, H.H.; Kordani, N.; Bagheri, A.; Derazkola, H.A. Optimization of 3D printing parameters for enhanced mechanical strength: Effects of glass fiber reinforcement and fill ratio using RSM and ANOVA. J. Compos. Sci. 2025, 9, 63. [Google Scholar] [CrossRef]
  20. Patil, S.; Ramesh, B.; Sathish, T.; Saravanan, A. RSM-based modelling for predicting and optimizing the rheological and mechanical properties of fibre-reinforced laterized self-compacting concrete. Heliyon 2024, 10, e25973. [Google Scholar] [CrossRef]
  21. Cui, W.; Ji, D.; Shen, L.; Su, S.; Shi, X.; Liu, J.; Bai, Z.; Sun, Y.; Gong, J.; Tao, Y. A neural network-based model for assessing 3D printable concrete performance in robotic fabrication. Results Eng. 2025, 27, 105970. [Google Scholar] [CrossRef]
  22. Arif, M.; Jan, F.; Rezzoug, A.; Afridi, M.A.; Luqman, M.; Khan, W.A.; Kujawa, M.; Alabduljabbar, H.; Khan, M. Data-driven models for predicting compressive strength of 3D-printed fiber-reinforced concrete using interpretable machine learning algorithms. Case Stud. Constr. Mater. 2024, 21, e03935. [Google Scholar] [CrossRef]
  23. Sheiati, S.; Ranjbar, N.; Frellsen, J. Neural network predictions of the simulated rheological response of cement paste in the FlowCyl. Neural Comput. Appl. 2021, 33, 13027–13037. [Google Scholar] [CrossRef]
  24. Peng, L.; Miao, X.; Zhu, J.-X.; Zhang, M.-Q.; Zheng, X.-Q.; Li, H.-Y.; Wang, Y.; Jiang, X.; Huang, B.-T. Hybrid machine learning and multi-objective optimization for intelligent design of green and low-carbon concrete. Sustain. Mater. Technol. 2025, 45, e01605. [Google Scholar] [CrossRef]
  25. Azhagarsamy, S.; Pannirselvam, N. Optimizing mechanical properties of recycled aggregate concrete with graphene oxide and steel fibers: A predictive approach using ANN and RSM. Results Eng. 2025, 26, 104875. [Google Scholar] [CrossRef]
  26. Ombres, L.; Aiello, M.A.; Cascardi, A.; Verre, S. Modeling of Steel-Reinforced Grout Composite System-to-Concrete Bond Capacity Using Artificial Neural Networks. J. Compos. Constr. 2024, 28, 04024034. [Google Scholar] [CrossRef]
  27. Moelich, G.M.; Kruger, J.; Combrinck, R. Modelling the interlayer bond strength of 3D printed concrete with surface moisture. Cem. Concr. Res. 2021, 150, 106559. [Google Scholar] [CrossRef]
  28. Zandifaez, P.; Asadi Shamsabadi, E.; Akbar Nezhad, A.; Zhou, H.; Dias-da-Costa, D. AI-assisted optimisation of green concrete mixes incorporating recycled concrete aggregates. Constr. Build. Mater. 2023, 391, 131851. [Google Scholar] [CrossRef]
  29. Luo, D.; Wang, K.; Wang, D.; Sharma, A.; Li, W.; Choi, I.H. Artificial intelligence in the design, optimization, and performance prediction of concrete materials: A comprehensive review. npj Mater. Sustain. 2025, 3, 14. [Google Scholar] [CrossRef]
  30. Zheng, W.; Shui, Z.; Xu, Z.; Gao, X.; Zhang, S. Multi-objective optimization of concrete mix design based on machine learning. J. Build. Eng. 2023, 76, 107396. [Google Scholar] [CrossRef]
  31. Getachew, E.M.; Taffese, W.Z.; Espinosa-Leal, L.; Yehualaw, M.D. Machine learning applications in sustainable construction materials: A scientometrics review of global trends, themes, and future directions. Sustainability 2025, 17, 8453. [Google Scholar] [CrossRef]
  32. Anjali, R.; Venkatesan, G. Optimization and prediction of mechanical properties of composite concrete with crumb rubber using RSM and hybrid DNN–HHO algorithm. J. Build. Eng. 2024, 84, 108486. [Google Scholar] [CrossRef]
  33. Mousavi, M.; Bengar, H.A.; Mousavi, F.; Mahdavinia, P.; Bengar, M.A. Interlayer bond strength prediction of 3D printable concrete using artificial neural network: Experimental and modeling study. Structures 2025, 71, 108147. [Google Scholar] [CrossRef]
  34. Bittmann, T. A practical guide from Ordinary Least Squares to causal machine learning. Int. Food Agribus. Manag. Rev. 2025, 1, 1–30. [Google Scholar] [CrossRef]
  35. Jensen, W.A. Response Surface Methodology: Process and Product Optimization Using Designed Experiments 4th edition. J. Qual. Technol. 2017, 49, 186–188. [Google Scholar] [CrossRef]
  36. Fard, S.; Zainuddin, Z. The universal approximation capabilities of 2pi-periodic approximate identity neural networks. In Proceedings of the 2013 International Symposium on Computational and Business Intelligence, Guangzhou, China, 7–8 December 2013; pp. 793–798. [Google Scholar] [CrossRef]
  37. Fard, S.; Zainuddin, Z. Universal approximation property of weighted approximate identity neural networks. Proc. Sci. 2015, 259, 7. [Google Scholar] [CrossRef]
  38. Lazrak, A.; Boudéhenn, F.; Bonnot, S.; Fraisse, G.; Leconte, A.; Papillon, P.; Souyri, B. Development of a dynamic artificial neural network model of an absorption chiller and its experimental validation. Renew. Energy 2016, 86, 1009–1022. [Google Scholar] [CrossRef]
  39. Khan, A.Q.; Awan, H.A.; Rasul, M.; Siddiqi, Z.A.; Pimanmas, A. Optimized artificial neural network model for accurate prediction of compressive strength of normal and high strength concrete. Clean. Mater. 2023, 10, 100211. [Google Scholar] [CrossRef]
  40. Akiba, T.; Sano, S.; Yanase, T.; Ohta, T.; Koyama, M. Optuna: A Next-generation Hyperparameter Optimization Framework. In Proceedings of the 25th ACM SIGKDD International Conference on Knowledge Discovery & Data Mining, Anchorage, AK, USA, 4–8 August 2019; KDD ’19. pp. 2623–2631. [Google Scholar] [CrossRef]
  41. Wu, D.; Wang, J.; Tong, M.; Chen, K.; Zhang, Z. Performance optimization of FA-GGBS geopolymer based on response surface methodology. Polymers 2023, 15, 1881. [Google Scholar] [CrossRef] [PubMed]
  42. Chen, W.; Zhang, G.; Qin, T.; Yu, L.; Li, T.; Guan, X. Experimental research on mix ratio of construction waste cemented filling material based on response surface methodology. Adv. Mater. Sci. Eng. 2022, 2022, 8274733. [Google Scholar] [CrossRef]
  43. Cui, H.; Peng, H.; Yang, W.; Yang, H.; Zhang, C.; Zheng, D. Effect of thermal cycles and curing age on bonding strength of cement mortar using manufactured sand. Buildings 2024, 14, 783. [Google Scholar] [CrossRef]
  44. Khuri, A.I. A general overview of response surface methodology. Biom. Biostat. Int. J. 2017, 5, 87–93. [Google Scholar] [CrossRef]
  45. Almarzooq, H.; Waheed, U. Automating hyperparameter optimization in geophysics with optuna: A comparative study. Geophys. Prospect. 2024, 72, 1778–1788. [Google Scholar] [CrossRef]
  46. Mairpady, A.; Mourad, A.; Mozumder, M. Statistical and machine learning-driven optimization of mechanical properties in designing durable HDPE nanobiocomposites. Polymers 2021, 13, 3100. [Google Scholar] [CrossRef] [PubMed]
  47. Nakhaei, M.; Mostafapour, A.; Naderi, G. Optimization of mechanical properties of PP/EPDM/clay nanocomposite fabricated by friction stir processing with response surface methodology and neural networks. Polym. Compos. 2016, 38, E80–E90. [Google Scholar] [CrossRef]
  48. Betiku, E.; Okunsolawo, S.; Ajala, S.; Odedele, O. Performance evaluation of artificial neural network coupled with genetic algorithm and response surface methodology in modeling and optimization of biodiesel production process parameters from shea tree (Vitellaria paradoxa) nut butter. Renew. Energy 2015, 76, 408–417. [Google Scholar] [CrossRef]
  49. Lingam, D.; Ananthanarayanan, R.; Jeevanantham, A. Analysis and prediction of the mechanical properties of cold rolled Al-Li preforms using statistical and artificial neural network models. Eng. Res. Express 2025, 7, 015583. [Google Scholar] [CrossRef]
  50. Sridhar, J.; Balaji, S.; Dhanapal, J.; Awoyera, P. Prediction of the mechanical properties of fibre-reinforced quarry dust concrete using response surface and artificial neural network techniques. Adv. Civ. Eng. 2023, 2023, 8267639. [Google Scholar] [CrossRef]
  51. Reza, A.; Chen, L. Optimization and modeling of ammonia nitrogen removal from high strength synthetic wastewater using vacuum thermal stripping. Processes 2021, 9, 2059. [Google Scholar] [CrossRef]
  52. Pardede, D.; Hayadi, B.; Iskandar, I. Kajian literatur multi layer perceptron seberapa baik performa algoritma ini. J. ICT Appl. Syst. 2022, 1, 23–35. [Google Scholar] [CrossRef]
  53. Taki, O.; Rhazi, K.; Mejdoub, Y. Stirling engine optimization using artificial neural networks algorithm. ITM Web Conf. 2023, 52, 02010. [Google Scholar] [CrossRef]
  54. Myers, R.H.; Montgomery, D.C.; Anderson-Cook, C.M. Response Surface Methodology: Process and Product Optimisation Using Designed Experiments, 4th ed.; Wiley: Hoboken, NJ, USA, 2016. [Google Scholar]
  55. Mashrei, M.A.; Seracino, R.; Rahman, M.S. Application of artificial neural networks to predict the bond strength of FRP-to-concrete joints. Constr. Build. Mater. 2013, 40, 812–821. [Google Scholar] [CrossRef]
  56. Haykin, S. Neural Networks and Learning Machines, 3rd ed.; Pearson: Upper Saddle River, NJ, USA, 2009. [Google Scholar]
  57. Montgomery, D.C.; Runger, G.C.; Hubele, N.F. Engineering Statistics, 5th ed.; Wiley: Hoboken, NJ, USA, 2012. [Google Scholar]
  58. Altharan, Y.; Shamsudin, S.; Lajis, M.; Al-Alimi, S.; Yusuf, N.; Alduais, N.; Zhou, W. Optimizing strength of directly recycled aluminum chip-based parts through a hybrid rsm-ga-ann approach in sustainable hot forging. PLoS ONE 2024, 19, e0300504. [Google Scholar] [CrossRef] [PubMed]
  59. Khalid, A.; Hamza, H.; Mirjalili, S.; Hosny, K. MOCOVIDOA: A novel multi-objective coronavirus disease optimization algorithm for solving multi-objective optimization problems. Neural Comput. Appl. 2023, 35, 17319–17347. [Google Scholar] [CrossRef] [PubMed]
  60. Khodadadi, N.; Abualigah, L.; Al-Tashi, Q.; Mirjalili, S. Multi-objective chaos game optimization. Neural Comput. Appl. 2023, 35, 14973–15004. [Google Scholar] [CrossRef]
  61. Moosbauer, J.; Herbinger, J.; Casalicchio, G.; Lindauer, M.; Bischl, B. Explaining hyperparameter optimization via partial dependence plots. Adv. Neural Inf. Process. Syst. 2021, 34, 2280–2291. [Google Scholar]
  62. Correia, A.; Oliveira, P.; Lemos, L. Strength assessment of chemically stabilised soft soils. Proc. Inst. Civ. Eng.-Geotech. Eng. 2019, 172, 218–227. [Google Scholar] [CrossRef]
  63. Baltazar, L.G.; Henriques, F.M.A.; Reis, D.; Cidade, M.T. Yield Stress in Injection Grouts for Strengthening of Stone Masonry Walls. In Proceedings of the Iberian Meeting on Rheology (IBEREO 2019); Galindo-Rosales, F.J., Campo-Deaño, L., Afonso, A.M., Alves, M.A., Pinho, F.T., Eds.; Springer: Cham, Switzerland, 2020; pp. 170–174. [Google Scholar] [CrossRef]
  64. Zhou, J.; Ban, C.; Zhou, H.; Ren, J.; Liu, Z. Experimental study on the shear strength and failure mechanism of cemented soil–concrete interface. Materials 2023, 16, 4222. [Google Scholar] [CrossRef]
  65. Mizobuchi, S.; Kato, T.; Yamada, B.; Kan, K.; Ohtani, M.; Kobiro, K. Influence of the nanostructural characteristics of inorganic fillers on the physical properties of resin cements. Dent. Mater. J. 2023, 42, 291–299. [Google Scholar] [CrossRef]
  66. Ebonghas, I.P.; Odokonyero, L.C. Integrated experimental and microstructural analysis of basalt fiber-reinforced cemented soils: Multivariable strength prediction and residual behavior assessment. 2025. Preprints. [Google Scholar] [CrossRef]
  67. Chen, Y.; Jansen, K.; Zhang, H.; Rodríguez, C.; Gan, Y.; Çopuroğlu, O.; Schlangen, E. Effect of printing parameters on interlayer bond strength of 3D printed limestone-calcined clay-based cementitious materials: An experimental and numerical study. Constr. Build. Mater. 2020, 262, 120094. [Google Scholar] [CrossRef]
  68. Yuan, Q.; Gao, C.; Huang, T.; Zuo, S.; Yao, H.; Zhang, K.; Liu, J. Factors influencing the properties of extrusion-based 3D-printed alkali-activated fly ash-slag mortar. Materials 2022, 15, 1969. [Google Scholar] [CrossRef]
  69. Raphael, B.; Senthilnathan, S.; Patel, A.; Bhat, S. A review of concrete 3D printed structural members. Front. Built Environ. 2023, 8, 1034020. [Google Scholar] [CrossRef]
  70. Ng, W.; Goh, G.; Ten, J.; Yeong, W. Progress and opportunities for machine learning in materials and processes of additive manufacturing. Adv. Mater. 2024, 36, 23010006. [Google Scholar] [CrossRef]
  71. Ning, X.; Liu, T.; Wu, C.; Wang, C. 3D printing in construction: Current status, implementation hindrances, and development agenda. Adv. Civ. Eng. 2021, 2021, 6665333. [Google Scholar] [CrossRef]
  72. Nguyen, P.; Zhang, Y.; Zhang, Z.; Yang, C. Multi-objective optimisation of fused filament fabrication of acrylonitrile butadiene styrene for enhancing mechanical performance and build time. Int. J. Adv. Manuf. Technol. 2025, 137, 5431–5449. [Google Scholar] [CrossRef]
  73. Zhu, A. Navigating the path to responsible AI: Interpretable models and ethical implications. Highlights Sci. Eng. Technol. 2024, 85, 830–835. [Google Scholar] [CrossRef]
Figure 1. Workflow of the RSM-CCD modelling process for bond strength optimisation.
Buildings 15 03794 g001
Figure 2. Architecture of the ANN showing the mechanism for predicting bond strength of 3D-printed cementitious composites.
Buildings 15 03794 g002
Figure 3. RSM response surfaces showing the combined effects of (a) W/C and time gap, and (b) W/C and SP on predicted bond strength.
Buildings 15 03794 g003
Figure 4. Optuna optimisation history for ANN hyperparameters, showing the evolution of the mean squared error (MSE) over trials.
Buildings 15 03794 g004
Figure 5. Scatter plots of predicted vs. experimental bond strength for (a) RSM and (b) ANN models.
Buildings 15 03794 g005
Figure 6. Residual plot comparing errors between RSM and ANN predictions for the 21 specimens in the experimental database.
Buildings 15 03794 g006
Figure 7. Prediction surfaces for bond strength: (a) RSM; (b) ANN, as functions of W/C and time gap.
Buildings 15 03794 g007
Figure 8. Comparison of contour plots for RSM and ANN models showing the effect of W/C ratio and time gap on bond strength.
Buildings 15 03794 g008
Figure 9. RSM model: (a) Desirability plot. (b) Bond strength prediction surface.
Buildings 15 03794 g009
Figure 10. ANN model: (a) Desirability plot; (b) Bond strength prediction surface.
Buildings 15 03794 g010
Figure 11. Partial dependence plots for ANN bond strength prediction, showing the marginal effect of each input variable.
Buildings 15 03794 g011
Figure 12. ANN feature sensitivity ranking based on PDP range (MPa).
Buildings 15 03794 g012
Table 1. Analysis of variance (ANOVA) results for the RSM model.
SourceSum SqdfFp-Value
WC2.6582165.2250.000021
SC1.4030134.4260.000239
SP2.7581167.6770.000018
Time Gap0.009210.2260.645941
WC 2 0.118912.9190.121741
SC 2 0.4391110.7740.009494
SP 2 0.130013.1900.107744
TimeGap 2 0.109512.6860.135643
WC:SC0.077411.9000.201331
WC:SP0.186014.5650.061369
WC:Time Gap0.250916.1560.034922
SC:SP0.243515.9750.037097
SC:Time Gap0.283716.9600.026992
SP:Time Gap0.041411.0160.339798
Residual0.36689
Table 2. Optimal ANN hyperparameters determined via Optuna.
HyperparameterOptimal Value
Number of units (Layer 1)70
Number of units (Layer 2)40
Activation functiontanh
Solveradam
Regularisation parameter ( α ) 1.42 × 10 5
Initial learning rate0.00923
Early stoppingFalse
Table 3. Comparison of actual and predicted bond strengths for RSM and ANN models.
Specimen No.RSMANN
Predicted (MPa)Abs. Error (MPa)Predicted (MPa)Abs. Error (MPa)
1−0.120.120.280.28
20.100.100.070.07
30.020.02−0.140.14
41.510.031.370.17
51.180.211.060.09
60.490.180.690.02
71.600.091.600.09
81.320.121.280.08
90.680.030.850.14
101.240.111.230.10
111.250.121.120.25
120.930.010.900.02
131.170.081.070.02
141.170.090.870.39
150.840.010.580.25
161.040.041.010.01
170.830.320.830.32
180.280.280.560.56
190.000.000.220.22
200.100.100.090.09
21−0.100.10−0.010.01
Disclaimer/Publisher’s Note: The statements, opinions and data contained in all publications are solely those of the individual author(s) and contributor(s) and not of MDPI and/or the editor(s). MDPI and/or the editor(s) disclaim responsibility for any injury to people or property resulting from any ideas, methods, instructions or products referred to in the content.