Article

Quantifying the Impact of Soil–Structure Interaction on Performance-Based Seismic Design of Steel Moment-Resisting Frame Buildings

1
Department of Disaster Mitigation for Structures, College of Civil Engineering, Tongji University, Shanghai 200092, China
2
Department of Civil Engineering, Faculty of Engineering, Ayatollah Boroujerdi University, Boroujerd 6919969737, Iran
3
School of Science and Technology, Hellenic Open University, GR26335 Patras, Greece
*
Author to whom correspondence should be addressed.
Buildings 2025, 15(20), 3741; https://doi.org/10.3390/buildings15203741
Submission received: 8 September 2025 / Revised: 2 October 2025 / Accepted: 14 October 2025 / Published: 17 October 2025

Abstract

This study quantifies the influence of soil–structure interaction (SSI) on key parameters of performance-based seismic design (PBSD) for steel moment-resisting frames. Specifically, PBSD is extended as a methodology in which explicit structural performance levels, such as immediate occupancy, damage limitation, life safety, and collapse prevention, serve as the basis for sizing and detailing structural members under specified seismic hazard levels, instead of traditional force-based design. The PBSD framework is further developed to incorporate SSI by adopting a beam on a nonlinear Winkler foundation model. This model captures the nonlinear soil response and its interaction with the structure, enabling a more realistic design framework within a performance-based context. To evaluate and quantify the influence of SSI in the PBSD method, an extensive parametric study is performed using 100 far-field ground motions, categorized into four groups (25 records each) corresponding to EC8 soil types A, B, C, and D. Nonlinear time history analyses reveal consistent trends across the examined frames. When SSI is neglected, the fundamental natural period (T) is systematically underestimated by approximately up to 3.5% on EC8 soil type C and up to 15% on soil type D. As a result, the base shear and the mean values of maximum interstorey drift ratios (IDRs) are overestimated compared to cases accounting for soil flexibility, with the largest drift discrepancies observed in frames with eight or more storeys on soil D. The analyses further reveal that softer soils (e.g., Soil D) lead to significantly higher q values, particularly for moderate-to-long period structures, whereas stiffer soils (e.g., Soil B) cause only minor deviations, remaining close to fixed-base values. A complementary machine learning module, trained on the same dataset, is employed to predict base shear, maximum IDR, and the behavior factor q. It successfully reproduces the deterministic SSI trends, achieving coefficients of determination (R2) ranging from 0.986 to 0.992 for maximum IDR, 0.947 to 0.948 for base shear, and 0.944 to 0.952 for q. Feature importance analysis highlights beam and column ductility, soil class, and performance level as the most influential predictors of structural response.

1. Introduction

The force-based design (FBD) approach remains the dominant methodology in most seismic code provisions, including Eurocode 8 (EC8) [1], despite widespread criticism regarding its limited ability to directly control structural damage [2]. According to this approach, an equivalent elastic seismic force is determined via an elastic design response spectrum. This force is subsequently reduced by a behavior factor that represents the inelastic deformation capacity of the structure [1]. The resulting design forces are vertically distributed throughout the structure, and a linear elastic analysis is performed to size members for strength. Deformation checks are conducted separately, often using simplified rules such as the equal displacement approximation [3]. In reinforced concrete structures, a common assumption is to reduce member gross stiffness by approximately fifty percent to account for cracking. If this adjustment is not properly calibrated, it can lead to significant underestimation of inelastic displacements [4]. For steel moment-resisting frames (MRFs), actual inelastic deformations may exceed the estimates derived from linear analysis due to variations in plastic hinge formation and the limitations of fixed mode shape assumptions [5,6]. Although FBD is widely used due to its relative simplicity and clarity, it typically addresses performance objectives in an implicit way.
Since the global force demands calculated in conventional FBD do not reliably represent the distribution or extent of actual structural damage, modern seismic design practice has increasingly adopted performance-based seismic design (PBSD). Specifically, PBSD extends the focus beyond strength to explicitly consider damage states across multiple levels of seismic intensity, typically with at least four distinct performance levels [7], namely immediate occupancy (IO), damage limitation (DL), life safety (LS), and collapse prevention (CP). Displacements are crucial in PBSD, since they correlate directly with both structural and non-structural damage. Although EC8 [1] nominally follows PBSD by recognizing serviceability and ultimate limit states, it provides only approximate coverage of performance levels. By defining distinct seismic intensities [8,9] and corresponding target deformation limits [7], PBSD yields more refined guidance for both new designs and the rehabilitation of existing structures.
A FBD method that implements the PBSD philosophy was proposed in references [10,11]. Instead of using a single uniform behavior factor, this approach introduces modal behavior factors or equivalent modal damping ratios that vary by mode, soil type, and performance objective. These mode-specific reduction factors or damping ratios are calibrated using target deformation limits, such as inter-story drift ratios (IDRs) and plastic rotations, so that strength checks alone inherently satisfy PBSD requirements without iterative deformation checks. Relevant studies on reinforced concrete [12,13] and steel [10,14] frames demonstrate that the resulting designs meet the performance levels with minimal additional effort over conventional FBD, while offering better deformation control.
Within the PBSD framework, displacement-based design (DBD) [15] is a key approach, with several improved variations developed to address higher mode effects and better stiffness estimation. Together with DBD, the hybrid force/displacement (HFD) method [2] combines displacement targets with conventional FBD procedures to integrate performance levels into a standard code-based framework.
The DBD approach targets deformation demands instead of forces [15], making it effective for flexible and ductile systems by incorporating realistic stiffness and damping. It has been applied to reinforced concrete and steel frames to control drifts and inelastic rotations [15,16,17], using equivalent single degree of freedom models or nonlinear analyses to meet performance levels. DBD also accounts for material variability better than FBD when calibrated with experimental or numerical data [18]. Direct displacement-based design (DDBD) builds on DBD by using target displacement as the main input and representing structures as equivalent single-degree-of-freedom systems with secant stiffness and equivalent damping [15,19]. This directly links deformation capacity to design forces and avoids arbitrary stiffness reductions. DDBD shows good consistency with the performance levels, especially for reinforced concrete frames [20], though simplified SDOF models and displacement spectra limit its broader use [21]. An improved DDBD method includes MDOF formulations for R/C frames capturing higher mode and p-Δ effects [22]. The same method has been extended to steel MRFs, eccentrically braced frames (EBFs), and buckling-restrained braced frames (BRBFs) using modal damping and drift-based displacements [23].
Finally, the HFD method advances performance-based design by combining elements of force and displacement-based approaches [2]. It converts drift and ductility demands into a target roof displacement, linking damage levels to design requirements [24], and introduces a deformation-dependent behavior factor to adjust seismic forces for inelastic displacements. Avoiding the replacement of the multi-degree-of-freedom system with a single-degree model preserves modeling accuracy [6], while its iterative process aligns strength and deformation criteria. The method has been applied to steel frames [25] and extended to reinforced concrete and composite systems [24,26]. A notable advantage is its one-step design process, where structural parameters are recalibrated to meet performance objectives and displacement limits simultaneously using standard elastic spectra in combination with a modified behavior factor.
In this study, the influence of soil–structure interaction (SSI) on steel MRFs is examined within a PBSD framework. SSI is commonly modeled using four approaches, namely, impedance-function substructure, macro-elements at the foundation interface, beam-on-nonlinear Winkler foundations (BNWFs), and continuum finite element (FE) models that explicitly resolve the soil domain. These options offer different balances between fidelity and computational cost. Specifically, the BNWF approach [27] captures key nonlinear soil–foundation mechanisms such as gapping, sliding, and rocking through distributed springs with well-established empirical calibration. It provides sufficient accuracy for capturing SSI effects while maintaining computational efficiency suitable for large-scale parametric studies. The method integrates with PBSD workflows and enables consistent representation of period elongation, energy dissipation, and foundation flexibility.
This work extends PBSD by incorporating the BNWF model [27] to capture soil flexibility and nonlinear interaction effects and evaluates their impact on fundamental natural period, base shear, interstorey drift ratios, and behavior factors q across different site conditions. The BNWF approach [27] realistically represents the dynamic interaction between the foundation and the structure. This integration refines seismic performance predictions by accounting for the additional flexibility and damping provided by the foundation system. By merging the BNWF model with the PBSD framework, the study aims to enhance design reliability and improve cost-effectiveness. The approach builds upon established SSI modeling principles from Gazetas [28] and Gajan et al. [27] (among others), offering a robust tool for evaluating the seismic behavior of steel MRFs under more realistic conditions.
The suite of ground motions and the model database are analyzed with a machine learning layer that maps structural and dynamic features, including soil class and an SSI indicator, to key seismic responses [29]. This component provides out-of-sample predictions for base shear, the maximum IDR, and the behavior factor q across the four soil classes classified by EC8. Feature importance diagnostics then identify the inputs that govern q. They consistently highlight maximum beam ductility as the leading predictor, followed by maximum column ductility, soil class, the performance level SPi, and the fundamental period T. The relative influence of these variables changes when SSI is included, reflecting the role of foundation flexibility and site conditions. The novelty of this study lies in the PBSD-oriented quantification of SSI effects on fundamental period T, base shear, maximum IDR, and the behavior factor, including empirical relations for q as a function of the fundamental period T . The study is intentionally non-site-specific, aiming to provide general insights based on EC8 soil classes rather than responses tied to a single location.

2. Seismic Design and Performance Levels Considered

2.1. Seismic Design of Frames

The structural models considered in this work consist of 15 planar, regular steel MRFs with heights varying from 2 to 16 stories. Each frame features a consistent story height of 3.0 m, bay spacing of 5.0 m, and consists of three bays, as illustrated in Figure 1. The initial sizing of frame members was based on a seismic design process compliant with EC8 [1] and Eurocode 3 (EC3) [30] and was conducted using SAP2000 software (v24) [31]. A gravity load combination of G + 0.3Q, accounting for uniformly distributed dead (G) and live (Q) loads, was applied with a total value of 27.5 kN/m (Figure 1). Structural steel of grade S275 was used in all members. The design considered a peak ground acceleration (PGA) of 0.24 g, representative of soil type B, and adopted a behavior factor of q = 4, in accordance with medium ductility class (DCM) specifications. HEB profiles were used for the columns, and IPE profiles for the beams, with the column’s strong axis placed perpendicular to the frame plane. Table 1 summarizes the member properties, listing HEB columns on the left and IPE beams on the right, with the corresponding story levels given in parentheses.

2.2. Performance Levels Considered

Eurocode 8 [1] adopts a two-level performance approach for seismic design, distinguishing between the DL state under frequent earthquakes and the ultimate limit state (ULS) under rare, more severe events. To place these within the SEAOC [7] framework, the DL state broadly corresponds to SP2 (Operational), which permits minimal damage and almost immediate reoccupancy, while the ULS is more closely aligned with SP3 (LS), where structural integrity is maintained but significant damage and limited occupancy are expected. Damage is quantified using either the IDR to represent global structural response, or beam-end rotation (θ) to capture localized inelastic deformation (see Table 2). While effective for conventional design, this dual-objective framework does not fully capture the range of performance demands relevant to modern seismic resilience assessments. A robust PBSD framework typically incorporates at least four performance levels, enabling a more detailed and function-oriented assessment of structural behavior. This study builds upon this extended performance framework by investigating how SSI influences the structural response across these performance levels. While the damage and performance levels themselves remain fixed, SSI alters the seismic response of both the superstructure and the foundation, thereby affecting whether a given performance objective is satisfied.

3. Modeling of Steel MRFs for the Nonlinear Time-History Analyses

After completing the seismic design phase, which establishes the dimensions of the steel frame members, a more detailed numerical model of the steel MRFs is developed to facilitate nonlinear time-history analyses. This section outlines the modeling approach by distinguishing between the superstructure (i.e., the part of the frame above ground), the foundation system, and the SSI model. Finally, the section presents the selection criteria and key characteristics of the seismic ground motion records used in this study.

3.1. Modeling of the Superstructure

The seismic response of steel MRFs is investigated through nonlinear time-history analyses of 15 frame configurations (2- to 16-story) subjected to 100 ground motions, using the Ruaumoko 2D 2006 software [32]. The analyses incorporate large-displacement effects to capture p–Δ phenomena, with each floor modeled as a rigid diaphragm to simulate a concrete slab. Beams are modeled with the Giberson one-component formulation, using an elastic member with flexural rigidity EI in series with plastic hinge springs at both ends, while columns are modeled with a steel beam–column formulation that accounts for the interaction between moment capacity and axial force [32]. All structural members exhibit bilinear hysteretic behavior with a bilinear factor of 0.03, and both strength and stiffness degradation are incorporated as detailed in [33,34]. Furthermore, the critical influence of the panel zone is captured using a scissors model [10,33,35], which employs zero-length rotational springs to simulate the shear flexibility of the joints. The analyses are conducted with Rayleigh damping at a damping ratio of 3% and utilize S275 steel (fy = 275 MPa, fu = 430 MPa) to ensure realistic seismic performance predictions. For more detailed information on the modeling of steel MRFs, the reader may refer to [8,10,33].

3.2. Modeling of the SSI System

For the SSI model, a single isolated footing per column is implemented, with footing dimensions scaled according to the building height: a 1 m × 1 m footing is applied for steel MRFs up to 5 stories, a 1.5 m × 1.5 m footing for up to 10 stories, and a 2 m × 2 m footing for up to 16 stories. In this study, SSI is modeled using the beam on a nonlinear Winkler foundation (BNWF) approach, implemented via the Ruaumoko 2D [32] software, as it is shown in Figure 2. This study adopts the approach suggested by Gajan et al. [27], employing 25 springs along the footing length (with approximately 4% spacing) to ensure numerical stability and an accurate representation of the BNWF model’s nonlinear behavior.
The elastic stiffness properties of the vertical foundational springs (Kx and Kz) and the corresponding damping coefficients of the vertical dashpots (Cx and Cz) are determined based on the formulations of Gazetas [28]. This study uses a two-region approach for distributing the vertical stiffness of the footing springs. In accordance with ATC 40 [36] guidelines, the footing is divided into a middle region, which represents the baseline vertical stiffness of an infinitely long strip footing, and an end region where Lend = B/6 (B is the footing width). In the end region, the springs are assigned an enhanced stiffness to capture the coupling between vertical and rotational behavior. The end region stiffness is increased by a factor of five compared to the baseline middle region stiffness, following Gajan et al. [27]. This approach is also followed by Harden and Hutchinson [37] and enables a more accurate representation of the nonlinear soil structure interaction, especially of shallow rocking-dominated foundations. The tension capacity parameter (TP), defined as the ratio of tension capacity to the ultimate bearing capacity, is set at 0.05. This value represents the mean of the range suggested by Gajan et al. [27] and Boulanger et al. [38], where TP typically lies between 0 and 0.1. The nonlinear backbone curve for the vertical soil springs is adopted following the approaches of Gajan et al. [27] and Raychowdhury and Hutchinson [39]. In addition, the shape parameters Cr, c, and n that govern the curvature and the transition from elastic to plastic response of the soil springs are implemented as recommended by Raychowdhury and Hutchinson [39].
The elastic branch of the backbone is given by
v ( s ) = k i n s for           s s 0
while the inelastic branch of the backbone is expressed by
v s = v ult 1 1 C r c   s 50 c   s 50 + s s 0 n for     s > s 0
where v(s) represents the load at a given displacement S, kin is the initial elastic stiffness defining the slope of the linear elastic response, S denotes the applied displacement, S0 is the yield displacement at which the response transitions from elastic to nonlinear behavior, and v0 is the yield load, defined by v0 = kin·S0 and equivalently as Cr·vult, with Cr being the yield ratio and vult the ultimate load capacity; in the nonlinear branch, c is a shape parameter that controls the tangent stiffness at the beginning of yielding, S50 is the displacement at which 50% of the ultimate load is mobilized, and n is the exponent that governs the curvature or softening rate of the post-yield response.
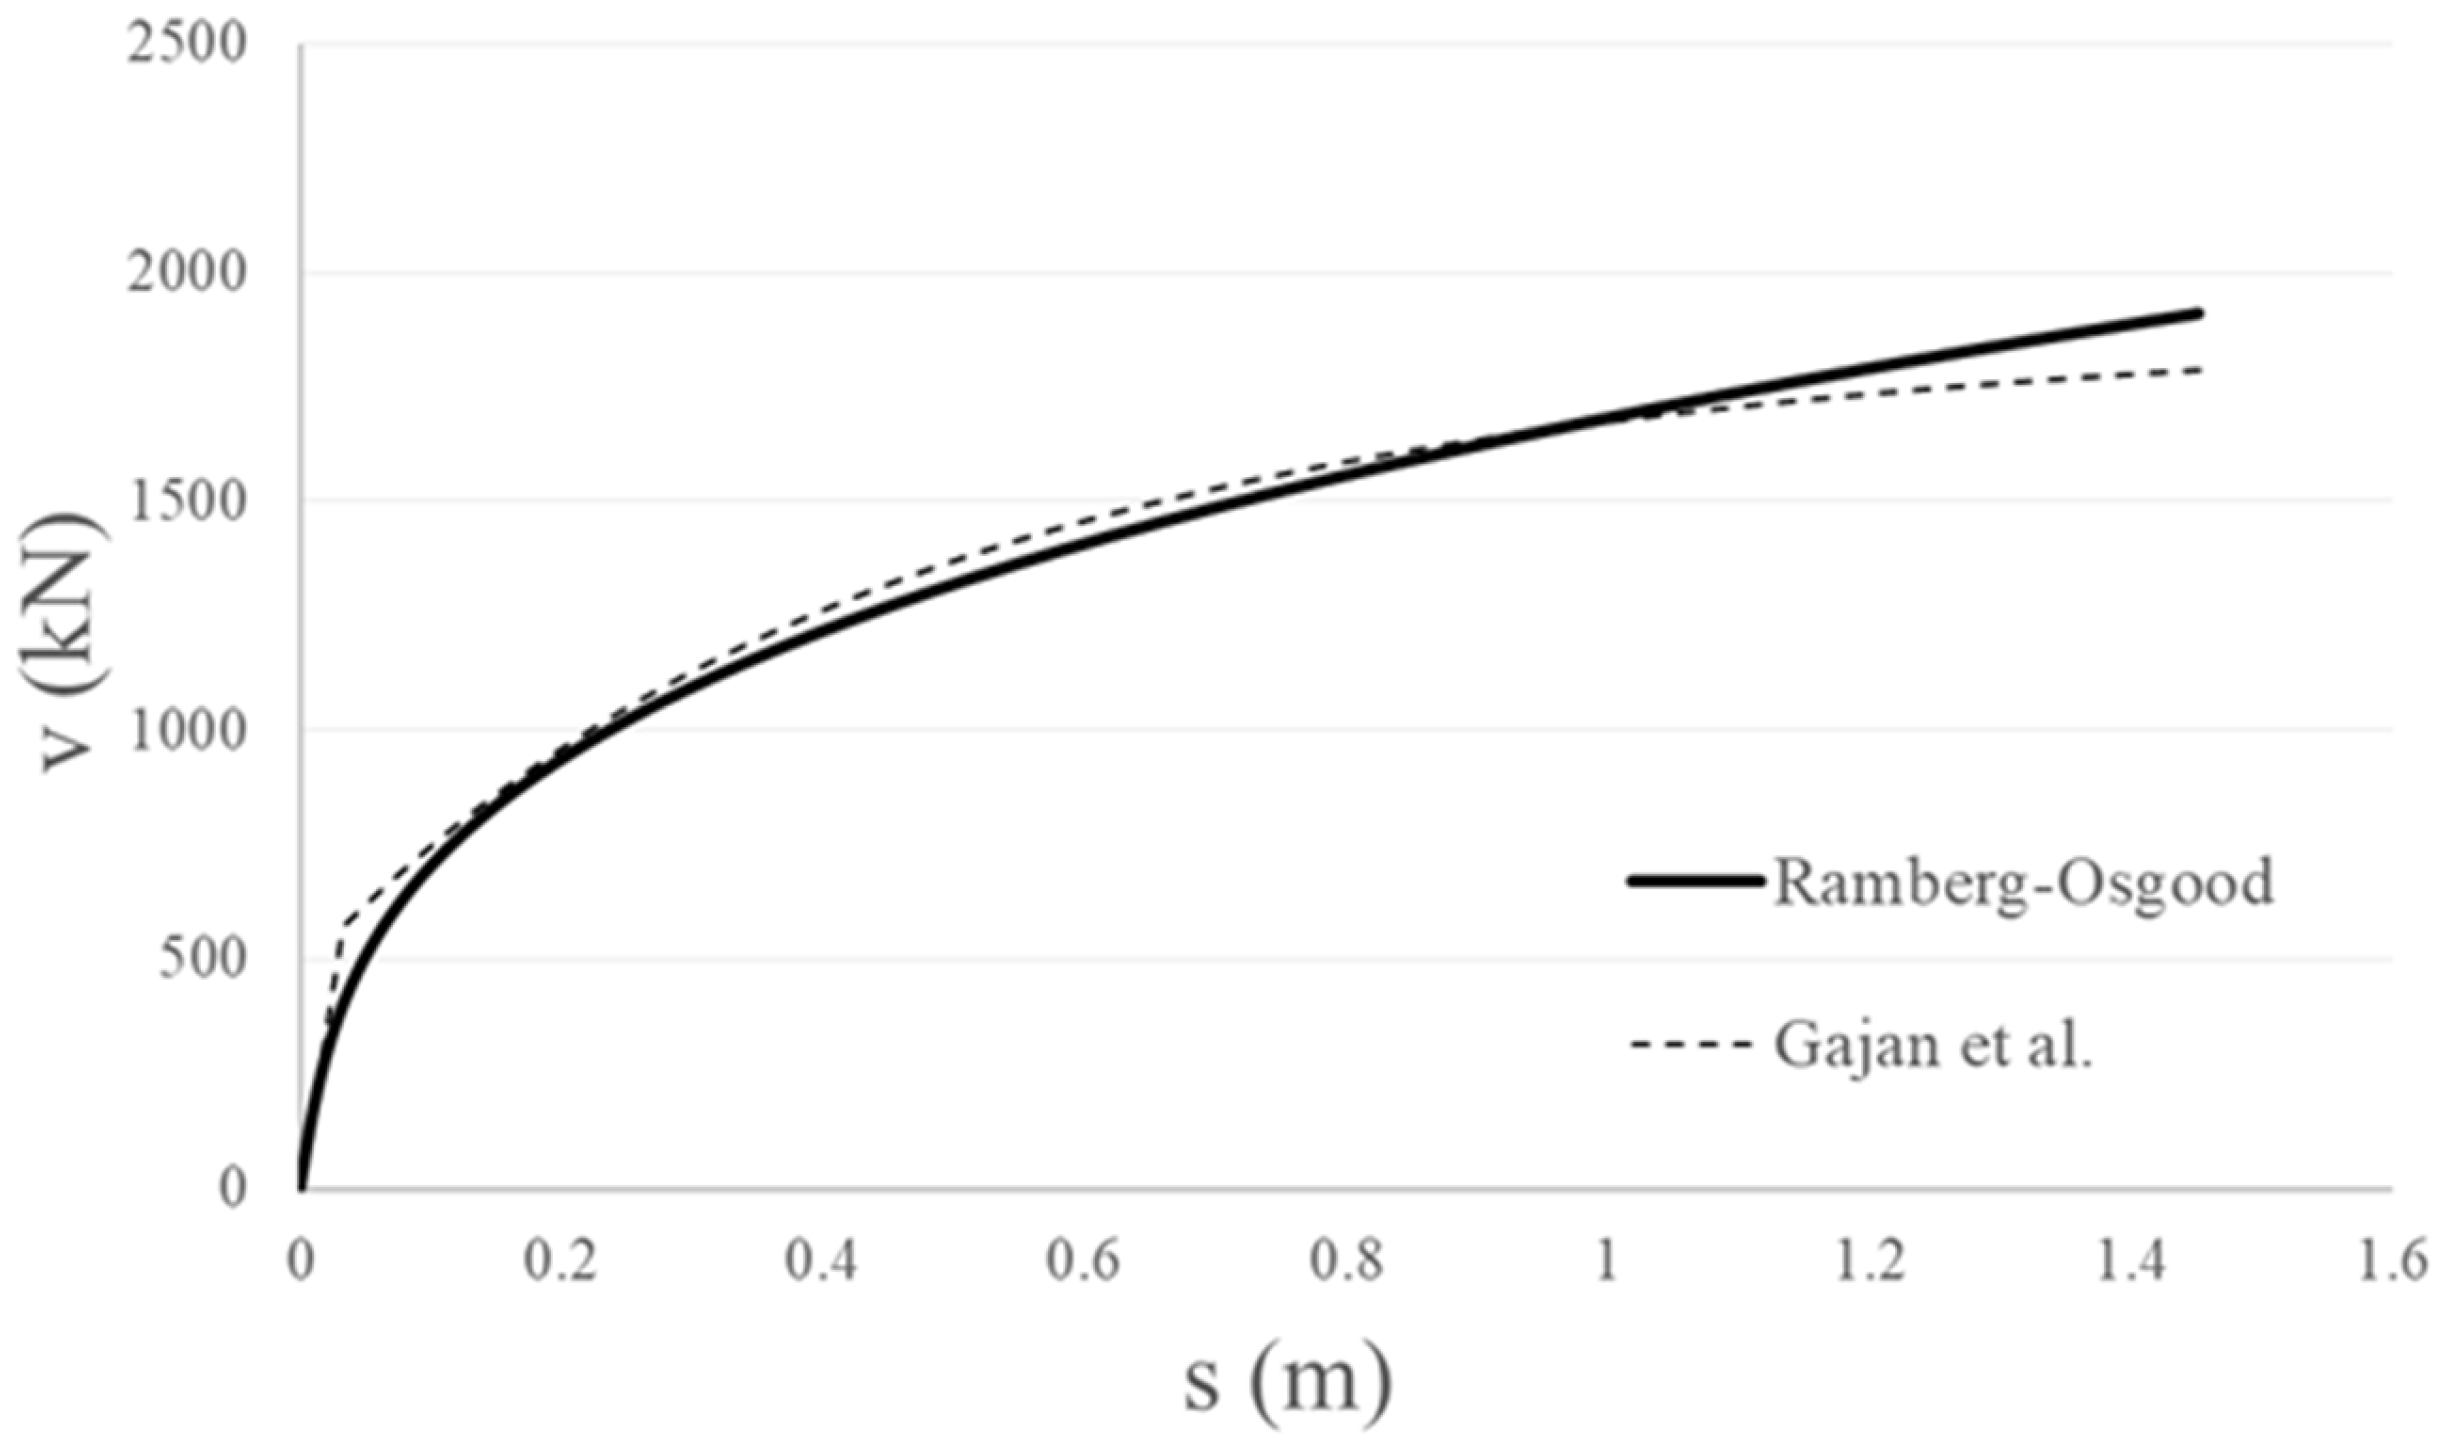
Specifically, the shape parameters were set to Cr equal to 0.3, c equal to 12.3, and n equal to 5.5. A Cr value of 0.3 indicates that plastic yielding begins at 30% of the ultimate load capacity, while a c value of 12.3 represents a relatively high tangent stiffness at the onset of yielding. An n value of 5.5 defines a moderately sharp transition into the post-yield softening regime. These parameter values are representative of soft soils, like sand, exhibiting intermediate ductility and moderate nonlinearity under cyclic loading. The backbone was calibrated using the Ramberg–Osgood formulation as implemented in the Ruaumoko 2D [32] software. The backbone equation, which characterizes the soil’s nonlinear load–displacement behavior according to the Ramberg–Osgood formulation, is given by
s = v k i n 1 + v v y r 1
where s represents the total displacement, v is the applied load, and kin is the initial elastic stiffness defining the linear response. The yield load, vy, marks the beginning of nonlinearity. The exponent r governs the post-yield curvature, determining the rate at which stiffness degrades beyond the yield point. As shown in Figure 3, the optimal calibration is obtained by applying an r factor of 3.1.
In shallow foundations, the horizontal bearing capacity of the soil springs is primarily derived from the frictional resistance mobilized at the soil–footing interface, with any residual cohesion contributing as well. This capacity is often estimated using the equation
V tot = A   c + σ t a n φ
where A is the effective area over which lateral resistance is mobilized, c represents the soil’s cohesion, σ is the effective normal stress (stemming from the weight of the overlying soil and any additional superimposed loads), and φ is the soil’s internal friction angle. The total lateral force calculated by this equation is then distributed among the horizontal springs so that each spring is assigned its corresponding share of the overall resistance. Finally, an upper spring is considered to simulate the gap behavior at the soil–footing interface. This gap element is designed to exhibit extremely high (almost infinite) stiffness in compression to prevent further penetration of the foundation into the soil, while providing negligible, near-zero stiffness in tension to allow free uplift (see Figure 2).

3.3. Seismic Records Considered

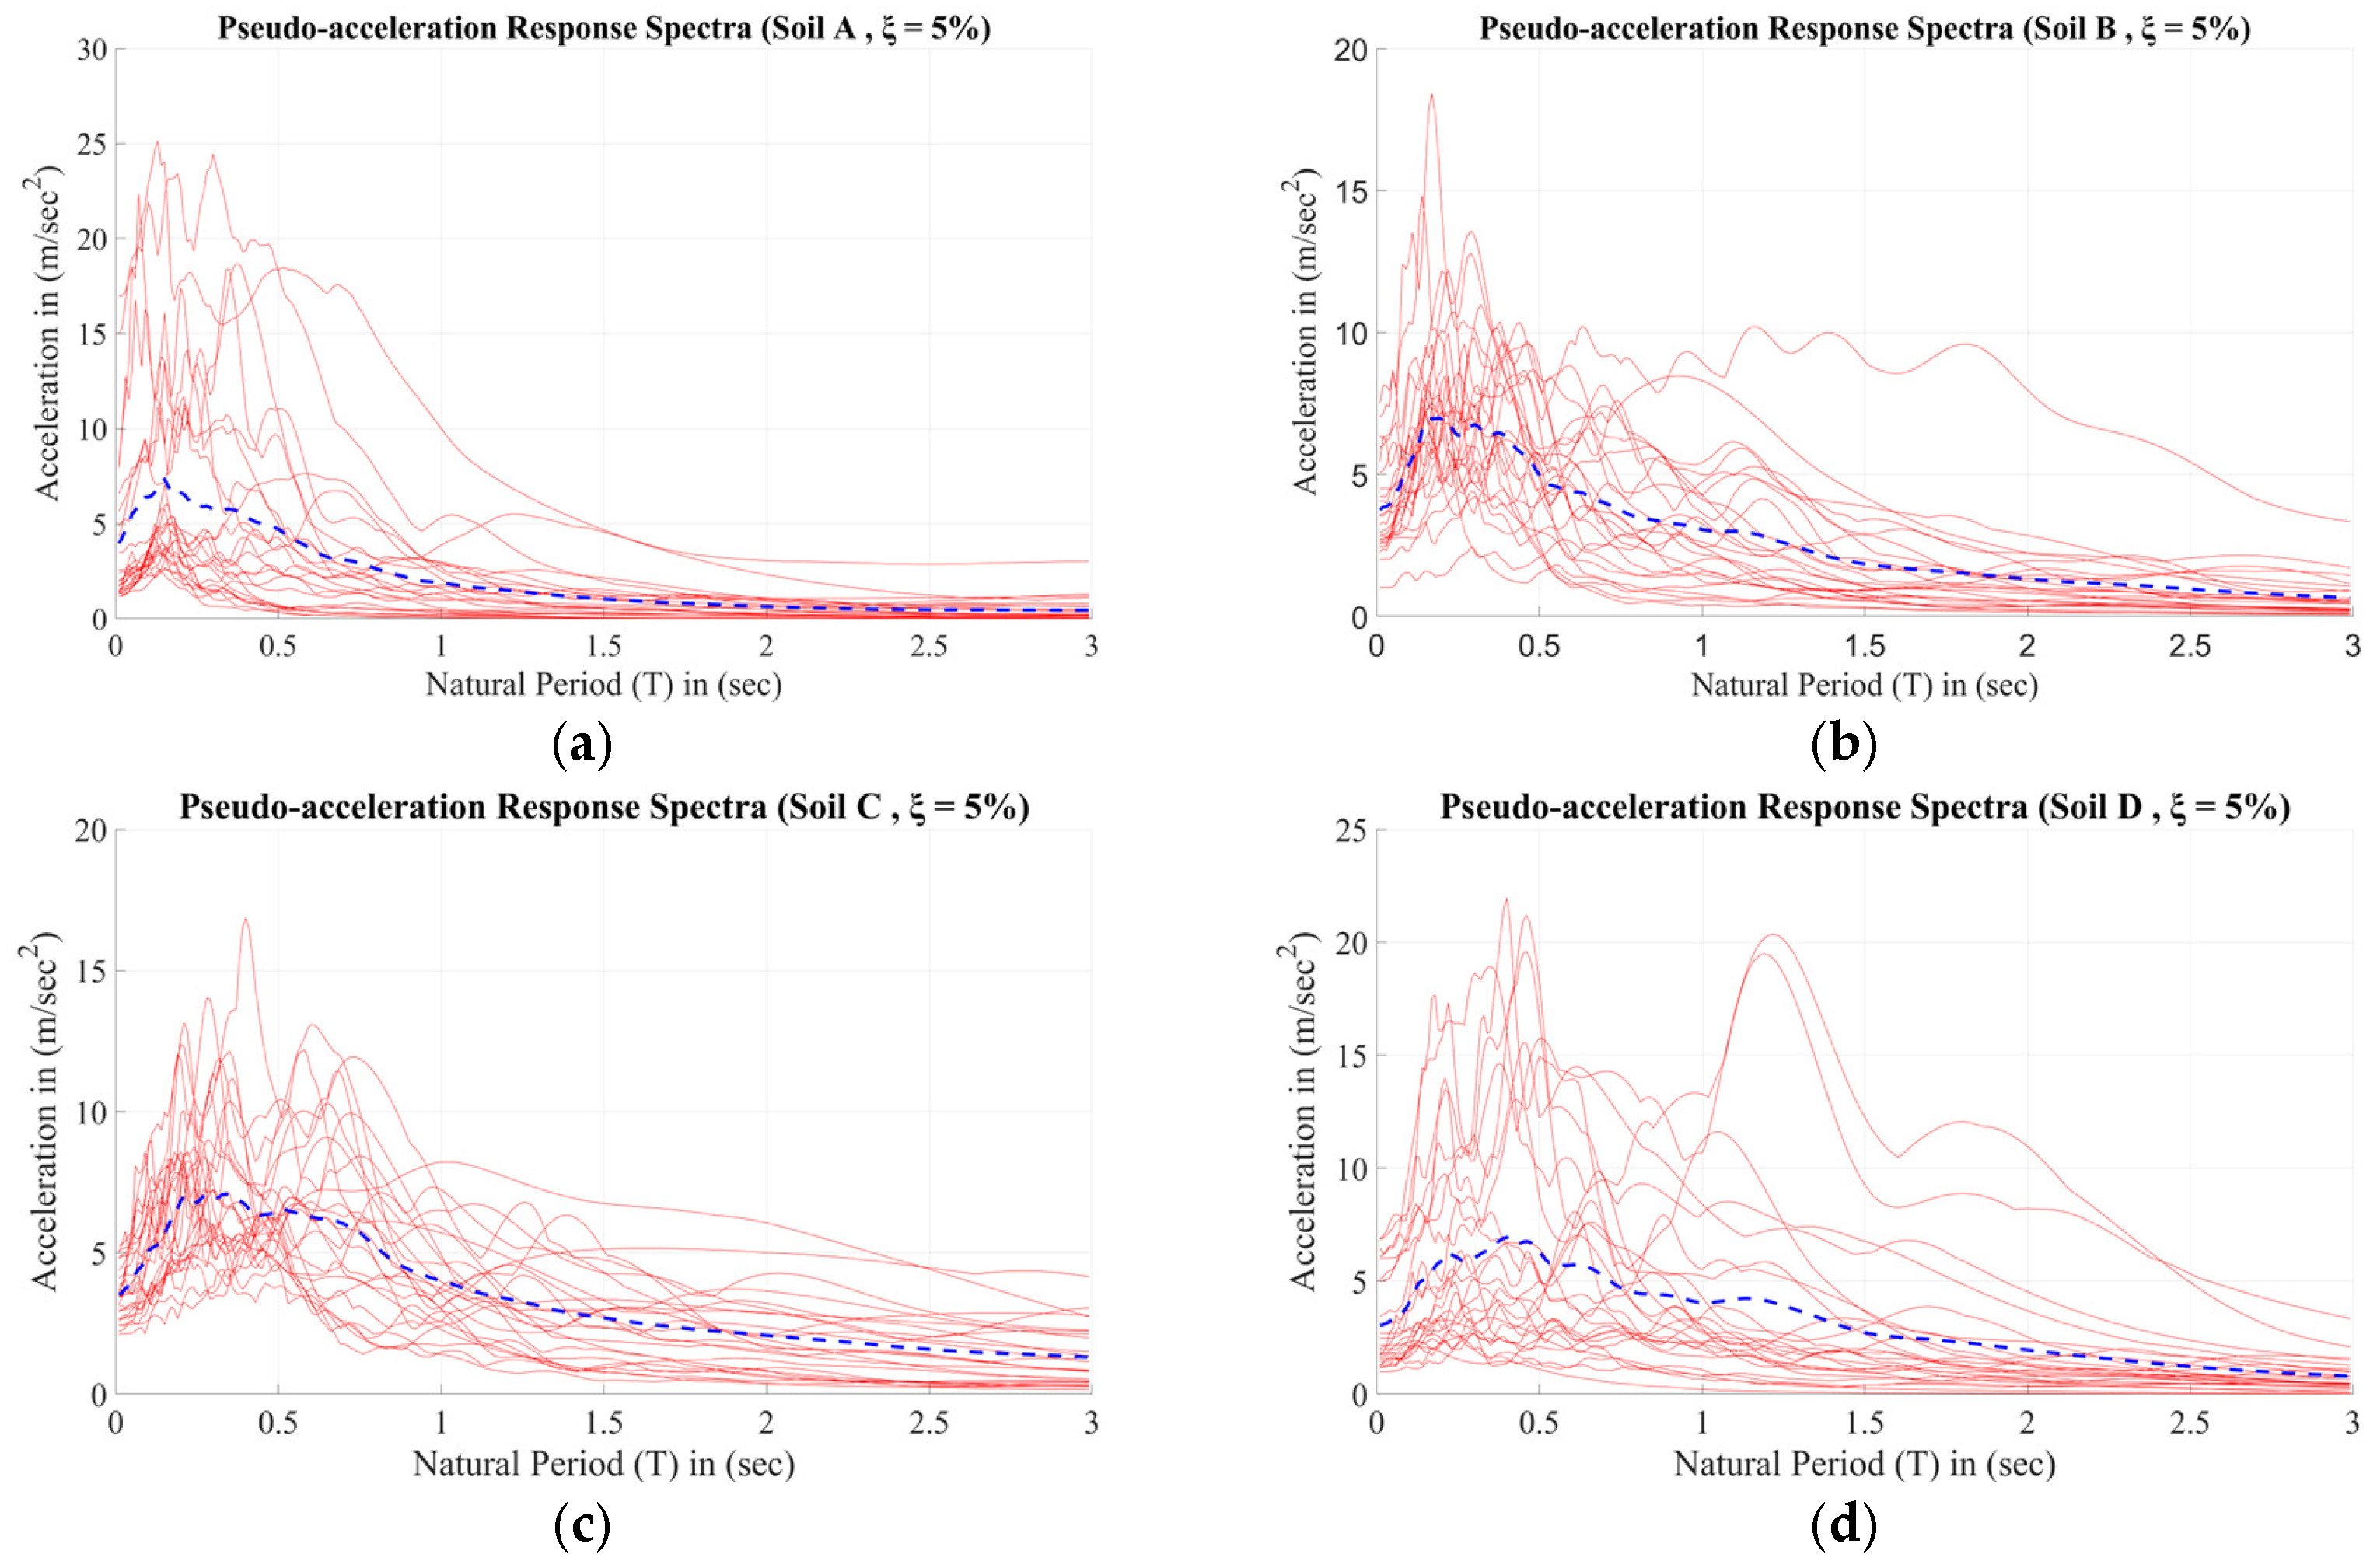
A total of 100 far-field ground motions are utilized for the seismic analysis of the steel MRFs examined in this study. These records, sourced from the PEER [40] and COSMOS [41] databases, are classified into four groups corresponding to soil types A, B, C, and D as defined by EC8 [1]. Table 3, Table 4, Table 5 and Table 6 provide details of each record, including the date, record name, component direction, station, and PGA. Selection was based on two main criteria: (i) moment magnitudes between 5.2 and 7.7 with effective durations from 7.0 to 45.0 s, and (ii) minimal scaling required to push the frames through all performance levels [7]. For completeness, the pseudo-acceleration spectra of the selected motions (assuming 5% damping) are presented in Figure 4.

4. Results of the Analyses

This section presents the results of nonlinear time-history analyses conducted on the fifteen steel MRFs of Table 1, each subjected to 100 far-field ground motions categorized according to EC8 soil types. Particular emphasis is placed on Soil B, the reference condition in many European designs, and Soil D, whose low stiffness makes it most susceptible to SSI effects. The response of fixed-base models is compared against models incorporating SSI to assess how foundation flexibility influences key seismic parameters, including the fundamental period, base shear, peak IDR, and behavior factor across the 2- to 16-story range.

4.1. Effect of SSI on the Fundamental Period

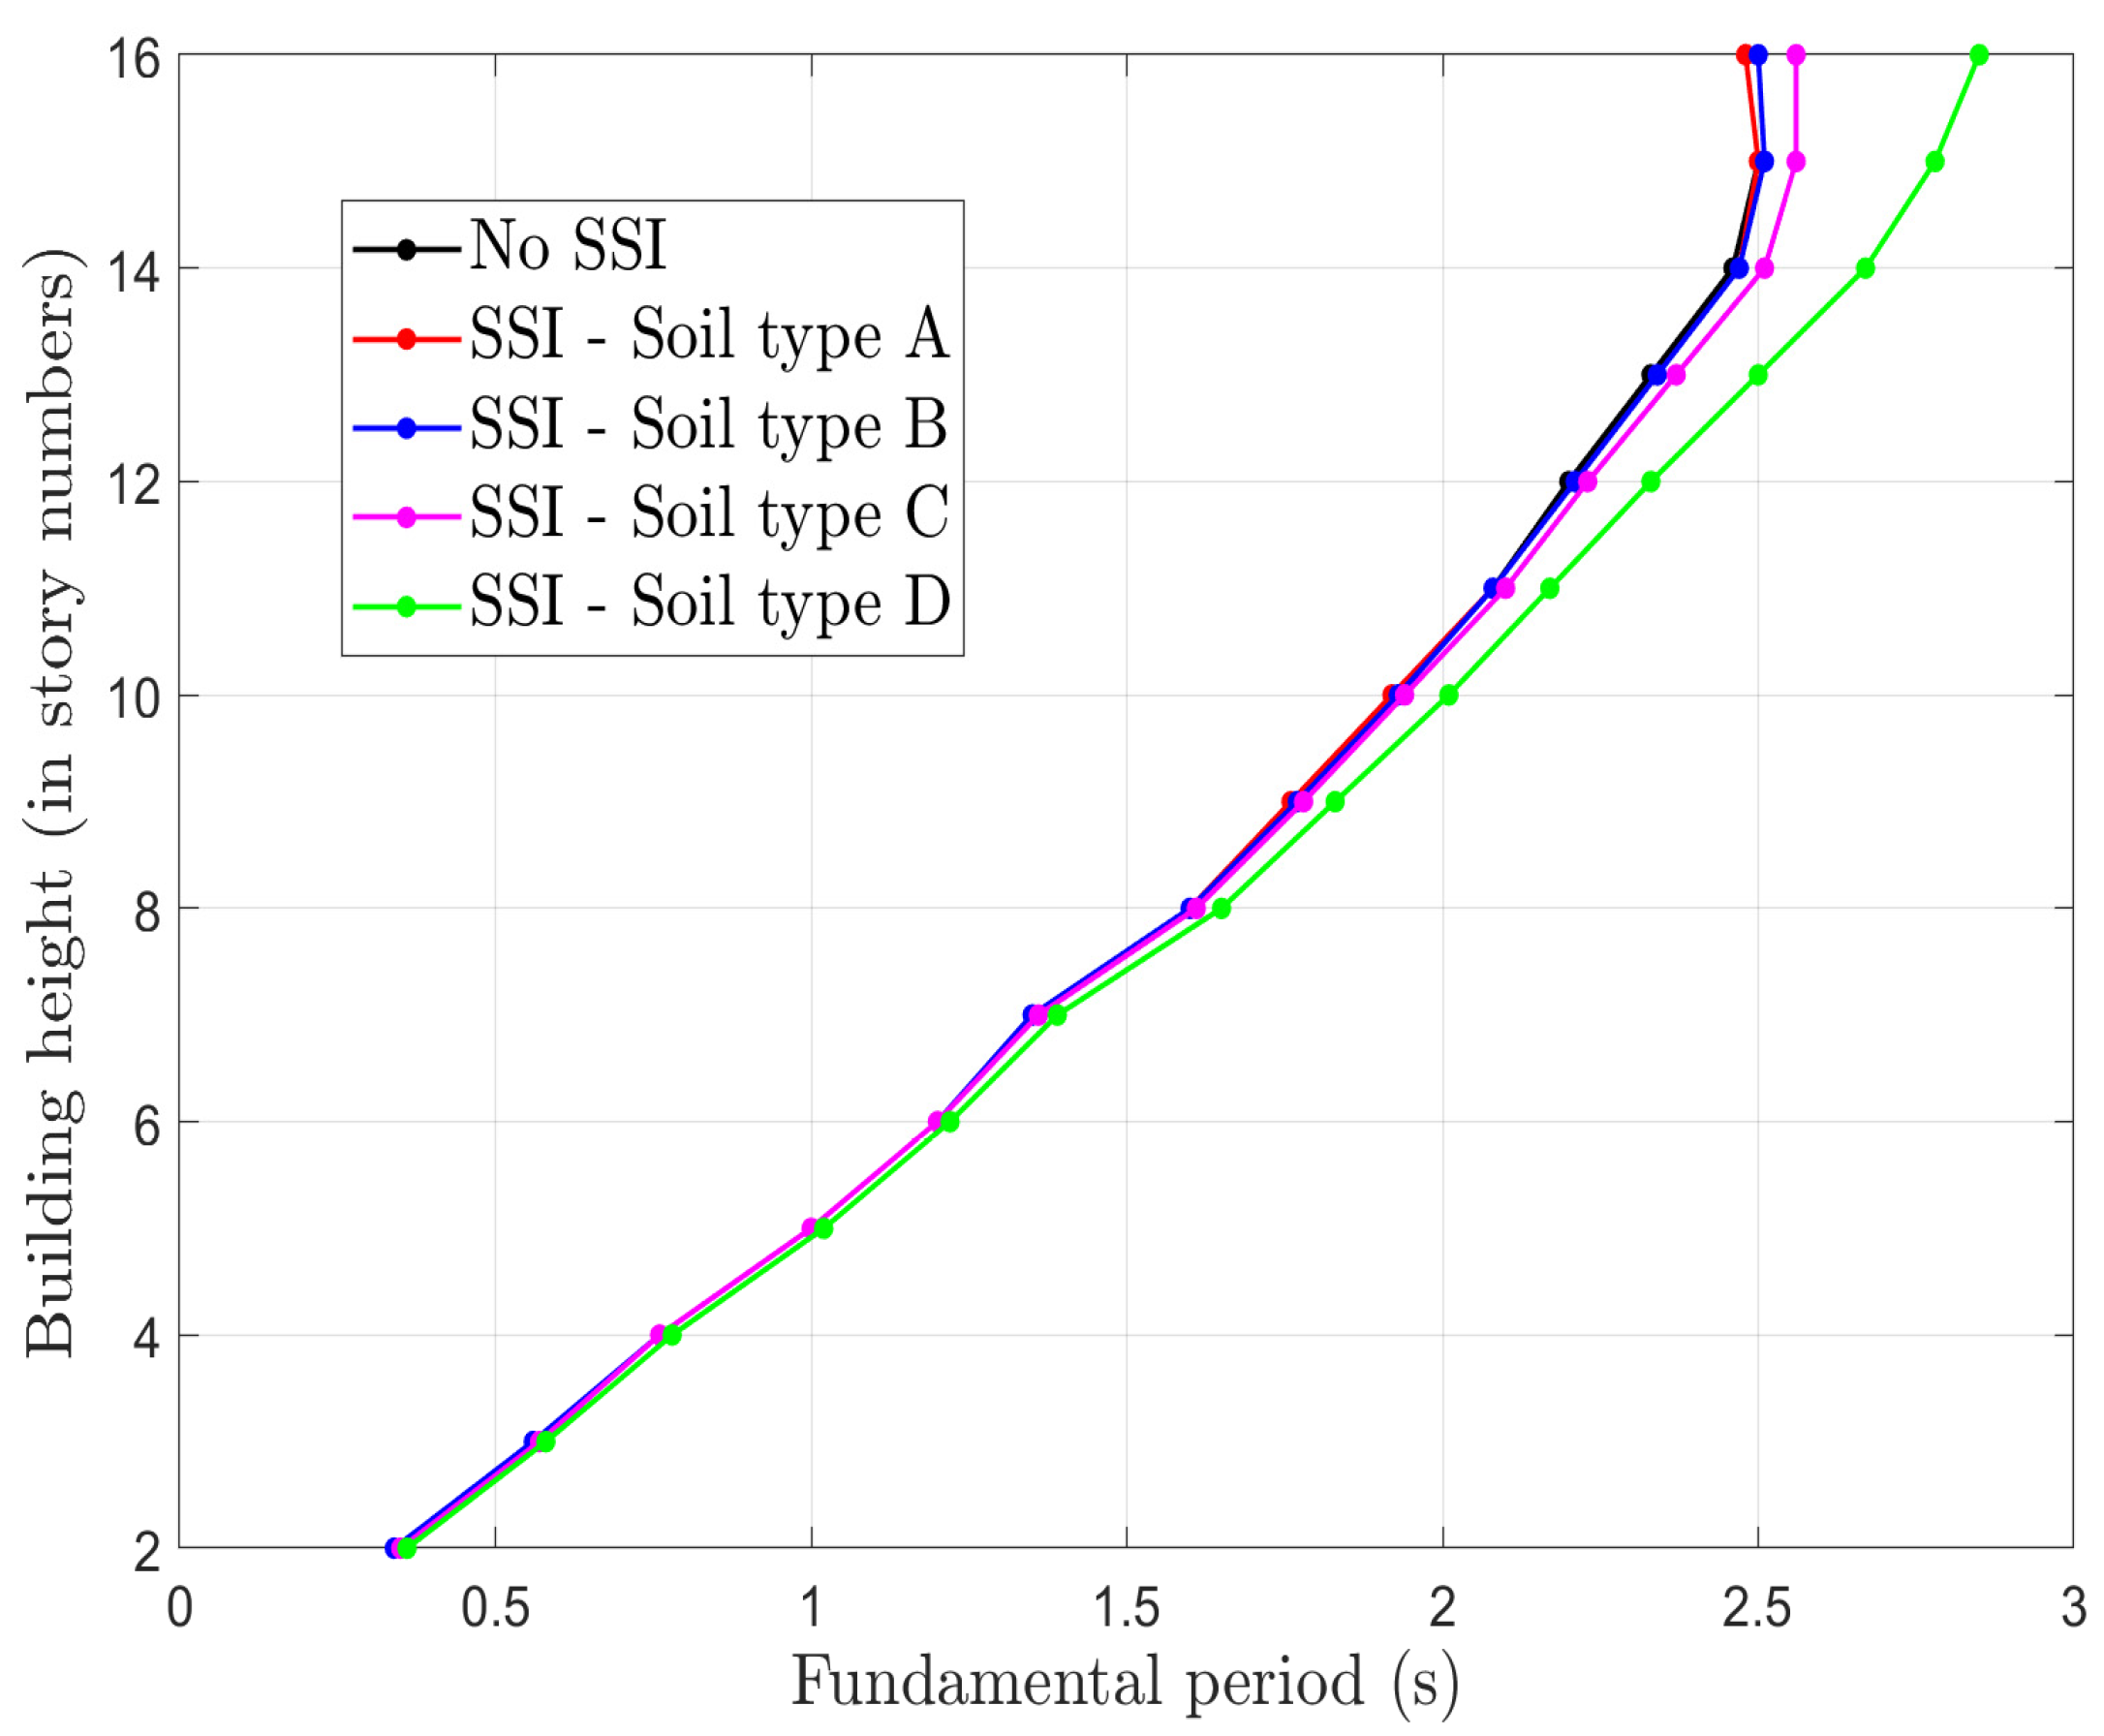
Figure 5 shows how the fundamental period varies with building height for the fixed-base steel MRFs and for those modeled to take into account the SSI on the four EC8 soil types. All trends are almost linear, confirming the consistent geometric scaling of the two- to sixteen-story frames however, the progressive horizontal shift of the SSI curves highlights the role of foundation flexibility. On very stiff ground (Soil A), the SSI response is nearly identical to that of the fixed-base model, with the corresponding curve showing minimal deviation. As such, results for Soil A are excluded from further discussion due to their negligible influence on the dynamic response. In contrast, Soil B, which serves as the standard reference in many design applications, shows only a slight increase in the fundamental period compared to the fixed base model. The difference becomes more pronounced as soil stiffness decreases. Soil C results in a maximum elongation of approximately 3.5 percent, while Soil D produces the most significant increase, reaching up to 15 percent at 16 stories. For buildings up to about eight stories, the influence of soil structure interaction remains limited, as all curves are closely aligned. However, in taller frames, neglecting soil flexibility, especially on soft soils like Soil D, may lead to a notable underestimation of the fundamental period, potentially placing the structural response in a lower spectral acceleration region and resulting in unconservative seismic force estimates.

4.2. Influence of SSI on Base Shear

The base shear values corresponding to buildings of varying heights and story numbers (from 2 to 16) are examined for both Soil B and Soil D across the three performance levels, i.e., DL, LS, and CP. The results, shown in Figure 6, represent the mean base shear values computed from the set of 25 ground motion records corresponding to each soil type, in accordance with EC8 classifications. Incorporating SSI generally leads to a reduction in base shear, with this effect being more pronounced on softer soils. For Soil D, the added flexibility of the soil results in a noticeable decrease in base shear levels, particularly in taller frames. In contrast, for Soil B, which represents stiffer ground conditions, the difference between fixed-base and SSI-inclusive models remains small, indicating that SSI has limited influence on base shear under such conditions. Furthermore, the mean base shear values associated with Soil B are consistently higher than those for Soil D, with the largest discrepancy observed under the CP performance level. These findings highlight the importance of considering SSI in seismic design, especially for structures founded on soft soils.

4.3. Impact of Soil Conditions on Maximum IDR Profiles

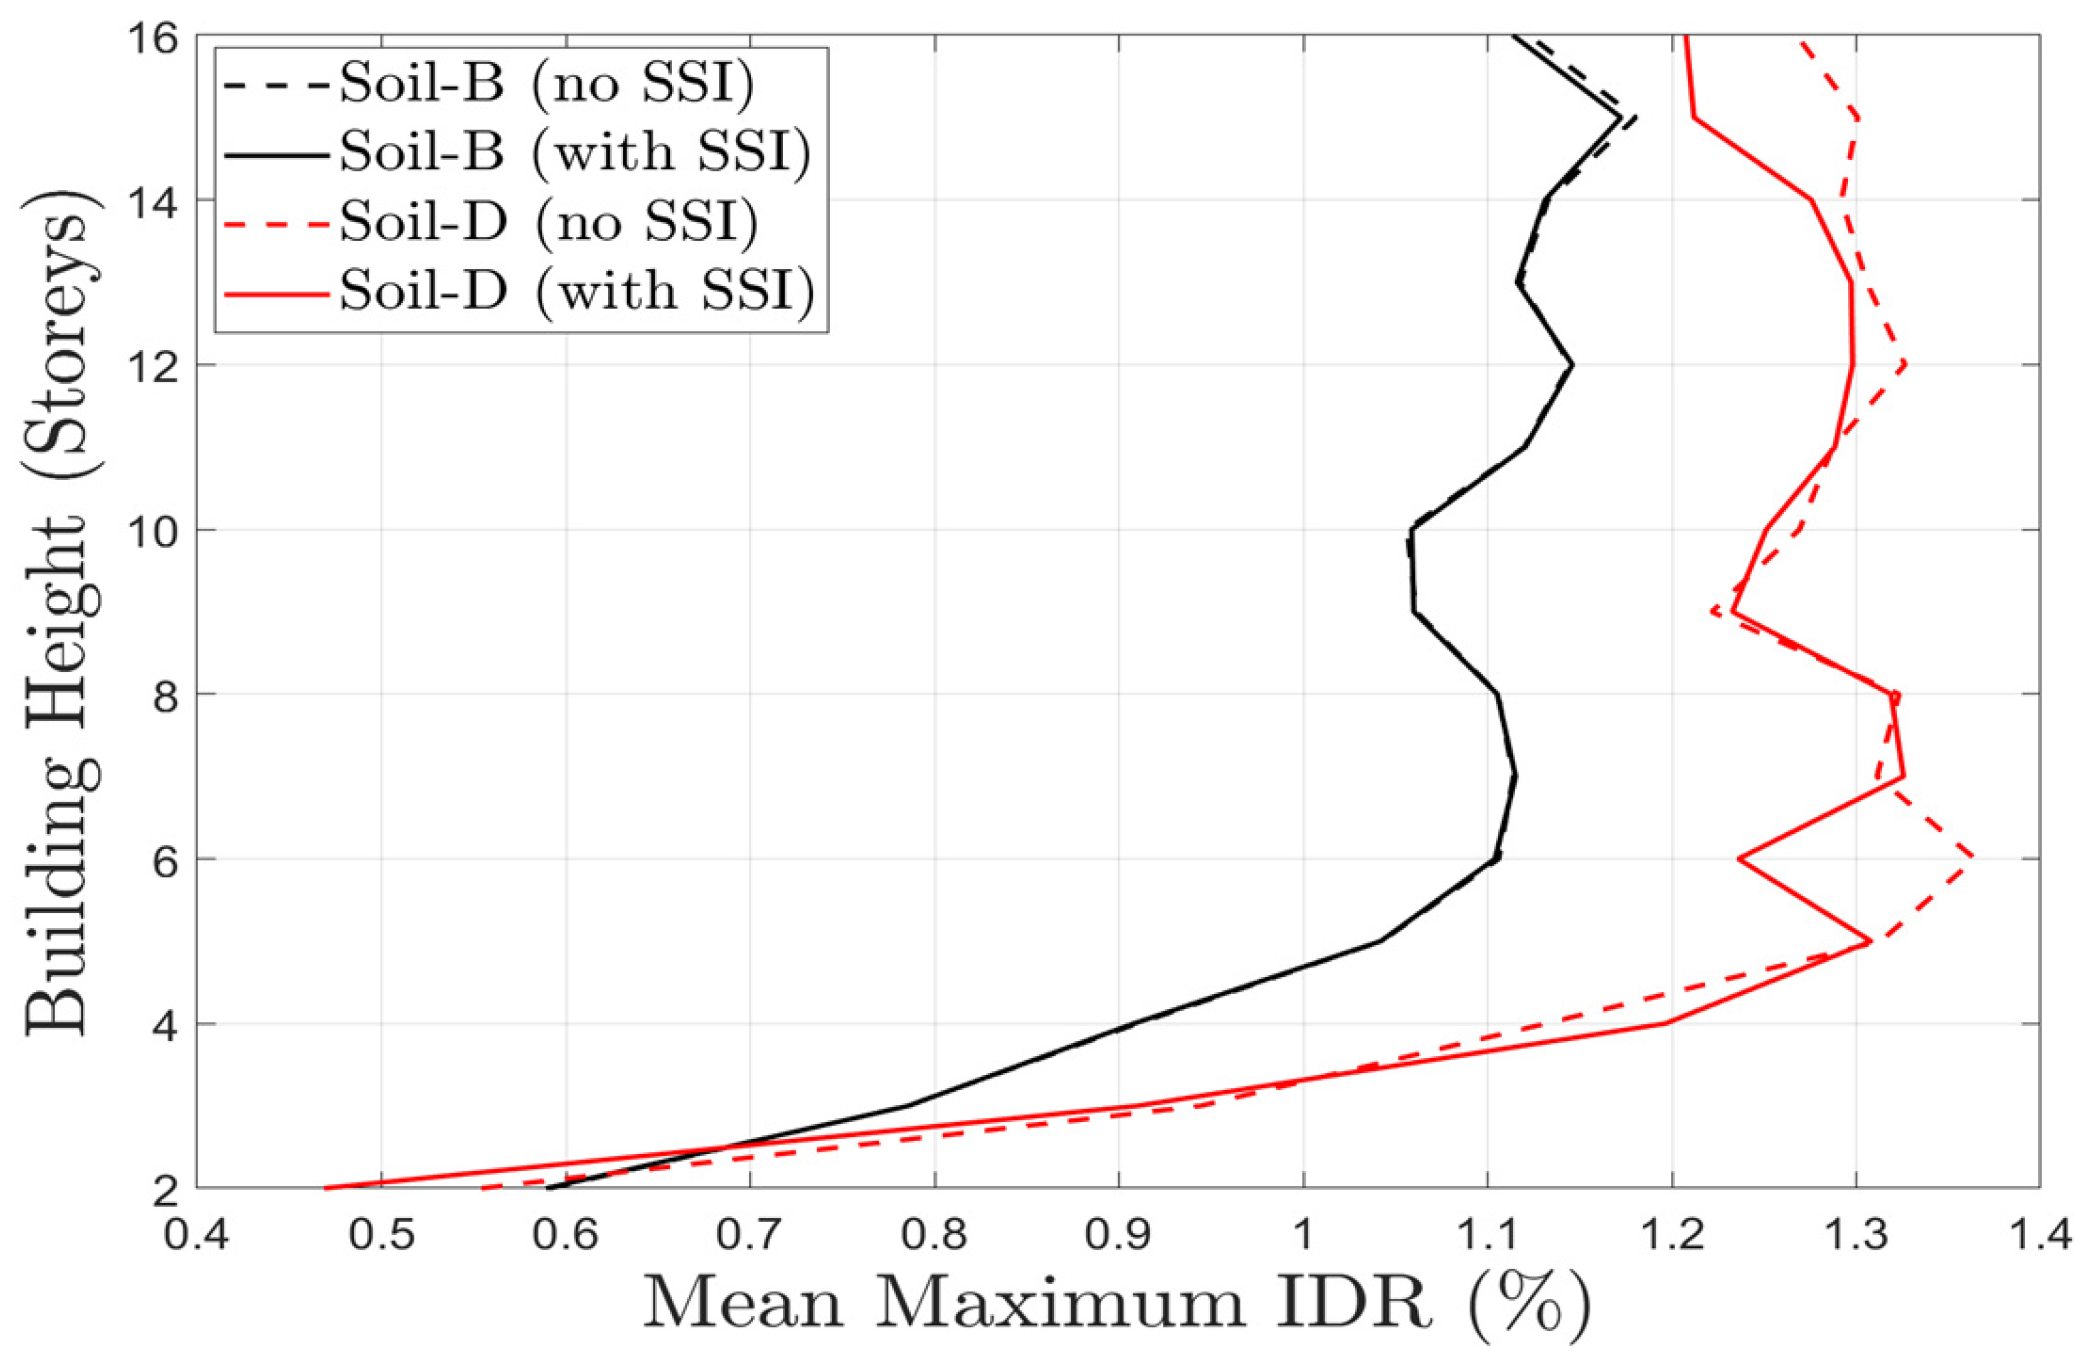
The average profiles of the maximum IDRs for the fifteen frames, computed using 25 ground motions for each soil class, reveal significant differences in structural response between stiff and soft soil conditions, as illustrated in Figure 7. For Soil B, representing a relatively rigid foundation material, the fixed-base and SSI curves align closely across all stories, suggesting that the influence of soil flexibility on drift demand is negligible in such cases. By contrast, Soil D shows a consistent reduction in IDRs when SSI is included, particularly in mid- to high-rise frames. The reduction becomes more evident for higher than eighth-story frames and reaches its maximum for the sixteen-story frames, where maximum IDR demands are significantly lower compared to the fixed-base counterpart. This behavior is attributed to the increased flexibility and damping introduced by the deformable soil, which modifies the dynamic characteristics of the system and reduces lateral deformation demands. Consequently, neglecting SSI on soft soils may result in overly conservative drift estimates and unnecessary design conservatism, while for stiffer soils, the fixed-base assumption remains a reasonable approximation.
Since the input ground motions were applied without scaling, the plotted curves reflect the unadjusted response of each frame rather than target drift values. As such, this figure illustrates general drift trends across soil types and building heights, without indicating compliance with specific damage or performance levels.

4.4. Influence of Soil Conditions on the Seismic Behavior Factor

The seismic reduction factor R, also called the behavior factor q, expresses how elastic force demands may be reduced for design by accounting for inelastic deformation capacity and overstrength. Although EC8 [1] includes baseline q values, a more informative, record-consistent estimate is obtained by scaling each ground motion to the scale factor SFy that triggers the first yield of the structure and then to SFPL at which a specified performance level is reached (Table 2). In line with incremental dynamic analysis (IDA) principles, the behavior factor is defined as
q = S F P L S F y
This formulation quantifies how much additional ground motion intensity the structure can sustain beyond first yield while preserving the original frequency content and duration of the records. To limit distortion of the input motions, the scale factor is restricted to a maximum value of about 10 [42]. The resulting q values are specific to the record set and the structural model and align with the interpretation of the reduction factor as a combined measure of ductility and overstrength [43].
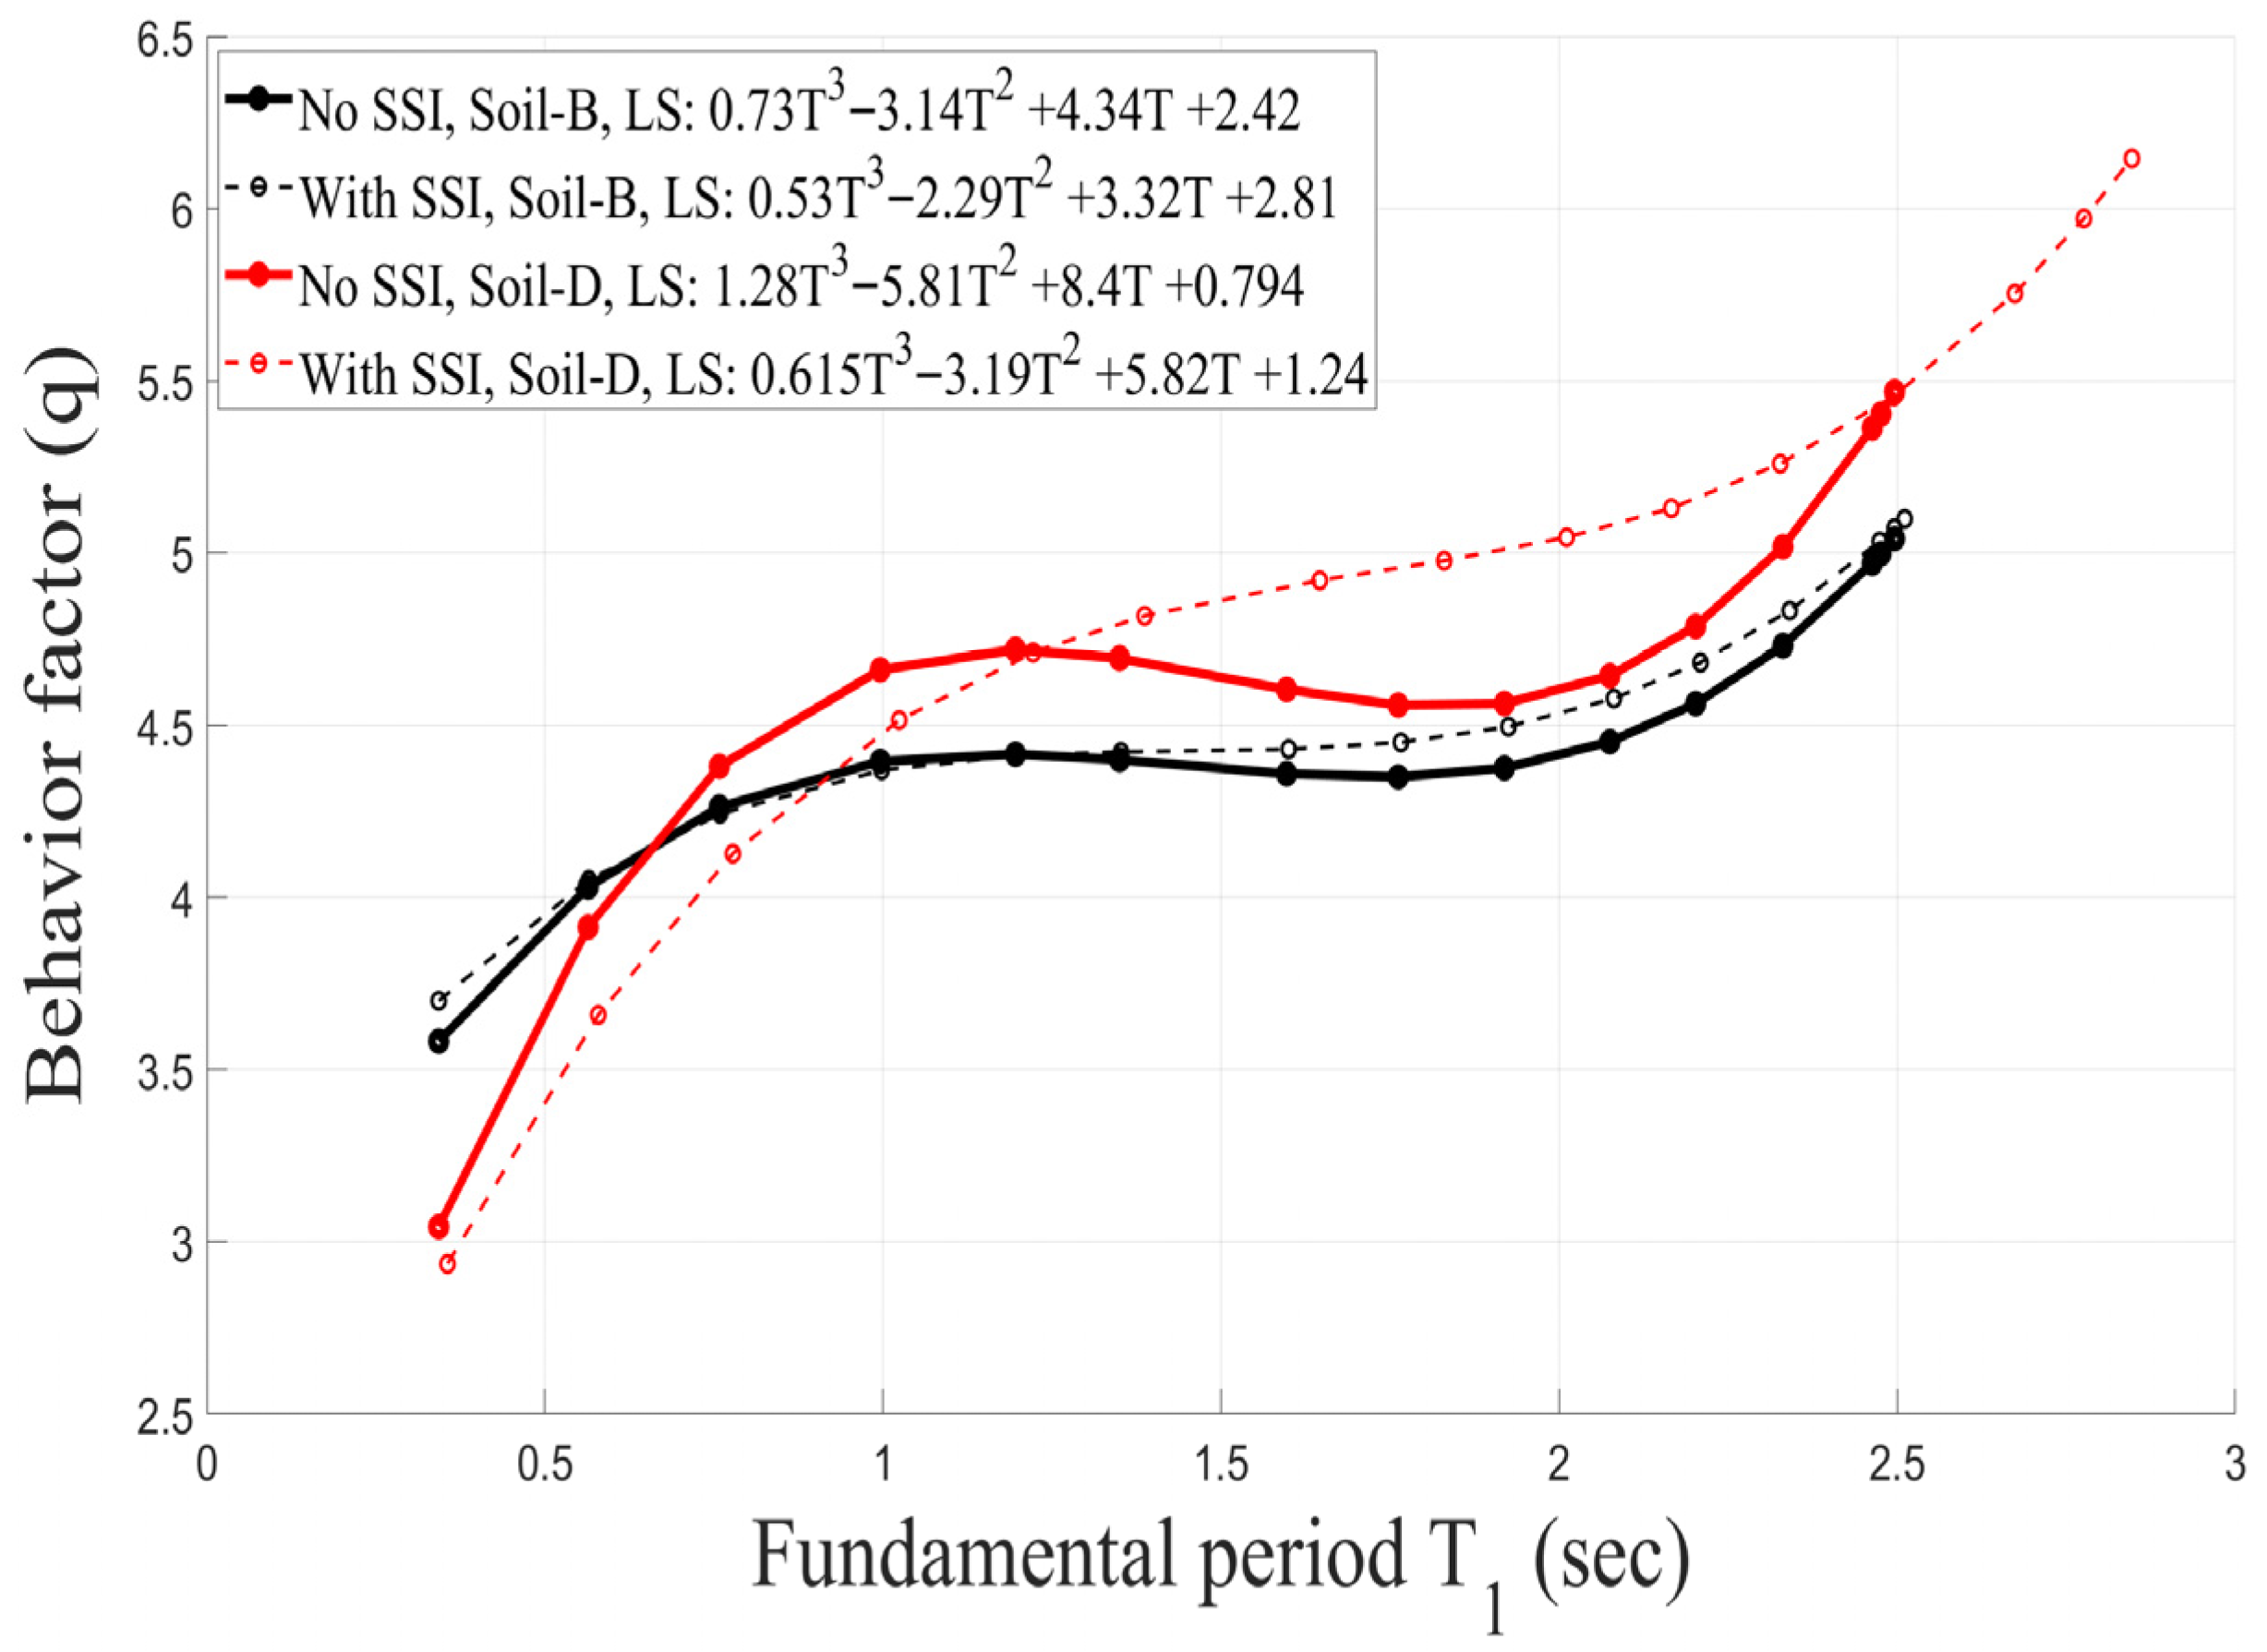
The plotted results (Figure 8) show the mean behavior factor q for the analyzed steel MRFs as a function of the fundamental period T, comparing fixed-base and SSI-inclusive models for both stiff (Soil B, black curves) and soft (Soil D, red curves) ground conditions. For stiff soils, the inclusion of SSI has a negligible influence on q, with the curves for Soil B nearly overlapping across the examined period range. In contrast, on soft soils, incorporating SSI leads to consistently higher q-values, particularly for frames with fundamental periods exceeding that of a 6-story configuration (≈1.2 s). This increase is most pronounced at moderate to long periods, reflecting the combined effects of period elongation and altered inelastic responses due to foundation flexibility. At shorter periods (below about 1.2 s), the difference between fixed-base and SSI-inclusive models remains relatively small, suggesting that SSI effects are less significant for low-rise systems. Overall, the findings indicate that disregarding SSI on soft soils can lead to an underestimation of the system’s true force-reduction capacity, while for stiff soils the fixed-base assumption remains an accurate and efficient representation.

4.5. Machine Learning Methodology and Validation

In this section, a machine learning model was trained utilizing a dataset derived from nonlinear time history analyses of structural frames to predict key seismic performance indicators of the frames, specifically the maximum IDR, base shear, and the behavior factor q. To accomplish this, an Extreme Gradient Boosting (XGBoost) model [44] was utilized, designed to address the task as a multi-output regression problem. The XGBoost framework was set up as an ensemble of decision trees that were trained sequentially to minimize the residuals of the ensemble constructed, while incorporating regularization terms to control the model complexity. To this end, a separate XGBRegressor was trained for each output variable, and the ensemble of models was managed under a multi-output regression framework. The model hyperparameters were set to ensure a balance between predictive accuracy and generalization capacity. Each estimator was constructed with 1000 boosted regression trees, a maximum depth of 6 nodes per tree, and a learning rate of 0.05. To make the model more stable and less likely to overfit, both row subsampling and column subsampling ratios were set to 0.8. The objective function was defined as the squared error loss, and built-in L1 and L2 regularization were applied to further control complexity. Early stopping with a patience of 50 rounds was adopted based on validation error to prevent overtraining of the ensemble.
Table 7 shows a summary of the model’s input and output variables. The inputs are structural features, dynamic responses, categorical variables, and engineered variables that capture normalized effects and interactions between parameters. The outputs are the predicted maximum IDR, base shear, and behavior factor q. The dataset was divided into three parts: training (70%), validation (15%), and testing (15%). A fixed random seed (42) was used to certify that the results could be reproduced. A flow diagram illustrating the implementation steps of the XGBoost model is presented in Figure 9.
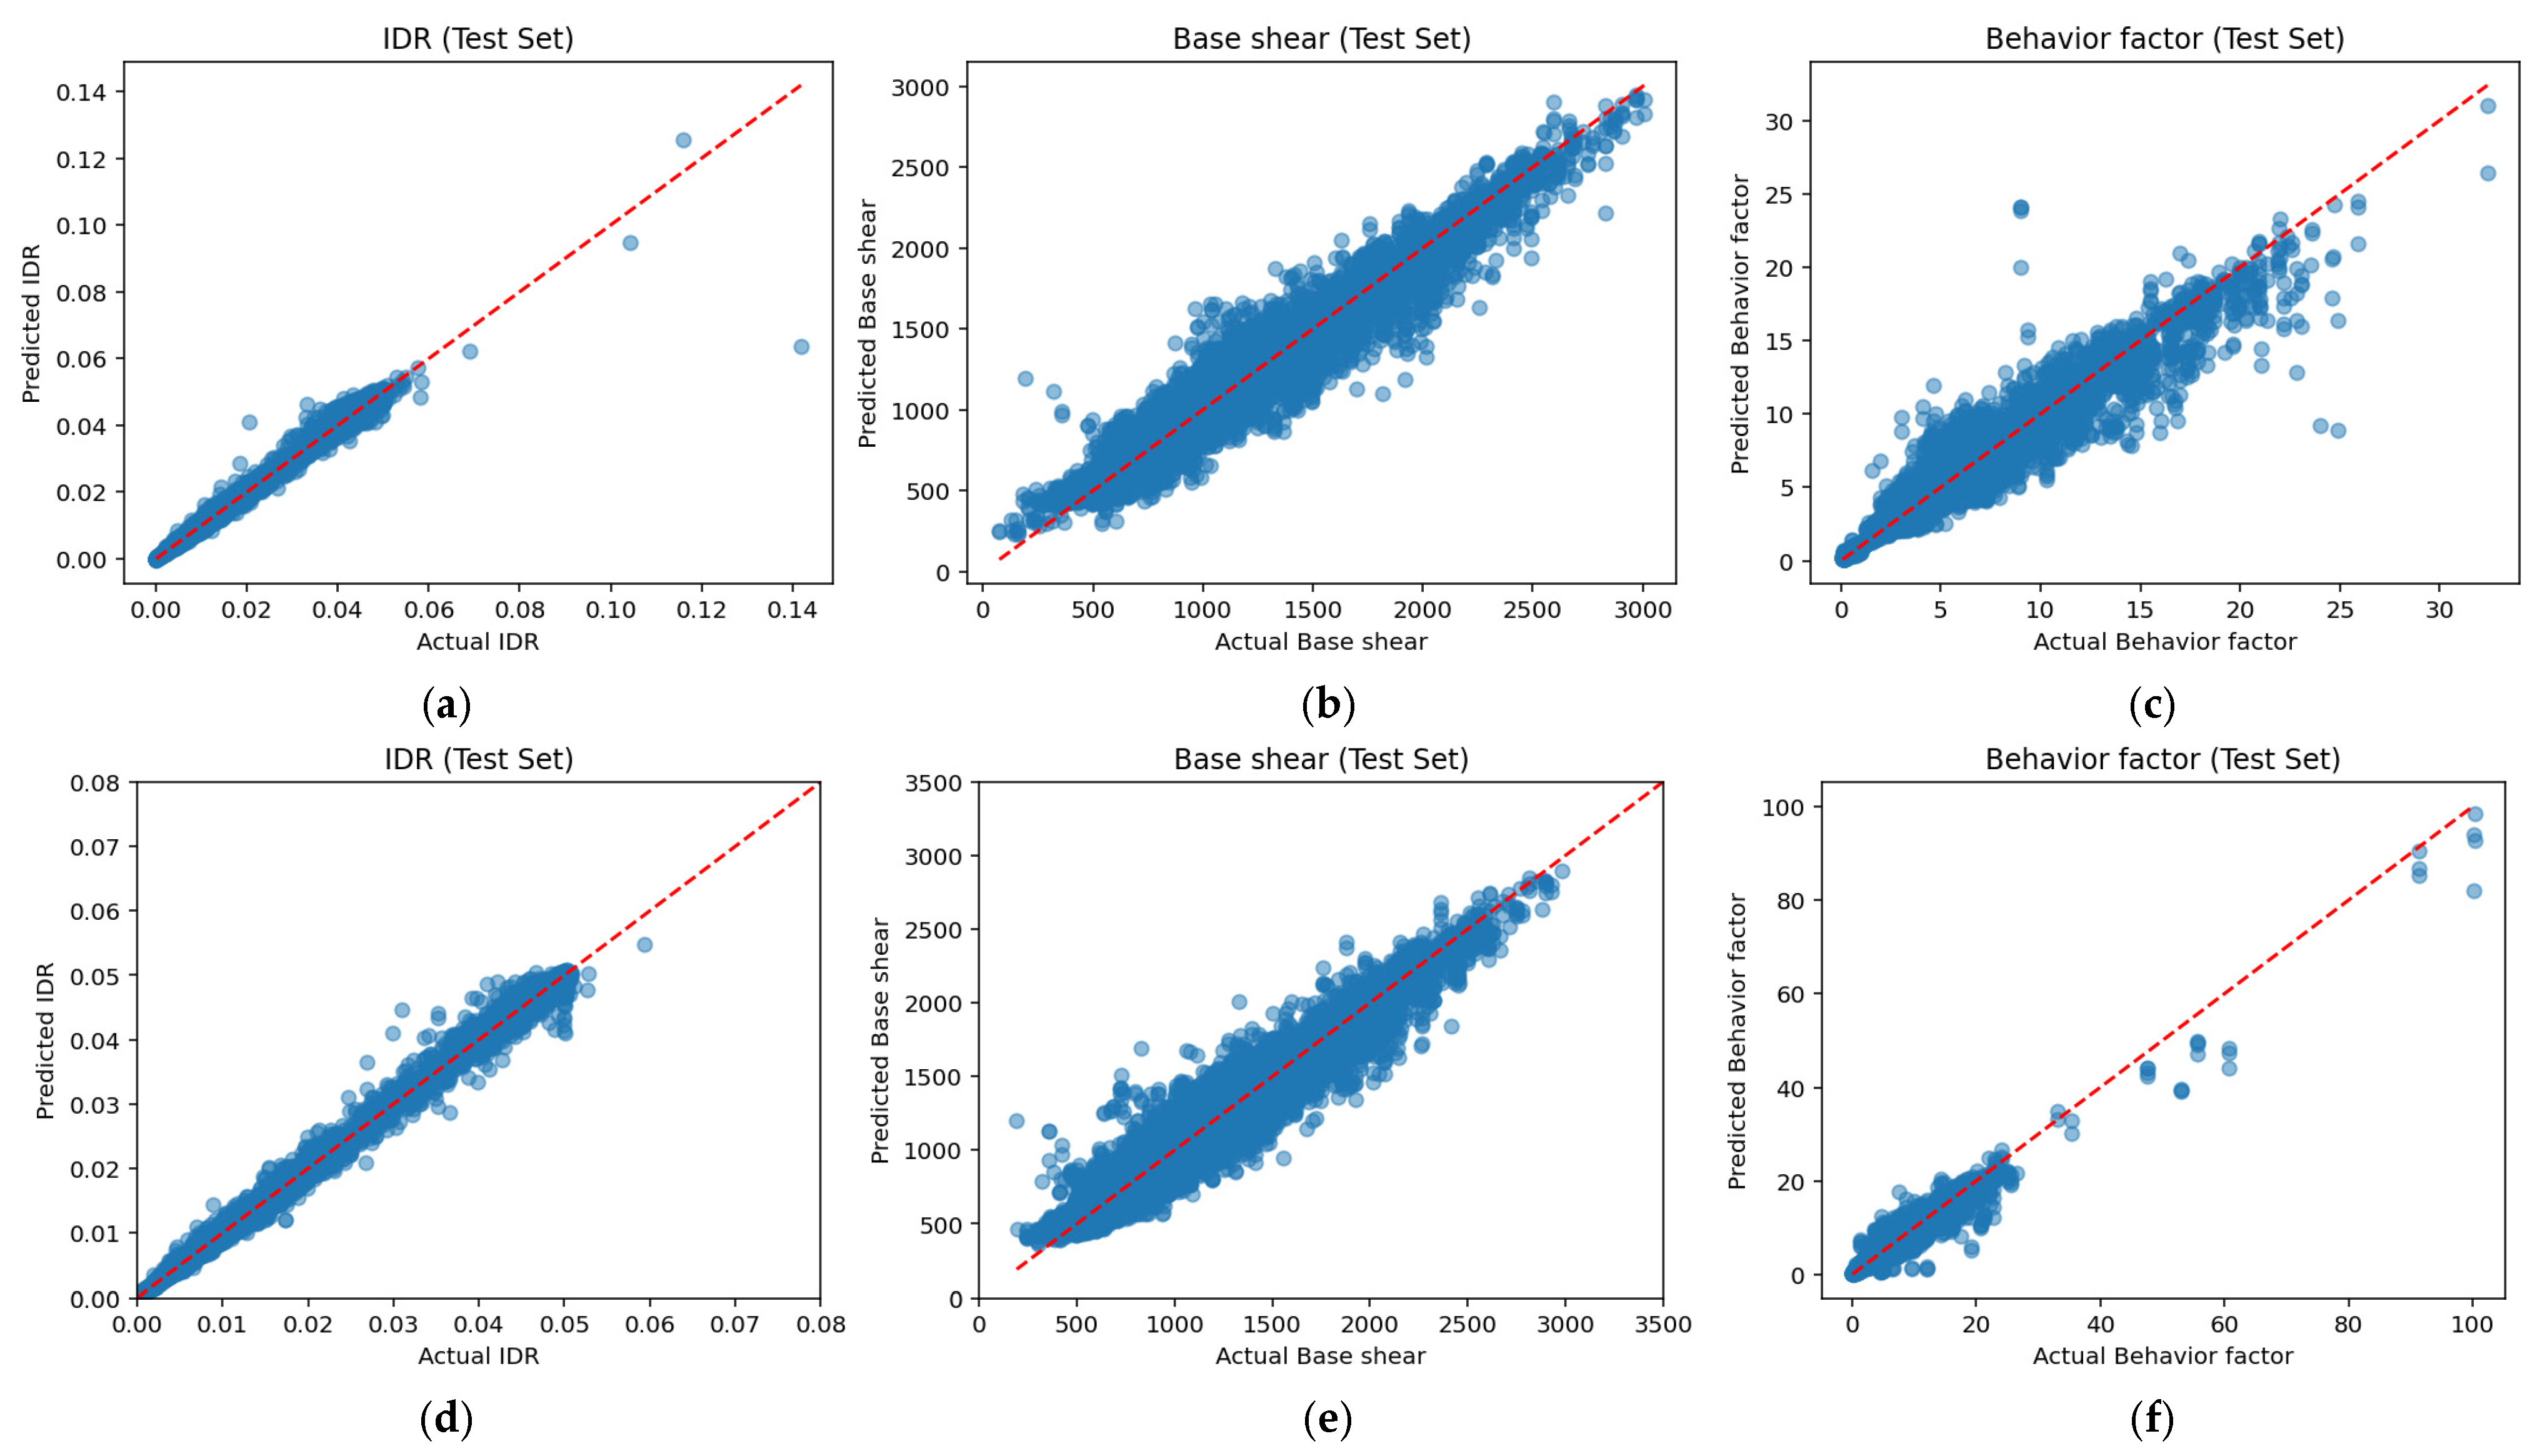
The scatter plots in Figure 10 illustrate the predicted versus actual values for the test dataset, both for fixed-base conditions (Figure 10a–c) and with SSI (Figure 10d–f). A strong correlation is observed between predicted and actual values, indicating high model accuracy across all scenarios. Table 8 summarizes the coefficient of determination (R2) values for each output variable, like maximum IDR, base shear, and behavior factor q, under different soil types and SSI conditions, confirming the robustness and reliability of the predictive framework. The inclusion of soil type and SSI as explicit parameters enables a detailed comparison of their influence on the predicted structural responses, highlighting the importance of site-specific conditions in seismic performance assessment. This work demonstrates that machine learning techniques, particularly XGBoost, can effectively capture complex relationships between structural and dynamic parameters and provide accurate predictions of key seismic performance indicators [29,44].
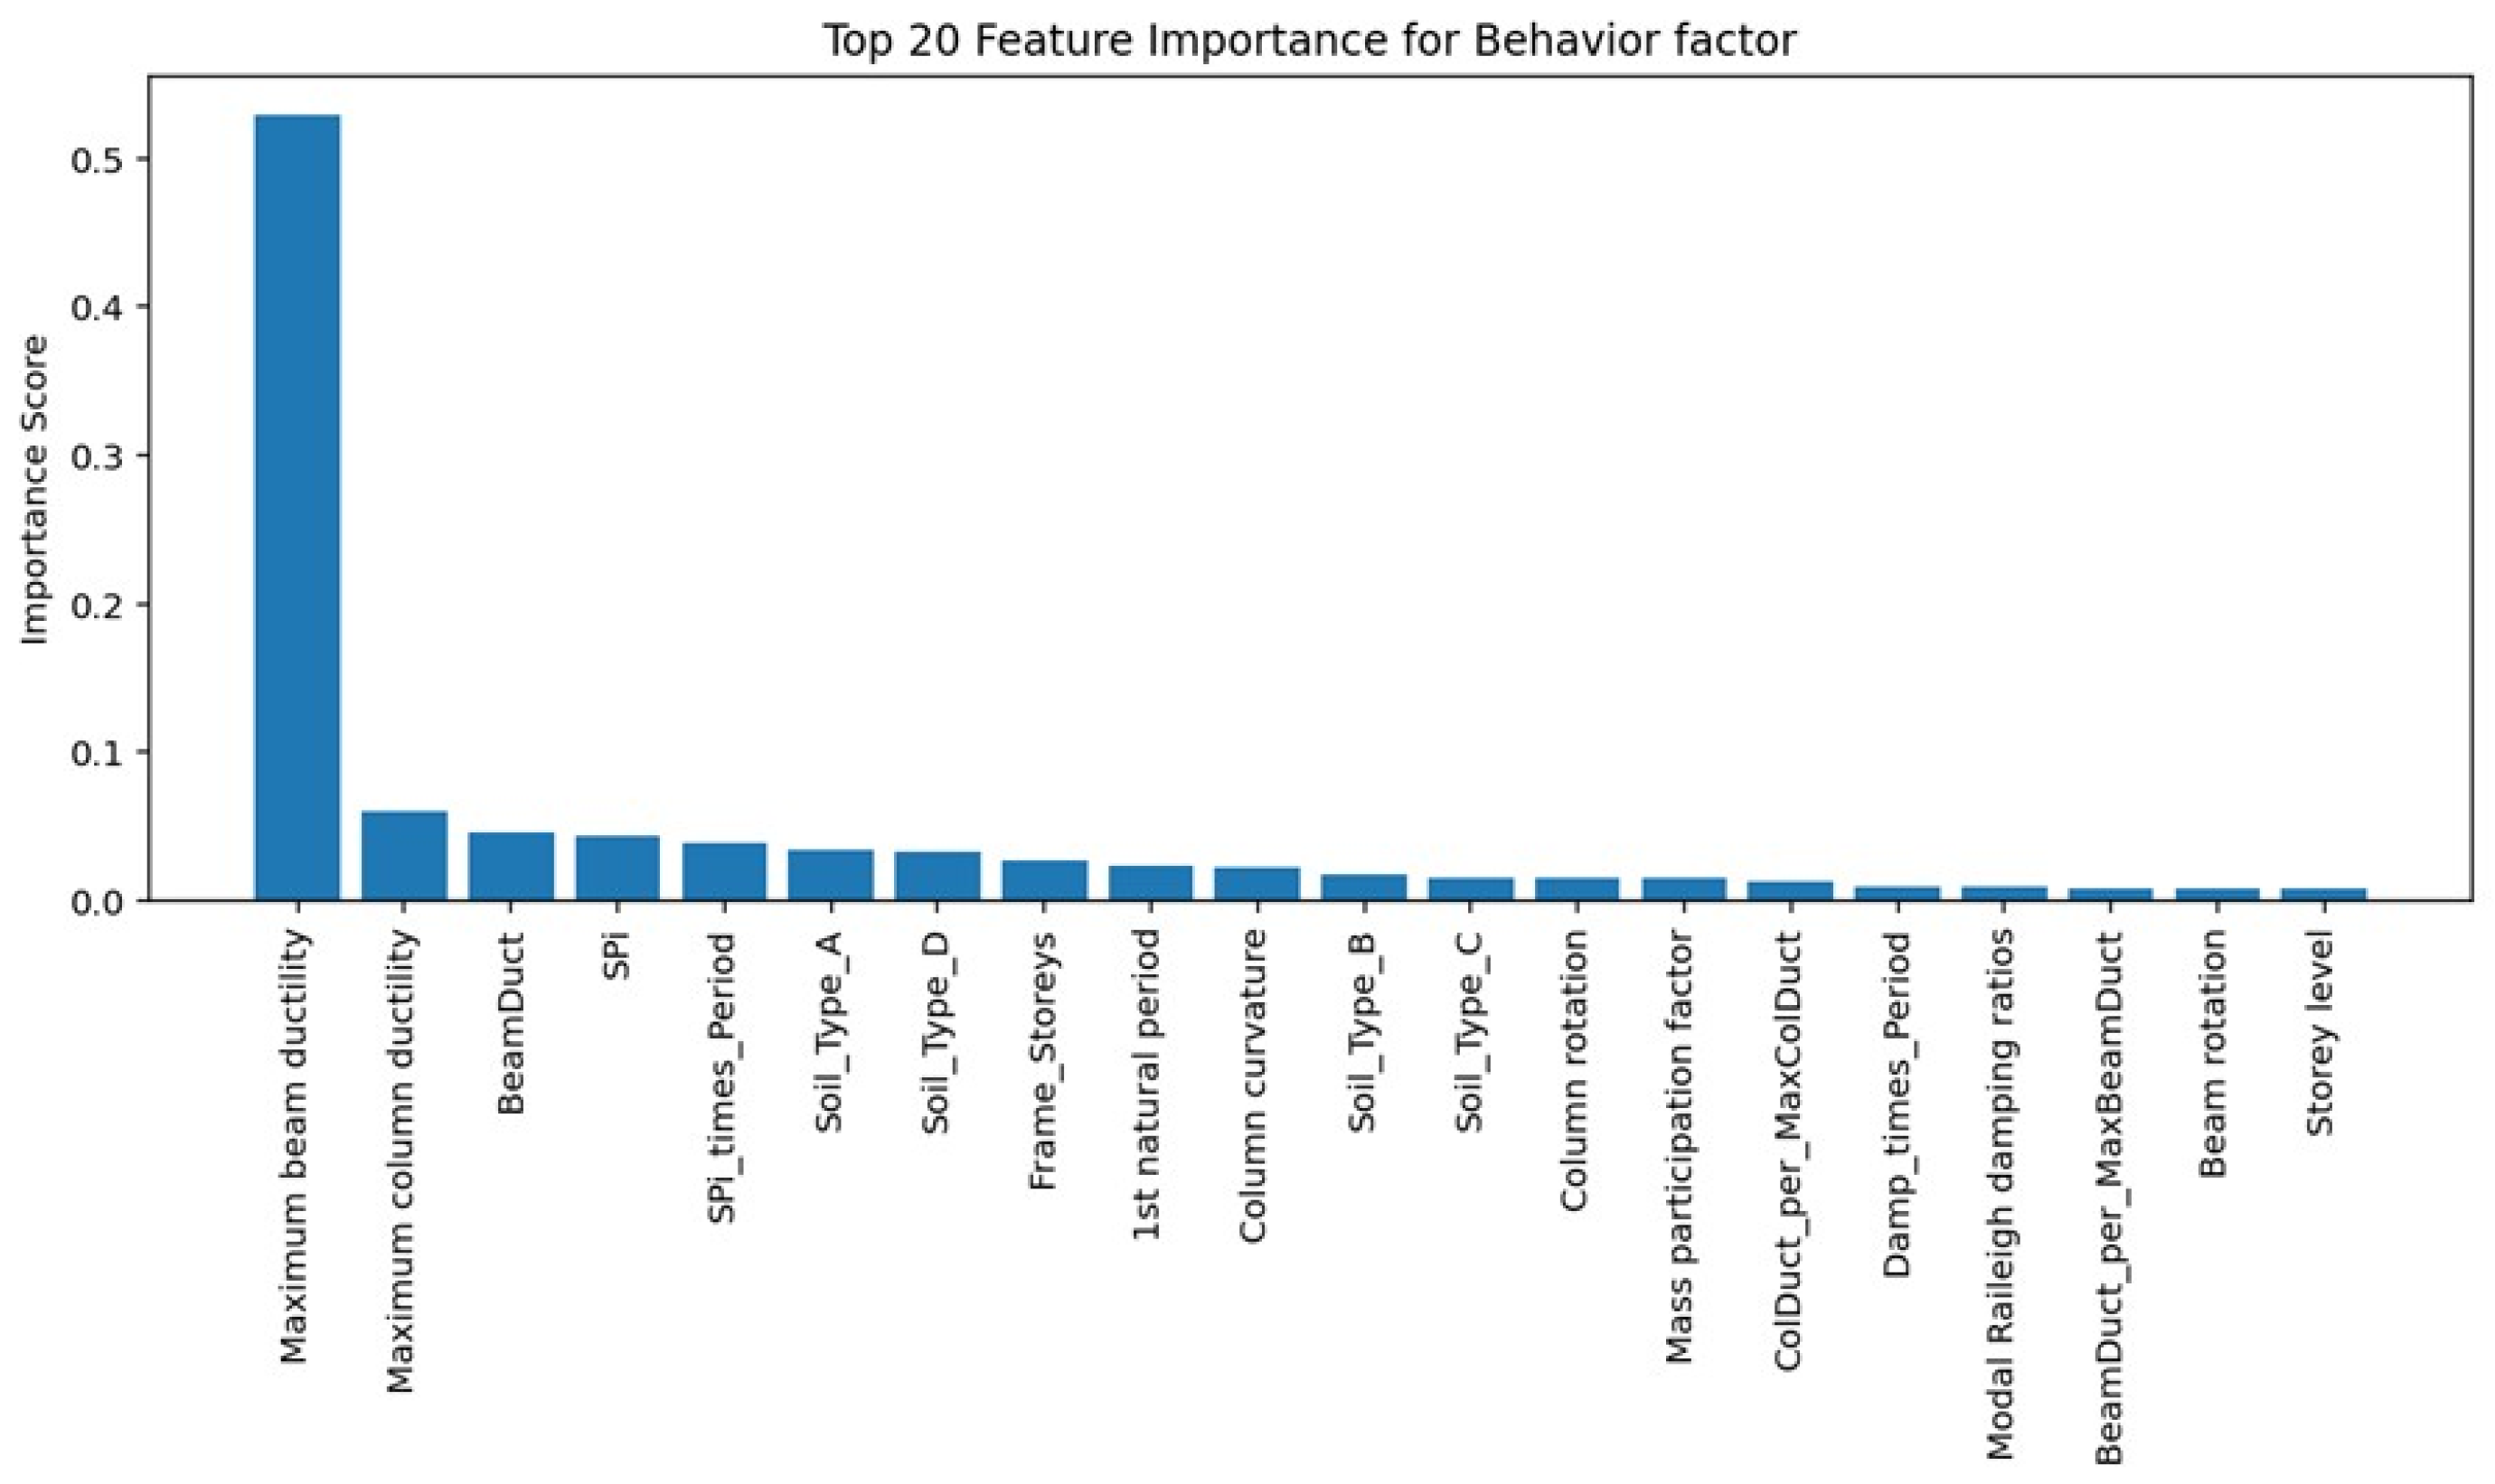
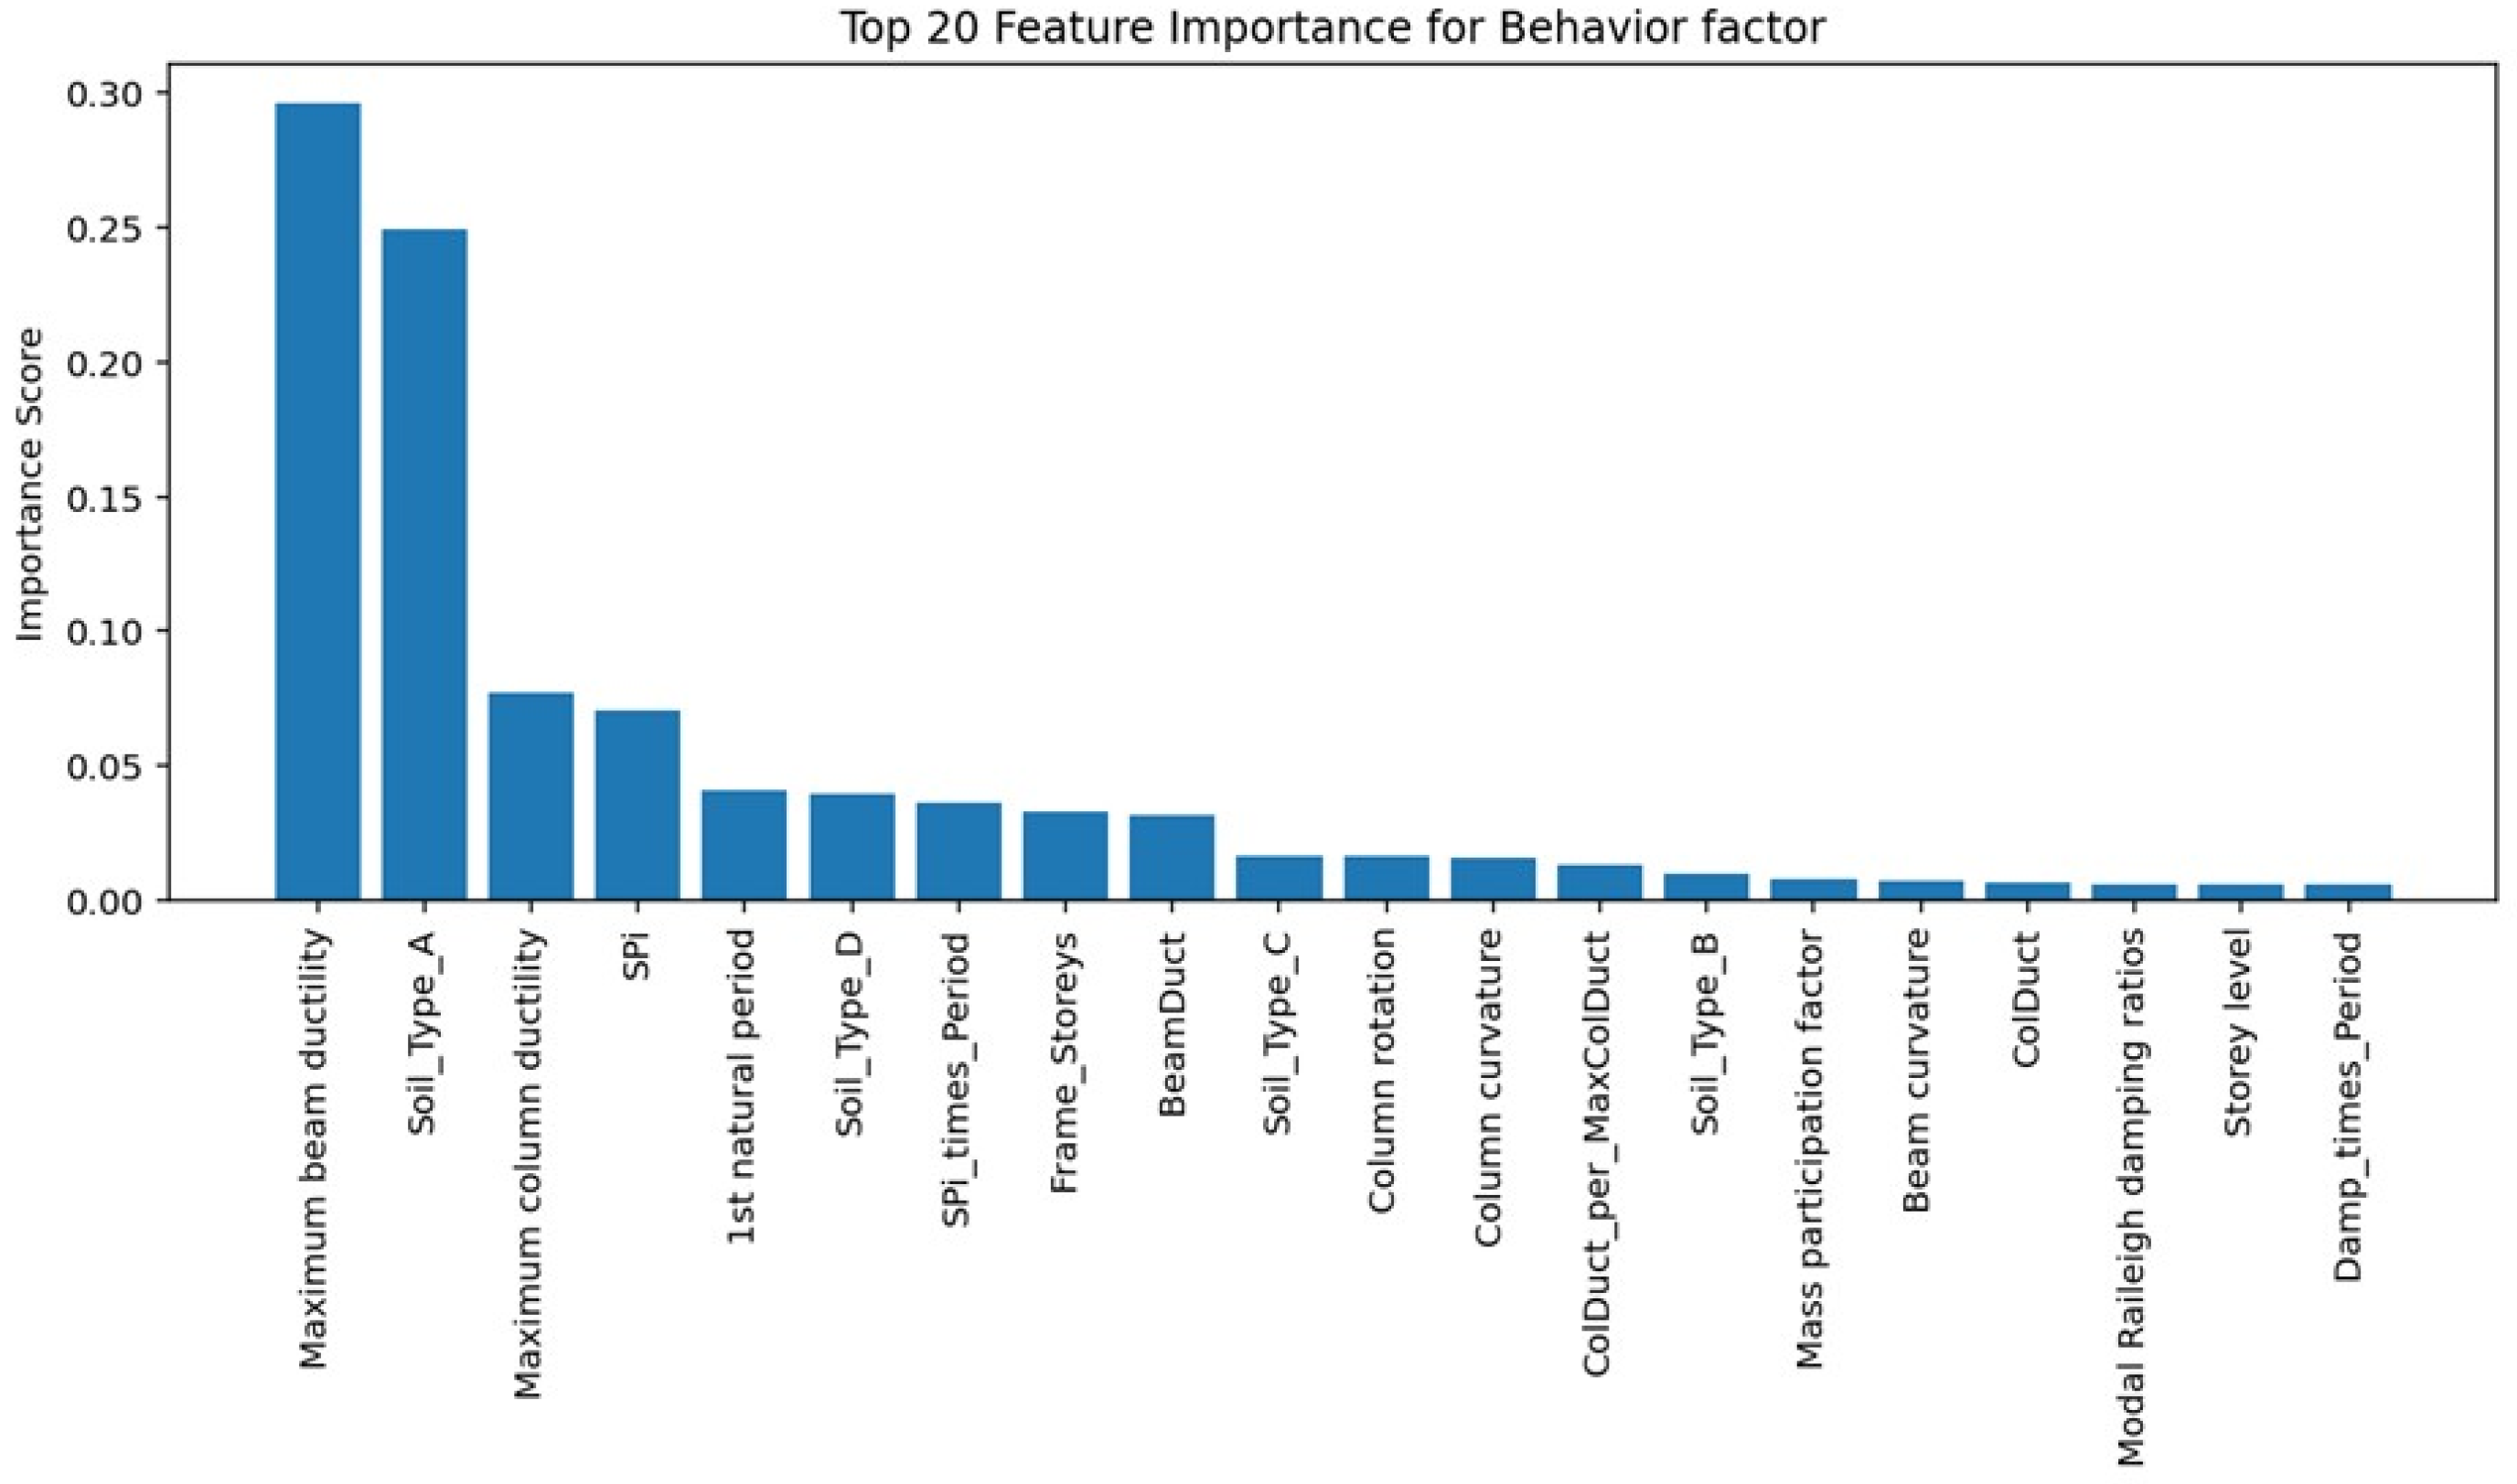
The trained XGBoost [44] was then used as a framework for sensitivity analysis by ranking input variables based on how they contribute to prediction accuracy. This ranking was based on measures such as gain, cover, and frequency, which demonstrate how often and how effectively a variable is used to make decisions in the ensemble of boosted trees. This feature importance analysis was performed specifically for the behavior factor q, taking into account both fixed-base and SSI conditions. The results are shown in two bar charts (Figure 11 and Figure 12), which show the 20 most important variables for each condition.
Comparing the feature-importance profiles for the behavior factor q under fixed base and SSI conditions shows a clear shift in what drives the prediction once foundation flexibility is considered. Maximum beam ductility remains the dominant contributor in both cases, reflecting the central role of beams in governing inelastic rotation capacity in steel MRFs. Under fixed base assumptions, maximum column ductility typically ranks second, consistent with its role in stability and load transfer. When SSI is included, the soil type A indicator moves into the second position, and column ductility drops to third, indicating that base flexibility and the associated period lengthening and modal redistribution change the distribution and magnitude of column demands. SSI also raises the importance of global dynamic descriptors such as the fundamental period (T) and the performance level (SPi), because foundation compliance shifts natural frequencies and alters mode shapes and the distribution of dynamic response. Overall, variables that are secondary in the fixed base case become influential when SSI is considered, which supports including explicit soil descriptors and interaction features to obtain robust, physically consistent predictions of the behavior factor q.
To conclude, the XGBoost model is developed as a surrogate for nonlinear time-history analysis of the frames, both with and without SSI consideration. It is trained to predict base shear, maximum IDR, and the behavior factor q. The model serves two main purposes. First, it enables sensitivity analysis to quantify the relative influence of ductility measures, soil class, foundation flexibility, and performance level. Second, it provides rapid and preliminary estimates of seismic demand for different structural configurations and site conditions, which reduces the computational effort required for scenario-based assessment in PBSD.

5. Discussion

Some key methodological aspects that warrant particular discussion are the derivation of the behavior factor q and the upper limit applied to ground-motion scaling. Using the ratio q = SFPL/SFy is consistent with the concept of a behavior or response-modification factor, which measures the reserve capacity beyond first yield by combining ductility and overstrength. This formulation is in line with IDA procedures, where records are progressively intensified until specific response thresholds are reached, and with methods that calibrate force-reduction factors from actual nonlinear capacity rather than elastic approximations. Guidance from FEMA P-695 [45] supports this approach by relating reduction factors directly to collapse-margin capacity, provided that yield and performance limits are defined consistently and statistics are computed across representative record sets.
When considering scaling limits, past recommendations suggest keeping amplitude scaling moderate, often between 0.5 and 2.0, to preserve the spectral and temporal characteristics of the motion. NIST [46] guidelines similarly caution against excessive scaling, warning that large factors can distort spectral shape, energy content, and duration, which in turn may bias nonlinear structural response. Some studies, however, indicate that larger factors do not necessarily bias median response if the selected records are spectrally sufficient for the chosen intensity measure. In engineering practice, many researchers adopt a single-digit maximum for scale factors, using values approaching 10 only when required and with checks to ensure motion integrity. In this context, our choice of SFPL/SFy for q estimation is appropriate, and setting the scale factor limit at around 10 is reasonable as an upper bound, provided that most records require much smaller factors and motion characteristics remain realistic.
Regarding the frame geometry, two-dimensional planar models are adopted to isolate the in-plane response of symmetric three-dimensional steel moment-resisting frames and to facilitate a large, controlled parametric study across different soil classes and ground motions. This approach captures the key SSI mechanisms, including fundamental period elongation, base shear modification, drift redistribution, and the resulting q(T) trends. While two-dimensional modeling does not account for torsional effects due to plan irregularity, accidental or inherent eccentricity, or three-dimensional soil–domain scattering, it remains appropriate for regular configurations where the response is governed by in-plane behavior. For highly irregular structures, or in cases where torsional demands are significant, a full three-dimensional SSI formulation is necessary. Two-dimensional analysis continues to be a reliable and efficient tool for large-scale parametric nonlinear time history analyses and is widely applied in contemporary research.
In terms of compatibility with existing design codes, the findings of this study can reasonably be aligned with current code provisions and directly applied in professional practice. The ASCE/SEI 7-2 [47] permits the modeling of foundation flexibility and the use of time-history analyses with flexible supports, which aligns with the BNWF approach adopted in this study. Eurocode also allows for the explicit inclusion of soil–foundation deformability and geotechnical considerations through its general rules and the provisions of Part 5 [48], both of which support substructure-based SSI modeling. For performance-based seismic evaluations, the FEMA P-58 [49] methodology accepts response-history outputs from structural models that incorporate SSI to compute decision-oriented performance metrics. In practice, the results indicate that SSI effects are limited on stiff soil sites but become increasingly significant on softer soils and for longer-period structures. In such cases, modeling foundation flexibility is recommended, whereas a fixed-base assumption generally remains acceptable for stiff ground conditions. The present work certifies the above observation. Ultimately, the most significant contribution of this study is that the proposed q factors can be integrated into existing seismic design codes, particularly within the force-based design framework.
With respect to the novelty of this work, there are relatively few prior studies that comprehensively examine performance-based seismic design of steel moment-resisting frames with SSI, especially across a wide range of soil conditions, building heights, and key PBSD aspects such as period elongation, base shear reduction, and drift redistribution. Nevertheless, the limited existing literature reports trends that are consistent with the findings of the present study. For example, foundation flexibility is known to increase the fundamental period, moderate base shear on softer soils, and shift drift demand toward longer periods. In Ref. [50], a cone model representation of SSI within a performance-based plastic design framework was used to propose ductility-dependent strength reduction factors for flexible-base steel MRFs. Their results align with the observed behavior of the strength reduction factor q as a function of the fundamental period in this study. Using a BNWF model, the present work confirms these mechanisms across EC8 soil classes A through D and frame heights ranging from 2 to 16 stories. Furthermore, this study provides empirical q versus period relationships for each soil class, extending the applicability of existing findings to a broader soil and height domain. These contributions highlight the novelty of the work and help address a significant gap in the current PBSD literature for steel moment-resisting frames with SSI.
Finally, during the ML procedure, some feature-importance plots display soil class A as more influential than soil class D. In gradient-boosted trees, importance (measured by gain) reflects the marginal contribution of each variable to reducing prediction error, after accounting for the presence of other correlated inputs. Since soil class A generally corresponds to fixed-base behavior, its indicator can effectively separate a large number of low-q observations, leading the model to assign it disproportionately high importance. In contrast, the effects of softer soils, such as class D, are primarily conveyed through variables like the fundamental period T and ductility measures, which already capture the associated response characteristics. As a result, the lower ranking of soil class D does not imply reduced physical significance but rather reflects the way the model distributes credit among correlated features.

6. Conclusions

This study quantifies the influence of soil–structure interaction (SSI) on key parameters within the performance-based seismic design (PBSD) framework for steel moment-resisting frames (MRFs). The PBSD methodology is extended to incorporate SSI by representing the foundation and supporting soil through a beam-on-nonlinear Winkler foundation (BNWF) model. Fifteen frames, ranging from two to sixteen storeys, are analyzed under a suite of 100 far-field ground motion records, classified according to Eurocode 8 into soil types A through D (25 records per soil type), with particular emphasis on soils B and D. The results show that including SSI systematically lengthens the fundamental period relative to fixed base conditions, with negligible changes on stiff sites (soil class A) and pronounced elongation on soft soils (soil class D), especially for taller frames. Mean base shear decreases when SSI is considered, and the difference between Soils B and D is larger at the collapse prevention (CP) level. Based on nonlinear time history analyses of 25 seismic records for each soil type, the average maximum interstorey drift ratios (IDRs) remain essentially unchanged on soil type B but are clearly reduced on soil type D, especially in mid- to high-rise frames. This indicates that foundation flexibility significantly influences the distribution of lateral demands depending on the soil conditions. Behavior factors were estimated from record-consistent scale factor ratios, with q defined as the ratio of the scale at the target performance level to the scale at first yield (q = SFPL/SFy). On soft soils, q increases at moderate to long periods, revealing a larger force reduction capacity than implied by fixed base models, whereas on stiff soils, q remains close to fixed base values. Taken together, these findings indicate that fixed-base analysis is a reasonable simplification for stiff sites and low-rise systems, but explicit modeling of soil structure interaction should be included for soft soils and taller frames to avoid bias in period, base shear force, and drift estimates. The outcomes support soil-specific calibration of drift limits and behavior factors within performance-based checks.
The machine learning procedure used the same database as the deterministic study to train separate models that predict base shear, maximum IDR, and the behavior factor q. Data were split into training, validation, and test sets, with early stopping to ensure generalization, and performance was reported with standard metrics. The models reproduced the main trends observed with and without SSI, including lower base shear and reduced drifts on soft soils and higher q at moderate to long periods. Feature importance consistently highlighted maximum beam ductility as the leading predictor, with column ductility, soil class, and the performance level also contributing. Under SSI consideration, soil type A can appear more important because the model assigns importance to whichever variable most cleanly separates the data after period and ductility are considered. This reflects the scoring method and does not imply any physical reversal of soil effects.
Overall, explicitly accounting for SSI improves the reliability of PBSD for steel MRFs by reducing bias in period, base shear, and maximum IDR estimates and by enabling soil-specific calibration of behavior factors q and drift limits for both design verification and assessment. Practically, the results show that explicit SSI modeling is necessary for softer soils and longer-period structures, while fixed-base assumptions are generally sufficient for stiff soils. The reported q(T1) relationships and drift trends can support soil-class-specific checks within existing provisions for design verification and assessment.

Author Contributions

Conceptualization, N.A.K.; methodology, N.A.K.; software, N.A.K. and M.S.; validation, N.A.K. and M.S.; formal analysis, N.A.K. and M.S.; investigation, N.A.K. and E.V.M. and G.S.K.; resources, N.A.K.; data curation, N.A.K. and M.S.; writing—original draft preparation, N.A.K.; writing—review and editing, N.A.K. and E.V.M. and G.S.K.; visualization, N.A.K.; supervision, E.V.M. and G.S.K. All authors have read and agreed to the published version of the manuscript.

Funding

This research received no external funding.

Data Availability Statement

The raw data supporting the conclusions of this article will be made available by the authors upon request.

Conflicts of Interest

The authors declare no conflicts of interest.

Abbreviations

The following abbreviations are used in this manuscript:
BNWFBeam on nonlinear Winkler foundation
CPCollapse prevention
DBDDisplacement-based design
DCMDuctility class medium
DLDamage limitation
EC3Eurocode 3
EC8Eurocode 8
FBDForce-based design
FEFinite element
HFDHybrid force–displacement
IDAIncremental dynamic analysis
IDRInter-story drift ratio
IOImmediate occupancy
LSLife safety
MRFMoment-resisting frame
PBSDPerformance-based design
SFScale factor
SLSServiceability limit state
SSISoil–structure interaction
ULSUltimate limit state

References

  1. EN 1998-1; Eurocode 8, Design of Structures for Earthquake Resistance, Part 1: General Rules, Seismic Actions and Rules for Buildings. European Committee for Standardization (CEN): Brussels, Belgium, 2009.
  2. Bazeos, N. Comparison of three seismic design methods for plane steel frames. Soil Dyn. Earthq. Eng. 2009, 29, 553–562. [Google Scholar] [CrossRef]
  3. Medina, R.A.; Krawinkler, H. Evaluation of drift demands for the seismic performance assessment of frames. J. Struct. Eng. 2005, 131, 1003–1013. [Google Scholar] [CrossRef]
  4. Fardis, M.N.; Carvalho, E.; Elnashai, A.; Faccioli, E.; Pinto, P. Designers’ Guide to EN 1998-1 and EN 1998-5 Eurocode 8: Design of Structures for Earthquake Resistance; Thomas Telford: Telford, UK, 2005. [Google Scholar]
  5. Karavasilis, T.L.; Bazeos, N.; Beskos, D.E. Deformation demands in plane steel frames with setbacks. Earthq. Eng. Struct. Dyn. 2008, 37, 929–948. [Google Scholar]
  6. Tzimas, A.S.; Karavasilis, T.L.; Bazeos, N.; Beskos, D.E. A hybrid force/displacement seismic design method for steel building frames. Eng. Struct. 2013, 56, 1452–1463. [Google Scholar] [CrossRef]
  7. SEAOC. Recommended Lateral Force Requirements and Commentary; Structural Engineers Association of California: Sacramento, CA, USA, 1999. [Google Scholar]
  8. Kalapodis, N.A.; Muho, E.V.; Beskos, D.E. Structure-specific, multi-modal and multi-level scalar intensity measures for steel plane frames. Soil Dyn. Earthq. Eng. 2025, 190, 109185. [Google Scholar] [CrossRef]
  9. Muho, E.V.; Kalapodis, N.A.; Beskos, D.E. Multi-modal and multi-level structure-specific spectral intensity measures for seismic evaluation of reinforced concrete frames. Bull. Earthq. Eng. 2024, 22, 6955–6989. [Google Scholar] [CrossRef]
  10. Kalapodis, N.A.; Papagiannopoulos, G.A.; Beskos, D.E. Modal strength reduction factors for seismic design of plane steel braced frames. J. Constr. Steel Res. 2018, 147, 549–563. [Google Scholar] [CrossRef]
  11. Papagiannopoulos, G.A.; Beskos, D.E. Towards a seismic design method for plane steel frames using equivalent modal damping ratios. Soil Dyn. Earthq. Eng. 2010, 30, 1106–1118. [Google Scholar] [CrossRef]
  12. Muho, E.V.; Papagiannopoulos, G.A.; Beskos, D.E. Deformation dependent equivalent modal damping ratios for the performance based seismic design of plane R/C structures. Soil Dyn. Earthq. Eng. 2020, 129, 105572. [Google Scholar] [CrossRef]
  13. Muho, E.V.; Papagiannopoulos, G.A.; Beskos, D.E. A seismic design method for reinforced concrete moment resisting frames using modal strength reduction factors. Bull. Earthq. Eng. 2019, 17, 337–390. [Google Scholar] [CrossRef]
  14. Kalapodis, N.A.; Papagiannopoulos, G.A. Seismic design of plane steel braced frames using equivalent modal damping ratios. Soil Dyn. Earthq. Eng. 2020, 129, 105947. [Google Scholar] [CrossRef]
  15. Priestley, M.J.N.; Calvi, G.M.; Kowalsky, M.J. Displacement-Based Seismic Design of Structures; IUSS Press: Pavia, Italy, 2007. [Google Scholar]
  16. Kowalsky, M.J.; Priestley, M.J.N.; MacRae, G.A. Displacement-based design of RC bridge columns in seismic regions. Earthq. Eng. Struct. Dyn. 1995, 24, 1623–1643. [Google Scholar] [CrossRef]
  17. Sullivan, T.J.; Priestley, M.J.N.; Calvi, G.M. Direct displacement-based seismic design of frame-wall structures. J. Earthq. Eng. 2006, 10, 91–124. [Google Scholar] [CrossRef]
  18. Calvi, G.M. A displacement-based approach for vulnerability evaluation of classes of buildings. J. Earthq. Eng. 1999, 3, 411–438. [Google Scholar] [CrossRef]
  19. Chopra, A.K.; Goel, R.K. Direct displacement-based design: Use of inelastic vs. elastic design spectra. Earthq. Spectra 2001, 17, 47–64. [Google Scholar] [CrossRef]
  20. Panagiotakos, T.B.; Fardis, M.N. A displacement-based seismic design procedure for RC buildings and comparison with Eurocode 8. Earthq. Eng. Struct. Dyn. 2001, 30, 1439–1462. [Google Scholar] [CrossRef]
  21. Sullivan, T.J.; Calvi, G.M.; Priestley, M.J.N.; Kowalsky, M.J. The limitations and performances of different displacement based design methods. J. Earthq. Eng. 2003, 7, 201–241. [Google Scholar] [CrossRef]
  22. Muho, E.V.; Qian, J.; Beskos, D.E. A direct displacement-based seismic design method using a MDOF equivalent system: Application to R/C framed structures. Bull. Earthq. Eng. 2020, 18, 4157–4188. [Google Scholar] [CrossRef]
  23. Kalapodis, N.A.; Muho, E.V.; Beskos, D.E. Seismic design of plane steel MRFS, EBFS and BRBFS by improved direct displacement-based design method. Soil Dyn. Earthq. Eng. 2022, 153, 107111. [Google Scholar] [CrossRef]
  24. Pian, C.; Qian, J.; Muho, E.V.; Beskos, D.E. A hybrid force/displacement seismic design method for reinforced concrete moment resisting frames. Soil Dyn. Earthq. Eng. 2020, 129, 105360. [Google Scholar] [CrossRef]
  25. Kalapodis, N.A.; Papagiannopoulos, G.A.; Beskos, D.E. A comparison of three performance-based seismic design methods for plane steel braced frames. Earthq. Struct. 2020, 18, 27–44. [Google Scholar]
  26. Skalomenos, K.A.; Hatzigeorgiou, G.D.; Beskos, D.E. Application of the hybrid force/displacement seismic design method to composite steel/concrete plane frames. J. Constr. Steel Res. 2015, 115, 179–190. [Google Scholar] [CrossRef]
  27. Gajan, S.; Raychowdhury, P.; Hutchinson, T.C.; Kutter, B.L.; Stewart, J.P. Application and validation of practical tools for nonlinear soil–foundation interaction analysis. Earthq. Spectra 2010, 26, 111–129. [Google Scholar] [CrossRef]
  28. Gazetas, G. Formulas and charts for impedances of surface and embedded foundations. J. Geotech. Eng. 1991, 117, 1363–1381. [Google Scholar] [CrossRef]
  29. Nguyen, H.D.; Truong, G.T.; Shin, M. Development of extreme gradient boosting model for prediction of punching shear resistance of r/c interior slabs. Eng. Struct. 2021, 235, 112067. [Google Scholar] [CrossRef]
  30. EN 1993-1-1; Eurocode 3, Design of Steel Structures—Part 1-1: General Rules and Rules for Buildings. European Committee for Standardization (CEN): Brussels, Belgium, 2009.
  31. Computers and Structures Inc. SAP2000, version 19; Analysis Reference Manual; Computers and Structures Inc.: Berkeley, CA, USA, 2019.
  32. Carr, A.J. Theory and User Guide to Associated Programs—Ruaumoko Manual; Department of Engineering, University of Canterbury: Christchurch, New Zealand, 2006. [Google Scholar]
  33. Kalapodis, N.A. Influence of Panel Zone Modeling on the Seismic Behavior of Steel Moment-Resisting Frames: A Numerical Study. Appl. Mech. 2025, 6, 22. [Google Scholar] [CrossRef]
  34. Lignos, D.G.; Krawinkler, H. Deterioration Modeling of Steel Components in Support of Collapse Prediction of Steel Moment Frames Under Earthquake Loading. J. Struct. Eng. 2011, 137, 1291–1302. [Google Scholar] [CrossRef]
  35. Schneider, S.P.; Amidi, A. Seismic Behavior of Steel Frames with Deformable Panel Zones. J. Struct. Eng. 1998, 124, 35–42. [Google Scholar] [CrossRef]
  36. Applied Technology Council. ATC-40—Seismic Evaluation and Retrofit of Concrete Buildings; Applied Technology Council: Redwood City, CA, USA, 1996; Volume 1–2. [Google Scholar]
  37. Harden, C.W.; Hutchinson, T.C. Beam-on-Nonlinear-Winkler-Foundation Modeling of Shallow, Rocking-Dominated Footings. Earthq. Spectra 2009, 25, 277–300. [Google Scholar] [CrossRef]
  38. Boulanger, R.W.; Curras, C.J.; Kutter, B.L.; Wilson, D.W.; Abghari, A. Seismic soil-pile-structure interaction experiments and analyses. J. Geotech. Geoenviron. Eng. 1999, 125, 750–759. [Google Scholar] [CrossRef]
  39. Raychowdhury, P.; Hutchinson, T.C. Nonlinear Material Models for Winkler-Based Shallow Foundation Response Evaluation. J. Geotech. Geoenvironmental Eng. 2008, 134, 1129–1141. [Google Scholar]
  40. PEER. Pacific Earthquake Engineering Research Center, Strong Ground Motion Database; University of California: Berkeley, CA, USA, 2009. [Google Scholar]
  41. COSMOS. Consortium of Organizations for Strong Motion Observation Systems; COSMOS: San Francisco, CA, USA, 2013. [Google Scholar]
  42. De Luca, F.; Iervolino, I.; Cosenza, E. Unscaled, Scaled, Adjusted and Artificial Spectral Matching Accelerograms: Displacement and Energy-Based Assessment. In Proceedings of the 13th Congress of the Italian National Association of Earthquake Engineering (ANIDIS), Bologna, Italy, 28 June–2 July 2009. [Google Scholar]
  43. Uang, C.M. Establishing R (or Rw) and Cd Factors for Building Seismic Provisions. J. Struct. Eng. 1991, 117, 19–28. [Google Scholar] [CrossRef]
  44. Dai, H.; Zhou, Y.; Liu, H.; Li, S.; Wei, Y.; Song, J. XGBoost-based prediction of on-site acceleration response spectra with multi-feature inputs from P-wave arrivals. Soil Dyn. Earthq. Eng. 2024, 178, 108503. [Google Scholar] [CrossRef]
  45. FEMA P-695; Quantification of Building Seismic Performance Factors. Federal Emergency Management Agency (FEMA): Washington, DC, USA, 2009.
  46. Whittaker, A.; Atkinson, G.; Baker, J.; Bray, J.; Grant, D.; Hamburger, R.; Haselton, C.; Somerville, P. NISTGCR 11-917-15—Selecting and Scaling Earthquake Ground Motions for Performing Response-History Analyses; National Institute of Standards and Technology: Gaithersburg, MD, USA, 2011. [Google Scholar]
  47. ASCE/SEI 7-22; Minimum Design Loads and Associated Criteria for Buildings and Other Structures. American Society of Civil Engineers (ASCE): Reston, VA, USA, 2022.
  48. EN 1998-5; Eurocode 8, Design of Structures for Earthquake Resistance, Part 5: Foundations, Retaining Structures and Geotechnical Aspects. European Committee for Standardization (CEN): Brussels, Belgium, 2004.
  49. FEMA P-58-1; Applied Technology Council, Seismic Performance Assessment of Buildings, Volume 1—Methodology. Federal Emergency Management Agency (FEMA): Washington, DC, USA, 2018.
  50. Ganjavi, B.; Gholamrezatabar, A.; Hajirasouliha, I. Effects of Soil-Structure Interaction and Lateral Design Load Pattern on Performance-Based Plastic Design of Steel Moment Resisting Frames. Struct. Des. Tall Spec. Build. 2019, 28, e1624. [Google Scholar] [CrossRef]
Figure 1. Plane steel MRF of n stories.
Buildings 15 03741 g001
Figure 2. (a) Representative spring set including the gap element for uplift and (b) full distribution of 25 spring sets along the footing employing the BNWF model to simulate soil–foundation interaction under seismic loading.
Buildings 15 03741 g002
Figure 3. Load–displacement backbone curve calibrated via the Ramberg–Osgood formulation versus the default backbone proposed by Gatzan et al. [27].
Buildings 15 03741 g003
Figure 4. Pseudo acceleration response spectra with the mean curve (blue dashed line), accounting for ξ = 5 % and (a) soil type A or (b) soil type B or (c) soil type C, or (d) soil type D.
Buildings 15 03741 g004
Figure 5. Variation in the fundamental period with building height for fixed-base and SSI models across EC8 soil types.
Buildings 15 03741 g005
Figure 6. Mean base shear versus building height for soil types B and D under different performance levels, with and without SSI consideration.
Buildings 15 03741 g006
Figure 7. Mean maximum IDR versus height for Soil B and Soil D frames, comparing fixed-base and SSI cases.
Buildings 15 03741 g007
Figure 8. Behavior factor q plotted against fundamental period T1 for steel MRFs on Soil B and Soil D, comparing fixed-base and SSI model.
Buildings 15 03741 g008
Figure 9. Schematic workflow of the XGBoost model implementation.
Buildings 15 03741 g009
Figure 10. Scatter plots of predicted versus observed values across all frames and EC8 soils: (a) IDR (fixed base), (b) base shear (fixed base), (c) behavior factor q (fixed base), (d) IDR (with SSI), (e) base shear (with SSI), and (f) behavior factor q (with SSI).
Buildings 15 03741 g010
Figure 11. Variable importance from the XGBoost analysis of the behavior factor q for the fixed base case without the consideration of SSI.
Buildings 15 03741 g011
Figure 12. Variable importance from the XGBoost analysis of the behavior factor q with SSI.
Buildings 15 03741 g012
Table 1. Steel member sections for columns and beams adopted in the seismic design of the MRFs.
FrameStoryFrame Sections HEB (Columns)—IPE (Beams)T1
(s)
T2
(s)
12400-300 (1), 360-270 (2)0.3430.08
23400-300 (1), 360-270 (2–3)0.5640.14
34400-300 (1–2), 360-270 (3–4)0.7580.21
45400-300 (1–2), 360-270 (3–5)0.9960.29
56400-300 (1–3), 360-270 (4–6)1.1960.36
67450-330 (1), 400-300 (2–4), 360-270 (5–7)1.3500.42
78450-330 (1), 400-300 (2–4), 360-270 (5–8)1.5970.51
89450-330 (1–2), 400-300 (3–5), 360-270 (6–9)1.7620.57
910450-330 (1–3), 400-300 (4–6), 360-270 (7–10)1.9190.64
1011450-330 (1–4), 400-300 (5–7), 360-270 (8–11)2.0750.71
1112500-360 (1), 450-330 (2–5), 400-300 (6–8), 360-270 (9–12)2.2020.76
1213500-360 (1–2), 450-330 (3–6), 400-300 (7–9), 360-270 (10–13)2.3310.81
1314500-360 (1–3), 450-330 (4–7), 400-300 (8–10), 360-270 (11–14)2.4630.87
1415550-400 (1–2), 500-360 (3–5), 450-330 (6–8), 400-300 (9–11),
360-270 (12–15)
2.4960.89
1516550-400 (1–4), 500-360 (5–7), 450-330 (8–10), 400-300 (11–13),
360-270 (14–16)
2.4760.90
Table 2. Response limit values for the performance levels of plane steel MRFs [7].
Performance LevelIDRθp
SP1 or IO0.7%0
SP2 or DL1.5%θy
SP3 or LS2.5%3.5 θy
SP4 or CP5.0%6.5 θy
Table 3. Far-field seismic motions compatible with soil type A.
DateRecord NameComp.Station NamePGA (g)
14 October 1987Whittier NarrowsNS24399 Mt Wilson-CIT Station0.158
24 October 1987Whittier NarrowsEW24399 Mt Wilson-CIT Station0.142
320 September 1999Chi-Chi, Taiwan056-NHWA0560.107
420 September 1999Chi-Chi, Taiwan056-NHWA0560.107
51 October 1987Whittier NarrowsNS24399 Mt Wilson-CIT Station0.186
61 October 1987Whittier NarrowsEW24399 Mt Wilson-CIT Station0.123
79 February 1971San FernandoN069127 Lake Hughes 90.157
89 February 1971San FernandoN159127 Lake Hughes 90.134
917 January 1994NorthridgeNS90019 San Gabriel-E. Gr. Ave.0.256
1017 January 1994NorthridgeEW90019 San Gabriel-E. Gr. Ave.0.141
1120 September 1999Chi-Chi, TaiwanNSTAP1030.177
1220 September 1999Chi-Chi, TaiwanEWTAP1030.122
1317 January 1994NorthridgeN00590017 LA-Wonderland Ave0.172
1417 January 1994NorthridgeN17590017 LA-Wonderland Ave0.112
157 June 1975Northern CalifN0601249 Cape Mendocino, Petrolia0.115
167 June 1975Northern CalifN1501249 Cape Mendocino, Petrolia0.179
178 July 1986N. Palm SpringsNS12206 Silent Valley0.139
1818 October 1989Loma PrietaN20558539 San Francisco0.105
1918 October 1989Loma PrietaNS47379 Gilroy Array 10.473
2018 October 1989Loma PrietaEW47379 Gilroy Array 10.411
2117 August 1999Kocaeli, TurkeyNSGebze0.137
2217 August 1999Kocaeli, TurkeyEWGebze0.244
2328 June 1992LandersNS21081 Amboy0.115
2428 June 1992LandersEW21081 Amboy0.146
2520 September 1999Chi-Chi, TaiwanN034TCU0460.133
Table 4. Far-field seismic motions compatible with soil type B.
DateRecord NameComp.Station NamePGA (g)
125 April 1992Cape MendocinoNS89509 Eureka0.154
225 April 1992Cape MendocinoEW89509 Eureka0.178
39 June 1980Victoria, MexicoN0456604 Cerro Prieto0.621
49 June 1980Victoria, MexicoN1356604 Cerro Prieto0.587
525 April 1992Cape MendocinoEW89324 Rio Dell Overpass0.385
625 April 1992Cape MendocinoNS89324 Rio Dell Overpass0.549
713 August 1978Santa BarbaraN048283 Santa Barbara Courthouse0.203
813 August 1978Santa BarbaraN138283 Santa Barbara Courthouse0.102
920 September 1999Chi-Chi, TaiwanNSTCU0950.712
1020 September 1999Chi-Chi, TaiwanEWTCU0950.378
116 August 1979Coyote LakeN2131377 San Juan Bautista0.108
126 August 1979Coyote LakeN3031377 San Juan Bautista0.107
1317 January 1994NorthridgeNS90021 LA-N Westmoreland0.361
1417 January 1994NorthridgeEW90021 LA-N Westmoreland0.401
158 July 1986N. Palm SpringsNS12204 San Jacinto-Soboba0.239
168 July 1986N. Palm SpringsEW12204 San Jacinto-Soboba0.25
1712 September 1970Lytle CreekN115290 Wrightwood0.162
1812 September 1970Lytle CreekN205290 Wrightwood0.2
1918 October 1989Loma PrietaNS58065 Saratoga-Aloha Ave0.324
2018 October 1989Loma PrietaEW58065 Saratoga-Aloha Ave0.512
2128 June 1992LandersNS22170 Joshua Tree0.284
2228 June 1992LandersEW22170 Joshua Tree0.274
2315 September 1976Friuli, ItalyNS8014 Forgaria Cornino0.212
2415 September 1976Friuli, ItalyEW8014 Forgaria Cornino0.26
2520 September 1999Chi-Chi, TaiwanN045TCU0450.512
Table 5. Far-field seismic motions compatible with soil type C.
DateRecord NameComp.Station NamePGA (g)
120 September 1999Chi-Chi, TaiwanNSNST0.388
220 September 1999Chi-Chi, TaiwanEWNST0.309
32 May 1983CoalingaEW36227 Parkfield0.147
42 May 1983CoalingaNS36227 Parkfield0.131
512 November 1999Duzce, TurkeyNSBolu0.728
612 November 1999Duzce, TurkeyEWBolu0.822
715 October 1979Imperial ValleyN0156622 Computertas0.186
815 October 1979Imperial ValleyN2856622 Computertas0.147
915 October 1979Imperial ValleyN0126621 Chihuahua0.27
1015 October 1979Imperial ValleyN2826621 Chihuahua0.284
1117 August 1999Kocaeli, TurkeyNSAtakoy0.105
1217 August 1999Kocaeli, TurkeyEWAtakoy0.164
1318 October 1989Loma PrietaNS1028 Hollister City Hall0.247
1418 October 1989Loma PrietaEW1028 Hollister City Hall0.215
1524 April 1984Morgan HillNS57382 Gilroy Array #40.224
1624 April 1984Morgan HillEW57382 Gilroy Array #40.348
1717 January 1994NorthridgeNS90057 Canyon Country0.482
1817 January 1994NorthridgeEW90057 Canyon Country0.41
199 February 1971San FernandoEW135 LA-Hollywood0.21
209 February 1971San FernandoNS135 LA-Hollywood0.174
2126 April 1981WestmorlandNS5169 Westmorland Fire Sta0.368
2226 April 1981WestmorlandEW5169 Westmorland Fire Sta0.496
2324 November 1987Superstition Hills(B)NS01335 El Centro Imp. Co. Cent0.258
2424 November 1987Superstition Hills(B)EW01335 El Centro Imp. Co. Cent0.358
2527 January 1980LivermoreEW57187 San Ramon0.301
Table 6. Far-field seismic motions compatible with soil type D.
DateRecord NameComp.Station NamePGA (g)
126 April 1981WestmorlandN0455062 Salton Sea Wildlife Ref.0.199
226 April 1981WestmorlandN1355062 Salton Sea Wildlife Ref.0.176
324 November 1987Superstitn HillsN0455062 Salton Sea Wildlife Refuge0.119
424 November 1987Superstitn HillsN1355062 Salton Sea Wildlife Refuge0.167
517 January 1994NorthridgeN06490011 Montebello-Bluff Rd.0.128
617 January 1994NorthridgeN15490011 Montebello-Bluff Rd.0.179
718 October 1989Loma PrietaNS58117 Treasure Island0.159
818 October 1989Loma PrietaEW58117 Treasure Island0.1
917 August 1999Kocaeli, TurkeyNSAmbarl0.184
1017 August 1999Kocaeli, TurkeyEWAmbarl0.249
1118 October 1989Loma PrietaN0431002 APEEL 2-Redwood City0.274
1218 October 1989Loma PrietaN1331002 APEEL 2-Redwood City0.22
1315 October 1979Imperial ValleyN0405057 El Centro Array 30.112
1415 October 1979Imperial ValleyN1305057 El Centro Array 30.179
1520 September 1999Chi-Chi, TaiwanN041CHY0410.639
1620 September 1999Chi-Chi, TaiwanN131CHY0410.302
1718 October 1989Loma PrietaN0471002 APEEL 2-Redwood City0.274
1818 October 1989Loma PrietaN1371002 APEEL 2-Redwood City0.22
1920 September 1999Chi-Chi, TaiwanEWTAP0030.126
2020 September 1999Chi-Chi, TaiwanNSTAP0030.106
2116 January 1995KobeNSNishi-Akashi0.503
2216 January 1995KobeEWNishi-Akashi0.509
2320 September 1999Chi-Chi, TaiwanN040TCU0400.123
2420 September 1999Chi-Chi, TaiwanN130TCU0400.149
2516 January 1995KobeNSKakogawa0.345
Table 7. Summary of input and output variables used in the XGBoost model for predicting seismic performance indicators.
TypeVariableUnitsDescription
Structural FeaturesFrame_StoreysTotal number of stories in the frame
Storey_NumberStory index for floor-level features
ColDuctColumn ductility
MaxColDuctMaximum column ductility
BeamDuctBeam ductility
MaxBeamDuctMaximum beam ductility
ColCurvrad/mColumn curvature
BeamCurvrad/mBeam curvature
ColRotradColumn rotation
BeamRotradBeam rotation
Dynamic ResponsesPeriodsFirst natural period (T)
SPiTarget performance level
Damp%Damping ratio
MassPF%Mass participation factor
ModPFModal participation factor
Categorical VariablesSoil_TypeEC8 soil class (A–D)
SSIFoundation condition: 0 = fixed base, 1 = SSI
Engineering VariablesBeamDuct/MaxBeamDuctNormalized beam ductility
ColDuct/MaxColDuctNormalized column ductility
SPi PeriodInteraction term between performance level and period
Damp PeriodInteraction term between damping and period
Output VariablesIDRInter-story drift ratio (IDR)
Base ShearkNBase shear force
q_FactorBehavior factor (q)
Table 8. Coefficient of determination (R2) values for XGBoost predictions of IDR, base shear, and behavioral factor with and without considering SSI.
Output VariableWithout SSIWith SSI
IDR0.9920.986
Base Shear0.9480.947
Behavior Factor0.9440.952
Disclaimer/Publisher’s Note: The statements, opinions and data contained in all publications are solely those of the individual author(s) and contributor(s) and not of MDPI and/or the editor(s). MDPI and/or the editor(s) disclaim responsibility for any injury to people or property resulting from any ideas, methods, instructions or products referred to in the content.