Article

Research on the Safety Judgment of Cuplok Scaffolding Based on the Principle of Image Recognition

1
School of Civil Engineering, Tianjin Chengjian University, Tianjin 300192, China
2
Tianjin Key Laboratory of Protection and Reinforcement of Civil Engineering and Building Structures, Tianjin 300192, China
3
Department of Building Structures and Structural Mechanics, Faculty of Civil Engineering and Environmental Sciences, Bialystok University of Technology, 15-351 Bialystok, Poland
*
Author to whom correspondence should be addressed.
Buildings 2025, 15(20), 3737; https://doi.org/10.3390/buildings15203737
Submission received: 5 August 2025 / Revised: 13 October 2025 / Accepted: 15 October 2025 / Published: 17 October 2025

Abstract

Due to their technical complexity, multi-step procedures, and low efficiency, traditional monitoring techniques have struggled to meet the rapid development of safety management on construction sites in assessing the safety of cuplok scaffolding. Therefore, this study applied image recognition technology to the safety monitoring of cuplok scaffold systems. A recognition model for identifying member shapes in images of cuplok scaffolds was proposed. Combined with a judgment criterion established based on the energy method, the safety state of the scaffold system was evaluated, ultimately forming an image recognition-based technique for detecting the safety performance of cuplok scaffolds. Experimental studies on a reduced-scale model demonstrated that the proposed method achieved an accuracy and efficiency of 80% in both recognition and judgment. The results indicated that this method enables rapid and efficient safety performance monitoring of cuplok scaffolding, holding significant practical implications for improving monitoring efficiency.

1. Introduction

As cuplok scaffolding has been extensively employed as a temporary supporting structure in infrastructure construction including bridges and buildings, its erection quality was critically linked to construction safety and the overall stability of the project [1]. However, potential issues in the cuplok scaffold system—such as installation deviations, missing members, or loose connections—could readily lead to structural instability or even collapse [2]. Therefore, continuous monitoring of its safety condition was essential. Traditional inspection methods primarily relied on manual assessment, which suffered from limitations such as low efficiency, strong subjectivity, and poor data traceability, making them inadequate to meet the growing demand for rapid, accurate, and verifiable safety supervision in modern engineering. In recent years, intelligent detection technologies based on image recognition have rapidly developed across various fields [3]. In the agricultural sector: Gong et al. [4] employed median filtering to reduce the impact of noise on disease features, used the K-means clustering method for image segmentation, and applied Support Vector Machines (SVMs) to classify fused features, achieving accurate identification of maize disease categories. Zhao et al. [5] utilized a DJI drone equipped with a multispectral camera to capture five-band multispectral images. Based on the Minimum Redundancy Maximum Relevance (mRMR) algorithm, sensitive features were optimized, and SVM and Random Forest methods were respectively used to construct monitoring models for assessing the severity of arcea yellow leaf disease. In the medical application field: Yi et al. [6] adopted CT images and machine learning methods, combining traditional radiological features with radiomic features for predictive modeling to differentiate between low-grade and high-grade Clear Cell Renal Cell Carcinoma (CCRCC). Bandara et al. [7] leveraged wavelet transform-based radiomic features, which are sensitive to the directionality of ultrasonic speckle patterns, to successfully distinguish between Chronic Kidney Disease (CKD) and healthy kidney ultrasound images.
Numerous scholars have also undertaken research on applying intelligent methods to safety inspection in the field of construction. Zhu Xiao [8] Based on computer technology and communication technology, a real-time monitoring system for scaffolding was constructed and applied to the safety management of external scaffolding construction. Through research and collection of relevant data, the feasibility and effectiveness of this system for the safety control of external scaffolding construction were further proved. Yang [9] Others used Mask R-CNN to conduct real-time segmentation and identification of the dangerous areas in the monitoring images, thereby helping tower crane operators ensure operation safety. Huang [10] In order to prevent the buckling failure of the support system, it is necessary to monitor the axial force and lateral displacement simultaneously, and integrate the analysis program into the monitoring in real time to achieve the effect of early warning in advance. Chen [11] The mechanical properties of the bowl-buckle type support were studied, the factors affecting its stability and bearing capacity were discussed, and various safeguard measures from the design to the construction stage were provided, as well as the monitoring and control method of the bowl-buckle type support based on bridge construction monitoring, effectively enhancing the engineering safety. Zhao et al. [12] employed an improved YOLOv5s algorithm for hazard identification in multi-scale external scaffolding within complex backgrounds. By refining the backbone and neck network architecture, experimental results demonstrated a significant enhancement in the model’s detection accuracy. Zhang et al. [13] proposed an improved Faster R-CNN-based algorithm for detecting safety helmet compliance among construction workers using image recognition technology. Their method achieved high recognition accuracy while fulfilling real-time detection requirements. Li et al. [14] developed an improved Faster R-CNN-based model for safety helmet detection in complex working environments. By employing strategies including anchor optimization and loss function replacement, the modified architecture significantly improved the recognition performance. Wang et al. [15] employed convolutional neural networks (CNNs) integrated with unmanned aerial vehicle (UAV) technology for perimeter safety barrier inspection. Their method achieved a recognition accuracy exceeding 90%, demonstrating the feasibility and effectiveness of applying image recognition technology to construction site monitoring. Liu et al. [16] proposed a YOLOv5-based algorithm for post-earthquake building damage detection, which enabled rapid identification of damage types such as debris, collapse, spalling, and cracks. The method achieved a recognition accuracy exceeding 90%, thereby meeting the requirements for real-time post-disaster assessment. Object detection algorithms, such as Faster R-CNN [17] and YOLO [18], demonstrate remarkable capabilities in feature learning, information processing, and feedback speed, thereby providing crucial technical support for intelligent construction management.
In summary, while image recognition algorithms have demonstrated significant progress in the field of safety inspection, research focusing specifically on the safety assessment of cuplok scaffolding using this technology remains scarce. Therefore, this study aimed to introduce image recognition into the safety monitoring of cuplok scaffolding. First, a precise recognition model for identifying member shapes in cuplok scaffold images was proposed to enable automatic detection of key structural components. Second, a stability evaluation criterion applicable to scaffold systems was established by integrating the energy method, thereby facilitating safety status assessment. Finally, a comprehensive image recognition-based technique for monitoring the safety performance of cuplok scaffolding was developed. This technique allowed for intelligent and rapid diagnosis of the scaffold’s safety condition, and its effectiveness was validated through experiments. The study ultimately provides a novel technical approach and methodological support for enhancing the monitoring efficiency of cuplok scaffolding.

2. Cuplok Scaffolding Safety Evaluation Framework

Addressing the limitations of traditional cuplok scaffold safety inspection methods—such as technical complexity, multi-step procedures, and low efficiency—and leveraging the advantages of image recognition technology, including high speed, accuracy, and cost-effectiveness, this paper proposed an image recognition-based method for safety assessment of cuplok scaffolding. The logical framework of the proposed method is illustrated in Figure 1. The specific procedure was implemented as follows. First, image acquisition of the cuplok scaffold was performed. The collected images were then processed using a detection model to extract member images and perform image segmentation, thereby obtaining the structural contours. Subsequently, the least squares method was applied to fit curves to the obtained contours, from which the buckling modes of the images were derived. Next, a safety evaluation criterion for the cuplok scaffold was established using the energy method. The fitted curve modes were compared with the standard modal shapes via image-based matching. Finally, upon successful matching, the safety status of the structural members was determined.

3. Image Processing of Cuplok Scaffolding Systems

The image processing technique treated the cuplok scaffold images as three-dimensional matrices and extracted the target structure through procedures including grayscale conversion, threshold segmentation, refinement, and image transformation. The images were first converted to grayscale to facilitate feature analysis. Threshold segmentation was then applied to distinguish the scaffold regions: based on the original image f(x, y), a grayscale threshold t was determined according to specific criteria. Pixels with values greater than t were set to 255, while those less than t were set to 0, resulting in a binary image g(x, y) and achieving image binarization [19]. The operation is expressed as follows:
g x , y = 255   I f   f x , y t 0 I f   f x , y < t
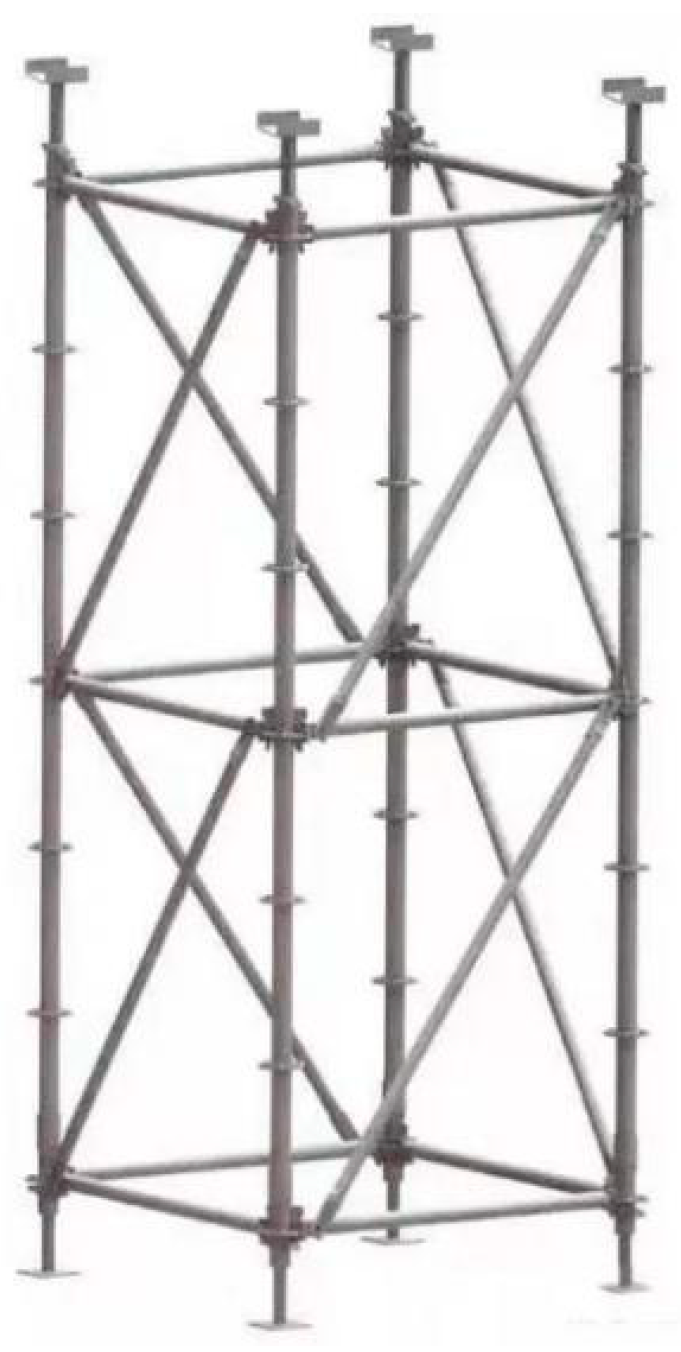
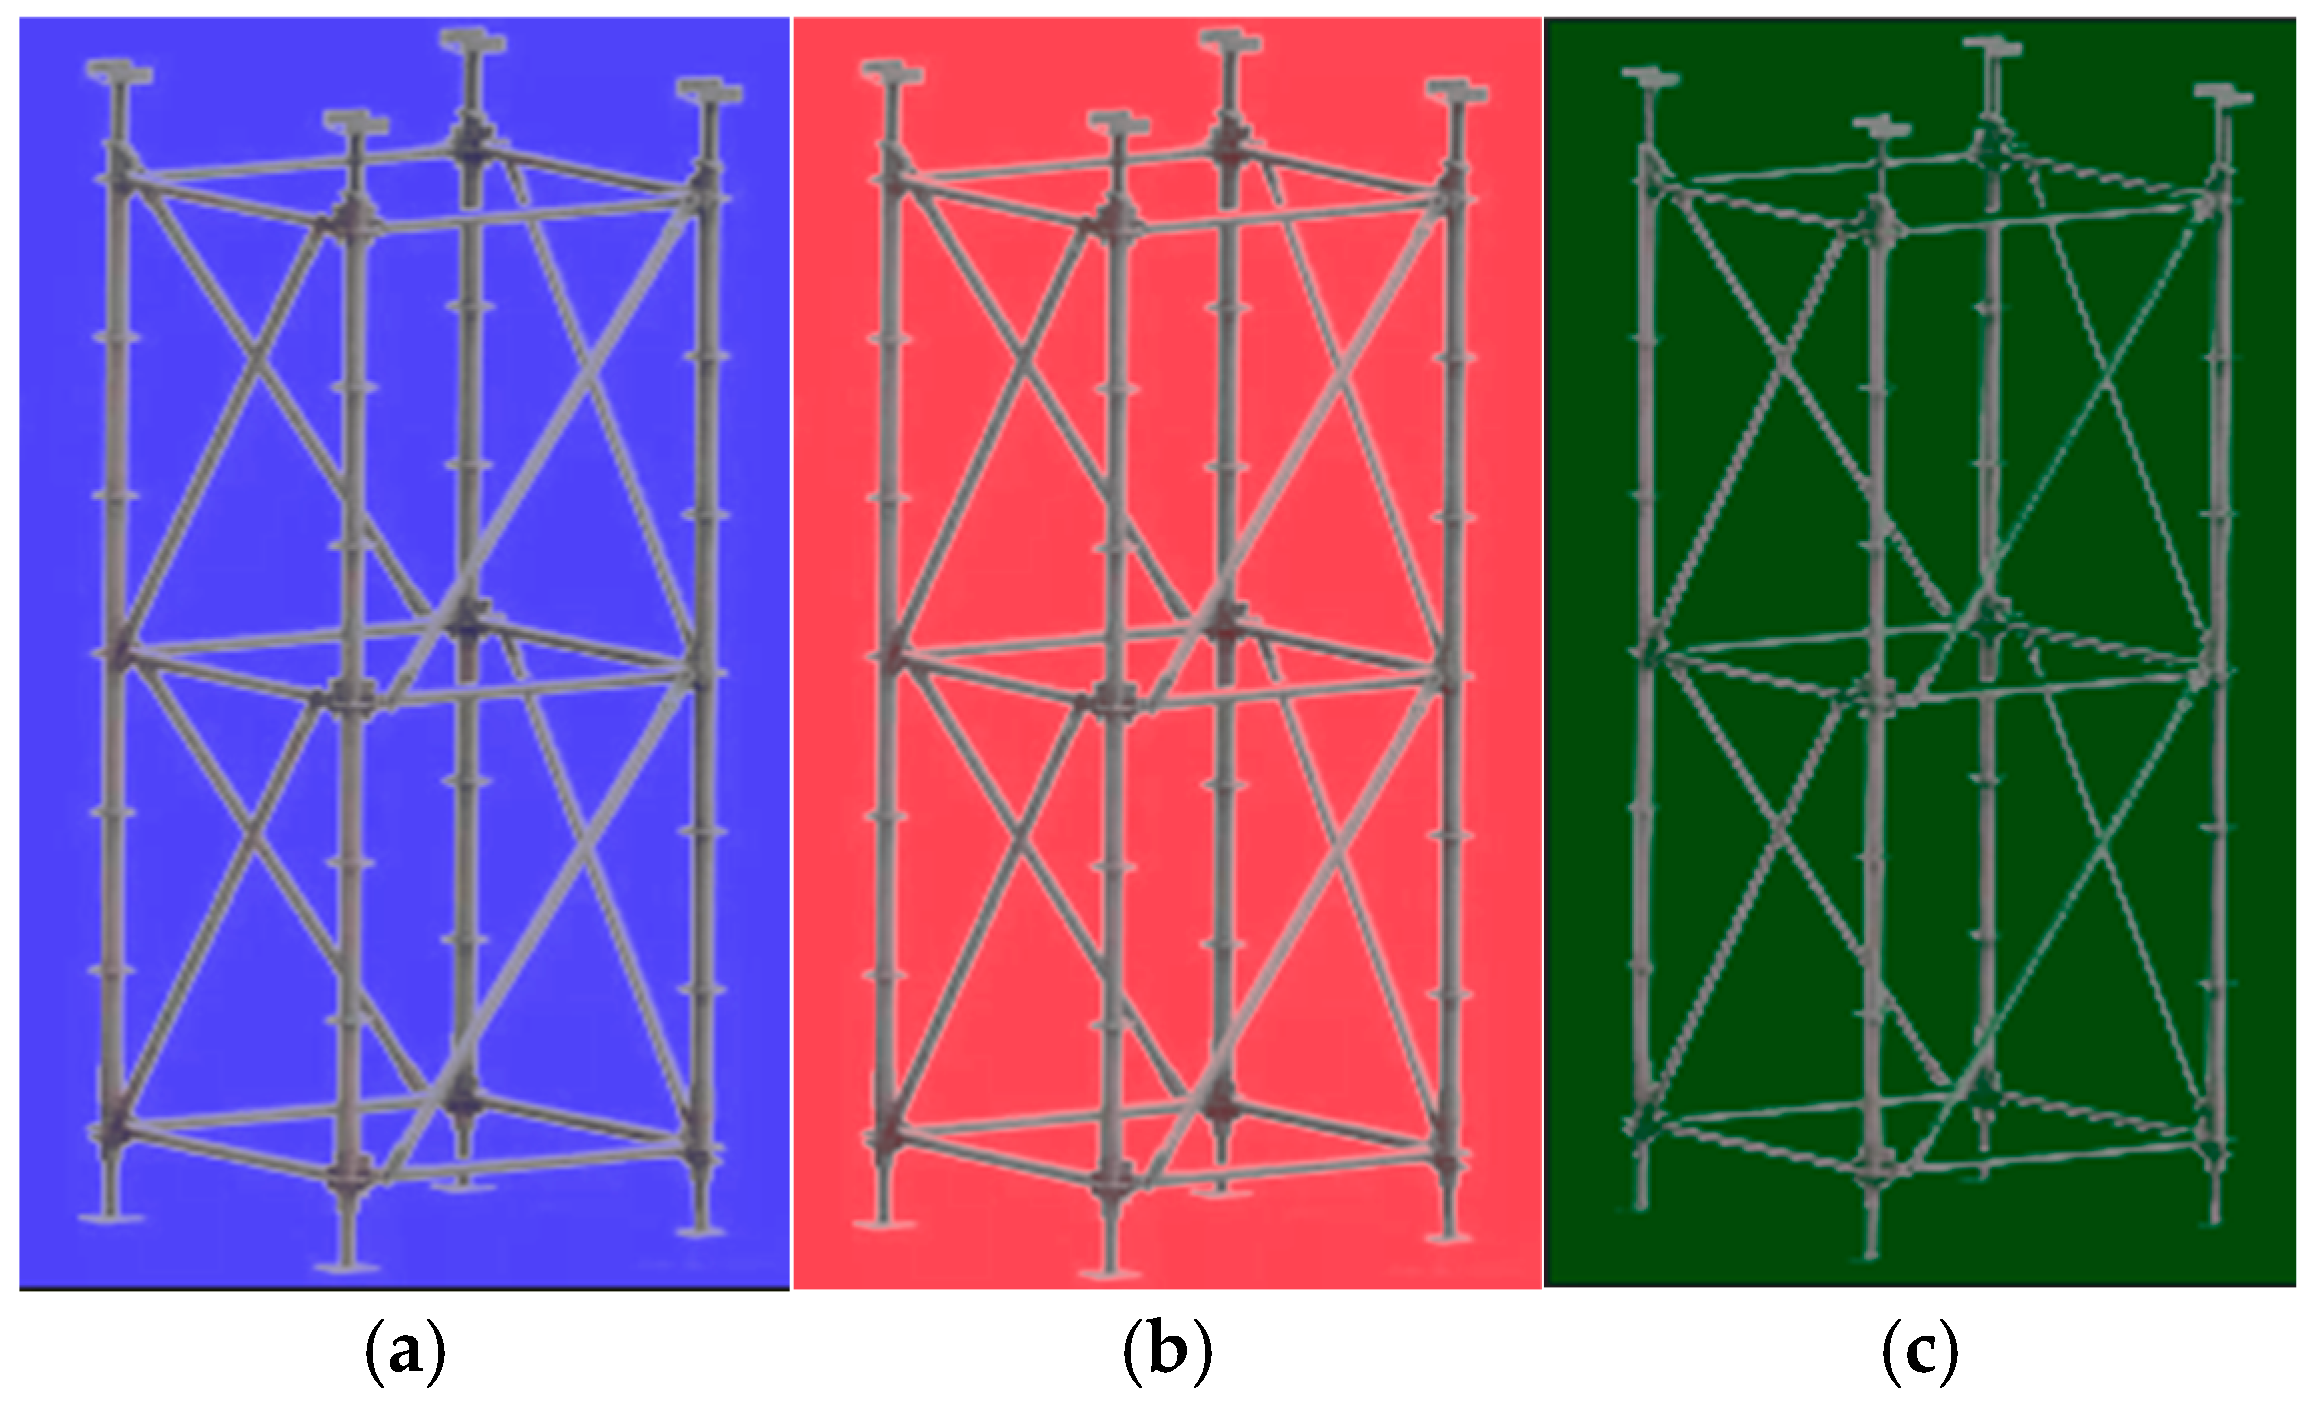
After image processing technology, the cuplok scaffold system that needs to be identified can be effectively segmented from the complex background. The original image of the cuplok scaffold is shown in Figure 2, The images of the Cuplok scaffolding brackets under red, green, and blue background conditions are shown in Figure 3.

3.1. Image Grayscale Processing

In a changing environment, the photos of the cuplok scaffold captured by the camera contain many complex visual elements. If these original images are processed directly, problems such as large computational load and color interference will be faced, which will reduce the accuracy of processing. Therefore, these images need to be grayscale processed. This processing method can remove the redundant color information, making the image more concise and thereby reducing the computing resources required during processing and accelerating the processing speed. After grayscale conversion, the amount of data in the image is reduced, and the information becomes clearer, facilitating further analysis and processing. The principle of grayscale conversion is to transform a color image into a black-and-white one and normalize the color threshold of the color image. Originally, there were 255 color levels in a color image, but after normalization, the grayscale conversion level was only 0 to 1. The purpose of grayscale is to accelerate the speed of image processing and reduce the computational complexity [20]. Average the pixel values of the three channels of RGB to obtain the gray value. The formula is
Gray = (R + G + B)/3
To calculate the gray value, check the histogram to see what the RGB values of the image are, respectively. The histogram call function of the image is cv2.calchist().
On a green background:
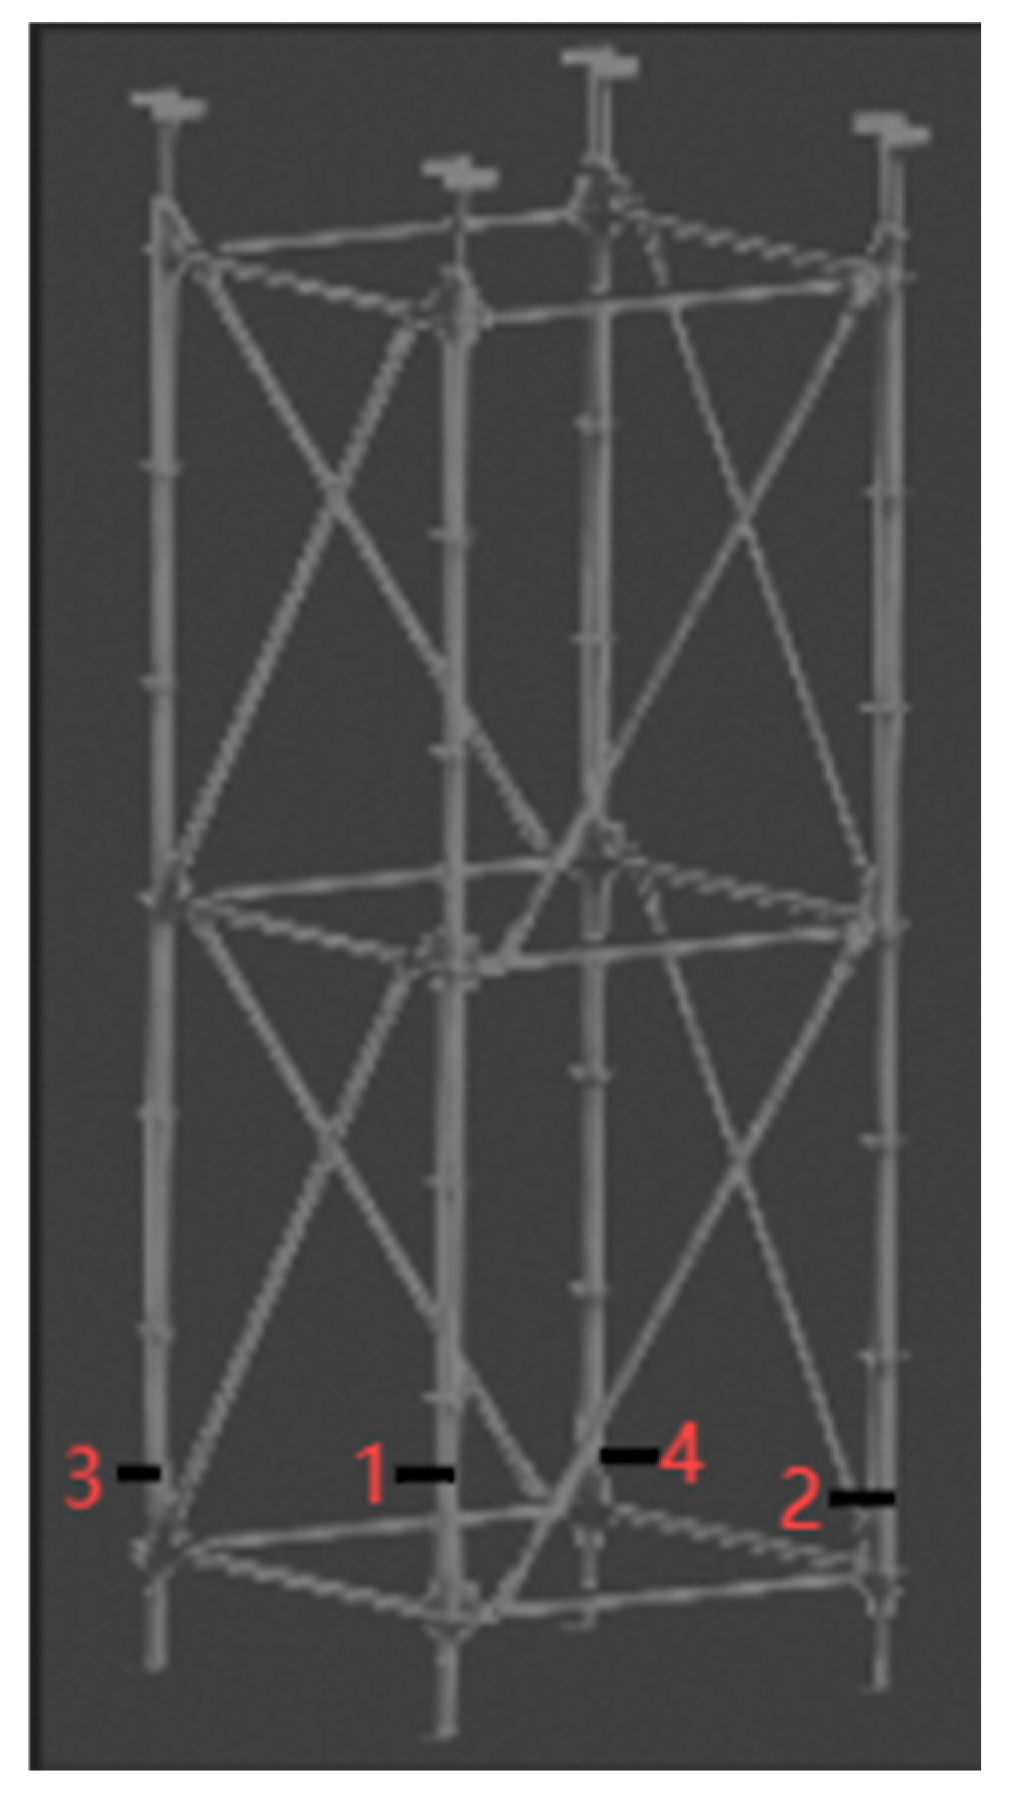
It can be observed from Figure 4 that under the green background, the grayscale values of the main structure of the cuplok scaffold were predominantly distributed in the higher range (approximately 180–200), while those of the background, shadows, and noise were concentrated in the lower range (approximately 0–170). Through repeated testing and validation on training set samples, a grayscale value of 73 was found to most effectively separate background noise. Consequently, the threshold was set at 73, and the grayscale image shown in Figure 5 was obtained.
Against a red background:
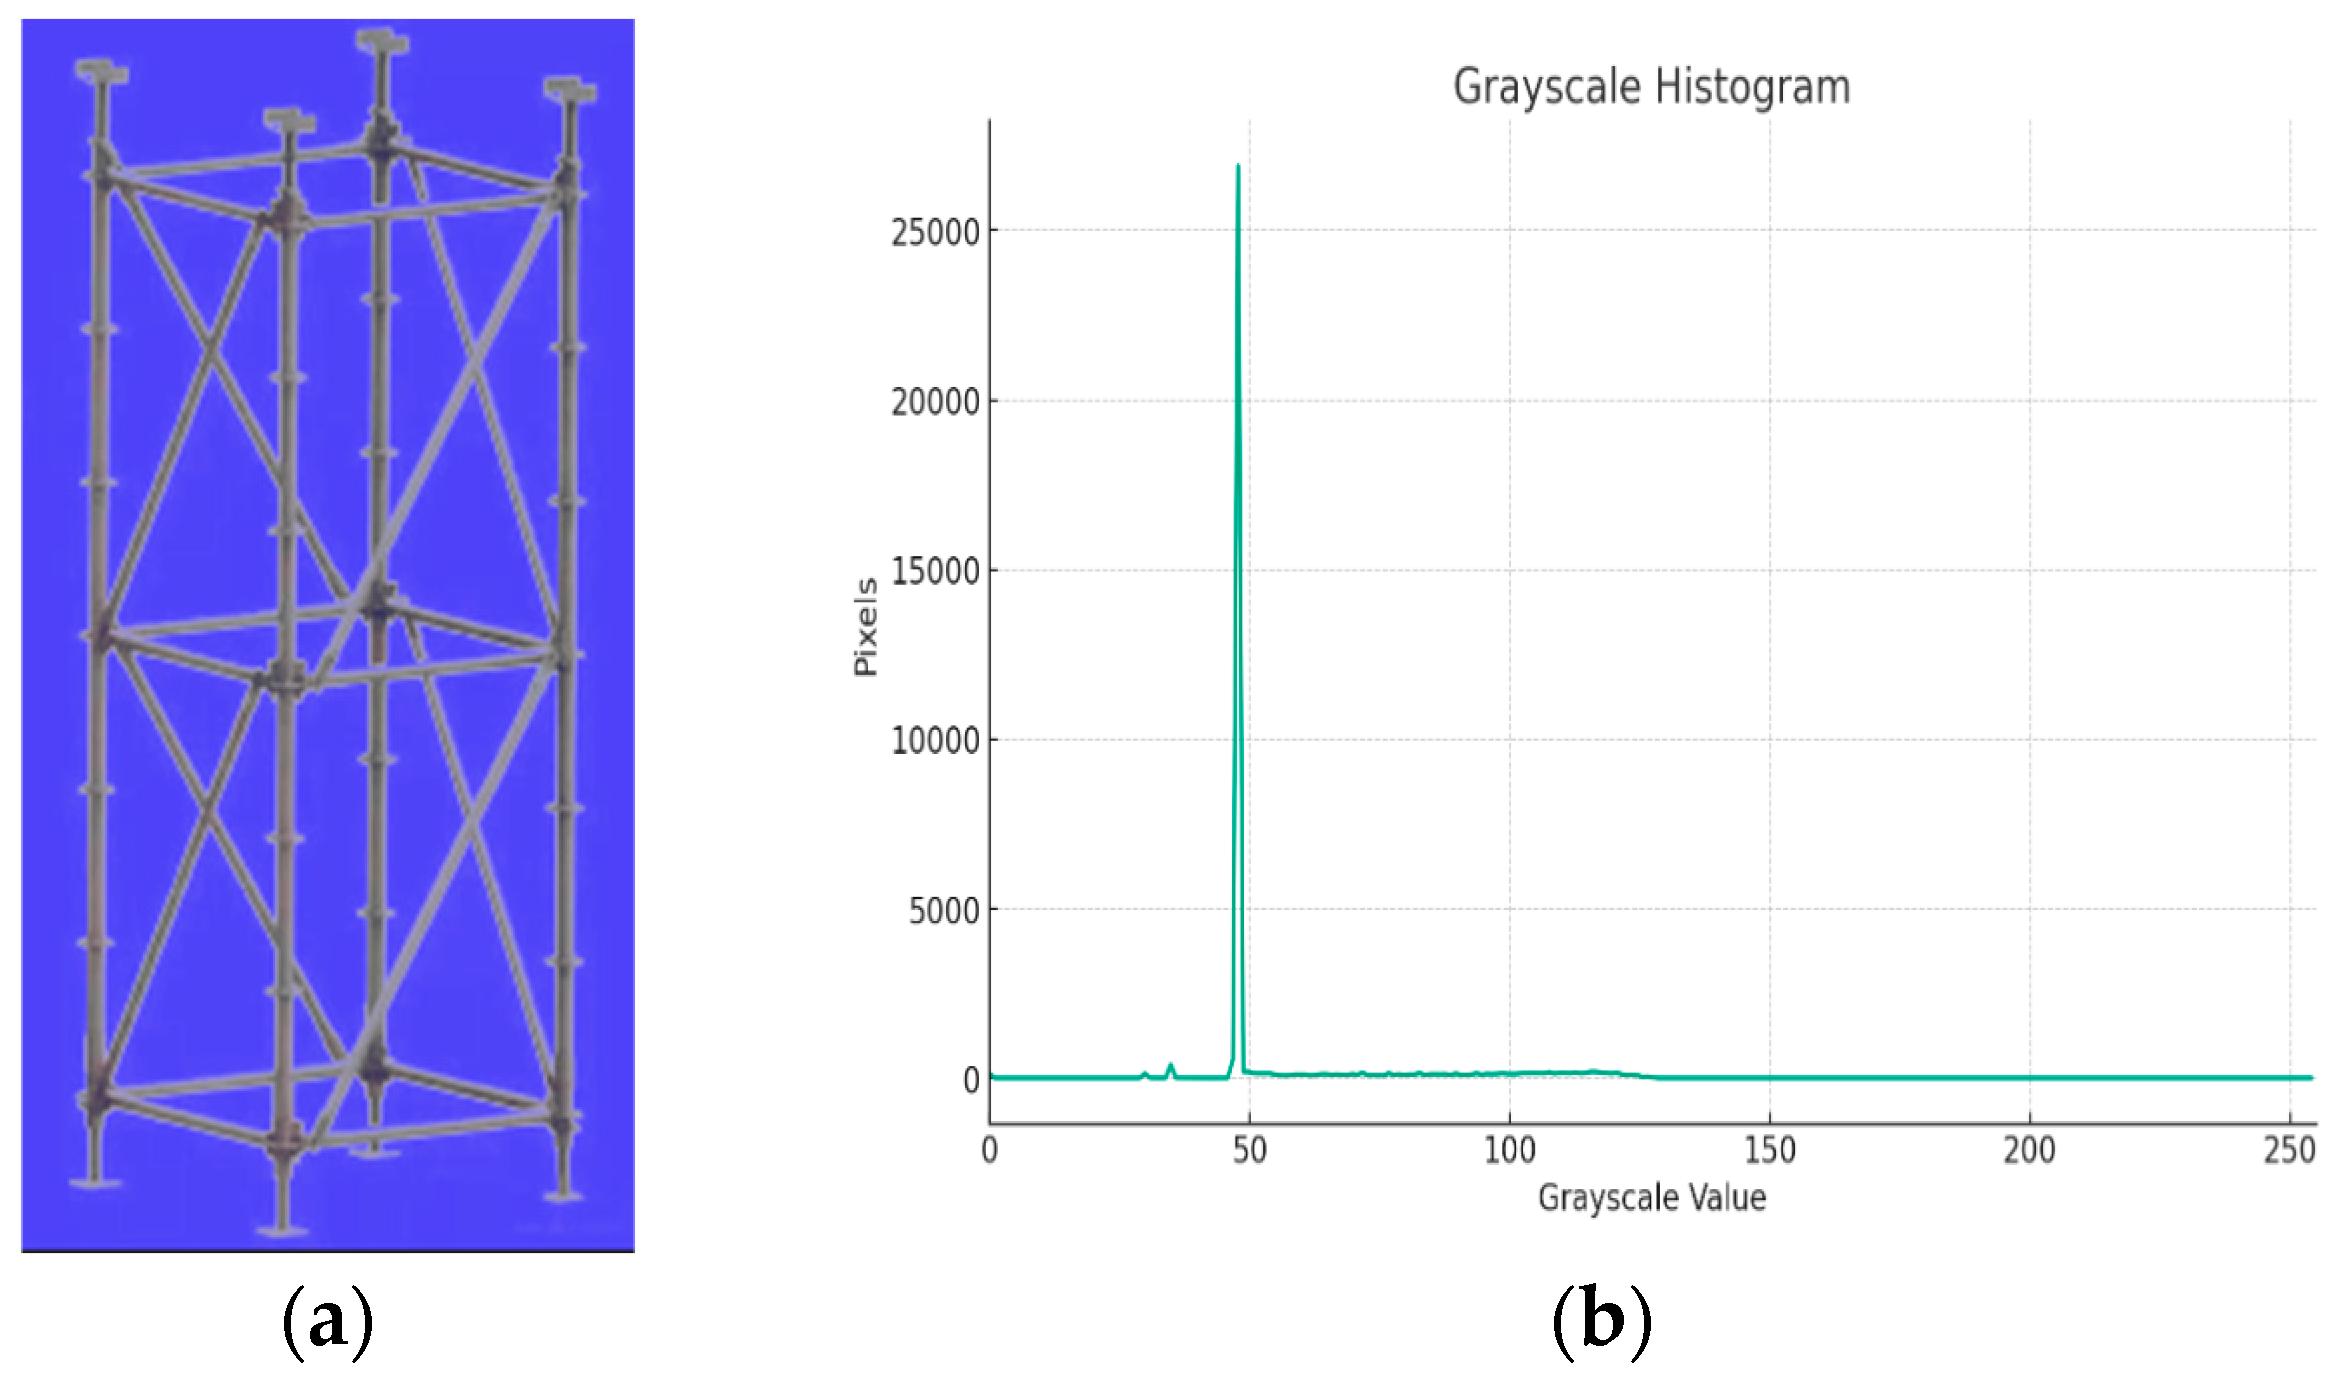
It can be observed from Figure 6 that under the green background, the grayscale values of the main structure of the cuplok scaffold were predominantly distributed in the higher range (approximately 0–50), while those of the background, shadows, and noise were concentrated in the lower range (approximately 100–200). Through repeated testing and validation on training set samples, a grayscale value of 16 was found to most effectively separate background noise. Consequently, the threshold was set at 16, and the grayscale image in Figure 7 was obtained.
Against a blue background:
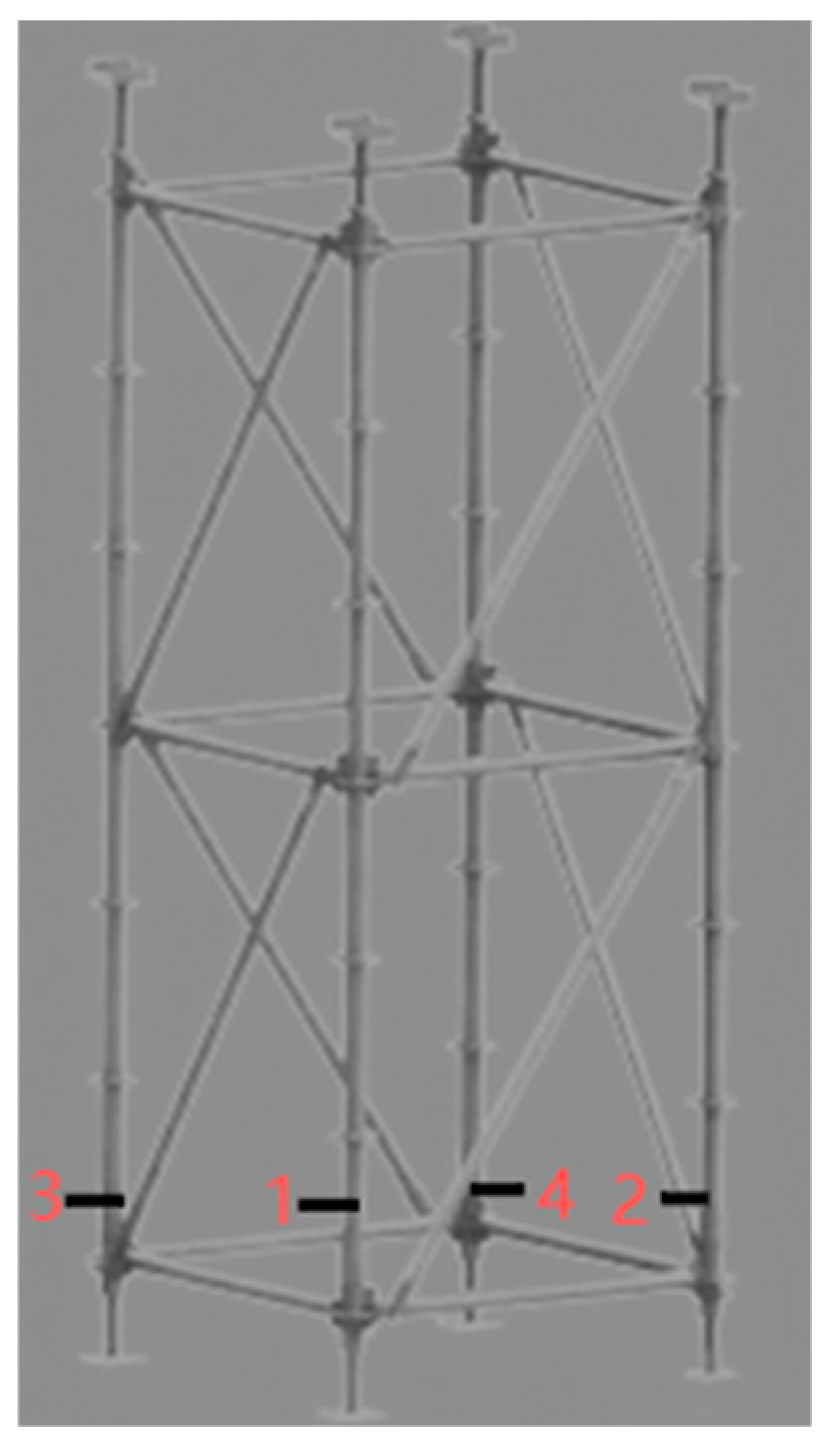
It can be observed from Figure 8 that under the blue background, the grayscale values of the main structure of the cuplok scaffold were predominantly distributed in the higher range (approximately 0–50), while those of the background, shadows, and noise were concentrated in the lower range (approximately 110–200). Through repeated testing and validation on training set samples, a grayscale value of 73 was found to most effectively separate background noise. Consequently, the threshold was set at 73, and the grayscale image shown in Figure 9 was obtained.
As evidenced above, background colors (red, green, blue) systematically introduced grayscale value deviations through the grayscale conversion formula. As experimental results indicated, the same cuplok scaffold exhibited the highest overall grayscale values against a green background, while the lowest values were observed against a blue background. The underlying cause lay in the unequal weighting coefficients assigned to each color component in the standard grayscale conversion algorithm, wherein the green component had a significantly higher weight than the blue component. Consequently, a green background resulted in brighter regions in the grayscale image, which could potentially erode or blur the boundaries with the target object. Conversely, a blue background produced darker regions. Based on the above discussion, experimental results demonstrated that the blue background most effectively enhanced the segmentation robustness when a fixed threshold algorithm was employed.

3.2. Image Feature Analysis and Segmentation Processing

Based on the study of the specific state of the target itself in the previous section and the segmentation processing of it, the irrelevant information in the image background was removed to provide a reliable guarantee for the accuracy of the next step of image recognition.
The image feature analysis method used in this paper was to extract the color moments of the RGB color space of the image. Use 2R/(G + B) as the color factor to determine the size of the color difference between two points [21]. First, a sequence of points on the surface of each structural member was selected. In this study, three point sequences were chosen to acquire the grayscale information of the R, G, and B channels for both the members and their surrounding background. The color factor was subsequently calculated using the formula mentioned above. The specific color information for each member and the corresponding background are presented in Table 1 and Table 2, respectively.
But in reality, structural members were affected by the intensity of light. The brightness level of the image can affect the visibility, edge clarity, and contrast of the target object in the image, and thereby affect the accuracy of target detection, segmentation, and recognition [22]. Therefore, it was necessary to study the segmentation thresholds of structural members under different luminance intensities.
Taking the four members separated above as experimental examples, by changing the variation trends of the color factors of each member under different brightness backgrounds, as shown in Figure 10, it can be known from the following figure:
  • Under the same light brightness and among the background color factor differences of each member, compared with the blue and green backgrounds, the color factor difference under the red background was the largest. It can be seen that for the color of the cuplok scaffold system, when there was a large amount of red in the background, the buckle bracket system was the easiest to distinguish.
  • It can be known from Rod 1, Rod 3, and Rod 4 that as the brightness of the light increases, the color factor difference keeps decreasing and decreases linearly. However, compared with Rod 3, the decrease in amplitude of Rod 1 and Rod 4 was faster. And the color factor difference is lower under the green and blue background; however, against the background of red and blue, member 2 suddenly showed a significant decrease in abruptness. It can be seen that when shooting the rods, a certain distance should be maintained.
  • Under the same light brightness and the same color, the color factor difference between member 1 and member 4 was the largest, while that between member 2 and member 3 was the smallest. Members 1 and 2 were at the closer positions of the image, while members 2 and 3 were further back. It can be concluded that due to the influence of distance, the closer the disk cuplok scaffold members are, the greater the color factor difference, and the easier it is to segment.
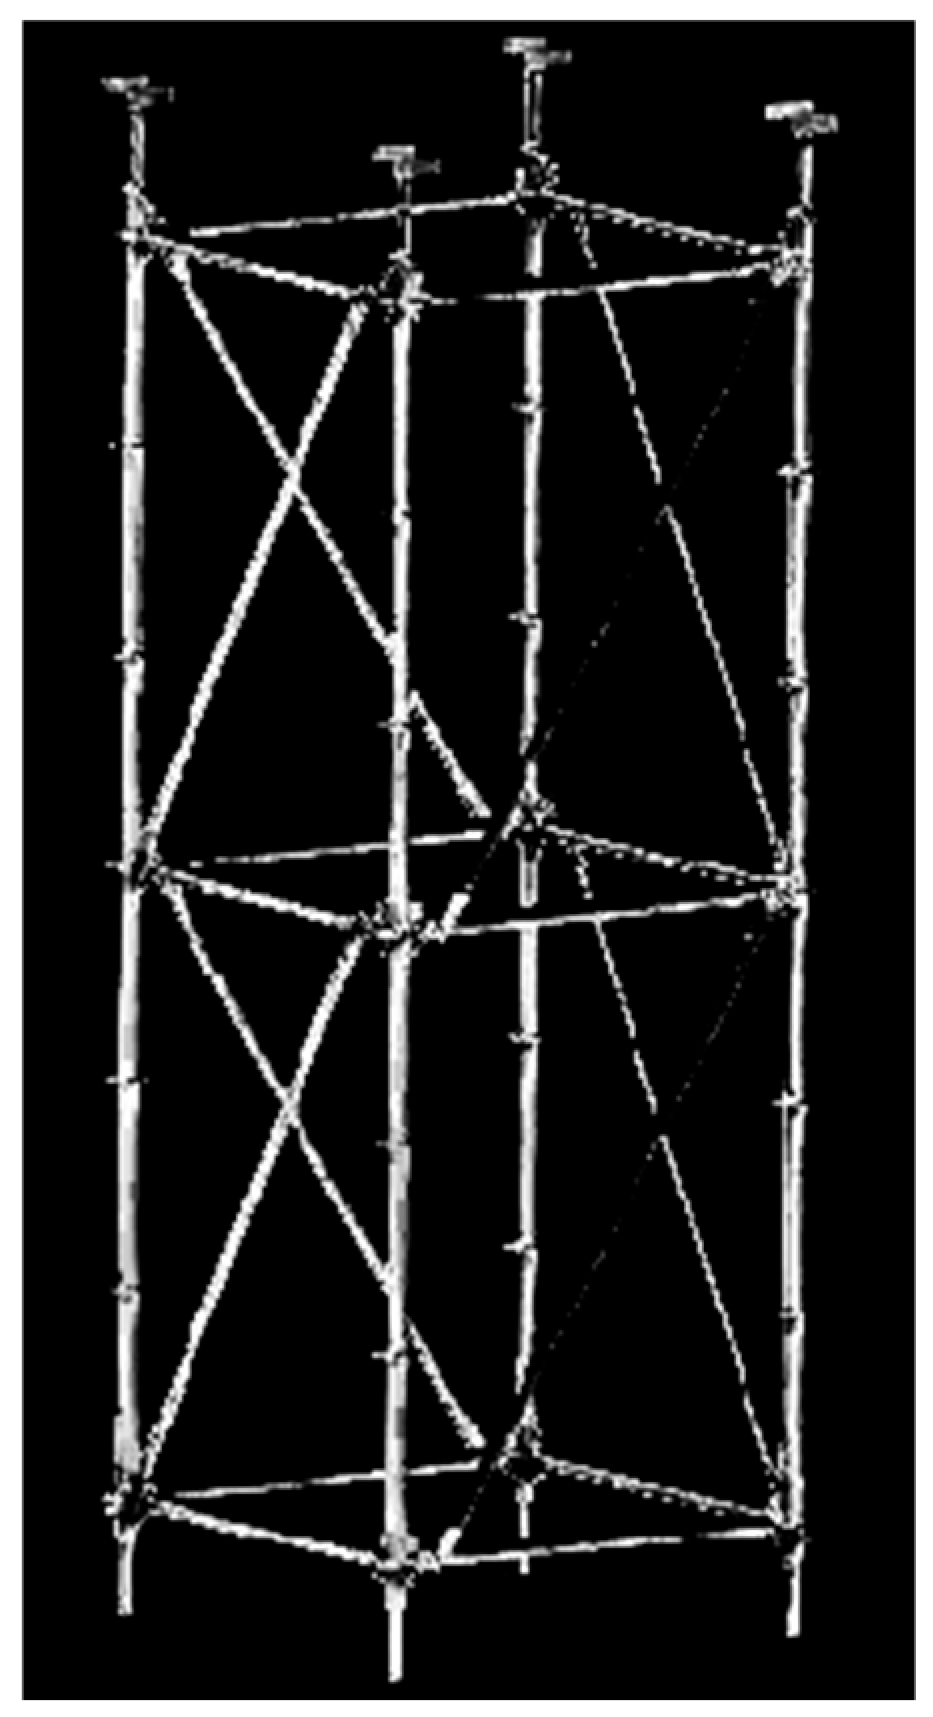
Therefore, through the above analysis, it can be known that after multiple adjustments to the color threshold of the rod, it was found that when the color threshold was set at 178, the segmentation effect of the image was the most ideal. The segmented image of the cuplok scaffold is shown in Figure 11.

3.3. Image Denoising and Morphological Processing

(1) During transmission, the image was susceptible to external noise interference. This degradation compromised image quality and complicated subsequent analysis. Consequently, the application of denoising processing was deemed essential.
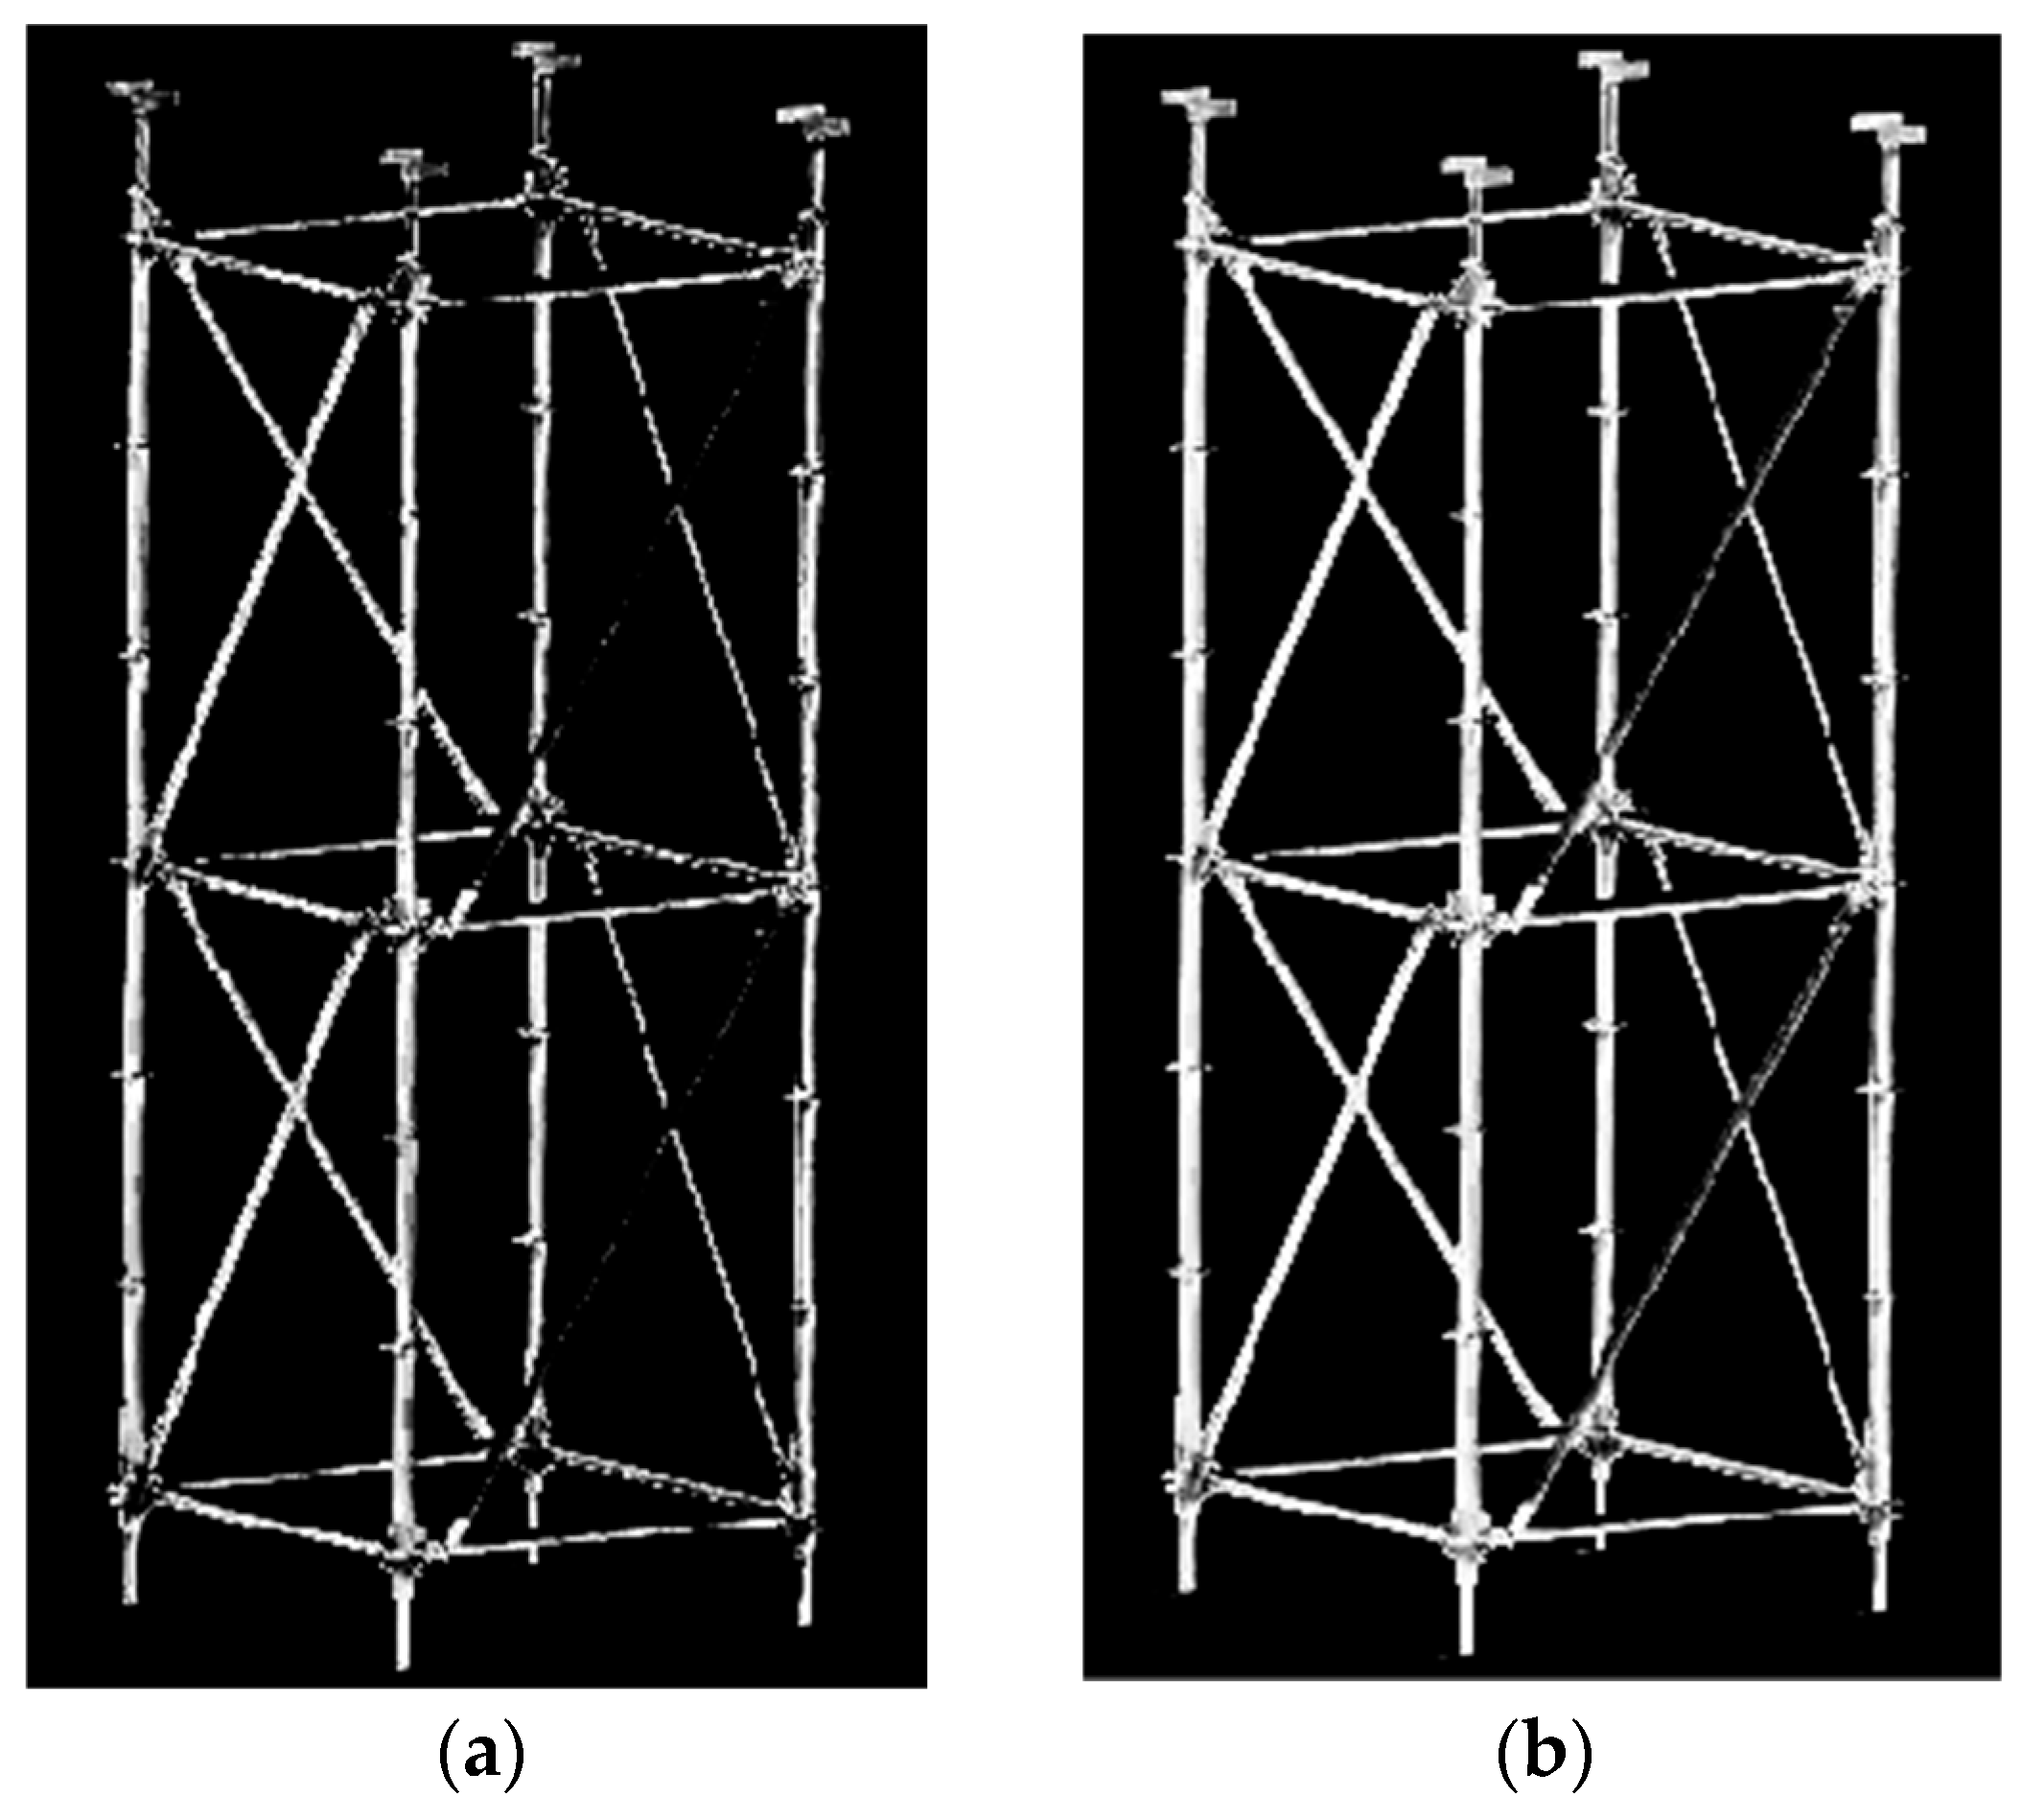
The median filter algorithm, which is a nonlinear image smoothing method capable of preserving edges and suppressing impulse noise, was utilized. To explore the influence of kernel size on denoising, three common templates (3 × 3, 5 × 5, and 7 × 7) were applied to process the segmented cuplok scaffolding system, allowing for an assessment of their effectiveness. The denoising effects of the three median filters with different kernel sizes are shown in Figure 12.
A comparative analysis of Figure 12b–d revealed that while a larger kernel size enhanced denoising capability, the 7 × 7 kernel caused over-smoothing, which eroded the details of the members within the cuplok scaffolding system. The 5 × 5 kernel demonstrated superior performance compared to the 3 × 3 kernel. Observation of the 5 × 5 result indicated that it preserved satisfactory edge smoothness for the scaffolding system. Therefore, the 5 × 5 kernel was selected as the optimal choice for denoising the cuplok scaffolding system images.
(2) Morphological denoising is the basic theory of mathematical morphological image processing [23]. The principle is as follows: Define X as the image to be processed, and Y is used to process X. Then, Y is called the structural element, and the corrosion expression is as follows:
Xe Y = {x|(Y)x ⊆ X}
In the formula, x represents the matrix shift, e is the decay operator, and (Y)x indicates that Y performs an “AND” operation around the corresponding size centered on the pixel point (x, y) based on the value of the pixel point in (Y)x and the value of the pixel point in the original image it covers. If the results of all pixel points are 1, the pixel points that satisfy this situation will be added to the set as the result of corrosion by the structural element Y.
Dilation of the image could fill small holes within the image and expand the external boundaries of target objects, forming a dual relationship with the erosion operation [24]. The principle is as follows: Define X as the image to be processed, and Y is used to process X. Then, Y is called the structural element. The extended expression is as follows:
X⊕Y = {x|(Yv)x ∩ X ≠ ∅}
In the formula, the image to be processed is X, the structural element is Y, ⊕ is the spread operator, and Yv is the set of reflections of Y with respect to the origin.
The process of the opening operation of an image is to perform the erosion operation on the image to be processed first, and then run the expansion operation. The closing operation and the opening operation of an image are the opposite [25]. The processed results obtained through the morphological image algorithm are presented in Figure 13.

3.4. Image Transformation Processing

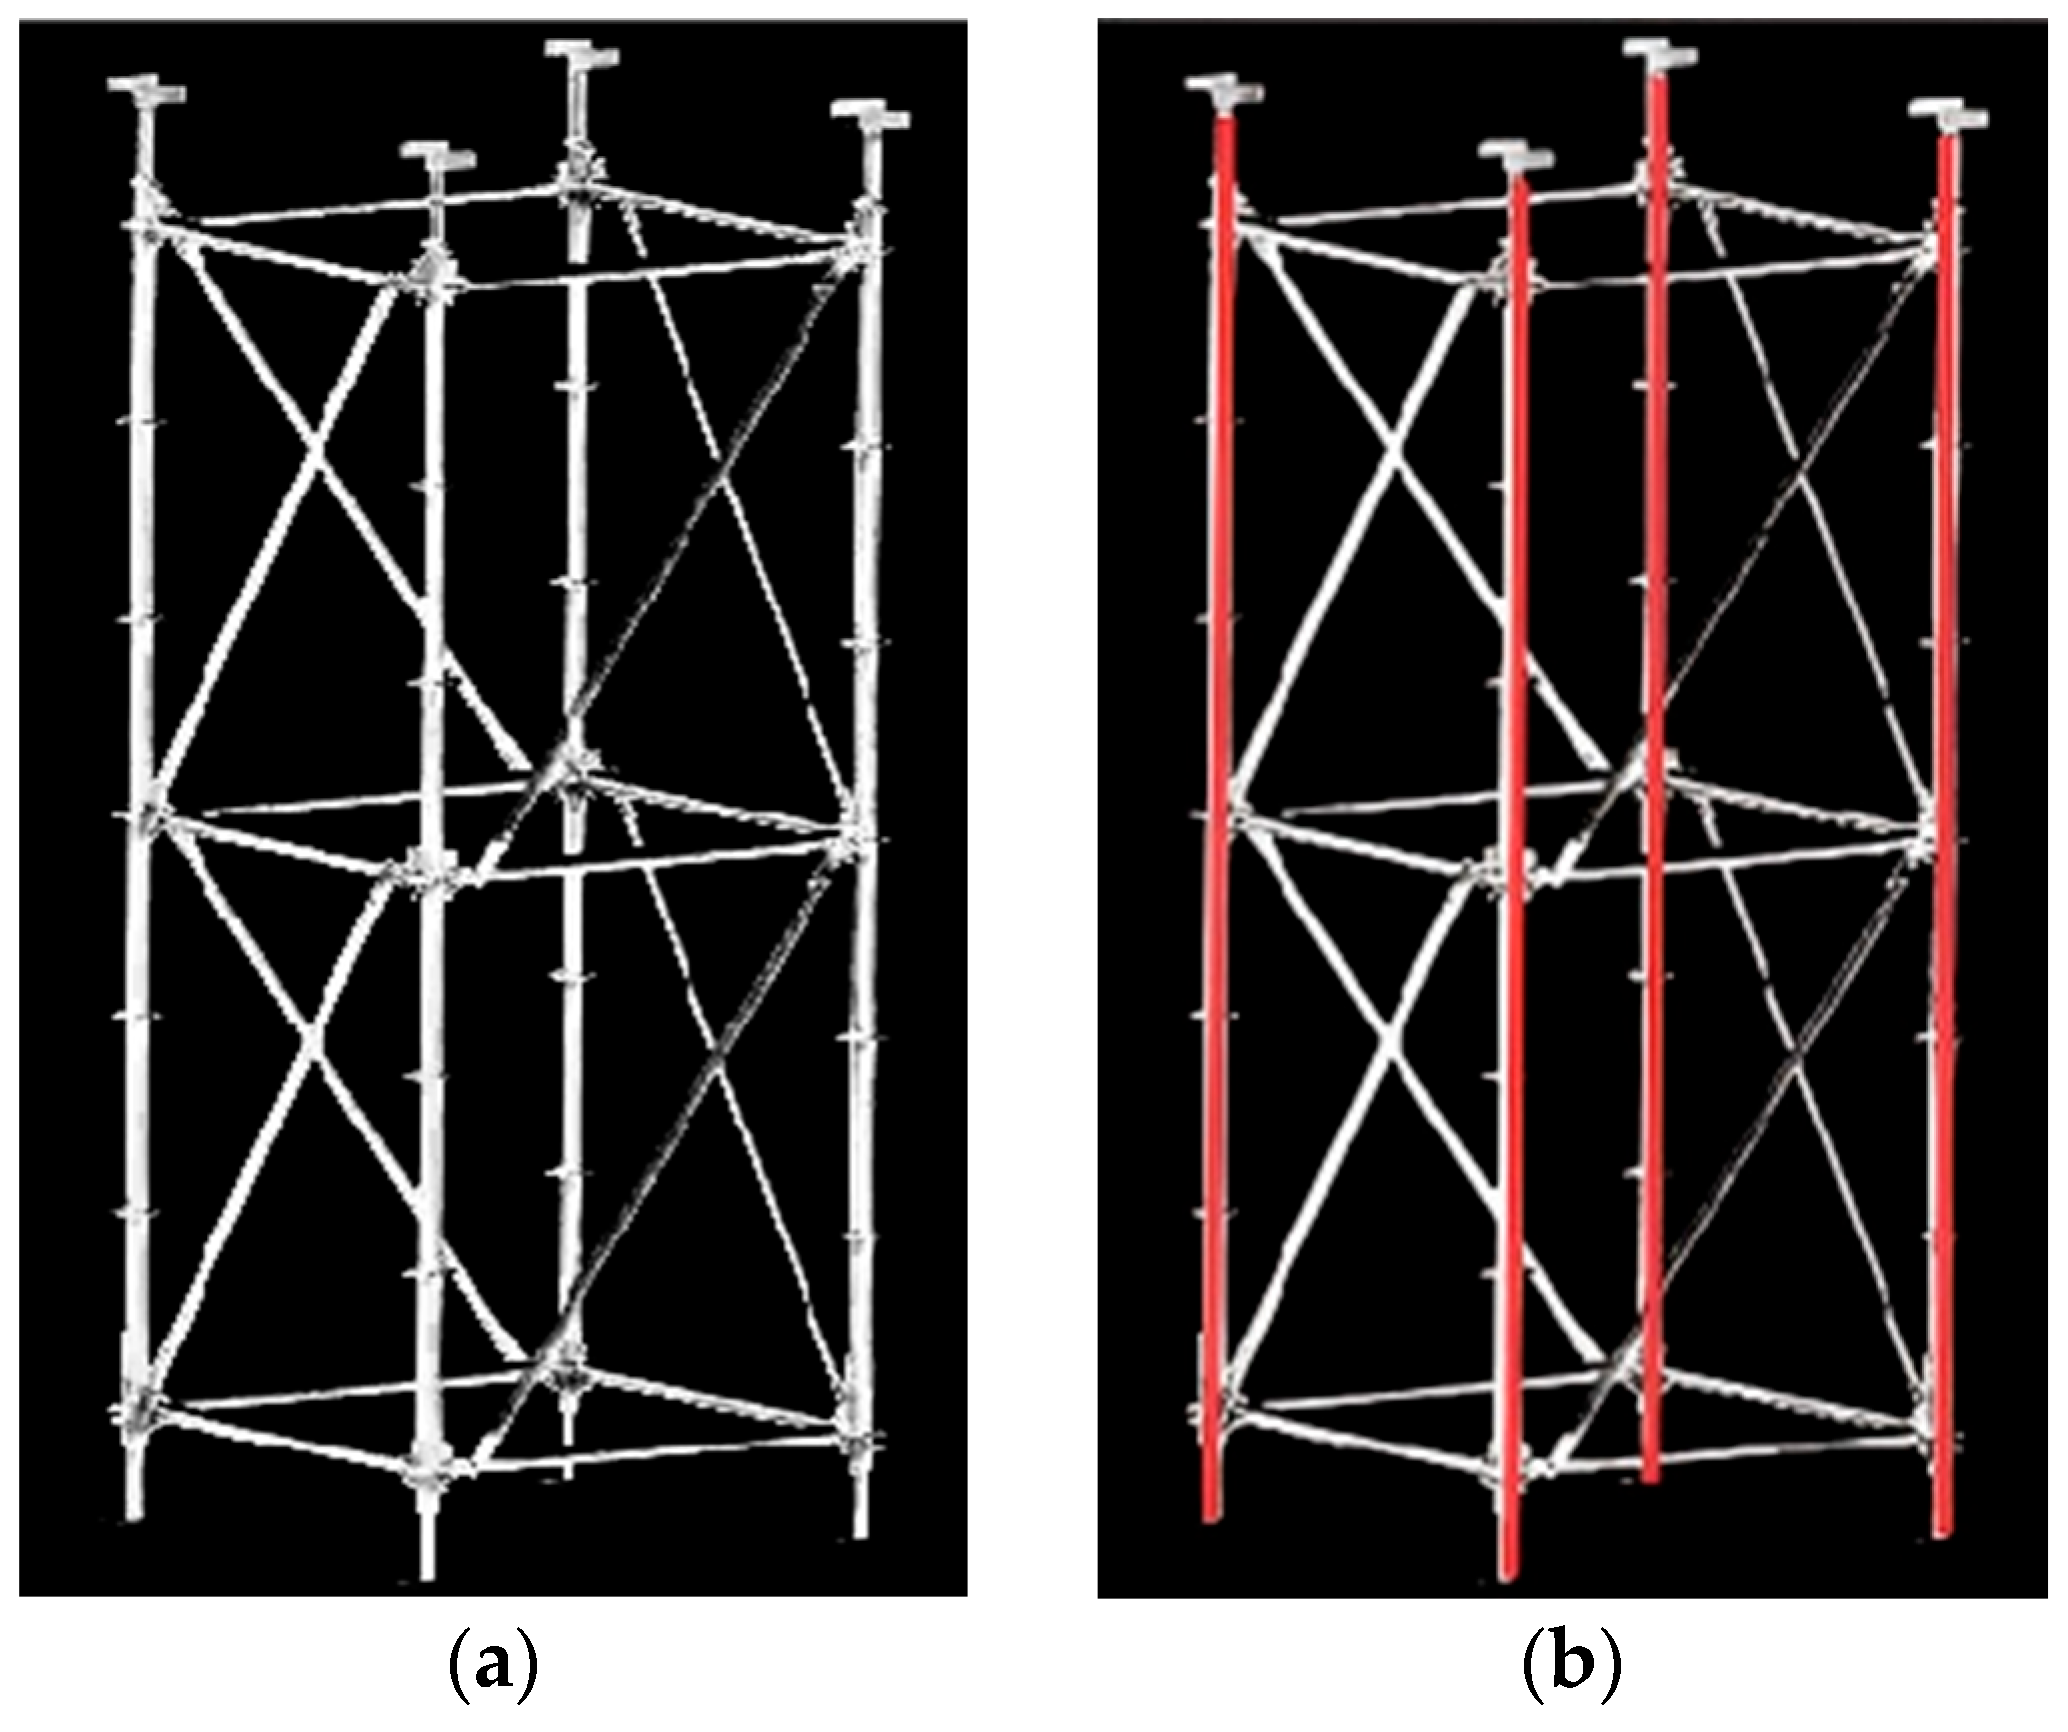
After image segmentation, the cuplok scaffold system has been completely segmented. However, this image is only a connected domain image and cannot reflect the unique properties of the cuplok scaffold system [26]. Frequently used spatial domain transform methods include the Fourier transform, Radon transform, and Hough transform. In order to investigate the detection accuracy of each algorithm for the cuplok scaffolding, this study employed these three algorithms to evaluate their detection performance. For this study, 50 images of the cuplok scaffolding acquired under identical conditions were utilized. Representative detection results from the three algorithms, randomly selected from the dataset, are presented in Figure 14.
Comparative analysis from Figure 14 yielded three main findings. First, under identical conditions, the Hough Transform algorithm detected the vertical members most completely and accurately, whereas the other two algorithms resulted in incomplete detection or false positives, indicating the superior precision of the Hough Transform. Second, the Hough Transform demonstrated stronger robustness against noise and partial occlusions; it could accurately detect vertical members as long as sufficient edge points were present. In contrast, the Fourier transform required high overall image quality, and the Radon transform was prone to errors when edges were blurred. Finally, the inherent mechanism of the Hough transform, which detects linear features directly via parameter space accumulation, provided a distinct advantage for vertical member detection. Consequently, the Hough transform algorithm was determined to be more effective for this application.

3.5. Discrete and Integrated Processing of Vertical Rods

The edge of the cuplok scaffold can be obtained by grayscale conversion, edge detection, and Hough line detection of the disk buckle bracket image, that is, the segmentation of the cuplok scaffold system can be carried out. The safety of the cuplok scaffold mainly lies in the stability of the vertical members. Therefore, the vertical members also need to be extracted for the determination of safety performance.
For the discretization of vertical rods, the algorithm of morphological erosion is adopted. That is, first select a suitable convolution kernel, multiply the elements in the convolution kernel by the corresponding pixel values in the bracket image region, and accumulate the results. During each convolution operation, align the center of the convolution kernel with each pixel point of the image, calculate the convolution result, and assign it to the pixel at the corresponding position of the image [27].
Algorithm: Create an m × 1 convolution kernel with a size of (11, 1), that is, a small matrix with a height of 11 and a width of 1 pixel. Scan the convolution kernel from top to bottom. When the 0-pixel area completely overlaps with the convolution kernel, it is retained; otherwise, it is deleted. Therefore, the vertical direction will be retained. The parameter “iterations” = 1, that is, the number of corrosions is 1.
As shown in Figure 15, by performing structured local operations on the vertical members in the image of the cuplok scaffold system, the boundaries of the cuplok scaffold system are corroded inward, thereby eliminating or reducing the dimensions of the inclined and horizontal members and separating the contact areas between the vertical and other members. However, there is a phenomenon of disconnection in the image of the structural members after corrosion. Therefore, fine processing is required. Connect the disconnected target.
The vertical bar integration adopts the morphological dilation algorithm, that is, the elements in the convolution kernel are multiplied by the corresponding pixel values in the bracket image region, and the results are accumulated. During each convolution operation, the center of the convolution kernel is aligned with each pixel point of the image, and the convolution result is calculated and assigned to the pixel at the corresponding position of the image.
Algorithm: Here, we introduce another convolution kernel. The size of the convolution kernel is (11, 1), that is, a small matrix with a height of 11 and a width of 1 pixel. The convolution kernel scans from top to bottom. When there are 0-pixel regions at both ends of the convolution kernel, they are connected. Therefore, they will be connected vertically.
As shown in Figure 16, when the boundary of the cuplok scaffold system is expanded inward to connect the contact area where the vertical members are disconnected, the integration effect of the vertical members is very good. However, at the connection point of the disk buckle support, due to the influence of the bolts, there are relatively large burrs.
Therefore, a convolution kernel is further introduced. The size of the convolution kernel is (1, 78), that is, a small pixel matrix with a height of 1 and a width of 78. Among them, the width 78 is the diameter size in the binarized image of the cuplok scaffold. The convolution kernel scans from top to bottom. When encountering a 0-pixel area, if the transverse pixels are less than 78, it continues to run. When the transverse pixels are greater than 78, it is refined to 78.
As shown in Figure 17, the boundary of the cuplok scaffold system is refined inward, thus keeping the bracket members uniform.

4. Linearization of the Image of the Cuplok Scaffold

Following a series of processing operations applied to the aforementioned images, the image information became notably clearer and more distinct. However, when performing similarity matching between structural members, the complexity of their shapes often hindered accurate matching of two complete structural components. To address this issue, linearization of the structural members was required. The linearization process consisted of image binarization, external contour recognition, contour tracing, and shape fitting. This procedure preserved only the essential features of the target structural members while eliminating redundant or unnecessary characteristics, thereby enhancing the matching speed and efficiency for the subsequently established safety evaluation criteria of the members.

4.1. Image Binarization Processing

The contour detection algorithms [28] used in outer contour recognition are usually based on edge detection or binarized images. Therefore, the image needs to be transformed into a binary graph. Binarization processing can convert an image into black and white, thereby making the outline clearer and more prominent.
In the software OPEN CV4.10.0, the binarized function is cv. threshold.
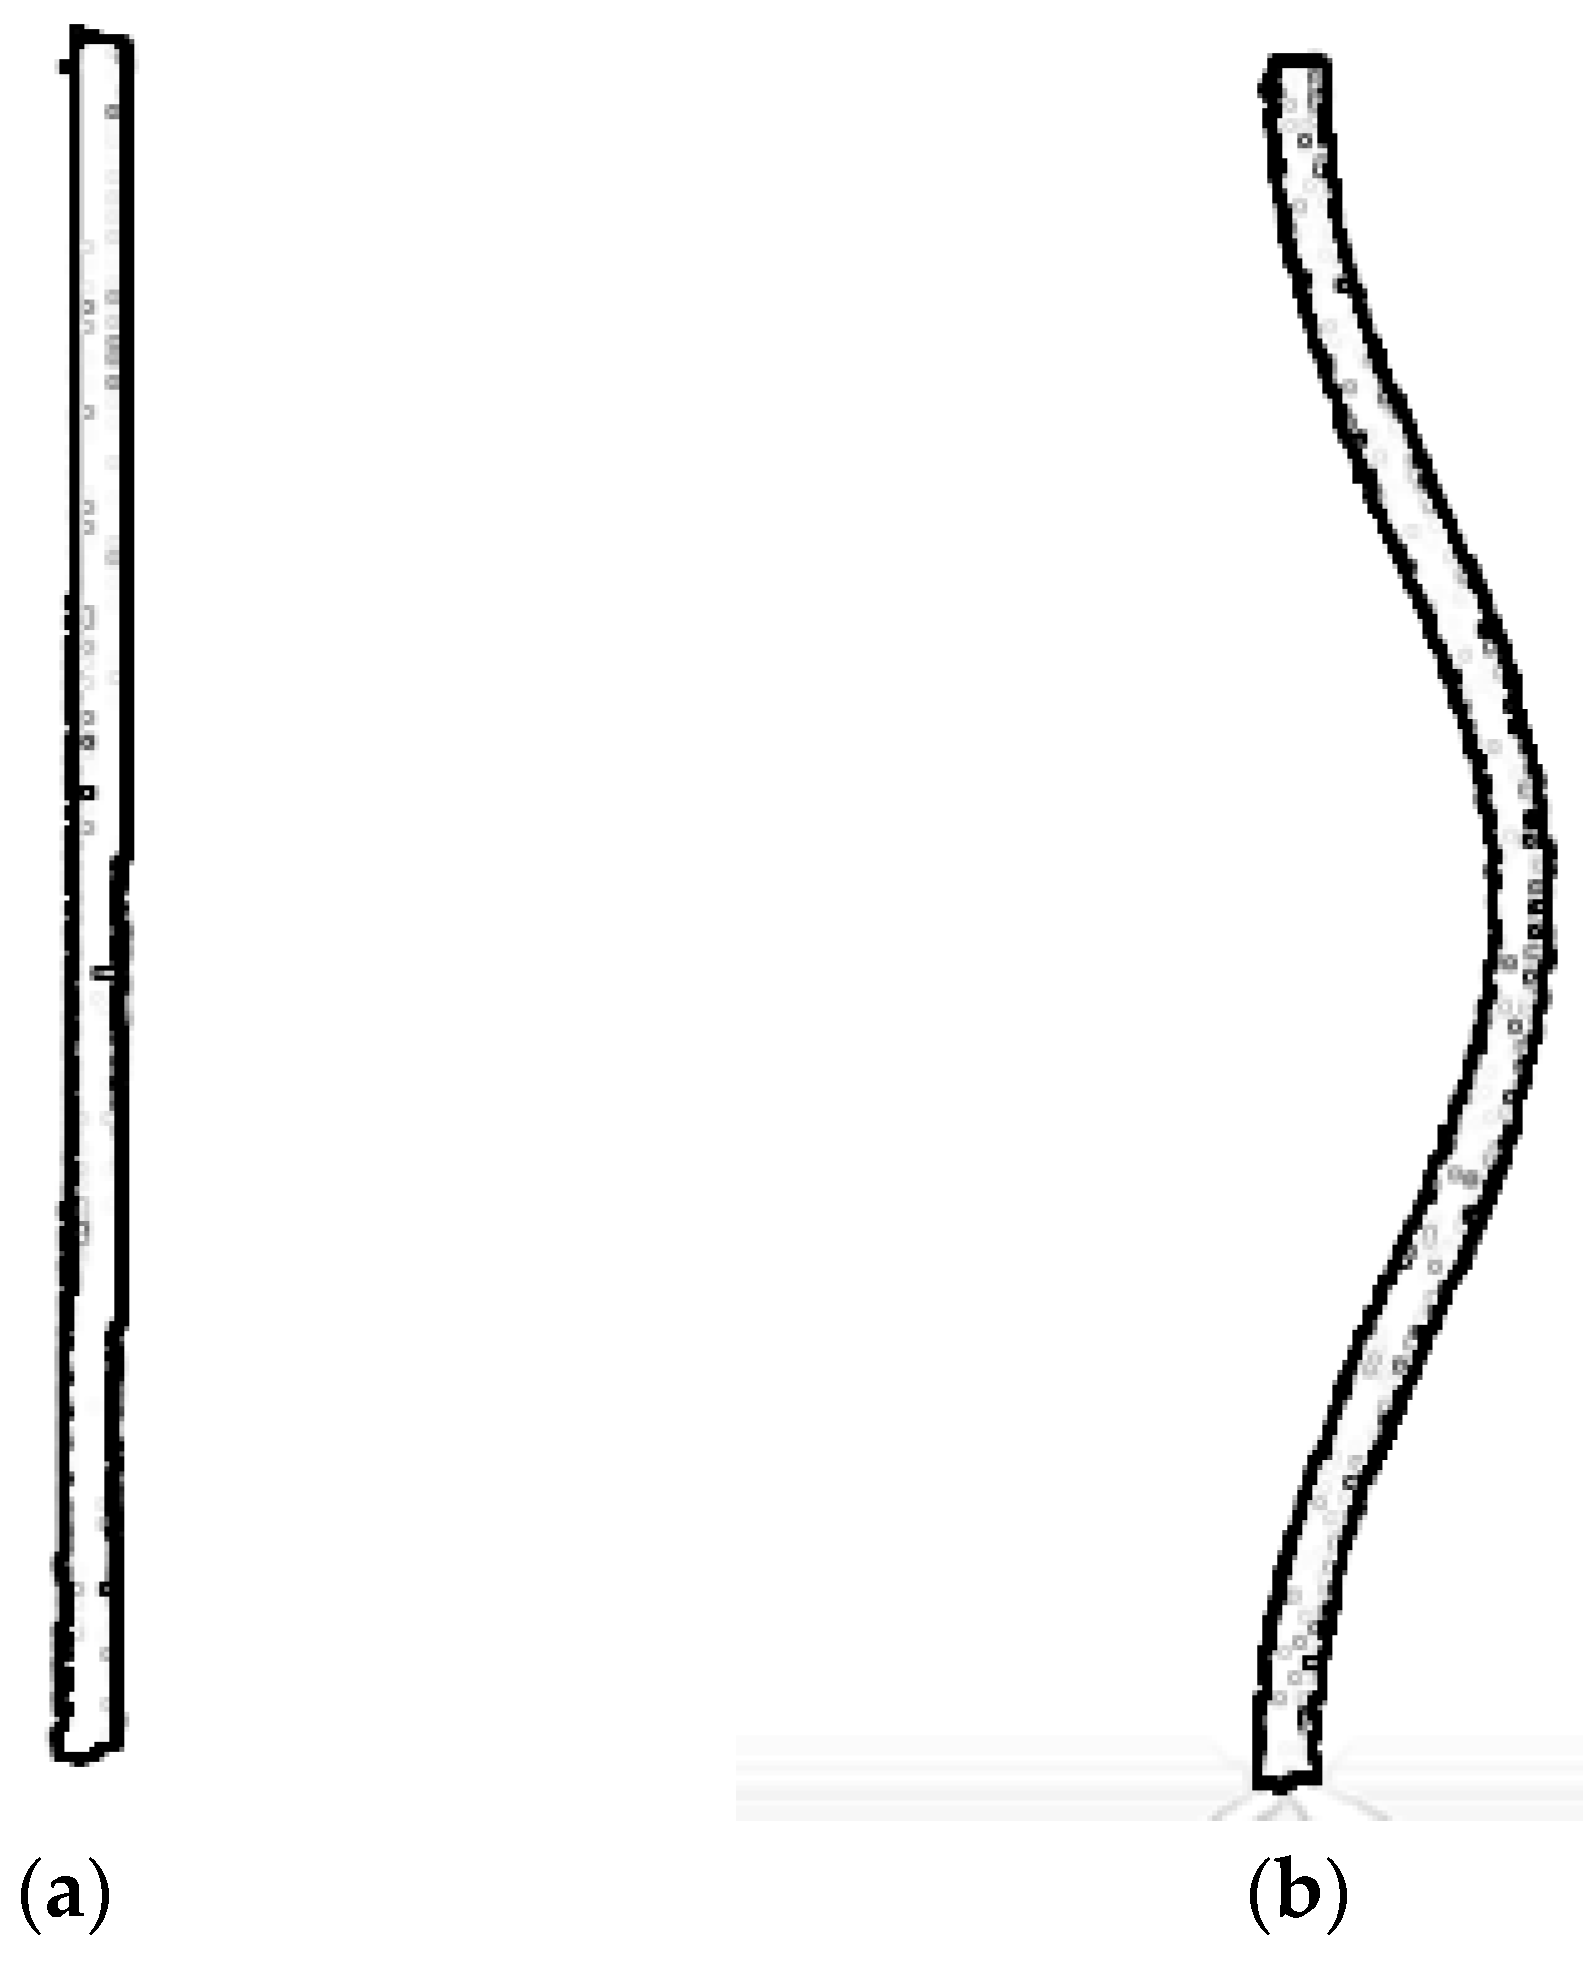
The raw images of the straight and curved bars were initially loaded as shown in Figure 18. After multiple threshold segmentation adjustments, the binarized image effects of the straight bar and curved bar structural members are shown in Figure 19. The best effect is achieved when the image color threshold is set to 155. Therefore, before searching for the outer contour of structural members, it may be disturbed by the grayscale image information, affecting the effect of outer contour detection. However, after binarization processing, these interferences can be effectively eliminated, thereby improving the stability and accuracy of outer contour detection of structural members.

4.2. Extraction of Outer Contour

The outer contour of the structural members is extracted by using OPEN CV. Firstly, the binarized image needs to be imported. Then, the outer contour edge detection of the structural members is carried out by using the cv. find Contours function. After detecting the outer contour, the outer contour is drawn through the cv. draw Contours function. Finally, the extraction result of the outer contour is displayed through the function cv. imshow.
After the contour of the support member is obtained, the outer contour of the structural member is drawn using Open cv, and the drawing function of the outer contour is cv draw contours. As shown in Figure 20, after the outer contour is drawn, the edges of the detected structural members are connected with lines or curves to form the shape of the structural members, and the edges of the structural members are smoother.

4.3. Based on Open Cv Numerical Curve Fitting

In order to obtain the function curve of the deformation of the member, by extracting the above outer contour and calculating the average value of the transverse X-axis pixel points, the function curve that retains only its curvature and the ratio of the major axis to the curvature is obtained.
Firstly, the re-sampling of the contour curve is carried out. In the structural member curve, the long axis part is selected for curve sampling at equal intervals. Twenty sampling points are taken, and their coordinate positions are recorded as the basis for contour curve fitting.
The least square method can be used for curve fitting [29]. It requires that the sum of the squares of the differences between y and f(x) in the sample points be minimized. Its formula is
φ 1 , φ k a 1 + φ 2 , φ k a 2 + Δ + φ n , φ k a n = f , φ k   k = 1 , 2 , , n
In the formula: f(x) is the fitting function of the curve; α is an undetermined coefficient; and Φ is a family of linearly independent functions. Given the shape, it can be well fitted through a second-order polynomial model, so it is taken as
0.92 , 93 = 1 , x , x 2
Taking 20 sampling points as the fitting points, according to the least square method of the formula, solve for three unknown coefficients, among them a1, a2, and a3. Then, the equation of the elliptic curve can be obtained as
y = f x = 0.0161 x 2 + 0.9833 x + 164.7
The corresponding function graph is shown in Figure 21.
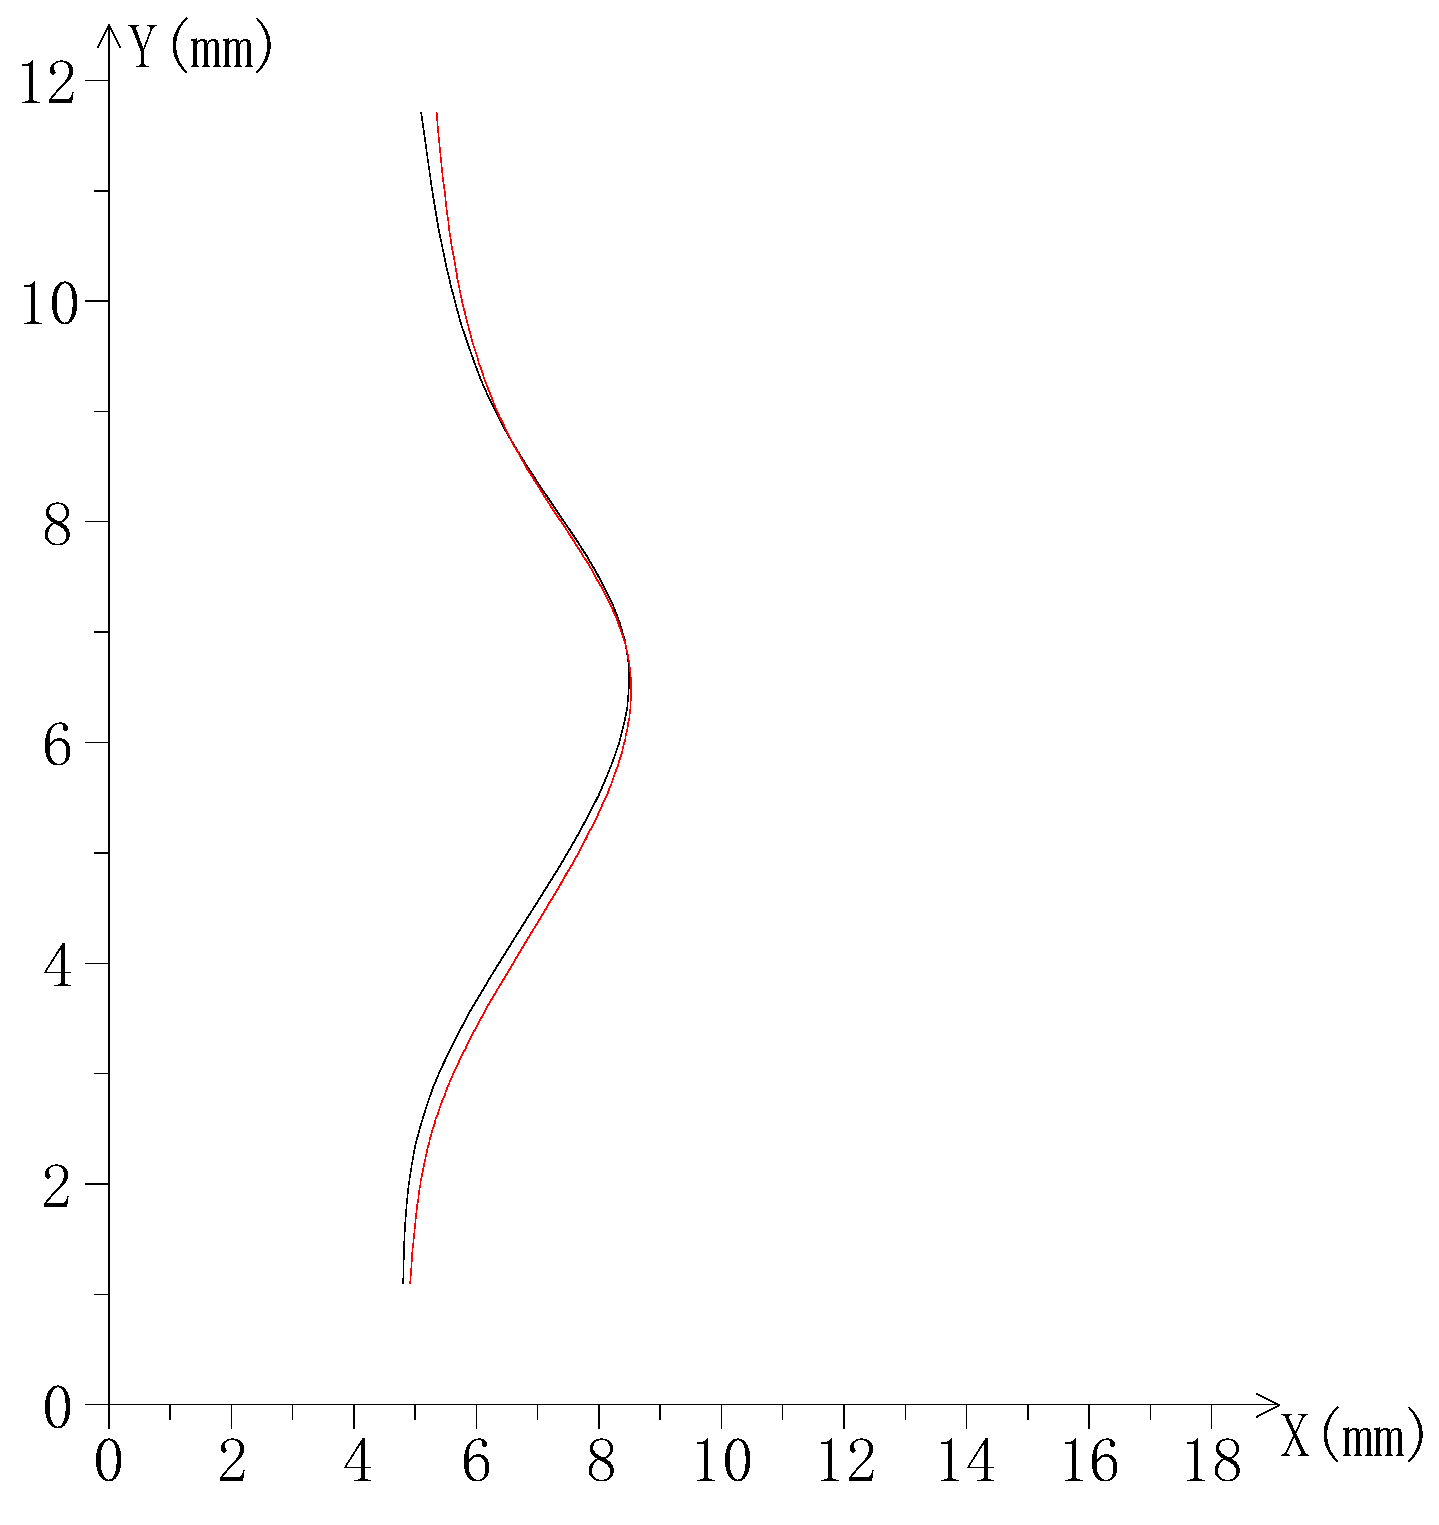
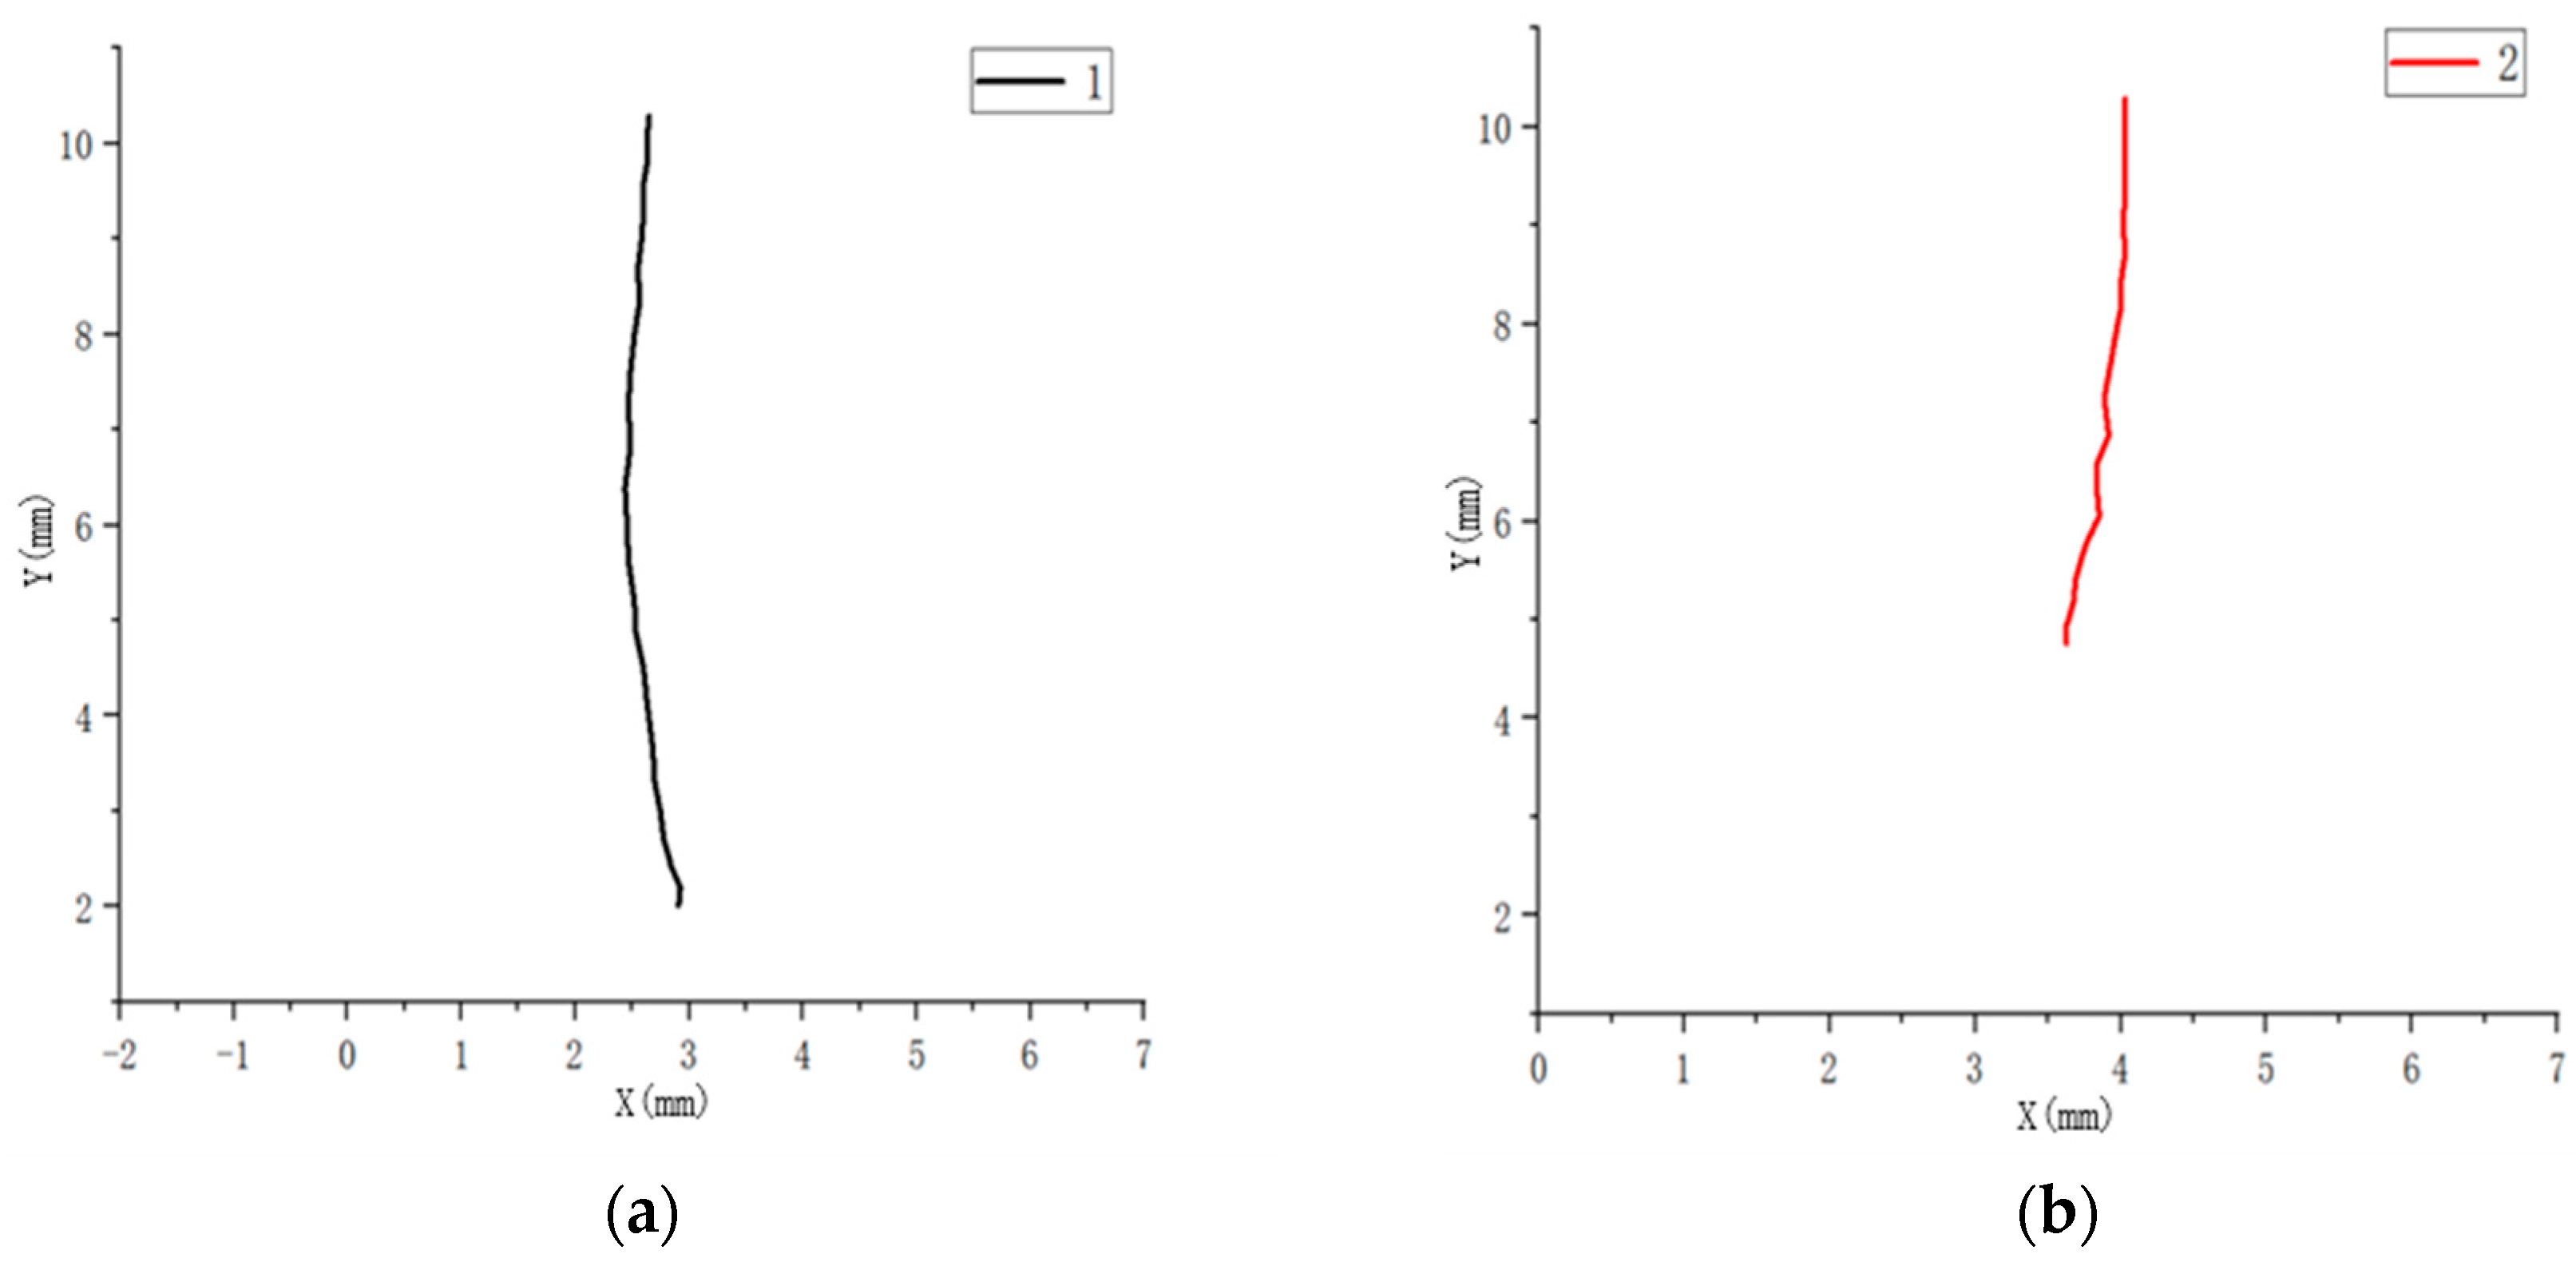
To validate the correctness of the curved fitting, a comparative analysis was conducted between the conventional Zhang–Suen algorithm [30] and the proposed algorithm. The resulting comparative curves are illustrated in Figure 22.
As shown in Figure 22, the red curve represents the result refined by the Zhang–Suen algorithm, while the black curve was obtained through outer contour fitting. The two curves were essentially coincident in the section above the maximum average bending point. Below this point, however, a divergence emerged, with the horizontal coordinate discrepancy between the two curves gradually increasing toward the lower portion of the linear structural member. As the bottom of the member was approached, the contour-fitted curve exhibited a tendency to converge toward the linearized result based on the Zhang–Suen algorithm, and ultimately realigned almost completely at the lowest section.
Therefore, it could be concluded that the numerical curve derived from the outer contour-based fitting method demonstrated fundamental consistency with that obtained through the traditional thinning method using binarized images.

5. The Image Safety Determination Criterion of the Cuplok Scaffold Is Established

Based on a series of processing and linearization fitting of the above images, this section proposes a safety performance determination method for the cuplok scaffold, establishes the determination equation, and finally defines the evaluation criteria for the safety of linear structure members to achieve rapid and efficient detection of the safety performance of the cuplok scaffold.

The Safety Determination Criterion Based on Bending Energy Is Established

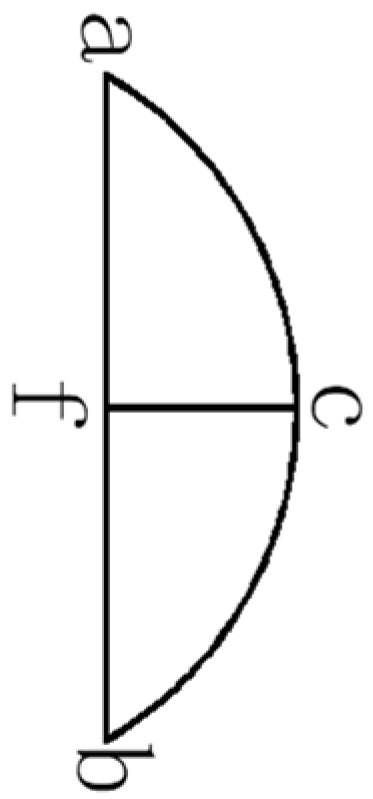
After the above-mentioned rods are fitted, similarity matching is carried out. The identified images and the numerical simulation images are matched, respectively, from the following three aspects: 1. Number of curve bends; 2. The ratio of arc length to major axis; and 3. The ratio of the radius of curvature of the coordinate point to the major axis. The schematic diagram of the curvature representation principle is shown in Figure 23.
1.
The number of curve bends ( Δ 1 ).
The contour curve of the entire structural member contains a certain degree of bending variation, and the curvature of the contour can reflect the characteristics of its curve. Determine whether the curve has bent by calculating the included angles of three adjacent points. The included Angle can be calculated using the included Angle between vectors, and its calculation method can be the dot product or the cross product. Make a choice based on specific needs. If the included Angle is less than the threshold of 180 degrees, it is considered that a bend has occurred.
Δ 1 = θ
θ = cos 1 A · B A B
2.
The ratio of arc length to major axis ( Δ 2 ).
The arc length refers to the arc length of the bending part of the structural member, and the arc length is taken as the sum of the coordinate distances of adjacent pixel points.
Δ 2 = F x a x
b = y x 1 y x 2
l = x 1 + x 2 + x 3 +
F x 1 = l / b
x 1 = l i / b i
In the formula:
l —Arc length of image curve
l i —Numerical simulation of arc length
b —The long axis of the image
b i —Numerical simulation of the long axis
Δ —The arc length is worse than the long axis
3.
The ratio of the radius of curvature of the coordinate point to the major axis.
This reflects the similarity degree of curvature characteristics between the numerical curve of the deformed support and the buckling mode curve calculated by the model example.
Δ 3 = F x 2 a x 2
ζ = 1 k
f x = 0.0161 x 2 + 0.9833 x + 164.7
F x 2 = ζ 1 b
a x 2 = ζ 2 b i
In the formula:
ζ 1 —The curvature radius of the image
ζ 2 —Numerical simulation of the curvature radius
b —The long axis of the image
b i —Numerical simulation of the long axis
Δ —The ratio difference between the radius of curvature of the coordinate point and the major axis
The above three features represent the information of the complete curve and thus can be used as the basis for bracket feature matching.
In order to reduce the computational load of image matching in the later stage, a limited number of points is adopted for security determination. Considering the different characteristics of the buckling modes of each order of the structural members and the manifestation of the bending energy of the curve, while also saving the calculation time, it is most appropriate to select 20 sampling points for the curve at equal intervals. Take 20 sampling points, record their coordinate positions, and use them as the basis points for curve alignment.
  • First, calculate the bending times of the identified structural members and the contour curves of the numerical model, respectively, and then compare them.
    When Δ 1 i < 180 ° , i = 1 , 2 , 3 , 20 , this point is considered to have experienced a bend;
    When 80% of the points (namely16 points) are successfully matched, it is considered that the number of curve bends is successfully matched.
  • Next, the identified bracket poles and the contour curves of the model examples are matched for the second feature. When the relative error between the two is less than 10%, it is considered that the characteristic value of the ratio of the arc length to the major axis of the two is successfully matched.
    When Δ 2 i a x 2 i < 10 % , i = 1 , 2 , 3 , . , 20 , it is considered that this point matches successfully;
    When 80% of the points (namely 16 points) are successfully matched, it is considered that the number of curve bends is successfully matched.
  • The comparison of the curvature radius and the ratio of the major axis of the contour curves of the identified support poles and model examples. When at least 80% of the coordinate points satisfy a relative error of less than 10%, the feature matching is considered successful.
    When Δ 3 i a x 3 i < 10 % , i = 1 , 2 , 3 , . , 20 , it is considered that this point matches successfully.
    When 80% of the points (i.e., 16 points) are successfully matched, it is considered that the number of curve bends is successfully matched. When the matching of the three features is successful, the corresponding recognition of the numerical curve of the identified deformed support and the buckling mode calculated by the model example is achieved.

6. Image Case and Result Analysis of Cuplok Scaffold

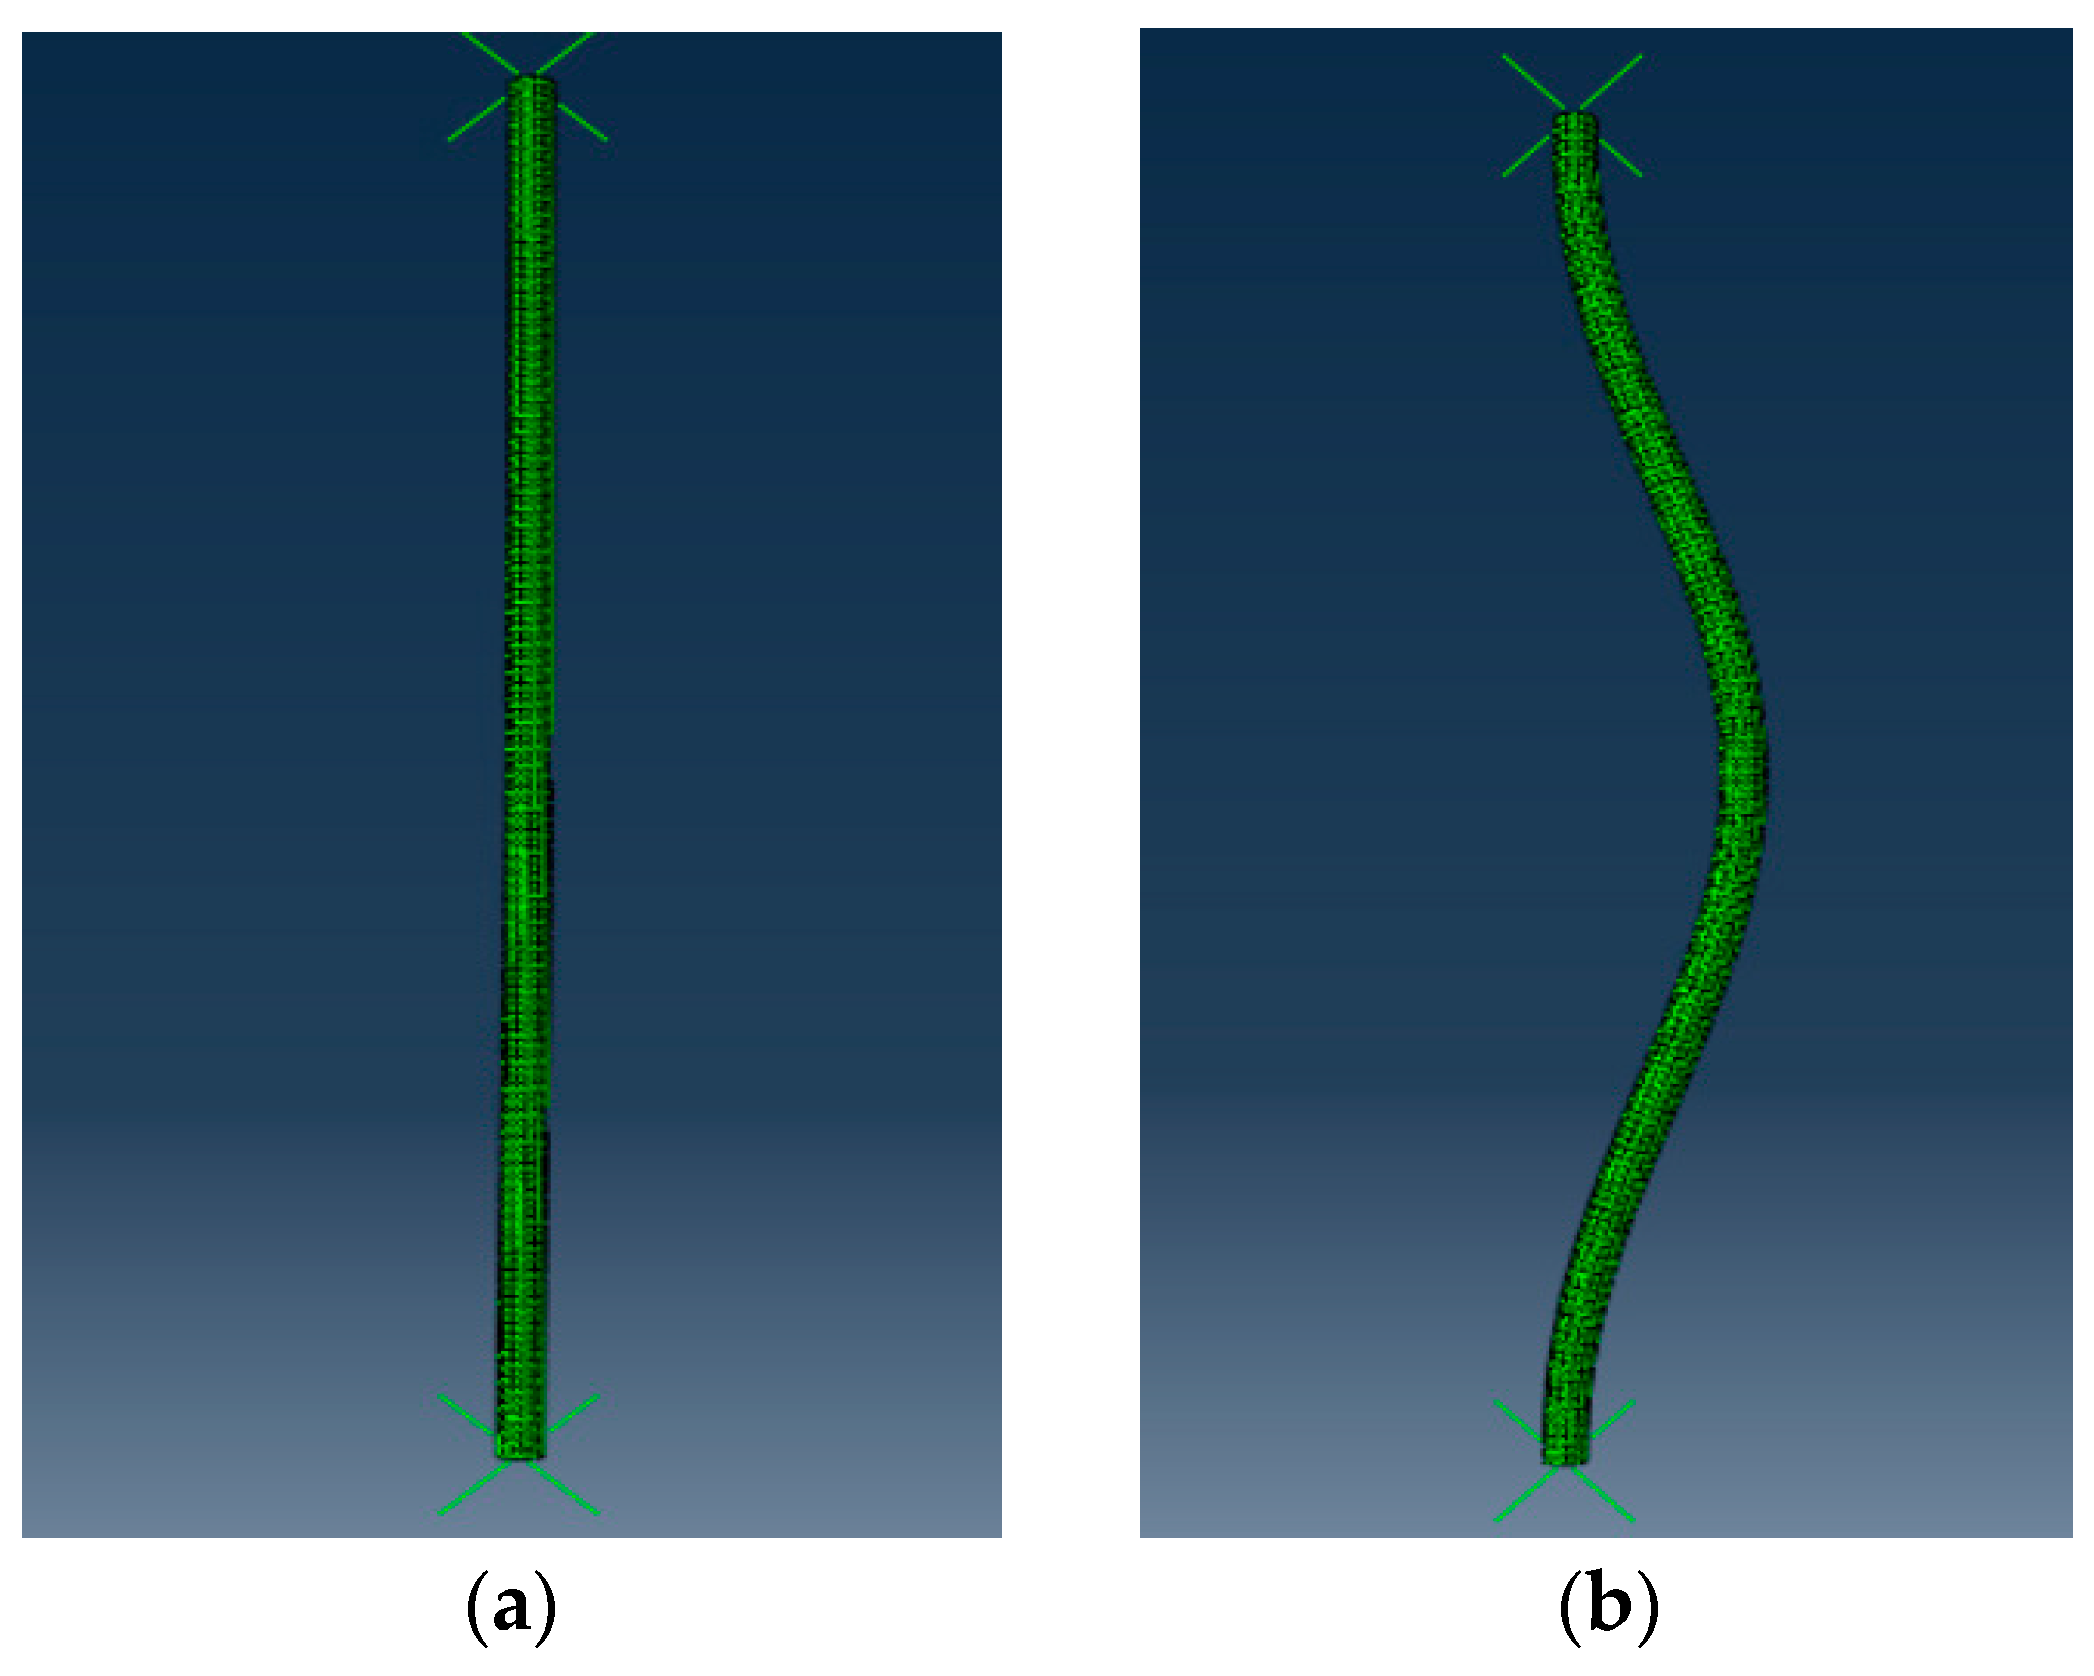
Based on the support images identified in the previous section, in order to conduct similarity matching, it is necessary to establish the buckling instability states of the structural members under various working conditions through numerical simulation and obtain the axial compression deformation forms of the structural members under various working conditions.

6.1. Image Case Processing

Image acquisition of the scaled model.
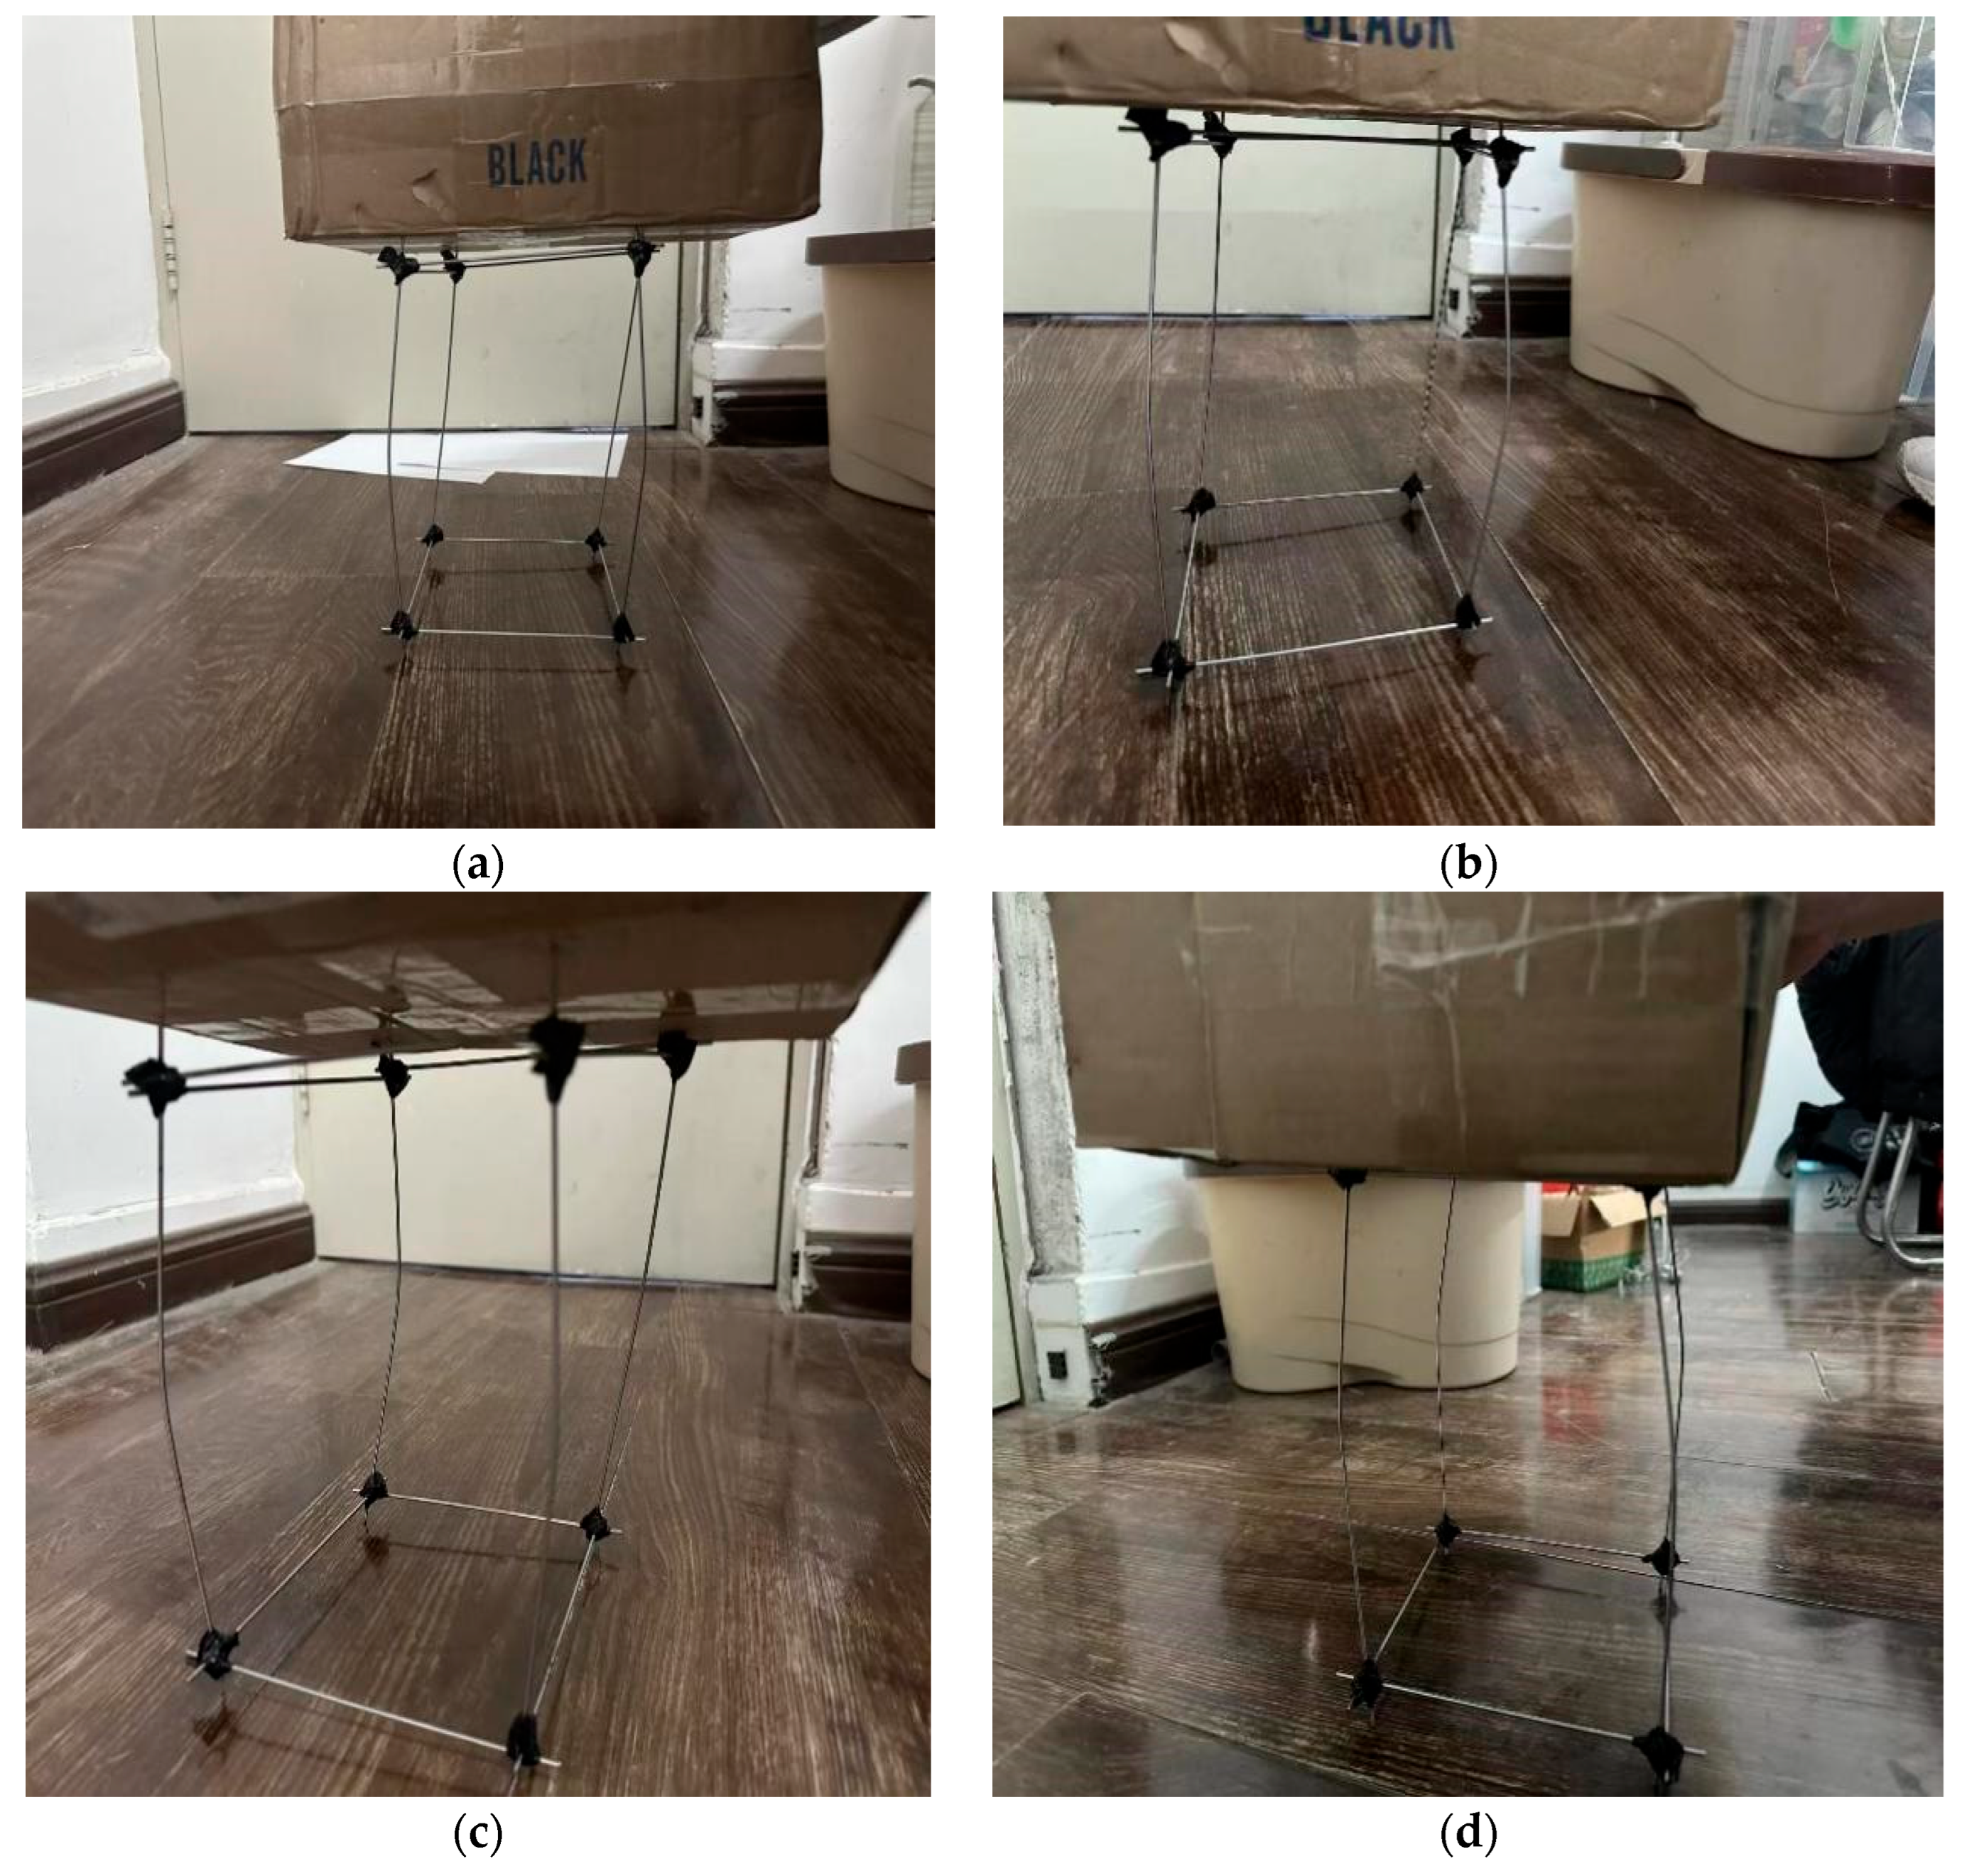
The scaled model members had a length of 80 mm, with longitudinal and transverse spacings of 40 mm, and a diameter of 3.25 mm. The members were made of Q235 steel with an elastic modulus E = 206,000 MPa and a Poisson’s ratio μ = 0.25. An axial pressure of 15 kN was applied. The images were captured using an iPhone 15 under uniform lighting conditions. Shooting began from the front of the support frame, followed by rotating counterclockwise to sequentially capture the right-side, rear, and left-side views. During the filming process, the system performed real-time matching of the member deformation captured within the lens. After each video recording, the member with the maximum deformation was identified, along with its most critical buckling morphology and corresponding bearing capacity. The above shooting procedure was repeated five times to compare the consistency of the identified results. After screening, a total of 300 images were selected for testing. Some of these images are shown in Figure 24.
After the shooting was completed, the images of each vertical member were obtained by image processing of the members through OPEN CV, As shown in Figure 25.

6.2. Analysis of Image Matching Results

Based on the member curve diagrams obtained through the aforementioned process, the matching results derived from the established criteria are presented in Figure 26.
As shown in Table 3, the overall matching rate of the members was above 90%, with a remarkable effect.
As shown in Table 4, the member identified with the largest deformation was Member #1, with an axial displacement of 1.2 mm, a force of 13.7 kN, and a recognition accuracy of 89%. The member with the smallest identified deformation was Member #3, with an axial displacement of 1.05 mm, a force of 10.95 kN, and a recognition accuracy of 80%. In summary, the recognition accuracy for all members exceeded 80%, indicating satisfactory recognition efficiency.

7. Conclusions

For the safety inspection of cuplok scaffolding, this study proposed a recognition model for identifying member shapes in images of the scaffold system. By integrating an evaluation criterion established based on the energy method, the safety state of the scaffold system was determined. The main conclusions are as follows:
  • For the collected images of the cuplok scaffold, a set of effective image processing technical methods was proposed to realize the recognition of the cuplok scaffold system in a complex background.
  • Based on Open CV, the outer contour of the structural members was proposed through binarized images, and the least square method was used to fit the outer contour to fit the linear curve of the deformed support. This has improved the efficiency for subsequent similarity matching.
  • The safety determination criterion of the cuplok scaffold was proposed. The results of the experimental case show that this safety determination method has better accuracy, and the accuracy rate of evaluating the force magnitude reaches 80%.
Although this study demonstrated the feasibility of intelligent safety assessment for cuplok scaffolding, the algorithm requires further validation due to limitations such as the randomness of actual field conditions and the limited number of experimental validations. Future research could employ an improved YOLOv8 algorithm to enhance detection accuracy and efficiency. Overall, the proposed algorithm establishes a foundation for subsequent studies.

Author Contributions

Conceptualization, J.X., S.B. and G.R.; methodology, J.X., S.B. and G.R.; software, J.X.; validation, S.B.; formal analysis, S.B. and G.R.; investigation, G.R. and M.G. All authors have read and agreed to the published version of the manuscript.

Funding

This research was funded by [Tianjin Key Laboratory of Soft Soil Characteristics and Engineering Environment Open Fund Project] grant number [2022SCEEKL004].

Data Availability Statement

The original contributions presented in this study are included in the article. Further inquiries can be directed to the corresponding author.

Conflicts of Interest

The authors declare no conflict of interest.

References

  1. Gui, Z.J.; Zhang, J.D.; Feng, X.N.; Liu, D. Application of Socket-Type Disk Buckle Steel Pipe Supports in Bridge Engineering. Highw. Traffic Sci. Technol. 2018, 35, 76–81. [Google Scholar]
  2. Xie, H.B.; Wang, G.L. Analysis of the Causes of Safety Accidents and Preventive Measures of Steel Pipe Formwork Supports in Bridge Construction. Highway 2010, 9, 175–179. [Google Scholar]
  3. Jiang, S.Q.; Min, W.Q.; Wang, S.H. Review and Prospect of Image Recognition Technology for Intelligent Interaction. Comput. Res. Dev. 2016, 53, 113–122. [Google Scholar]
  4. Gong, R.K.; Liu, J. Research on maize disease recognition based on image processing. Mod. Electron. Tech. 2021, 44, 149–152. [Google Scholar]
  5. Zhao, J.L.; Jin, Y.; Ye, H.C.; Huang, W.; Dong, Y.; Fan, L.; Jiang, J. Remote sensing monitoring of areca yellow leaf disease based on UAV multispectral images. Trans. Chin. Soc. Agric. Eng. 2020, 36, 54–61. [Google Scholar]
  6. Yi, X.; Xiao, Q.; Zeng, F.; Yin, H.; Li, Z.; Qian, C.; Chen, B.T. Computed tomography radiomics for predicting pathological grade of renal cell carcinoma. Front. Oncol. 2021, 10, 570396. [Google Scholar] [CrossRef]
  7. Bandara, M.S.; Gurunayaka, B.; Lakraj, G.; Pallewatte, A.; Siribaddana, S.; Wansapura, J. Ultrasound based radiomics features of chronic kidney disease. Acad. Radiol. 2022, 29, 229–235. [Google Scholar] [CrossRef] [PubMed]
  8. Zhu, X. Research on Real-time Monitoring Method and Application of External Scaffolding Safety Based on Mobile IT. Master’s Thesis, Harbin Institute of Technology, Harbin, China, 2014. [Google Scholar]
  9. Yang, Z.; Yuan, Y.; Zhang, M.; Zhao, X.; Zhang, Y.; Tian, B. Safety distance identification for crane drivers based on mask R-CNN. Sensors 2019, 19, 2789. [Google Scholar] [CrossRef] [PubMed]
  10. Huang, Y.L.; Chen, W.F.; Chen, H.J.; Yen, T.; Kao, Y.G.; Lin, C.Q. A monitoring method for scaffold-frame shoring systems for elevated concrete formwork. Comput. Struct. 2000, 78, 681–690. [Google Scholar] [CrossRef]
  11. Chen, Y.R.; Liu, L.J.; Duan, C.Y. Study on the Mechanical Characteristic and Safety Measures of Bowl-scaffold. Procedia-Soc. Behav. Sci. 2013, 96, 304–309. [Google Scholar] [CrossRef]
  12. Zhao, J.P.; Liu, X.X.; Zhang, X.Z. Hazard Image Recognition Technology for External Scaffolding Based on Improved YOLOv5s. China Saf. Sci. J. 2023, 33, 60–66. [Google Scholar] [CrossRef]
  13. Zhang, M.Y.; Cao, Z.Y.; Zhao, X.F.; Yang, Z. Research on Safety Helmet Wearing Detection for Construction Workers Based on Deep Learning. J. Saf. Environ. 2019, 19, 535–541. [Google Scholar]
  14. Li, H.; Wang, Y.B.; Yi, P.; Wang, T.; Wang, C.L. Research on Safety Helmet Recognition in Complex Work Scenarios Based on Deep Learning. J. Saf. Sci. Technol. 2021, 17, 175–181. [Google Scholar]
  15. Wang, Z.; Zhou, J.; Zhou, Y.; Chen, B.; Xu, X.; Zhu, H. Exploration of Perimeter Guardrail Identification Method Based on CNN Algorithm and UAV Technology. J. Inf. Technol. Civ. Eng. Archit. 2021, 13, 29–37. [Google Scholar]
  16. Liu, C.; Sui, H.; Wang, J.; Ni, Z.; Ge, L. Real-Time Ground-Level Building Damage Detection Based on Lightweight and Accurate YOLOv5 Using Terrestrial Images. Remote Sens. 2022, 14, 2763. [Google Scholar] [CrossRef]
  17. Ren, S.; He, K.; Girshick, R.; Sun, J.; Faster, R.C.N.N. Faster R-CNN: Towards Real-Time Object Detection with Region Proposal Networks. IEEE Trans. Pattern Anal. Mach. Intell. 2017, 39, 1137–1149. [Google Scholar] [CrossRef] [PubMed]
  18. Redmon, J.; Divvala, S.K.; Girshick, R.; Farhadi, A. You Only Look Once: Unified, Real-Time Object Detection. In Proceedings of the IEEE Conference on Computer Vision and Pattern Recognition, Las Vegas, NV, USA, 27–30 June 2016; pp. 779–788. [Google Scholar]
  19. Lou, L.T.; He, H.L. An OTSU Threshold Optimization Algorithm Based on Image Grayscale Transformation. J. South-Cent. Minzu Univ. (Nat. Sci. Ed.) 2021, 40, 325–330. [Google Scholar]
  20. Zhang, L.N. Color Image Gray Method Research. Ph.D. Thesis, Lanzhou University, Lanzhou, China, 2024. [Google Scholar]
  21. Bhunia, A.K.; Bhattacharyya, A.; Banerjee, P.; Roy, P.P.; Murala, S. A novel feature descriptor for image retrieval by combining modified color histogram and diagonally symmetric co-occurrence texture pattern. Pattern Anal. Appl. 2019, 23, 1–21. [Google Scholar] [CrossRef]
  22. Li, E.; Zhang, W. Smoke Image Segmentation Algorithm Suitable for Low-Light Scenes. Fire 2023, 6, 217. [Google Scholar] [CrossRef]
  23. Ma, W.; Zhang, P.C.; Huang, L.; Zhu, J.W.; Lian, Y.T.; Xiong, J.; Jin, F. Improved Yolov5 and Image Morphology Processing Based on UAV Platform for Dike Health Inspection. Int. J. Web Serv. Res. (IJWSR) 2023, 20, 1–13. [Google Scholar] [CrossRef]
  24. Grigoriev, S.N.; Zakharov, O.V.; Lysenko, V.G.; Masterenko, D.A. An efficient algorithm for areal morphologicalfiltering. Meas. Tech. 2024, 66, 906–912. [Google Scholar] [CrossRef]
  25. Liu, J.L. Application of Mathematical Morphology in Digital Image Processing. Integr. Circuit Appl. 2022, 39, 75–77. [Google Scholar] [CrossRef]
  26. Salanghouch, H.S.; Kabir, E.; Fakhimi, A. Finding Particle Size Distribution from Soil Images Using Circular Hough Transform. Int. J. Civ. Eng. 2025, 23, 1521–1533. [Google Scholar] [CrossRef]
  27. Li, P.S.; Li, J.D.; Wu, L.W.; Hu, J.P. Convolution kernel initialization method based on image characteristics. J. Ji Lin Univ. (Sci. Ed.) 2021, 59, 587–594. [Google Scholar] [CrossRef]
  28. Zhang, X.; Sun, J.; Gao, J. An algorithm for building contour inference fitting based on multiple contour point classification processes. Int. J. Appl. Earth Obs. Geoinf. 2024, 133, 104126. [Google Scholar] [CrossRef]
  29. Amato, U.; Della Vecchia, B. Iterative rational least squares fitting. Georgian Math. J. 2019, 28, 1–14. [Google Scholar] [CrossRef]
  30. Zhu, G.A.; Wang, J.X. Research on Human Sitting Posture Recognition Method Based on Zhang-Suen Algorithm. Digit. World 2020, 1–46. [Google Scholar]
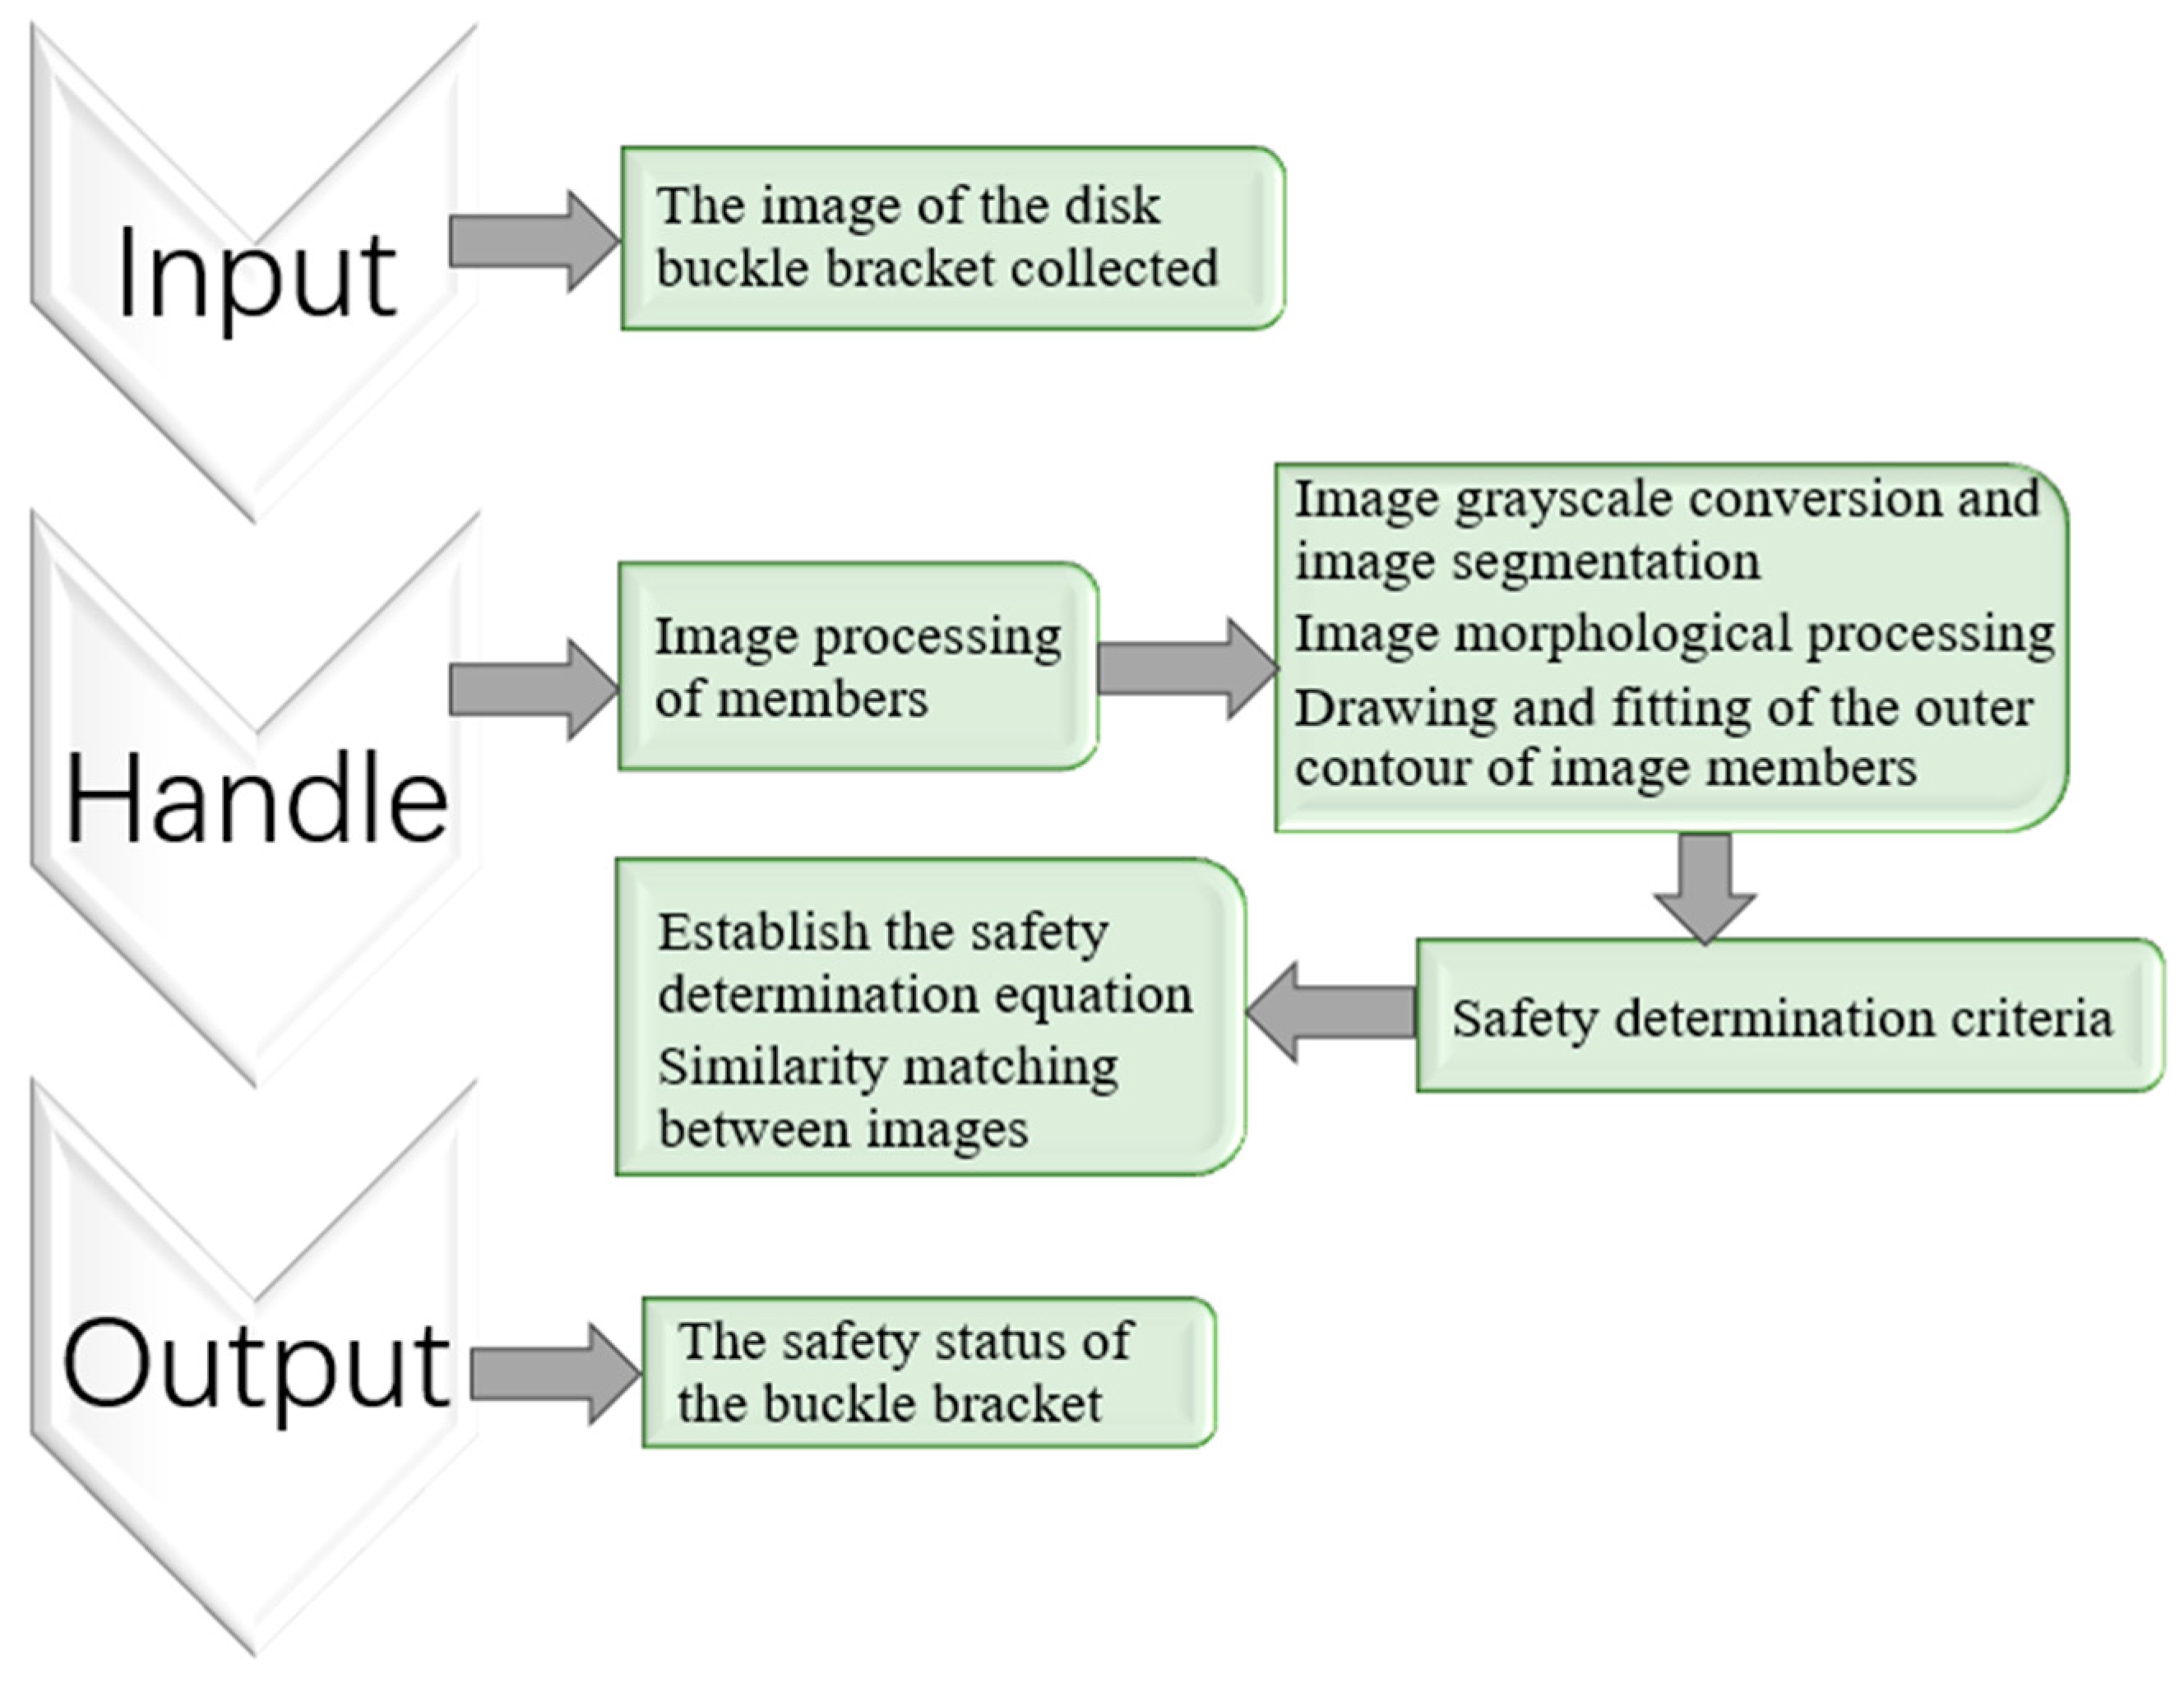
Figure 1. Framework diagram for cuplok scaffolding safety assessment.
Buildings 15 03737 g001
Figure 2. Original diagram of the cuplok scaffold.
Buildings 15 03737 g002
Figure 3. (a) A picture of the cuplok scaffold against a blue background; (b) a picture of the cuplok scaffold against a red background; (c) a picture of the cuplok scaffold against a green background.
Buildings 15 03737 g003
Figure 4. (a) The image of the buckle bracket against a green background; (b) histogram of the buckle bracket against a green background.
Buildings 15 03737 g004
Figure 5. Grayscale processing of the image against a green background. Note: Number 1 indicates Member 1, Number 2 indicates Member 2, Number 3 indicates Member 3, and Number 4 indicates Member 4.
Buildings 15 03737 g005
Figure 6. (a) Image of the cuplok scaffold against a red background; (b) histogram of the cuplok scaffold against a red background.
Buildings 15 03737 g006
Figure 7. Grayscale processing of the image against a red background. Note: Number 1 indicates Member 1, Number 2 indicates Member 2, Number 3 indicates Member 3, and Number 4 indicates Member 4.
Buildings 15 03737 g007
Figure 8. (a) Image of the cuplok scaffold against a blue background; (b) histogram of the cuplok scaffold against a blue background.
Buildings 15 03737 g008
Figure 9. Grayscale processing of the image against a blue background. Note: Number 1 indicates Member 1, Number 2 indicates Member 2, Number 3 indicates Member 3, and Number 4 indicates Member 4.
Buildings 15 03737 g009
Figure 10. Color factor diagrams of each member: (a) Member 1; (b) member 2; (c) member 3; (d) member 4.
Buildings 15 03737 g010
Figure 11. Image segmentation effect diagram.
Buildings 15 03737 g011
Figure 12. Image denoising comparison: (a) Segmented image; (b) denoised image with 3 × 3 kernel; (c) denoised image with 5 × 5 kernel; (d) denoised image with 7 × 7 kernel.
Buildings 15 03737 g012aBuildings 15 03737 g012b
Figure 13. Image morphological processing diagram: (a) The image processed by the closure operation; (b) open the image after operation processing.
Buildings 15 03737 g013
Figure 14. Results of the image transforms: (a) Original image; (b) result from Hough transform; (c) result from Fourier transform; (d) result from Radon transform. Note: Red lines in panels (bd) represent the detected members identified by the three aforementioned algorithms, which were visualized using red lines for clarity.
Buildings 15 03737 g014aBuildings 15 03737 g014b
Figure 15. Discrete image of the vertical bar.
Buildings 15 03737 g015
Figure 16. Vertical bar integrated image.
Buildings 15 03737 g016
Figure 17. Refined image of the vertical pole.
Buildings 15 03737 g017
Figure 18. (a) Original images of straight rods; (b) original images of curved rods.
Buildings 15 03737 g018
Figure 19. (a) Binarization images of straight rods; (b) binarization images of curved rods.
Buildings 15 03737 g019
Figure 20. (a) The outer contour image of the straight rods; (b) the outer contour image of the curved rods.
Buildings 15 03737 g020
Figure 21. (a) Straight bar fitting curve graph; (b) fitting curve of the curved rod.
Buildings 15 03737 g021
Figure 22. Fitting comparison diagram.
Buildings 15 03737 g022
Figure 23. Curvature representation diagram.
Buildings 15 03737 g023
Figure 24. Example of taking pictures: (ad) are the bending images of the cuplok scaffold.
Buildings 15 03737 g024
Figure 25. Curves of each member after processing: (a) Curve image of Rod 1 after processing; (b) curve image of Rod 2 after processing; (c) curve image of Rod 3 after processing; (d) curve image of Rod 4 after processing.
Buildings 15 03737 g025aBuildings 15 03737 g025b
Figure 26. Matching curves of each member: (a) Rod 1 recognition result diagram; (b) Rod 2 recognition result diagram; (c) Rod 3 recognition result diagram; (d) Rod 4 recognition result diagram.
Buildings 15 03737 g026
Table 1. Color information of each point of the image member.
Category of RodsPoint SequenceRGBColor
Factor
Member 112512211251.45
22552201251.47
32512211321.42
Member 242532431081.20
52552431101.21
62552431081.31
Member 372512231381.03
82522201351.03
92552301381.02
Member 4102512211251.45
112512211251.45
122522201321.43
Table 2. Background color information.
BackgroundRGBColor
Factor
red1753270.43
green1753270.43
blue76672440.58
Table 3. Feature matching error table.
Δ 1 Δ 2 Δ 3
Rod 1100%90%90%
Rod 290%80%85%
Rod 385%80%80%
Rod 4100%95%90%
Table 4. Comparison table of axial forces of structural members.
Serial NumberActual Axial ForceIdentify Axial ForceAccuracy Rate
Rod 115 kN13.7 kN89%
Rod 215 kN13 kN87%
Rod 315 kN12.45 kN83%
Rod 415 kN13.65 kN91%
Disclaimer/Publisher’s Note: The statements, opinions and data contained in all publications are solely those of the individual author(s) and contributor(s) and not of MDPI and/or the editor(s). MDPI and/or the editor(s) disclaim responsibility for any injury to people or property resulting from any ideas, methods, instructions or products referred to in the content.