1. Introduction
Acoustic experiments play a vital role in the engineering curriculum system of higher education. They are essential for helping students understand wave theory, master signal acquisition and analysis techniques, and enhance their engineering practice skills [
1,
2]. Different levels of courses assign varying teaching objectives to acoustic experiments: public basic courses such as “College Physics” focus on establishing the basic concepts of sound wave propagation and measurement [
3,
4]; professional basic courses (e.g., “Engineering Acoustics” and “Signals and Systems”) emphasize the characteristics of acoustic signals, processing methods and sensor applications [
5,
6]; application-oriented courses (e.g., “Underwater Acoustics” and “Structural Health Monitoring”) aim to cultivate system integration and practical innovation abilities within specific engineering contexts [
7,
8]. To support these multi-level teaching demands, the functions and performance of the experimental platform are of vital importance.
At present, acoustic experiments in colleges and universities generally rely on discrete excitation and acquisition platforms composed of signal generators and oscilloscopes (
Figure 1). This mode performs stably in basic measurement, and the signal generator can output a variety of common waveforms. However, it still presents significant limitations in teaching applications: the excitation and acquisition stages operate independently, the experimental process lacks automated support, and data requires manual recording and processing, making it difficult to meet the requirements of large-class teaching or rapid verification of multiple sets of data [
9,
10]. For example, in the experiment of measuring the speed of sound in solids, students often need to repeatedly adjust signal source parameters and read data from an oscilloscope. This process is time-consuming and easily affected by human error [
11,
12]. In higher-level experimental teaching, such as underwater acoustic positioning experiments, existing platforms often lack multi-channel synchronous collection and automated analysis, limiting the completion of data collection and accuracy verification within class time [
13,
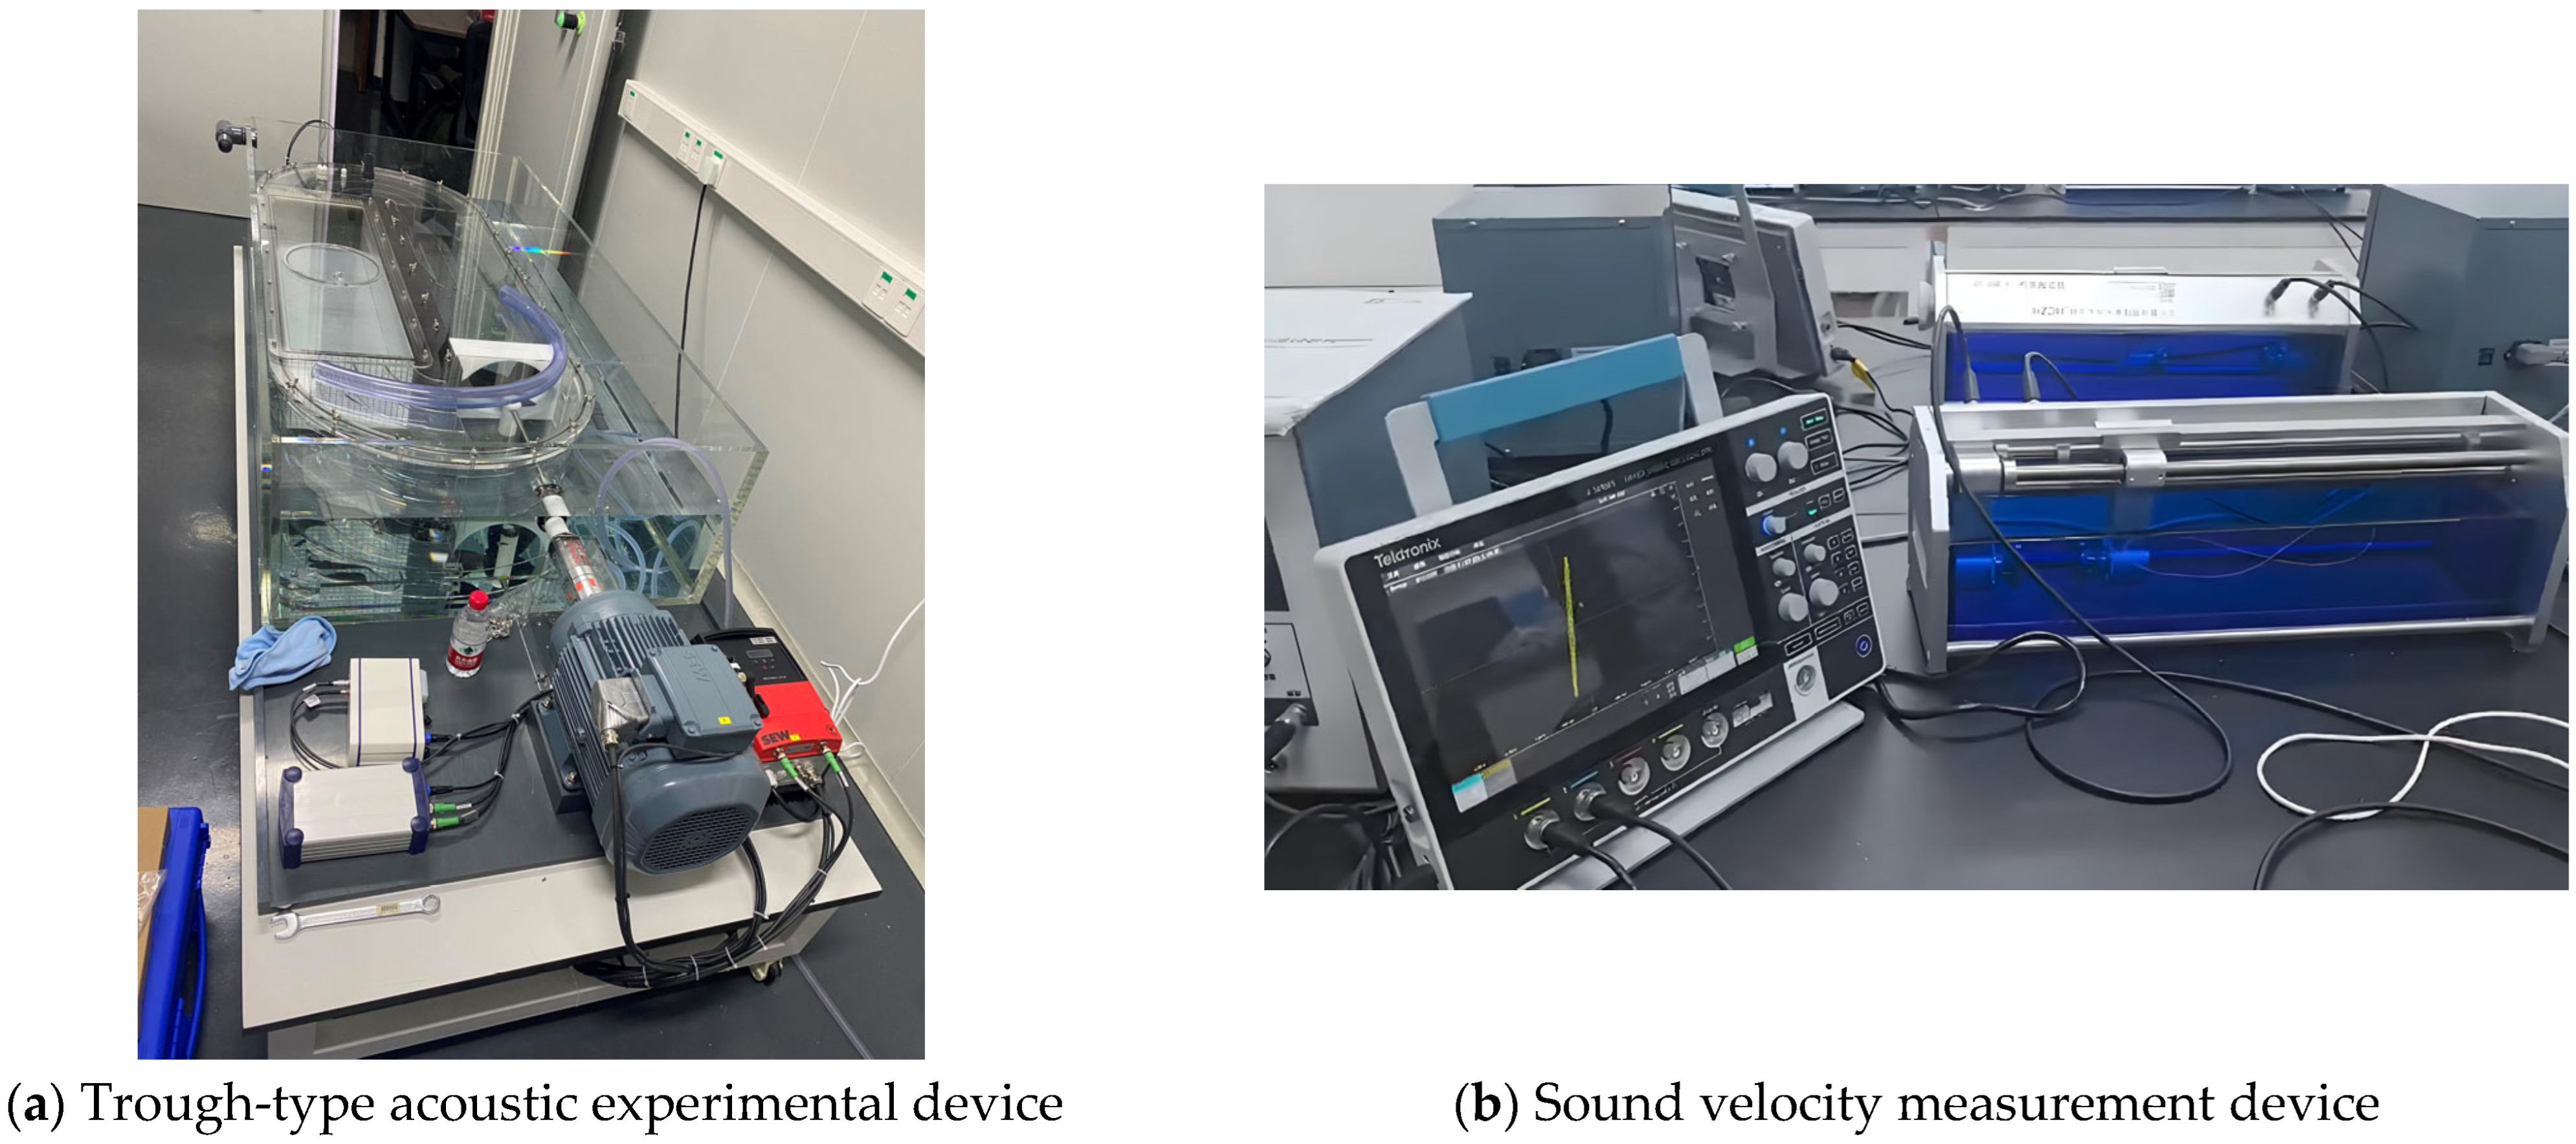
14]. Some courses still use trough-type acoustic experimental apparatus (
Figure 2a). Although it measures sound velocity and displays waveforms, it has a large size, complex wiring, and cumbersome operation, reducing its suitability for rapid classroom deployment [
15,
16]. In applied experiments, common sound velocity measurement devices (
Figure 2b) utilize ultrasonic pulse transmission to determine sound velocity in different media. These devices are widely used in acoustic research and engineering testing, providing intuitive and highly accurate results. However, their large size limits portability, and they depend strongly on experimental site and conditions, making them difficult to implement as regular platforms in standard teaching.
To address these challenges, researchers both domestically and internationally have proposed various improvement strategies. These include low-cost acquisition systems utilizing PC sound cards [
17], basic waveform generators based on microcontrollers or digital signal processors (DSPS) [
18], and instructional platforms integrating virtual simulations with online experiments [
19]. While these approaches have successfully reduced equipment costs and simplified operational procedures, they still exhibit limitations in measurement accuracy, signal programmability, real-time processing, and remote accessibility [
20,
21]. These shortcomings are particularly significant in interdisciplinary engineering education, where there is a growing demand for systems that effectively balance hardware integration, software functionality, and operational flexibility [
22,
23]. To more intuitively highlight the differences and limitations of existing research outcomes, this paper reviews and compares several representative acoustic teaching systems, as summarized in
Table 1.
To address the persistent challenges in cost-efficiency, remote accessibility, and intelligent capabilities of acoustic teaching systems in recent years, this study proposes and implements a digital, portable acoustic teaching platform. On the hardware side, the system integrates a programmable signal generator and multi-channel synchronous acquisition module based on FPGA. It supports the generation of multiple excitation signal types—including pulse, sine, sweep, and coded waveforms—and drives various sensors through a two-stage power amplifier, thereby enabling high-speed and high-precision signal excitation and acquisition [
24,
25]. On the software side, the system features a cross-platform interactive interface developed using the Qt framework. It supports both USB direct connection and TCP-based remote control. The software includes built-in functions such as first-wave extraction, cross-correlation analysis, and spectral processing, forming an integrated and closed-loop workflow: signal excitation–synchronous acquisition–real-time processing–data storage–result visualization.
Compared with most discrete or single-function teaching platforms, the proposed system demonstrates clear advantages in portability, signal programmability, and remote interaction capabilities. Its integrated design effectively reduces hardware costs and deployment complexity, simplifies experimental procedures, and improves both data processing efficiency and measurement accuracy. Furthermore, the platform supports multi-level course instruction and foundational engineering training within the same system architecture, demonstrating strong adaptability and scalability. Overall, the system effectively meets the practical demands of acoustic teaching in terms of task integration, real-time interaction, and multi-scenario deployment, offering high potential for widespread adoption and application.
2. Overall System Design
The portable acoustic teaching system proposed in this study follows the core design principles of digitalization, intelligence, and portability. It addresses the limitations of traditional discrete experimental platforms, such as complex operation, low efficiency, and poor integration. The system forms a complete experimental workflow that includes signal excitation, synchronous acquisition, real-time processing, data storage, and result visualization. This approach improves the intuitiveness, efficiency, and scalability of experimental teaching.
As shown in
Figure 3, the overall system architecture supports a variety of typical teaching experiments, including sound velocity measurement, hydrophone positioning, and structural acoustic detection. The system uses acoustic probes, such as gas or liquid sensors, hydrophones, and structural vibration sensors, to collect the corresponding acoustic signals. The core hardware is an integrated device that combines a programmable signal excitation module based on FPGA with a multi-channel synchronous acquisition module. This integration ensures high precision while significantly reducing wiring complexity and operational effort. As a result, the system improves portability and enhances the efficiency of classroom setup and deployment.
The system supports high-speed communication between hardware and software through a USB interface. The software sends commands and data to the hardware signal source module to generate waveforms. At the same time, the acquisition module returns multi-channel data in real time for processing and visualization. This setup overcomes the limitations of traditional experimental tools, such as the passive sampling of oscilloscopes, the limited excitation capabilities of signal generators, and the lack of real-time analysis in both. The software platform is developed using the Qt framework. It integrates key functions, including acquisition control, signal generation, signal processing, data storage, and playback.
The system supports both local USB connections and remote operation. Remote access and data sharing are achieved through Raspberry Pi nodes using TCP protocols.
Overall, the system completes the entire workflow from signal excitation to data acquisition and processing. It offers strong scalability and is suitable for a wide range of teaching and engineering applications.
2.1. Design of Hardware Subsystem
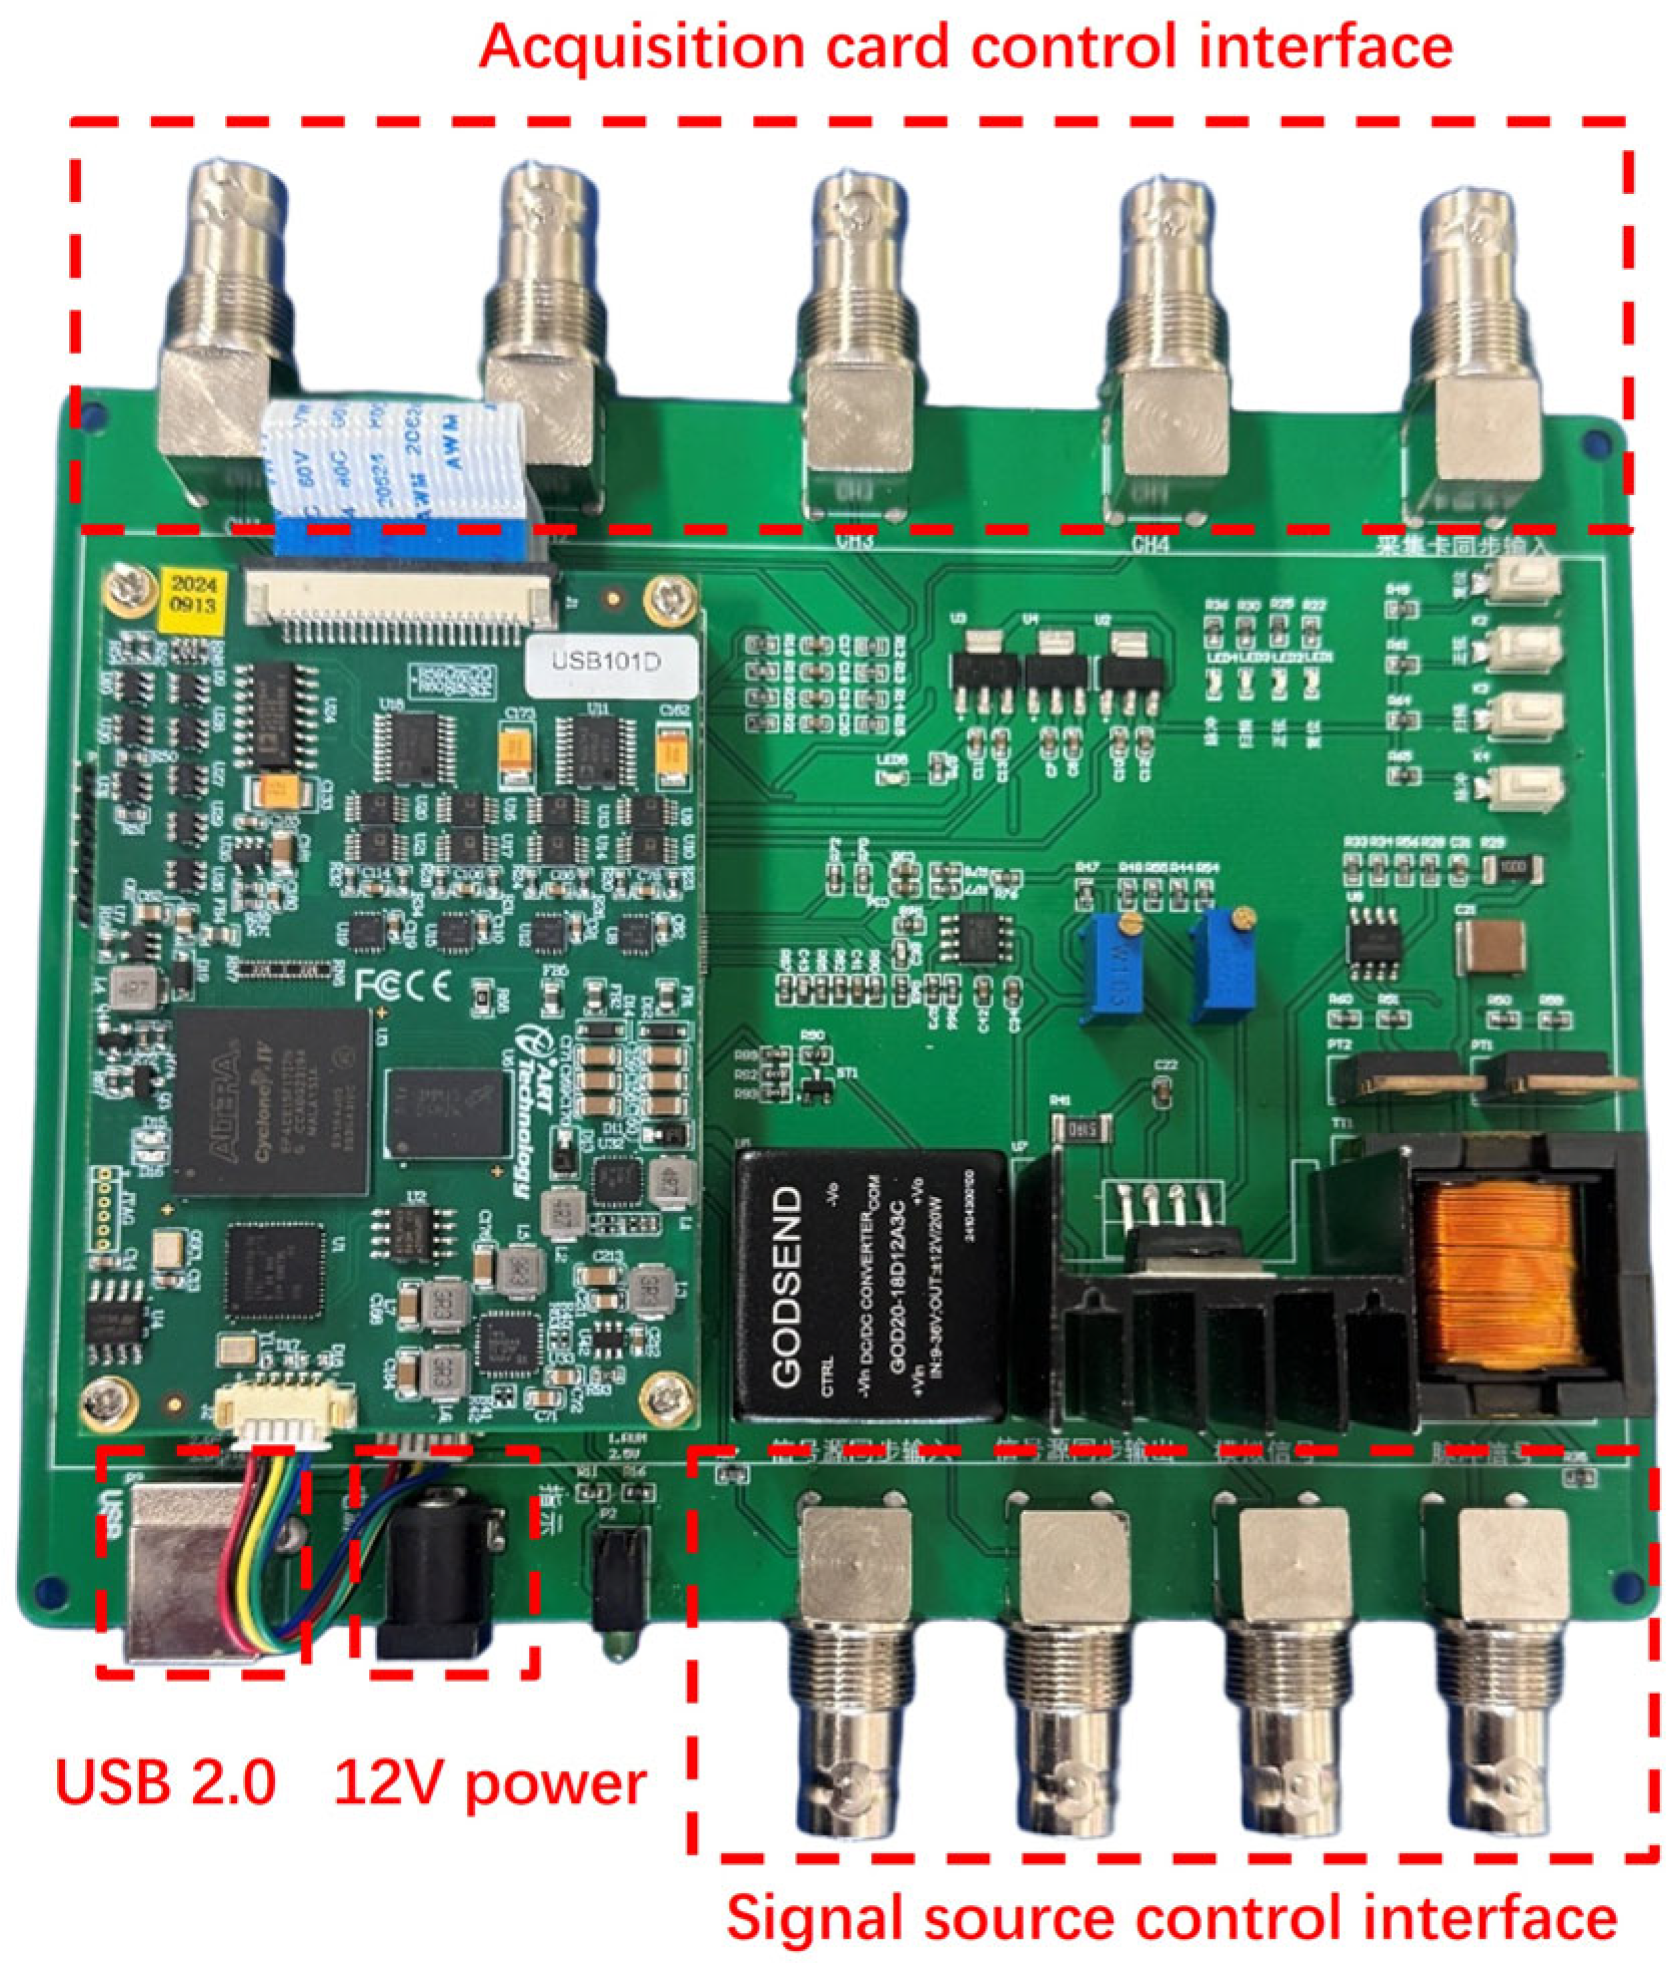
The hardware of this system is designed using a modular approach. This ensures experimental accuracy while also considering ease of operation and rapid deployment in teaching environments. To improve portability and classroom efficiency, the signal excitation, synchronous acquisition, and USB communication modules are fully integrated into a single portable device (
Figure 4). The device features multiple BNC-standard ports on both sides, including interfaces for signal output and synchronous acquisition. These ports allow users to complete wiring quickly and easily. One side also includes a USB interface for communication and power, enabling plug-and-play functionality with the host computer. This integrated design eliminates the need for complex wiring between separate instruments. It lowers the operational barrier for students and improves the overall flow of classroom teaching.
2.1.1. Signal Source Excitation Module
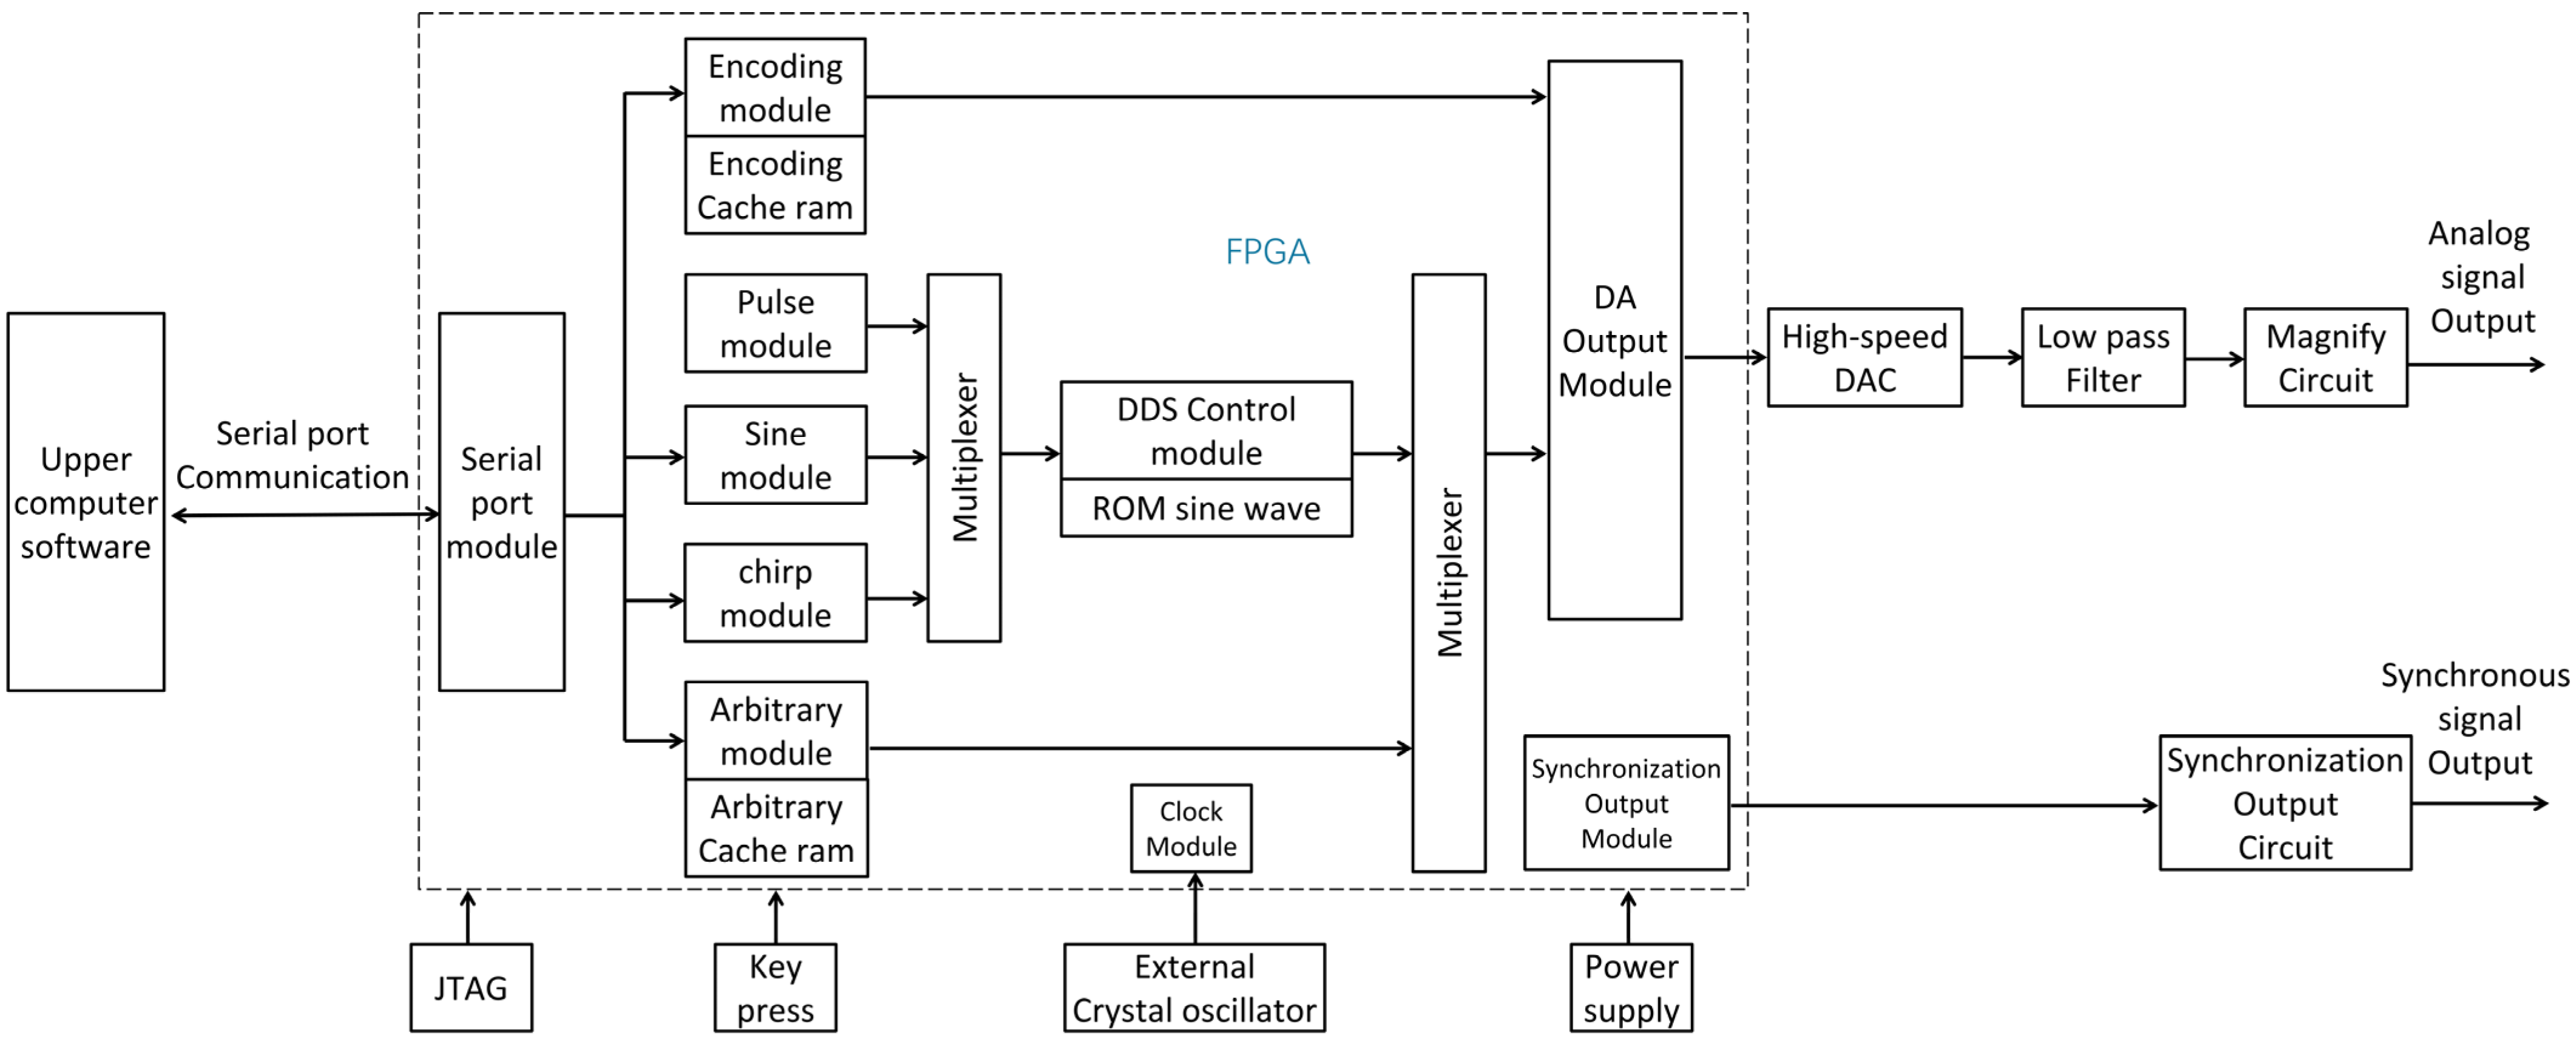
The block diagram of the signal excitation module is shown in
Figure 5. This module is built around an FPGA and is capable of generating a variety of excitation signals, including pulses, sine waves, chirps, and arbitrary waveforms, to meet different experimental needs. An internal power amplification unit boosts the output signal to a level sufficient to drive transducers or sensors, ensuring stable and reliable acoustic excitation.
2.1.2. Multi-Channel Synchronous Acquisition Module
The block diagram of the acquisition module is shown in
Figure 6. This module uses FPGA control and a high-resolution analog-to-digital converter (ADC) to perform multi-channel synchronous sampling. The design ensures time and amplitude consistency in the acquired acoustic signals. This consistency is important for experiments such as underwater acoustic positioning and structural vibration detection. The system enhances the reliability and repeatability of experimental data.
2.2. Design of Software Subsystem
The software subsystem is developed based on the Qt(v5.14) framework, offering excellent cross-platform compatibility and graphical interaction capabilities. It supports full-process functions ranging from interface operation to signal control and data management, thereby forming a complete, integrated experimental teaching loop.
To meet the requirements of multi-platform deployment and high real-time performance, Qt was selected as the primary development tool. As a mature C++ development framework, Qt features efficient GUI construction, extensive hardware interface support, and outstanding system resource management efficiency—making it particularly suitable for educational systems that demand fast response and high interaction precision.
Compared with other common development options such as Python-based PyQt (v5.15.9), Tkinter (Python 3.10), or browser-server (B/S) architectures that combine web frontends with local backends, Qt demonstrates superior performance in terms of runtime efficiency, graphical rendering, native interface consistency, and serial communication stability. These advantages make it especially appropriate for this system, where signal preview, control feedback, and real-time visualization are core requirements.
Moreover, Qt’s signal-slot mechanism provides strong decoupling between functional modules, facilitating future feature expansion, system maintenance, and platform migration. Overall, the Qt-based software architecture not only supports the integrated demands of current acoustic teaching tasks but also lays a solid foundation for sustainable system upgrades and broader engineering deployment.
For signal source control, the software provides options to configure various excitation signals, including pulses, sine waves, chirps, and arbitrary waveforms. Users can set parameters such as amplitude, frequency, and output mode. The software parses these parameters and sends them to the hardware signal source module through a serial port. The hardware performs digital-to-analog conversion (DAC) and generates the corresponding waveform. The software also includes a waveform preview function that displays the signal curve in real time before transmission. This helps users visually check the accuracy of the configured signal. It also supports waveform file import, sampling rate adjustment, amplitude scaling, and signal inversion. These operations are carried out by the hardware and enhance the system’s flexibility and adaptability for different experimental scenarios.
For data acquisition and processing, the software communicates with the hardware acquisition module through a USB interface. It allows flexible configuration of sampling rate, acquisition length, and trigger mode. The hardware transmits multi-channel data in real time, and the software parses it based on protocol specifications. It performs voltage conversion and organizes the data into a structured format. The processed data is sent to the analysis module, where functions such as first-wave extraction, cross-correlation calculation, and spectrum analysis are applied. Results are displayed in real time through a graphical user interface. The software also supports data storage and playback. Experimental data can be saved in binary format for archiving or comparative analysis. Historical data can be loaded and replayed for classroom demonstrations or student review sessions.
Through this integrated design, the software subsystem and hardware platform together form a closed-loop process of signal excitation, synchronous acquisition, real-time processing, data storage, and result visualization. Compared with traditional discrete experimental platforms, the system offers greater flexibility in digital interaction, such as support for arbitrary waveform input and real-time algorithm extension. It also demonstrates a high level of hardware integration in a portable form, significantly improving the efficiency and practicality of acoustic experimental teaching.
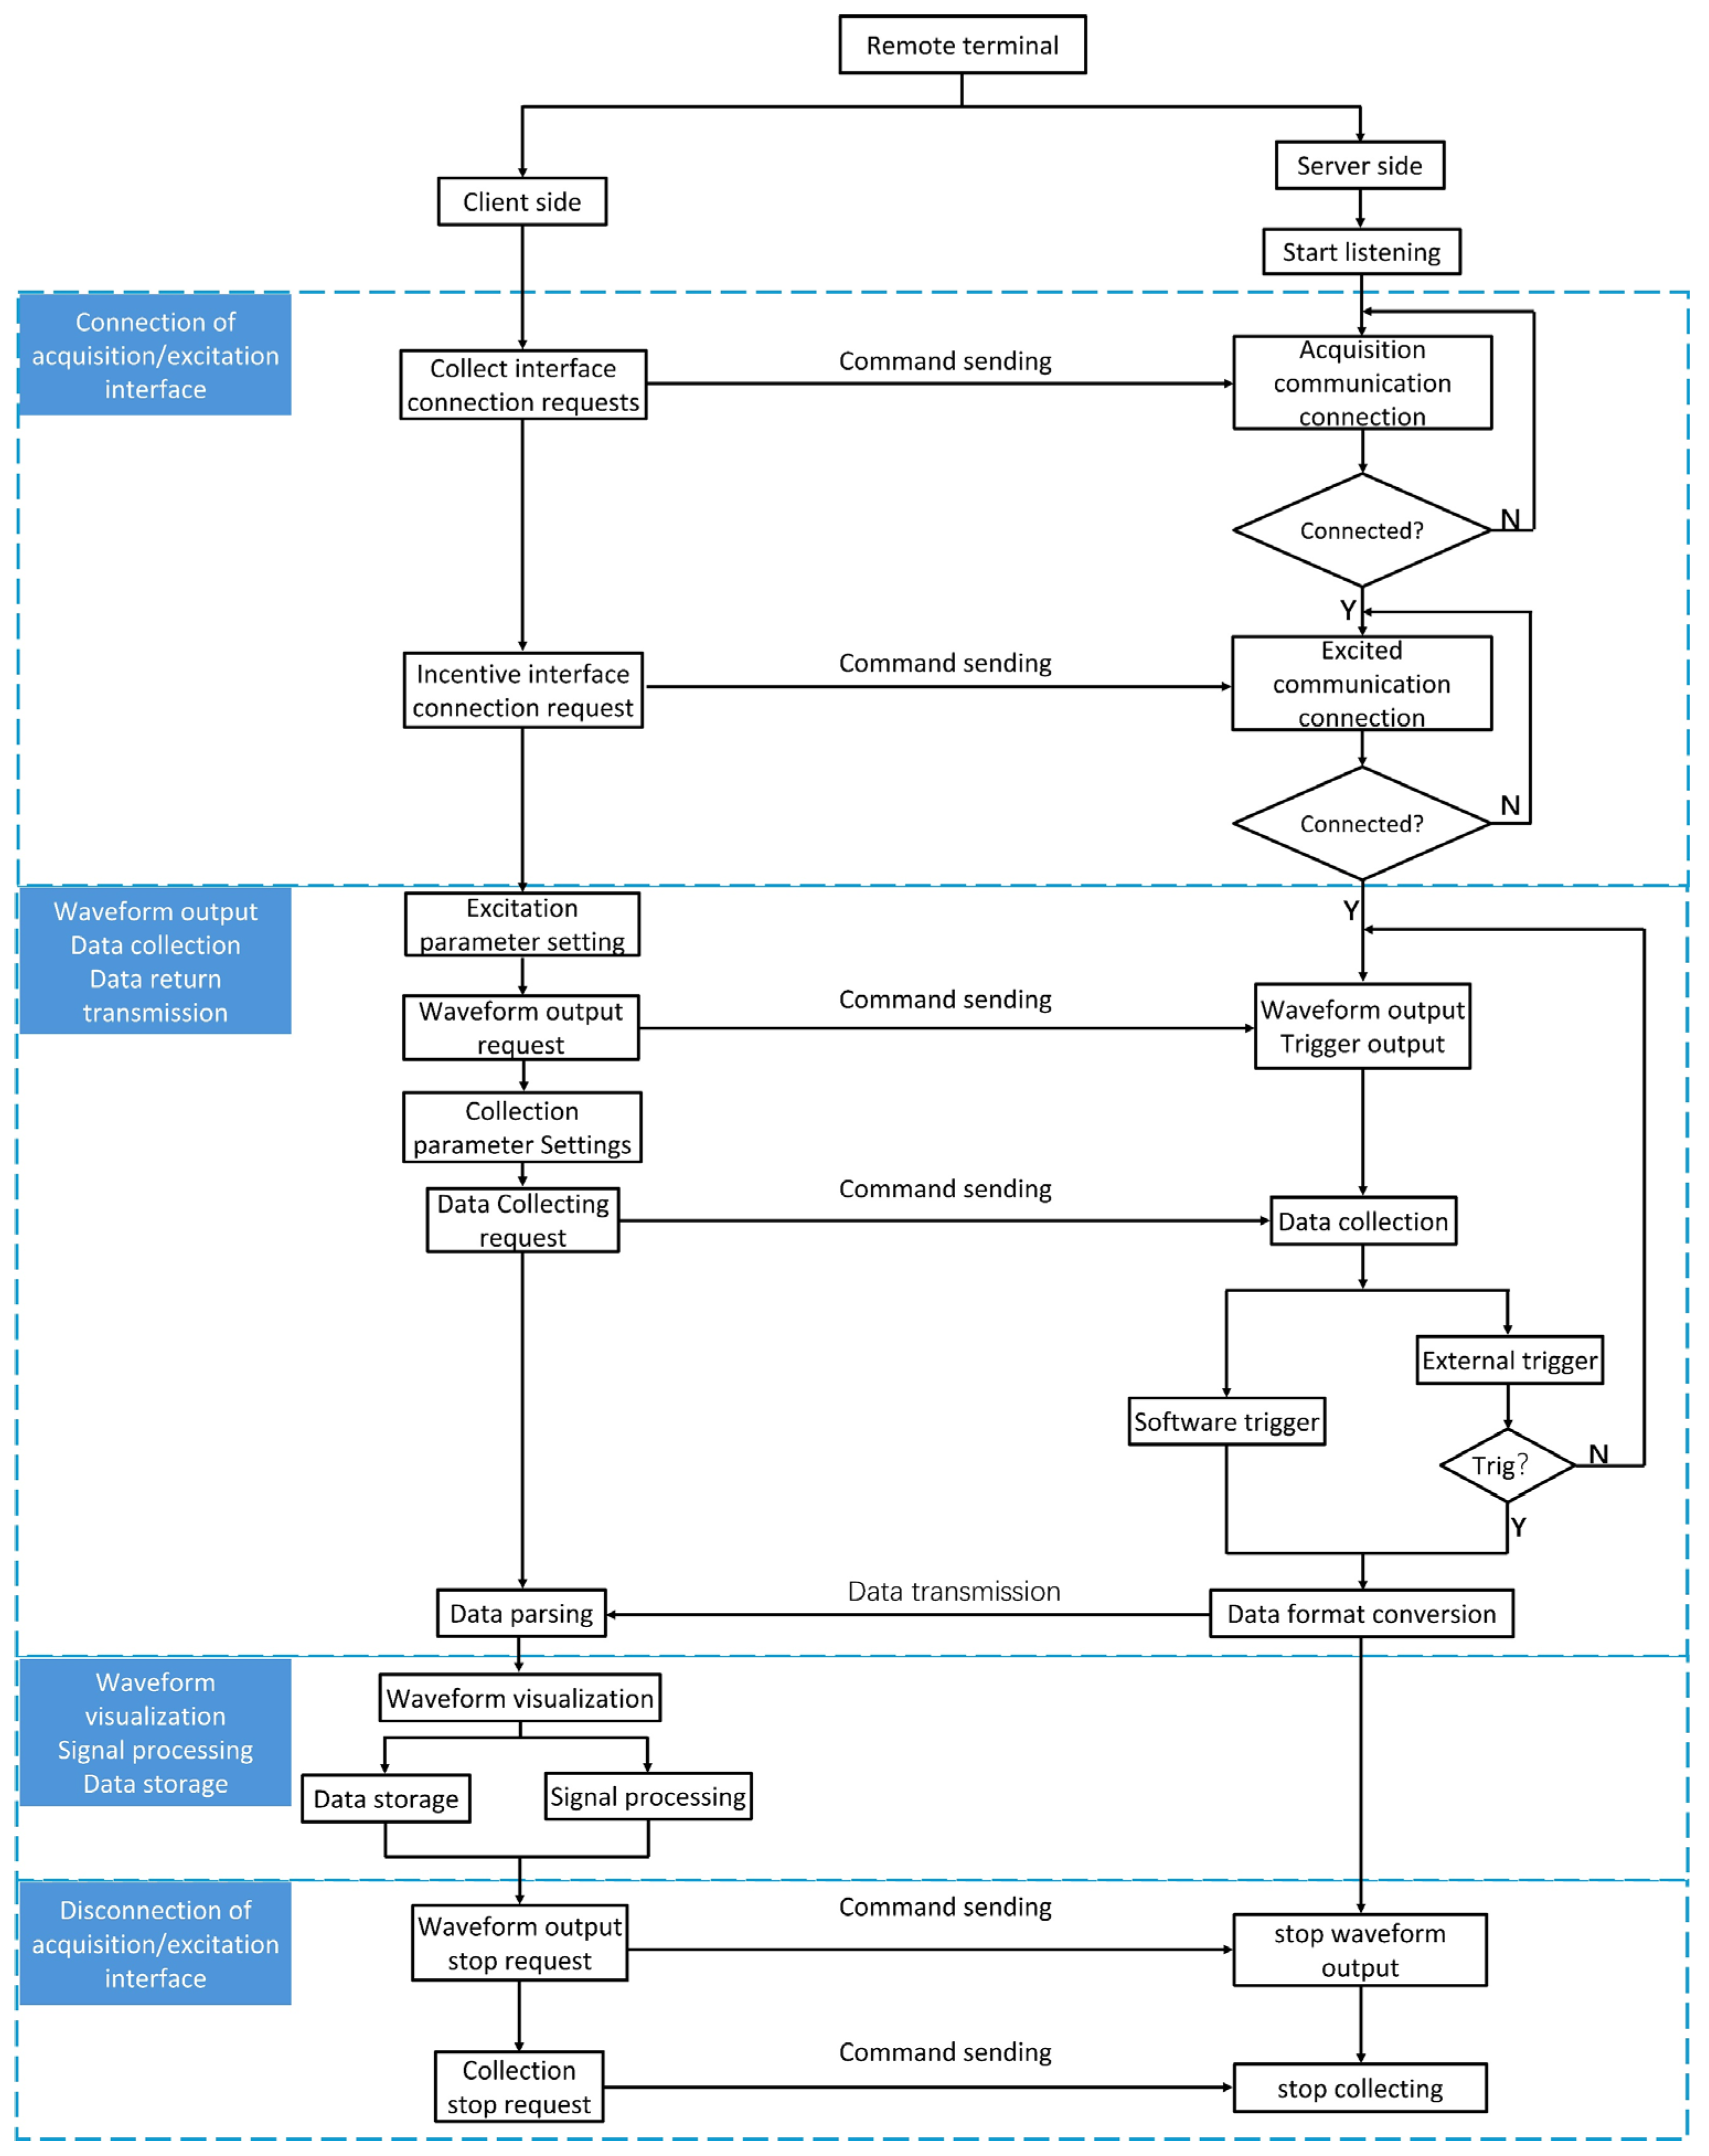
The software operation supports two modes: local and remote, as illustrated in
Figure 7 and
Figure 8.
The local mode (
Figure 7) is designed primarily for fast-paced experimental teaching within classroom settings. In this mode, a PC or tablet is directly connected to the integrated acquisition and excitation device via USB, creating a plug-and-play experimental environment. During class, instructors only need to perform initialization and parameter configuration. The system then generates the desired excitation signal and drives the sensor to collect the response. The acquired multi-channel data is transmitted in real time via USB to the software, where it undergoes waveform display, spectrum analysis, and first-wave extraction. Results can be saved or replayed as needed. This mode offers convenient deployment and rapid operation, significantly reducing experimental preparation time. It is especially suitable for teaching basic physics courses, allowing students to complete the entire process—from observing physical phenomena to analyzing data—within limited class hours. This helps reinforce their understanding of fundamental acoustic principles such as sound velocity measurement and wave propagation.
The remote mode (
Figure 8) is designed for cross-regional experiments and data sharing. In this setup, a Raspberry Pi serves as the server on a robotic platform. It receives control commands from a remote client via the TCP protocol and communicates with the acoustic device through a USB connection. This enables full remote control of the experimental process. In remote mode, the client can send excitation and acquisition tasks in real time. The multi-channel data collected by the acoustic device is uploaded to the client via the Raspberry Pi. The client then performs real-time analysis and visualization. Experimental results can also be shared and discussed among multiple users, overcoming the limitations of time and physical laboratory space. Typical application scenarios include cross-institutional collaborative courses and field-based engineering experiments. For example, in a remote acoustic inspection experiment, the system was integrated into a wall-climbing robot. The robot performed acoustic data acquisition and defect detection on a building wall. Students could remotely observe the waveform data and analysis results in real time, providing an intuitive understanding of the practical value of acoustic detection in structural health monitoring.
Overall, the local mode emphasizes rapid deployment and immediate verification, making it well-suited for classroom teaching and basic acoustic experiments. In contrast, the remote mode focuses on cross-regional data sharing and engineering scalability, making it ideal for inter-institutional collaboration and applied research scenarios. These two modes complement each other. Together, they enhance the efficiency of classroom instruction while extending the experimental system’s value in engineering practice. This dual-mode approach provides flexible and effective technical support for the digital and intelligent transformation of acoustic experiment teaching.
2.3. System Function Operation Process Demonstration
To enhance experimental efficiency and user experience, the software interface of the system adopts a modular design, with clearly defined functional sections that allow users to quickly complete various operations. For example, to configure a five-peak Hanning-window-modulated signal, the user can click the “ULC” button to open the signal source control panel, set the desired signal frequency and amplitude, and preview the output waveform by pressing the “Preview” button. After clicking “Start”, the relevant parameters are transmitted via the serial port to the hardware for execution.
Upon completing data acquisition, the user can navigate to the “Signal Processing” menu to perform spectrum analysis via the “FFT” submenu, or apply first-arrival automatic extraction through the “AIC” submenu. The analysis results are displayed in real time in the corresponding graphical windows and can be exported for storage. This task workflow demonstrates the system’s well-designed human–machine interaction and high degree of task integration, enabling efficient completion of the full teaching cycle within limited class time.
As shown in
Figure 9, the software interface features a clear structural layout, integrating multiple functional modules including signal configuration, acquisition monitoring, real-time analysis, and result management. It supports visualized control and end-to-end management of the experimental process, providing an intuitive and efficient digital platform for acoustic experiment instruction.
3. Experimental Case Design and Verification
To verify the pedagogical applicability and generalizability of the proposed portable acoustic teaching system, three representative experimental cases were selected and implemented: sound velocity measurement, hydrophone localization, and remote acoustic inspection. These experiments cover key instructional levels, including the validation of fundamental acoustic concepts, methods of localization and parameter inversion, and intelligent analysis in complex engineering scenarios. Correspondingly, they align with three tiers of educational objectives: foundational theory instruction, signal processing and localization principles, and cross-platform engineering application.
The selection of experimental cases followed the principles below:
- (1)
Representativeness—Each case reflects critical performance metrics of the system under distinct acoustic application scenarios;
- (2)
Clear educational value—The experiments align with common curricular requirements in acoustic-related courses in higher education;
- (3)
Diversity in experimental format—The set includes both local measurements and remote interaction, as well as variations in structural response and propagation medium.
Through the implementation and analysis of these three experiments, the system’s capabilities in signal excitation, synchronous acquisition, real-time processing, and data visualization have been comprehensively validated, providing a practical foundation for future expansions in teaching depth and functional scope.
3.1. Multi-Media Sound Velocity Measurement Experiment
The speed of sound refers to the velocity at which acoustic waves propagate through a medium. When the propagation distance s and time t are known, the sound speed v can be calculated using the formula .
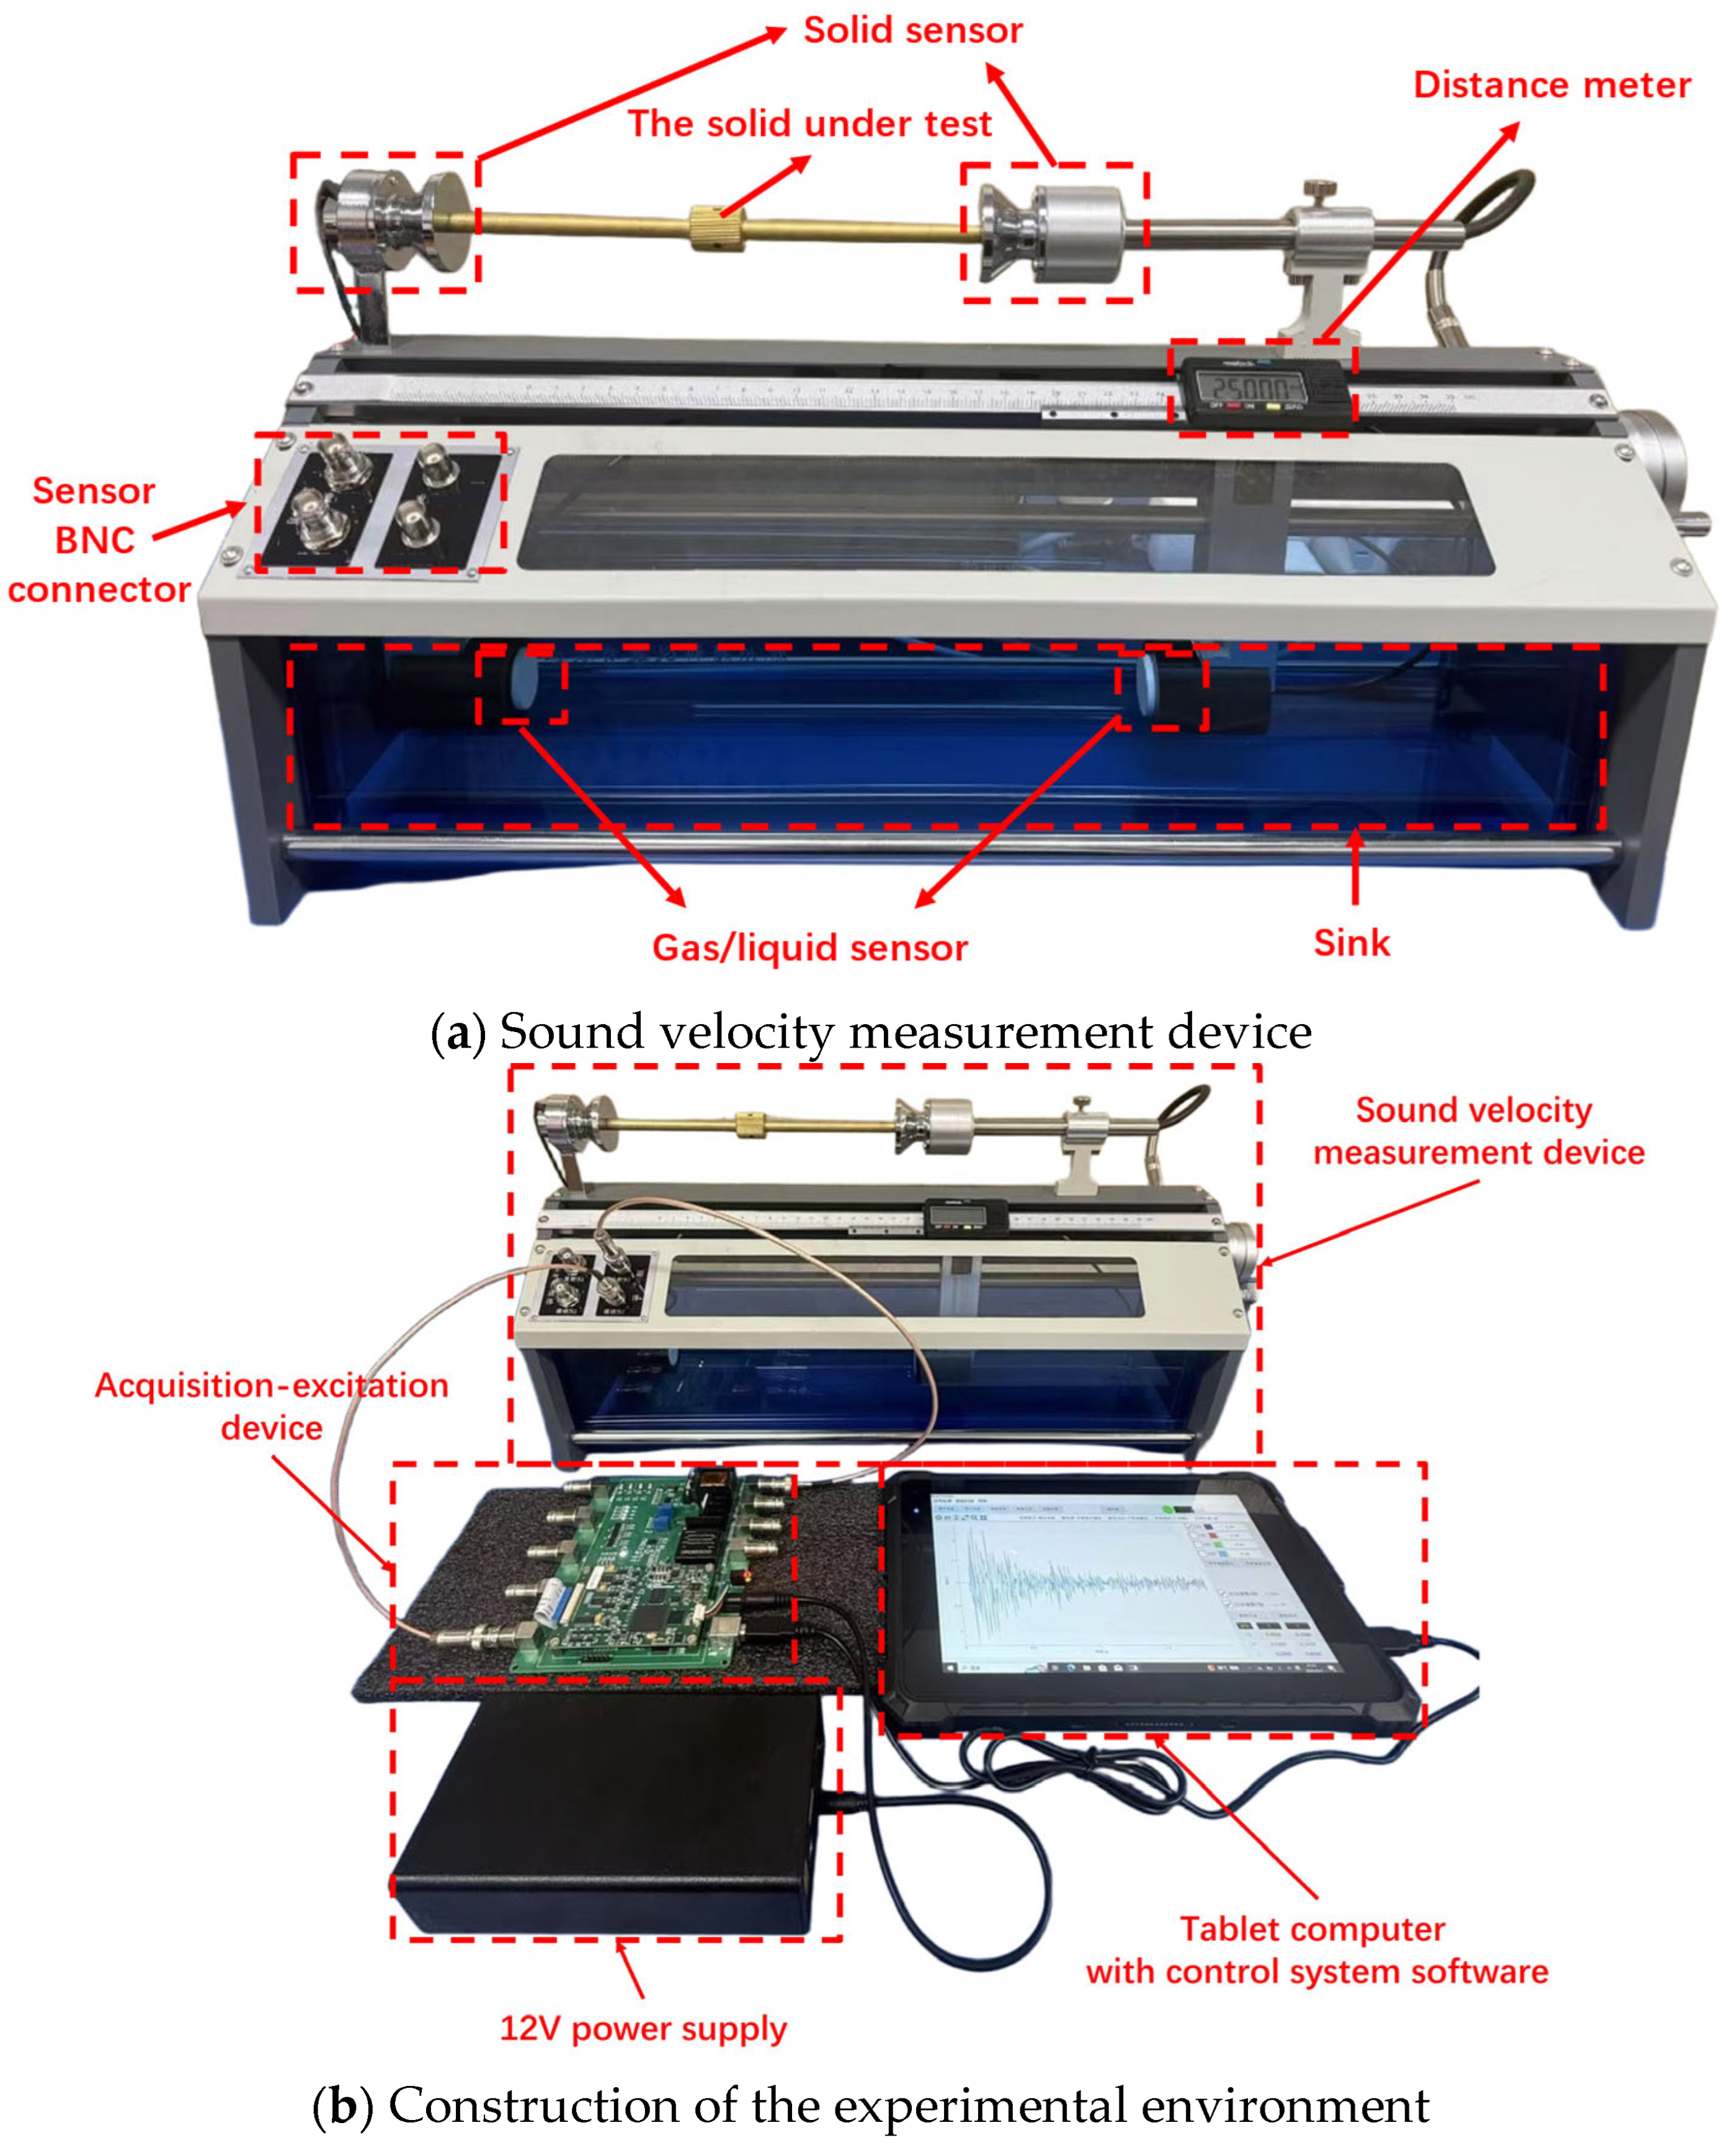
In this experiment, the portable acoustic teaching system is used to measure the speed of sound in solid, liquid, and gaseous media. The experimental apparatus is shown in
Figure 10a, which includes solid-state sensors, gas/liquid sensors with corresponding BNC interfaces, a high-precision displacement measurement system, and a water tank, supporting sound speed measurement across various media. The experimental setup is illustrated in
Figure 10b. The system consists of the experimental fixture, the integrated excitation-acquisition unit, a tablet device running the control software, and a 12 V power supply. The entire setup features a simple wiring structure and offers high operational convenience.
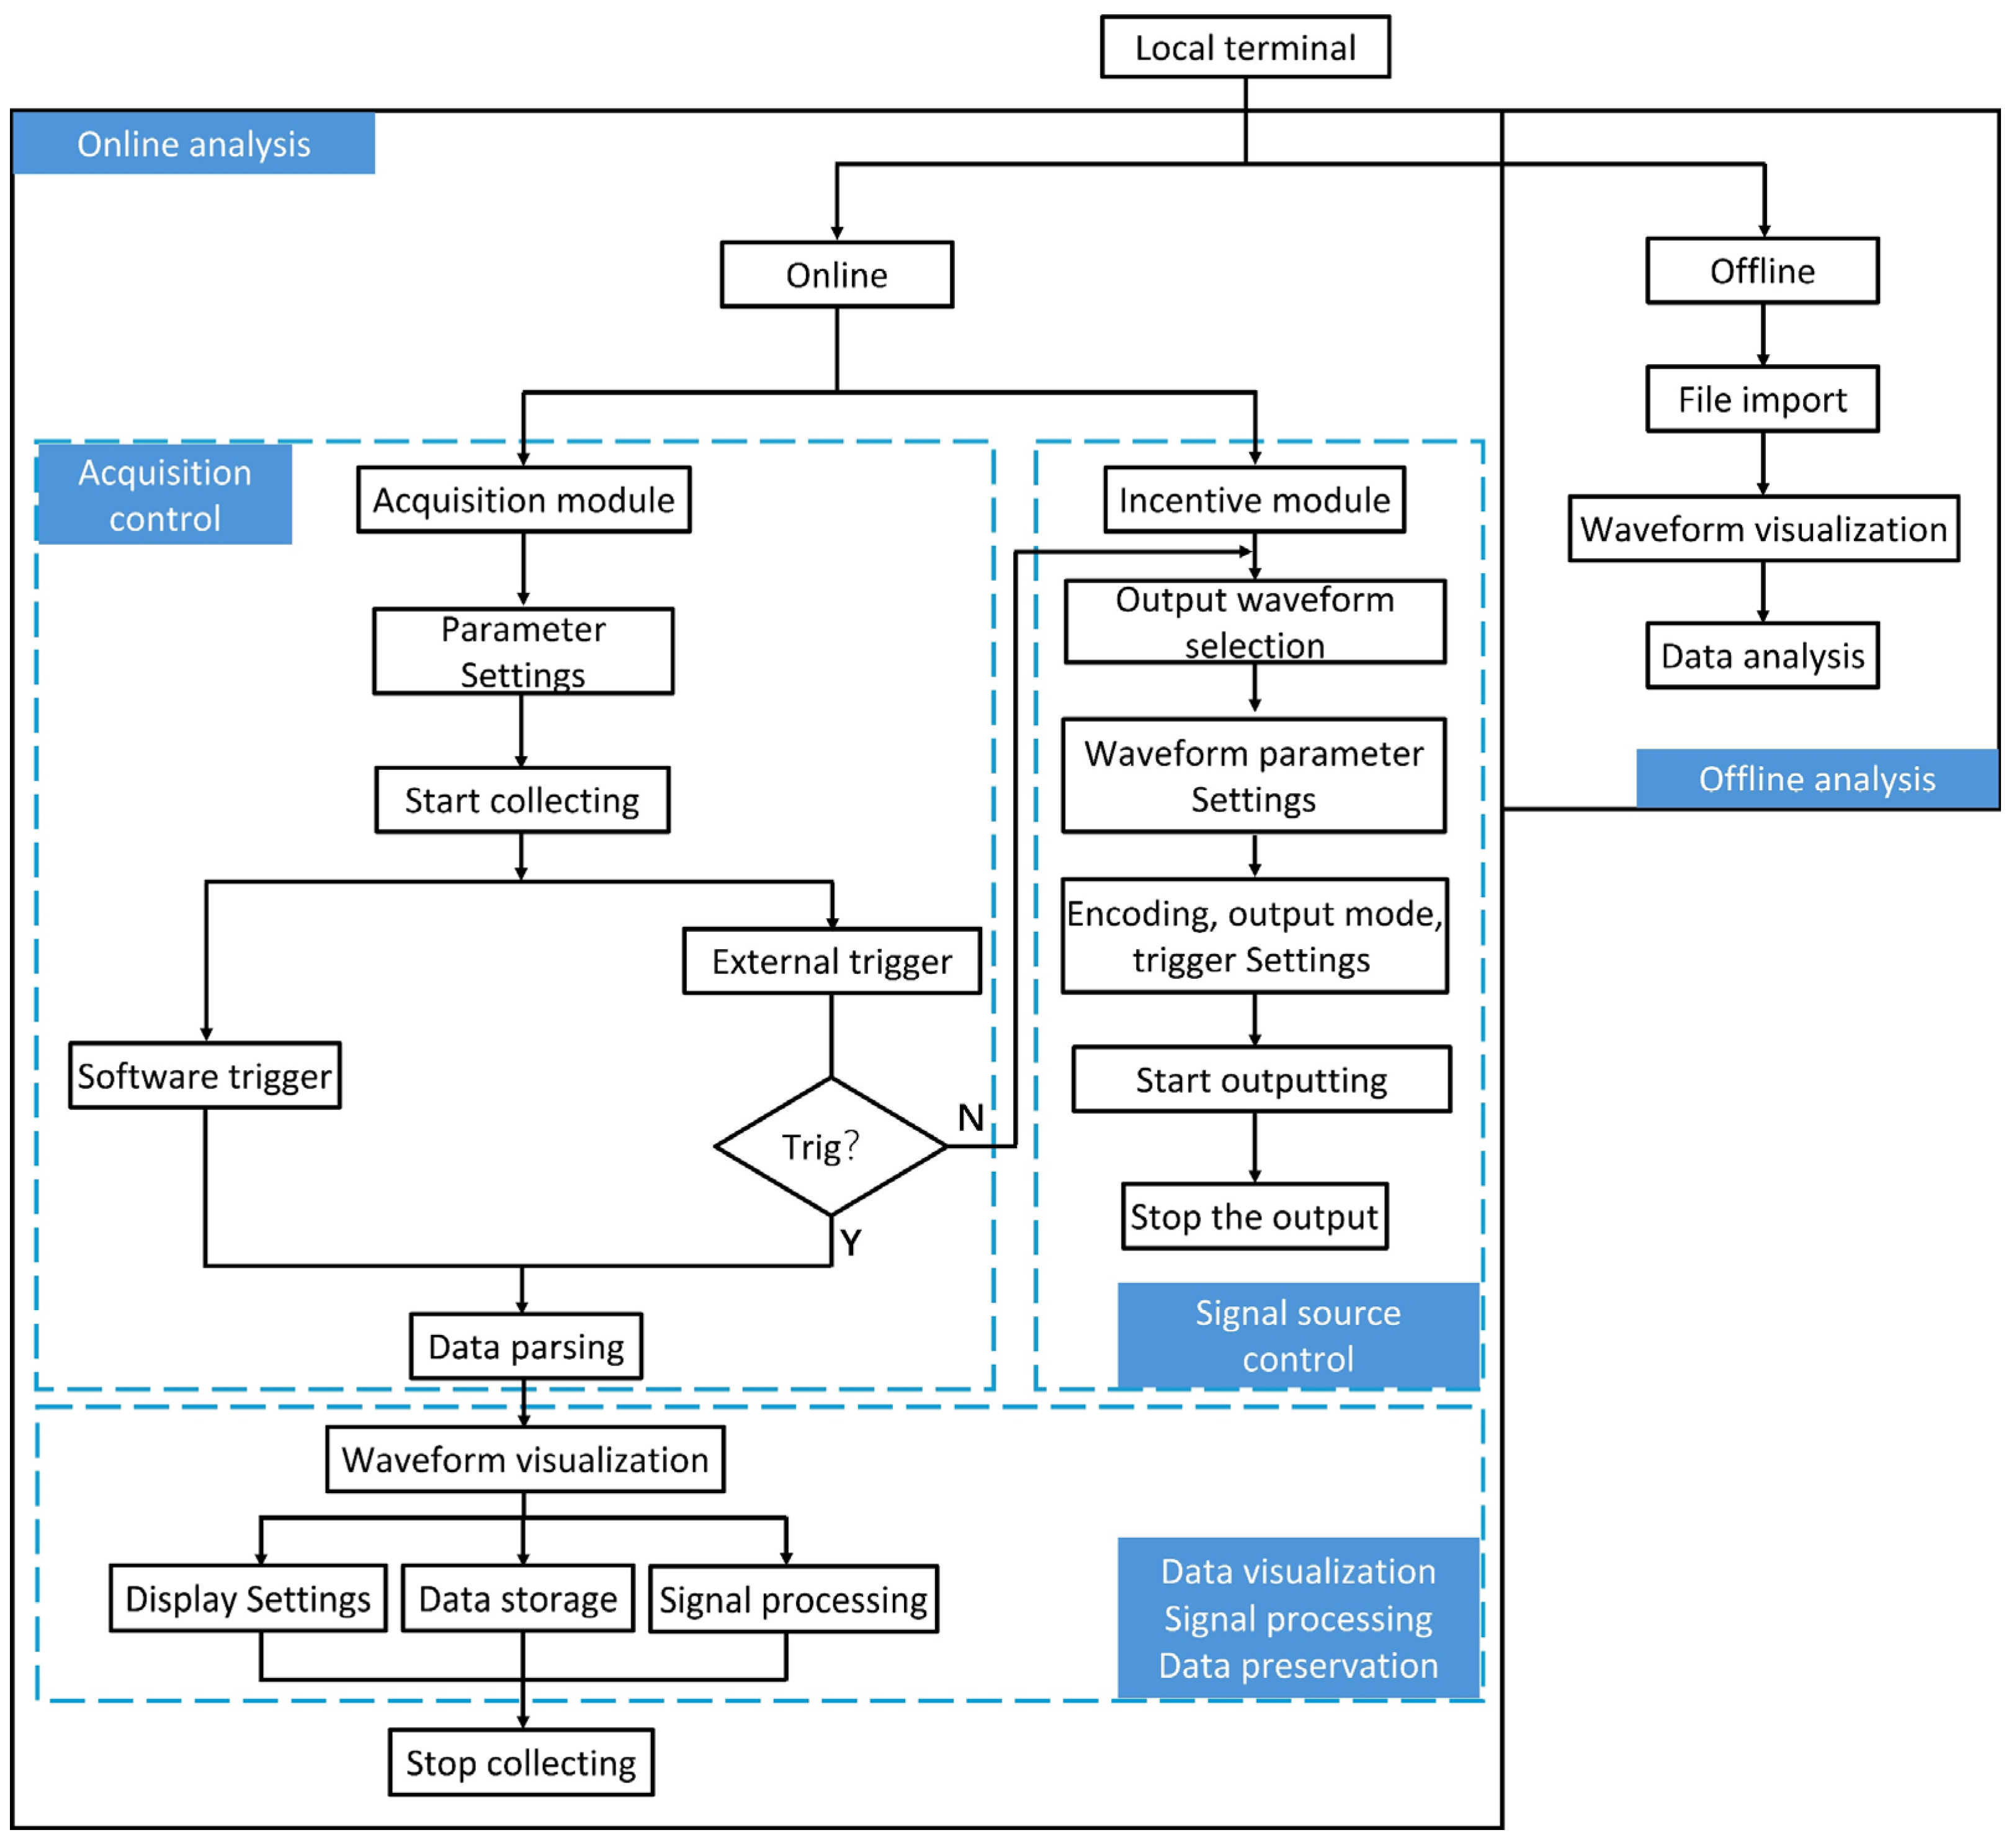
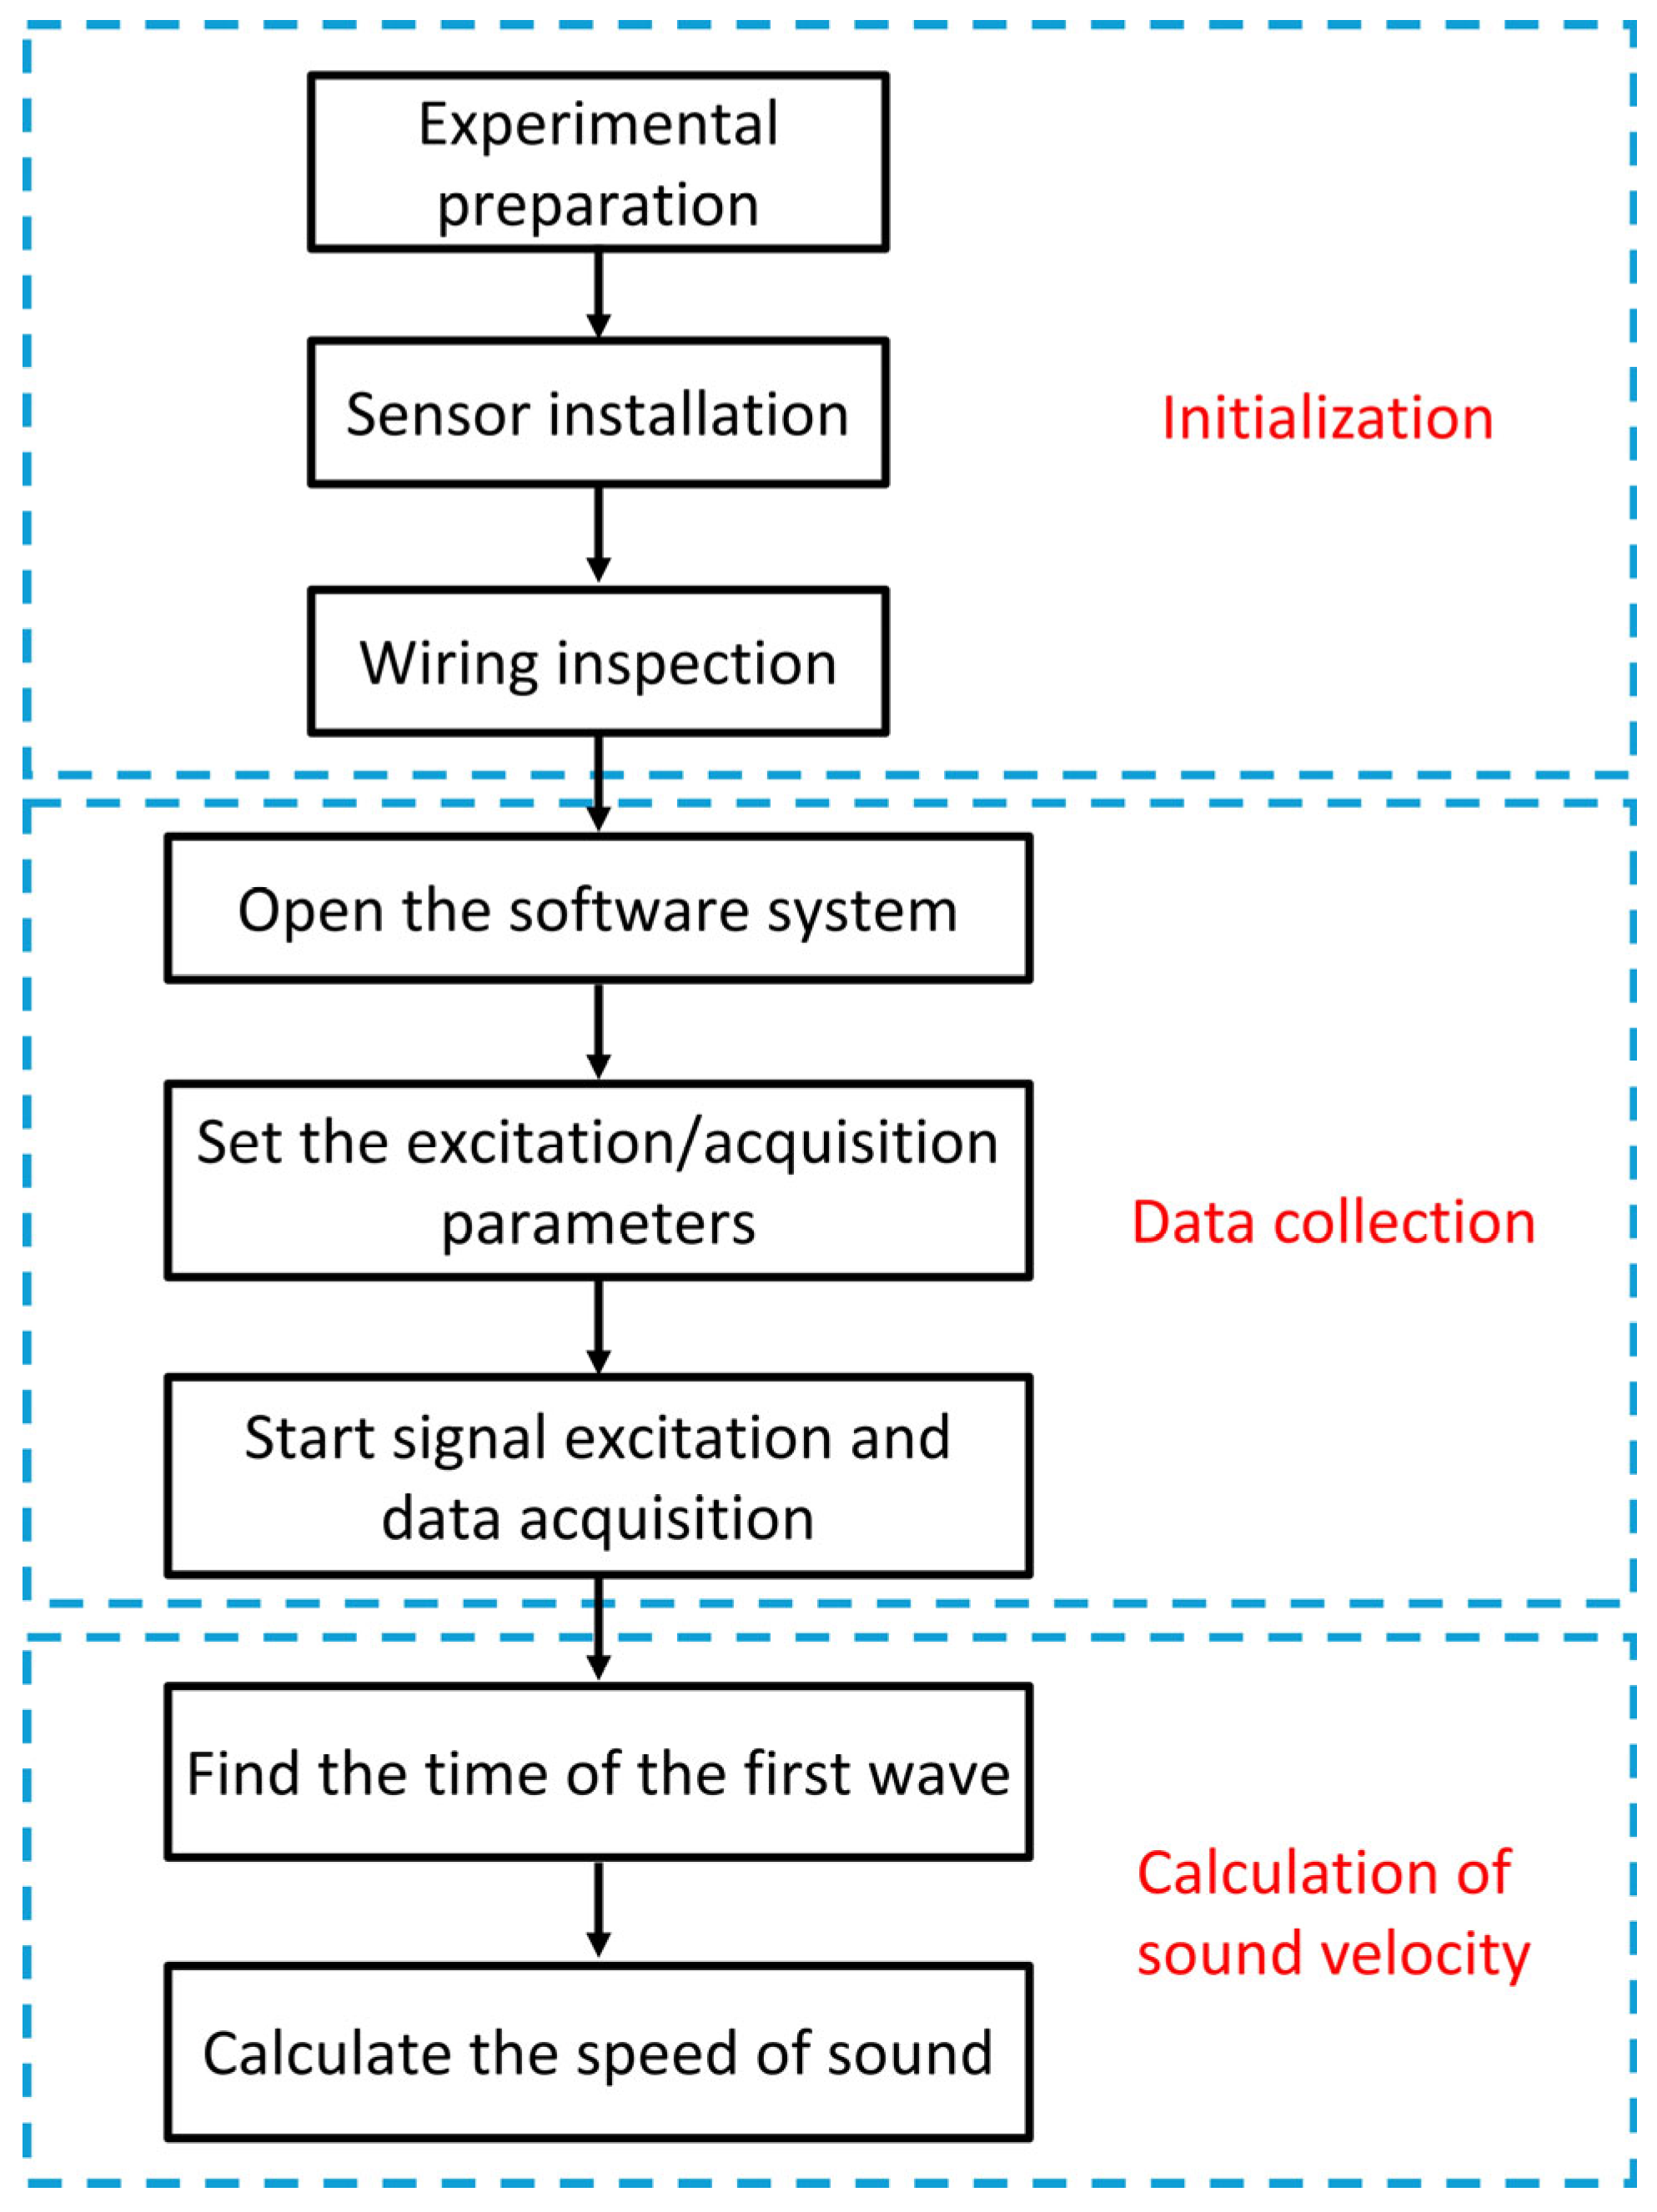
The experimental process consists of three main stages: initialization, data acquisition, and sound velocity calculation. During the initialization stage, the sensors are installed, and all connections are checked. In the data acquisition stage, the software on the computer sets the excitation waveform and acquisition parameters. The system then emits pulse signals and synchronously records the waveforms at the receiving end. In the final stage, the software automatically extracts the arrival time of the first wave and calculates the sound velocity based on the predefined propagation distance. The experimental procedure is shown in
Figure 11.
To ensure the representativeness of the results, multiple sets of measurements were conducted in different media. The results are shown in
Table 2,
Table 3 and
Table 4.
The experimental results show that the measured sound velocities in different media closely match the corresponding theoretical values, with a maximum relative error of no more than 1.5%.
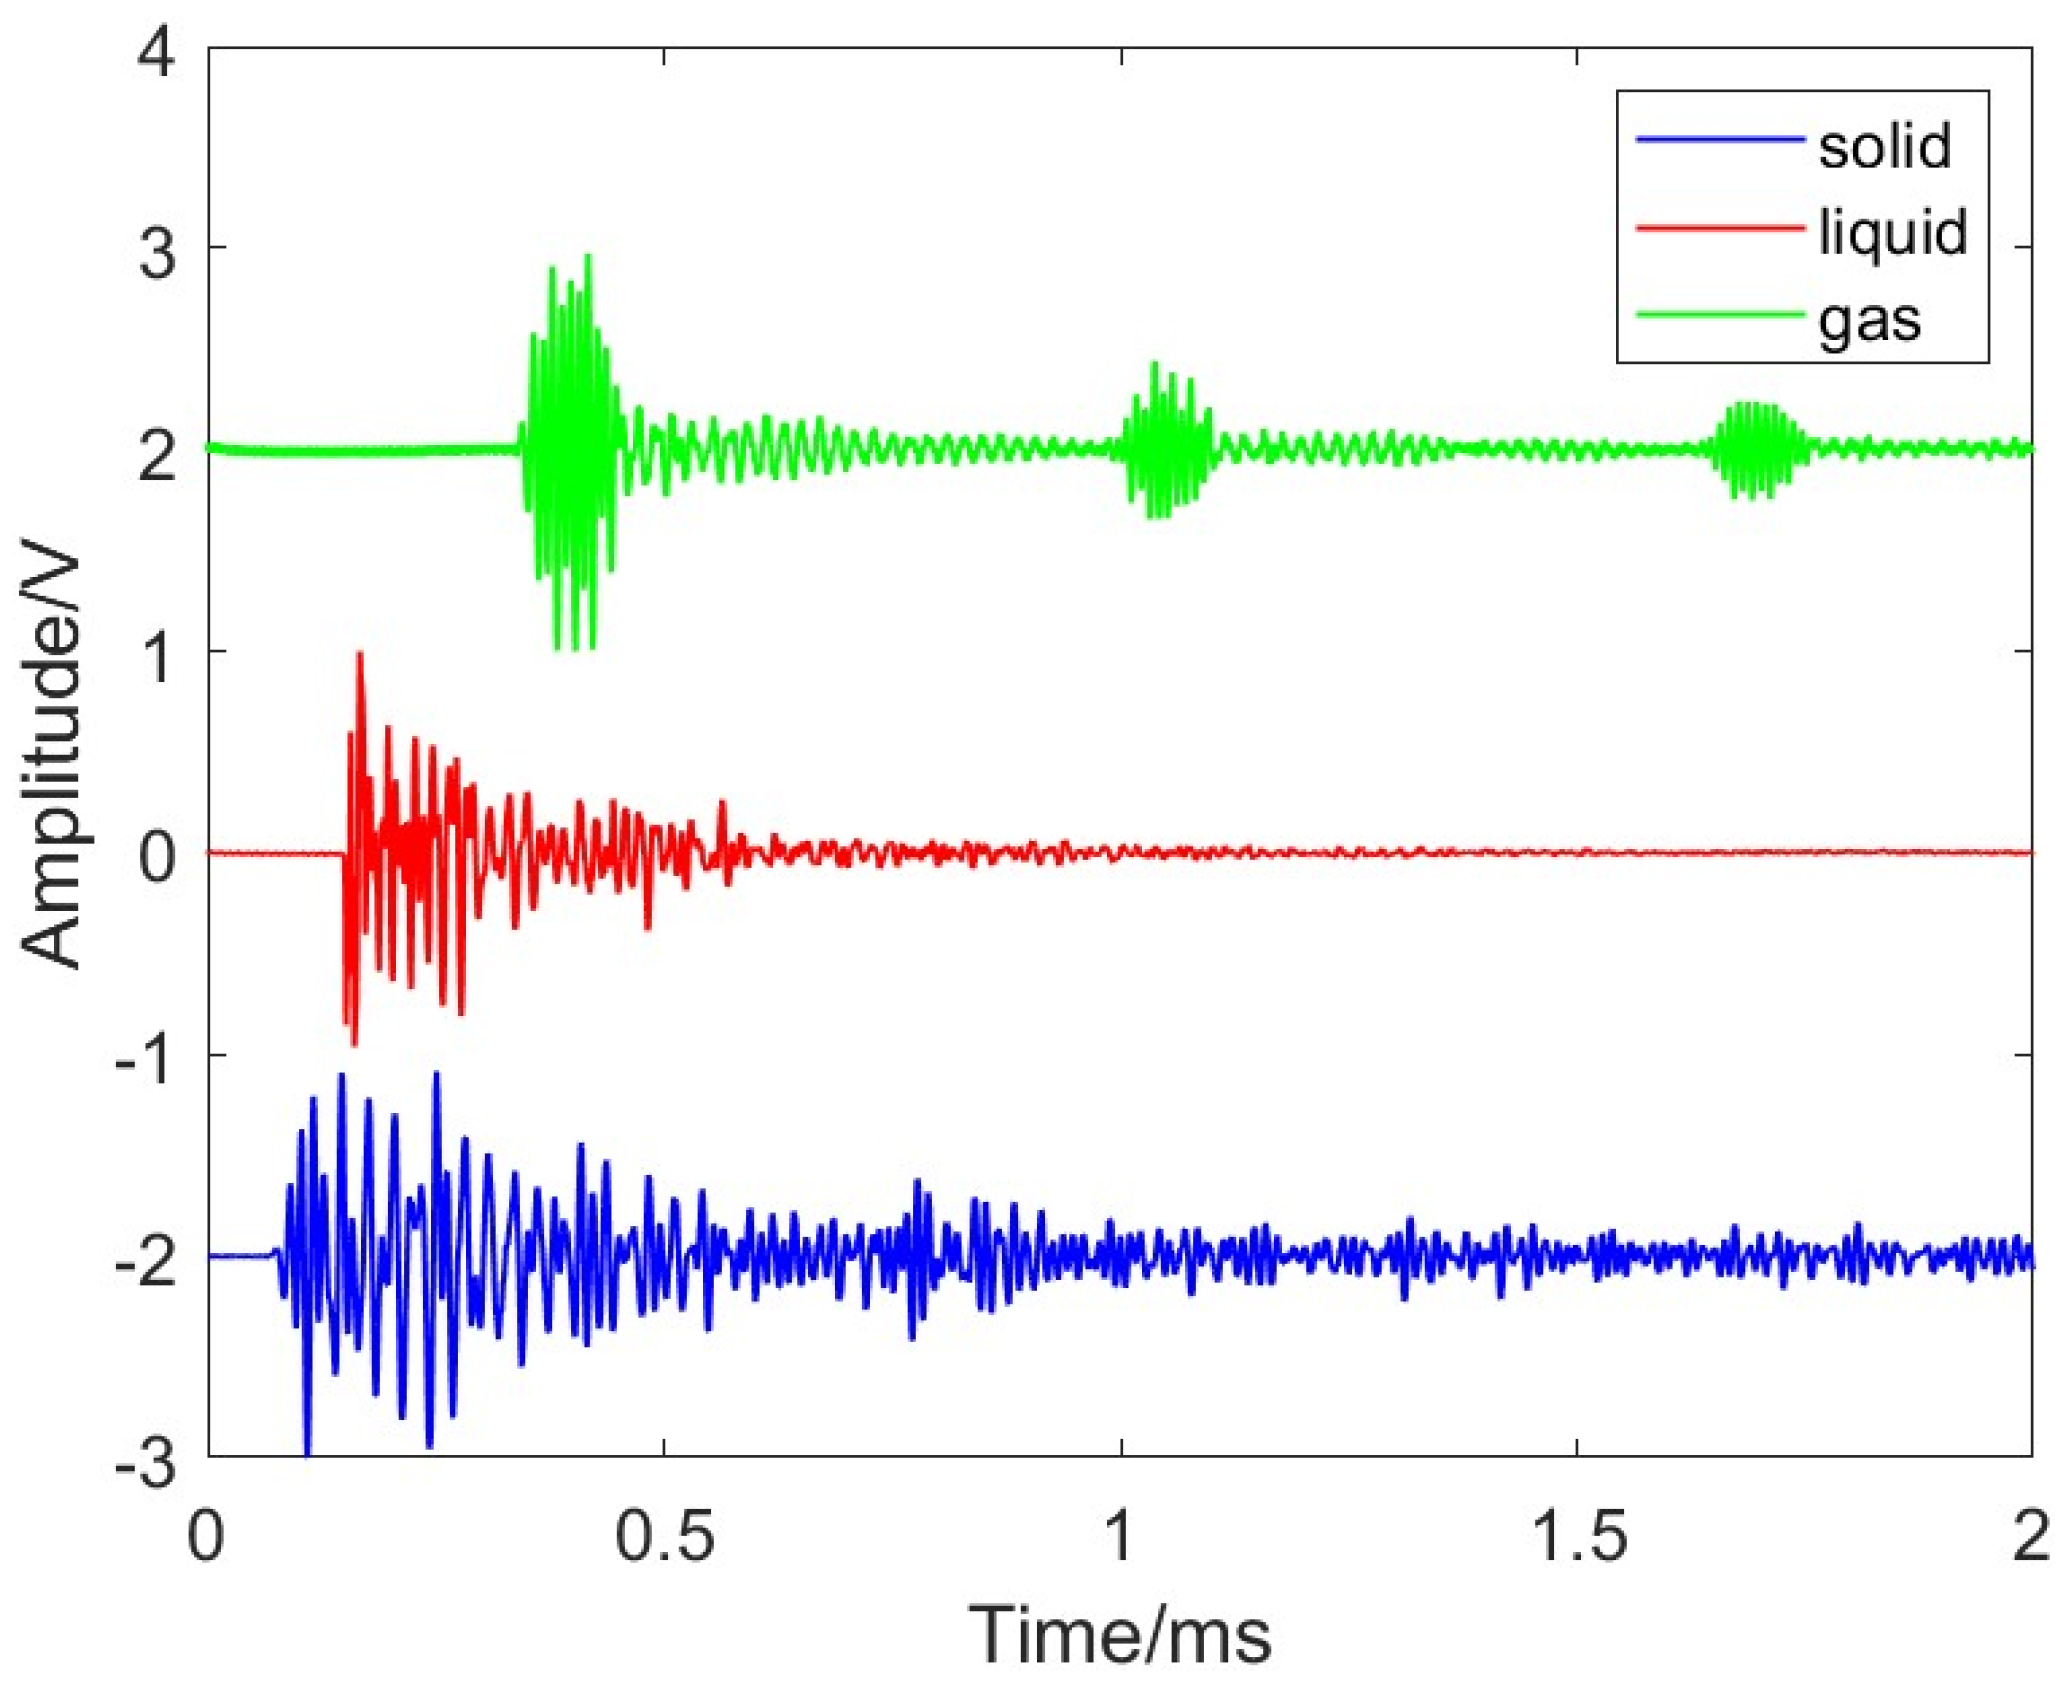
Figure 12 illustrates the time-domain response waveforms of the same excitation signal propagated through three typical media. The horizontal axis represents time (in milliseconds), while the vertical axis represents voltage (in volts). Clear differences can be observed in terms of propagation speed, amplitude attenuation, and waveform broadening across different media, highlighting the significant influence of medium properties on acoustic wave behavior.
In summary, this experiment verifies the system’s adaptability to different propagation media environments. Without requiring any hardware reconfiguration, the excitation and acquisition modules are capable of reliably extracting the first arrival time of acoustic waves, demonstrating excellent consistency in signal excitation and high sampling accuracy. Through a unified sampling rate and signal processing workflow, the system accommodates a wide range of acoustic conditions—from low-speed wave propagation in liquids to high-speed propagation in solids—highlighting its strong generalizability and flexible deployment capability.
As an essential part of fundamental acoustic experiments, this module not only showcases the system’s high precision and operational stability in multi-media sound velocity measurements but also facilitates students’ deeper understanding of wave propagation characteristics and the physical meaning of acoustic velocity. The experiment is well-suited for foundational physics courses in higher education and effectively enhances students’ comprehensive capabilities in experimental operation, data analysis, and engineering interpretation.
3.2. Hydrophone Positioning Experiment Based on TDOA
Underwater acoustic localization experiments are mainly used to verify the principle of sound source localization based on Time Difference of Arrival (TDOA). Let the speed of sound be
, the distance between the two hydrophones be
, and the time it takes for the sound wave to reach the hydrophones R1 and R2 be
and
, respectively. Then, the time difference
. The distances
and
from the sound source to the two hydrophones can be calculated by the following formula:
This model is a classical expression of one-dimensional TDOA-based range difference estimation, commonly adopted in UWB indoor 1D localization studies [
26].
The experiment was carried out in a water tank, with two hydrophones (R1 and R2) fixed at a distance of 26 cm apart. The signal source module generated an excitation signal to drive the transmitting transducer, while the two hydrophones synchronously recorded the received signals. During the experiment, the sound source was sequentially placed at multiple positions. The system software applied cross-correlation to the received waveforms and extracted the time delay (∆t) between the signals. This delay was then substituted into Equations (1) and (2) to calculate the distances from the sound source to each hydrophone. The experimental procedure is shown in
Figure 13.
Figure 14 illustrates the typical process and data results of the hydrophone positioning experiment.
Figure 14a shows the physical setup of the experimental device, including the acoustic source, water tank, two fixed-position hydrophones (R1 and R2), the integrated excitation-acquisition controller, a tablet running the upper-computer software, and a 12 V power module.
Figure 14b illustrates the layout of excitation and reception points. The two hydrophones are placed at a fixed distance, while the sound source is positioned at different locations within the tank to create varying propagation path differences.
Figure 14c presents a typical excitation waveform generated by the system, with the time axis in microseconds (μs) and amplitude in volts (V). The waveform exhibits high time-domain clarity and energy concentration, facilitating subsequent delay measurement and localization calculations.
Figure 14d further shows the signals acquired by both hydrophones along with the indicated time delay ∆t between them, which serves as the basis for TDOA-based localization.
Figure 14e shows the cross-correlation analysis results for the signals received by R1 and R2. The time delay (∆t) between the two signals is clearly visible, with the peak position indicating the time difference used for subsequent.
TDOA calculations. Together, these diagrams provide a comprehensive visualization of the experimental process—from sound wave emission and signal reception to time-delay extraction and positioning calculation. This representation helps students better understand the fundamental principles and signal processing techniques involved in acoustic positioning experiments.
The experimental data are presented in
Table 5. The results indicate that the sound source positions estimated by the system closely match the actual measured values. The maximum positioning error is 0.65 cm, while the average error is only 0.44 cm. These results verify the high accuracy and reliability of the system in underwater acoustic positioning experiments.
In this experiment, the system successfully achieved precise extraction of time differences of arrival (TDOA) and accurate localization by leveraging a unified multi-channel synchronous acquisition architecture. The entire localization process operates without requiring hardware reconfiguration or algorithmic modifications, allowing flexible adaptation to various sensor arrangements and geometric parameters. This demonstrates the system’s high degree of structural generality and configuration compatibility. Experimental results confirm that the system delivers consistently reliable performance in terms of time-domain resolution, signal synchronization, and computation efficiency, effectively supporting the full workflow from data acquisition to position estimation. These capabilities meet the dual instructional demands for spatial localization accuracy and real-time responsiveness.
Furthermore, the experiment offers a concise and intuitive introduction to the TDOA localization principle, clearly demonstrating key steps such as time delay extraction and localization algorithm implementation. Compared with traditional discrete-component setups, the proposed system provides a more integrated solution in terms of operational workflow, user interface, and data processing. This reduces operational complexity and allows students to focus more on mastering localization mechanisms and data analysis methods. As such, the experiment is highly suitable for courses such as Underwater Acoustics and Engineering Acoustics, offering strong adaptability and teaching value.
3.3. Acoustic Remote Detection Experiment
This experiment is designed for courses related to civil engineering and engineering acoustics, and involves the construction of a portable acoustic remote detection platform. Its objective is to help students develop skills in remote sensor data transmission, acoustic signal acquisition and analysis, and non-destructive testing methods in real-world engineering environments. Through this experiment, students gain an intuitive understanding of how acoustic detection technology is applied in structural health monitoring and engineering maintenance. Additionally, they learn to operate remote and networked experimental systems, strengthening their practical skills in modern engineering diagnostics.
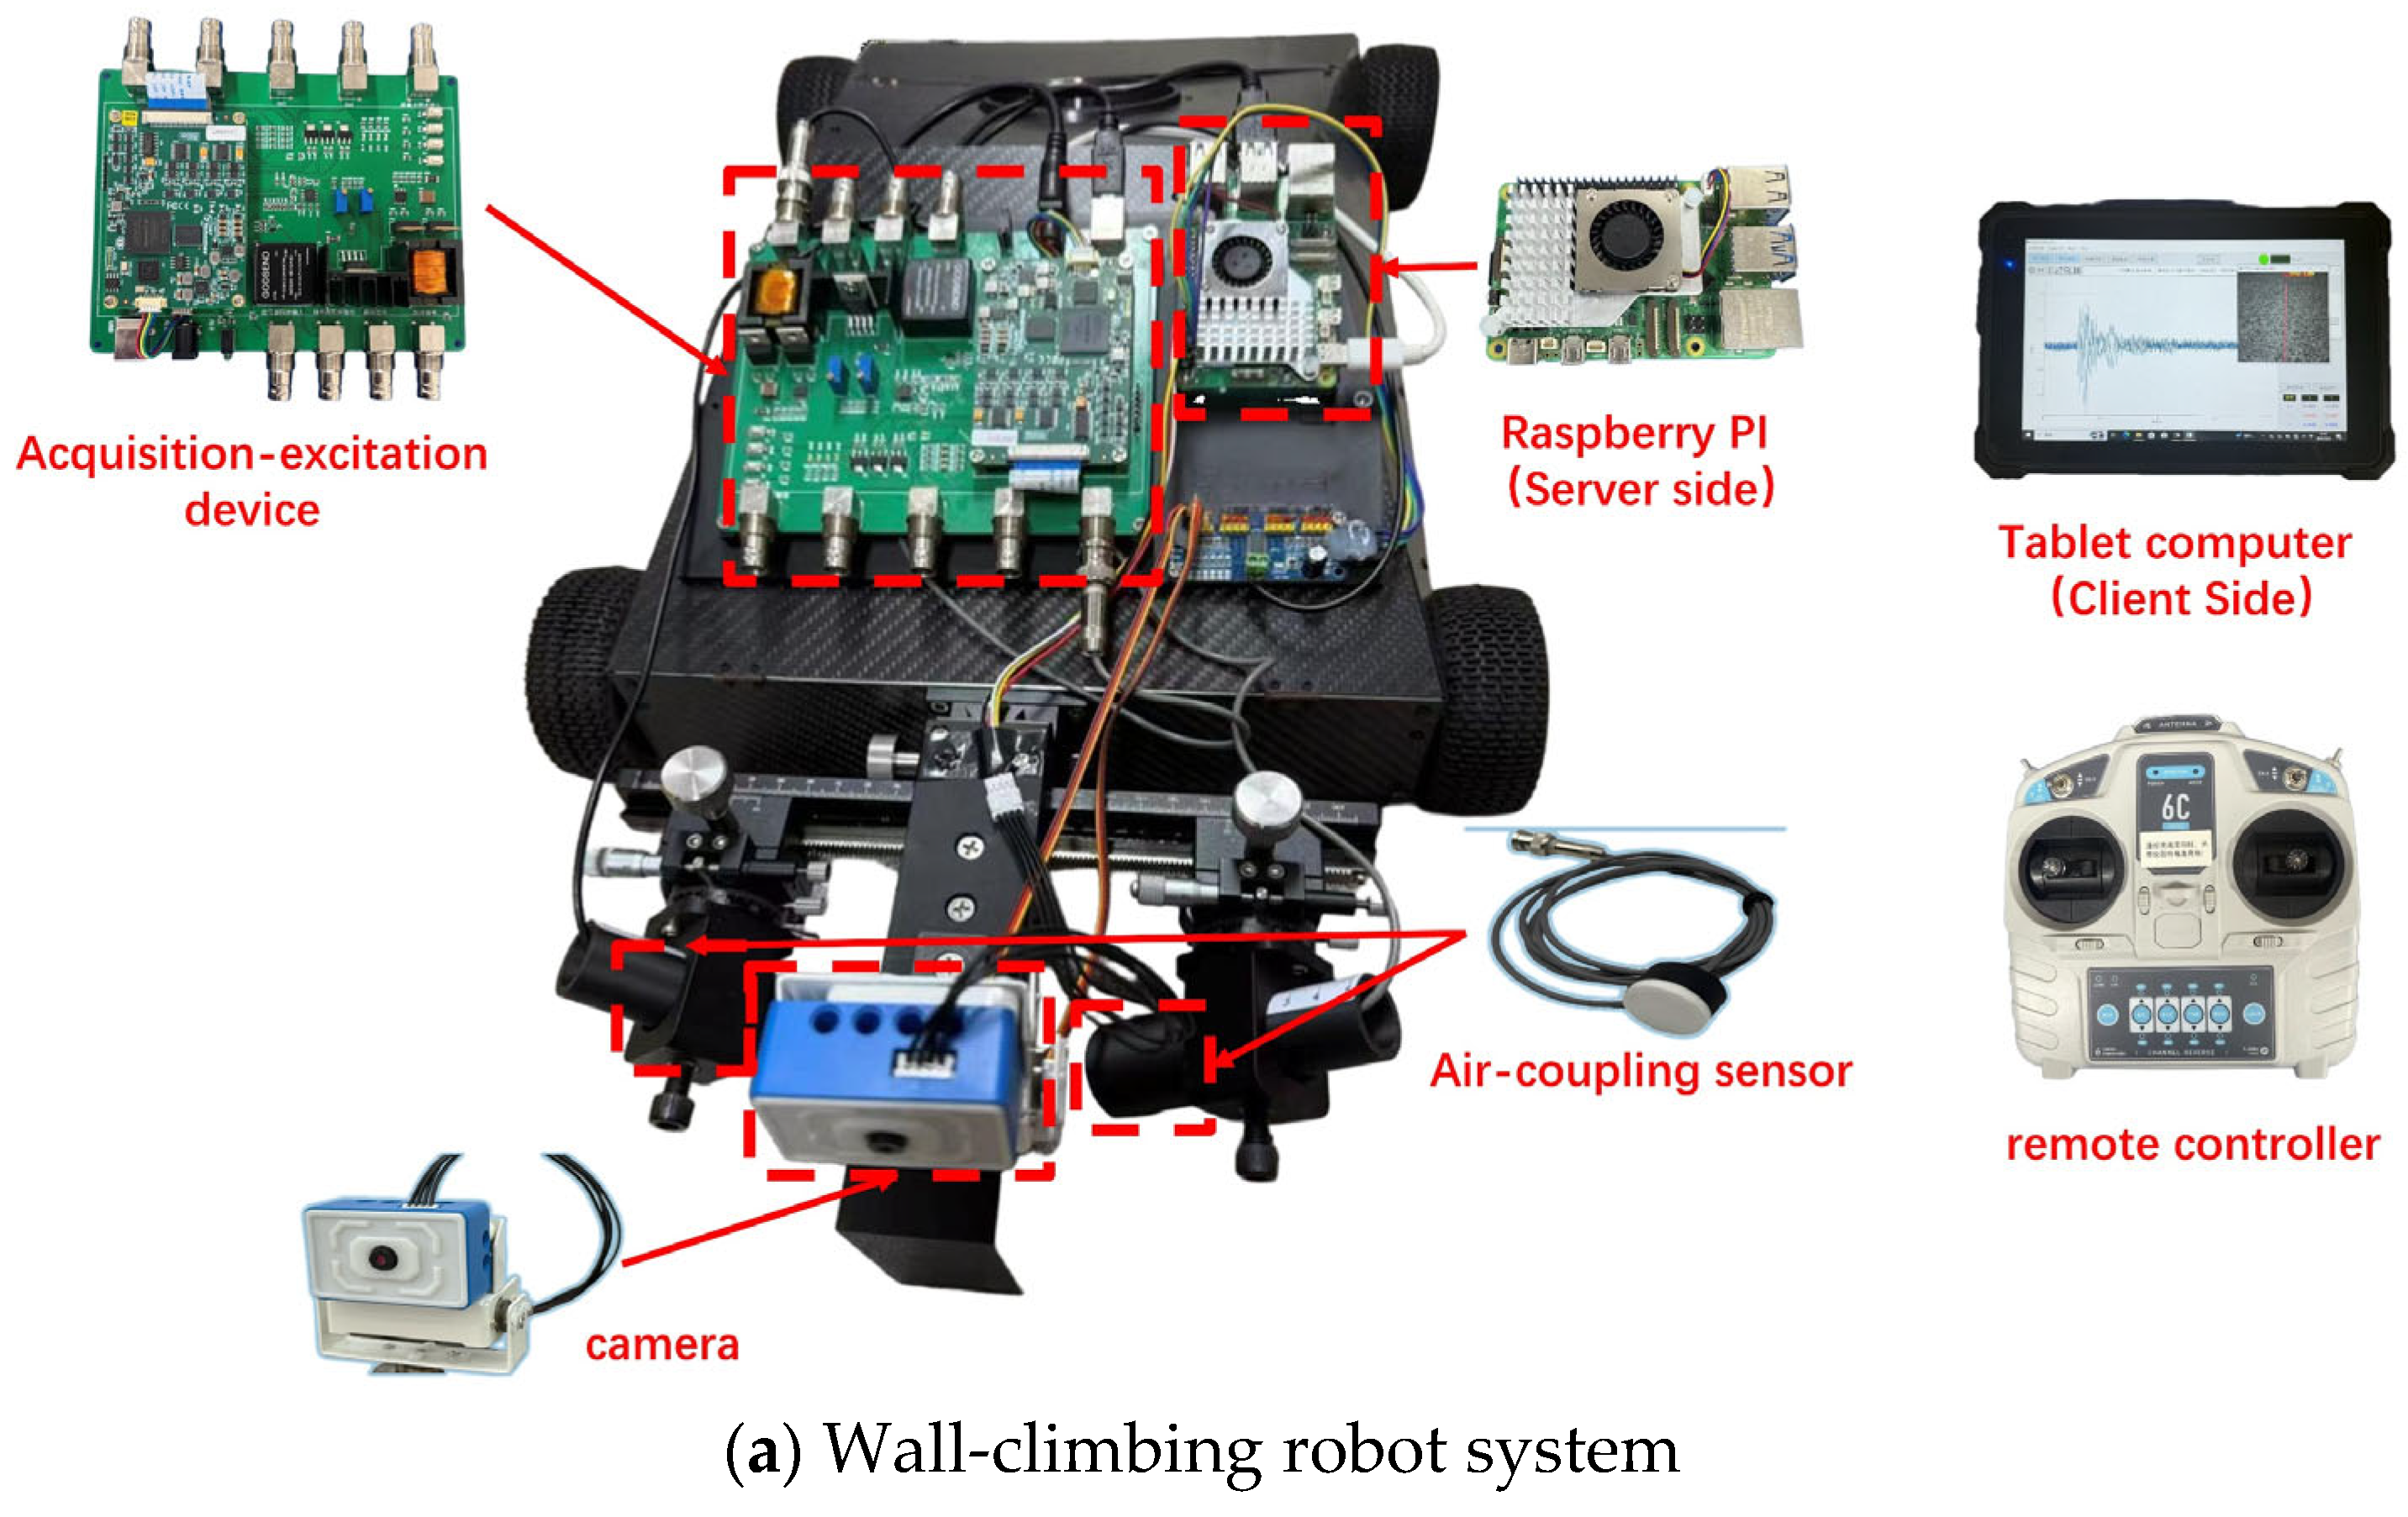
The experimental platform consists of a wall-climbing robot, a remote control unit, and a tablet computer. The wall-climbing robot is procured from TJZX Technology Co., Ltd. (Shanghai, China), while the integrated acquisition and excitation device, Raspberry Pi, camera, and acoustic sensors are independently developed and integrated into the system. This configuration allows the robot to navigate complex environments while performing data collection and image acquisition. The client device communicates with the Raspberry Pi on the robot via the TCP protocol, enabling remote operation and task control.
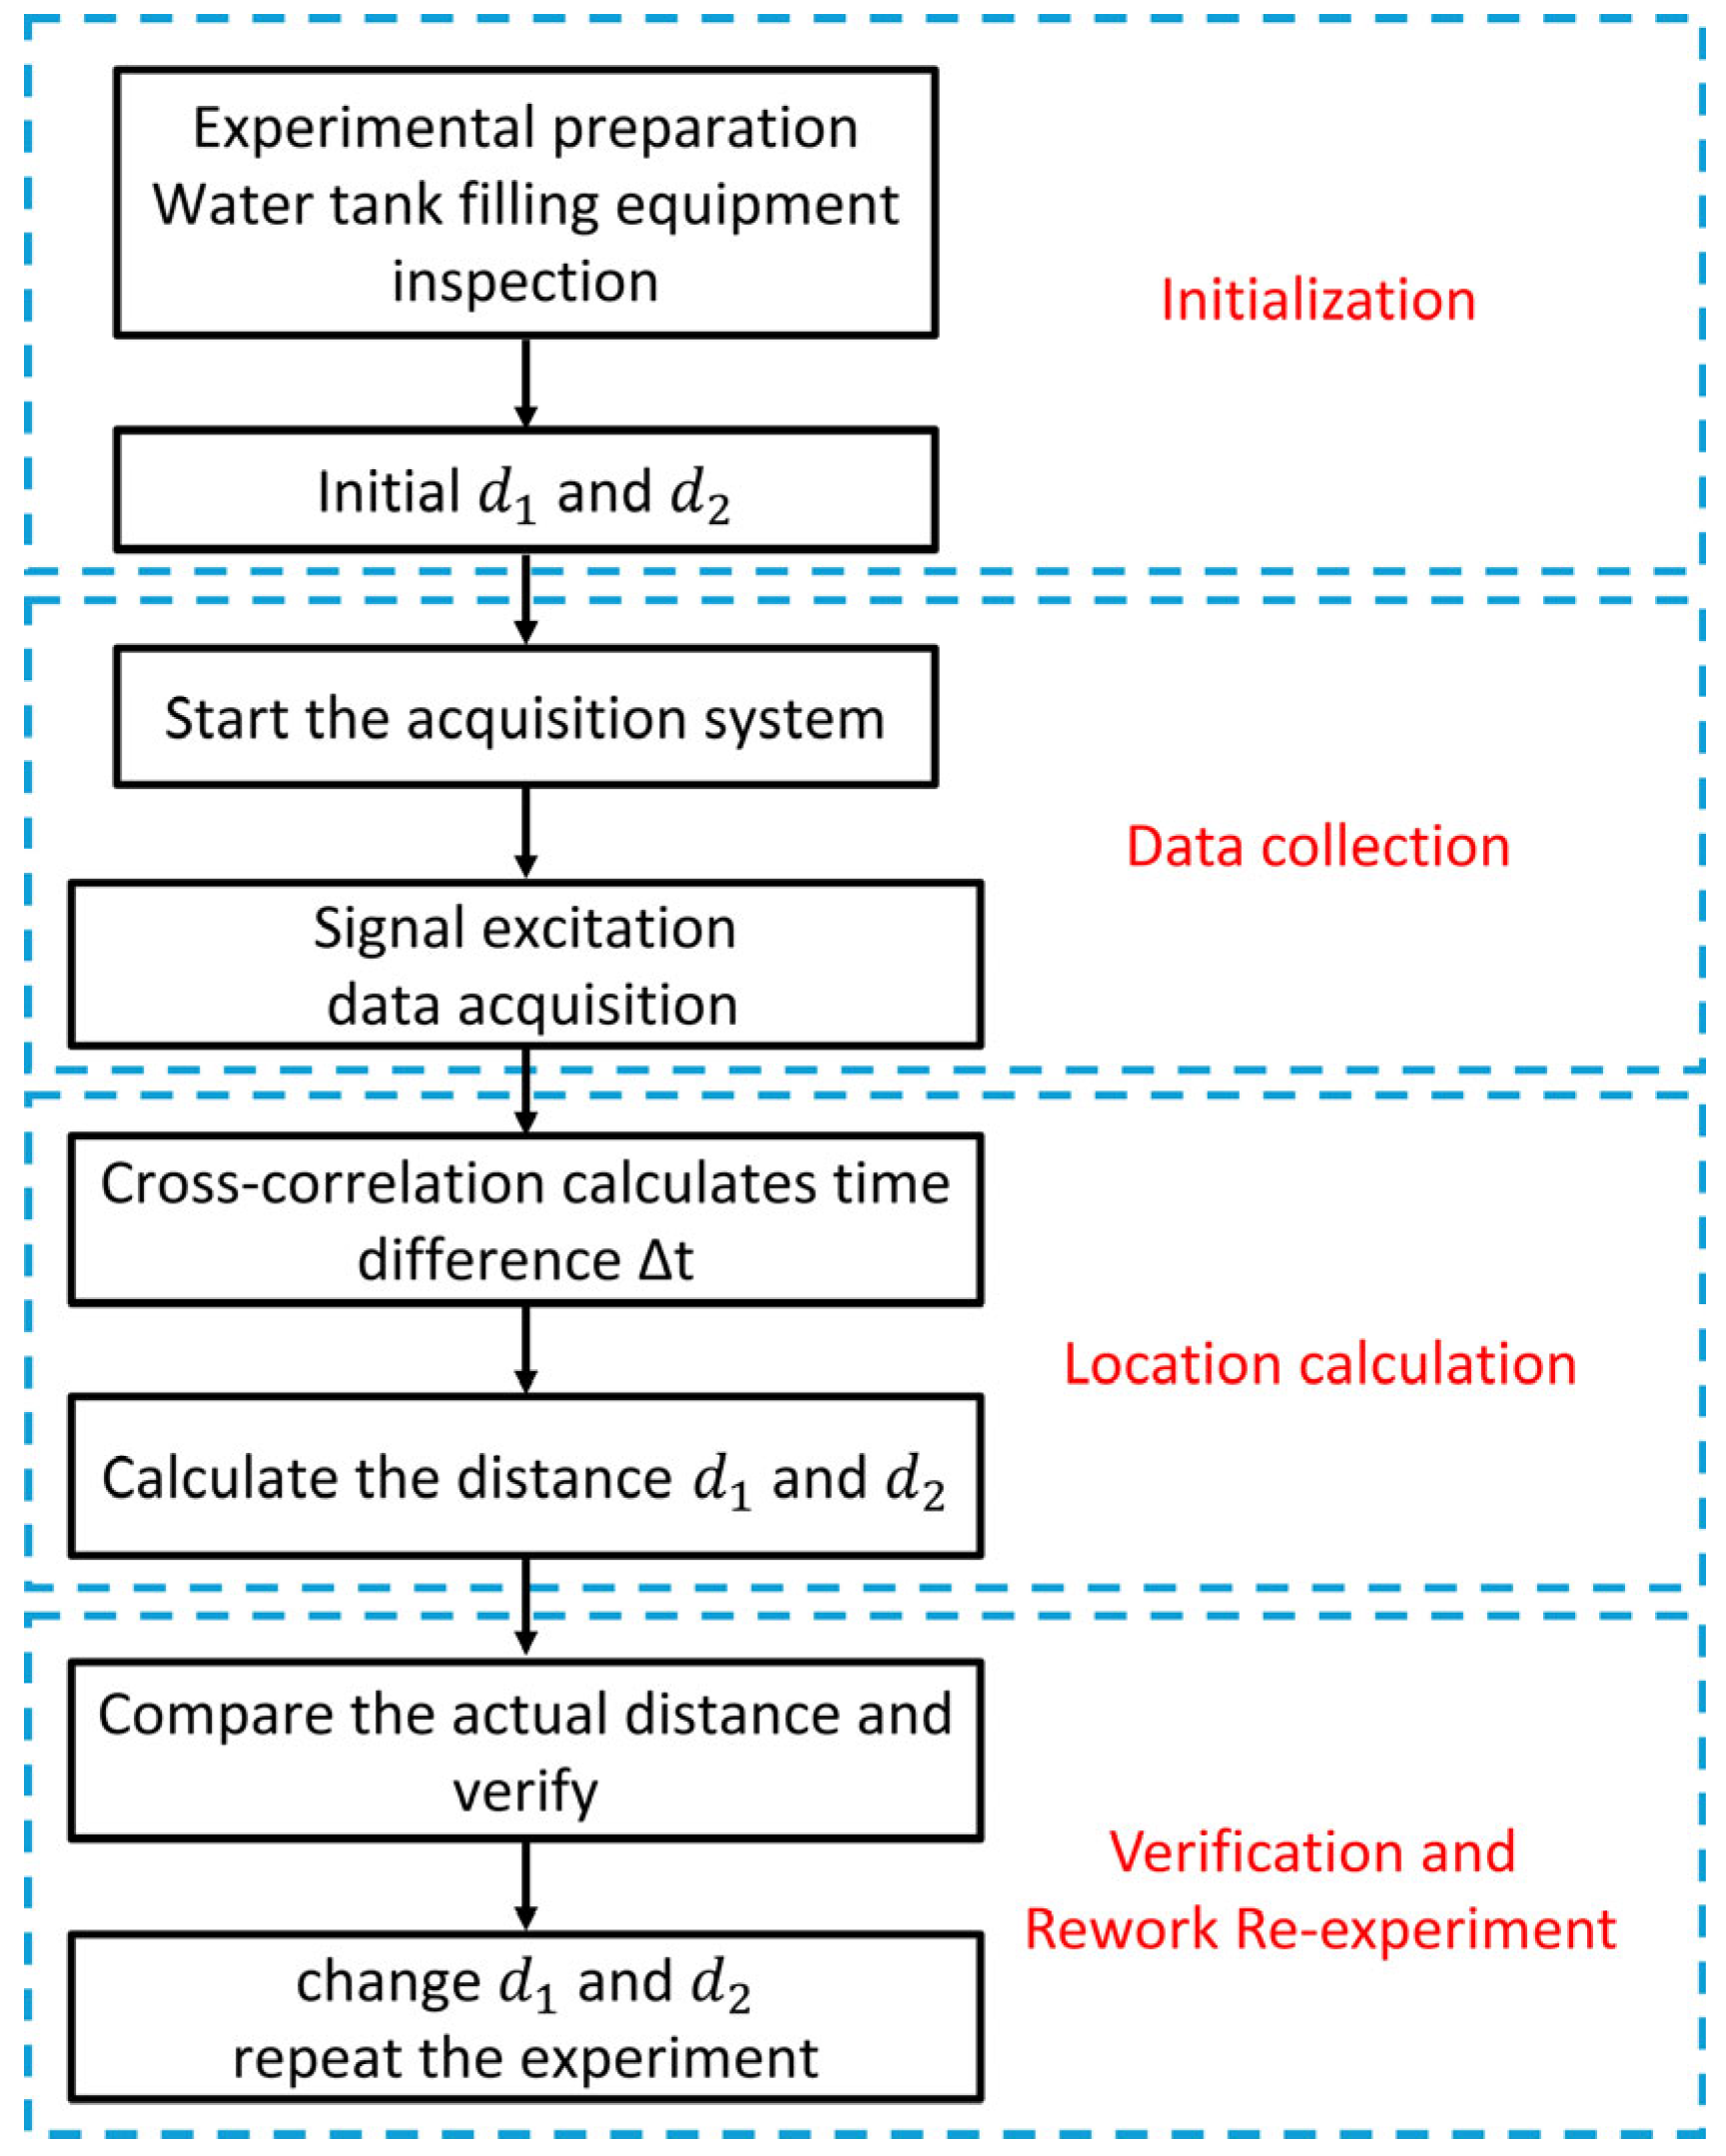
The experimental process, shown in
Figure 15, is divided into four stages: initialization, data acquisition, signal processing and detection analysis, and result storage. Students use the client-side interface to assign tasks and manage data transmission. The system then automatically carries out the detection tasks and outputs the results.
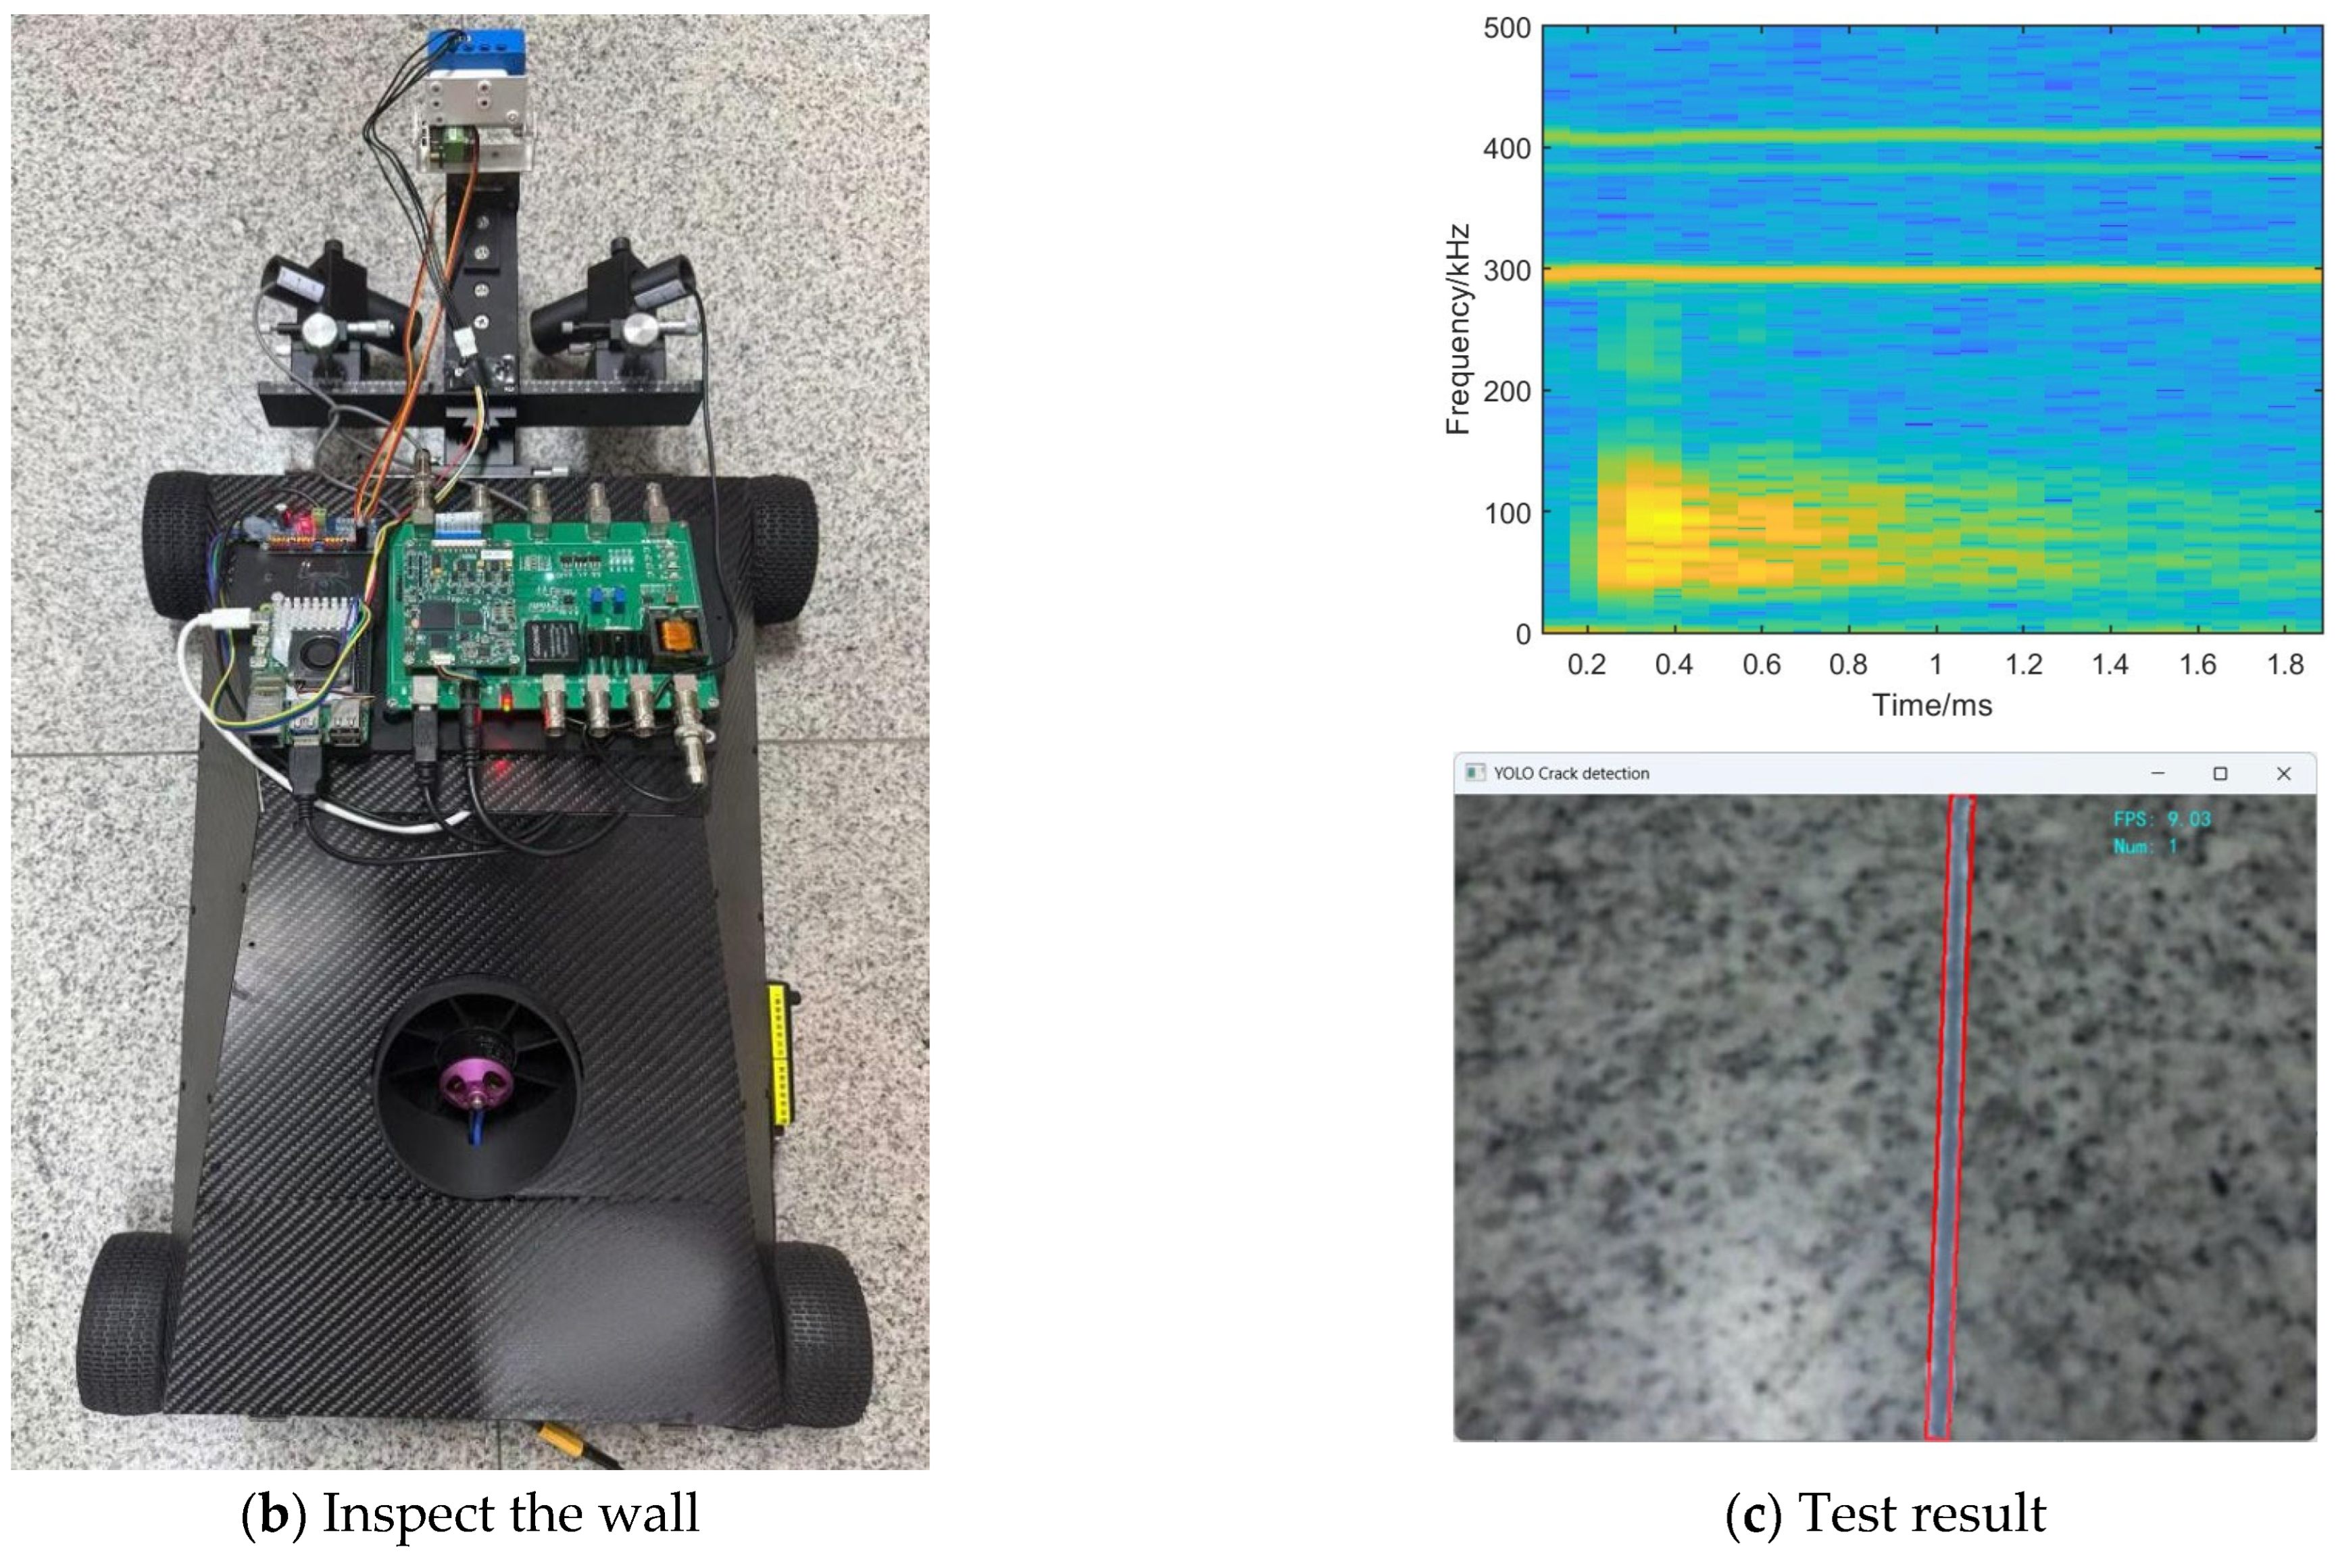
Figure 16 illustrates the experimental setup and practical application scenarios.
Figure 16a shows the wall-climbing robot equipped with acoustic sensors, integrating multiple functions such as acoustic signal acquisition, image recognition, and data transmission;
Figure 16b presents the robot in a working scenario, where negative pressure is applied to the detection surface to ensure stable adhesion and facilitate accurate data collection;
Figure 16c displays the acquired acoustic waveforms alongside the corresponding time-frequency graph and image recognition result(the areas marked with red bounding boxes indicate the locations of identified defects). These results enable defect detection and demonstrate the practical value of combining acoustic and visual inspection technologies in the structural assessment of engineering facilities.
In this experiment, the acoustic inspection robot reliably performed remote signal acquisition and transmission. On the client side, structural response signals and key acoustic features were displayed in real time. By analyzing both acoustic emission and echo signals, the system effectively identified representative structural defects, demonstrating its potential for intelligent inspection and remote monitoring applications. Compared to traditional manual inspection methods, the proposed solution offers superior operational efficiency and safety—especially under conditions involving high-voltage excitation, intense structural responses, or remote network environments. Through robotic execution and integrated software control, the system significantly reduces human contact risk and minimizes equipment damage or signal distortion caused by operational errors, thus providing a safer and more user-friendly experimental platform for teaching purposes.
The experiment was conducted under remote communication conditions, where all system modules—including excitation, acquisition, and data analysis—functioned stably. Time synchronization mechanisms and signal processing routines operated correctly. These results indicate that the platform possesses strong capabilities for remote deployment and cross-environment adaptability, with consistent performance across both local and remote scenarios. Therefore, it is well-suited for various educational and engineering applications.
Through this experiment, students gain a direct understanding of how acoustic inspection technologies are applied in structural health monitoring, while also becoming familiar with the interactive modes of intelligent remote platforms. This experience enhances their interdisciplinary practical skills. Moreover, the experiment serves as a bridge between laboratory teaching and engineering practice, broadening students’ engineering perspectives and reinforcing their systems thinking capabilities.
4. Discussion
This study presents a digital acoustic teaching system centered on the design objectives of portability, programmability, and remote accessibility. Through a tightly integrated hardware–software architecture, the system enables multiple representative experiments to be executed on a unified platform. In educational scenarios such as sound velocity measurement, acoustic source localization, and remote inspection, the system demonstrates strong excitation stability, synchronized data acquisition, and consistent signal processing, thereby preliminarily validating its adaptability for teaching and potential for engineering extension. The modular software interface reduces operational barriers, supporting excitation configuration, signal visualization, and automated processing, thus improving both experimental efficiency and teaching quality.
However, several limitations and challenges remain in the current version of the system. First, the system does not yet support more advanced experimental tasks such as acoustic impedance measurement, complex sound field simulation, or validation of nonlinear propagation mechanisms—capabilities essential for research-oriented curricula and upper-level courses. The current functionality is insufficient for these advanced teaching requirements. Second, although the system supports remote control and data feedback across geographic locations, in scenarios with network instability or significant latency, issues such as packet loss and amplified synchronization errors may arise, potentially degrading the accuracy and completeness of experiments. Furthermore, the remote data processing module imposes a relatively high system load. Without a robust resource scheduling and fault recovery mechanism, the system may experience processing delays or service interruptions during complex task execution.
The system also exhibits limited intelligence. While some automatic analysis and visualization functions have been integrated, complex tasks such as first-arrival detection, defect recognition, and feature extraction still require manual intervention, introducing variability due to subjective judgments. This hinders the system’s effectiveness in batch data processing or large-scale instructional deployment. Additionally, although the user interface is modular, it currently lacks higher-level teaching aids such as experiment workflow management and learning feedback mechanisms, constraining its potential for adaptive teaching and behavioral analysis.
Future development will proceed along two main directions. On the experimental front, the system will be extended to support tasks such as structural parameter inversion, noise impact evaluation, and sound field imaging, thereby enhancing its applicability to advanced teaching and research training. On the system side, improvements will focus on optimizing communication protocols and load management under remote operation, incorporating buffering and timing control strategies to enhance network robustness. Moreover, by integrating deep learning algorithms, the system will aim to automate the identification and evaluation of key acoustic features, ultimately evolving into an intelligent teaching platform capable of adaptive regulation and diagnostics.
5. Conclusions
This study has designed and implemented a digital portable system tailored for acoustic experiment instruction. The system integrates programmable excitation, synchronized acquisition, and real-time analysis capabilities and supports both local and remote experimental operations. It is intended to offer a compact, functionally integrated, and user-friendly solution for acoustic education environments.
The system achieves the following outcomes in terms of hardware–software integration, functional flexibility, and adaptability to diverse teaching contexts:
- (1)
The system demonstrates potential advantages in its portable design. By integrating an FPGA-based signal source excitation and multi-channel synchronous acquisition module, it may reduce the complexity of wiring and operation compared to traditional discrete devices, potentially enhancing the operability and efficiency of classroom experiments.
- (2)
The system enables programmable signal generation. It supports various types of excitation signals, including pulses, sine waves, chirps, and arbitrary waveforms. The parameters can be flexibly configured to meet diverse needs in acoustic experimental teaching and research.
- (3)
The system supports remote operation mode, achieving cross-regional experimental control and data sharing through communication between Raspberry PI and TCP, breaking laboratory time and space limitations, and has the application potential for inter-institutional collaboration and blended teaching.
- (4)
Three typical experiments are used to verify the system. These include multi-media sound velocity measurement, TDOA hydrophone positioning, and remote acoustic detection. The results show that the system performs well in experimental accuracy, positioning stability, and remote detection. This confirms its value in both basic teaching and engineering practice.
In summary, the proposed system provides a viable pathway for enhancing the flexibility and modernization of acoustic experiment instruction. It offers valuable insights into the integration of pedagogical innovation and engineering training.
Author Contributions
Conceptualization, L.C., Q.K. and X.L.; methodology, X.L. and Q.K.; software, G.T.; validation, G.T.; formal analysis, R.W. and X.Z.; investigation, R.W. and X.Z.; resources, L.C., Q.K. and X.L.; data curation, G.T.; writing—original draft preparation, G.T.; writing—review and editing, G.T. and L.C.; visualization, G.T.; supervision, L.C. and Q.K.; project administration, G.T. and X.L.; funding acquisition, L.C. and X.L. All authors have read and agreed to the published version of the manuscript.
Funding
This research was funded by the National Natural Science Foundation under Grant No. 52308327, and the Ministry of Education Supply and Demand Matching Employment and Education Project under Grant Nos. 2025042502613 and 2025070719494.
Data Availability Statement
The original contributions presented in this study are included in the article. Further inquiries can be directed to the corresponding author.
Acknowledgments
The authors would like to thank the journal editors and anonymous reviewers for their valuable and thought-provoking comments and suggestions. The authors remain responsible for any errors or mistakes.
Conflicts of Interest
The authors declare no conflicts of interest.
Abbreviations
The following abbreviations are used in this manuscript:
| DSPS | Digital Signal Processors |
| ADC | Analog-to-digital Converter |
| DAC | Digital-to-analog Conversion |
| FPGA | Field Programmable Gate Array |
| TDOA | Time Difference of Arrival |
References
- Baydur, C.; Wang, X.; Mao, D. The Acoustics Program at the Institute of Acoustics, Tongji University, China. J. Acoust. Soc. Am. 2022, 152, 1058. [Google Scholar] [CrossRef] [PubMed]
- Russell, D.A.; Wilson, P.S. Introduction to the Special Issue on Education in Acoustics. J. Acoust. Soc. Am. 2022, 152, 3102. [Google Scholar] [CrossRef] [PubMed]
- Vogt, P.; Kasper, L.; Rädler, M. Determining the Speed of Sound in Different Gases with a Dog Whistle. Phys. Teach. 2021, 59, 726–727. [Google Scholar] [CrossRef]
- Jiang, L.; Sun, Y.; Zhuang, W.; Wu, J.; Song, J. Measuring the Speed of Sound by Schlieren Imaging. Phys. Teach. 2025, 63, 266–268. [Google Scholar] [CrossRef]
- Rocha, G.D.; Torres, J.C.B.; Petraglia, M.R.; Vorländer, M. Direction of Arrival Estimation of Partial Sound Sources of Vehicles with a Two-Microphone Array. Acta Acust. 2021, 5, 18. [Google Scholar] [CrossRef]
- Lian, B.; Pan, K.; Wang, L.; Shi, L.; Yao, J.; Guo, W. Research and Experimentation on Acoustic Monitoring Technology for Laser Drilling Penetration. Micromachines 2025, 16, 475. [Google Scholar] [CrossRef]
- Vongsawad, C.T.; Neilsen, T.B.; Kingsley, A.D.; Ellsworth, J.E.; Anderson, B.E.; Terry, K.N.; Dobbs, C.E.; Hollingsworth, S.E.; Fronk, G.H. Design of an Underwater Acoustics Lab. Proc. Mtgs. Acoust. 2022, 45, 070005. [Google Scholar]
- Tonelli, D.; Luchetta, M.; Rossi, F.; Migliorino, P.; Zonta, D. Structural Health Monitoring Based on Acoustic Emissions: Validation on a Prestressed Concrete Bridge Tested to Failure. Sensors 2020, 20, 7272. [Google Scholar] [CrossRef]
- Sidebottom, D.L. Slow Sound: An Undergraduate Lab Experience for Critical Thinking. Am. J. Phys. 2020, 88, 521–525. [Google Scholar] [CrossRef]
- Rasnow, B. Flipping the Electronics Lab: Learning Upper Division Electronics at Home. Am. J. Phys. 2024, 92, 809–818. [Google Scholar] [CrossRef]
- Staacks, S.; Hütz, S.; Heinke, H.; Stampfer, C. Simple Time-of-Flight Measurement of the Speed of Sound Using Smartphones. Phys. Teach. 2019, 57, 112–113. [Google Scholar] [CrossRef]
- Faux, D.A.; Godolphin, J. Manual Timing in Physics Experiments: Error and Uncertainty. Am. J. Phys. 2019, 87, 110–115. [Google Scholar] [CrossRef]
- McEachern, J.; Malekshahi, E.; Hotkani, M.M.; Bousquet, J.F. Real-Time Passive Underwater Localization Using a Compact Acoustic Sensor Array. Comput. Netw. 2024, 251, 110621. [Google Scholar] [CrossRef]
- Xu, Z.; Chen, Z. Optimizing Time-Delay Estimation for Underwater Acoustic Positioning in Tank Inspection Robots to Mitigate Reflection Interference. Appl. Ocean Res. 2025, 154, 104427. [Google Scholar] [CrossRef]
- Peng, Z.E.; Buss, E.; Shen, Y.; Bharadwaj, H.; Stecker, G.C.; Beim, J.A.; Bosen, A.K.; Braza, M.; Diedesch, A.C.; Dorey, C.M.; et al. Remote Testing for Psychological and Physiological Acoustics: Initial Report of the P&P Task Force on Remote Testing. Proc. Meet. Acoust. 2020, 42, 050009. [Google Scholar] [CrossRef]
- Duncan, A.J.; Lucke, K.; Erbe, C.; McCauley, R.D. Issues associated with sound exposure experiments in tanks. Proc. Mtgs. Acoust. 2016, 27, 070008. [Google Scholar]
- Silva, A.; Carvalho, F.; Cruz, B.F. High-Performance Wide-Band Open-Source System for Acoustic Stimulation. HardwareX 2024, 19, e00555. [Google Scholar] [CrossRef]
- Mevsim, E.; Mutlu, R. A Microcontroller-Based Signal Generator With High Output Current. Trak. Üniv. Mühendis. Bilim. Derg. 2024, 25, 1–9. [Google Scholar] [CrossRef]
- Moheit, L.; Schmid, J.D.; Schmid, J.M.; Eser, M.; Marburg, S. Acoustics Apps: Interactive simulations for digital teaching and learning of acoustics. J. Acoust. Soc. Am. 2021, 149, 1175. [Google Scholar] [CrossRef] [PubMed]
- Averina, I.; Yusuf, E. Physics Laboratory with Smartphone: Sound and Light. J. Phys. Conf. Ser. 2023, 2596, 012062. [Google Scholar] [CrossRef]
- Wang, J.; Li, C.; Lin, Y.; Weng, C.; Jiao, Y. Smart Soundscape Sensing: A Low-Cost and Integrated Sensing System for Urban Soundscape Ecology Research. Environ. Technol. Innov. 2023, 29, 102965. [Google Scholar] [CrossRef]
- Terkaj, W.; Pessot, E.; Kuts, V.; Bondarenko, Y.; Pizzagalli, S.L.; Kleine, K. A framework for the design and use of virtual labs in digital engineering education. AIP Conf. Proc. 2024, 2989, 030003. [Google Scholar] [CrossRef]
- Alhashem, F.; Alfailakawi, A. Technology-Enhanced Learning through Virtual Laboratories in Chemistry Education. Contemp. Educ. Technol. 2023, 15, ep474. [Google Scholar] [CrossRef]
- Gui, D.; Yu, Z. Research on the Key Technology of High-Precision Waveform Synchronization Identification and Measurement. PLoS ONE 2024, 19, e0299027. [Google Scholar] [CrossRef]
- Zhou, F.; Song, S.; Deng, Y.; Zhang, T.; Chen, B.; Xu, N. Mixed-Signal Data Acquisition System for Optically Detected Magnetic Resonance of Solid-State Spins. Rev. Sci. Instrum. 2021, 92, 114702. [Google Scholar] [CrossRef] [PubMed]
- Ma, T.; Zhang, D.; Zhuang, J.; You, C.; Yin, G.; Tang, S. TDOA-Based UWB Indoor 1D Localization via Weighted Sliding Window Filtering. Digit. Signal Process. 2024, 151, 104544. [Google Scholar] [CrossRef]
Figure 1.
Commonly used acoustic experimental equipment in colleges and universities (signal generators (MFG-2160MF, GW Instek, Taiwan, China) and oscilloscopes (DS1152E, RIGOL Technologies, Inc., Beijing, China)).
Figure 1.
Commonly used acoustic experimental equipment in colleges and universities (signal generators (MFG-2160MF, GW Instek, Taiwan, China) and oscilloscopes (DS1152E, RIGOL Technologies, Inc., Beijing, China)).
Figure 2.
Common acoustic detection experimental devices in colleges and universities.
Figure 2.
Common acoustic detection experimental devices in colleges and universities.
Figure 3.
Overall system architecture diagram.
Figure 3.
Overall system architecture diagram.
Figure 4.
Integrated device for collection and excitation.
Figure 4.
Integrated device for collection and excitation.
Figure 5.
Block diagram of the signal source excitation module.
Figure 5.
Block diagram of the signal source excitation module.
Figure 6.
Block diagram of the multi-channel synchronous acquisition module.
Figure 6.
Block diagram of the multi-channel synchronous acquisition module.
Figure 7.
The operation process of the local mode.
Figure 7.
The operation process of the local mode.
Figure 8.
The operation process of remote mode.
Figure 8.
The operation process of remote mode.
Figure 9.
System software interface and function display.
Figure 9.
System software interface and function display.
Figure 10.
Multi-media sound velocity measurement experimental apparatus and environment.
Figure 10.
Multi-media sound velocity measurement experimental apparatus and environment.
Figure 11.
Flowchart of the sound velocity measurement experiment.
Figure 11.
Flowchart of the sound velocity measurement experiment.
Figure 12.
Comparison of response waveforms in different media.
Figure 12.
Comparison of response waveforms in different media.
Figure 13.
Flowchart of underwater acoustic positioning experiment.
Figure 13.
Flowchart of underwater acoustic positioning experiment.
Figure 14.
Hydrophone positioning experimental device and measurement results.
Figure 14.
Hydrophone positioning experimental device and measurement results.
Figure 15.
Flowchart of the remote detection experiment for wall-climbing robots.
Figure 15.
Flowchart of the remote detection experiment for wall-climbing robots.
Figure 16.
Wall-climbing robot detection device and detection results.
Figure 16.
Wall-climbing robot detection device and detection results.
Table 1.
Comparative Analysis of Representative Acoustic Experimental Teaching Systems.
Table 1.
Comparative Analysis of Representative Acoustic Experimental Teaching Systems.
| System/Method | Advantages | Limitations |
|---|
| PC sound card acquisition system | Low cost, suitable for beginner teaching | Low precision, lacking remote and multi-channel support |
| Single-chip microcomputer/DSP waveform generator | Simple and portable, easy to deploy quickly | Single-function and weak in signal processing capability. |
| Virtual simulation + online platform | Strong remote interaction, suitable for modern teaching. | The lack of real hardware leads to insufficient authenticity of the experiment. |
| Software-defined experimental system | Built-in processing algorithm with certain intelligent analysis functions | Lack of hardware integration and limited responsiveness |
| Embedded multi-channel teaching platform | Real-time collection and analysis integration, suitable for classroom training | Complex interface and weak remote capabilities |
Table 2.
Measurement results of sound velocity in brass.
Table 2.
Measurement results of sound velocity in brass.
| Number | Distance
(cm) | Measurement Time
(µs) | Measured Speed of Sound
(m/s) | Theoretical Speed of Sound (m/s) | Relative Error (%) |
|---|
| 1 | 18 | 59 | 3050 | 3050 | 0 |
| 2 | 22 | 72 | 3055 | 0.16 |
| 3 | 26 | 85 | 3058 | 0.26 |
| Average | - | - | 3054.33 | - | 0.14 |
Table 3.
Measurement results of sound velocity in water.
Table 3.
Measurement results of sound velocity in water.
| Number | Distance
(cm) | Measurement Time
(µs) | Measured Speed of Sound
(m/s) | Theoretical Speed of Sound (m/s) | Relative Error (%) |
|---|
| 1 | 180 | 120 | 1500 | 1500 | 0 |
| 2 | 200 | 131 | 1527 | 1.8 |
| 3 | 260 | 169 | 1538 | 2.5 |
| Average | - | - | 1516.25 | - | 1.43 |
Table 4.
Measurement results of sound velocity in the air.
Table 4.
Measurement results of sound velocity in the air.
| Number | Distance
(cm) | Measurement Time
(µs) | Measured Speed of Sound
(m/s) | Theoretical Speed of Sound (m/s) | Relative Error (%) |
|---|
| 1 | 100 | 0.305 | 328 | 330 | 0.6 |
| 2 | 120 | 0.366 | 328 | 0.6 |
| 3 | 160 | 0.483 | 331 | 0.3 |
| Average | - | - | 1516.25 | - | 0.5 |
Table 5.
Positioning and error calculation.
Table 5.
Positioning and error calculation.
| Number |
(ms) | Estimation
(/cm) | Actual
(/cm) | Estimation
(/cm) | Actual
(/cm) | Error
(cm) |
|---|
| 1 | 0.098 | 5.65 | 5 | 20.35 | 21 | 0.65 |
| 2 | 0.091 | 6.175 | 6 | 19.825 | 20 | 0.175 |
| 3 | 0.032 | 10.6 | 10 | 15.4 | 16 | 0.6 |
| 4 | 0.032 | 15.4 | 16 | 10.6 | 10 | 0.6 |
| 5 | 0.062 | 17.65 | 17 | 8.35 | 9 | 0.65 |
| 6 | 0.094 | 20.05 | 20 | 5.95 | 6 | 0.05 |
| Disclaimer/Publisher’s Note: The statements, opinions and data contained in all publications are solely those of the individual author(s) and contributor(s) and not of MDPI and/or the editor(s). MDPI and/or the editor(s) disclaim responsibility for any injury to people or property resulting from any ideas, methods, instructions or products referred to in the content. |
© 2025 by the authors. Licensee MDPI, Basel, Switzerland. This article is an open access article distributed under the terms and conditions of the Creative Commons Attribution (CC BY) license (https://creativecommons.org/licenses/by/4.0/).

