Article

The Effects of Constant Mechanical Wind, Sinusoidal Wind, and Simulated Natural Wind on Thermal Comfort in a Slightly Hot Environment

1
Qingdao Haier Air Conditioner Co., Ltd., Qingdao 266101, China
2
National Engineering Research Center of Digital Home Networking, Qingdao 266101, China
3
Department of Building Science, School of Architecture, Tsinghua University, Beijing 100084, China
*
Authors to whom correspondence should be addressed.
Buildings 2025, 15(20), 3711; https://doi.org/10.3390/buildings15203711
Submission received: 7 September 2025 / Revised: 5 October 2025 / Accepted: 11 October 2025 / Published: 15 October 2025

Abstract

In high-temperature environments, using airflow systems has been demonstrated to be an effective method of regulating thermal sensation and enhancing thermal comfort. Given the importance of optimizing airflow selection strategies, the impact of different airflow forms on thermal comfort is a topic worthy of consideration. This study aimed to compare and analyze thermal comfort under three distinct airflow conditions: constant mechanical wind, sinusoidal wind and simulated natural wind. The experimental condition was set to a high temperature of 30 °C. The experimental results show that thermal sensation votes (TSV) are lower and thermal comfort votes (TCV) are higher in the simulated natural wind environment than in the other two environments. Statistical analysis of subjects’ environmental preferences showed that simulated natural wind was the most preferred option. When exposed to simulated natural wind, subjects reported a stronger sense of softness and relaxation than when exposed to constant mechanical wind or sinusoidal wind. Additionally, the level of calmness experienced under the simulated natural wind condition was found to be lower than that observed under the constant mechanical wind condition. Comparing TSV and TCV results over time reveals that thermal comfort is influenced not only by thermal sensation but also by the stimulation that different types of airflow variation exert on the human body. Concurrently, in airflow environments, thermal sensation exhibits a non-linear relationship with changes in skin temperature, and this relationship may be influenced by airflow stimulation. This study clarifies the mechanism by which different airflows affect thermal comfort differently in high-temperature environments. It thereby provides both experimental evidence and theoretical support for the airflow design of air-conditioning systems, with the goal of aligning such designs with human physiological perceptual characteristics.

1. Introduction

With the development of social economy and the improvement of residents’ living standards, air-conditioning systems have become an indispensable part of modern building environments. As important devices for regulating the indoor thermal environment, air conditionings play a key role in enhancing thermal comfort [1]. However, in actual use, user satisfaction with the comfort of air conditioning air supply still needs to be improved [2]. Studies have shown that when air conditioning airflow acts directly on the human body, it may lead to discomfort for users and even cause health problems [3]. From a health perspective, in 2012, Chen et al. [3] found that current air conditioning and mechanical ventilation systems are designed to maintain an appropriate indoor relative humidity to prevent the growth of biological pollutants such as fungi and bacteria. A large amount of cold air needs to be introduced, creating a 5–8 °C temperature difference between the inside and outside of the building, causing the occupants inside to feel overly cold. In 2018, D’Amato et al. [4] found that if indoor exposure occurs quickly and without any gradual adaptation to a temperature 2–3 °C lower than the external temperature and especially with a 5 °C difference and humidity of between 40% and 60%, there is a risk of negative consequences on the respiratory tract. From a comfort perspective, Tamura et al. [5] found that the comfort level under direct airflow in a cooling environment was lower than that under indirect airflow. This was also supported by the results of an electroencephalogram. This phenomenon was further verified in the questionnaire survey conducted prior to this study, which focused on people’s air conditioner usage habits. The questions covered the placement of air conditioners in the home, usage frequency, temperature setting, and wind direction selection. These questionnaires were distributed online, and the results obtained indicated that in summer air conditioning use scenarios, 75% of the users tended to choose the wind direction swing mode, while only 25% of the users chose the fixed wind direction mode. All of these studies reflect the problems associated with the direct blowing of cooling air towards the human body. In addition, the respondents generally reflected that the existing air conditioning airflow had the problem of insufficient softness, which indicates that there is still a large optimization space for the current air conditioning airflow mode.
A substantial body of research has demonstrated that reasonable airflow configurations can markedly reduce thermal sensation and effectively alleviate discomfort in high-temperature environments [6,7,8]. In 1974, Fanger [9] discovered that an average wind speed of 0.8 m/s could make the subjects feel comfortable in an environment of 28 °C. Subsequently, in 1998, the research results of Arens et al. [10] indicated that when the metabolic rate was set at 1.0 met, an airflow of 1.4 m/s could raise the tolerable temperature of the environment to 31 °C. In 2022, Yu et al. [11] found that under the condition of temperature of 32 °C and humidity of 50%, the comfortable wind speed range was 1.09–1.87 m/s. Most of these studies were focused on summer conditions, and the clothing was generally conventional summer clothing with a clothing insulation of around 0.5–0.6 clo. The results of field surveys conducted on the subject of thermal comfort in China have demonstrated that current indoor temperatures set during the summer months are, in some cases, unnecessarily low [12]. By optimizing the airflow design, the summer indoor temperature setpoint can be appropriately increased, ensuring thermal comfort and reducing cooling energy consumption of air conditioning systems [13,14]. However, it should be noted that there are certain limitations to the extent to which airflow can enhance comfort. It has been demonstrated that when the ambient temperature exceeds a certain threshold, the regulation of airflow alone is unable to fully compensate for the discomfort caused by high temperatures [15]. In this regard, the ASHRAE 55-2023 standard specifies a range of temperature and air velocity matching [16]. It is important to acknowledge that this standard is predominantly concerned with constant mechanical wind conditions. However, recent studies have demonstrated that dynamic wind possesses clear advantages over constant mechanical wind with respect to reducing thermal sensation and enhancing comfort [17].
There are significant differences in the effects of different types of airflow parameters (including wind speed, direction, and temperature) on thermal comfort and thermal sensation [5,18,19,20]. Kabanshi et al. [21] established that the intermittent air jet strategy can provide a satisfactory indoor climate and demonstrates energy-saving potential. Ugursal et al. [22] found that 30 s pulsed airflow is more effective in providing a cooling sensation than either constant airflow or 60 s pulsed airflow. To date, researchers have explored a variety of parameters with the aim of quantifying different airflow characteristics [23]. Zhu et al. [24] provided a comprehensive overview of the distinctions and interrelationships between the airflow turbulence characteristics of natural and mechanical winds, articulated in terms of two pivotal parameters: turbulence and pulsation frequency. Ouyang et al. [25] found that within the range of frequency bands to which humans are sensitive, the power spectral exponent (β-value) of natural winds ranges from 1.1 to 2.0, while the β-value of mechanical wind near the air supply outlet ranges from 0 to 0.5. Xie et al. [26] investigated the turbulence characteristics of natural wind in the incoming direction on this basis.
Concurrently, the primary considerations in relation to the benefits of dynamic airflow are frequently thermal factors [27]. It has been demonstrated that the characteristics of dynamic airflow have an impact on the convective heat transfer coefficient [27,28], which in turn affects human thermal sensation and thermal comfort. Indeed, the mechanism through which dynamic wind influences comfort is intricate, and it is never possible for a single thermal factor to account for this. Furthermore, stimuli generated by dynamic winds, characterized by varying parameters such as frequency and magnitude of wind speed fluctuations [29], have been demonstrated to play a pivotal role in the perception of comfort [30]. However, extant studies demonstrate a paucity of specific methodologies for quantifying dynamic stimuli of airflow in comparison to thermal factors [27]. Drawing upon the accumulated knowledge from empirical research in the field and preliminary user studies, this study proposes the incorporation of three dimensions of subjective perception: “softness”, “relaxation”, and “disturbance”.
A comprehensive examination of the optimal utilization of airflow strategy, scientific selection of air supply mode, and temperature parameters is of significant theoretical and practical value for enhancing human thermal comfort. Existing literature has predominantly employed fans [31,32], with comparatively few studies utilizing air conditioners. The utilization of air conditioners in this study has the potential to offer novel insights and contributions to the field of airflow comfort research.
As demonstrated in the preceding analysis, the present study concentrates on quotidian life scenarios and systematically explores the effects of differing airflow modes on human thermal comfort in high-temperature environments. This may provide a theoretical basis and practical guidance for the optimal design and comfort enhancement of air conditioners.

2. Methods

The present experiment was conducted within a climate chamber at Tsinghua University, which contains two independent experimental chambers. One of the experimental chambers was utilized as a laboratory (5 m × 2.5 m × 2.7 m), while the other was designated as a waiting room (5 m × 3 m × 2.7 m) for the preparation and recovery phases. The two experimental chambers were equipped with independent air-conditioning systems, which enabled precise control of the temperature and humidity. It was ensured that the environmental conditions within each chamber remained independent of the other. Variations in the indoor air temperature (Ta) and relative humidity (RH) were controlled to be within the range of ±0.3 °C and ±5%, respectively. The air is introduced into the chamber from the supply plenum chamber located on the ceiling, and it is subsequently returned through the floor, utilizing small dense air inlets and outlets to ensure uniform temperature and humidity distribution within the chamber (Figure 1). Furthermore, the air velocity was maintained at a low and uniform level, thus ensuring minimal disturbance to the wind environment established during the experimental procedure. The temperature and humidity of the environment were set one hour prior to the initiation of the experiment, with the intention of ensuring that the prevailing conditions remained consistent and uniform during the experiment.
Twenty healthy university students (ten males and ten females) participated in the experiment. The distribution of characteristics such as age and BMI is demonstrated in Table 1. The subjects were instructed to wear typical summer clothing, comprising a short-sleeved top, thin long pants, and sneakers, with a clothing insulation of approximately 0.57 clo (1 clo = 0.155 m2⋅K/W). Prior to the commencement of the experiment, the subjects were requested to abstain from the consumption of alcoholic and stimulant beverages, as well as strenuous exercise, for a period of no less than 24 h. During the experiment, the subjects remained in a seated position and were permitted to engage in reading and writing activities. According to ASHRAE Standard 55-2023 [16], the metabolic rate was approximately 55–65 W/m2, equivalent to 1–1.1 met.
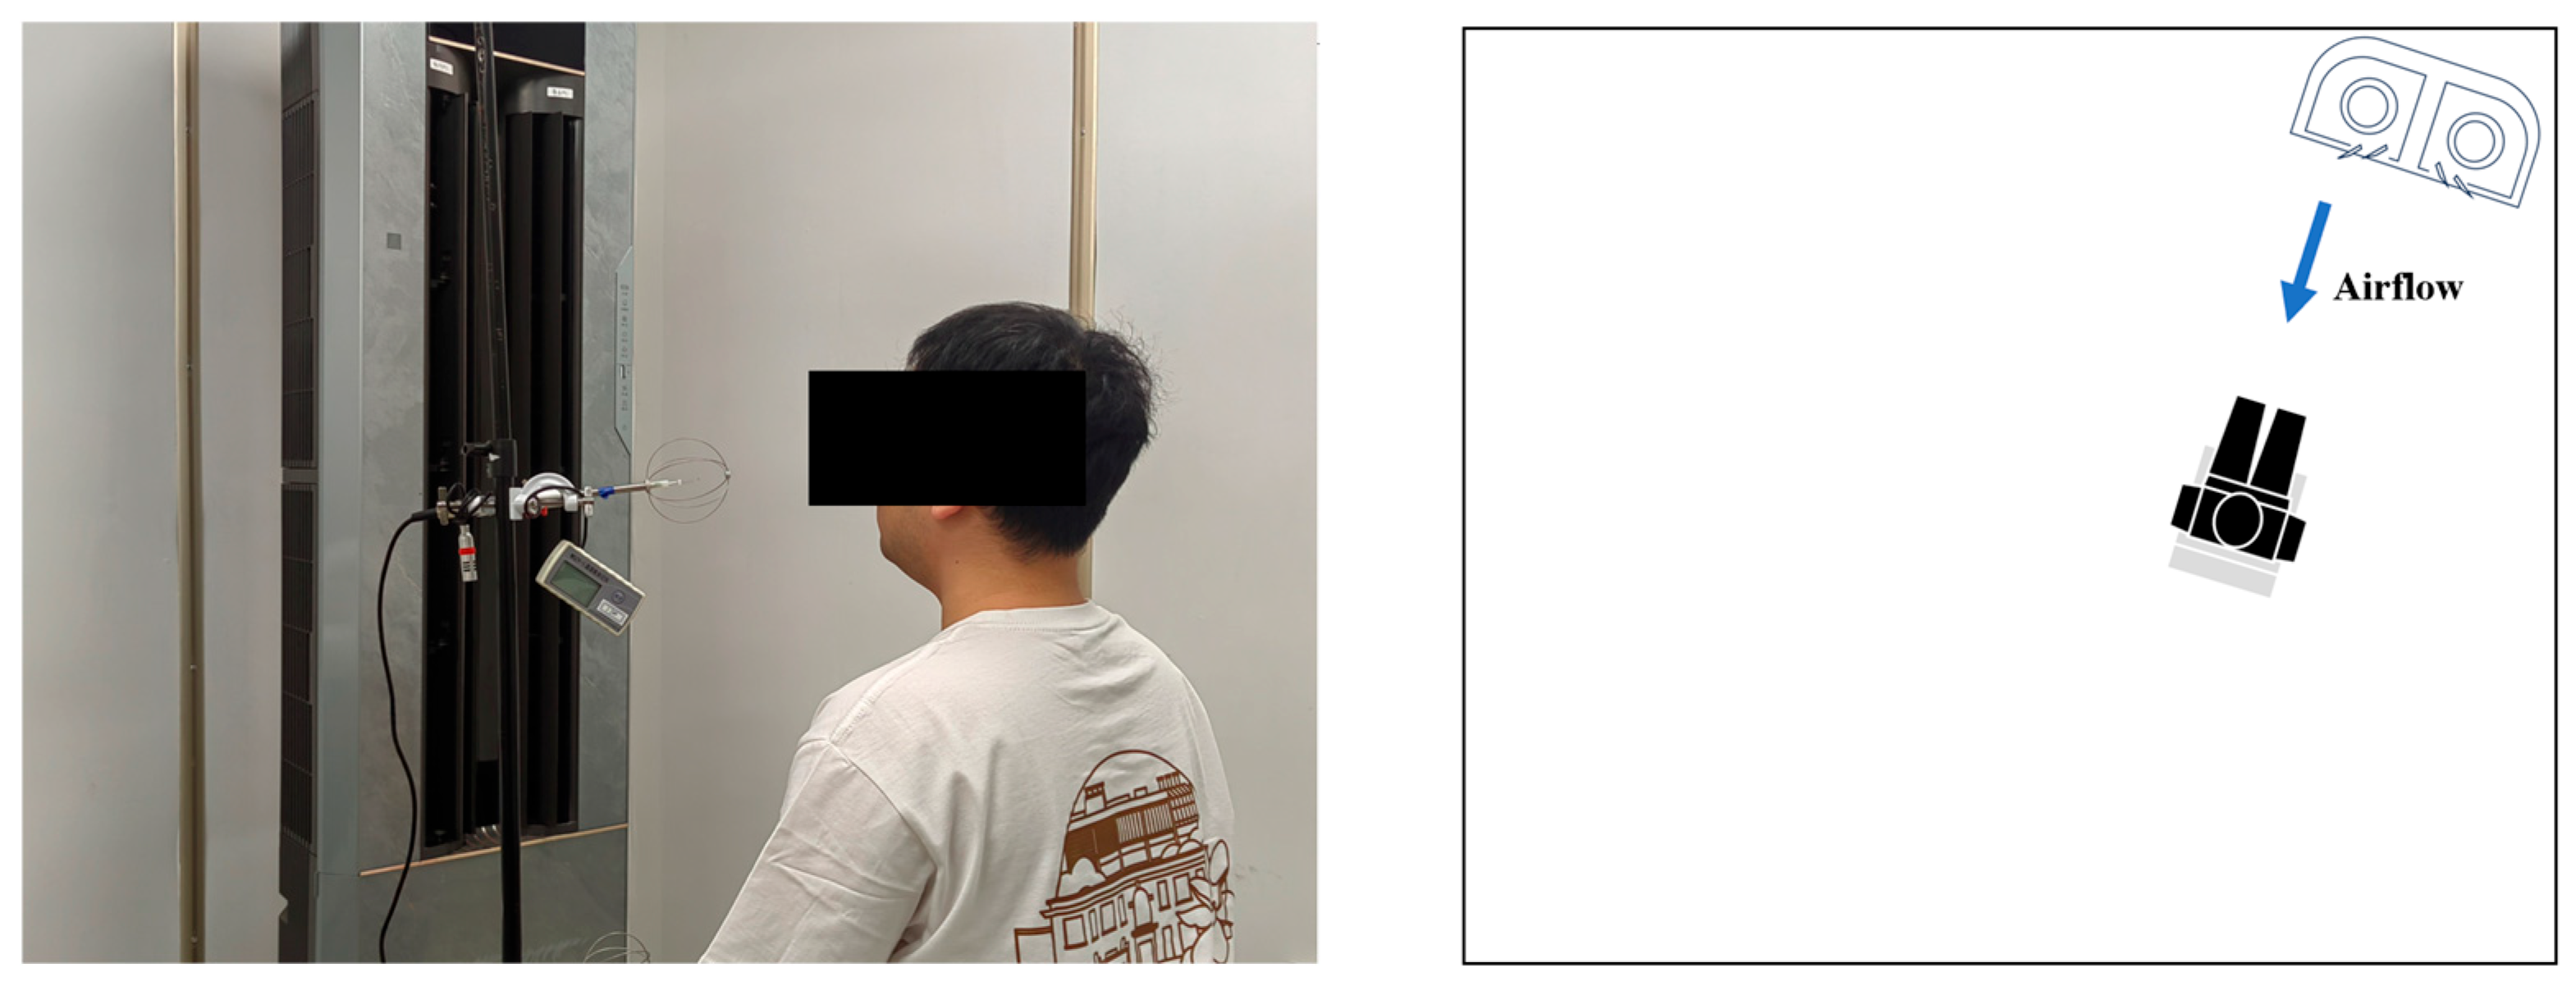
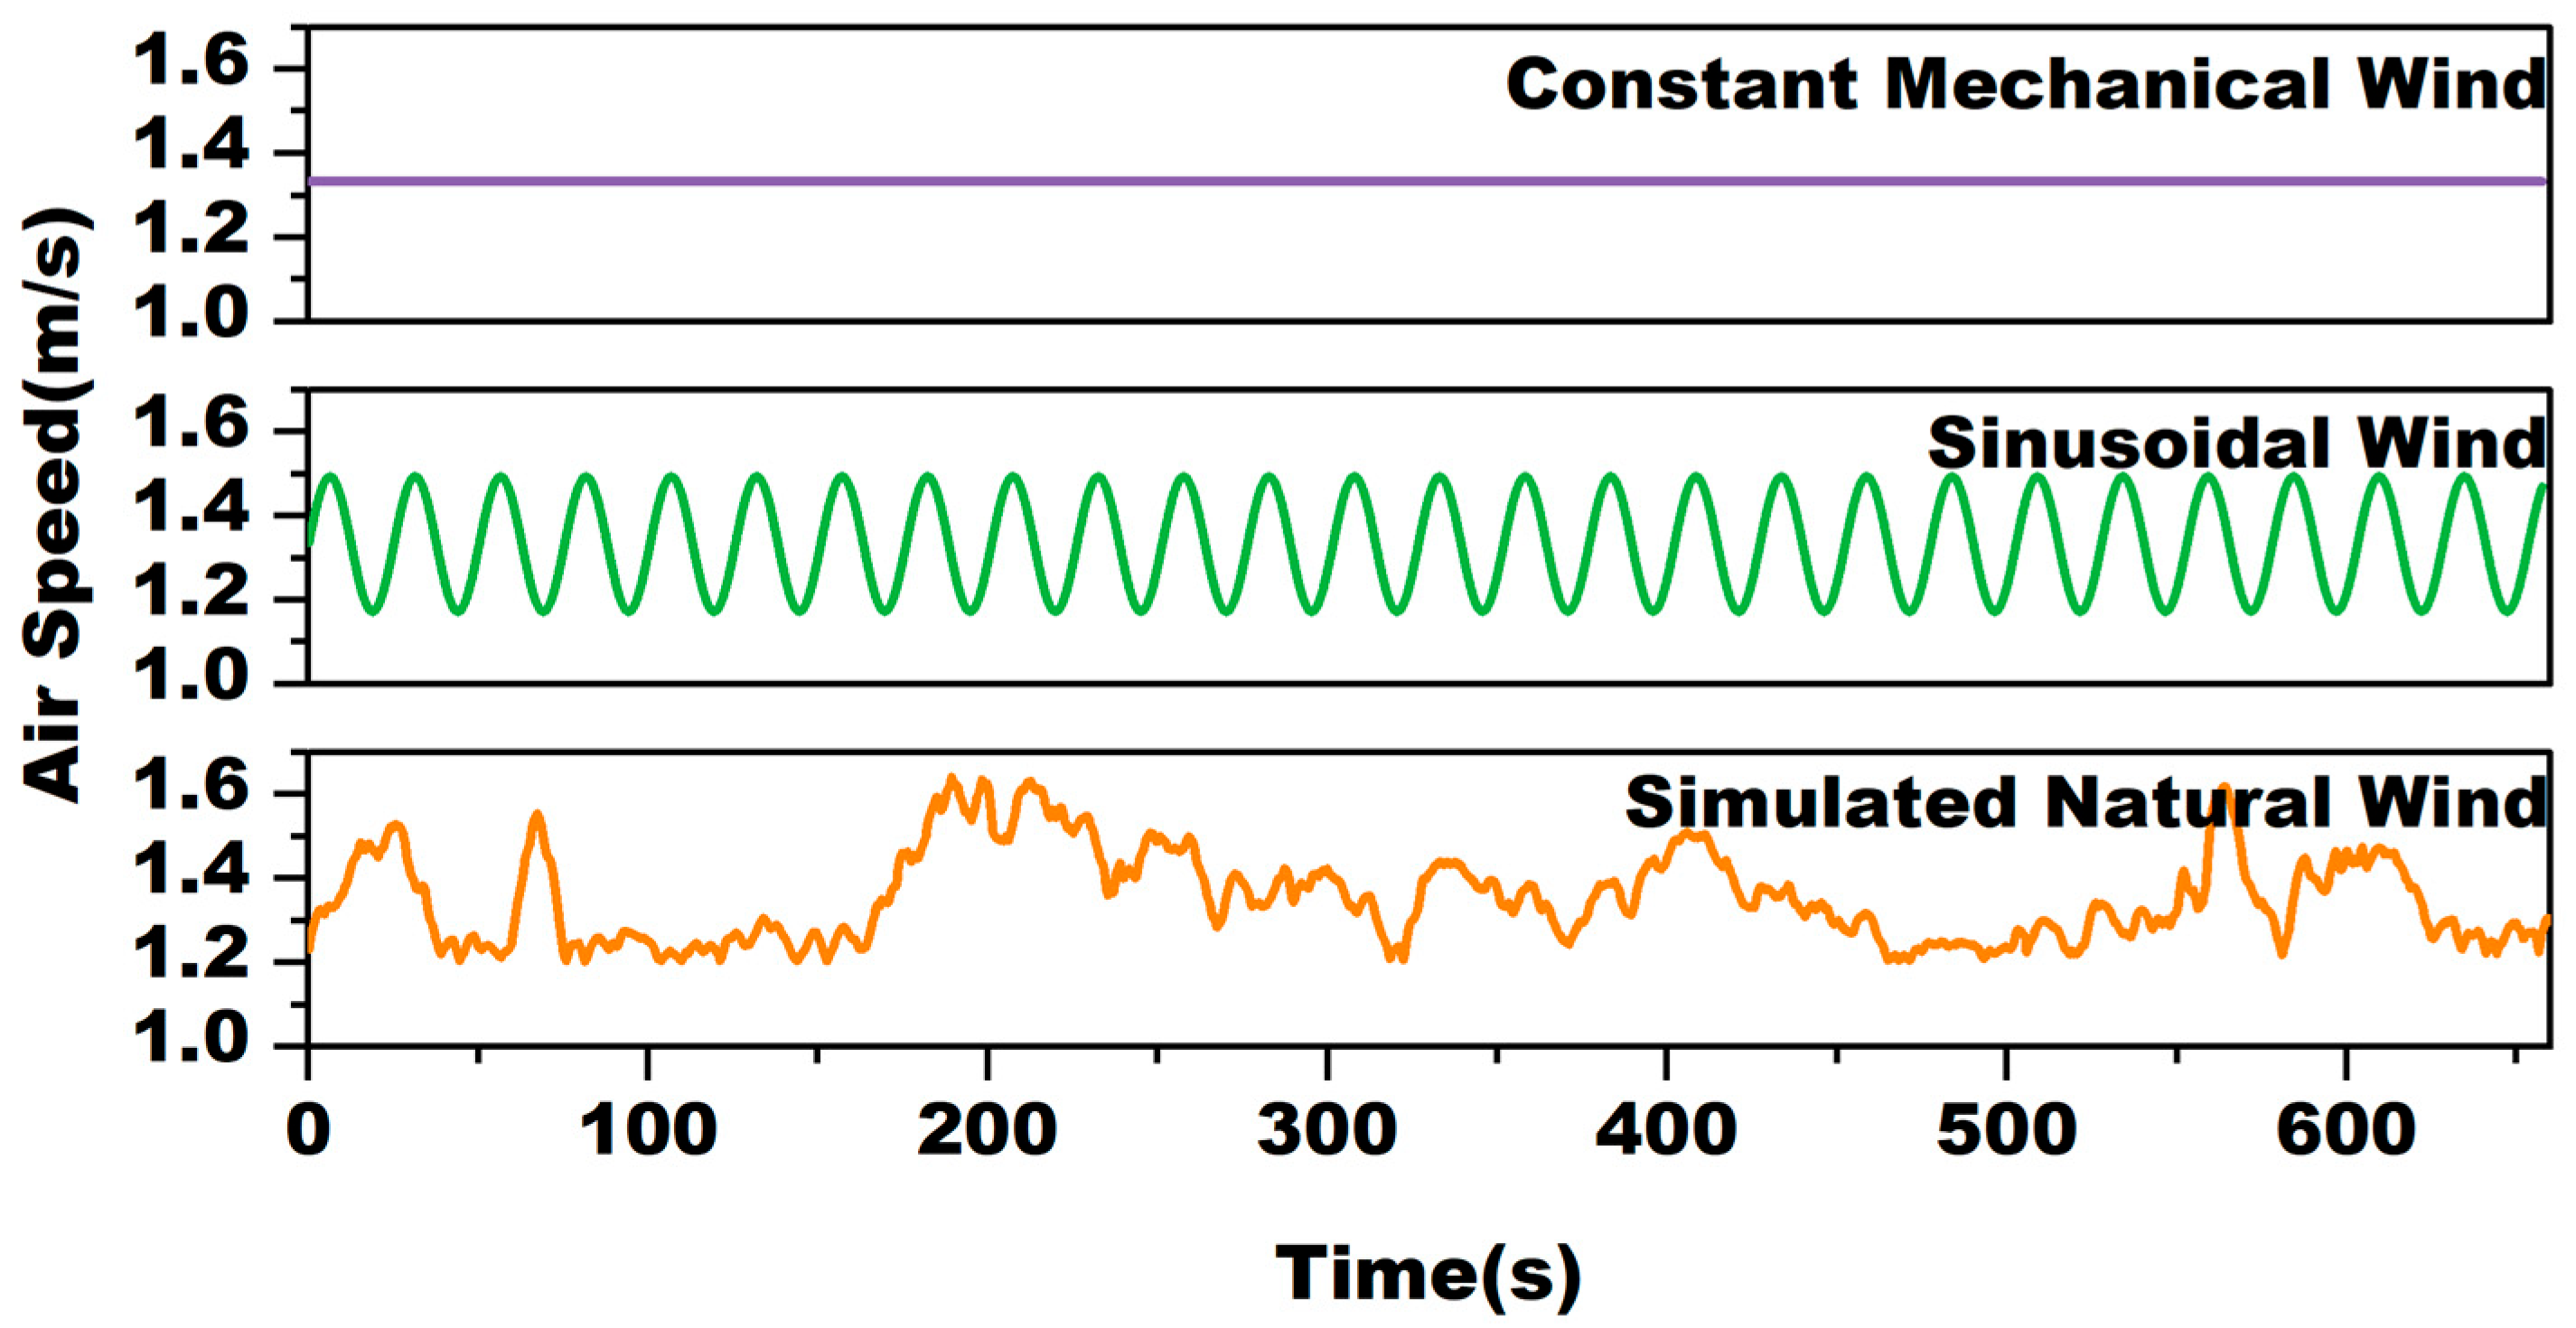
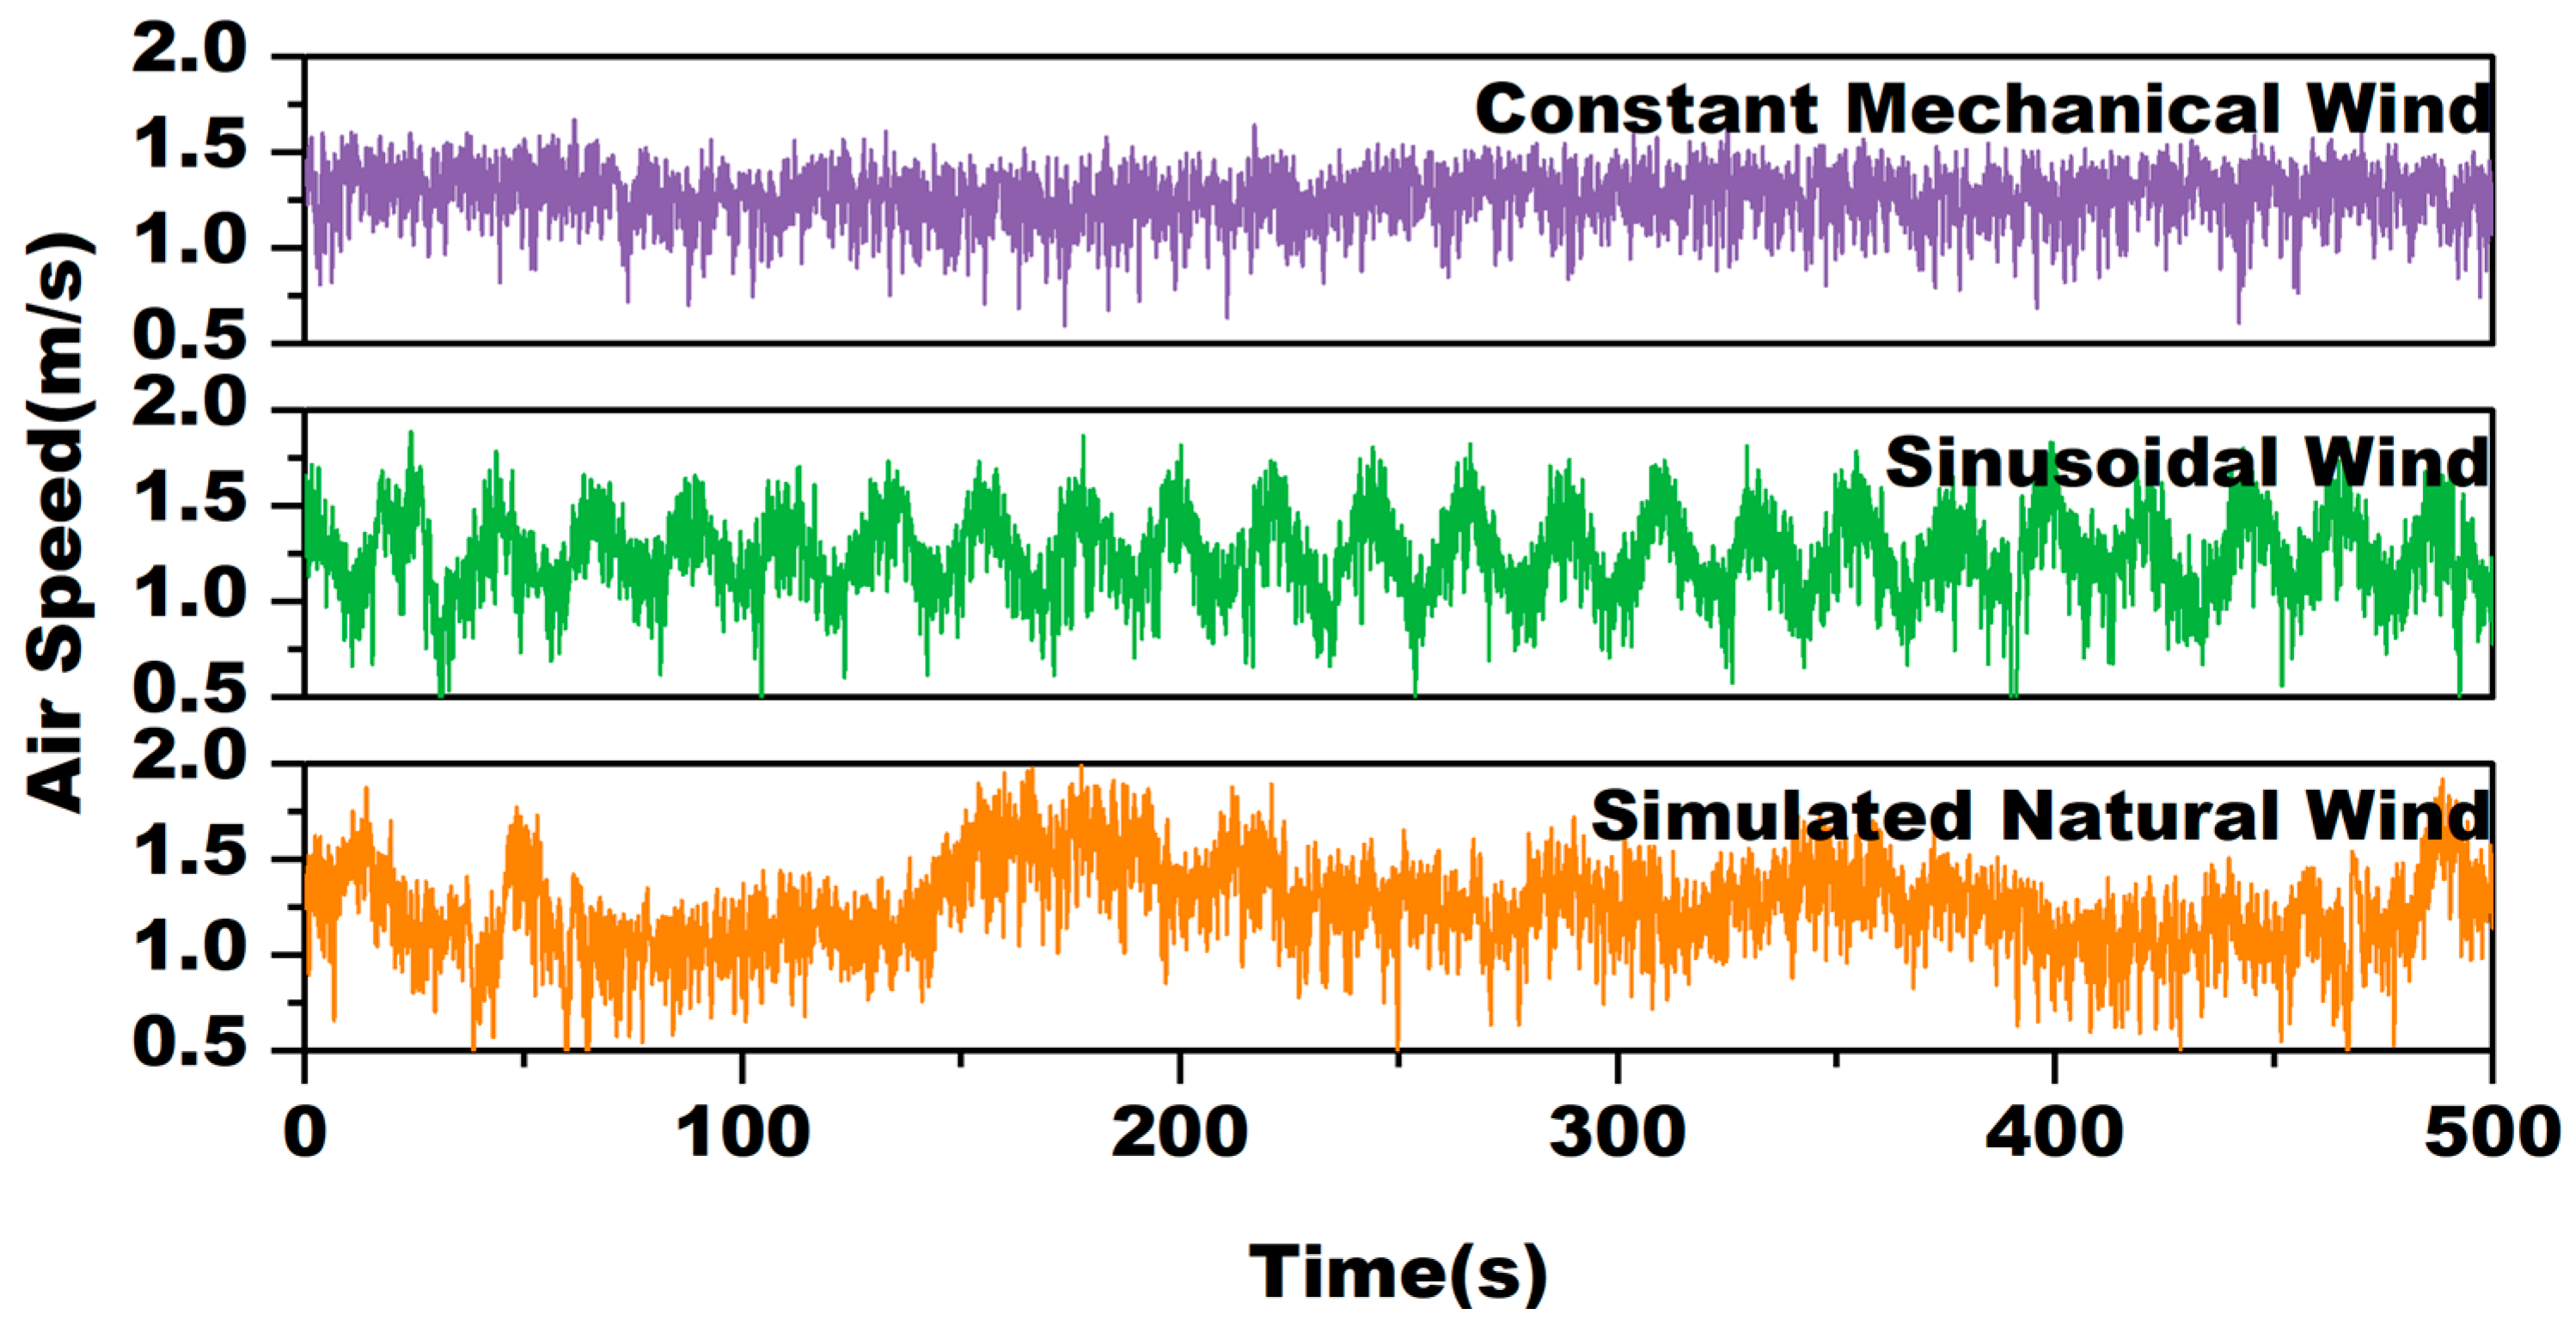
The experiment was conducted using a column air conditioner with subjects sitting 1 m from the air vents (Figure 2). The air temperature was maintained at 30 ± 0.3 °C in the laboratory and 26 ± 0.3 °C in the waiting room, with the humidity maintained at 30 ± 5% in both rooms. The experiment was configured to operate under three distinct conditions: constant mechanical wind, sinusoidal wind, and simulated natural wind. In the experiment, constant mechanical wind was obtained by inputting a stable rotational speed. Sinusoidal wind was obtained by inputting a rotational speed that varies in a sinusoidal waveform. The input sample for simulated natural wind was derived from the continuously measured wind speed in a comfortable outdoor wind environment. The waveforms of the original input samples are demonstrated in Figure 3. Figure 4 illustrates the measured airflow at a distance of 1 m from the air outlet, which corresponds to the subjects’ position. The mean air velocity of the three types of air supply is equivalent at the time of the original input sample, and the measured mean air velocity at 1 m from the air outlet is 1.27 m/s for constant mechanical wind, 1.24 m/s for sinusoidal wind, and 1.25 m/s for simulated natural wind. The average wind speed of the sinusoidal wind used in this experiment was 1.24 m/s, the maximum wind speed was 1.39 m/s, and the minimum wind speed was 1.09 m/s, with a fluctuation amplitude of 0.15 m/s. The period was 25 s, which means the frequency was 0.04 Hz. The measured turbulence intensities for constant mechanical wind, sinusoidal wind, and simulated natural wind were 11.9%, 18.1%, and 18.9%, respectively. The instruments utilized in the experiment are enumerated in Table 2.
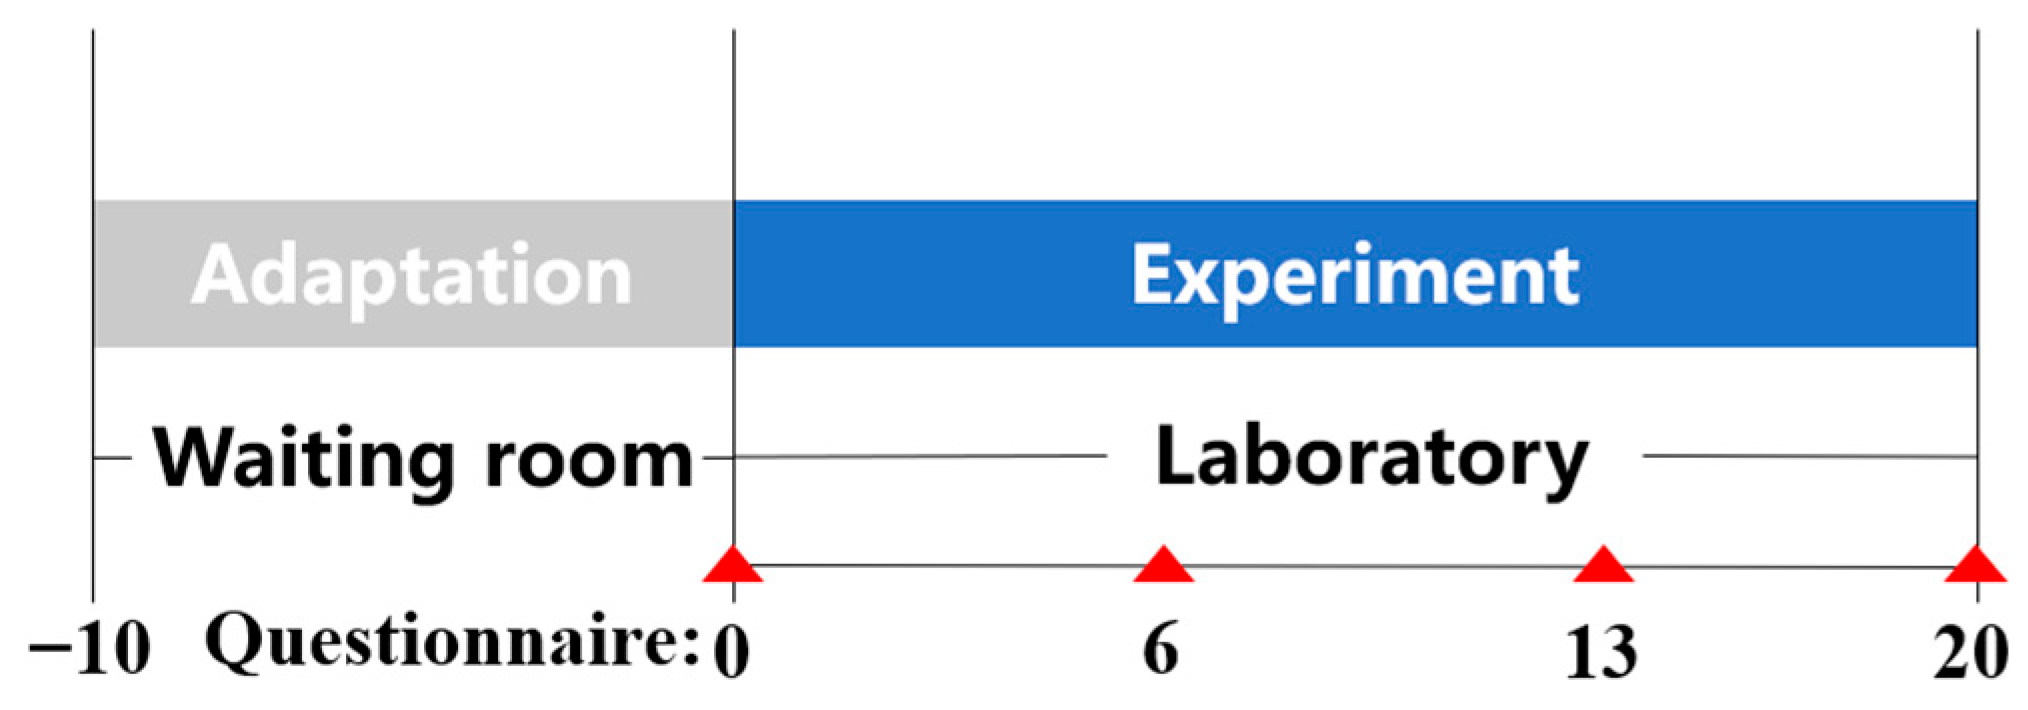
The experiment was subdivided into a 10 min preparatory phase and a 20 min experiment phase, as illustrated in Figure 5. Each participant was exposed to a total of three experiments, thereby ensuring that they encountered all three wind conditions. In order to avoid the influence of a fixed order of experimental conditions on the experimental results, subjects randomly experienced the three conditions in a different order. Meanwhile, these three environments were each given a code name, and the participants were not aware of which kind of wind it was. During the experimental conditions, subjects were required to complete the questionnaire at seven-minute intervals. The questionnaire encompassed both the overall and local thermal sensation vote (TSV) and thermal comfort vote (TCV), utilizing a seven-point scale. The specific voting grading is delineated in Table 3.
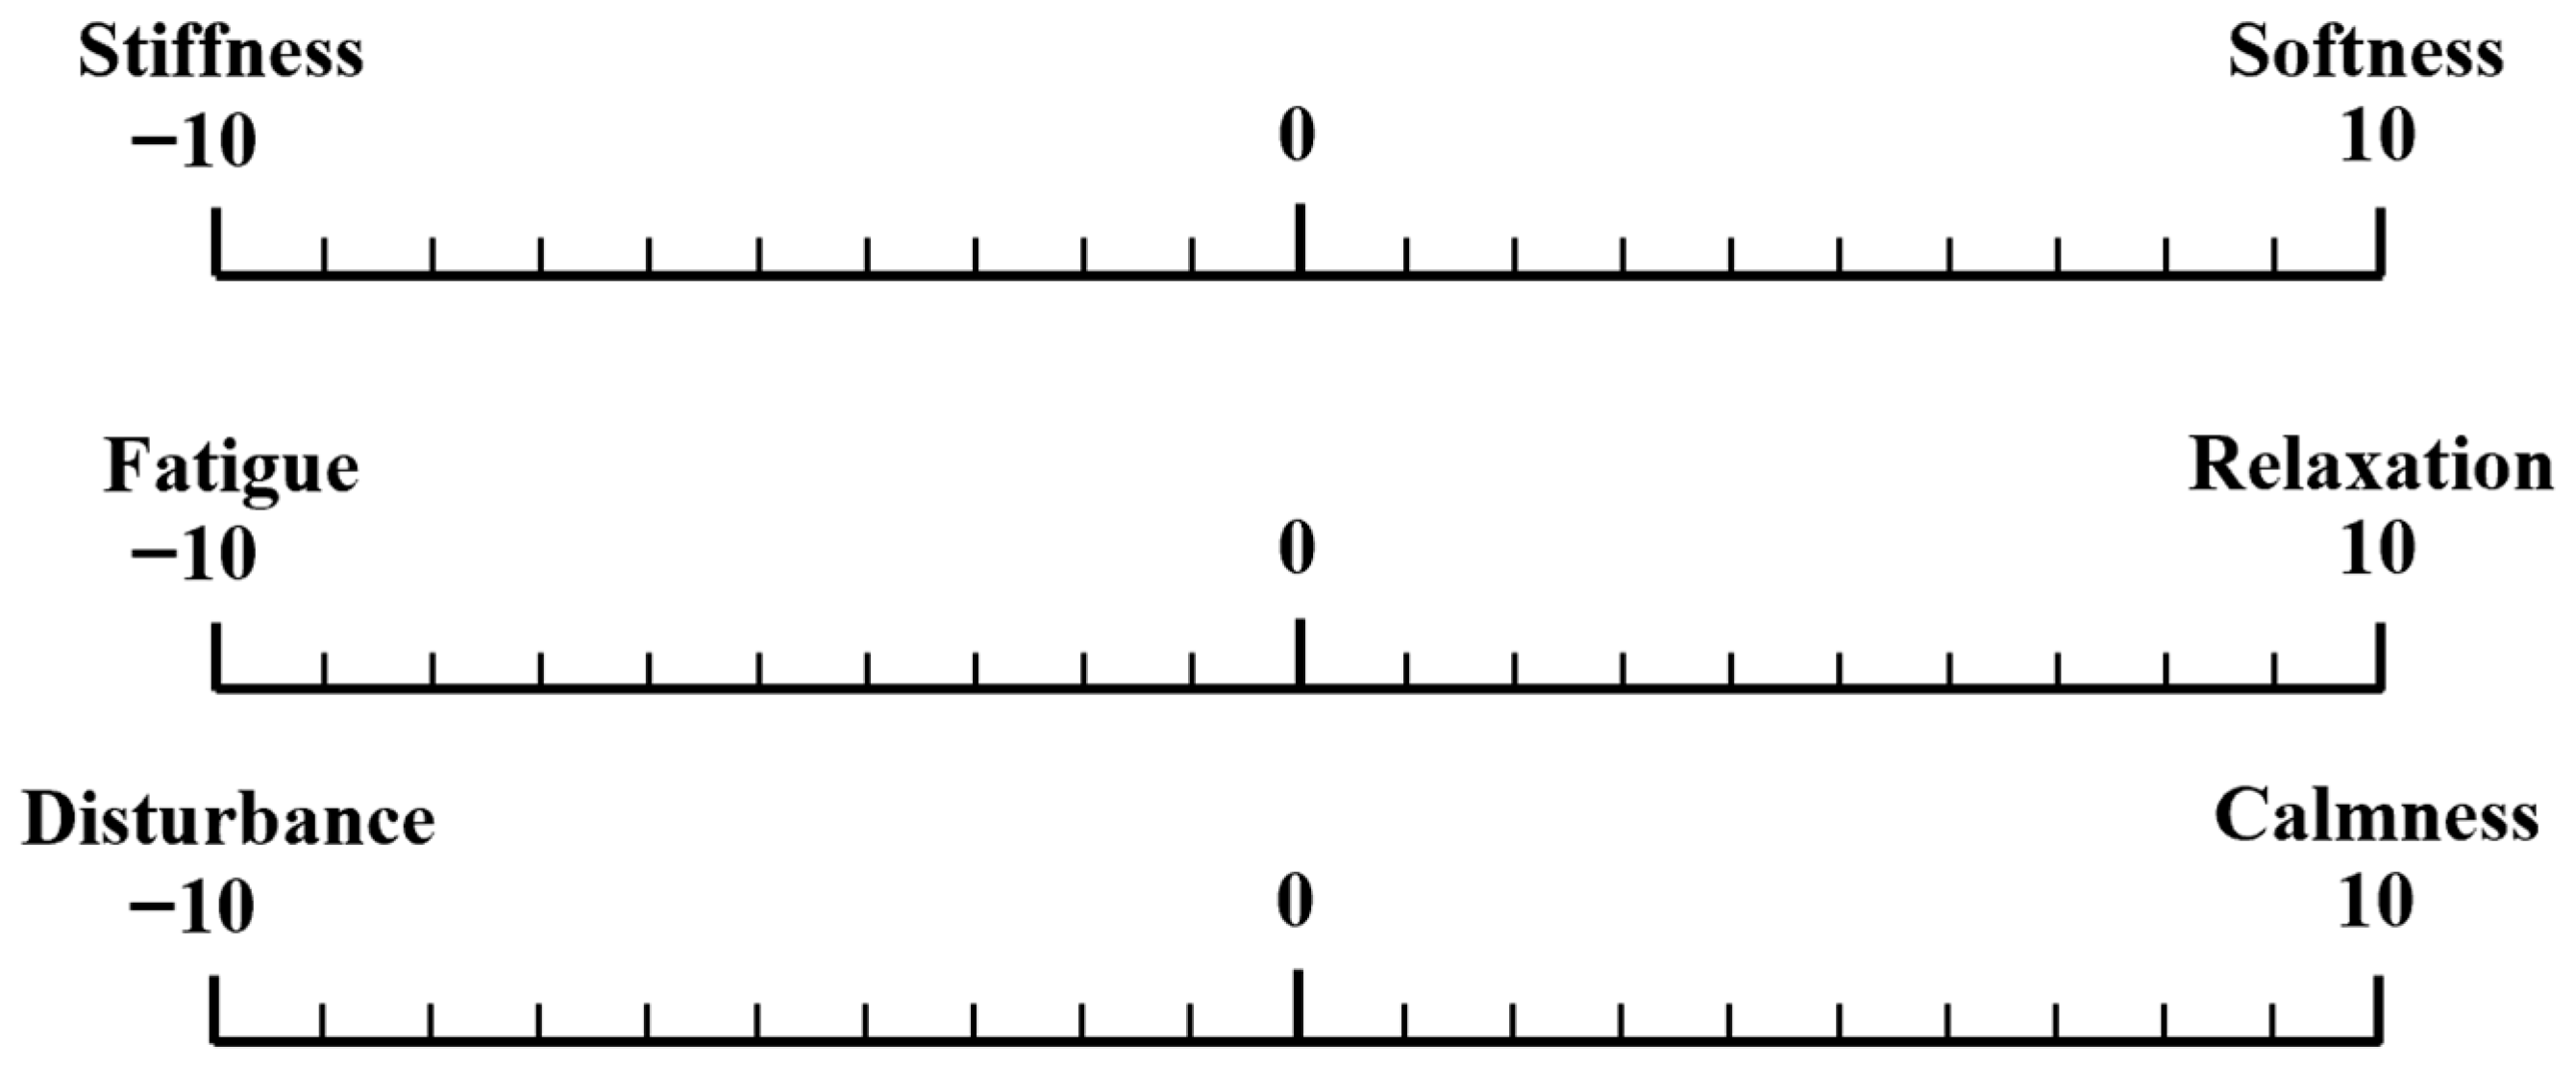
We explored different aspects of the subjects’ perception of wind as a reference for more dimensions. Three predominant perceptions were included: (1) stiffness and softness; (2) fatigue and relaxation; and (3) disturbance and calmness. The specific voting grading is delineated in Figure 6.
The experimental procedure involved the measurement of skin temperature (Tsk) in the subjects. Skin temperature was measured using the ten-point method. The PyroButton was utilized to undertake continuous measurements of skin temperature at 0.5 min intervals at 10 specific sites: the forehead (0.06), the left chest (0.12), the left abdomen (0.12), the left back (0.12), the right upper arm (0.08), the left forearm (0.06), the right hand (0.05), the right anterior thigh (0.19), the right anterior calf (0.13) and the right foot (0.07) [33]. The mean skin temperature (mTsk) was calculated based on the respective weights.

3. Results

3.1. Thermal Sensation Vote

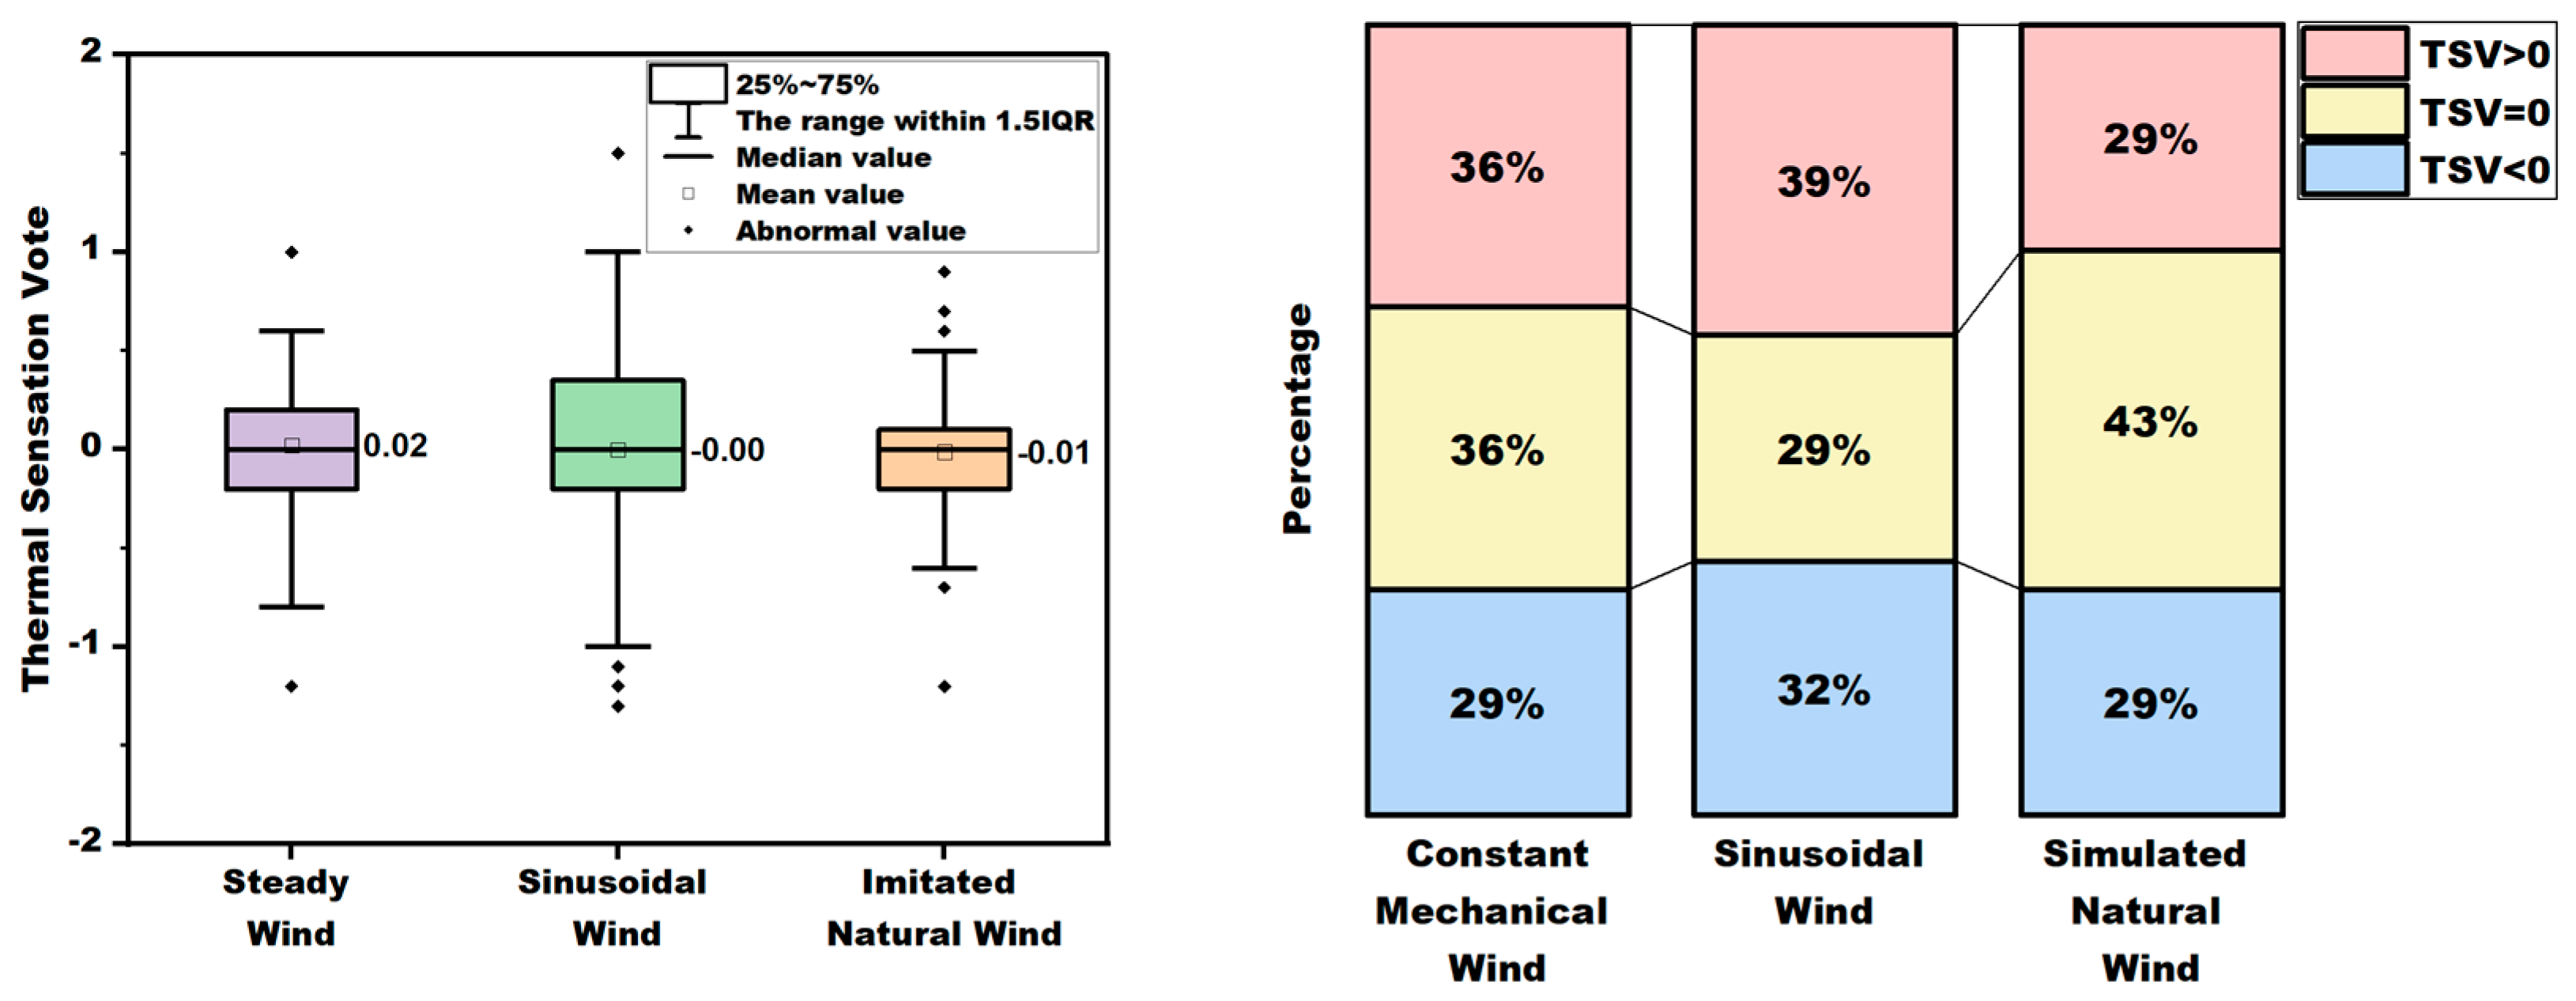
The mean values of TSV under the three airflows were found to be relatively similar. The order of the TSV from low to high was as follows: simulated natural wind < sinusoidal wind < constant mechanical wind. The results of the study indicate that the percentage of TSV = 0 under simulated natural wind was significantly higher than that of constant mechanical wind and sinusoidal wind, and conversely, the percentage of TSV > 0 was significantly lower than that of constant mechanical wind and sinusoidal wind (Figure 7).
The mean values of TSV under all three airflows were found to be close to 0. These results may be attributed to the relatively well-matched mean wind speed and temperature environments that were chosen. Meanwhile, since the experimental environment was chosen to be relatively dry, the thermal sensation would be relatively lower under the same high temperature condition, where the low ambient humidity facilitates the evaporation of sweat.

3.2. Thermal Comfort Vote

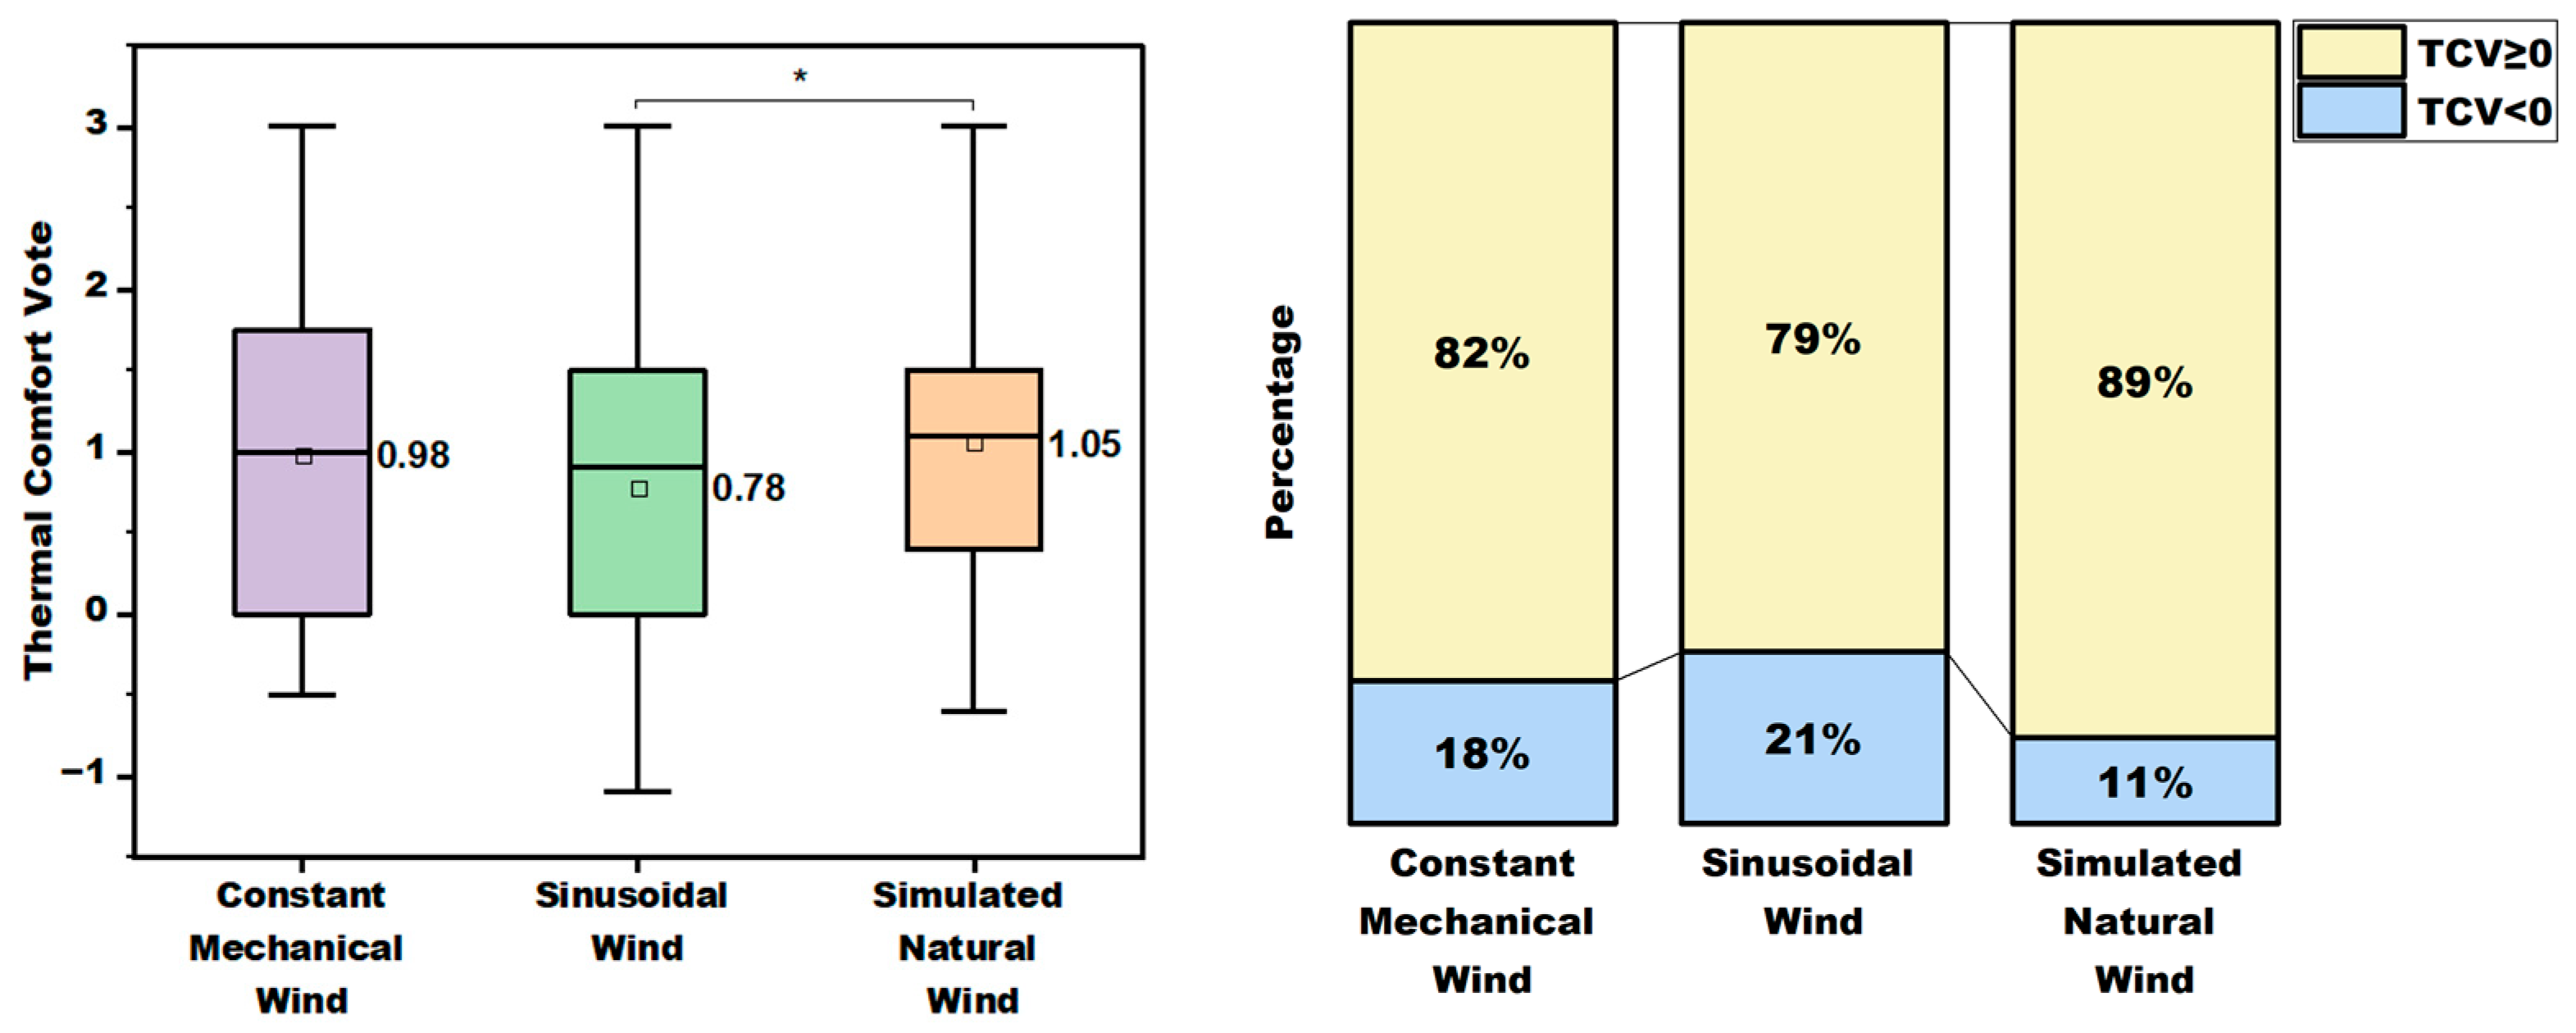
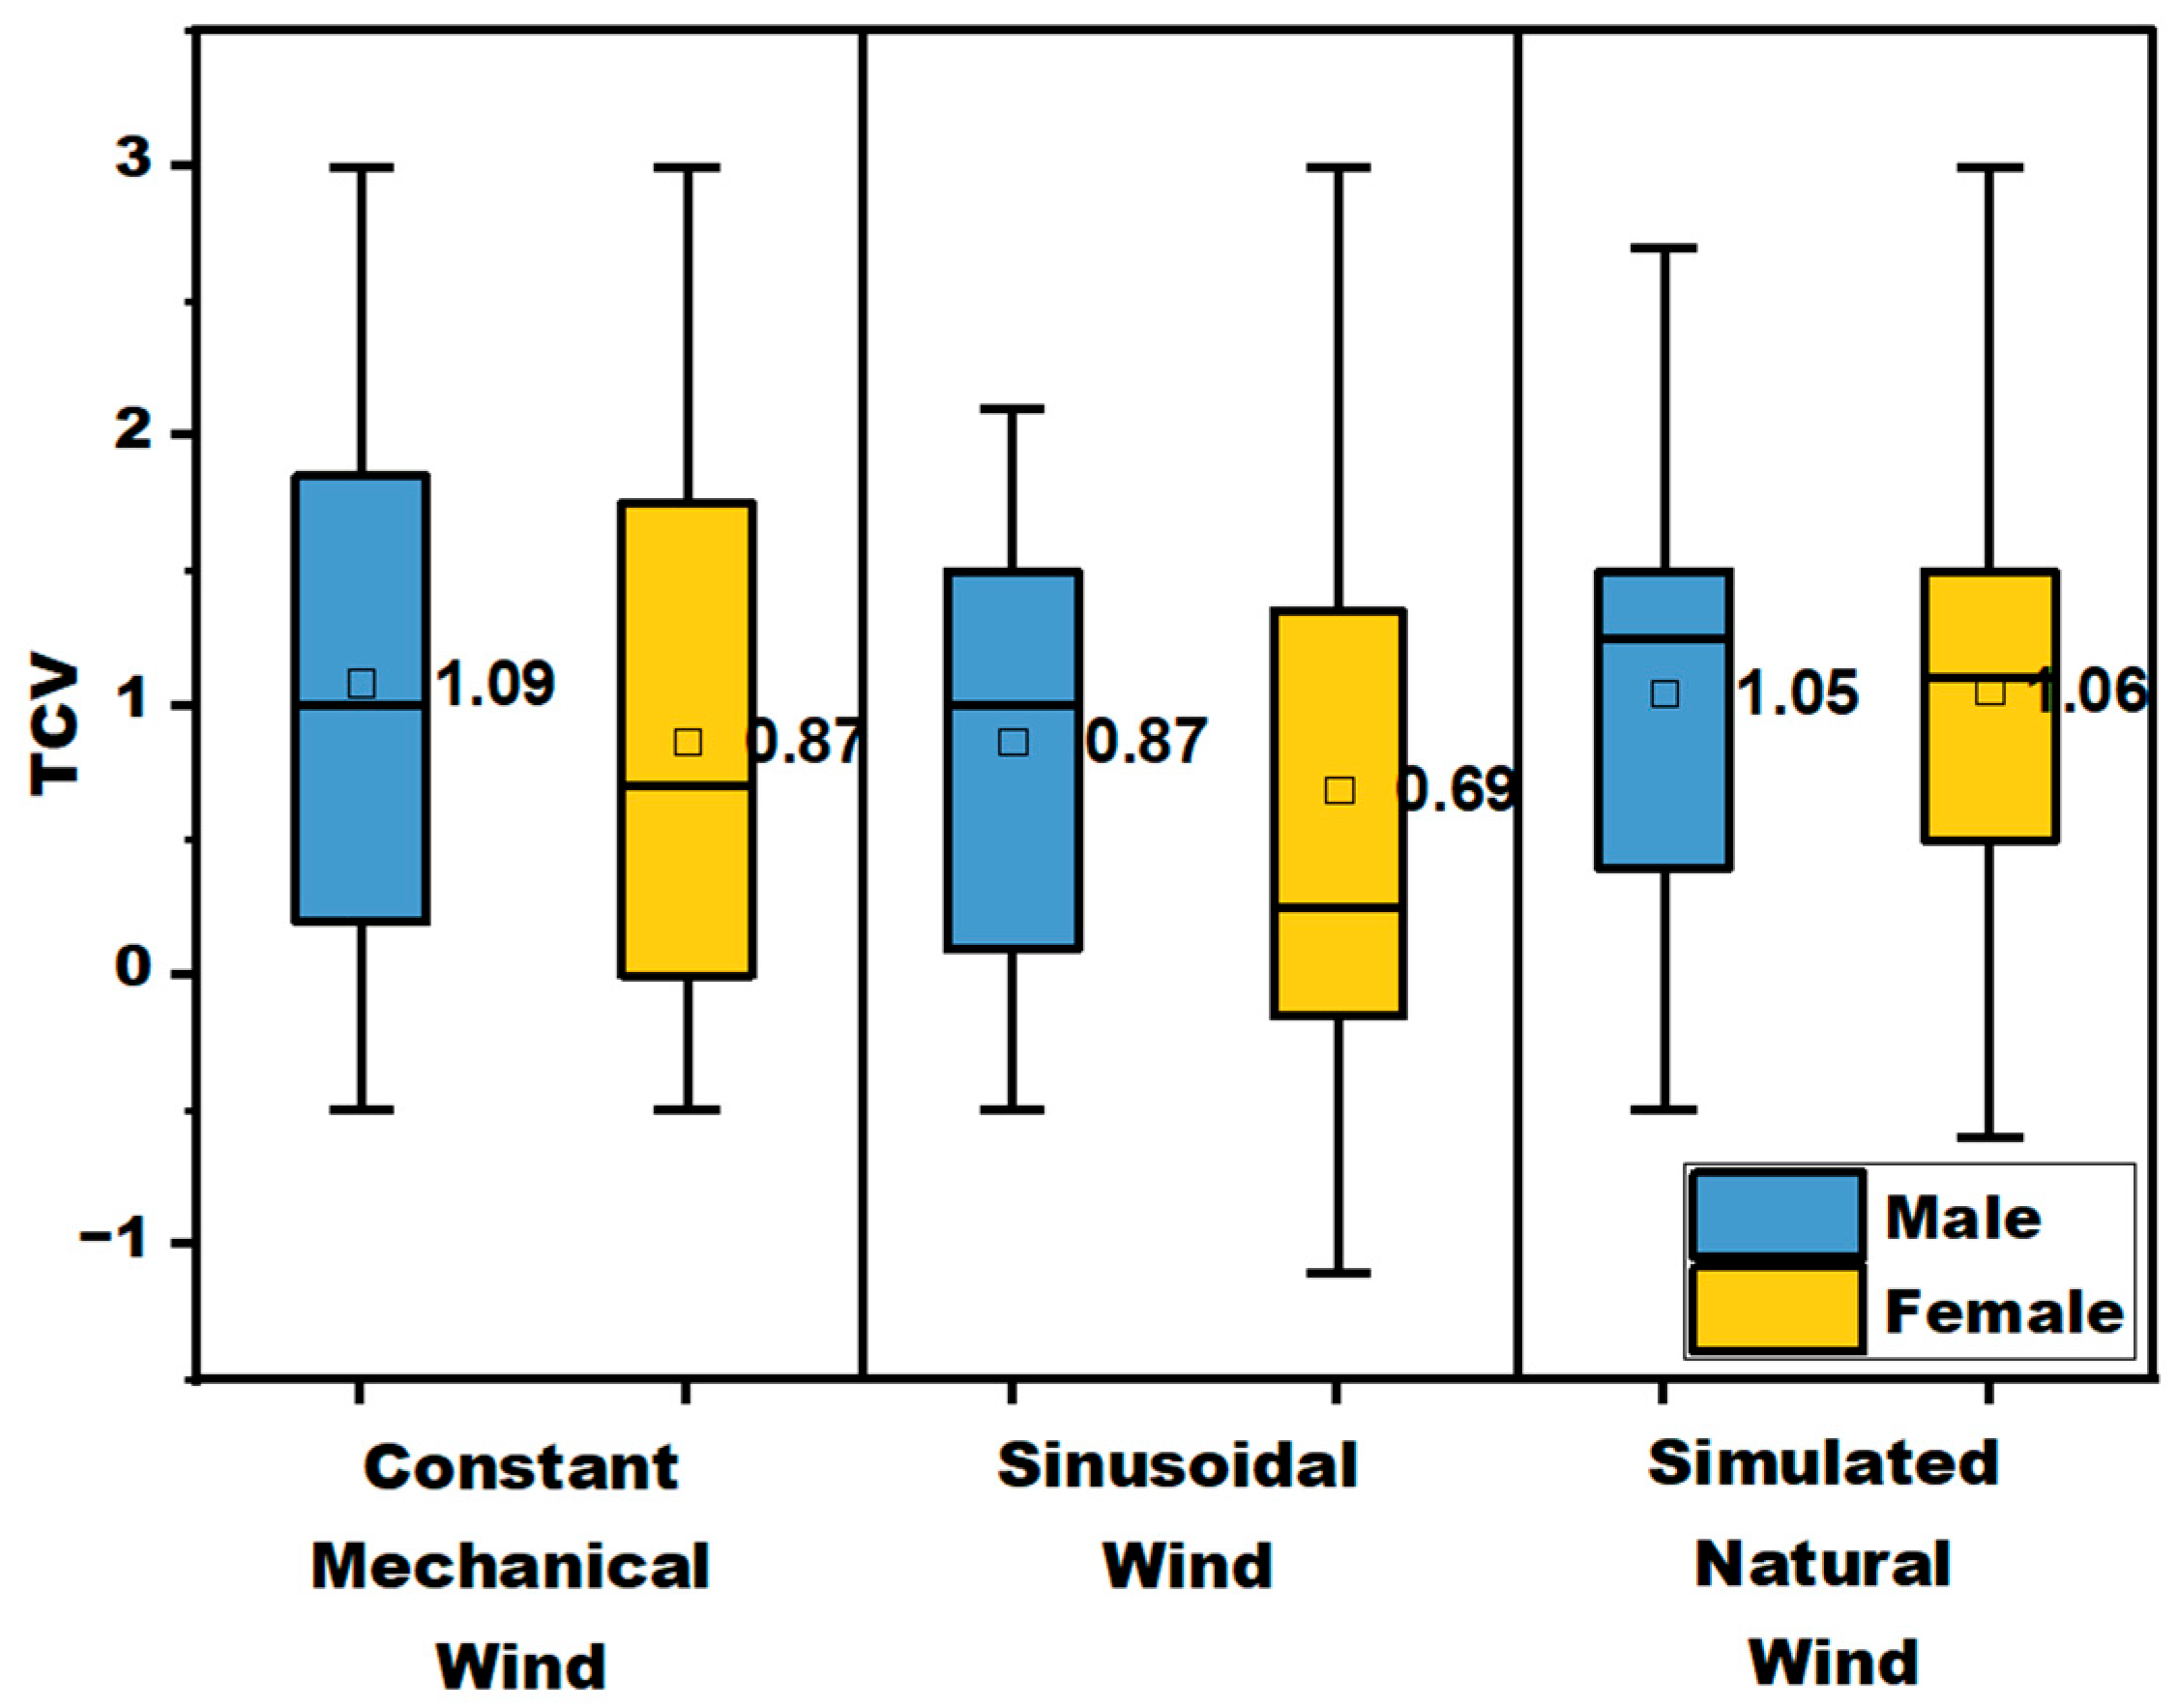
According to Figure 8, the mean TCV values under the three airflows in descending order were simulated natural wind > constant mechanical wind > sinusoidal wind. TCV under simulated natural wind was 0.27 higher than TCV under sinusoidal wind (p < 0.05). According to the number of votes, the percentage of TCV ≥ 0 in the simulated natural wind environment was 89%, which was higher than that of constant mechanical wind (82%) and sinusoidal wind (79%).

3.3. Variation in Thermal Sensation Vote over Time

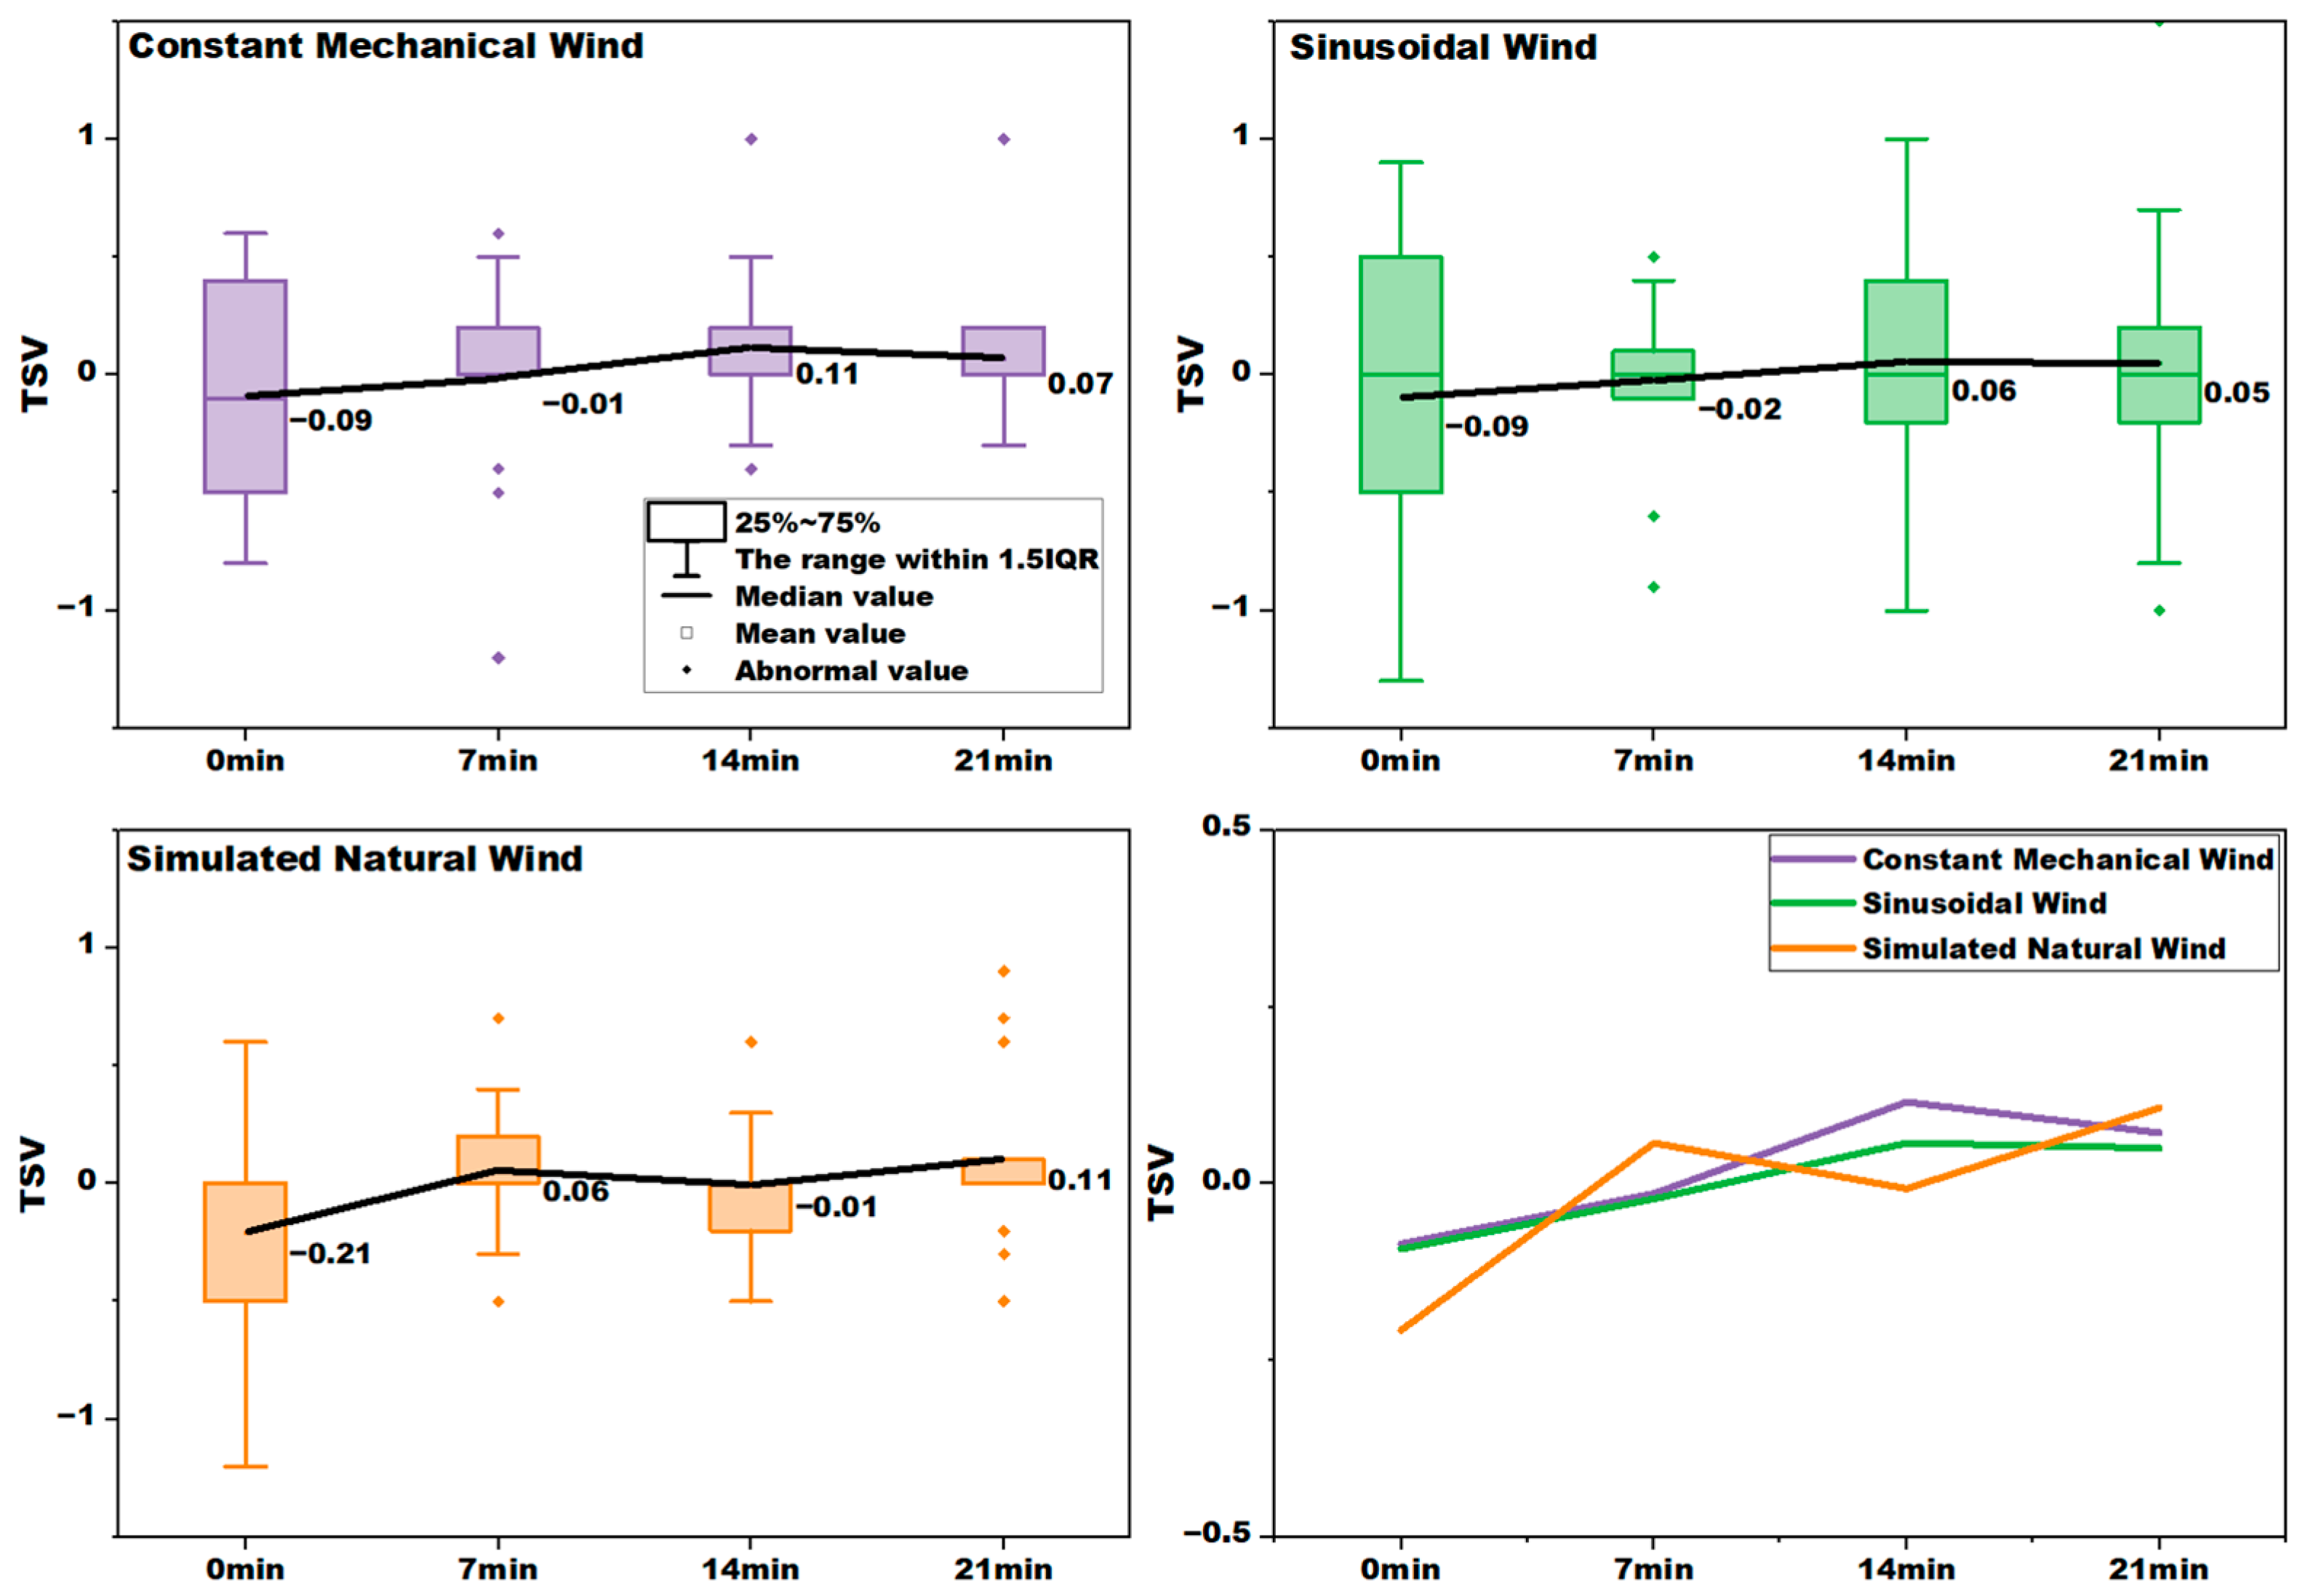
At the moment of first entering the laboratory, the TSV in the simulated natural wind environment was lower than the constant mechanical wind and sinusoidal wind. As time progressed, the fluctuation of TSV in the simulated natural wind environment was found to be the most significant, followed by the constant mechanical wind, and the sinusoidal wind fluctuation was the least substantial (Figure 9). This finding suggests that the changing wind speed characteristics of the simulated natural wind will have a more significant effect on thermal sensation. Although sinusoidal wind is also a dynamic wind, the fluctuation period is comparatively brief relative to the time interval of the questionnaire, as it is a repetitive fluctuation with a short period.
In all three wind environments, the TSV demonstrated an initial increase, followed by a subsequent decrease or fluctuation over time. This phenomenon can be attributed to the thermal regulation mechanism in three stages: (1) in the initial stage, the wind speed significantly enhances the convective and evaporative heat dissipation efficiency, resulting in low transient thermal sensation; (2) in the middle stage, with the continuous accumulation of metabolic heat production and the rise of local microenvironmental humidity and heat, the human body experiences a transient rebound of thermal sensation; and (3) in the late stage, as a result of the gradual adaptation of human beings to their environments and reestablishment of balance in body temperature regulation, the thermal sensation drops or fluctuates slightly and tends to stabilize.

3.4. Variation in Thermal Comfort Vote over Time

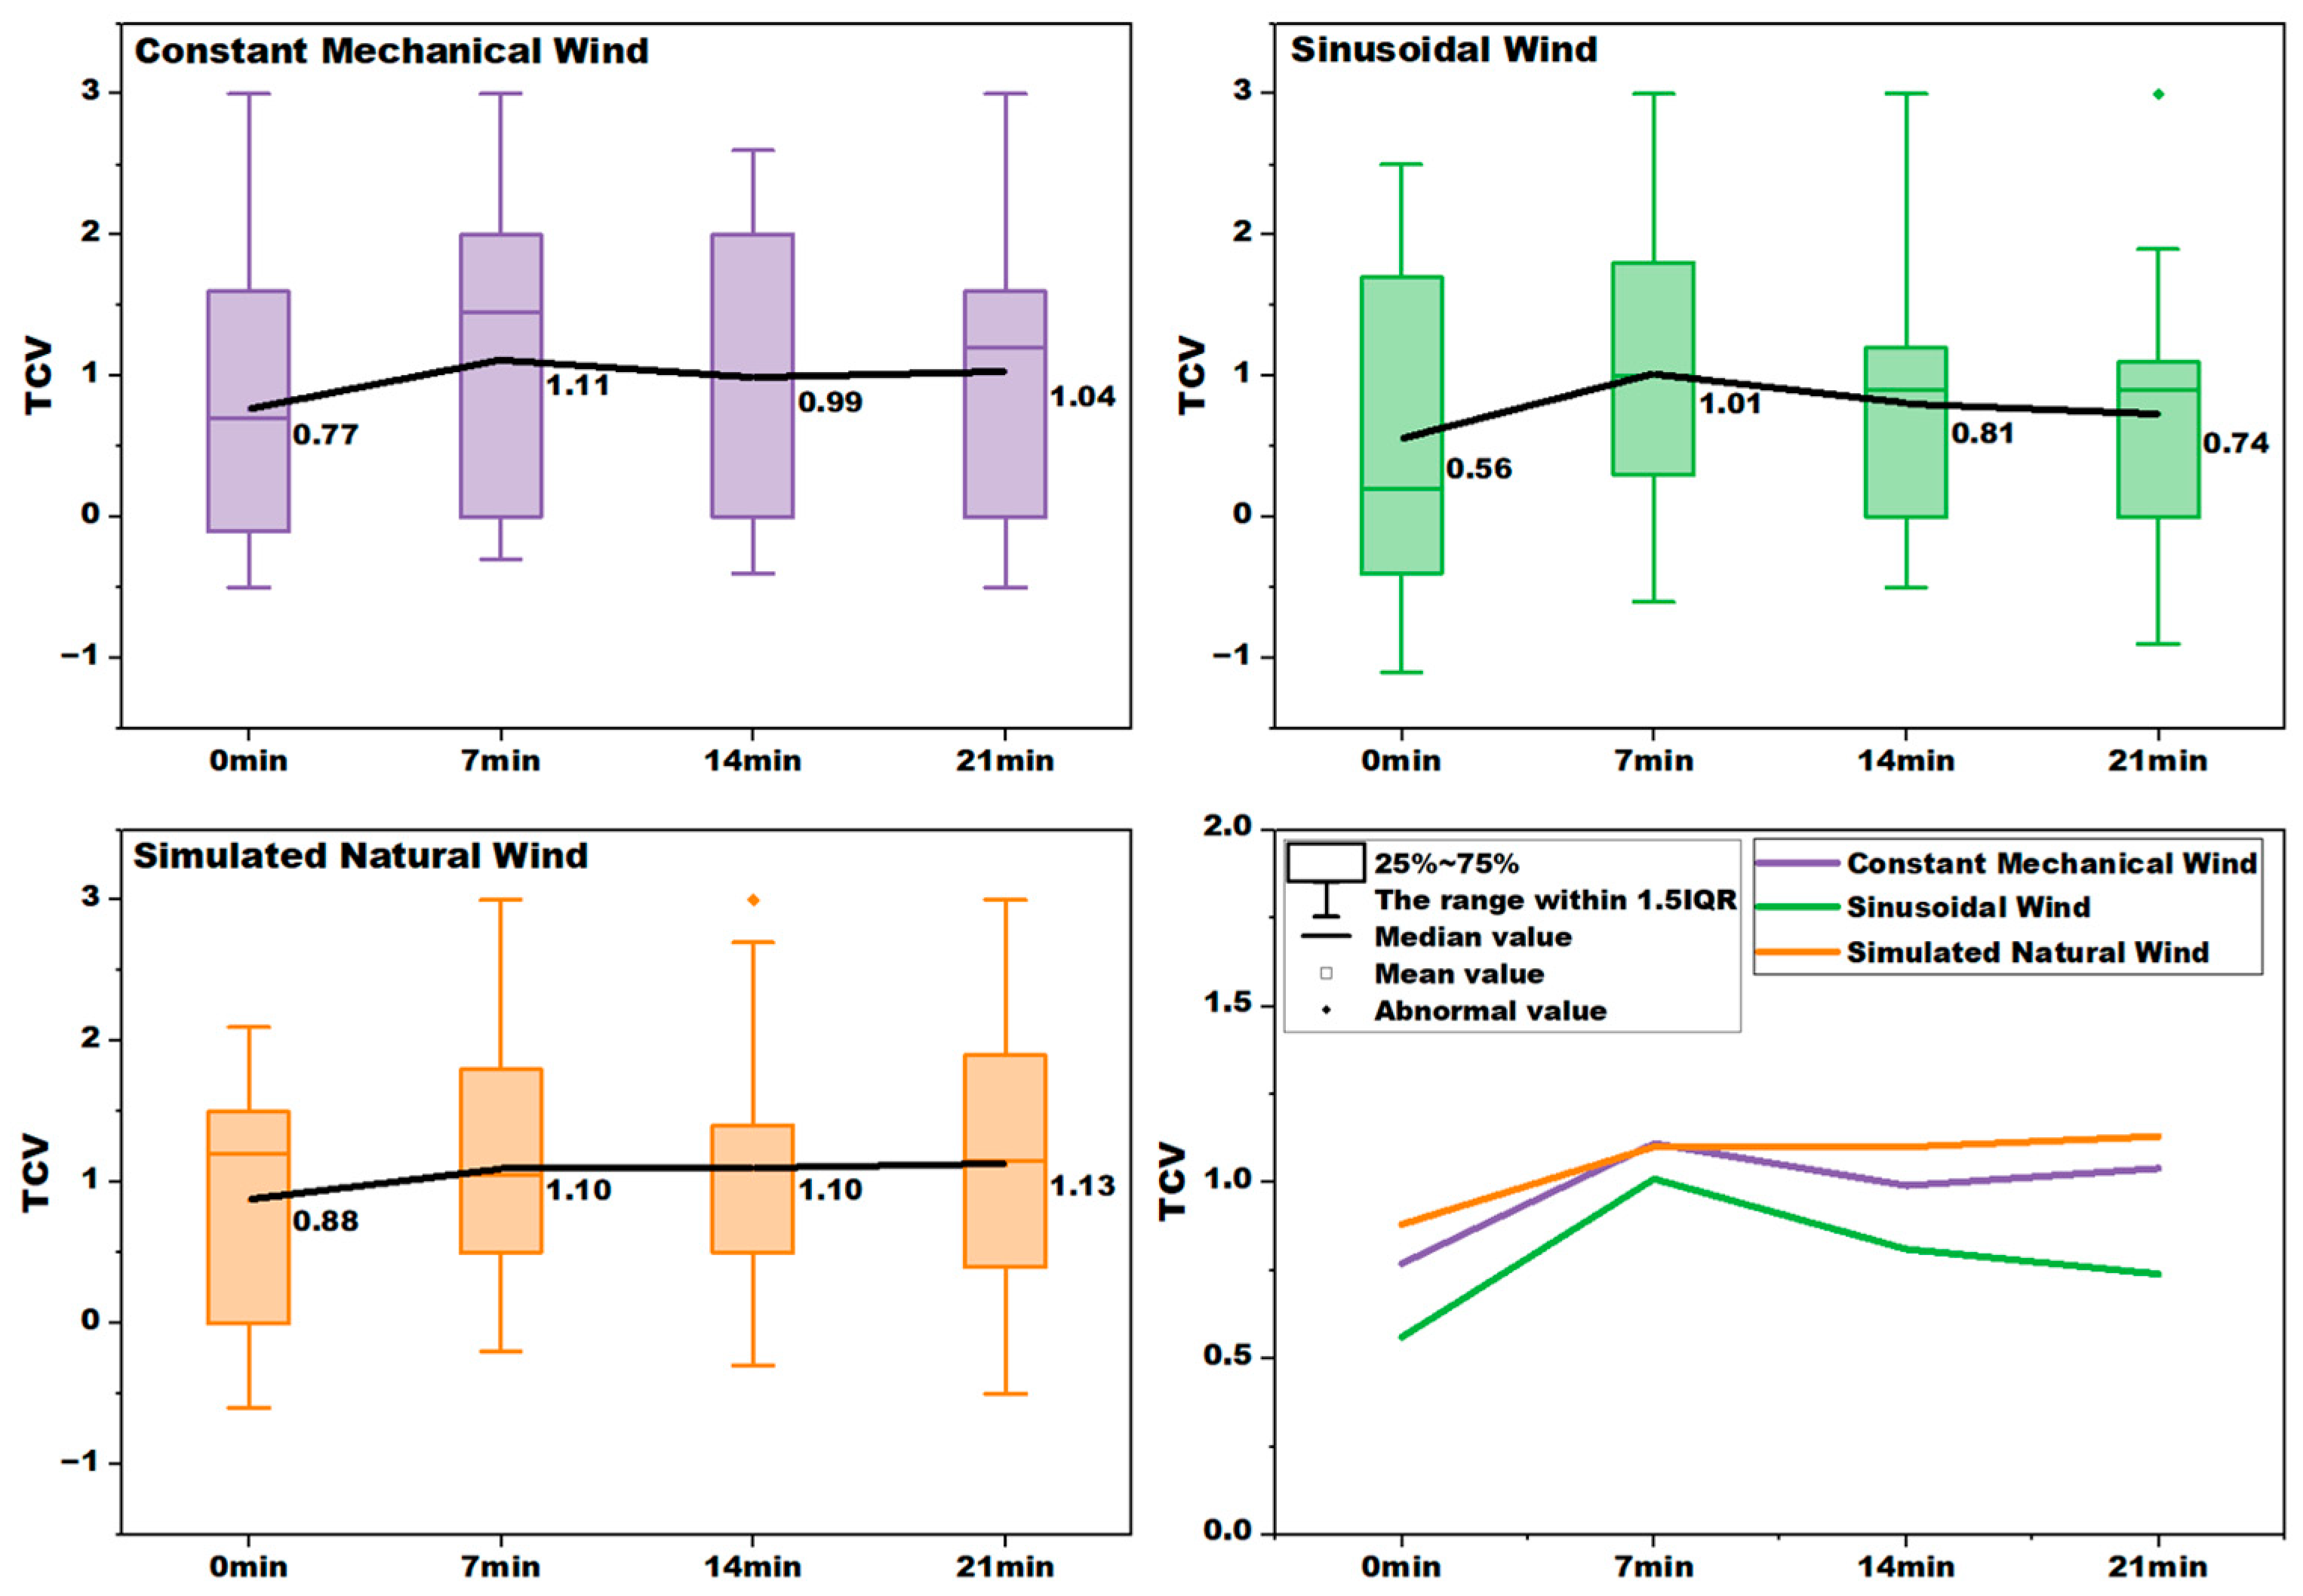
As the time following entry into the environment increased, the TCV was consistently higher and more stable in the simulated natural wind compared to the sinusoidal and constant mechanical winds. In all three airflows, the TCV was higher at 7 min compared to when the subjects were just entering. As time passed, both under sinusoidal wind and constant mechanical wind, the TCV of subjects demonstrated a decline (Figure 10).
The fluctuations in TCV under sinusoidal and constant mechanical winds corresponded to the TSV. From 0 to 7 min, the TSV approached 0 from less than 0, and the TCV increased gradually. From 7 min until 14 min, the TSV gradually rises above 0, with a concomitant small decline in the TCV. After 14 min, the change in TCV is relatively small. In the case of the simulated natural wind, the TCV was found to be more stable.

3.5. Thermal Sensation Vote for Different Body Parts

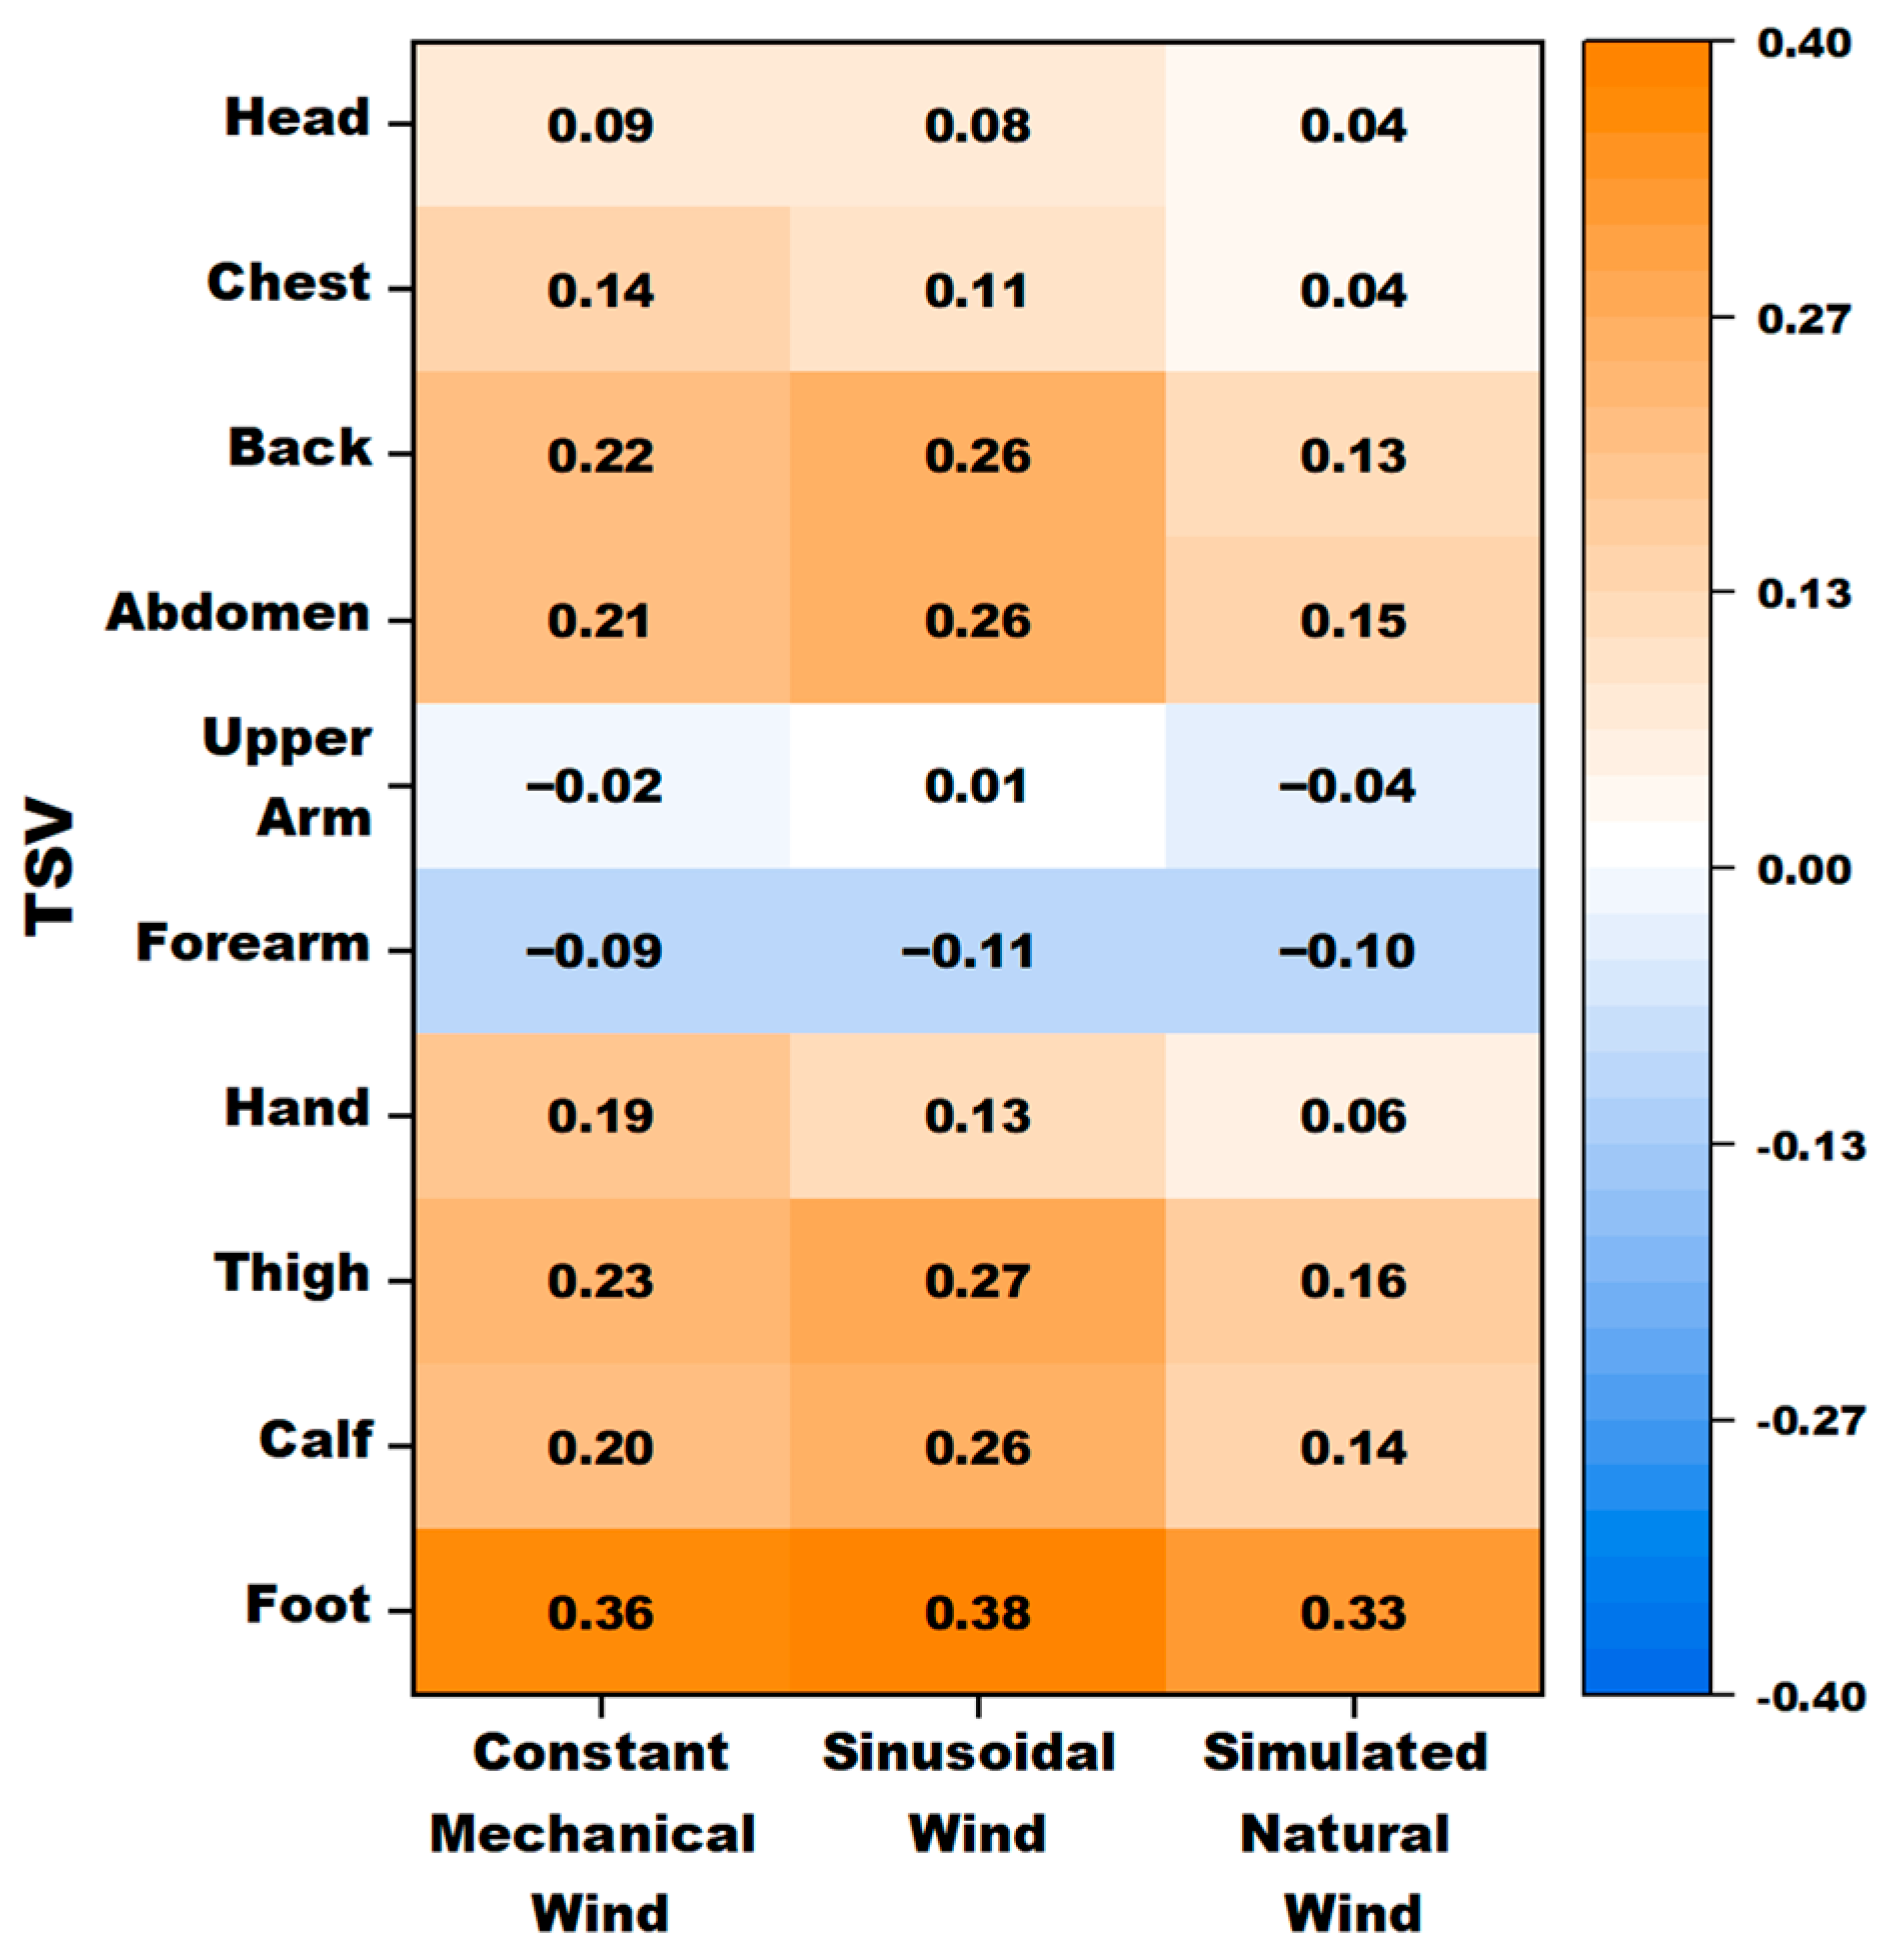
The lowest TSV was identified in the upper arm and forearm, while the highest was found in the foot. The thermal sensation uniformity of all parts under simulated natural wind conditions was found to be superior to that of constant mechanical wind and sinusoidal wind conditions, and closer to neutral. The disparity in thermal sensation between the upper arm, forearm, and foot under varying wind conditions was minimal. It is evident that the TSVs in the three environments all decrease in order: feet > thighs and calves > back and abdomen > hands > chest > head > upper arms > forearms (Figure 11). The variation in thermal sensation among different body regions can be attributed, firstly, to the disparity in wind speeds at these locations. Concurrently, disparities in the thermal resistance of local clothing for distinct body parts, such as some exposed parts, were also observed. Furthermore, for different body parts at locations with similar wind speeds and thermal resistance, there were also differences in TSV. This is due to the fact that different parts have different sensitivities to the thermal environment.

3.6. Thermal Comfort Vote for Different Body Parts

The mean TCV values of all body parts in the simulated natural wind environment were higher than those of the constant mechanical wind and sinusoidal wind. In the constant mechanical wind environment, the TCV values of all parts were in the range of 0.63–0.95, with relatively high thermal comfort in the abdomen, thighs and calves and relatively low thermal comfort in the back. In the sinusoidal wind environment, the TCV of each part ranged from 0.57 to 0.96, with low thermal comfort in the head and back. In the simulated natural wind environment, the TCV of each body part was ranged from 0.86 to 1.10, with the comfort level of each part being higher and more uniform than in the other two environments (Figure 12).

3.7. Mean Skin Temperature

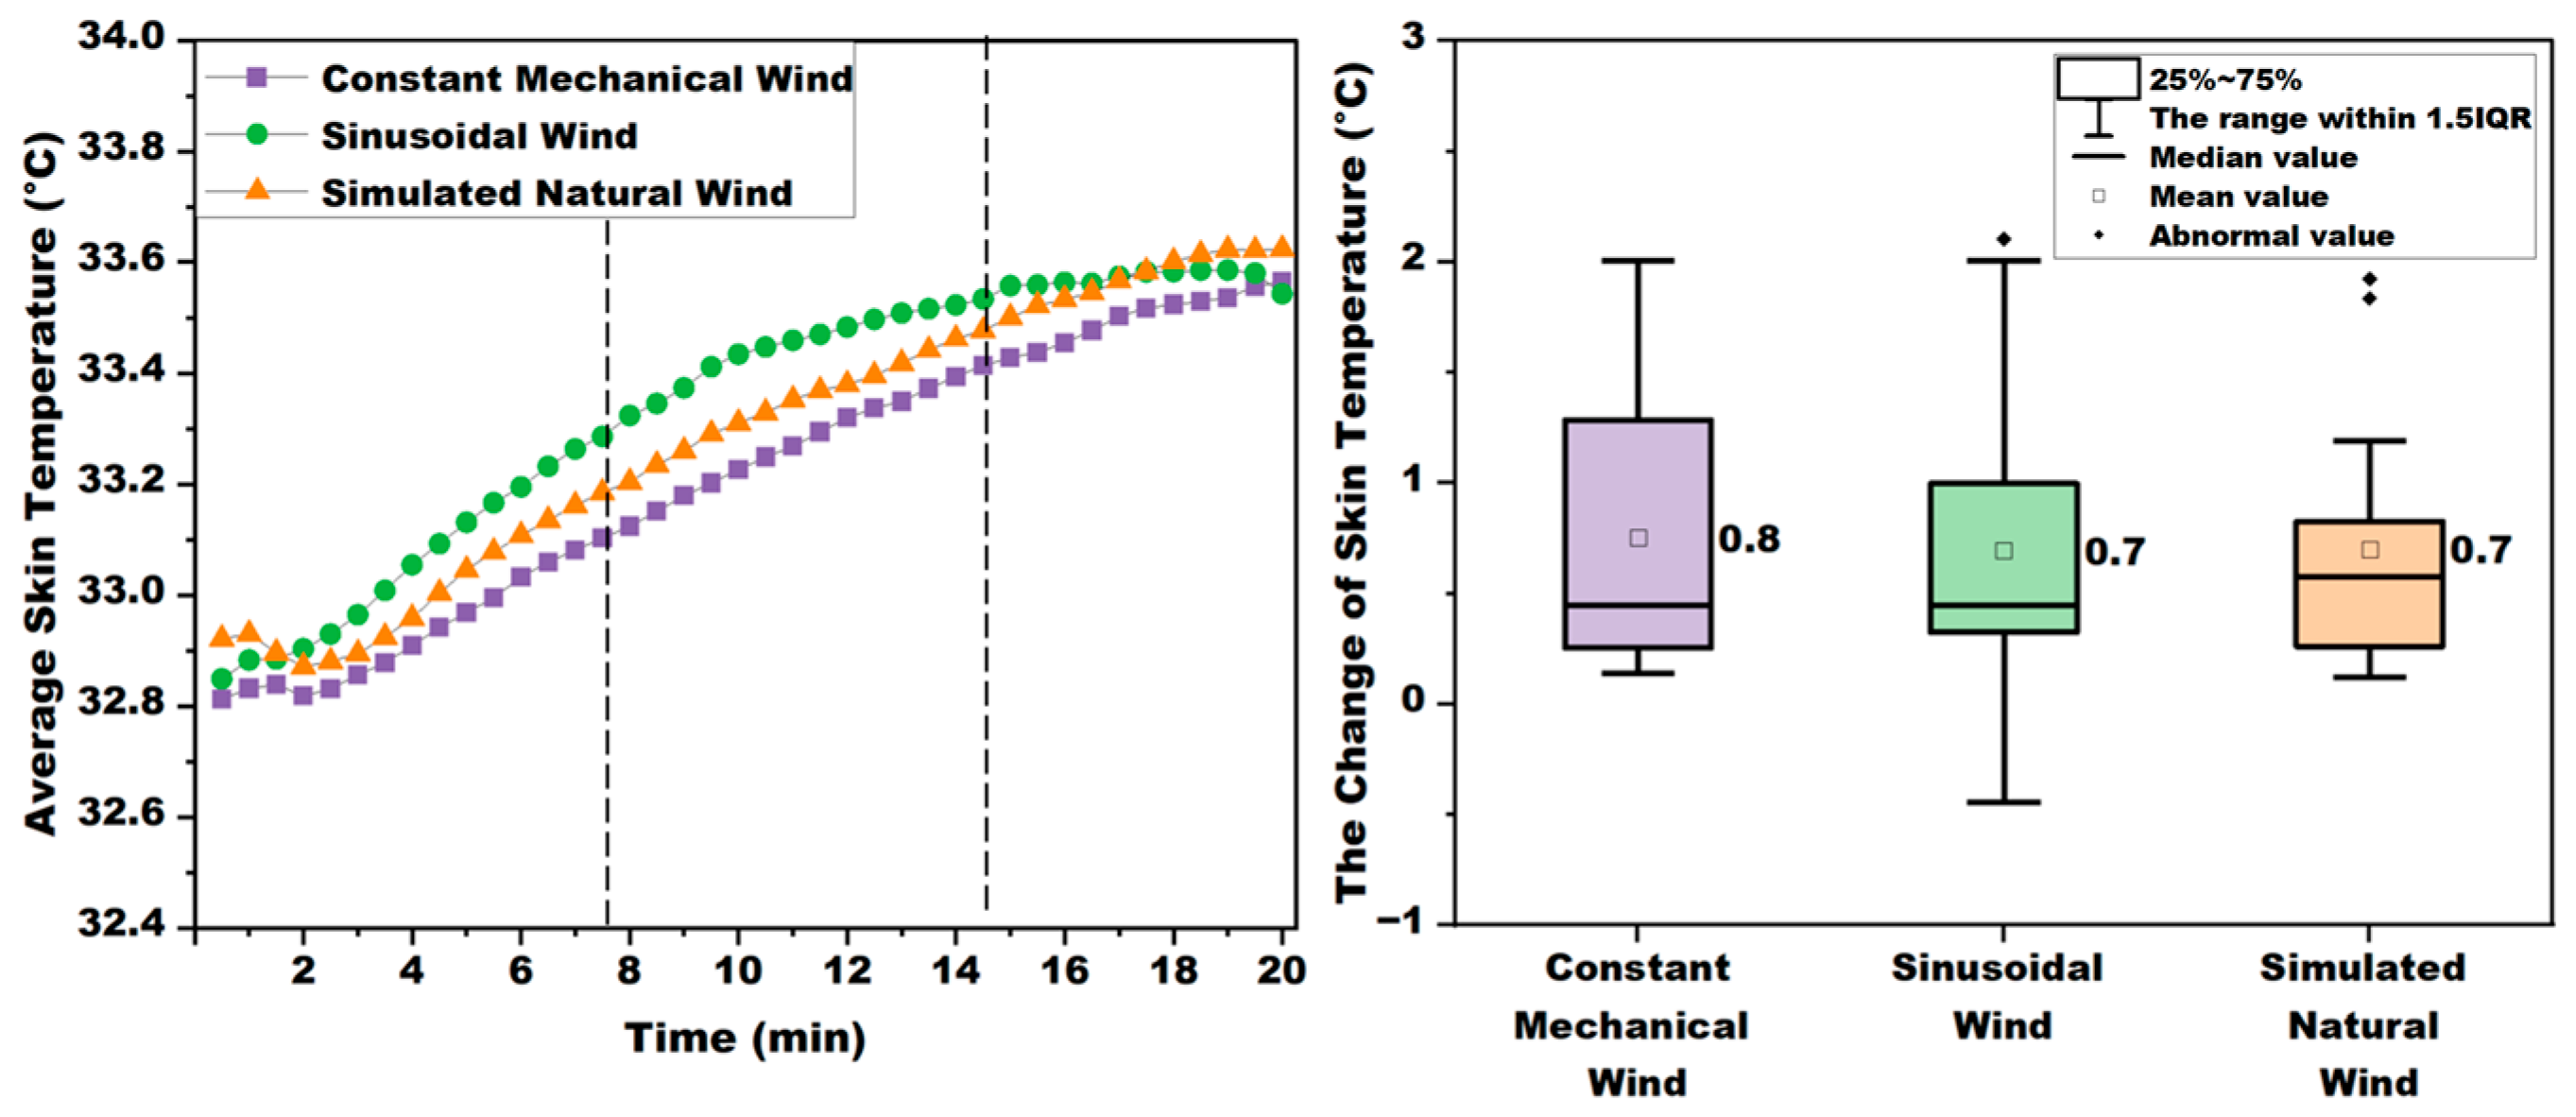
Skin temperature increased over time in all three environments. In the constant mechanical wind environment, an increase in skin temperature of 0.8 °C was observed. Furthermore, an increase of 0.7 °C and 0.7 °C was documented in the sinusoidal wind and simulated natural wind conditions, respectively (Figure 13). A significant decrease in skin temperature was observed in the simulated natural wind condition upon initial entry into the laboratory, which is consistent with the lower TSV (Figure 9) recorded when entering the simulated natural wind condition in comparison to the other environments. A division of the change in skin temperature according to the time points of the questionnaire reveals that, in all three environments, the rise in skin temperature is gradually slowing down and levelling off.

3.8. Skin Temperature of Different Body Parts

In the constant mechanical wind environment, the values of skin temperature change in all parts ranged from −0.3 to 1.3 °C. In the sinusoidal wind environment, these values ranged from −0.2 to 0.7 °C, while in the simulated natural wind environment, they ranged from −0.2 to 0.9 °C. The most uniform values of skin temperature change in different body parts were found in the sinusoidal wind environment, followed by the simulated natural wind, and lastly, the constant mechanical wind. In all three environments, a decrease in skin temperature of the head was observed, whilst the remaining body parts exhibited an increase (Figure 14).

3.9. Gender Differences in TSV

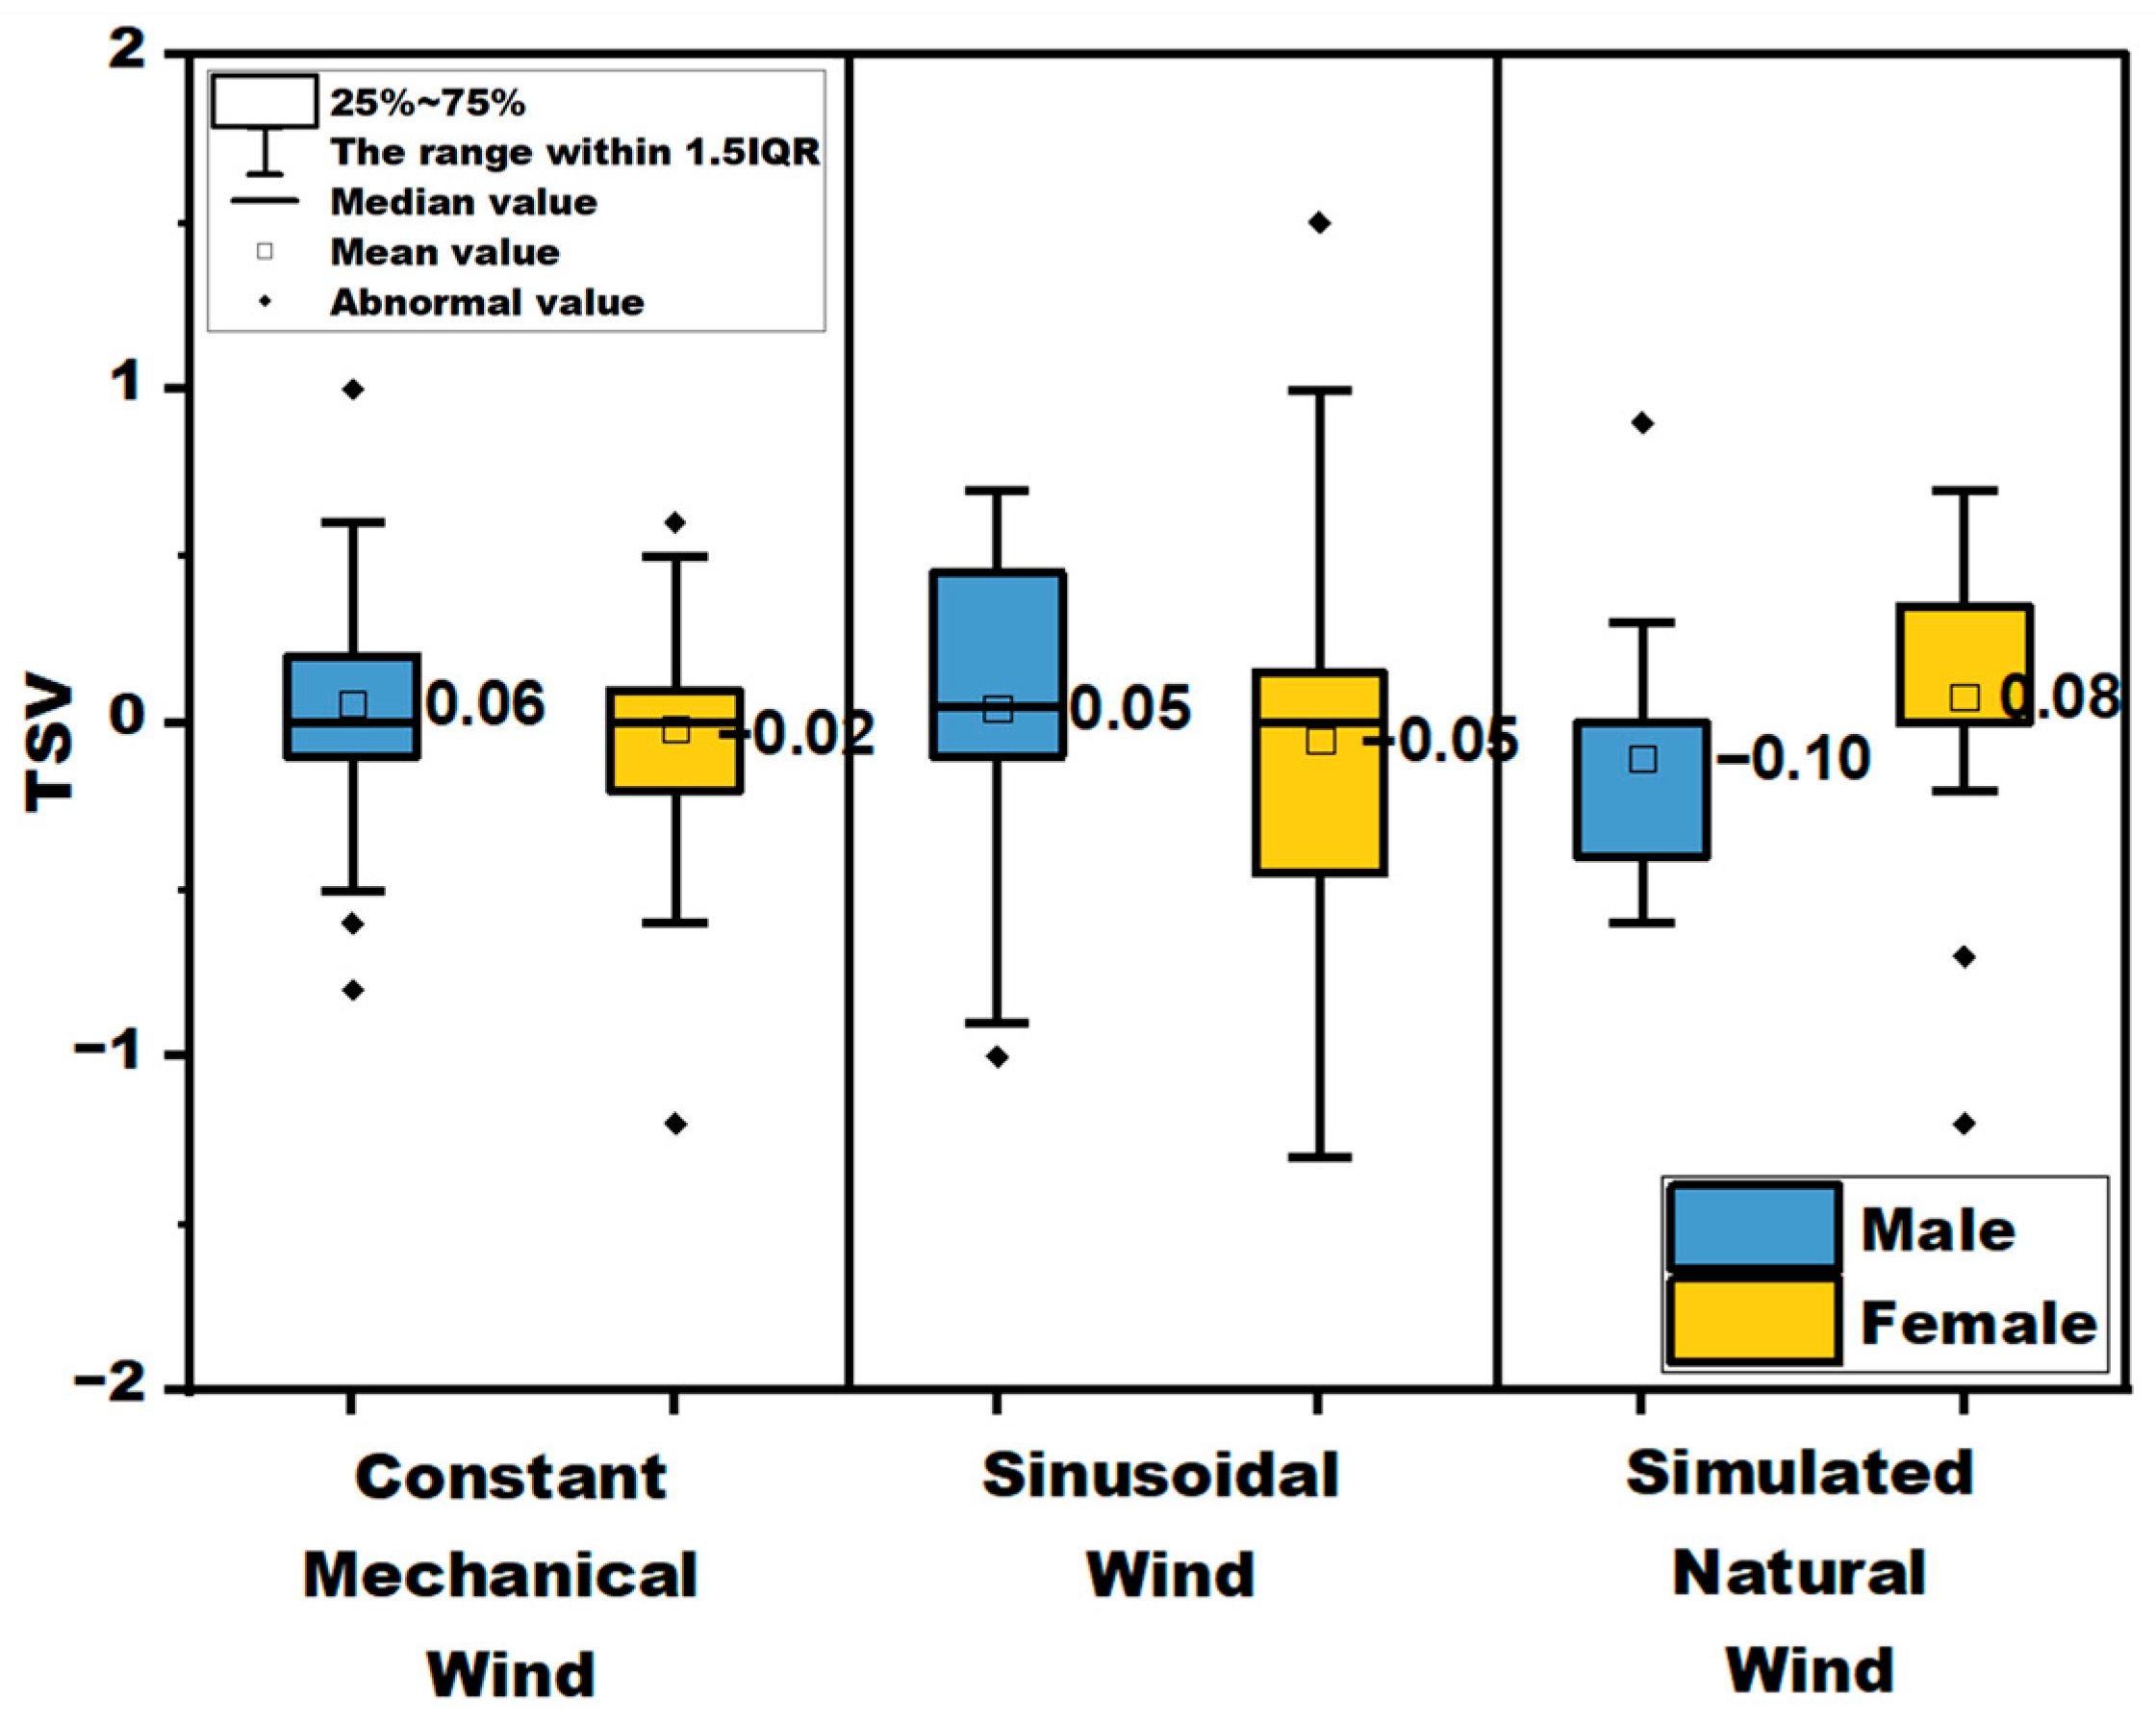
According to Figure 15, under constant mechanical wind and sinusoidal wind conditions, the TSV of males was higher than that of females, while under simulated natural wind conditions, the TSV of males was lower than that of females. Overall, the differences in TSV among the various conditions are relatively small. Under simulated natural wind conditions, the difference in TSV between males and females was the greatest.

3.10. Gender Differences in TCV

According to Figure 16, under constant mechanical wind, the TCV of males was the highest, and there was not much difference compared to the simulated natural wind condition. However, under the simulated natural wind condition, the TCV of females was the highest. The TCV results seem not to have a linear correlation with the TSV. This further indicates that thermal comfort is not only dependent on thermal factors but also influenced by the effect of air flow pressure stimulation.

4. Discussion

4.1. Airflow Characteristics and Subjects Perception

The present experiment explored different aspects of subjects’ wind perception. We identified three predominant perceptions: (1) stiffness and softness; (2) fatigue and relaxation; and (3) disturbance and calmness. The overall perception of softness and relaxation was found to be significantly higher in the simulated natural wind environment than in the constant mechanical wind and sinusoidal wind environments. Conversely, the perception of calmness was found to be significantly lower in the simulated natural wind environment than in the constant mechanical wind environment (Figure 17). This finding suggests that the fluctuation of simulated natural wind can enhance the perception of softness and relaxation, but it can also cause disturbance to the subjects. Consequently, the efficacy of simulated natural wind may also be contingent on the user’s condition. It can be hypothesized that simulated natural wind may be more suitable for the resting state than the working state [34].
It has been demonstrated in other studies that thermal comfort levels under sinusoidal wind conditions are, in general, higher than those experienced under constant mechanical wind conditions [11,35]. However, the results obtained in this experiment are not consistent with these findings. This may be attributable to the sinusoidal wind employed in this experiment displaying divergent dynamic characteristics, including frequency [36] and fluctuation amplitude, when compared with other experiments. The average wind speed used in this experiment was 1.24 m/s, with the maximum wind speed being 1.39 m/s and the minimum wind speed being 1.09 m/s, resulting in a fluctuation amplitude of 0.15 m/s. The period was 25 s, which corresponds to a frequency of 0.04 Hz. The measured turbulence intensity was 18%. In existing studies, for instance, Zhou et al. [35] used a sinusoidal wind turbulence intensity of 53%, a frequency of 0.1 Hz, and an average wind speed of 0.8 m/s. In Huang et al.’s [36] study, the air temperature was 30 °C, the average wind speed was 0.6 m/s, and in a sinusoidal wind environment with a turbulence intensity of 30–40%, a 0.5 Hz sinusoidal wind was considered comfortable. The average speed of the airflow used in this study was determined based on ensuring the average thermal sensation to be neutral. In the pre-experiment conducted before the main experiment, at this wind speed, a high frequency and turbulence intensity would cause significant interference to the subjects and cause discomfort. Therefore, a relatively gentle fluctuation frequency and amplitude were selected. In fact, the impact of different frequency sinusoidal winds on comfort requires further research.

4.2. Skin Temperature and Thermal Sensation

A comprehensive analysis revealed that the relationship between TSV and skin temperature changes in various body parts was non-linear. To illustrate this, consider the example of the skin temperature increase under constant mechanical wind. It can be seen that this increase was relatively large, and the TSV was also high, showing some correlation. However, in the back and calf, the skin temperature increase was not consistent with TSV. For instance, the back exhibited the greatest skin temperature increase under simulated natural wind, while TSV was higher under sinusoidal wind. The impact of diverse wind environments on heat transfer to the human body is a multifaceted issue that is influenced by a combination of wind speed and wind direction. The thermal sensation of each body part is influenced by a combination of factors, including skin temperature and the characteristics of wind blowing. The intricate mechanisms of heat exchange and physiological sensing imply that further research is required to fully comprehend the interplay between wind conditions and human thermal sensation.
Concurrently, the sensitivity and preference of disparate body parts to fluctuations in skin temperature also exhibit marked variation. For instance, a decline in skin temperature was observed on the forehead, while an increase was noted on the forearm and upper arm. However, the TSV of the head exceeded that of the forearm and upper arm. This result corroborates the findings of earlier research, which demonstrated that different body parts exhibit a preference for distinct temperature intervals. For instance, the head was shown to have a lower tolerance for elevated temperatures [37].

4.3. Individual Differences

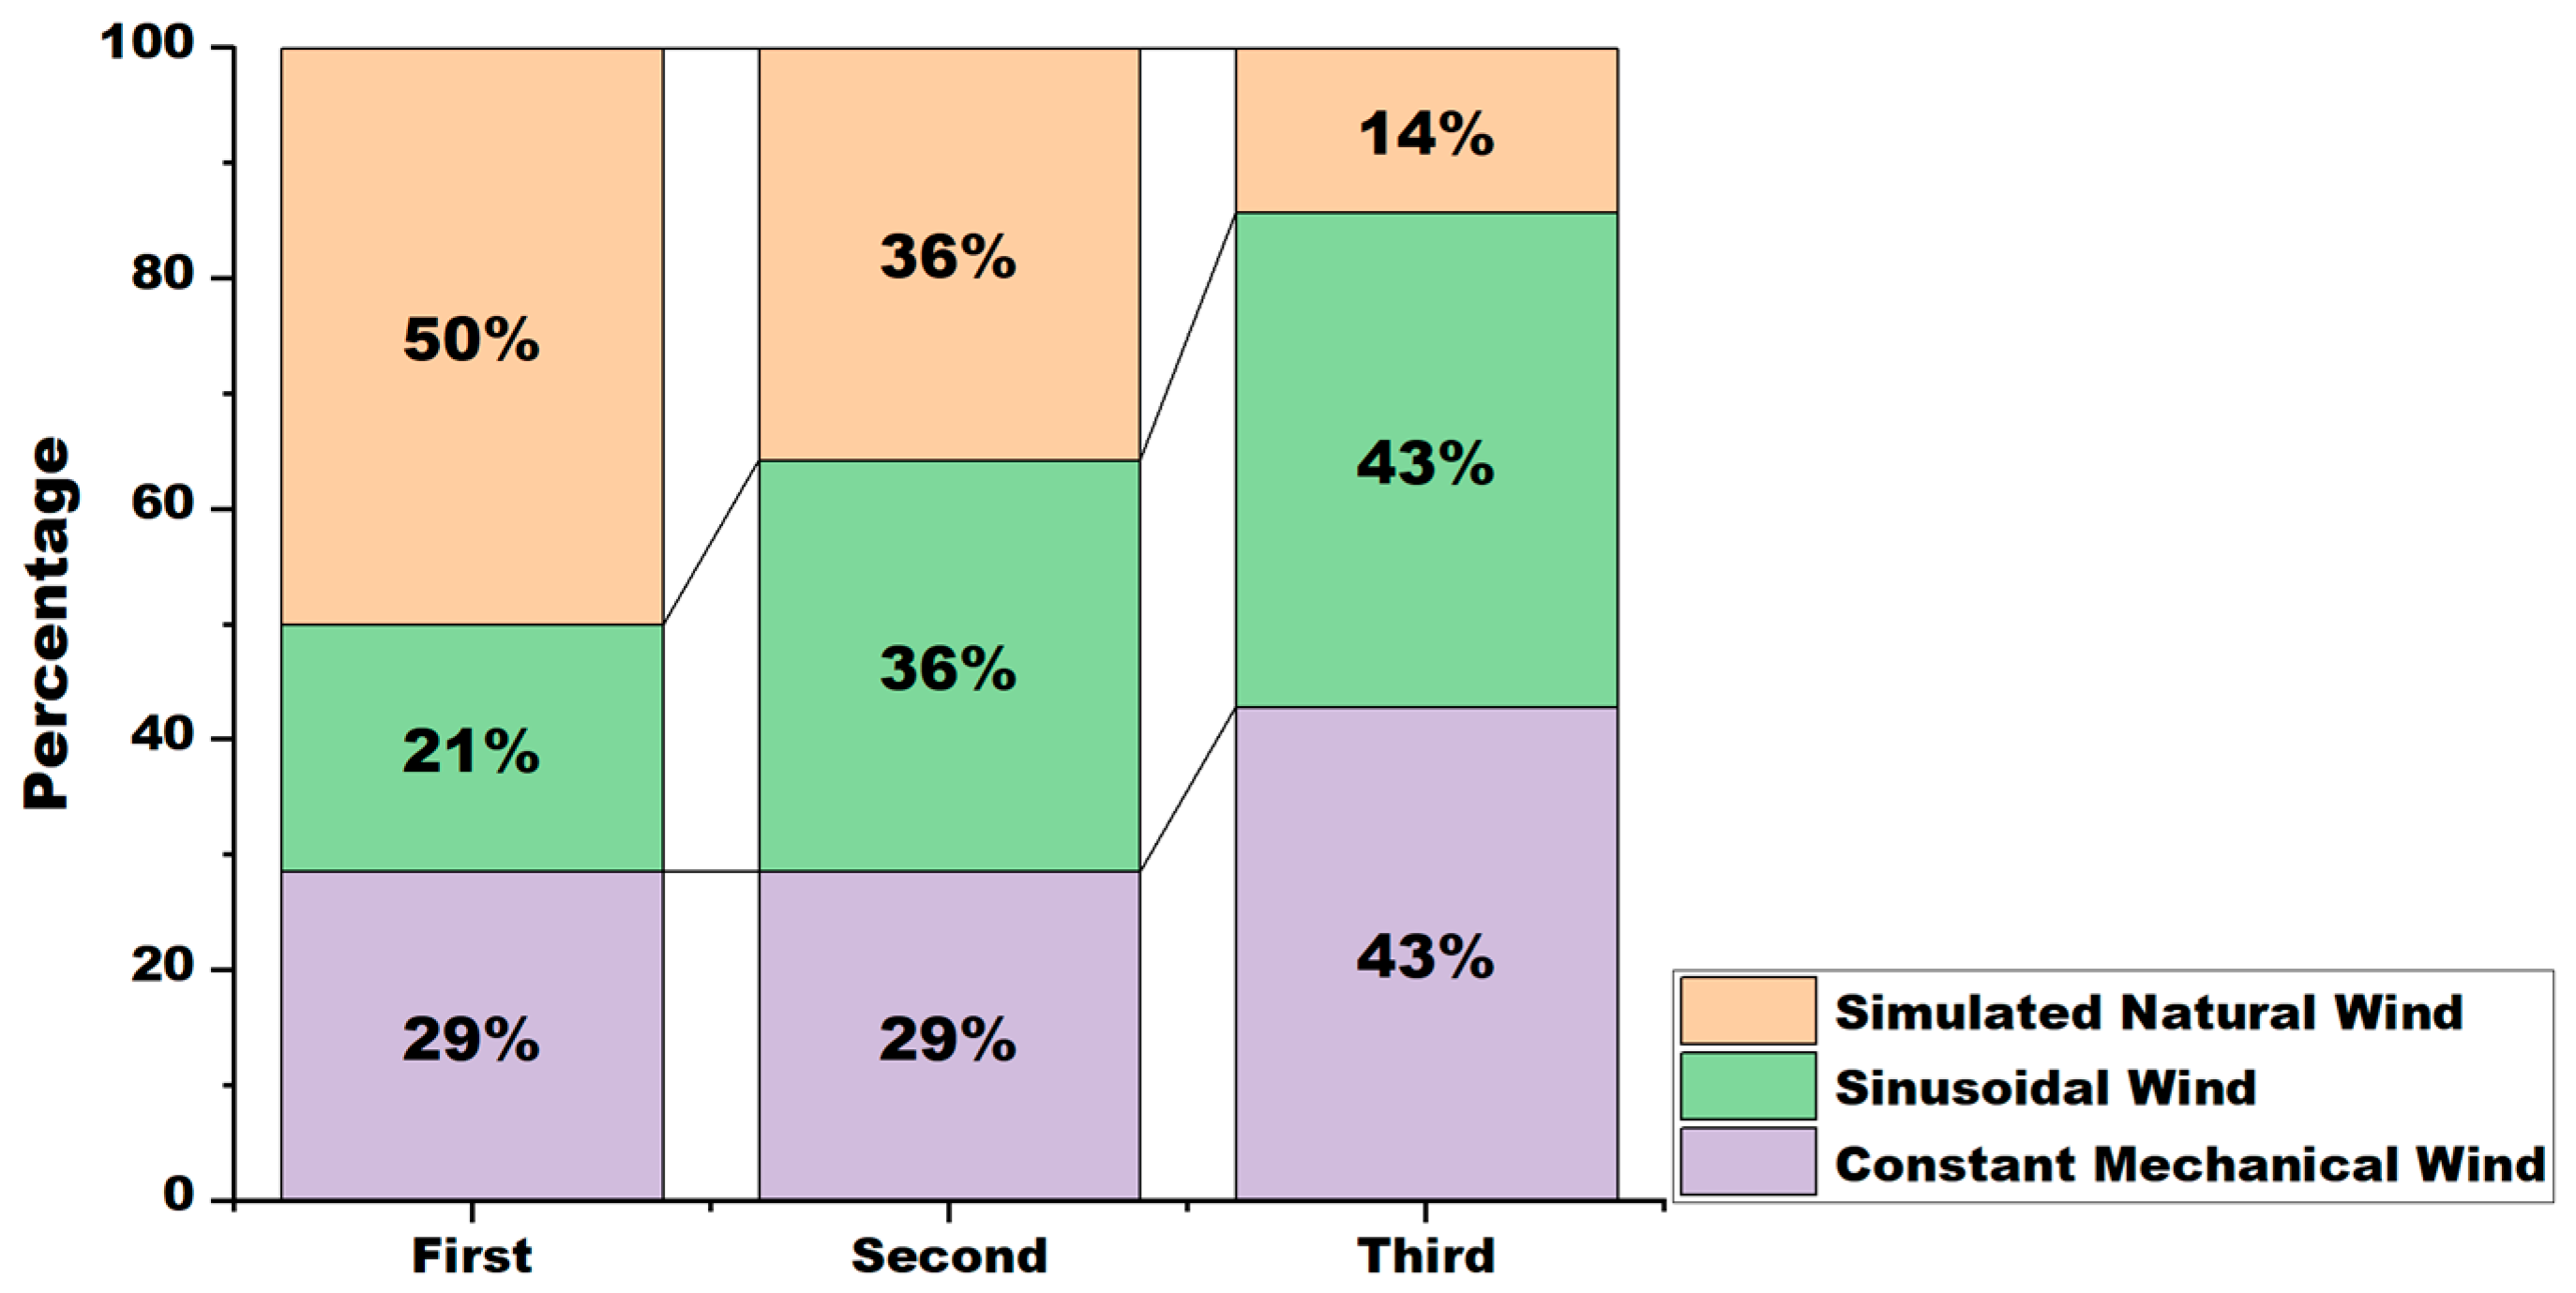
At the end of the experiment, the participants were asked to fill out a supplementary questionnaire, ranking the comfort levels of the three environments they had experienced. The ranking was still made using the code names of the three environments, and the specific wind types of the experienced environments were not disclosed to the participants. Based on the proportion of the rankings, Figure 18 was drawn. It can be seen that among the comfort level rankings, 50% chose the simulated natural wind as the top choice, which was significantly higher than the other two types of wind. In consideration of the three wind environments that were simulated, the preference was expressed for the simulated natural wind conditions, with the constant mechanical wind conditions ranking second. As demonstrated in Figure 7 and Figure 8, the thermal sensation under sinusoidal wind is more closely aligned with neutral compared to that under constant mechanical wind. However, the TCV remains comparatively low, particularly after 14 min, exhibiting a downward trend that differs from the patterns observed under constant mechanical and simulated natural wind. This phenomenon may be attributed to the constant mechanical wind speed, relatively stable heat exchange, and gradual stabilization of human thermal comfort after a period of acclimatization. The sinusoidal variation in wind speed, characterized by periodic fluctuations, initially provides a sense of comfort. However, subsequent stages may be accompanied by a decrease in TCV, attributable to the repetitive and frequent alterations in the cycle. The wind speed of the simulated natural wind is complex and variable, and the thermal comfort is enhanced during the human body’s adaptation process in the early stage. This fluctuated but was maintained at a relatively comfortable level in the subsequent stage due to the close proximity to the natural environment.
Despite the evident benefits of simulated natural wind, it is important to acknowledge that each of these three wind environments has its own set of supporters. This finding underscores the necessity for consideration of individual differences in practical applications.

4.4. Limitations and Subsequent Research Directions

As previously stated, the state of people may have an effect on the preference for the wind environment, and subsequent research could incorporate this aspect into the study.
The experimental results indicate that the temperature and humidity levels set in this study were not sufficiently high, making it relatively easier to achieve a thermally neutral and comfortable environment through airflow. Subsequent experiments should involve higher temperature and humidity conditions to explore the comfort boundaries and acceptability limits attainable with different airflow strategies. In fact, some studies have shown that an appropriate airflow pattern can expand the comfortable range to 32 °C [38]. Some researchers have also studied different humidity levels, such as Yu et al. [11], who found that at 30 °C, the upper limit of the comfortable wind speed increases with increasing humidity. At a humidity of 50%, the upper limit of the comfortable wind speed is 0.86 m/s, at 70% it is 1.42 m/s, and at 90% it is 1.5 m/s. Huang et al. [39] discovered that under an airflow speed of 0.8 m/s, for environments with 30% relative humidity, 50% relative humidity, and 90% relative humidity, the upper acceptable temperature limits can be extended to 31.6 °C, 31.4 °C, and 29.2 °C, respectively, indicating that as the humidity increases, the acceptable temperature range narrows.
It should be noted that this experiment employed only a single sample for both sinusoidal and simulated natural wind conditions. Previous studies have demonstrated that sinusoidal wind and simulated natural wind exhibit different fluctuation characteristics, which may significantly influence human subjective perception. Future research should investigate dynamic winds with varying characteristics to better determine how specific parameter values (e.g., fluctuation frequency and magnitude) affect comfort levels under the same airflow type.
Current research indicates that at a temperature of 30 °C and with an average wind speed of around 1.25 m/s, the airflow can make the thermal sensation of the subjects approach thermal neutrality. When using simulated natural wind, it is often desired that β be as large as possible, close to or above 1. In addition, there are certain limitations on the amplitude and frequency of the fluctuations, which are restricted by the limited space in the indoor environment. Excessive amplitude and frequency of the fluctuations may cause certain disturbances to the users. Based on this, it is necessary to further determine the range of fluctuations that users perceive as “gentle”.

5. Conclusions

This study explored the influence of three different characteristics of air conditioning winds, namely constant mechanical wind, sinusoidal wind, and simulated natural wind, on thermal comfort at a room temperature of 30 °C. The main conclusions are as follows:
  • Compared to constant mechanical wind and sinusoidal wind, the lowest TSV and the highest TCV were observed in the simulated natural wind environment, indicating that simulated natural wind is more effective in reducing thermal sensation and improving thermal comfort in a hot environment.
  • The fluctuation of TSV in the simulated natural wind environment was found to be the most significant over time. In all three wind environments, TSV demonstrated an initial increase, followed by a small decrease or fluctuation over time.
  • During the experimental period, the TCV recorded under simulated natural wind conditions remained higher and more stable than those measured under both sinusoidal and constant mechanical airflow conditions.
  • The lowest levels of TSVs were observed in the upper arm and forearm, while the highest levels were detected in the feet. The uniformity of thermal sensation across all body parts under the simulated natural wind was comparatively superior to that under the constant mechanical wind and sinusoidal wind, and it was closer to neutrality.
  • The findings demonstrated that the sensation of softness and relaxation experienced under the simulated natural wind was higher than under the constant mechanical wind or sinusoidal wind conditions. Furthermore, the level of calmness perceived was lower in the simulated natural wind conditions compared to the constant mechanical wind. This finding suggests that the variability of the simulated natural wind may enhance the subjects’ sense of softness and relaxation; however, it may also induce disturbances.
  • At 30 °C, an airflow with an average wind speed of around 1.25 m/s can make the thermal sensation of the subjects approach thermal neutrality. Features that are closer to natural wind may enhance the comfort of the subjects. However, there are certain limitations on the amplitude and frequency of the fluctuations. Due to the limited space in the indoor environment, too large amplitude and frequency of the fluctuations may cause certain disturbances to the users.

Author Contributions

Formal analysis, Y.W.; Investigation, Y.W.; Resources, J.L. (Jing Li), J.L. (Jing Ling), J.L. (Jinwen Liu), M.G., K.Q. and M.Y.; Writing—original draft, Y.W.; Writing—review and editing, B.C.; Supervision, J.L. (Jing Li) and B.C. All authors have read and agreed to the published version of the manuscript.

Funding

This study was funded by the collaborative R&D project between Qingdao Haier Air Conditioner Co. Ltd. and Tsinghua University.

Institutional Review Board Statement

Tsinghua University Science and Technology Ethics Committee (Medicine), THU01-20240083, 4 June 2024.

Informed Consent Statement

Informed consent was obtained from all subjects involved in this study.

Data Availability Statement

The data presented in this study are available upon request from the corresponding author.

Conflicts of Interest

The authors declare that they have no known competing financial interests or personal relationships that could have appeared to influence the work reported in this paper. The collaborative R&D project between Qingdao Haier Air Conditioner Co., Ltd. and Tsinghua University provided funding and technical support for the work.

Abbreviations

The following abbreviations are used in this manuscript:
TSVThermal sensation vote
TCVThermal comfort vote
TaAir temperature
RHRelative humidity
VaAir velocity
TgGlobe temperature
TskinSkin temperature
mTskMean skin temperature
MMetabolic rate (met)
IcloClothing insulation (clo)

References

  1. Randazzo, T.; De Cian, E.; Mistry, M.N. Air conditioning and electricity expenditure: The role of climate in temperate countries. Econ. Model. 2020, 90, 273–287. [Google Scholar] [CrossRef]
  2. Liu, S.; Schiavon, S.; Kabanshi, A.; Nazaroff, W.W. Predicted percentage dissatisfied with ankle draft. Indoor Air 2017, 27, 852–862. [Google Scholar] [CrossRef]
  3. Chen, A.; Chang, V.W.-C. Human health and thermal comfort of office workers in Singapore. Build. Environ. 2012, 58, 172–178. [Google Scholar] [CrossRef]
  4. D’Amato, M.; Molino, A.; Calabrese, G.; Cecchi, L.; Annesi-Maesano, I.; D’Amato, G. The impact of cold on the respiratory tract and its consequences to respiratory health. Clin. Transl. Allergy 2018, 8, 20. [Google Scholar] [CrossRef]
  5. Tamura, K.; Matsumoto, S.; Tseng, Y.H.; Kobayashi, T.; Miwa, J.; Miyazawa, K.; Hirao, T.; Matsumoto, S.; Hiramatsu, S.; Otake, H.; et al. Physiological and subjective comfort evaluation under different airflow directions in a cooling environment. PLoS ONE 2021, 16, e0249235. [Google Scholar] [CrossRef]
  6. Hua, J.; Ouyang, Q.; Wang, Y.; Li, H.; Zhu, Y. A dynamic air supply device used to produce simulated natural wind in an indoor environment. Build. Environ. 2012, 47, 349–356. [Google Scholar] [CrossRef]
  7. Tian, X.; Zhang, S.; Lin, Z.; Li, Y.; Cheng, Y.; Liao, C. Experimental investigation of thermal comfort with stratum ventilation using a pulsating air supply. Build. Environ. 2019, 165, 106416. [Google Scholar] [CrossRef]
  8. Bhandari, N.; Tadepalli, S.; Gopalakrishnan, P. Influence of non-uniform distribution of fan-induced air on thermal comfort conditions in university classrooms in warm and humid climate, India. Build. Environ. 2023, 238, 110373. [Google Scholar] [CrossRef]
  9. Fanger, P.O.; Østergaard, J.; Olesen, S.; Madsen, T.L. The effect on man’s comfort of a uniform airflow from different directions. ASHRAE Trans. 1974, 80, 142–157. [Google Scholar]
  10. Arens, E.; Xu, T.; Miura, K.; Hui, Z.; Fountain, M.; Bauman, F. A study of occupant cooling by personally controlled air movement. Energy Build. 1998, 27, 45–59. [Google Scholar] [CrossRef]
  11. Yu, W.; Zhou, Y.; Li, B.; Ruan, L.; Zhang, Y.; Du, C. An innovative method of simulating close-to-nature-dynamic air movement through dynamically controlling electric fans. J. Build. Eng. 2022, 45, 103410. [Google Scholar] [CrossRef]
  12. Wang, Y.; Wang, Z.; Zhang, N.; Ji, W.; Zhu, Y.; Cao, B. Field studies on thermal comfort in China over the past 30 years. Build. Environ. 2025, 269, 112449. [Google Scholar] [CrossRef]
  13. Cao, S.-H.; Ming, P.-P.; Zhao, X. Fuzzy comprehensive evaluation of human thermal comfort in simulating natural wind environment. Build. Environ. 2021, 188, 107447. [Google Scholar] [CrossRef]
  14. Hoyt, T.; Arens, E.; Zhang, H. Extending air temperature setpoints: Simulated energy savings and design considerations for new and retrofit buildings. Build. Environ. 2015, 88, 89–96. [Google Scholar] [CrossRef]
  15. O’Connor, F.K.; Meade, R.D.; Wagar, K.E.; Harris-Mostert, R.C.; Tetzlaff, E.J.; McCormick, J.J.; Kenny, G.P. Effect of Electric Fans on Body Core Temperature in Older Adults Exposed to Extreme Indoor Heat. JAMA 2024, 332, 1752–1754. [Google Scholar] [CrossRef] [PubMed]
  16. ASHRAE 55-2023; Thermal Environmental Conditions for Human Occupancy. ASHRAE: Peachtree Corners, GA, USA, 2023.
  17. Zhao, H.; Ji, W.; Deng, S.; Wang, Z.; Liu, S. A review of dynamic thermal comfort influenced by environmental parameters and human factors. Energy Build. 2024, 318, 114467. [Google Scholar] [CrossRef]
  18. Xie, Z.; Cao, B.; Zhu, Y. A novel wind comfort evaluation method for different airflows by considering dynamic characteristics of wind direction and velocity. Build. Environ. 2023, 246, 110976. [Google Scholar] [CrossRef]
  19. Xiao, D.; Yuan, Q.; Yue, R. Experimental investigation of air conditioner’s comfortable and energy by multidimensional wind. Chin. J. Refrig. Technol. 2011, 21–22+39. [Google Scholar]
  20. Pasut, W.; Arens, E.; Zhang, H.; Zhai, Y. Enabling energy-efficient approaches to thermal comfort using room air motion. Build. Environ. 2014, 79, 13–19. [Google Scholar] [CrossRef]
  21. Kabanshi, A.; Wigö, H.; Ljung, R.; Sörqvist, P. Experimental evaluation of an intermittent air supply system—Part 2: Occupant perception of thermal climate. Build. Environ. 2016, 108, 99–109. [Google Scholar] [CrossRef]
  22. Uğursal, A.; Culp, C.H. The effect of temperature, metabolic rate and dynamic localized airflow on thermal comfort. Appl. Energy 2013, 111, 64–73. [Google Scholar] [CrossRef]
  23. Xie, Z.; Fan, J.; Cao, B.; Zhu, Y. Airflow Analytical Toolkit (AAT): A MATLAB-based analyzer for holistic studies on the dynamic characteristics of airflows. Build. Simul. 2024, 17, 1137–1159. [Google Scholar] [CrossRef]
  24. Zhu, Y.; Ouyang, Q.; Dai, W. Literature review of airflow fluctuations in building environments. J. Tsinghua Univ. (Sci. Technol.) 2004, 1622–1625. [Google Scholar] [CrossRef]
  25. Ouyang, Q.; Dai, W.; Li, H.; Zhu, Y. Study on dynamic characteristics of natural and mechanical wind in built environment using spectral analysis. Build. Environ. 2006, 41, 418–426. [Google Scholar] [CrossRef]
  26. Xie, Z.; Xie, Y.; Cao, B.; Zhu, Y. A study of the characteristics of dynamic incoming flow directions of different airflows and their influence on wind comfort. Build. Environ. 2023, 245, 110861. [Google Scholar] [CrossRef]
  27. Li, J.; Zhou, S.; Yu, Y.; Niu, J. Effects of dynamic airflows on convective cooling of human bodies—Advances in thermal comfort assessment and engineering design. Energy Build. 2024, 324, 114924. [Google Scholar] [CrossRef]
  28. Zhou, S.; Yu, Y.; Niu, J.; Kwok, K.C.; Chauhan, K.; Tse, K.T.; Xu, X.; Wong, S.H.Y. Human body convective heat transfer coefficient under non-stationary turbulent wind. Build. Environ. 2025, 271, 112632. [Google Scholar] [CrossRef]
  29. Cao, S.; Li, X.; Yang, B.; Li, F. A review of research on dynamic thermal comfort. Build. Serv. Eng. Res. Technol. 2021, 42, 435–448. [Google Scholar] [CrossRef]
  30. Xie, Z.; Zhu, Y.; Cao, B. Multi-fanning based simulated natural wind environment and its comfort performance under warm-to-hot conditions. Build. Environ. 2024, 262, 111792. [Google Scholar] [CrossRef]
  31. Zhu, Y.; Luo, M.; Ouyang, Q.; Huang, L.; Cao, B. Dynamic characteristics and comfort assessment of airflows in indoor environments: A review. Build. Environ. 2015, 91, 5–14. [Google Scholar] [CrossRef]
  32. Buonocore, C.; De Vecchi, R.; Lamberts, R.; Güths, S. From characterisation to evaluation: A review of dynamic and non-uniform airflows in thermal comfort studies. Build. Environ. 2021, 206, 108386. [Google Scholar] [CrossRef]
  33. Liu, W.; Lian, Z.; Deng, Q. Use of mean skin temperature in evaluation of individual thermal comfort for a person in a sleeping posture under steady thermal environment. Indoor Built Environ. 2015, 24, 489–499. [Google Scholar] [CrossRef]
  34. Wang, Y.; Hua, J.; Ouyang, Q.; Li, X.; Zhu, Y. Human thermal comfort under simulated natural wind with different turbulence intensities. Heat. Vent. Air Cond. 2013, 43, 91–96. [Google Scholar] [CrossRef]
  35. Zhou, X.; Ouyang, Q.; Lin, G.; Zhu, Y. Impact of dynamic airflow on human thermal response. Indoor Air 2006, 16, 348–355. [Google Scholar] [CrossRef]
  36. Huang, L.; Ouyang, Q.; Zhu, Y. Perceptible airflow fluctuation frequency and human thermal response. Build. Environ. 2012, 54, 14–19. [Google Scholar] [CrossRef]
  37. Parkinson, T.; de Dear, R. Thermal pleasure in built environments: Physiology of alliesthesia. Build. Res. Inf. 2015, 43, 288–301. [Google Scholar] [CrossRef]
  38. Xie, Z.; Zhu, Y.; Cao, B. Multi-fanning and its improvement of thermal and wind comfort: An auxiliary means to air conditioning. Energy Build. 2024, 315, 114299. [Google Scholar] [CrossRef]
  39. Huang, X.; Xiao, Y.; Chen, J.; Wei, S.; Zhou, H.; Miao, W.; Kang, R.; Ma, X.; Bian, C.; Yu, W. Developing a practical method coupling the impact of temperature, humidity, and air velocity on human acceptable temperature in warm environment. Build. Environ. 2025, 285, 113566. [Google Scholar] [CrossRef]
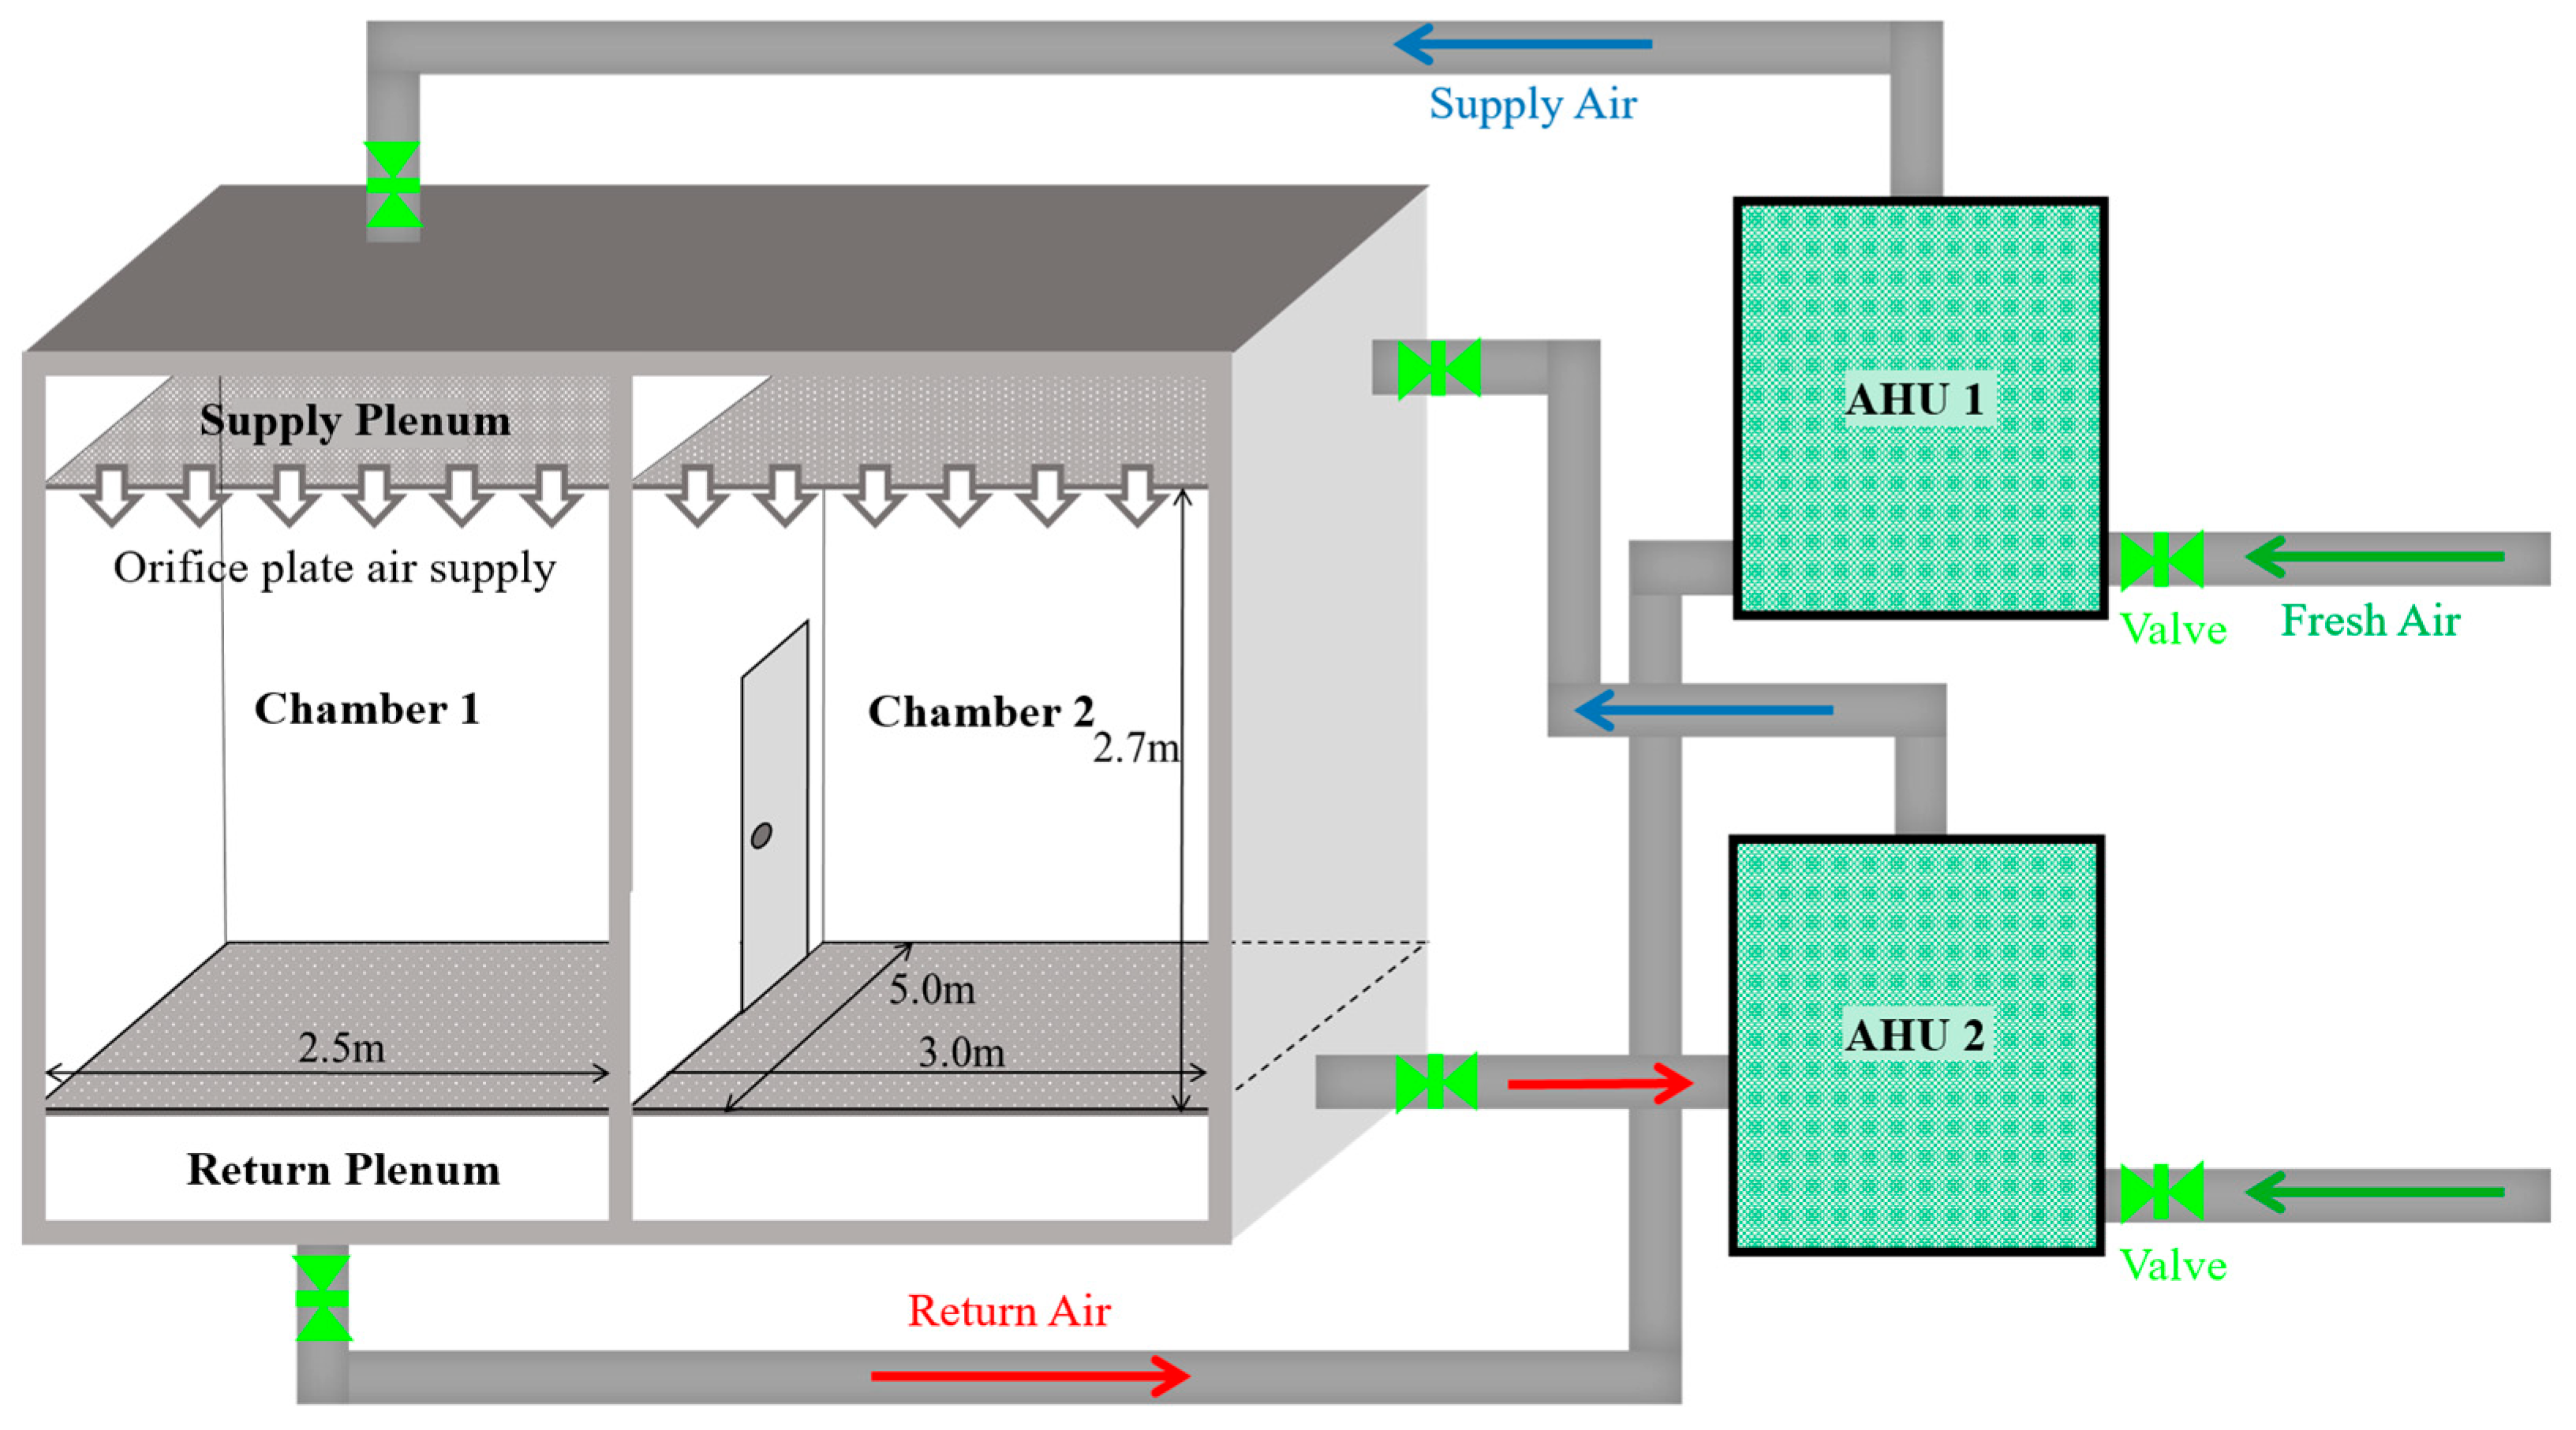
Figure 1. Climate chamber.
Buildings 15 03711 g001
Figure 2. Experimental setup.
Buildings 15 03711 g002
Figure 3. Waveform diagram of the original input sample.
Buildings 15 03711 g003
Figure 4. The measured waveform diagram of the subject position.
Buildings 15 03711 g004
Figure 5. Experimental procedure.
Buildings 15 03711 g005
Figure 6. Scales of supplementary subjective votes.
Buildings 15 03711 g006
Figure 7. Thermal sensation vote.
Buildings 15 03711 g007
Figure 8. Thermal comfort vote (* p < 0.05).
Buildings 15 03711 g008
Figure 9. Variation in thermal sensation votes over time. (The black line is the connecting line of the average values).
Buildings 15 03711 g009
Figure 10. Variation in thermal comfort votes over time. (The black line is the connecting line of the average values).
Buildings 15 03711 g010
Figure 11. Thermal sensation votes for different body parts.
Buildings 15 03711 g011
Figure 12. Thermal comfort votes for different body parts.
Buildings 15 03711 g012
Figure 13. Mean skin temperature.
Buildings 15 03711 g013
Figure 14. Skin temperature of different body parts.
Buildings 15 03711 g014
Figure 15. Gender differences in TSV.
Buildings 15 03711 g015
Figure 16. Gender differences in TCV.
Buildings 15 03711 g016
Figure 17. Airflow characteristics and subjects’ perceptions.
Buildings 15 03711 g017
Figure 18. Individual differences.
Buildings 15 03711 g018
Table 1. Anthropometric information of participants.
GenderNumberAge (year)Height (cm)Weight (kg)BMI (kg/m2)
Male1023 ± 3177.3 ± 6.668.9 ± 10.221.9 ± 2.8
Female1023 ± 3165.7 ± 3.859.2 ± 8.621.5 ± 2.7
Table 2. Experimental instrument.
No.MeasurementInstrumentAccuracyResolutionMeasurement Range
1Air temperature (Ta) WSZY-1 Thermometer±0.3 °C0.1 °C−40–100 °C
2Relative Humidity (RH)WSZY-1 Thermometer±3%0.1%0–100%
3Air Velocity (Va)SWA03 AnemometerAt room temperature: 0.05–1.00 m/s: ±0.03 m/s; 1.00–3.00 m/s: ±3% of the measured value 0.05–3 m/s
4Globe Temperature (Tg)HQZY-1 Globe Thermometer (Standard 150 mm globe)±0.3 °C0.1 °C−20–80 °C
5Skin Temperature (Tskin)PyroButtons (Opulus, PA, USA)±0.1 °C8 bits: 0.5 °C
11 bits: 0.0625 °C
0–125 °C
Table 3. Scales of subjective votes.
−1−2−30123
TSVcoldcoolslightly coolneutralslightly warmwarmhot
TCVvery
uncomfortable
uncomfortableslightly
uncomfortable
not
uncomfortable
slightly
comfortable
comfortablevery
comfortable
Disclaimer/Publisher’s Note: The statements, opinions and data contained in all publications are solely those of the individual author(s) and contributor(s) and not of MDPI and/or the editor(s). MDPI and/or the editor(s) disclaim responsibility for any injury to people or property resulting from any ideas, methods, instructions or products referred to in the content.