Abstract
Indoor environments have received increasing attention in recent years, and achieving high-quality indoor conditions has become increasingly important. Underfloor air distribution (UFAD) systems have attracted significant interest due to their potential to improve ventilation efficiency, enhance thermal comfort, and reduce energy consumption. Compared with overhead air distribution (OHAD) systems, UFAD not only offers better energy savings but also demonstrates improved thermal stratification performance. However, most previous studies have relied on numerical simulations to evaluate UFAD performance under specific system designs or scenarios. Few studies have conducted on-site measurements to investigate the combined effects of multiple air-conditioning settings, which are closely related to user control strategies. This study experimentally evaluated the cooling performance and thermal comfort of a UFAD system under different control configurations. By combining variations in airflow rate, temperature setpoints, and supply air distribution, a total of 12 test configurations were examined. The results indicate that configurations with lower temperature setpoints achieved the highest cooling performance. Most test settings produced neutral thermal conditions at heights between 120 and 180 cm, while areas at 60 cm or below were noticeably cooler. These findings provide practical guidance for users in controlling UFAD systems.
1. Introduction
The first chapter of this paper is composed of two sections: research background and motivation. The former introduces methods of indoor environmental control and types of HVAC air distribution systems, and then outlines the characteristics of underfloor air distribution systems. The latter section further reviews and compares existing studies on the underfloor air distribution system, identifies research gaps, and presents the main purpose of this study.
1.1. Background
As awareness of office workers’ well-being, health, and workplace conditions continues to rise, the significance of indoor environmental quality has garnered increasing attention. Consequently, a growing body of research has been dedicated to enhancing the quality of office environments [1,2,3]. To achieve a comfortable indoor setting, both passive and active environmental control strategies are widely adopted [4,5,6]. Passive strategies typically involve natural ventilation and the utilization of building thermal mass [7,8,9], whereas active strategies rely on mechanical systems such as heating, ventilation, and air-conditioning (HVAC) [10,11,12]. In hot and humid climates—where latent heat load is predominant—actively controlled environments that ensure higher stability and precision are generally more appropriate for office settings [13]. This indicates a greater reliance on HVAC and ventilation systems in such regions to maintain sufficient cooling and air exchange.
HVAC systems can generally be categorized into two types: centralized systems, where mechanical equipment is installed in a central plant room [5], and decentralized systems, where equipment is located near the spaces it serves [10]. In most small- to medium-sized office spaces, decentralized split-type air-conditioning systems are widely adopted due to their ease of installation and high flexibility. The type of outdoor unit used in these systems depends on the cooling method, while the indoor units typically operate using either overhead air distribution (OHAD) systems [14] or underfloor air distribution (UFAD) systems [15]. However, studies have shown that OHAD systems are less effective in achieving thermal stratification, resulting in limited performance in terms of ventilation efficiency and energy savings [16]. In contrast, UFAD systems not only enhance ventilation efficiency [17] but also improve thermal comfort and reduce overall energy consumption [18]. Figure 1 shows the section layout of UFAD and OHAD systems.
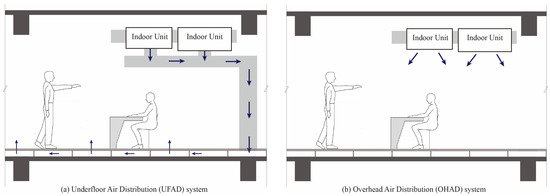
Figure 1.
Section layout of UFAD and OHAD systems.
The design and operational principles of UFAD systems have been thoroughly detailed in Bauman’s [19] Underfloor Air Distribution Design Guide. In such systems, air can be supplied into the underfloor plenum using either a ducted (zero-pressure) or ductless (pressurized) configuration, and is then delivered into the occupied zone through floor-mounted diffusers. These diffusers are generally categorized into two types: active diffusers, which use localized fans for air delivery, and passive diffusers, which rely on the pressurized plenum to release air naturally [20].
In this study, a ductless pressurized plenum paired with passive diffusers is adopted, aiming to reduce material usage and provide a practical solution for retrofitting office spaces with UFAD systems. The system supplies cool air directly to the occupied zone, while utilizing thermal buoyancy to drive warm air upward to the ceiling, thus creating a stratified thermal environment. Key advantages of UFAD systems include improved cooling efficiency achieved through stratified airflow, reduced energy consumption by minimizing air circulation over heat-generating equipment (e.g., lighting), and enhanced occupant comfort and control via adjustable diffusers. However, the performance of UFAD systems is highly sensitive to spatial layout and system configuration, which has prompted extensive research on design optimization. Notable areas of investigation include the impact of plenum height in data centers [21], room dimensional effects [22], and the optimal placement of return grilles [23].
To enhance indoor environmental quality and energy efficiency, most studies have focused on the performance of UFAD systems under various conditions in terms of thermal comfort, ventilation effectiveness, and energy consumption. According to ASHRAE Standard 55, a vertical temperature difference exceeding 3 °C between the ankle and neck may lead to thermal discomfort [24]. Additionally, the predicted mean vote (PMV) model proposed by Fanger [25] is widely adopted as an indicator of thermal comfort. In UFAD applications, terminal air velocity (approximately 0.25 m/s) should not exceed a height of 120 cm above the floor, and the supply air temperature should remain above 16–18 °C to prevent cold discomfort at the feet [19]. These findings provide the theoretical basis and boundary conditions for evaluating UFAD system performance.
Research on thermal comfort has mainly explored seasonal variations [15,26], supply and return air conditions [18], and numerical simulations [27]. Similarly, studies on ventilation effectiveness have concentrated on the simulation of pollutant dispersion [28], seasonal differences [15], and space usage types [29]. However, compared with numerical modeling, field measurements in this area remain largely unexplored.
1.2. Motivation
Current research on UFAD systems is primarily based on numerical simulations and often limited to specific case scenarios or system design. Few studies have employed on-site measurements to simultaneously investigate the combined effects of multiple system settings—such as airflow rate, supply air temperature, and outdoor air volume—on cooling performance and thermal comfort. Moreover, most existing studies emphasize overall system behavior, with relatively limited exploration of spatial differences in height and horizontal position, which are critical in UFAD applications.
To address this research gap, this study conducted a field experiment in a subtropical climate, retrofitting an existing small office space originally equipped with a split-type air-conditioning system into a UFAD system. The experiment included various combinations of airflow rates, supply air temperatures, and outdoor air volumes. Environmental data were collected through multi-point and multi-layer measurements to evaluate the effects of each condition on cooling efficiency and vertical thermal comfort distribution. The results are particularly relevant to small- to medium- sized offices spaces, whereas applications for large open-plan offices or venues may require further validation.
2. Materials and Methods
The structure of this chapter is as follows: Section 2.1 describes the test location, the UFAD system based on a variable refrigerant volume (VRV) system, and the configuration of sensor placement. Section 2.2 details the test conditions and experimental combinations of UFAD air-conditioning settings. Section 2.3 presents the measured environmental parameters to further analyze cooling performance and thermal comfort.
2.1. Experimental Setup
The experimental office was located in southern Taiwan, where the summer climate is typically hot and humid; the field tests were conducted during this season. The net dimensions of the space were 8.63 m in length, 6.8 m in width, and 3 m in height, resulting in a net floor area of 58.68 m2 and a net volume of 176 m3. The raised floor tiles were positioned 0.15 m above the structural slab, creating an underfloor plenum serving as a supply air static pressure chamber. The office had an exterior wall on the north side with a window, while the remaining three walls were interior partitions. According to the “Energy Saving Design Guidelines for Office Buildings in Taiwan,” the occupant density was set at 0.15 m2 per person, allowing for a maximum occupancy of nine individuals in this space.
The UFAD system used in this study was retrofitted from a conventional split-type air-conditioning system, which is widely applied in small- to medium-sized office buildings. The air-conditioning equipment employed was a VRV system, consisting of indoor units connected to an energy recovery ventilator (ERV) to facilitate indoor–outdoor air exchange. An additional duct was installed to supply mixed air into the underfloor plenum. There were no extra ducts within the underfloor static pressure chamber. A cross-sectional view of the complete equipment configuration is shown in Figure 2a, while the supply air outlet arrangement is depicted in Figure 2b. In this setup, the ERV introduces outdoor fresh air into the VRV indoor unit, and the mixed supply air is delivered through the duct into the underfloor plenum, where it is passively supplied to the occupied zone by means of static pressure differences.
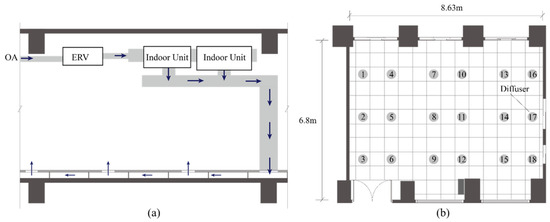
Figure 2.
(a) Sectional view of the HVAC system and (b) air diffuser layout.
Environmental parameter measurement locations were determined in accordance with section 7.3.2 “Physical Measurement Positions within the Building” as specified in ASHRAE (American Society of Heating, Refrigerating and Air-Conditioning Engineers) Standard 55-2017 [30]. Horizontal measurement points were established at six floor locations labeled A through F. At each location, six vertical measurement heights were set to correspond with seated and standing postures: 10 cm (ankle), 60 cm (thigh), 90 cm (chest), and 120 cm (head) for seated occupants; and 150 cm (chest) and 180 cm (head) for standing occupants (Figure 3c shows the actual on-site placement of the measurement instruments). A schematic of the vertical measurement point arrangement is shown in Figure 3a. Measurements at different points were conducted to identify spatial variations, with a total of 36 measurement points distributed throughout the space. Environmental parameters were recorded every 5 min. The spatial distribution of the measurement points is illustrated in Figure 3b.
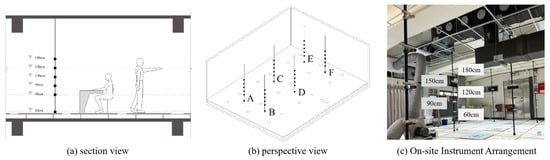
Figure 3.
Layout of instrument placements in horizontal and vertical directions.
Four types of measurement instruments were used in this study: anemometers, temperature and humidity sensors, mean radiant temperature (MRT) sensors, and power loggers. The measurement ranges and accuracies of these instruments are summarized in Table 1. Prior to each experiment, all instruments were placed in the same zone for 30 min to calculate measurement errors and verify consistency across devices. This procedure served as an internal calibration step to minimize systematic deviations and ensure data reliability.

Table 1.
Measurement instruments for indoor environmental parameters: ranges and accuracy.
2.2. Test Conditions and Variable Settings
This study investigates the optimal operating conditions of the UFAD system to achieve thermal comfort and effective cooling by comparing indoor environmental performance under different UFAD air-conditioning settings. Each test lasted approximately 4 h, representing about half a typical workday. The space serves not only as a daily office but is occasionally used as a meeting room. Three variables were considered in each UFAD setting: outdoor fresh air supply rate, air-conditioning supply airflow rate, and air-conditioning setpoint temperature
According to the “Energy Saving Design Guidelines for Office Buildings in Taiwan,” the required outdoor ventilation rate is 10 CMH per square meter for office use and 15 CMH per square meter for meeting room use. Based on these standards, two outdoor fresh air supply rates were set for this study (586 CMH and 880 CMH). For supply airflow rates, preliminary tests showed that when the airflow difference was below ~200 CMH, vertical performance changes were minimal and hard to distinguish. Therefore, the minimum available rate (1624 CMH) and a higher setting were adopted. Although the unit’s maximum was 2200 CMH, this produced velocities above 0.25 m/s at 120 cm—exceeding Bauman’s recommended limit—so the upper level was reduced to 1990 CMH for the experiments. Three setpoints (22.5, 24.5, and 26.5 °C) were selected to represent the central ASHRAE 55 comfort zone for occupants (1.0 met, 0.6 clo) under moderate humidity [30]. A 2 K spacing was adopted because pilot observations showed that 1 K differences produced little variation. Lower setpoints (<22 °C) were excluded due to potential floor-level overcooling, while higher values (≥28 °C) weakened cooling above 120–180 cm and reduced representativeness. Although ASHRAE 55 defines comfort in operative temperature, the studied office had only one exterior wall, so the difference from setpoints was small (<1 K), making them a reasonable approximation.
This design is based on the VRV system’s cooling activation, which starts when the ambient temperature exceeds the setpoint by approximately 2 °C. In total, 12 test scenarios were conducted, representing a full factorial combination of 2 outdoor fresh air supply rates × 2 supply airflow settings × 3 temperature setpoints. The experimental matrix is summarized in Table 2.
Table 2.
Summary of operating parameters for the 12 test scenarios.
2.3. Measurement Parameters and Data Processing
This study evaluates indoor environmental performance from two aspects: cooling effectiveness and thermal comfort. These aspects were analyzed from horizontal, vertical, or combined spatial perspectives. In addition to specific environmental data, the data analysis procedures and calculation methods used for each evaluation item are described. The overall framework of the methodology is illustrated in Figure 4.
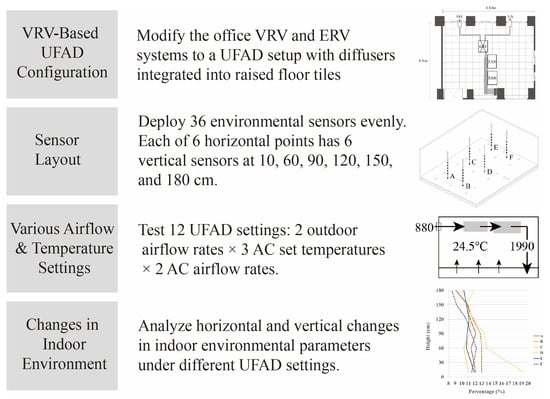
Figure 4.
Framework of experiment method.
The evaluation of cooling performance was based on Equation (1). The initial temperature was recorded when the system reached a steady state, and the final temperature was measured at the end of the 4 h test period, allowing for assessment of cooling performance differences at various locations.
Data analysis was conducted from the following two perspectives:
- Horizontal analysis: comparing cooling performance differences across various locations on the floor plan.
- Vertical analysis: examining cooling performance at different heights under various UFAD air-conditioning settings.
Thermal comfort was evaluated using Fanger’s PMV model (Fanger, 1970) [25]. For each UFAD test condition, PMV values were calculated at six vertical heights ranging from 10 cm to 180 cm at every measurement point. The calculation was based on four measured environmental parameters: air temperature, air velocity, relative humidity, and MRT, assuming a metabolic rate of 1.0 met and clothing insulation of 0.6 clo. This approach enabled analysis of the vertical distribution of thermal comfort, particularly assessing potential discomfort caused by excessive cooling of the lower body. The calculation is presented in Equation (2). The indoor environment may reach a more neutral or comfortable condition when the PMV value is between −0.5 and +0.5 and cooler or warmer when the value is below −0.5 or above +0.5, respectively.
where M is metabolic rate (W/m2); W is external work (W/m2); Icl is clothing thermal insulation (m2·K/W); fcl is clothing surface area factor; ta is air temperature (°C); tr is mean radiant temperature (°C); var is air velocity (m/s); pa is water vapor partial pressure (Pa); hcl is convective heat transfer coefficient [W/(m2·K)]; tcl is clothing surface temperature (°C).
PMV = [0.303 × exp(–0.036 × M) + 0.028] × {(M − W) − 3.05 × 10−3 × [5733 − 6.99 × (M − W) − pa] − 0.42 × [(M − W) − 58.15] − 1.7 × 10⁻⁵ × M × (5867 − pa) − 0.0014 × M × (34 − ta) − 3.96 × 10⁻⁸ × fcl × [(tcl + 273)4 − (tr + 273)4] − fcl × hc × (tcl − ta)}
tcl = 35.7 − 0.028 × (M − W) − Icl + {3.96 × 10⁻⁸ × fcl × [(tcl + 273)4 − (tr + 273)4] + fcl × hc × (tcl − ta)}
hcl = 2.38 × |tcl − ta|0.25 for 2.38 × |tcl − ta|0.25 > 12.1 × √var, = 12.1 × √var for 2.38 × |tcl − ta|0.25 < 12.1 × √var
fcl = (1.00 + 1.290 × Icl) for Icl ≤ 0.078 m2·K/W, = (1.05 + 0.645 × Icl) for Icl > 0.078 m2·K/W
3. Results and Discussion
Office space environmental parameters were recorded under 12 different UFAD settings. The collected data were then processed and analyzed to assess cooling effectiveness and thermal comfort across various locations within the space. The end of this chapter organizes and compares the overall performance of each UFAD setting to identify optimal combinations; the aim is to provide effective methods when applying the UFAD system to office environments.
3.1. Cooling Effectiveness
The experimental results analyze the overall thermal environment in the occupied zone from both horizontal and vertical perspectives, exploring how different UFAD settings influence cooling performance. Figure 5a,b illustrate the airflow velocity distribution at the floor-level supply outlets under two different supply airflow rate settings. The red areas in the figures indicate the locations of the main supply duct outlets connected to the static pressure plenum, where conditioned air is delivered from the indoor unit into the underfloor space.
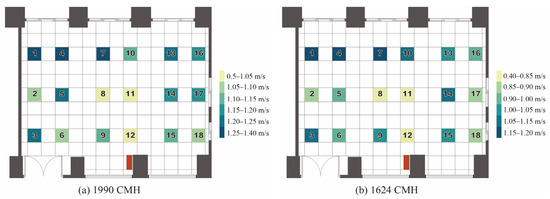
Figure 5.
Air velocity distribution at 10 cm height under different air supply flow rates.
Measurements show that supply outlets farther from the main duct (e.g., points 1, 3, 4, and 7) exhibited higher airflow velocities, particularly near walls and corners. Conversely, outlets closer to the main supply duct connection (e.g., points 8, 11, and 12) demonstrated lower velocities. This phenomenon may be attributed to pressure buildup within the plenum, where air tends to be pushed more forcefully toward distal outlets. As a result, locations farther from the duct connection exhibited stronger airflow, while nearby outlets showed reduced velocity, possibly due to local turbulence and internal flow resistance near the supply point. These effects resulted in notable differences in airflow velocity distribution throughout the space. For users and designers alike, understanding these distribution characteristics can guide the selection of supply outlet locations to better meet individual comfort preferences or functional requirements.
The cooling effectiveness at six locations (A–F) under different UFAD settings is shown in Figure 6. From a horizontal perspective, points D, B, and A generally exhibited better cooling effectiveness percentage across most heights—corresponding to the main occupied zone. In contrast, points C, F, and E showed overall lower cooling percentages under multiple conditions, suggesting reduced airflow or weaker cooling delivery in those areas. This spatial variation may result from airflow path resistance or distance from supply outlets. These findings indicate that both office configuration and supply outlet position should be carefully considered in UFAD design, especially if a ductless plenum and passive diffuser system are applied. It also appears the need to evaluate both horizontal and vertical cooling performance when applying UFAD systems.
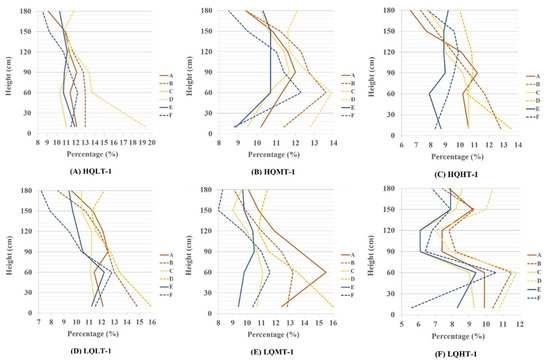
Figure 6.
Cooling percentage at each height across 6 horizontal positions.
The average vertical distribution of cooling percentages across all 12 UFAD test combinations is shown in Figure 7. Each curve represents the mean cooling percentage at various heights from the floor up to head level. Overall, test scenarios with lower supply air temperatures (such as LQLT-2 and HQLT-2) exhibited superior vertical cooling performance, with curves positioned closer to the right side of the graph, indicating higher cooling percentages throughout the height range. In contrast, higher supply air temperature settings (such as HQHT and LQHT) showed poorer overall performance. These results suggest that supply air temperature plays a more critical role than airflow rate in directly influencing the vertical distribution of cooling effectiveness.
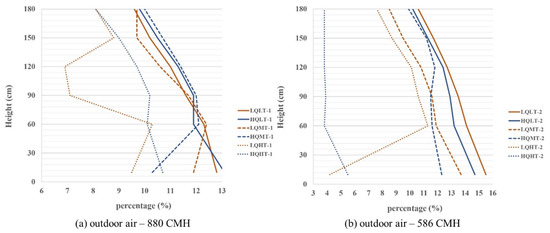
Figure 7.
Average cooling percentage under 12 different UFAD AC settings.
The average cooling percentages for each test combination are shown in Figure 8. Among them, LQLT-2 performed the best with an average cooling effectiveness of 13.02%, followed by HQLT-2 (12.45%) and HQMT-2 (11.38%). This further supports the notion that lowering the supply air temperature contributes to improved overall cooling performance. Conversely, despite HQHT-2 having a higher airflow rate, its average cooling effectiveness was low, as well as the combination of LQHT-1 and LQHT-2. This phenomenon indicates that increasing airflow alone is insufficient to achieve effective cooling; if the supply air temperature is too high, satisfactory performance cannot be attained.
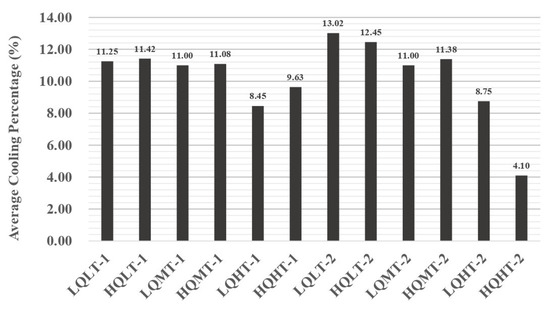
Figure 8.
Average cooling percentage under 12 settings.
The combined analysis of Figure 7 and Figure 8 indicates that achieving a balance between airflow rate and supply air temperature is critical in UFAD system design. While increasing airflow helps enhance the distribution of cooling, its effectiveness is significantly constrained when the supply air temperature is set too high. Therefore, to ensure effective thermal management throughout the entire occupied zone, it is essential to combine lower set temperatures with appropriate airflow rates, thereby guaranteeing efficient delivery of cooled air across space.
3.2. Thermal Comfort (PMV)
This study evaluated thermal comfort across 12 UFAD system settings using the PMV index at six vertical heights (10 cm to 180 cm). Figure 9 presents the vertical PMV distribution after 2 and 4 h of system operation and compares the effects of two outdoor air supply rates (880 CMH and 586 CMH) on thermal comfort. All PMV calculations were based on four measured environmental parameters: air temperature, air velocity, relative humidity, and MRT.
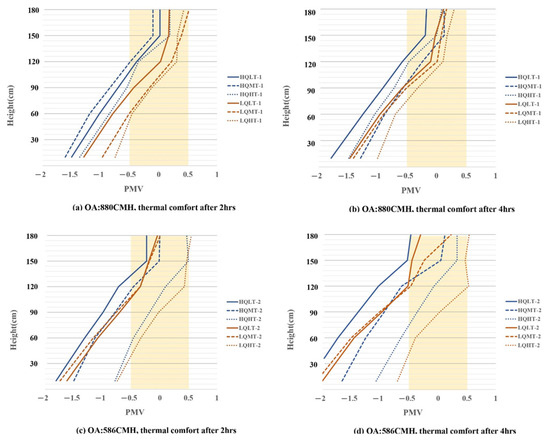
Figure 9.
PMV under 12 different settings.
Twelve settings exhibited PMV values below 0 across most heights, indicating an overall cool indoor environment. Notably, PMV values in the lower body region (below 60 cm) mostly ranged from −2 to −0.5. This reflects the common UFAD issue of “overcooling of the feet and legs,” as cool air tends to accumulate near the floor. In contrast, PMV values at upper body heights (120–180 cm) were closer to the neutral range (−0.5 to 0.5). In some cases, PMV values at head height approached or slightly exceeded 0, especially under low airflow and high-temperature settings (e.g., LQHT-2). However, the lower body region remained relatively cool in most scenarios, suggesting that vertical thermal stratification persisted.
When comparing the two outdoor air supply rates (880 CMH vs. 586 CMH), their impact on PMV was found to be significantly smaller than that of supply airflow rate and supply air temperature. This supports the conclusion that, within the scope of this experiment, thermal comfort in UFAD systems is more sensitive to changes in airflow and temperature than to ventilation rate. In summary, to reduce vertical discomfort, it is essential to properly balance upward airflow strength with supply air temperature. Maintaining PMV values near the neutral range across the entire occupied zone height is crucial for optimizing thermal comfort in UFAD-conditioned spaces. Appendix A provides the complete and detailed PMV data for all 12 settings.
3.3. Discussion
This study evaluated the overall performance of 12 UFAD air-conditioning settings by comparing cooling effectiveness, thermal comfort distribution, and energy consumption. The test results show that lowering the supply air temperature significantly improved cooling effectiveness, even under lower airflow rates. Among all configurations, the LQLT-2 setting (1624 CMH, 22.5 °C) demonstrated the best average cooling effectiveness, followed by the HQLT-2 setting, indicating stable and strong cooling performance throughout the occupied zone. In contrast, the HQHT setting (1990 CMH, 26.5 °C), despite its higher airflow rate, yielded the worst cooling performance. These results suggest that increasing airflow alone is insufficient to compensate for inadequate cooling caused by overly high supply air temperatures. In terms of thermal comfort, PMV analysis revealed that most settings can achieve a neutral environment (PMV between −0.5 and +0.5) at heights between 120 and 180 cm. Conversely, at the height of 60 cm and under, most settings resulted in overcooling near the feet and leg, with PMV ranging from −2 to −0.5. As for energy consumption, shown in Table 3, higher airflow rates increased the power usage of the indoor units. HQ configurations consumed 4.85 to 5.33 kW, while LQ configurations consumed 4.33 to 4.72 kW. Overall, the LQLT configuration achieved the most balanced performance across all three aspects: high cooling effectiveness, favorable vertical comfort distribution, and lower energy consumption.
Table 3.
Comparison of 12 settings: energy consumption.
The findings of this study indicate that optimal UFAD system performance does not rely on maximizing airflow but rather on optimizing the combination of airflow rate and supply air temperature. This balanced strategy can maintain overall indoor environment performance while minimizing unnecessary energy use.
Finally, an analysis of variance (ANOVA) analysis was conducted using the “statsmodels” package in Python, with OA, T_set, and Q_set as influencing factors (Table 2) and total energy consumption as the response variable (Table 3). As shown in Table 4, the results indicate that both T_set and Q_set had a significant effect on total energy consumption, whereas OA did not exhibit a significant effect. The interaction analysis revealed that the interaction between T_set and Q_set was significant, while the interactions involving OA with other factors were not significant. Overall, the total energy consumption was primarily controlled by the set temperature and set airflow rate, with variations in the outdoor air supply having a limited effect.
Table 4.
ANOVA results.
4. Conclusions
This study conducted a series of in situ experiments in a small office located in southern Taiwan to evaluate the overall performance of different settings of an improved UFAD system. The research focused on two main aspects: cooling effectiveness and thermal comfort. Twelve different air-conditioning settings were tested, varying in airflow rate, supply air temperature, and outdoor air intake rate. A total of 36 measurement points were distributed throughout the occupied zone to comprehensively capture both horizontal and vertical environmental variations within the space.
Based on the experimental results and subsequent analysis, the main findings are as follows:
- Cooling effectiveness is primarily influenced by supply air temperature, followed by airflow rate.
- PMV model analysis indicates significant vertical thermal stratification in most UFAD settings. Heights between 120 and 180 cm can achieve a more comfortable or neutral environment, while at 60 cm and under it may be cooler.
These results highlight the importance of a balanced and optimized air-conditioning setting approach while using the UFAD system. Relying solely on high airflow rates is ineffective if the supply air temperature is set too high, as it fails to deliver adequate cooling or enhance thermal comfort. Conversely, combining lower supply temperatures improves cooling effectiveness across the occupied zone and reduces unnecessary energy consumption. Also, it is necessary to consider the performance variations across indoor space vertically and horizontally. These findings offer methods for the control and design of UFAD systems, especially in office environments.
While the findings provide useful control strategies for UFAD systems in small office spaces, this study is limited to environments with conditions similar to the case examined. Further research is required to validate the results in other contexts, such as fully glazed or enclosed spaces, large open-plan spaces, buildings located in different climate zones, operation across different outdoor conditions and seasons, and occupant’s clothing insulation and metabolic rate.
Author Contributions
Conceptualization, Y.-C.W. and H.-C.H.; data curation, Y.-C.W.; formal analysis, Y.-C.W. and H.-C.H.; funding acquisition, C.-Y.P.; investigation, Y.-C.W., H.-Y.W. and C.-Y.P.; methodology, Y.-C.W. and H.-C.H.; project administration, C.-Y.P.; resources, C.-Y.P.; software, Y.-C.W. and H.-C.H.; supervision, H.-Y.W. and C.-Y.P.; validation, C.-Y.P.; visualization, Y.-C.W.; writing—original draft, Y.-C.W.; writing—review and editing, H.-C.H., H.-Y.W. and C.-Y.P. All authors will be updated at each stage of manuscript processing, including submission, revision, and revision reminder, via emails from our system or the assigned Assistant Editor. All authors have read and agreed to the published version of the manuscript.
Funding
The authors sincerely acknowledge the generous support provided by the following institutions. This research was funded in part by the National Science and Technology Council (NSTC), Taiwan, under Grant Nos. NSTC 113–2321-B-006–007-, NSTC 114–2321-B-006–012, and NSTC 114-2221-E-006-017-MY2. The authors are deeply grateful for this support, which made this research possible.
Data Availability Statement
The original contributions presented in this study are included in the article. Further inquiries can be directed to the corresponding author.
Conflicts of Interest
The authors declare that they have no known competing financial interests or personal relationships that could have appeared to influence the work reported in this paper.
Appendix A
| Abbr. | Date | Time (Hr) | Outdoor | Indoor | PMV | |||||
|---|---|---|---|---|---|---|---|---|---|---|
| T (°C) | RH (%) | Height (cm) | Ta (°C) | RH (%) | v (m/s) | MRT | ||||
| HQLT-1 | 25-09-2024 | 10:00 –12:00 | 30.6 | 73.8 | 10 | 24.22 | 63.00 | 1.11 | 25.08 | −1.50 |
| 60 | 24.45 | 70.70 | 0.64 | 25.12 | −1.02 | |||||
| 90 | 24.55 | 70.30 | 0.39 | 25.10 | −0.70 | |||||
| 120 | 24.72 | 70.20 | 0.24 | 25.14 | −0.38 | |||||
| 150 | 24.90 | 71.30 | 0.10 | 25.25 | 0.02 | |||||
| 180 | 25.12 | 70.50 | 0.12 | 25.45 | 0.02 | |||||
| 12:00 –14:00 | 30.9 | 71.5 | 10 | 23.53 | 63.00 | 1.11 | 24.39 | −1.79 | ||
| 60 | 23.87 | 70.50 | 0.64 | 24.54 | −1.25 | |||||
| 90 | 23.97 | 70.10 | 0.39 | 24.52 | −0.91 | |||||
| 120 | 24.18 | 70.10 | 0.24 | 24.46 | −0.58 | |||||
| 150 | 24.37 | 70.50 | 0.10 | 24.60 | −0.19 | |||||
| 180 | 24.62 | 69.70 | 0.12 | 24.95 | −0.17 | |||||
| HQMT-1 | 24-09-2024 | 10:00 –12:00 | 29.6 | 82.8 | 10 | 23.78 | 64.00 | 1.11 | 25.49 | −1.61 |
| 60 | 23.87 | 70.20 | 0.64 | 25.21 | −1.19 | |||||
| 90 | 23.98 | 70.30 | 0.39 | 25.08 | −0.84 | |||||
| 120 | 24.20 | 70.00 | 0.24 | 25.13 | −0.49 | |||||
| 150 | 24.38 | 70.70 | 0.10 | 25.12 | −0.10 | |||||
| 180 | 24.63 | 70.00 | 0.12 | 25.31 | −0.10 | |||||
| 12:00 –14:00 | 30.1 | 72.7 | 10 | 24.50 | 66.00 | 1.11 | 26.20 | −1.29 | ||
| 60 | 24.58 | 73.20 | 0.64 | 25.92 | −0.88 | |||||
| 90 | 24.67 | 72.60 | 0.39 | 25.76 | −0.57 | |||||
| 120 | 24.80 | 75.40 | 0.24 | 25.72 | −0.24 | |||||
| 150 | 24.95 | 73.40 | 0.10 | 25.74 | 0.13 | |||||
| 180 | 25.15 | 72.70 | 0.12 | 25.98 | 0.13 | |||||
| HQHT-1 | 17-09-2024 | 10:00 –12:00 | 32.2 | 68.2 | 10 | 25.52 | 56.00 | 1.11 | 22.50 | −1.36 |
| 60 | 25.85 | 65.60 | 0.64 | 23.49 | −0.85 | |||||
| 90 | 25.92 | 65.30 | 0.39 | 24.00 | −0.55 | |||||
| 120 | 25.98 | 65.80 | 0.24 | 23.71 | −0.35 | |||||
| 150 | 26.12 | 67.30 | 0.10 | 25.03 | 0.19 | |||||
| 180 | 26.45 | 65.90 | 0.12 | 25.07 | 0.19 | |||||
| 12:00 –14:00 | 32 | 67 | 10 | 24.95 | 58.00 | 1.11 | 22.79 | −1.49 | ||
| 60 | 25.13 | 65.30 | 0.64 | 23.44 | −1.05 | |||||
| 90 | 25.27 | 64.90 | 0.39 | 23.90 | −0.72 | |||||
| 120 | 25.43 | 65.20 | 0.24 | 23.73 | −0.47 | |||||
| 150 | 25.70 | 66.50 | 0.10 | 24.46 | 0.00 | |||||
| 180 | 26.03 | 65.00 | 0.12 | 25.06 | 0.09 | |||||
| LQLT-1 | 17-10-2024 | 10:00 –12:00 | 30.9 | 67.4 | 10 | 24.90 | 56.00 | 0.94 | 24.50 | −1.29 |
| 60 | 25.20 | 64.00 | 0.53 | 24.89 | −0.79 | |||||
| 90 | 25.32 | 63.40 | 0.29 | 25.07 | −0.43 | |||||
| 120 | 25.45 | 63.40 | 0.15 | 25.45 | 0.03 | |||||
| 150 | 25.83 | 64.80 | 0.12 | 25.77 | 0.17 | |||||
| 180 | 25.97 | 63.70 | 0.14 | 25.45 | 0.18 | |||||
| 12:00 –14:00 | 30.5 | 71.2 | 10 | 24.25 | 53.00 | 0.94 | 25.04 | −1.47 | ||
| 60 | 24.45 | 64.50 | 0.53 | 25.07 | −0.96 | |||||
| 90 | 24.60 | 62.70 | 0.29 | 25.10 | −0.58 | |||||
| 120 | 24.85 | 66.00 | 0.15 | 25.15 | −0.10 | |||||
| 150 | 25.05 | 67.50 | 0.12 | 25.42 | −0.02 | |||||
| 180 | 25.38 | 66.80 | 0.14 | 25.61 | 0.12 | |||||
| LQMT-1 | 19-09-2024 | 10:00 –12:00 | 34.2 | 67.1 | 10 | 26.30 | 57.00 | 0.94 | 23.51 | −0.97 |
| 60 | 26.47 | 67.10 | 0.53 | 24.30 | −0.51 | |||||
| 90 | 26.60 | 66.80 | 0.29 | 24.87 | −0.16 | |||||
| 120 | 26.75 | 66.80 | 0.15 | 24.86 | 0.22 | |||||
| 150 | 26.97 | 68.40 | 0.12 | 25.53 | 0.39 | |||||
| 180 | 27.25 | 67.60 | 0.14 | 25.80 | 0.50 | |||||
| 12:00 –14:00 | 33.4 | 66.1 | 10 | 25.40 | 59.00 | 0.94 | 21.37 | −1.41 | ||
| 60 | 25.65 | 68.20 | 0.53 | 22.52 | −0.90 | |||||
| 90 | 25.80 | 67.10 | 0.29 | 23.31 | −0.50 | |||||
| 120 | 26.03 | 66.90 | 0.15 | 24.37 | 0.01 | |||||
| 150 | 26.33 | 68.20 | 0.12 | 24.40 | 0.08 | |||||
| 180 | 26.55 | 67.40 | 0.14 | 24.51 | 0.17 | |||||
| LQHT-1 | 15-10-2024 | 10:00 –12:00 | 32.8 | 63.9 | 10 | 25.87 | 73.40 | 0.94 | 25.59 | −0.75 |
| 60 | 25.87 | 73.40 | 0.53 | 25.65 | −0.46 | |||||
| 90 | 25.93 | 72.80 | 0.29 | 25.86 | −0.12 | |||||
| 120 | 26.00 | 72.90 | 0.15 | 26.00 | 0.31 | |||||
| 150 | 26.03 | 73.80 | 0.12 | 25.97 | 0.32 | |||||
| 180 | 26.23 | 72.70 | 0.14 | 26.17 | 0.43 | |||||
| 12:00 –14:00 | 32.4 | 65.8 | 10 | 25.27 | 66.40 | 0.94 | 25.39 | −1.00 | ||
| 60 | 25.37 | 66.40 | 0.53 | 25.15 | −0.70 | |||||
| 90 | 25.45 | 65.80 | 0.29 | 25.57 | −0.32 | |||||
| 120 | 25.62 | 65.80 | 0.15 | 25.62 | 0.11 | |||||
| 150 | 25.77 | 67.00 | 0.12 | 25.83 | 0.18 | |||||
| 180 | 26.00 | 66.80 | 0.14 | 26.00 | 0.30 | |||||
| HQLT-2 | 08-10-2024 | 10:00 –12:00 | 31.5 | 71.6 | 10 | 24.07 | 61.00 | 1.11 | 21.90 | −1.81 |
| 60 | 24.35 | 70.00 | 0.64 | 22.65 | −1.31 | |||||
| 90 | 24.43 | 69.40 | 0.39 | 23.05 | −0.99 | |||||
| 120 | 24.55 | 68.40 | 0.24 | 23.03 | −0.72 | |||||
| 150 | 24.82 | 69.40 | 0.10 | 23.90 | −0.23 | |||||
| 180 | 25.02 | 69.20 | 0.12 | 24.06 | −0.23 | |||||
| 12:00 –14:00 | 31.8 | 69 | 10 | 23.50 | 62.00 | 1.11 | 19.09 | −2.23 | ||
| 60 | 23.75 | 69.40 | 0.64 | 20.31 | −1.73 | |||||
| 90 | 23.85 | 69.40 | 0.39 | 21.06 | −1.38 | |||||
| 120 | 24.05 | 68.60 | 0.24 | 21.58 | −1.03 | |||||
| 150 | 24.33 | 71.80 | 0.10 | 22.50 | −0.53 | |||||
| 180 | 24.70 | 71.90 | 0.12 | 22.84 | −0.47 | |||||
| HQMT-2 | 30-09-2024 | 10:00 –12:00 | 33.7 | 68.5 | 10 | 25.00 | 63.00 | 1.11 | 21.97 | −1.50 |
| 60 | 25.07 | 67.70 | 0.64 | 22.70 | −1.13 | |||||
| 90 | 25.17 | 69.70 | 0.39 | 23.24 | −0.78 | |||||
| 120 | 25.30 | 70.10 | 0.24 | 23.67 | −0.46 | |||||
| 150 | 25.55 | 72.60 | 0.10 | 24.23 | −0.01 | |||||
| 180 | 25.87 | 72.20 | 0.12 | 24.27 | 0.00 | |||||
| 12:00 –14:00 | 32.3 | 73.9 | 10 | 24.18 | 65.00 | 1.11 | 22.88 | −1.66 | ||
| 60 | 24.27 | 71.30 | 0.64 | 23.25 | −1.25 | |||||
| 90 | 24.38 | 71.10 | 0.39 | 23.55 | −0.93 | |||||
| 120 | 24.53 | 70.70 | 0.24 | 23.53 | −0.63 | |||||
| 150 | 24.83 | 71.50 | 0.10 | 25.48 | 0.05 | |||||
| 180 | 25.22 | 71.20 | 0.12 | 25.92 | 0.12 | |||||
| HQHT-2 | 10-10-2024 | 10:00 –12:00 | 29.9 | 67.6 | 10 | 26.30 | 62.00 | 1.11 | 25.88 | −0.78 |
| 60 | 26.35 | 67.60 | 0.64 | 26.02 | −0.46 | |||||
| 90 | 26.38 | 69.40 | 0.39 | 26.11 | −0.18 | |||||
| 120 | 26.42 | 69.50 | 0.24 | 26.14 | 0.10 | |||||
| 150 | 26.50 | 70.20 | 0.10 | 26.32 | 0.50 | |||||
| 180 | 26.60 | 69.40 | 0.12 | 26.42 | 0.47 | |||||
| 12:00 –14:00 | 30.6 | 63.5 | 10 | 25.88 | 52.00 | 1.11 | 25.03 | −1.07 | ||
| 60 | 26.07 | 61.00 | 0.64 | 25.40 | −0.64 | |||||
| 90 | 26.15 | 61.80 | 0.39 | 25.61 | −0.36 | |||||
| 120 | 26.22 | 62.20 | 0.24 | 25.71 | −0.07 | |||||
| 150 | 26.32 | 62.90 | 0.10 | 25.93 | 0.33 | |||||
| 180 | 26.47 | 62.10 | 0.12 | 26.16 | 0.33 | |||||
| LQLT-2 | 07-10-2024 | 10:00 –12:00 | 30 | 70.1 | 10 | 24.48 | 54.00 | 0.94 | 22.47 | −1.62 |
| 60 | 24.77 | 64.70 | 0.53 | 23.21 | −1.08 | |||||
| 90 | 24.88 | 64.00 | 0.29 | 23.63 | −0.70 | |||||
| 120 | 25.10 | 64.00 | 0.15 | 23.49 | −0.34 | |||||
| 150 | 25.38 | 65.40 | 0.12 | 24.10 | −0.19 | |||||
| 180 | 25.65 | 64.70 | 0.14 | 24.39 | −0.04 | |||||
| 12:00 –14:00 | 29.8 | 72.9 | 10 | 23.55 | 53.00 | 0.94 | 21.53 | −2.00 | ||
| 60 | 23.82 | 63.20 | 0.53 | 22.25 | −1.45 | |||||
| 90 | 24.13 | 63.40 | 0.29 | 22.88 | −0.97 | |||||
| 120 | 24.35 | 63.40 | 0.15 | 23.24 | −0.52 | |||||
| 150 | 24.67 | 63.90 | 0.12 | 23.41 | −0.45 | |||||
| 180 | 24.97 | 63.20 | 0.14 | 23.66 | −0.30 | |||||
| LQMT-2 | 26-09-2024 | 10:00 –12:00 | 33.2 | 68.5 | 10 | 24.53 | 60.00 | 0.94 | 20.47 | −1.74 |
| 60 | 24.92 | 69.80 | 0.53 | 21.78 | −1.16 | |||||
| 90 | 25.03 | 69.70 | 0.29 | 22.53 | −0.76 | |||||
| 120 | 25.20 | 70.10 | 0.15 | 22.99 | −0.34 | |||||
| 150 | 25.50 | 71.80 | 0.12 | 23.62 | −0.18 | |||||
| 180 | 25.75 | 70.80 | 0.14 | 24.29 | 0.01 | |||||
| 12:00 –14:00 | 33.2 | 69.6 | 10 | 23.65 | 58.00 | 0.94 | 19.56 | −2.10 | ||
| 60 | 24.07 | 68.60 | 0.53 | 20.91 | −1.50 | |||||
| 90 | 24.38 | 68.90 | 0.29 | 21.87 | −1.01 | |||||
| 120 | 24.62 | 68.40 | 0.15 | 22.97 | −0.47 | |||||
| 150 | 24.97 | 69.00 | 0.12 | 24.09 | −0.24 | |||||
| 180 | 25.28 | 68.60 | 0.14 | 26.28 | 0.23 | |||||
| LQHT-2 | 28-09-2024 | 10:00 –12:00 | 30.6 | 67.6 | 10 | 26.07 | 66.00 | 0.94 | 25.79 | −0.74 |
| 60 | 26.17 | 73.20 | 0.53 | 26.26 | −0.33 | |||||
| 90 | 26.22 | 71.90 | 0.29 | 26.17 | −0.02 | |||||
| 120 | 26.28 | 74.20 | 0.15 | 26.32 | 0.43 | |||||
| 150 | 26.37 | 74.80 | 0.12 | 26.43 | 0.47 | |||||
| 180 | 26.53 | 74.50 | 0.14 | 26.47 | 0.55 | |||||
| 12:00 –14:00 | 30.8 | 67.4 | 10 | 26.00 | 71.00 | 0.94 | 26.00 | −0.70 | ||
| 60 | 26.15 | 70.80 | 0.53 | 26.00 | −0.39 | |||||
| 90 | 26.20 | 75.00 | 0.29 | 26.45 | 0.03 | |||||
| 120 | 26.50 | 76.80 | 0.15 | 26.50 | 0.53 | |||||
| 150 | 26.30 | 77.80 | 0.12 | 26.30 | 0.47 | |||||
| 180 | 26.43 | 76.80 | 0.14 | 26.37 | 0.54 | |||||
References
- Shukla, P.; Mishra, S.; Goswami, S. A field study of investigation of indoor environmental quality status in Indian offices: Concerns and influencing building factors. J. Build. Eng. 2024, 86, 108648. [Google Scholar] [CrossRef]
- Suryo, M.S.; Ichinose, M.; Kuroda, Y.; Alkhalaf, H. An Investigation of Indoor Environment Quality on Occupants’ Thermal Responses, Health, and Productivity: A Study Based on Physiological Data in Occupied Office Space. Buildings 2024, 14, 3562. [Google Scholar] [CrossRef]
- Keene, K.; McCord, K.; Dehwah, A.H.A.; Jung, W. Meta-Analysis and Regression Modeling of the Impacts of Four Indoor Environmental Quality Metrics on Office Performance. Indoor Air 2025, 2025, 6840369. [Google Scholar] [CrossRef]
- Pan, C.-Y.; Weng, K.-T.; Hsu, H.-C. Air change per hour improvement for positive and negative pressure mechanical ventilation facilities systems. J. Build. Eng. 2024, 83, 108414. [Google Scholar] [CrossRef]
- Hsu, H.-C.; Pan, C.-Y.; Wu, I.C.; Liu, C.-C.; Zhuang, Z.-Y. Using the big data analysis and basic information from lecture Halls to predict air change rate. J. Build. Eng. 2023, 66, 105817. [Google Scholar] [CrossRef]
- Bavarsad, F.S.; Mohajerani, M.; Tywoniak, J.; Jiao, Z.; Yuan, J. Future Climate Impacts on Urban Office Buildings: Energy, Comfort, and Passive Solutions in Osaka, Japan. J. Therm. Biol. 2025, 131, 104212. [Google Scholar] [CrossRef]
- Hsu, H.-C.; Chang, C.-W.; Chen, C.-C.; Pan, C.-Y. Natural Ventilation: Optimizing Window Opening Size for CO2 Concentration Control and Thermal Comfort on Nonwindward Facades. Indoor Air 2024, 2024, 1435400. [Google Scholar] [CrossRef]
- Arumugam, P.; Ramalingam, V. Thermal comfort enhancement of office buildings located under warm and humid climate through phase change material and insulation coupled with natural ventilation. Sustain. Energy Technol. Assess. 2024, 63, 103657. [Google Scholar] [CrossRef]
- Heidari, S.; Poshtiri, A.H.; Gilvaei, Z.M. Enhancing thermal comfort and natural ventilation in residential buildings: A design and assessment of an integrated system with horizontal windcatcher and evaporative cooling channels. Energy 2024, 289, 130040. [Google Scholar] [CrossRef]
- Pan, C.Y.; Hsu, H.C.; Huang, K.W. Real-Time Control of the Air Volume in Ventilation Facilities by Limiting CO2 Concentration With Cluster Algorithms. IEEE Trans. Ind. Electron. 2023, 70, 12894–12903. [Google Scholar] [CrossRef]
- Chen, Y.; Ozaki, A.; Yang, X.; Arima, Y.; Li, Z.; Choi, Y. Adaptive model-based advanced natural ventilation control strategy for mixed-mode residential buildings in Japan. Build. Environ. 2025, 273, 112718. [Google Scholar] [CrossRef]
- Elhami, M.; Goodarzi, S.S.; Maleki, S.; Sajadi, B. Three-objective optimization of the HVAC system control strategy in an educational building to reduce energy consumption and enhance indoor environmental quality (IEQ) using machine learning techniques. J. Build. Eng. 2025, 105, 112444. [Google Scholar] [CrossRef]
- Litardo, J.; Del Pero, C.; Molinaroli, L.; Leonforte, F.; Aste, N. Sustainable active cooling strategies in hot and humid climates—A review and a practical application in Somalia. Build. Environ. 2022, 221, 109338. [Google Scholar] [CrossRef]
- Jacob Jeslu, C.; Pandit, D.; Sen, J. Case Study Exploring the Influence of Diffuser Arrangement on Air Distribution Using Field Experiments and Computational Fluid Dynamics Simulations. J. Archit. Eng. 2025, 31, 05025001. [Google Scholar] [CrossRef]
- Li, L.; Yao, C.; Liu, W.; Yin, Z.; Huang, W.; Yao, Y.; Luo, Y.; Huang, Y. Impact of displacement ventilation and underfloor air distribution systems on concentrations of indoor particle in different seasons. J. Build. Eng. 2024, 84, 108466. [Google Scholar] [CrossRef]
- Yau, Y.H.; Rodzi, M.A.M.; Nik Ghazali, N.N. Numerical simulation on supply air of high sidewall grille with retrofitted energy recovery ventilator system for thermal comfort in the tropics. J. Build. Eng. 2024, 89, 109281. [Google Scholar] [CrossRef]
- Ho, S.H.; Rosario, L.; Rahman, M.M. Comparison of underfloor and overhead air distribution systems in an office environment. Build. Environ. 2011, 46, 1415–1427. [Google Scholar] [CrossRef]
- Kanaan, M.; Amine, S.; Gazo-Hanna, E. Optimizing supply conditions and use of return air in UFAD system: Assessment of IAQ, thermal comfort and energy performance. Results Eng. 2024, 24, 103426. [Google Scholar] [CrossRef]
- Bauman, F.S. Underfloor Air Distribution (UFAD) Design Guide; American Society of Heating, Refrigerating and Air-Conditioning Engineers (ASHRAE): Peachtree Corners, GA, USA, 2003. [Google Scholar]
- Zhang, K.; Zhang, X.; Li, S.; Jin, X. Review of underfloor air distribution technology. Energy Build. 2014, 85, 180–186. [Google Scholar] [CrossRef]
- Chen, M.; Zhang, Z.; Deng, Q.; Feng, Y.; Wang, X. Optimization of underfloor air distribution systems for data centers based on orthogonal test method: A case study. Build. Environ. 2023, 232, 110071. [Google Scholar] [CrossRef]
- Kong, Q.; Yu, B. Numerical study on temperature stratification in a room with underfloor air distribution system. Energy Build. 2008, 40, 495–502. [Google Scholar] [CrossRef]
- Qin, C.; Fang, H.-Q.; Wu, S.-H.; Lu, W.-Z. Establishing multi-criteria optimization of return vent height for underfloor air distribution system. J. Build. Eng. 2022, 57, 104800. [Google Scholar] [CrossRef]
- ANSI/ASHRAE Standard 55; Thermal Environmental Conditions for Human Occupancy. ANSI/ASHRAE: Peachtree Corners, GA, USA, 2023. Available online: https://www.ashrae.org/technical-resources/bookstore/standard-55-thermal-environmental-conditions-for-human-occupancy (accessed on 15 May 2025).
- Fanger, P.O. Thermal Comfort. Analysis and Applications in Environmental Engineering; Danish Technical Press: Vanløse, Denmark, 1970. [Google Scholar]
- Li, R.; Sekhar, S.C.; Melikov, A.K. Thermal comfort and IAQ assessment of under-floor air distribution system integrated with personalized ventilation in hot and humid climate. Build. Environ. 2010, 45, 1906–1913. [Google Scholar] [CrossRef]
- Nada, S.A.; El-Batsh, H.M.; Elattar, H.F.; Ali, N.M. CFD investigation of airflow pattern, temperature distribution and thermal comfort of UFAD system for theater buildings applications. J. Build. Eng. 2016, 6, 274–300. [Google Scholar] [CrossRef]
- Cao, S.; Li, F.; Li, X. Numerical study on settlement characteristics of inhalable particles in under-floor air distribution system. J. Build. Eng. 2022, 45, 103481. [Google Scholar] [CrossRef]
- Rahmati, B.; Heidarian, A.; Jadidi, A.M. Investigation in performance of a hybrid under-floor air distribution with improved desk displacement ventilation system in a small office. Appl. Therm. Eng. 2018, 138, 861–872. [Google Scholar] [CrossRef]
- ANSI/ASHRAE Standard 55-2017; Thermal Environmental Conditions for Human Occupancy. American Society of Heating, Refrigerating and Air-Conditioning Engineers: Atlanta, GA, USA, 2017.


Disclaimer/Publisher’s Note: The statements, opinions and data contained in all publications are solely those of the individual author(s) and contributor(s) and not of MDPI and/or the editor(s). MDPI and/or the editor(s) disclaim responsibility for any injury to people or property resulting from any ideas, methods, instructions or products referred to in the content. |
© 2025 by the authors. Licensee MDPI, Basel, Switzerland. This article is an open access article distributed under the terms and conditions of the Creative Commons Attribution (CC BY) license (https://creativecommons.org/licenses/by/4.0/).