Article

Mud Spurt Distance and Filter Cake Hydraulic Conductivity of Slurry Shield

1
Department of Civil Engineering, Hangzhou City University, Hangzhou 310015, China
2
Department of Civil Engineering, College of Civil Engineering and Architecture, Zhejiang University, Hangzhou 310030, China
*
Author to whom correspondence should be addressed.
Buildings 2025, 15(20), 3699; https://doi.org/10.3390/buildings15203699
Submission received: 25 August 2025 / Revised: 28 September 2025 / Accepted: 30 September 2025 / Published: 14 October 2025
(This article belongs to the Section Building Materials, and Repair & Renovation)

Abstract

Maintaining stable tunnel face pressure in slurry shield tunneling is critically dependent on the formation of a low-permeability filter cake. However, the knowledge of the filter cake and mud spurt is not specifically understood. Using a modified fluid loss test, this study investigates the formation and hydraulic properties of filter cakes from various slurry mixtures under different pressures. The key findings reveal that CMC-Na (sodium carboxymethyl cellulose) serves as the most effective additive for enhancing slurry performance. A comprehensive database of constitutive model parameters for 15 slurry compositions was established, enabling precise prediction of the filter cake’s hydraulic conductivity and void ratio under any pressure. Analysis of the cyclic formation process revealed that the dynamic filter cake averages two-thirds of the maximum thickness, offering a key parameter for stability control. Furthermore, a practical mud spurt model was proposed that predicts slurry penetration by avoiding the need for site-specific empirical constants or complex column tests, relying instead on standard geotechnical and slurry parameters. The results provide practical criteria for filter cake formation and directly applicable models to optimize slurry design, thereby enhancing the control and safety of shield tunneling.

1. Introduction

The slurry pressure plays a critical role in ensuring face stability in slurry shield tunneling. During excavation, pressurized slurry penetrates the surrounding soil matrix, with its solid particles obstructing pore paths and leading to the formation of a filter cake on the tunnel face or a mud spurt zone within the stratum (see Figure 1) [1,2,3,4]. These resulting structural layers contribute to effective transmission of slurry pressure to the excavation face, thereby improving overall stability. However, in highly permeable sand and gravel formations, excessive slurry filtration loss may occur due to high hydraulic conductivity of the filter cake [5], posing serious risks such as face collapse or ground settlement [6]. Field evidence from slurry shield projects, such as the Greater Cairo Metro, underscores the practical significance of understanding and controlling settlement, which is intrinsically linked to face stability [7]. Furthermore, the continuous excavation and soil-cutting process makes slurry infiltration a highly dynamic phenomenon, which must be thoroughly investigated to ensure safe construction.
Although extensive research has been conducted on slurry infiltration, a predictive framework that is both practically applicable and accounts for both the mud spurt phenomenon and filter cake formation on the tunnel face remains elusive. Theoretically, Xu and Bezuijen [8] extended Broere’s work [9] to establish practical models for filter cake and mud spurt formation, emphasizing the vulnerability of filter cakes under dynamic loading. Experimentally, Talmon & Mastbergen categorized slurry penetration into mud spurt and filter cake formation stages [10]. Watanabe & Yamazaki correlated slurry density and sand content with filtration loss, particularly in permeable grounds [11]. While these models provide valuable theoretical insights, they often rely on the extreme assumption (e.g., no filter cake), or require laboring test for obtaining input parameters (e.g., infiltration column tests), limiting their direct application in engineering design.
Min et al. identified key influencing factors—slurry viscosity, density, particle size distribution, and solid content—on filter cake permeability via infiltration column tests [12]. Yin et al. further revealed the periodic nature of filter cake development under cyclic pressure and its relationship with limiting excess pressure [13,14]. Yang et al. derived an empirical model for dynamic filter cake formation time [15], while Yin et al. and Li provided additional experimental data on infiltration behavior [16,17]. The infiltration column testing has successfully identified key influencing factors; however, the results are often specific to the tested conditions, and a generalized constitutive model for various slurries is still lacking.
Numerical approaches offer supplementary insights. Zhang et al. developed a coupled Computational Fluid Dynamics and Discrete Element Method (CFD-DEM) framework to simulate filter cake development and slurry flow [18]. Yin et al. applied Discrete Element Method (DEM) to analyze particle transport, linking infiltration patterns to changes in constriction size [19]. However, realistic numerical modeling remains challenging due to the complex morphology of slurry aggregates and soil heterogeneity. Recent studies by Cheng et al. employed Finite Element Method (FEM) to evaluate the effect of filter cake permeability on face stability in sandy gravel [20], and Liu et al. utilized CFD-DEM to analyze particle-scale infiltration mechanisms [21]. Recent CFD-DEM simulations by Liu et al. have further quantified the limitations of column tests, showing that a realistic tunneling model alters the infiltration dynamics despite forming similar filter cakes [22]. At the micro-scale, Chen et al. employed CFD-DEM to link the long-term stability of filter cakes under dynamic loads to the evolution of internal contact force chains, providing micromechanical insights into their failure process [23]. Numerical simulations offer detailed insights into the process, but the computational complexity and specialized expertise required make them challenging for routine engineering use.
To address these challenges, this study establishes a practical framework for slurry design and face stability control by pursuing three key objectives: (1) to develop a novel mud spurt model that relies solely on standard geotechnical and slurry parameters, eliminating the need for complex testing; (2) to establish a comprehensive constitutive database for 15 different slurry mixtures, enabling accurate prediction of filter cake properties under any pressure; and (3) to quantify the dynamic evolution of the filter cake and derive a simplified thickness ratio for practical stability assessment during cutterhead rotation. By integrating modified fluid loss tests with theoretical analysis, this work bridges the gap between theoretical models and routine engineering practice.

2. Materials

We tested the most important polymers used for slurry conditioning. For the bentonite slurries, a commercially available sodium activated calcium bentonite was used. Bentonite was taken from Hebei Province, China, and it was widely used in slurry shield construction and had high quality [24,25]. The sodium-based bentonite is lightly yellow. It has a 2.55 relative density and its swelling index is 12 mL/2 g. The basic properties of the bentonite are shown in Table 1. In slurry shield engineering, methylcellulose (CMC), polyacrylamide (anion) (APAM), polyacrylamide (cation) (CPCM), sodium polyacrylate (PAA-Na) and sodium carboxymethylcellulose (CMC-Na) are commonly used as polymer material slurry additives, which can increase the viscosity of the bentonite slurry and have a significant modification effect.
To study regarding slurries in slurry shield projects, 15 slurries with different properties were configured [26,27]. This bentonite, polymer materials and degassed water composed the slurries of this study. The basic properties of the slurry, including density, viscosity, and yield stress, were measured following the American Petroleum Institute (API) standard testing procedures for drilling fluids (i.e., API RP 13B-1). The bentonite concentrations of 50 and 70 g/L were selected to represent the typical density range (1.03–1.10 g/cm3) of fresh slurries used in industrial slurry shield projects Basic properties of slurry are as shown in Table 2. Both the Russian funnel and Marsh funnel viscosities were measured. Although they assess similar rheological behavior, the Russian funnel is commonly used in China and parts of Europe, while the Marsh funnel is standard in American Petroleum Institute (API) procedures and many other regions. Reporting both sets of data enhances the practical relevance of our findings for a global engineering audience.
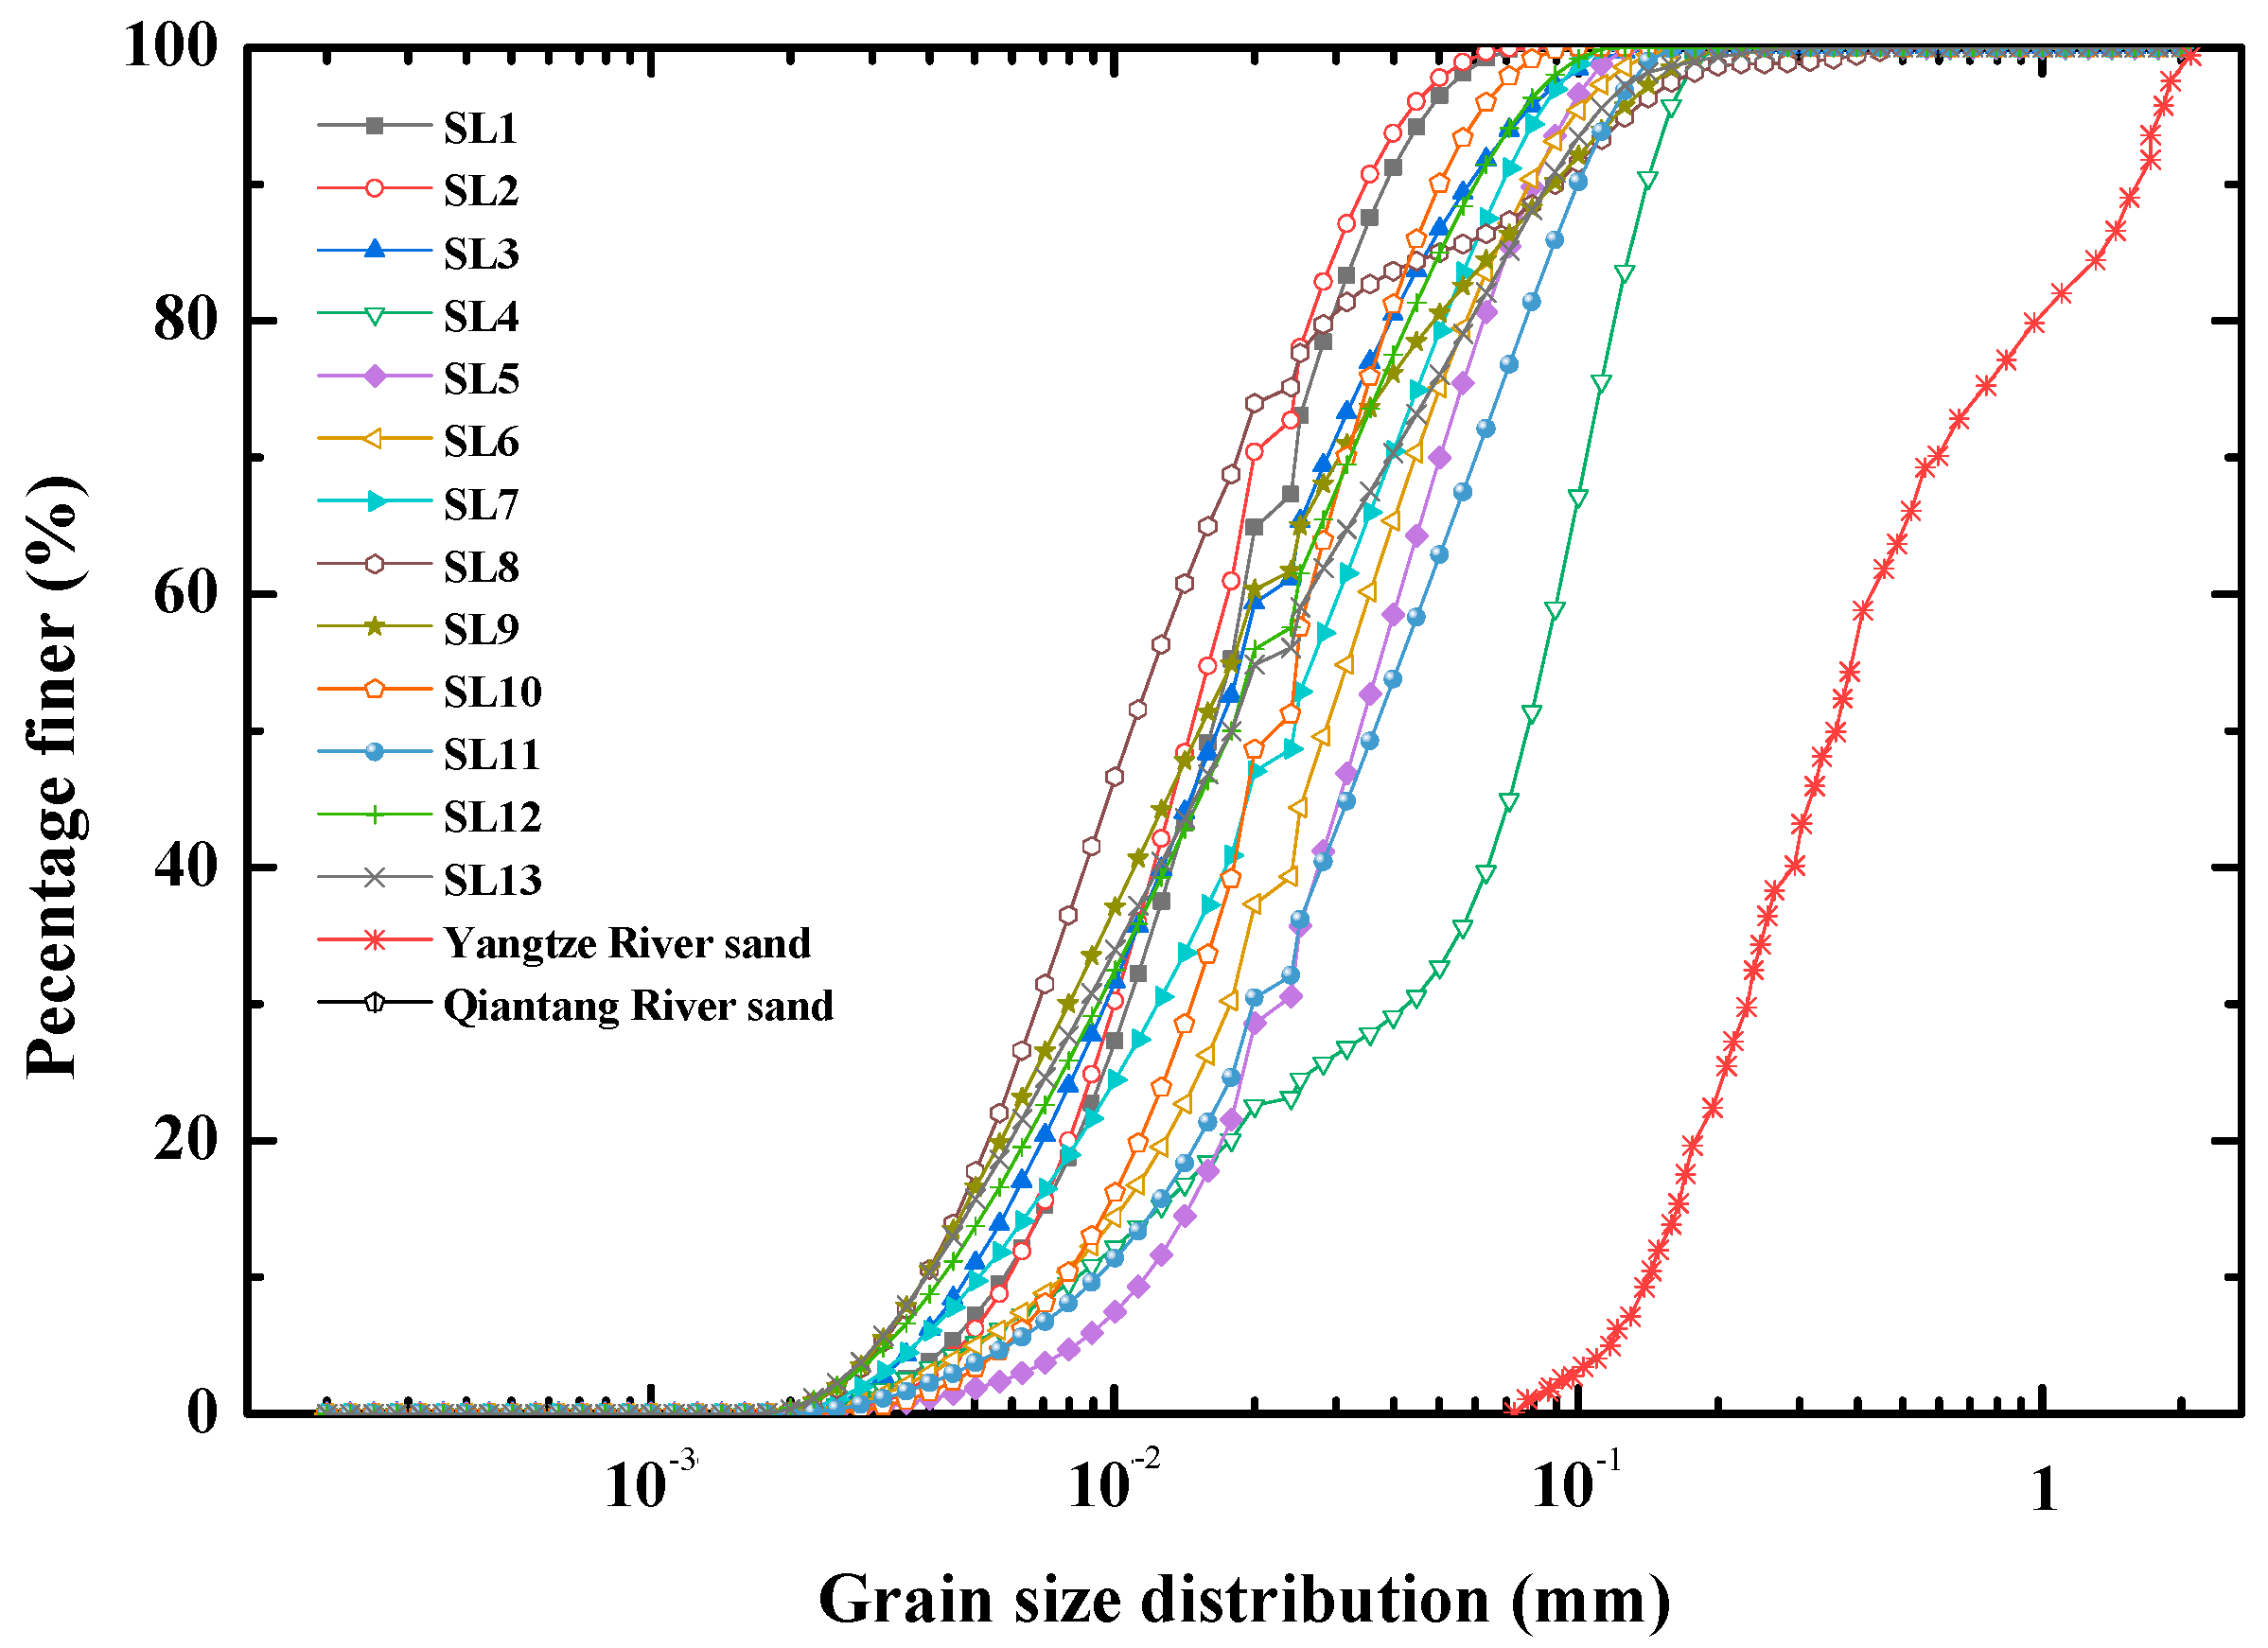
SL1 and 2 were pure bentonite slurries; Qiantang River sand (QT) was added to SL14 and 15. The rest were bentonite slurries with the addition of different polymer materials. We tested the properties of the configured slurries, measuring particle size distribution with a laser particle size analyzer and other basic properties (see Figure 2). Basic properties tests were carried out for 15 slurries, and three sets of parallel tests were conducted for each test to ensure the accuracy of the test results.
When used as additives, the concentration of the polymers is usually between 1% and 2% (related to the bentonite concentration), which means 10–20 g of polymer per L of bentonite slurry. The slurries tested had 0–2% polymer contents and densities of 1.03–1.10 g/cm3. The tests showed that the viscosity of the slurries increased with the increasing polymer content, because the polymer material is adsorbed on the surface of the bentonite particles. The addition of polymer materials to the slurry will cause the bentonite particles to form a bridging effect with the water molecules, reducing the free water in the slurry and increasing the density and viscosity of the slurry. With the same concentration of bentonite, the Russian funnel viscosity of SL9 increased by 94%, compared with SL1. The basic properties of the tested slurries are shown in Table 2.

3. The Criteria of Filter Cake Formation

A well-established body of research has proposed various criteria to predict the infiltration behavior of slurry into a granular soil. These criteria, summarized in Table 3, determine whether a slurry will form an impermeable filter cake, experience both filter cake formation and mud spurt, or penetrate freely without forming a stable cake [8,10,24,25]. However, these existing criteria employ different indicative particle sizes (e.g., d85/D15 vs. Dpore/d50), leading to potential inconsistencies in prediction. D15 is the particle size for which 15% by weight of particles in the sand are smaller (m), d85 is the particle size for which 85% by weight of particles in the suspension are smaller (m).
For this study, the criteria proposed by Sherard et al. [24] and Min et al. [10] were selected as the benchmark, based on the ratios d85/D15 and d15/D15. This choice was made because the indices d85, d15, and D15 are readily measurable in both laboratory and field settings, enhancing the practical applicability of our findings. The specific criteria and their physical meaning are as follows:
d 85 / D 15 0.25 .
Equation (1) defines the condition for the formation of a low-permeability filter cake. When the slurry particles are sufficiently large relative to the soil pores (represented by D15), they will effectively block the pore throats on the tunnel face, leading to the rapid formation of a stable filter cake.
0.095 < d 85 / D 15 < 0.25 .
Equation (2) describes an intermediate state where both mud spurt and filter cake formation occur. An initial slurry penetration (mud spurt) is followed by the formation of a filter cake within the soil matrix, creating a “mud spurt zone.”
d 85 / D 15 0 . 095 .
Equation (3) indicates that the slurry particles are too fine to effectively block the soil pores, resulting in continuous penetration without forming a filter cake.
Equations (1)–(3) were used to determine the theoretical infiltration behavior of the 15 slurries in this study on the Yangtze River sand (D15 = 0.159 mm). This preliminary assessment confirmed that all designed slurries (SL1–SL13) were theoretically capable of forming a filter cake or a filter cake with mud spurt, thereby validating our experimental design and ensuring the subsequent investigations into filter cake properties were conducted on relevant mixtures. The results of this verification are presented in the following sections.
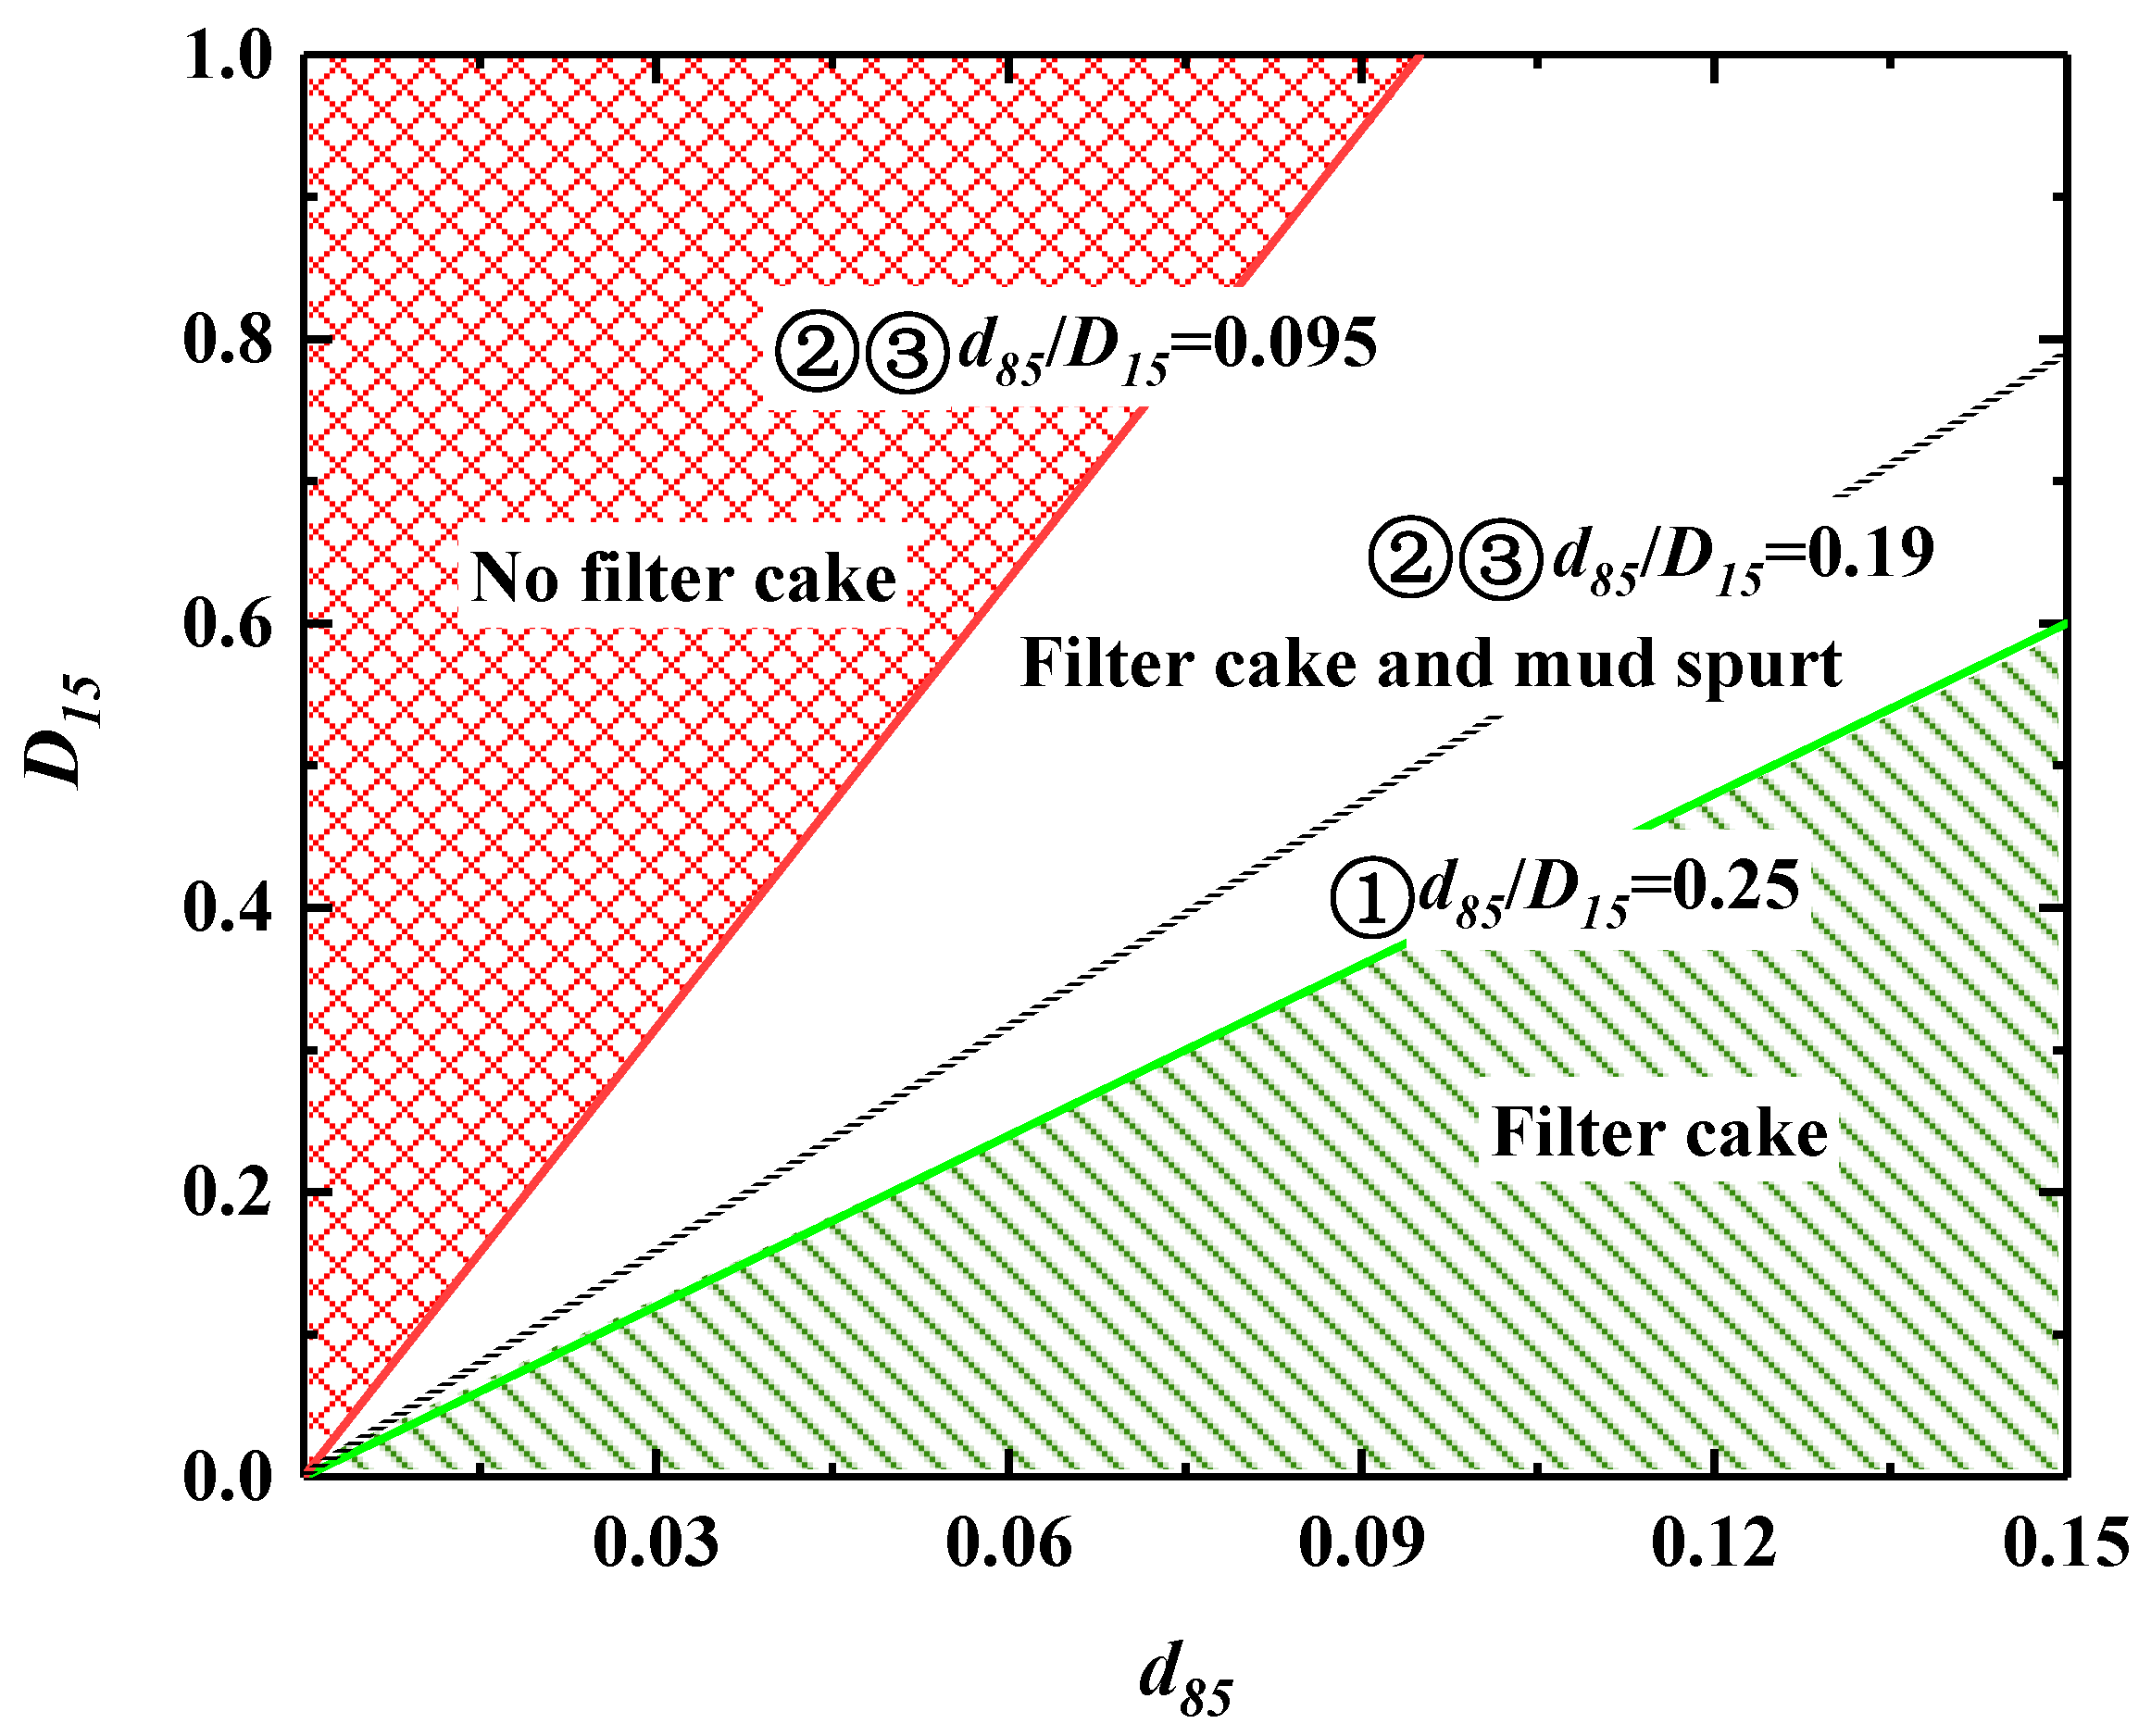
Equations (1)–(3) are the formulae to determine formable filter cake, formable filter cake, and mud spurt, non-formable filter cake, respectively (see Figure 3). The filter cake can be formed in the lower right diagonal area, filter cake and mud spurt can be formed in the middle blank area, and filter cake cannot be formed in the upper left grid area. The above criteria of forming filter cake can predict the physical form produced by slurry penetration in the stratum, and then it can be more clearly understood whether filter cake or mud spurt can be formed by slurry shield in sand stratum. Equations (1)–(3) were used to determine whether the slurry in this study could form a filter cake on the Yangtze River sand (D15 = 0.159 mm). It was verified that pure bentonite slurry SL1 and 2 can form filter cake and mud spurt, and slurry SL3-13 can form filter cake. According to Talmon & Masthergen [8], when Dpore = 0.02544 mm and d50 are as shown in Table 2, slurry SL1-13 were able to form filter cake on Yangtze river sand, which is in accordance with the equations.

4. Mud Spurt Distance Model

4.1. Mud Spurt Model

Broere and Krause assuming that slurry infiltration does not form a filter cake, and formula was proposed to calculate the mud spurt distance at a specified time, which was Krause-Broere model [9,30]. To further precise the slurry penetration distance in the formation [8], the influence of the mud spurt on the slurry penetration was considered. Based on Krause-Broere’s model, Xu’s model was proposed. However, the empirical constants in Krause-Broere’s model depend on the test setup and are not constants, so they are only applicable to the specific situations [31]. Xu’s model requires infiltration column tests to measure the hydraulic conductivity kb of the slurry in the stratum, which is complicated to carry out in practical engineering. Therefore, further improvements are needed.
To avoid complex column tests and facilitate practical application, we proposed a new mud spurt model. According to Krause-Broere model and Xu’s model, it is known that the apparent slurry viscosity μ has a significant on the slurry penetration distance [9,30]. Therefore, the mud spurt model assumed that slurry penetration cannot form a filter cake, and the flow of slurry in the sand layer is in accordance with Darcy’s law. While the slurry is a non-Newtonian fluid, this study adopts an established approach from filtration theory where its behavior is accounted for by using the apparent viscosity (μ, mPa·s) within the Darcy’s law framework. This simplification is justified for engineering applications, as it avoids the need for complex rheological models with parameters difficult to obtain in practice. The hydraulic conductivity of the slurry in the stratum is obtained as follows.
k b = Δ p k w Δ φ μ ,
where ∆p is the pressure drop over the sand sample (kPa), kb is the hydraulic conductivity of sand for the bentonite slurry (m/s), kw is the hydraulic conductivity of saturated sand (m/s), ∆φ is the difference in piezometric head (m) over the grout (in this experiment over the filter cake of the bentonite slurry).
The excavation of the slurry shield is mainly conducted in the sand stratum where the hydraulic conductivity of sandy soil stratum is around 10−4 m/s, and the input slurry bentonite content of the slurry shield is generally 40 to 60 g/L. Ye et al. studied the diffusion area of slurry in sand stratum under pressure, and found that the diffusion radius of slurry in a sand stratum is around 0.12 m [32]. Therefore, to prevent the slurry from penetrating out of the sand layer, it is necessary to ensure that the thickness of the sand stratum is at least 0.12 m. According to the computational Xu’s model and the infiltration column test, the sand stratum thickness Ls obtained is as 1 to 3 times of the slurry thickness Lb.
L s = δ L b ,
where δ is the empirical constant (1 ≤ δ ≤ 3). Ls can be calculated by Equation (5). According to Ye et al. [32] and Kim et al. [33], Ls is sufficient by slurry diffusion radius of 0.12 m. Substituting Equations (4) and (5) into Xu’s model eliminates the parameters that require complex infiltration column tests, resulting in an implicit relationship between the infiltration time t and the slurry penetration distance x. Since this implicit function cannot be solved for x directly, the Newton-Raphson algorithm was employed. Accordingly, a residual function, f(x), was constructed for the iterative numerical solution.
f ( x ) = x k w k b k w k b [ ( L s L k w + L k b ) ln ( 1 x L ) Δ φ t n L ] ,
where x is the penetration distance at any time (m), L is the theoretical maximum penetration distance of the slurry (m), n is the sand porosity.
The slurry penetration distance in the stratum at any filtration time can be found using Equation (6). Compared with the Krause-Broere model, the mud spurt model uses more parameters for adjustment and obtains more accurate slurry penetration distances. Compared with the Xu’s model, the parameters in the mud spurt model can be obtained from geological surveys and basic slurry properties tests, and complex infiltration column tests are not required.

4.2. Calculation of Mud Spurt Model

Using MATLAB (R2020b) for programming, Equation (6) was solved by the Newton-Raphson method (see Figure 4). First, let x be equal to x0 (x0 is taken to be close to the actual penetration distance). If f′ (x0) = 0, the calculated parameters are wrong and the test parameters need to be verified, if f′ (x0) ≠ 0, the Taylor first-order expansion of the mud spurt model is used to obtain x1. Finally, it is determined whether ǀx1x0ǀ is less than 0.1%, if not, the cycle is repeated until the condition is satisfied, and finally x1 is output as the slurry penetration distance at t.

4.3. Validation of Mud Spurt Model

In the slurry shield excavation process, the cutter head will continuously and periodically cut the soil in front of the tunnel face, resulting in a dynamic process of continuous “destruction–formation–destruction” of the filter cake on the tunnel face [2]. Considering the low speed (1 r/min) of slurry shield tunneling in loose strata and the general division of the tool into six sectors, the formation period of dynamic filter cake would be 10 s.
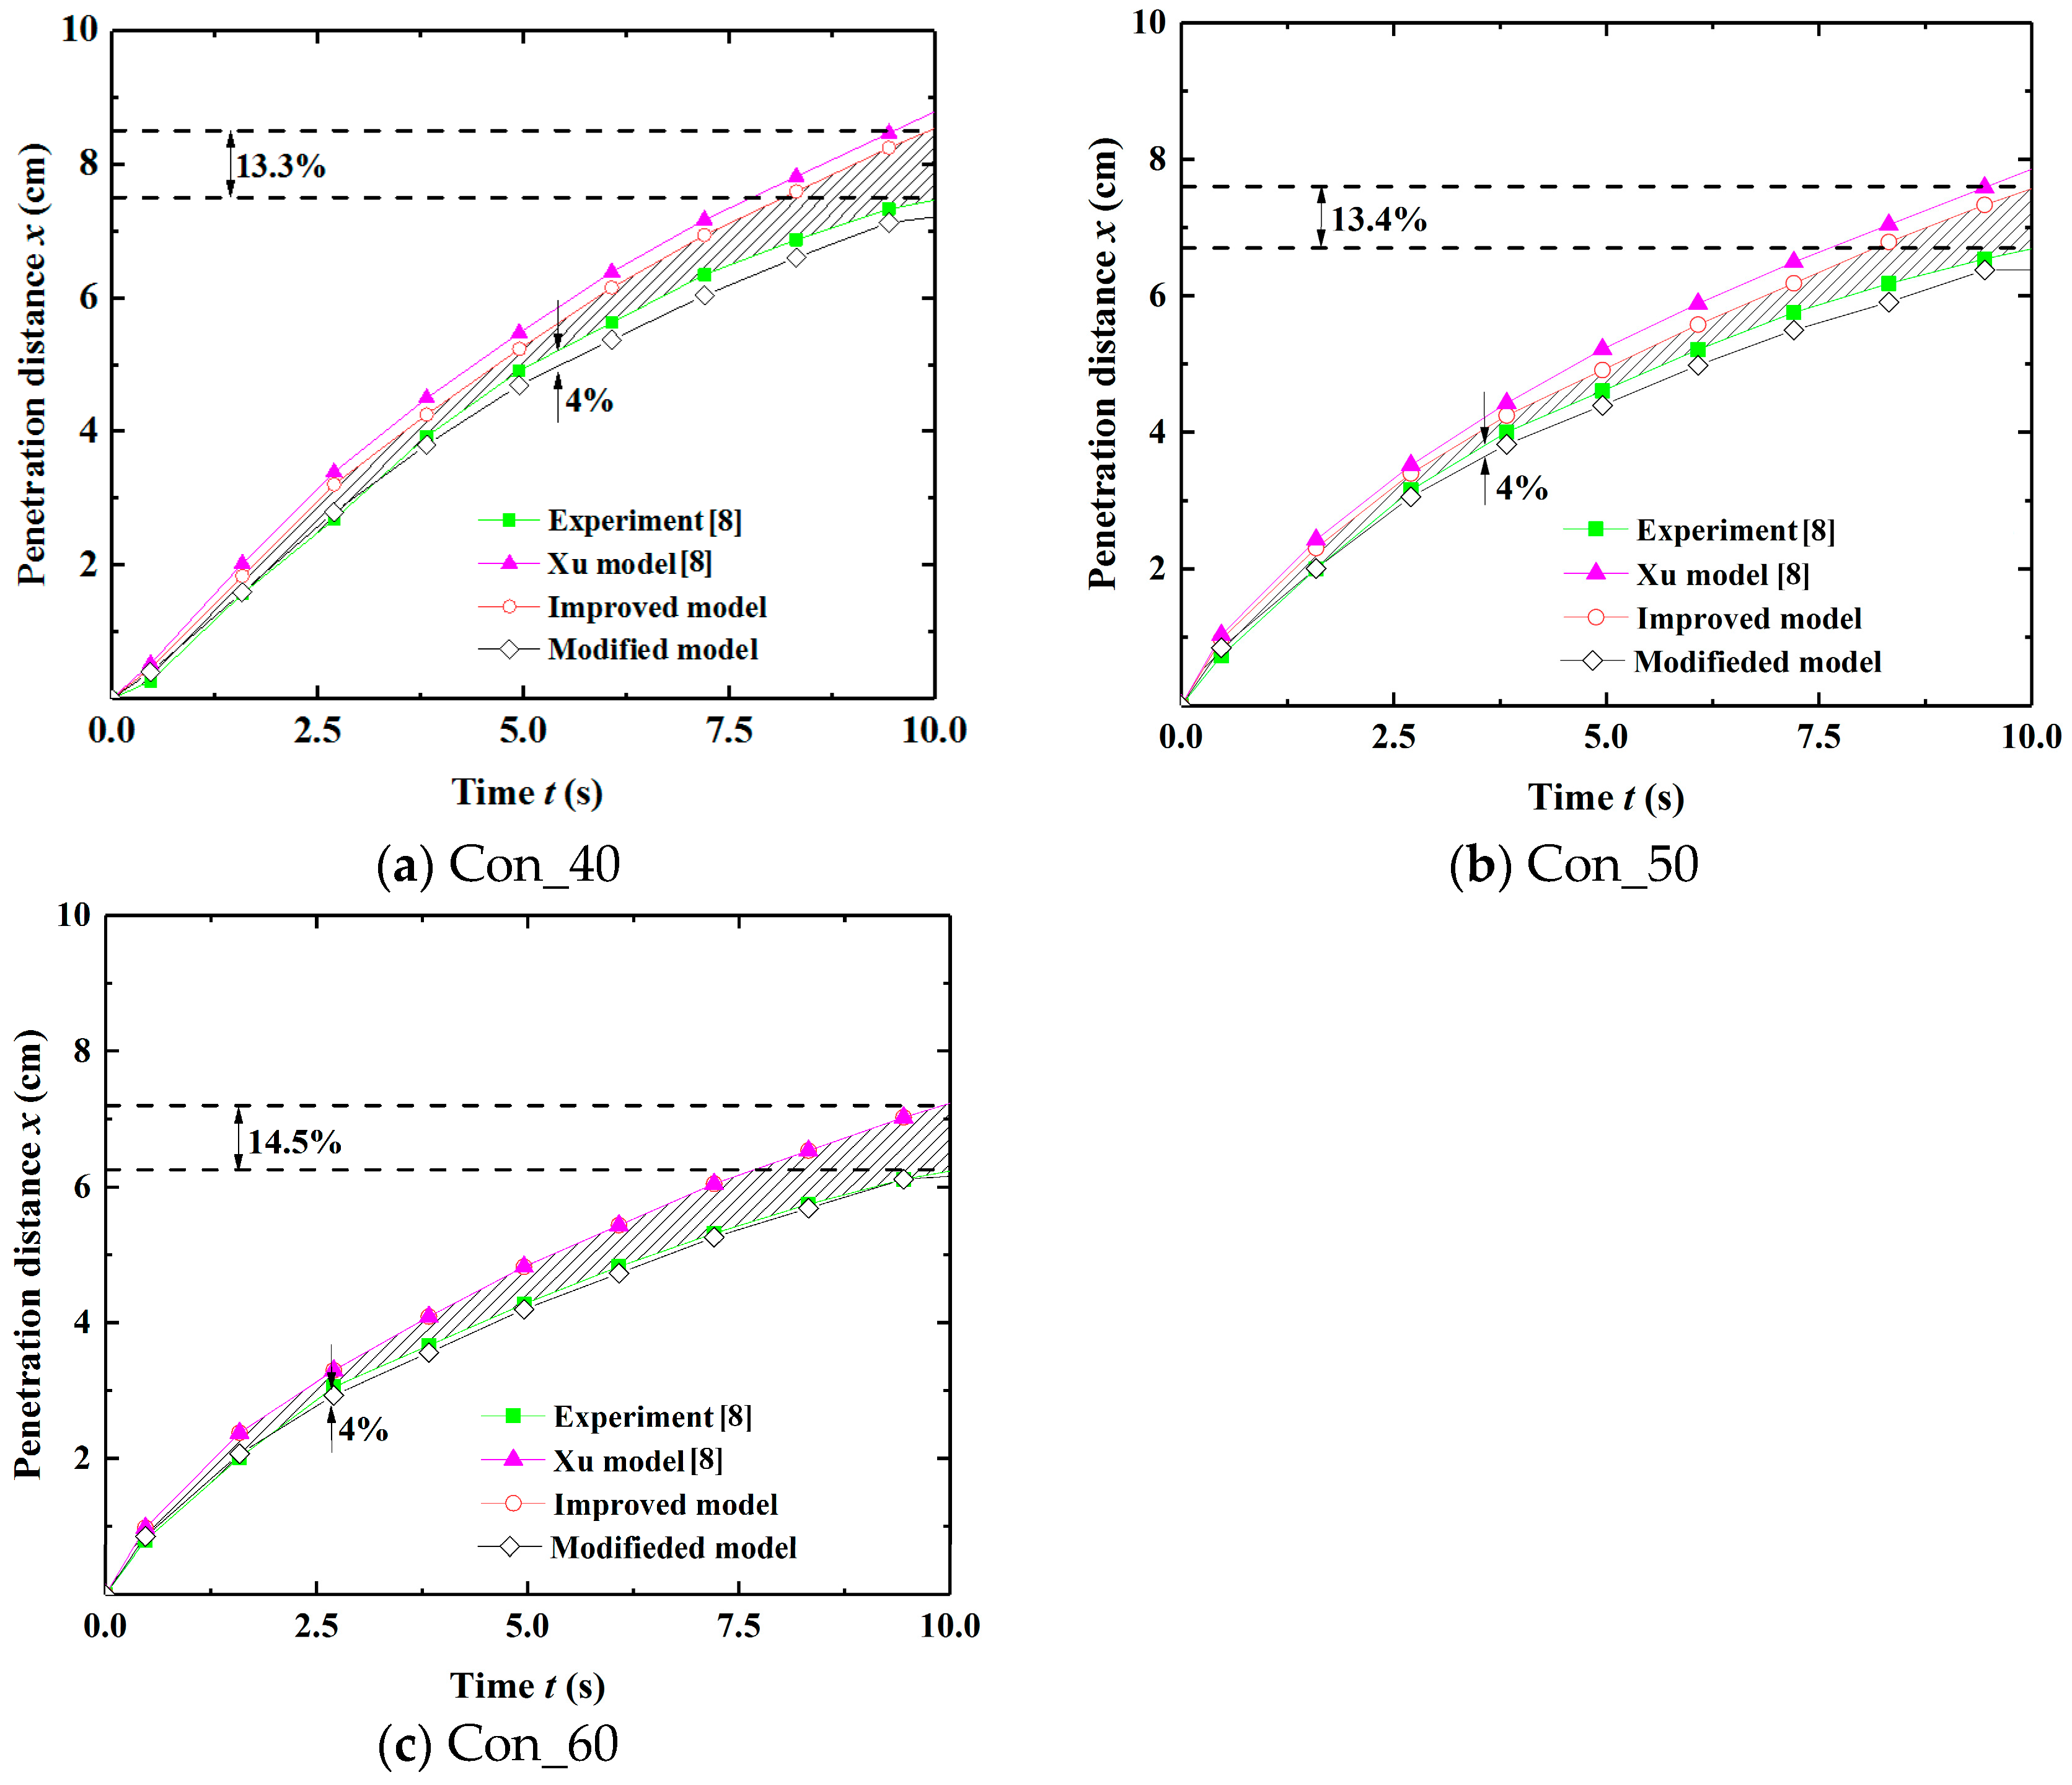
The accuracy of the mud spurt model was tested according to the experimental data [8], where n = 0.37, ∆φ = 5 m, Ls = 0.17 m, and kw = 3 × 10⁻⁴ m/s. There were three slurries with different bentonite contents: Con_40, Con_50, and Con_60. As bentonite concentration increases, τy and L increase, while kb and kb decrease (Table 4). The mud spurt model and Xu’s model were compared with the measured permeation distance during the 10 s of the dynamic filter cake formation cycle (see Figure 5). The shaded part shows the error ∆x between the mud spurt model and the measured penetration distance, and the maximum error between the mud spurt model and the measured penetration distance is marked with a dotted line. According to the calculation results, the error between the mud spurt model and the Xu’s model is less than 6%, and it is close to the measured infiltration distance. From Figure 5, it is apparent that in the case of Con_40, the error between the mud spurt model and the measured infiltration distance is less than 13.3%. The error between the mud spurt model and the measured infiltration distance is less than 13.4% for Con_50. In the case of Con_60, the error between the mud spurt model and the measured infiltration distance is less than 14.5%.
The maximum observed error of 14.5% for the Con_60 slurry represents the upper bound of the model’s deviation under the tested conditions. While non-negligible, this margin of error is considered acceptable within the context of practical slurry shield design for several reasons. Firstly, geotechnical engineering and tunnel face stability analysis inherently involve significant uncertainties, such as spatial variability of soil properties. Predictive models with errors within 15–20% are often deemed sufficient for preliminary design and decision-making. Secondly, the primary advantage of the proposed model lies in its practicality; it eliminates the need for time-consuming and specialized infiltration column tests, providing a rapid estimation tool using readily available parameters. The trade-off between a modest increase in error and a significant reduction in experimental complexity is highly favorable for engineering application.

4.4. Mud Spurt Model with Filter Cake

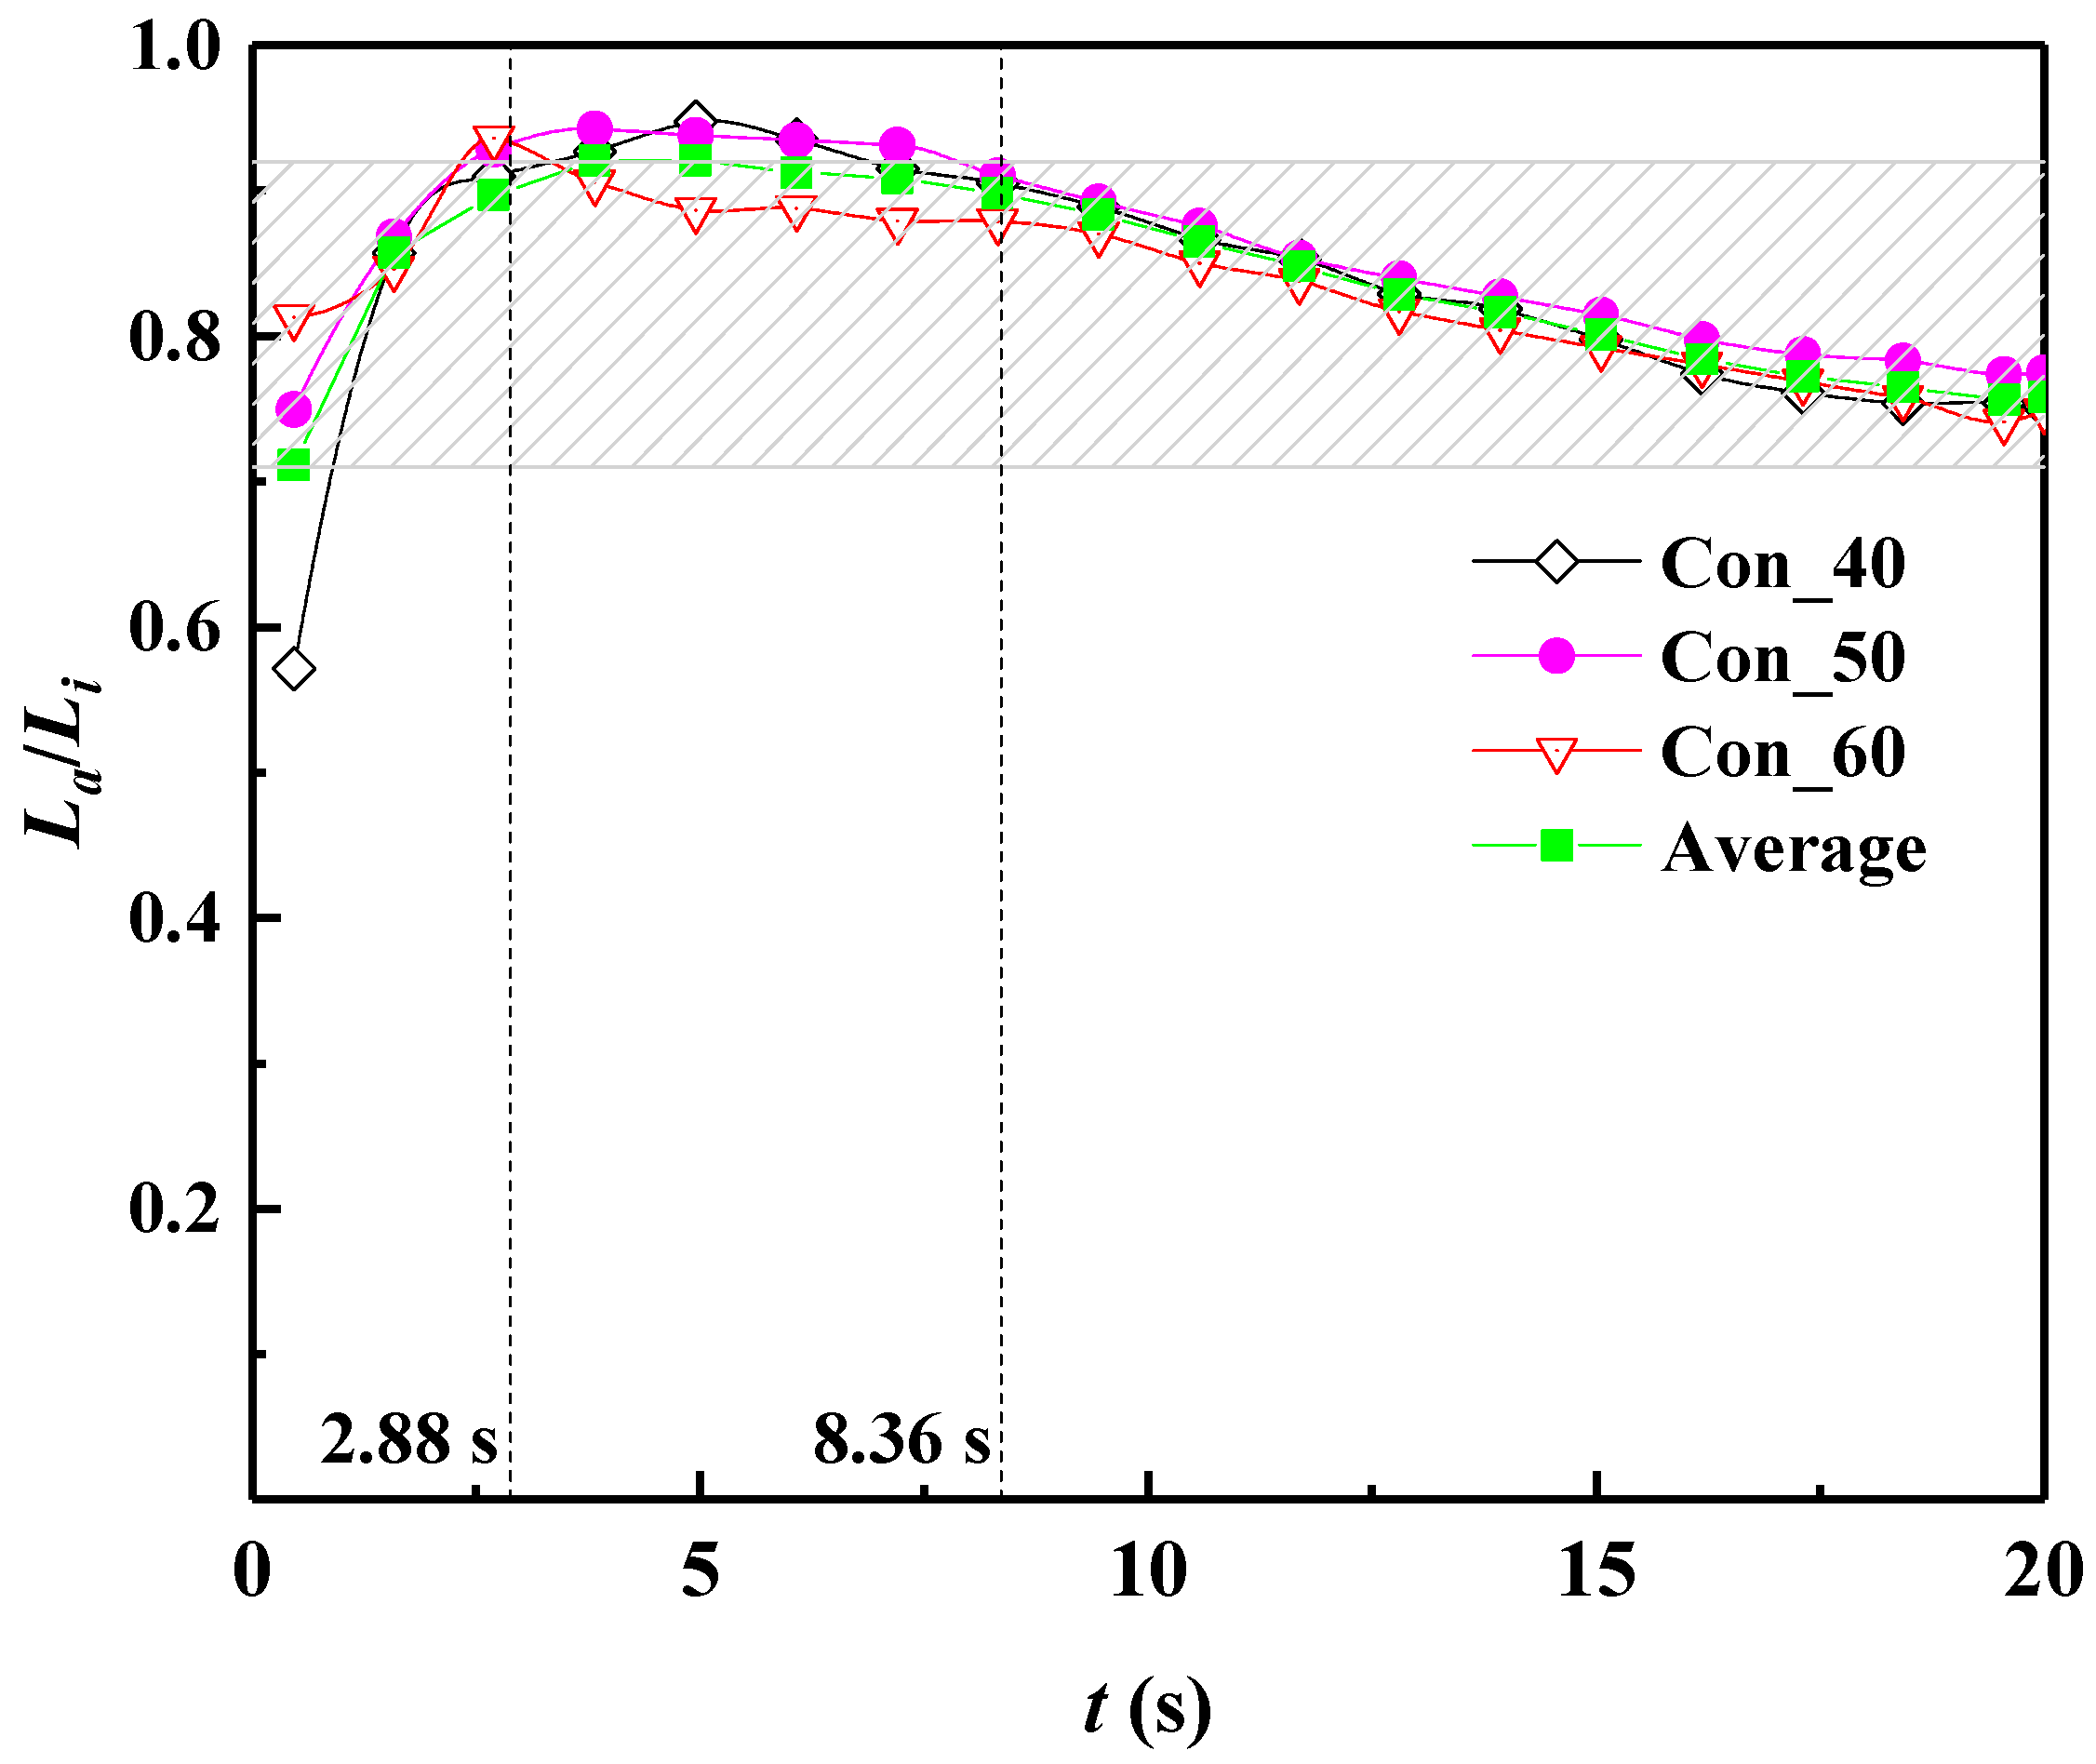
Modification of the mud spurt model to take into account the filter cake accompanying the slurry penetration strata. The measured penetration distances La of Con_40, Con_50 and Con_60 are divided by the result of the mud spurt model calculation Li (see Figure 6). The shaded part shows the area where the average values of the three error curves are located. It is obvious that the three error curves have the same trend, first an upward trend and then a downward trend. The values of the three curves are close to each other, indicating the universality of this ratio relationship. It can also be observed that the average values of the three curves are 0.72 ≤ La/Li ≤ 0.9 at 0 ≤ t ≤ 2.88 s; 0.9 < La/Li ≤ 0.92 at 2.88 s < t < 8.36 s; and 0.87 ≤ La/Li ≤ 0.9 at 8.36 s ≤ t ≤ 10 s. Therefore, the average values within 10 s of the filtration time are selected as the range of the correction coefficients:
f ( x m ) = x m γ k w k b k w k b L s L k w + L k b ln ( 1 x m γ L ) Δ φ t n L ,
where xm is the modified slurry penetration distance (m), γ is the correction factor (0.72 ≤ γ ≤ 0.92).
The correction factor was taken as the average value of 0.87 corresponding to 10 s (see Figure 6), and the data in Figure 5 were corrected to obtain the mud spurt model with filter cake penetration distance within 10 s of the dynamic filter cake formation cycle. The error between the corrected penetration distance and the measured penetration distance was found to be less than 4%, indicating that the mud spurt model with filter cake was more accurate and can be used to predict the slurry penetration distance.
In the slurry shield excavation process, a floating pressure of 20 kPa is generally set as a safety margin during the excavation process, considering the possible pulsating state of the slurry pressure. Accordingly, a slurry pressure ∆p of 20 kPa was selected for this study [34]. The Yangtze River sand was selected for the study stratum, which is classified as chalk sand (SM) according to ASTM D2487-11, γ′ = 10 kN/m3, kw = 2 × 10⁻⁴ m/s, n = 0.39, Ls = 0.12 m. The nine slurries in Table 2 that best fit the actual project were selected, and the mud spurt model with filter cake was used to predict the slurry penetration distance. The permeation distances of the nine slurries in the test were obtained from the mud spurt model with filter cake between 2.3 and 6.3 cm at a filtration time of 10 s. The diameter of the slurry shields in major cities in China is around 6 m, and the longest penetration distance is only 1.05% of the shield diameter, indicates that the distance of slurry penetration in the sand stratum during shield excavation is negligible.

5. Hydraulic Conductivity and Thickness of Filter Cake

5.1. Filtration Theory

The filtration theory is used to solve filtration problems related to the filter cake [35,36]. The formation of the filter cake is related to the slurry properties and the filtration time, and the filtration theory proposes basic assumptions and functions related to the formation of filter cake [37].
k c = β γ w 2 A 2 Δ p t V 2 1 ,
where kc is overall hydraulic conductivity of filter cake (m/s), β is defined as the ratio of increase in thickness of the filter cake to the filtrate volume/area at any time, γw is unit weight of water (kN/m3), A is filter area (m2), ∆p is applied overall stress (air pressure + hydraulic stress) (kPa), t is filtration time (s), V is filtrate volume (m3).
The coefficient of proportionality β is calculated from the mass balance expressions as follows:
β = L F A V = C m ρ w ( 1 + e ) ( 1 C m ) ρ s e C m ρ w ,
where Cm is mass fraction of solids in the slurry, ρw is density of water (kg/m3), ρs is density of solid particles (kg/m3), e is overall void ratio of filter cake, (the saturation of the filter cake is assumed to be 100% in this study), LF is filter cake thickness (m).
Based on the conservation of mass, the equation for the relationship between filtration time and filter cake thickness was derived from Equations (8) and (9).
L F = 2 k c Δ p t β γ w .
Tien [25] assumed that for filter cake formed from the same slurry, e and kc were determined by ∆p, independent of t, a constitutive model of the filter cake was proposed as follows:
e = e 0 ( Δ p p A ) δ ,
k c = k 0 ( Δ p p A ) α ,
where pA is parameter of the constitutive equations (pA = 1 Pa in this study), k0 is hydraulic conductivity corresponding to p0 (m/s), α is the slope of the lg kc − lg p0 plot (lg p0 is the abscissa), e0 is void ratio corresponding to p0, δ is the slope of the lg e − lg p0 plot, lg p0 is the abscissa. k0, e0, α, and δ is obtained from the results of the Modified Fluid Loss (MFL) Test.

5.2. Modified Fluid Loss Test

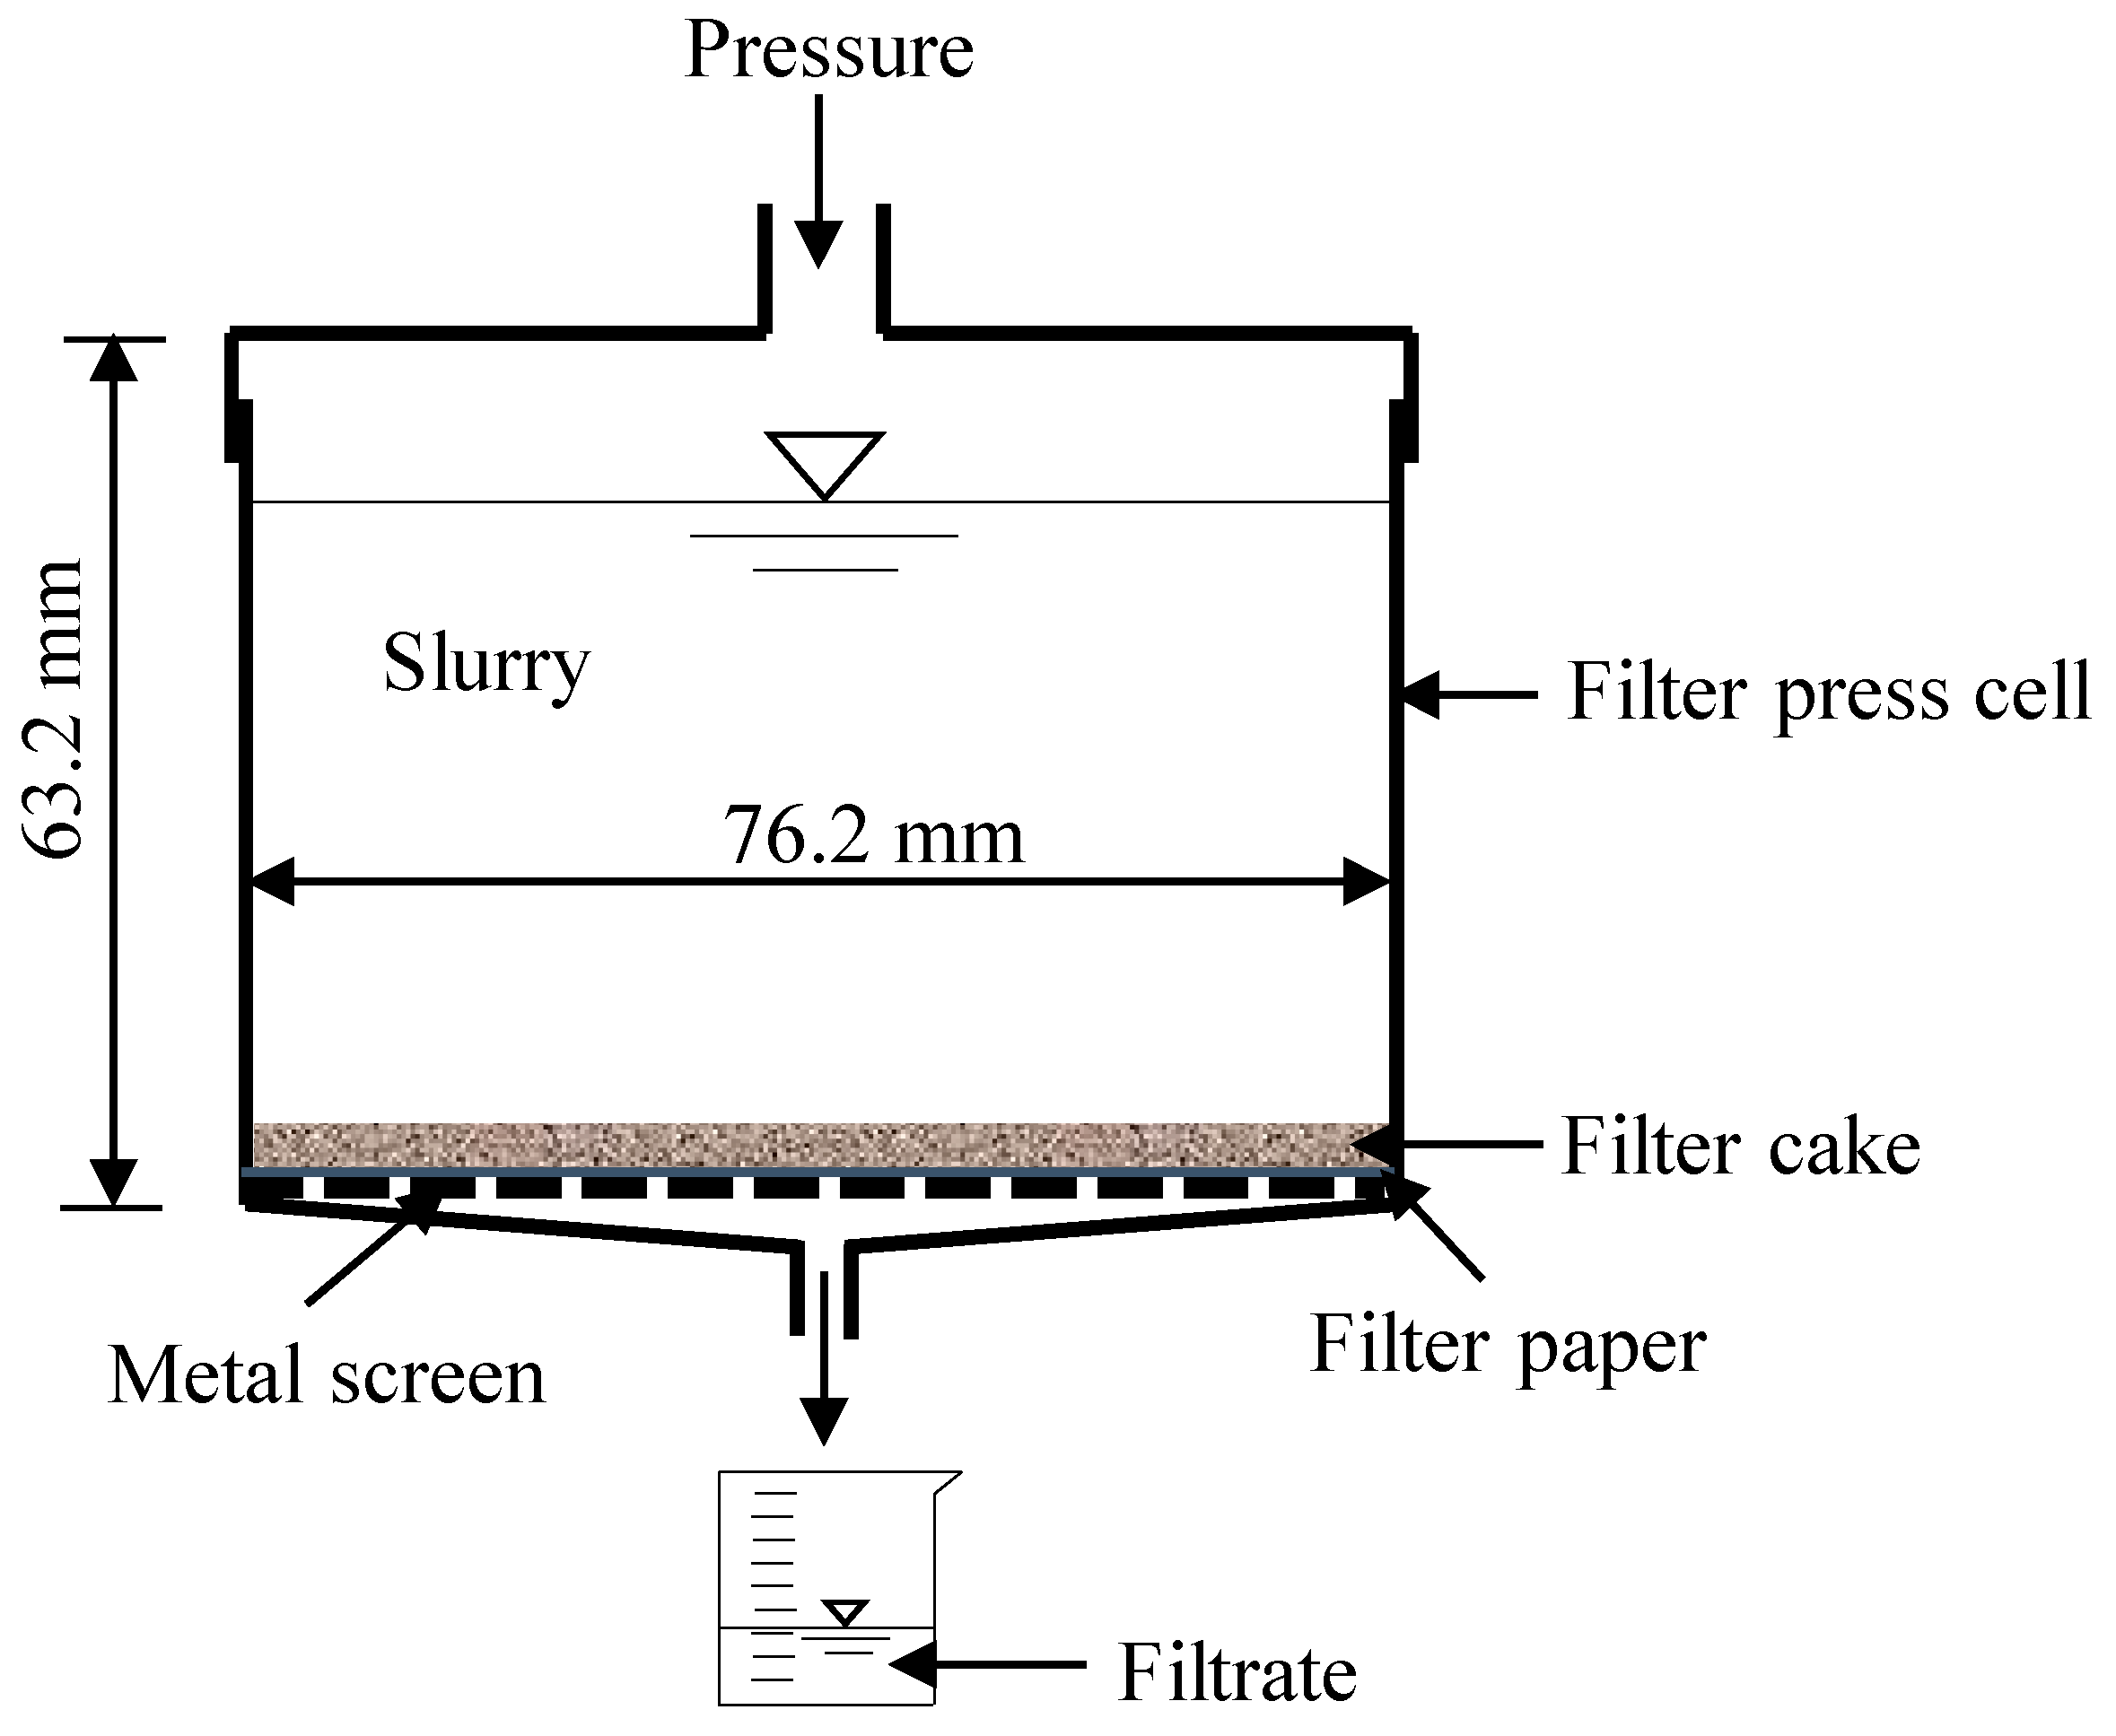
The modified fluid loss test is widely used in the study of the permeability characteristics of bentonite slurry. Although initially standardized by the American Petroleum Institute (API) for drilling fluid analysis, the fundamental process of filter cake formation under pressure—where solid particles in a slurry accumulate on a porous medium—is directly analogous to the process occurring at the tunnel face during slurry shield tunneling. The API RCLF-1A static filter press (see Figure 7)provides a well-established, standardized, and reproducible method to quantify this fundamental process in a controlled laboratory setting. Its use allows for the direct comparison of our results with a vast body of existing literature on bentonite slurry properties, thereby enhancing the reliability and broader relevance of our findings. The RCLF-1A static filter press consists of a slurry cell, a pressure reducing valve, a pressure gauge and a bracket. Before the test, the valve was closed and 350 mL of the prepared slurry was injected into the slurry cell. During the test, the valve is opened and the pressurized air pressure is added to the slurry cell from the top, and the slurry permeates vertically to the filter paper under pressure, and the solid particles in the slurry accumulate on the surface of the filter paper to form a filter cake. The filtrate flows out from the small hole at the bottom of the slurry cell, and a measuring cylinder is placed under the small hole to collect the filtrate and measure the volume of filtrate.
Filtrate volume was recorded at intervals of 5 s (first 5 min), 30 s (5–15 min), 1 min (15–60 min), and 15 min (after 1 h), typically for 3 h. The time was extended or shortened according to the specific situation to ensure the accuracy of filter cake thickness and void ratio. The test was conducted using API standard test filter paper to simulate the stratum. After the test, the filter paper with the filter cake was removed, and the thickness of the filter cake was measured with vernier calipers after wiping off the liquid film on the upper surface of the filter cake with a geotechnical knife, and the water content of the filter cake was tested by the drying method. Special attention is paid to the fact that since it takes a certain time to apply pressure to reach the specified value in the test, some filtrate (denoted as V0) will occur during this time due to gravity and other factors, leading to a time-filtrate volume asynchrony phenomenon. The initial filtrate volume V0 was measured for each test condition. To correct for this, the measured filtrate volume V(t) at any time t was adjusted as follows:
V c o r r = V ( t ) + V 0 ,
where Vcorr is the corrected filtrate volume at time t. It is necessary to apply this correction in the later data processing to ensure an accurate representation of the pressure-filtration relationship.

5.3. Test Results

The results of the MFL test showed that all 15 different slurries were able to form a measurable filter cake. A direct comparison with the filter cake formation criteria established in Section 3 was conducted to validate these findings. The predictions based on Equations (1)–(3) for the Yangtze River sand (D15 = 0.159 mm) are as follows:
Slurries SL3 to SL13 and SL15 satisfied the condition of Equation (1), which defines the formation of a low-permeability filter cake on the tunnel face. This indicates that the slurry particles are sufficiently large to rapidly block the soil pore throats.
Slurries SL1 to 2, and SL14 fell into the intermediate regime described by Equation (2), predicting the formation of both a mud spurt zone within the soil and a filter cake.
The experimental results from the MFL test are in excellent agreement with these theoretical predictions. The formation of a filter cake by the slurries, which contains Qiantang River sand (QT) (except SL4), aligns with its classification under Equation (1); the addition of QT increased the d85 value (as shown in Table 2), promoting filter cake formation despite an initial mud spurt. This direct comparison confirms that the criteria provided in Section 3 accurately forecast the slurry infiltration behavior observed in laboratory tests.
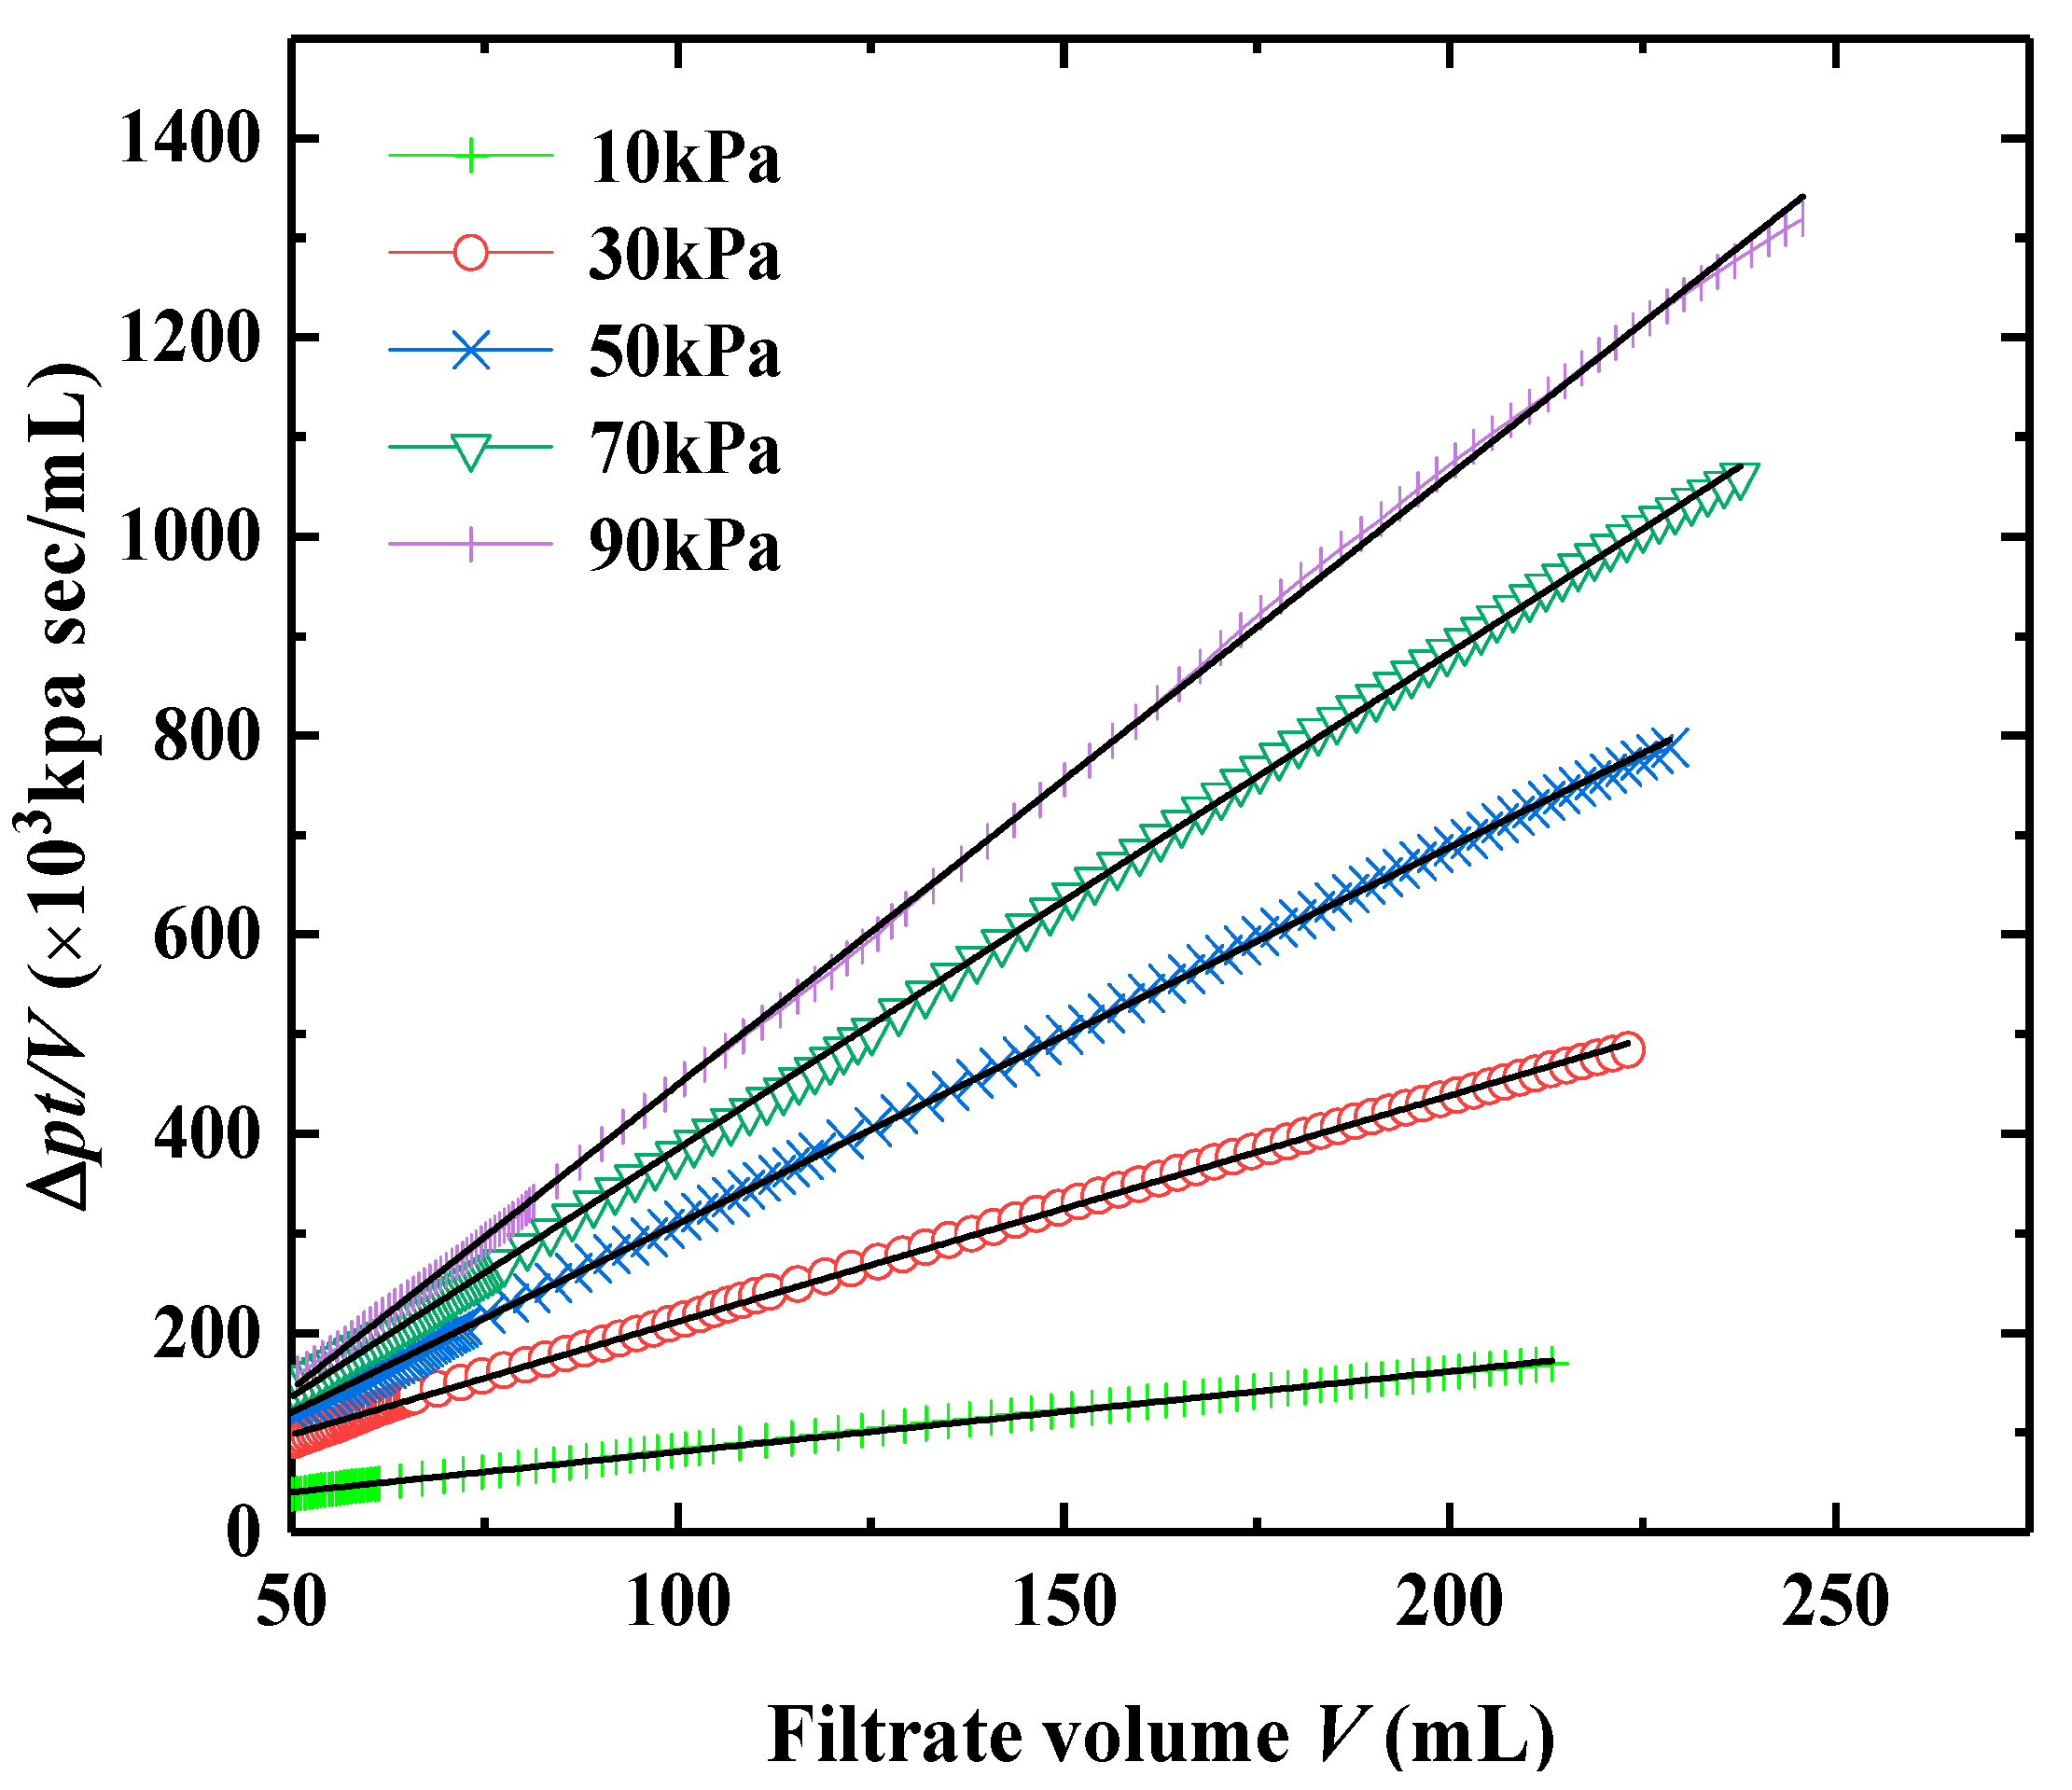
Figure 8 shows the relationship curves between ∆pt/V and the filtrate volume V for slurry SL1 under the action of various levels of pressure. The test results show that V increases with the increasing t, and V also increases with the increasing slurry pressure ∆p. The ∆pt/V has a good positive relationship with V, i.e., ∆pt/V2 is a constant value under constant stress condition. ∆pt/V2 reflects the bentonite filtrate volume at constant total stress and time.
The relationships presented in the following figures (Figure 9, Figure 10 and Figure 11) are derived from the analysis of averaged datasets from three replicate tests. The high reproducibility of the underlying measurements (coefficient of variation <5% for filtrate volume and filter cake thickness) ensures the robustness of the observed trends. The strong correlations and their consistency with filtration theory, as discussed below, further attest to their statistical significance.
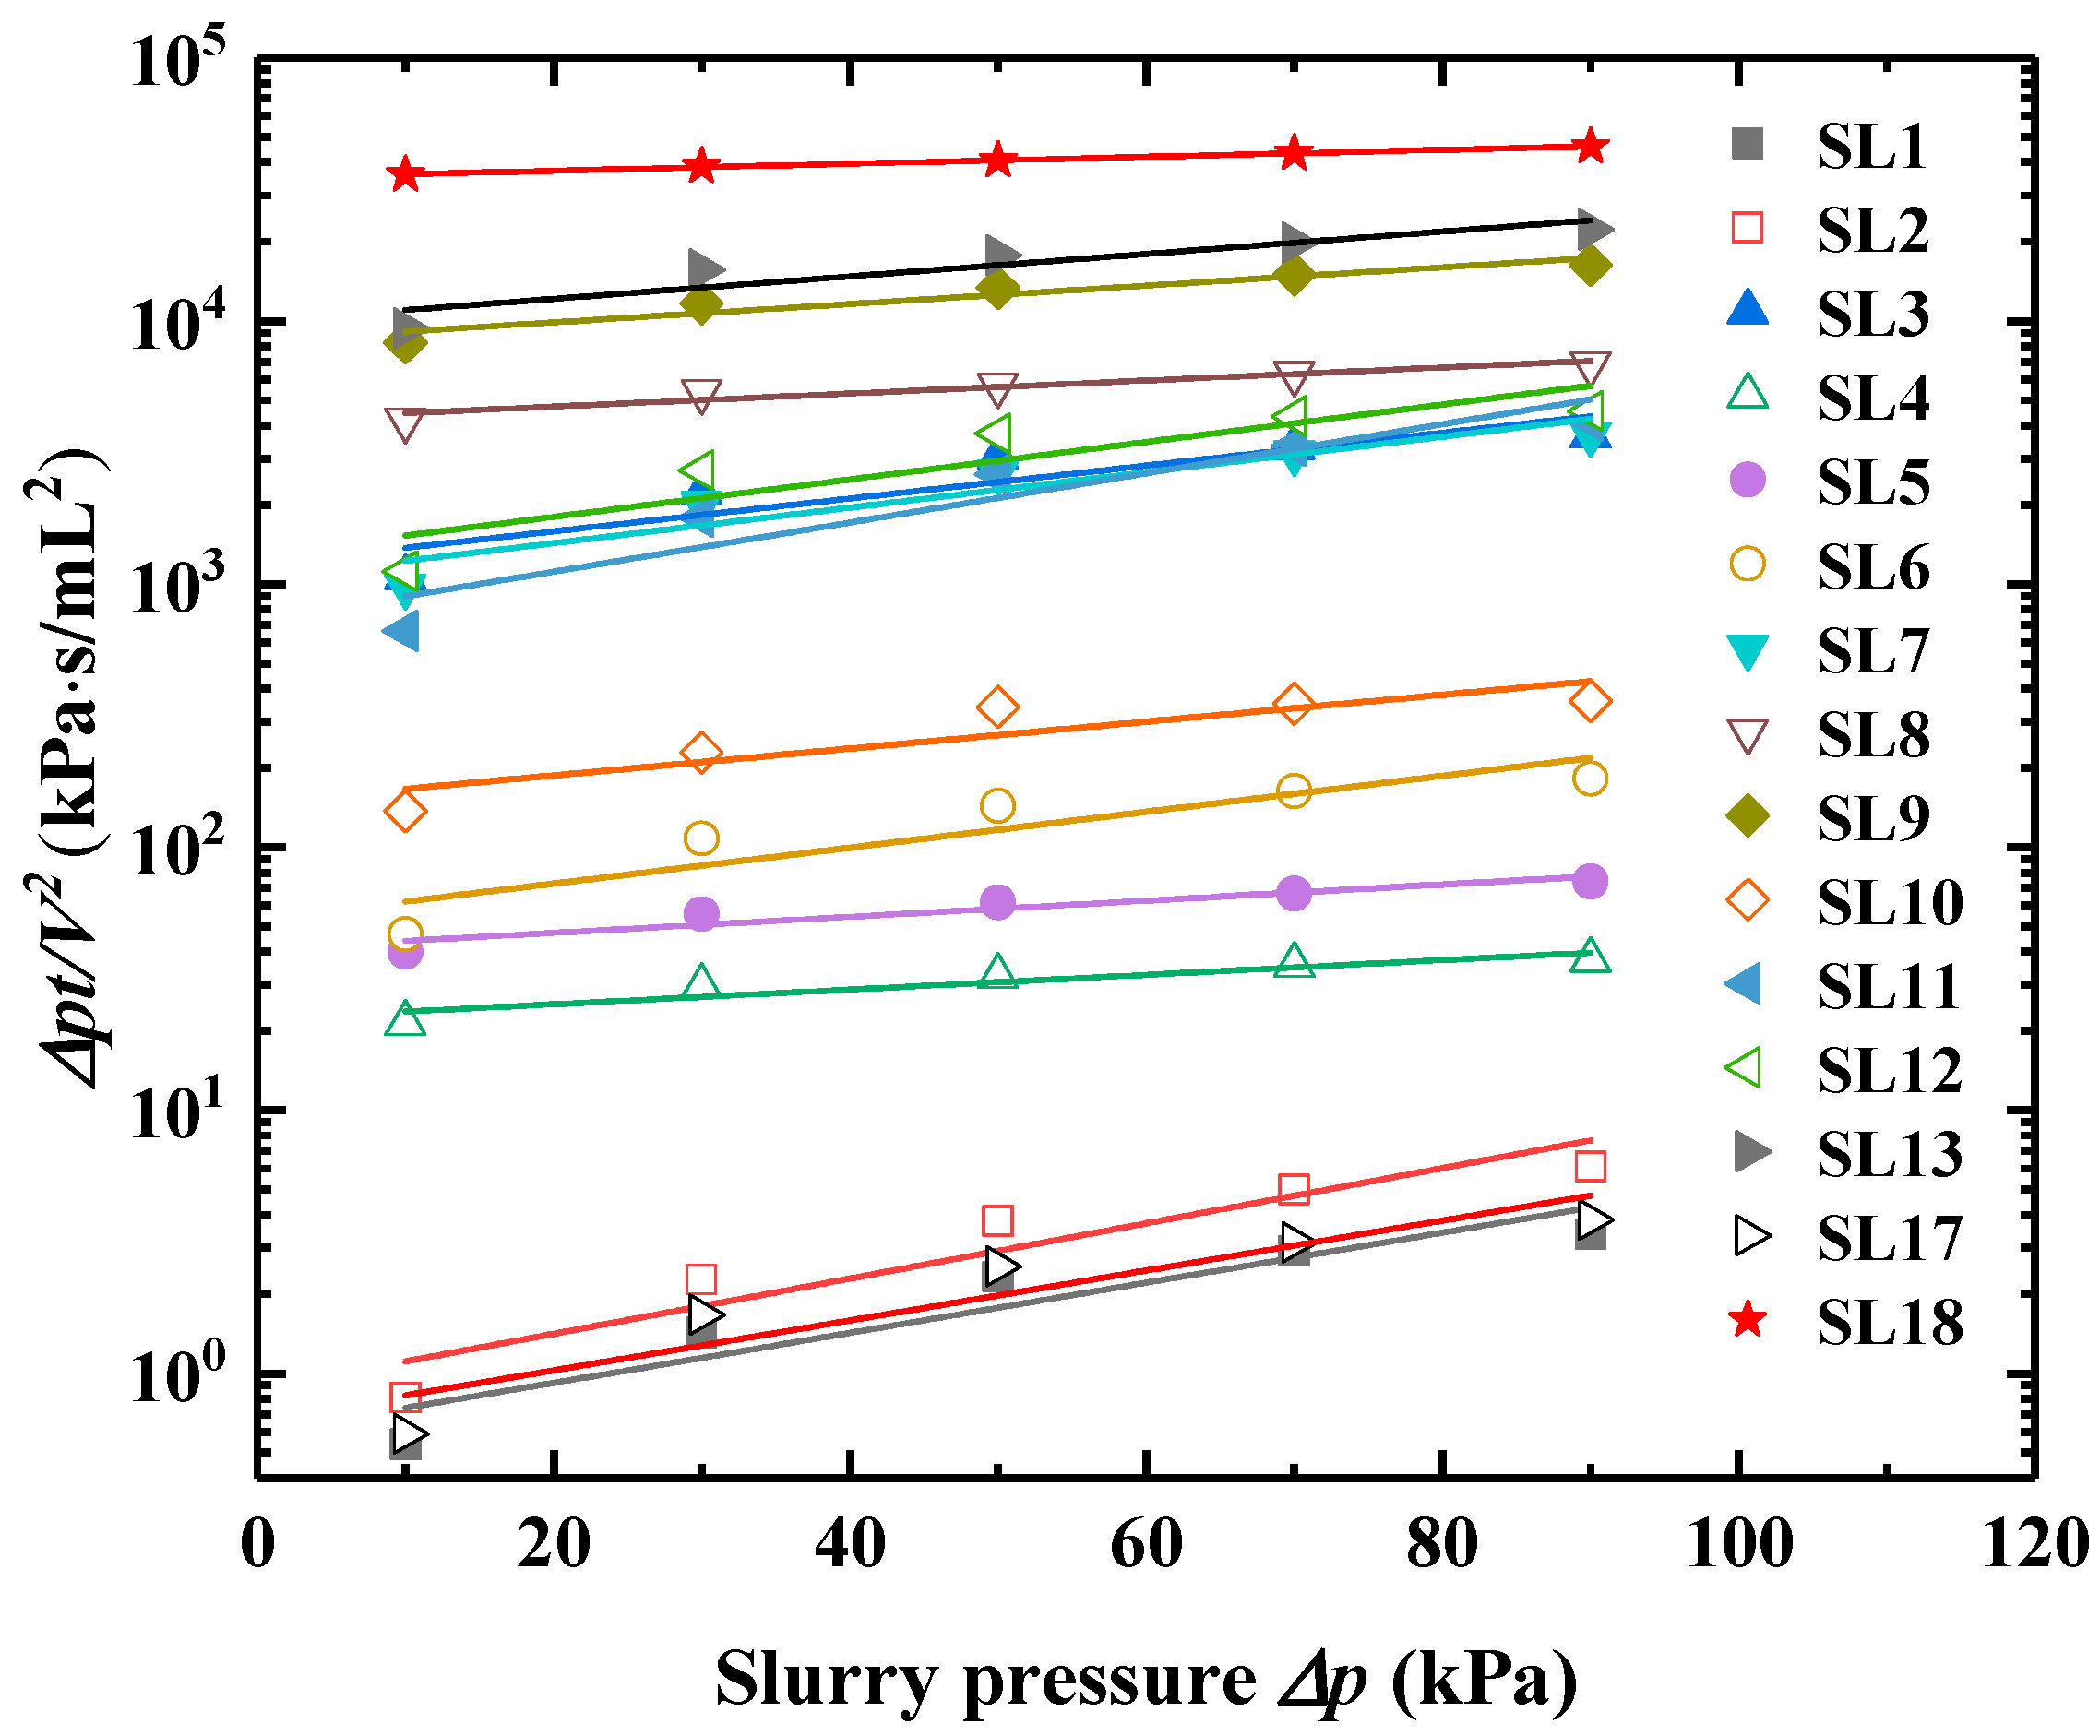
The relationship between ∆p and ∆pt/V2 for each group of slurry specimens is shown in Figure 9. A linear fit was performed, yielding coefficients of determination (R2) in the range of 0.98 to 0.99 for all slurries. This indicates a highly deterministic relationship, which is corroborated by the high reproducibility of the raw data. The smallest value of ∆pt/V2 was found for SL1, and the largest value of ∆pt/V2 was found for SL15. It indicates that the final filtration loss of SL15 is the smallest, which indicates that the soil cut from the tunnel face mixed into the slurry will make the formed filter cake with better hydraulic conductivity in the project. Comparing the slurry formulations with 1% polymer content (see Table 2), SL9 formed the best filter cake hydraulic conductivity.
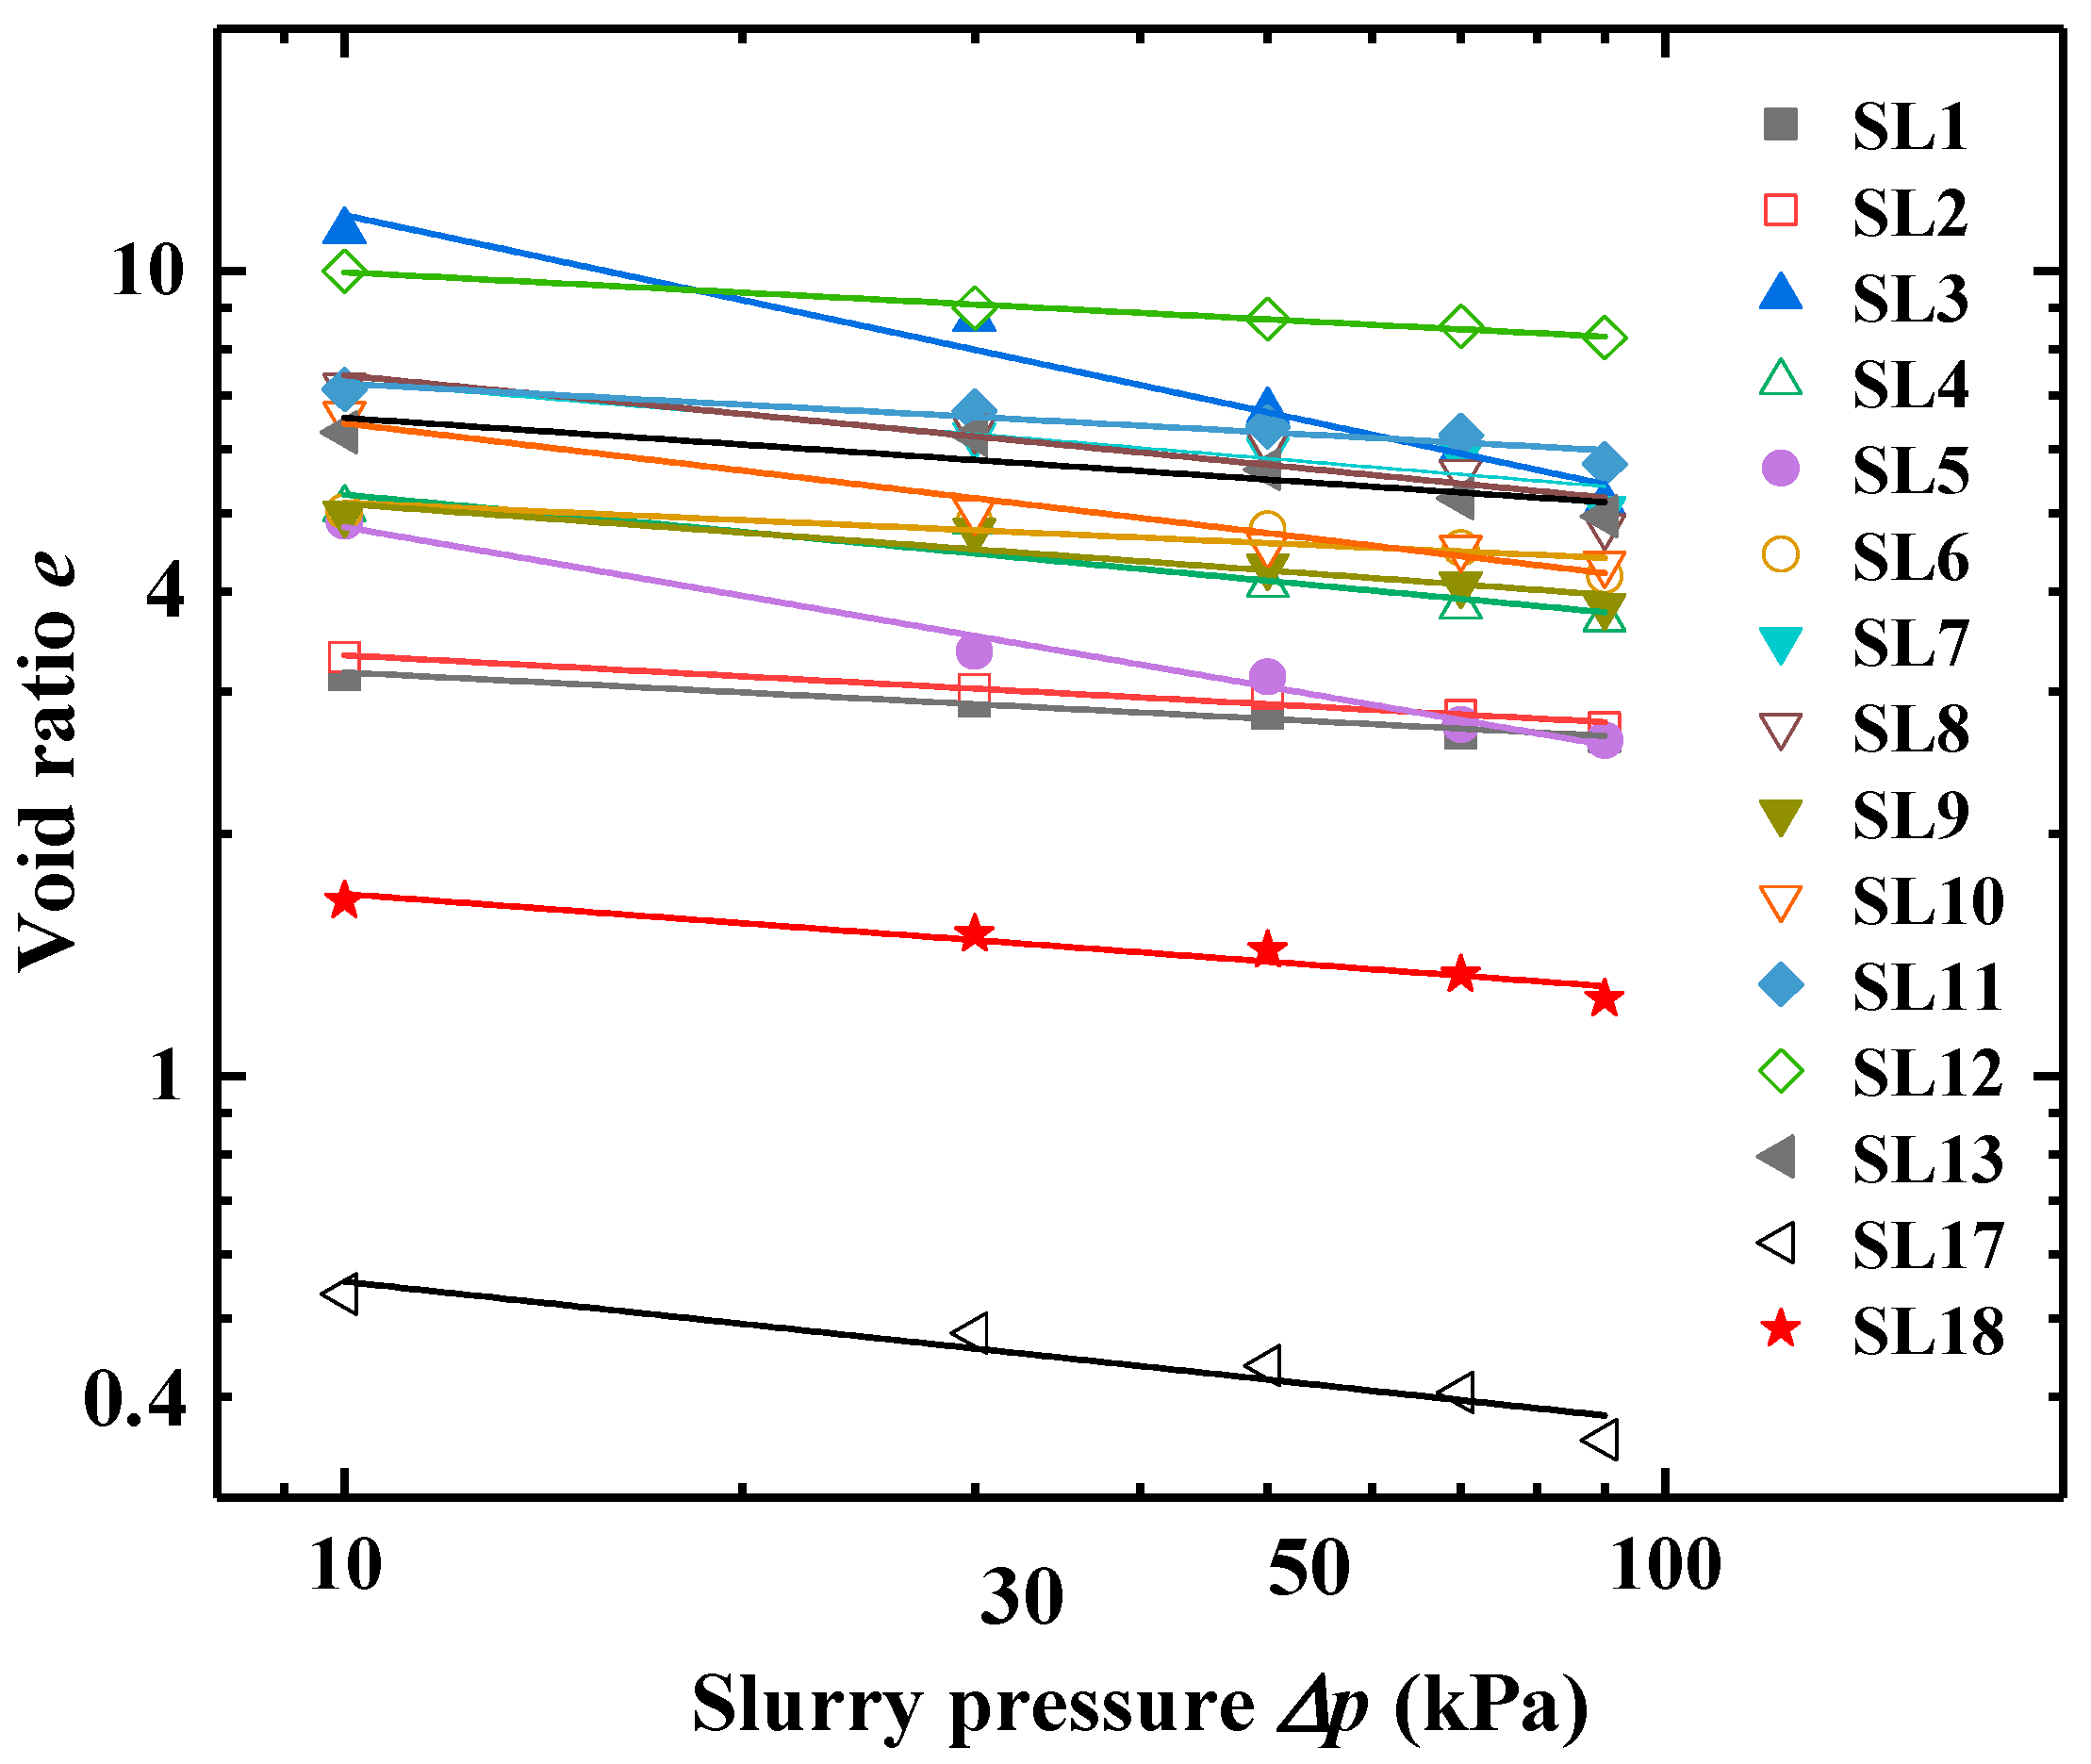
The results of the MFL test showed that all 15 different kind of slurry were able to form filter cake, which is consistent with the results predicted by the criteria of filter cake formation (SL1-13 can create filter cake). The relationship between e and ∆p was obtained (see Figure 10). It can be seen that except for the slurry with the addition of QT, e of all the slurries is much more than 1, indicating that the filter cake has high compressibility. e decreases with increasing ∆p, implying that the higher the ∆p the higher the density of the filter cake. For the same concentration of bentonite slurry, the void ratio of the filter cake with the addition of polymeric materials is significantly larger than that of the pure bentonite filter cake. The void ratio of the slurry SL3 with APAM is the largest, which is 2.5 times higher than that of the pure bentonite slurry SL1 with the same concentration. The void ratio of the filter cake formed by slurry SL14 and 15 is relatively small due to the larger QT clay particles. This means that the larger the slurry particles, the smaller the void ratio of the filter cake formed.
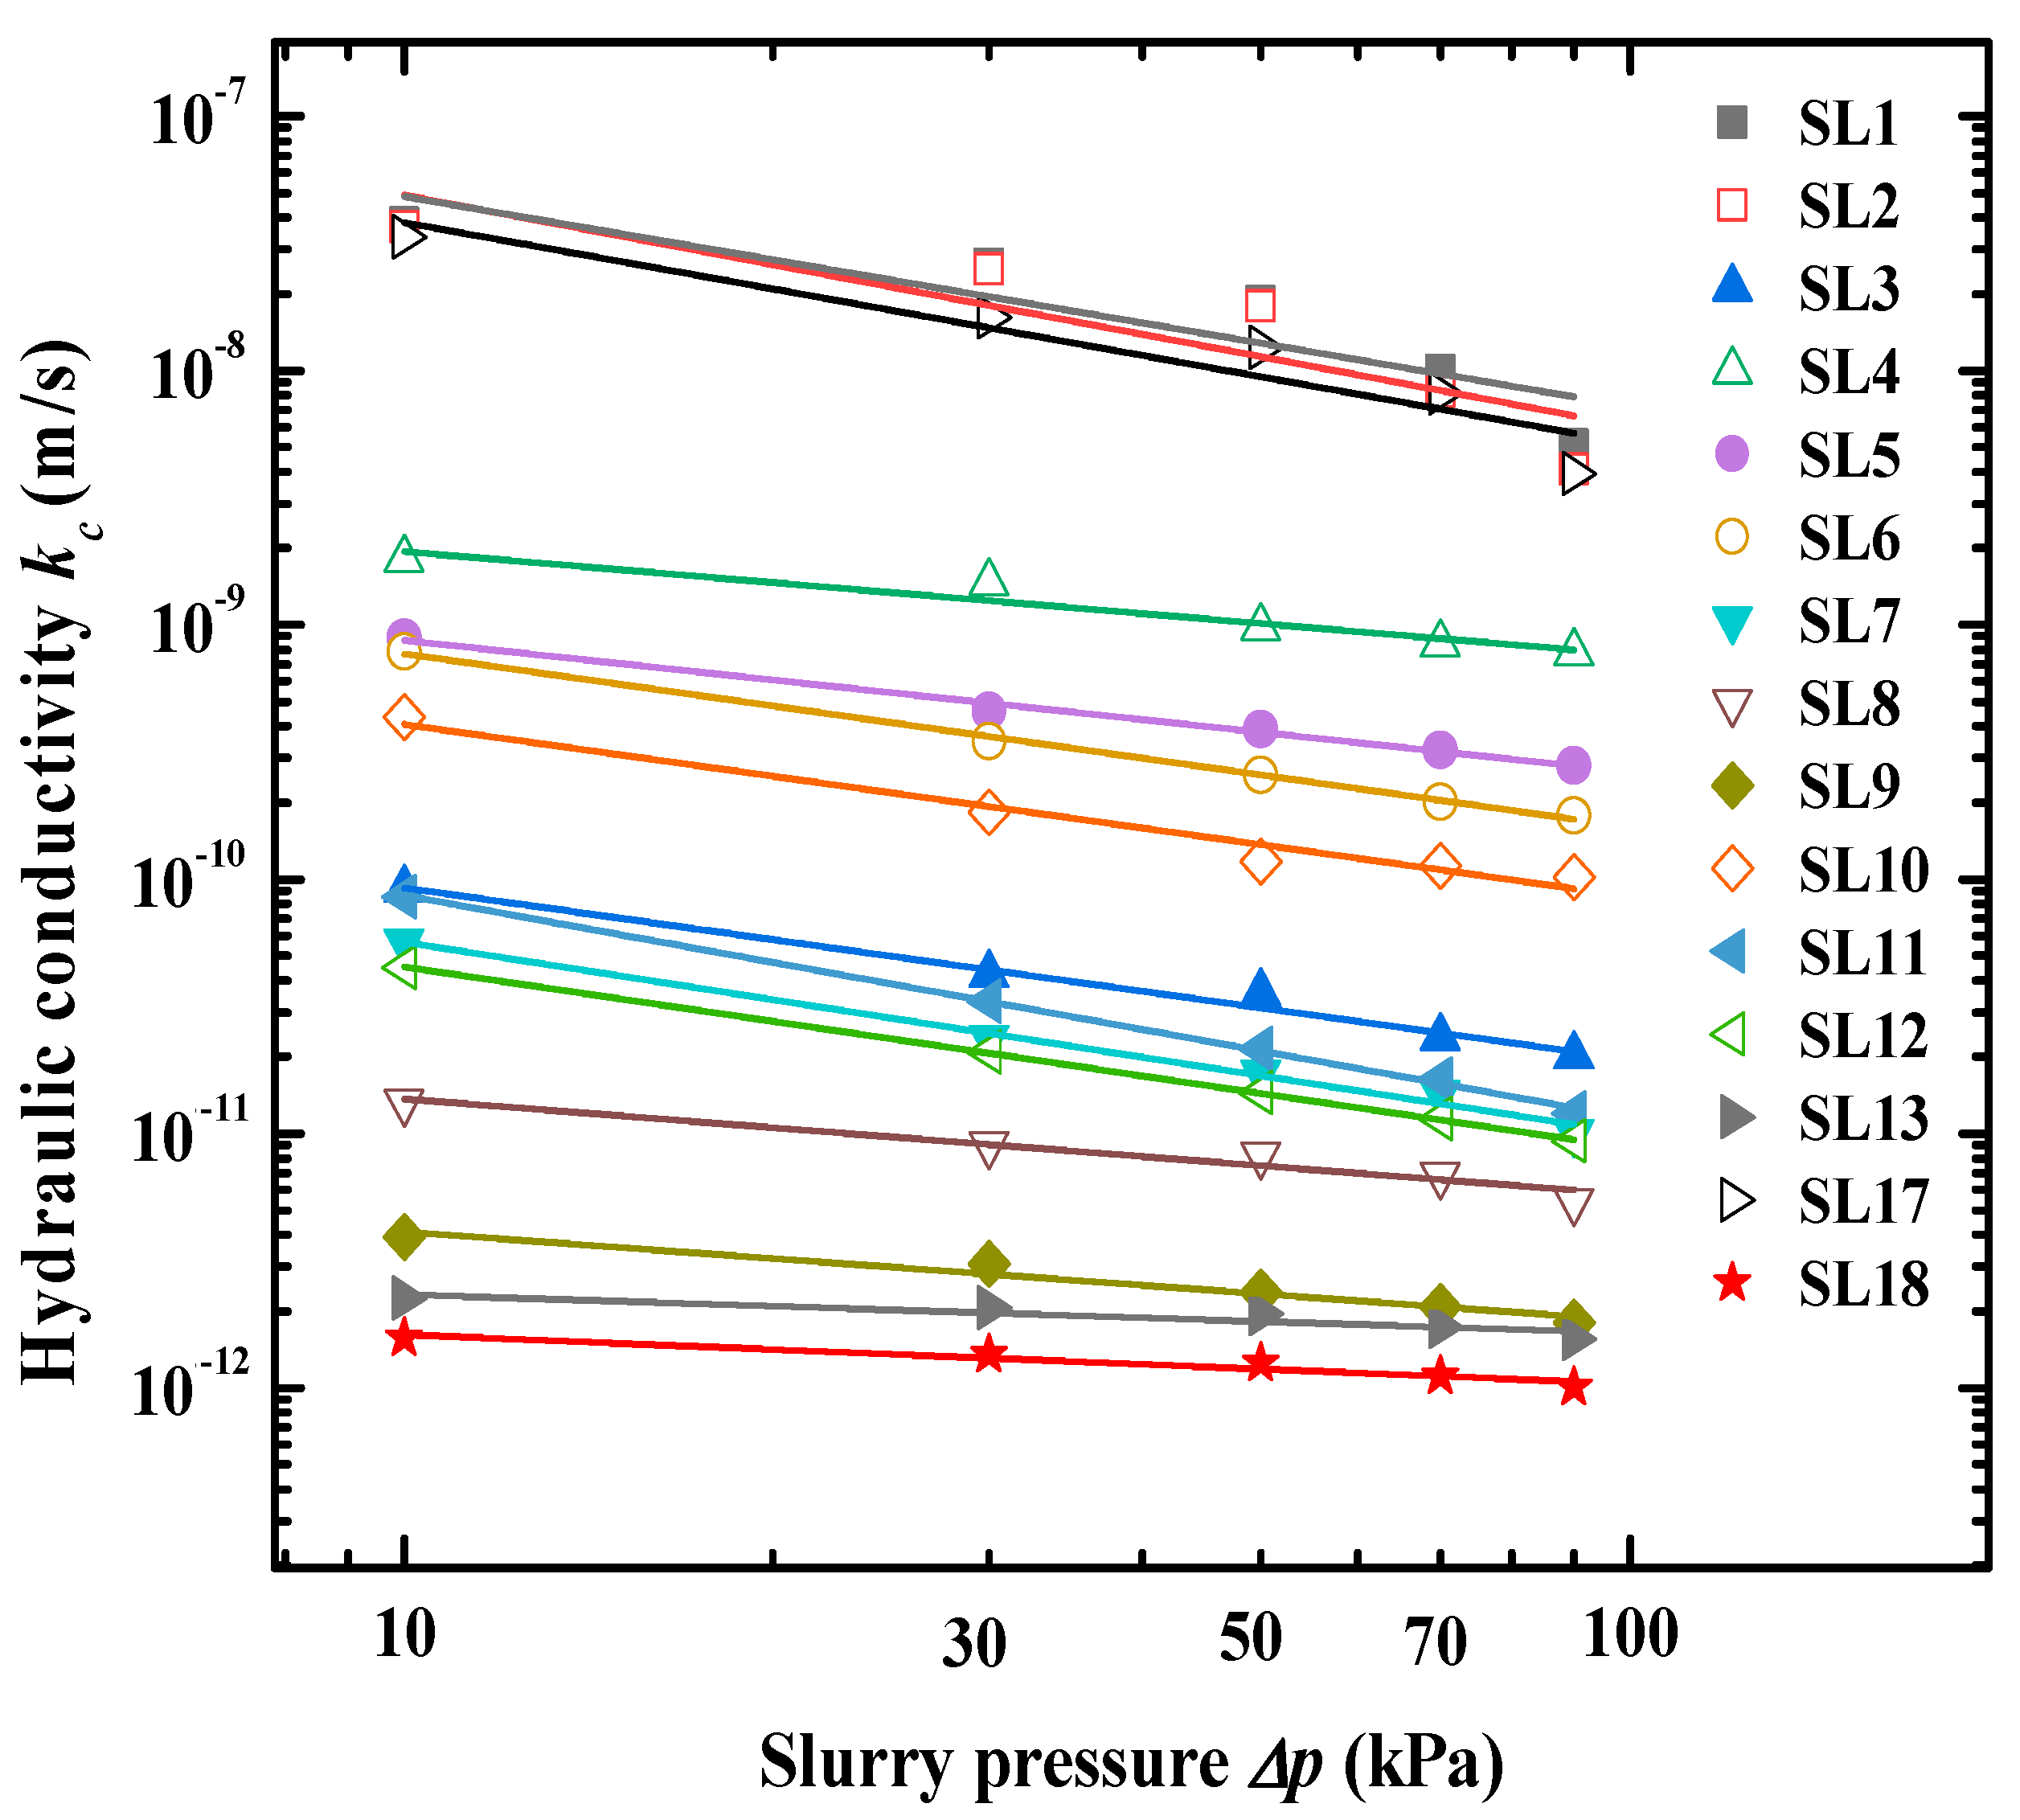
According to Equations (8) and (9), kc can be obtained by measuring e and Cm. The relationship between kc and ∆p for each specimen is shown in Figure 11. As shown in Figure 11, kc and e decreases as the slurry pressure increases. This indicates that an increase in test pressure causes a decrease in e and thus a decrease in kc. Except for the slurry SL1, 2 and 14 without adding polymer materials, kc of all the specimens was more minor than 1 × 10⁻⁸ m/s, which met the requirements for the hydraulic conductivity of filter cake in slurry shield projects.

5.4. Filter Cake Hydraulic Conductivity

The hydraulic conductivity and void ratios of the filter cake were obtained from MFL tests (see Figure 10 and Figure 11), and the constitutive parameters of the filter cake were obtained from the curve relationships in Figure 10 and Figure 11 (see Table 5). The constitutive parameters of the filter cake presented in Table 5 were obtained from the curve fitting of the MFL test results. For each slurry, the data points (filtrate volume, V, versus time, t) from the three parallel tests were averaged at each time interval to generate a single, representative dataset for curve fitting. This approach ensures the derived parameters are robust and representative. The parallel tests demonstrated high reproducibility. The coefficient of variation for key directly measured outcomes, such as the final filter cake thickness and the total filtrate volume after 3 h, was consistently less than 5% across all slurry types, attesting to the reliability of the experimental data and the constitutive parameters derived therefrom.
As can be seen from Table 5, the distribution of filter cake parameters ranged from 0.152 ≤ α ≤ 0.925, 2.52 × 10⁻¹² m/s ≤ k0 ≤ 3.97 × 10⁻⁷ m/s, 0.0714 ≤ δ ≤ 0.3509, 0.8287 ≤ e0 ≤ 26.3087. Among them, the value of k0 reflects the magnitude of the hydraulic conductivity of the filter cake. It was found that the SL15 slurry with the addition of CMC-Na had the smallest value of k0, indicating that the addition of CMC-Na can effectively reduce the hydraulic conductivity of the filter cake. kc and e at the specified slurry pressure can be obtained from the data in Table 5 using Equations (11) and (12).
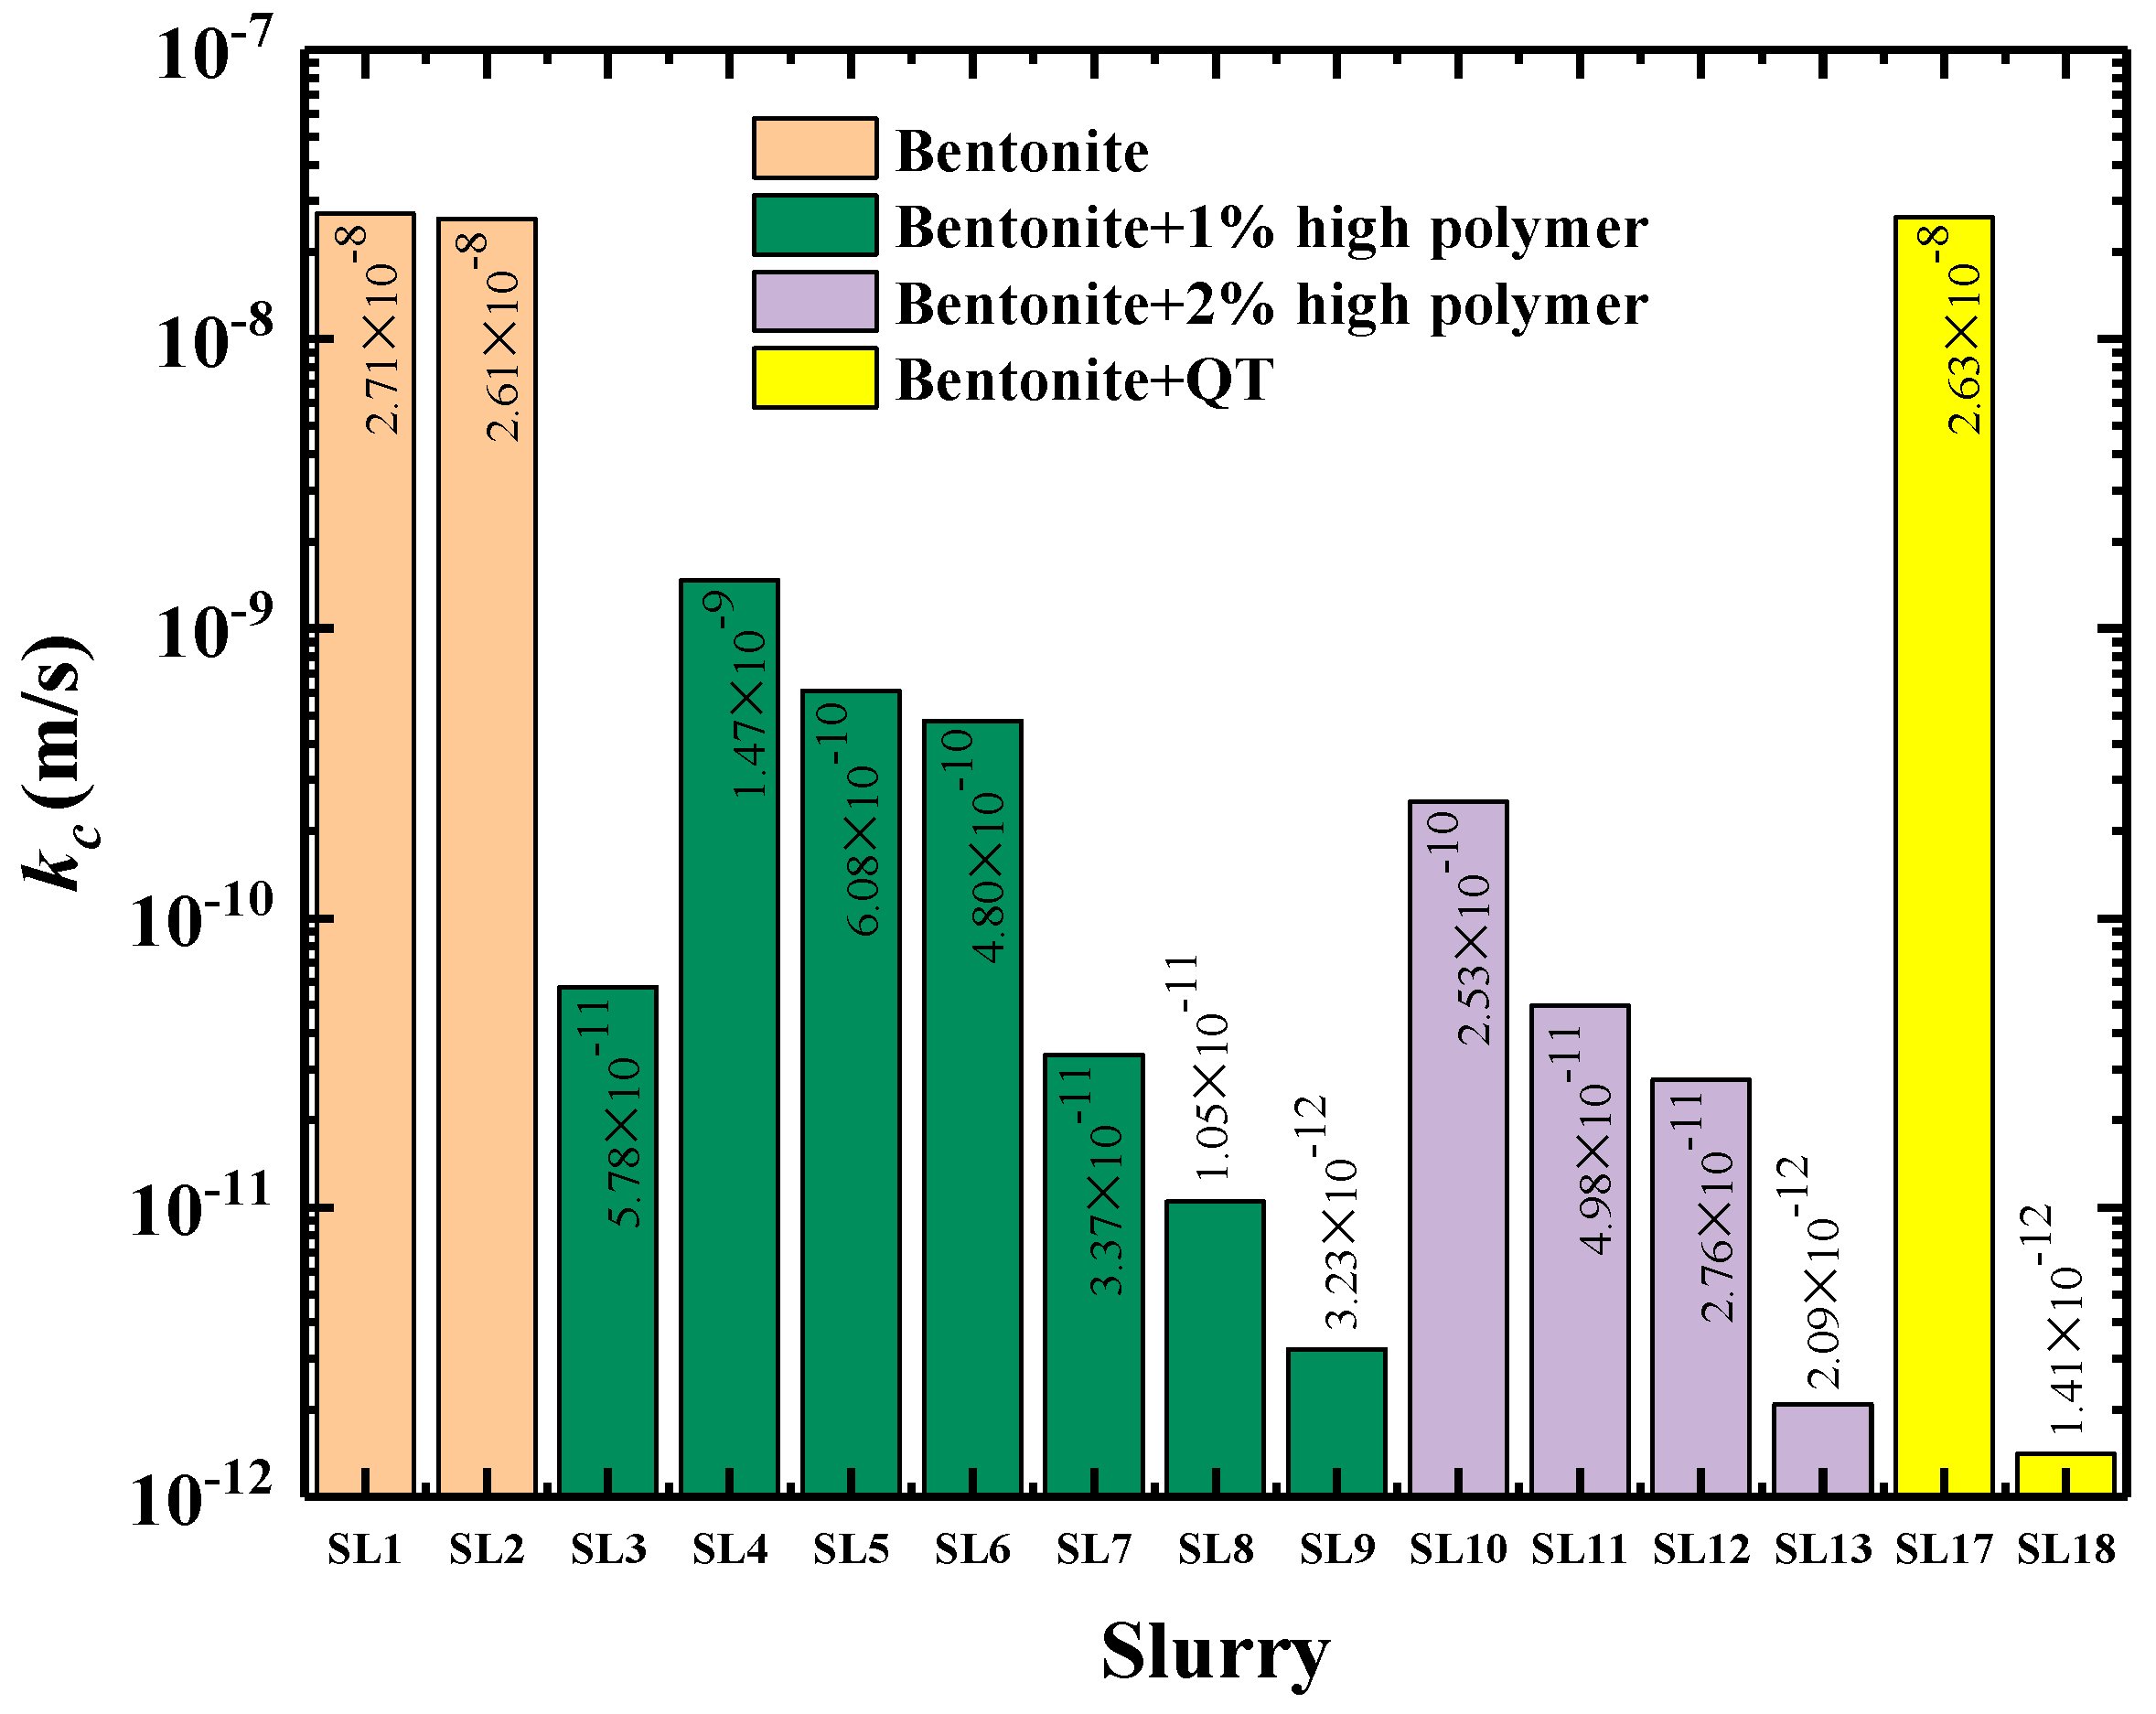
kc for ∆p = 20 kPa was obtained using Equation (11) based on Table 5 (see Figure 12). The average hydraulic conductivity of the filter cakes ranged from 1.41 × 10⁻¹² to 2.71 × 10⁻⁸ m/s. The significant difference in the average hydraulic conductivity of filter cakes mainly lies in the various basic properties of the slurry. For slurries with a polymer content of 1%, slurry SL9 with CMC-Na added formed the most miniature filter cake hydraulic conductivity (3.23 × 10⁻¹² m/s), which is one ten thousandths of the hydraulic conductivity of pure bentonite slurry SL1 with the same concentration (2.71 × 10⁻⁸ m/s), four orders of magnitude smaller. It can also be observed from Figure 12 that the average hydraulic conductivity of the slurry with adding QT becomes smaller, but the magnitude of the decrease varies. The hydraulic conductivity of slurry SL14 without adding polymeric material is reduced by 3.4% compared to SL1. In comparison, the hydraulic conductivity of slurry SL15 with polymeric material is reduced by 33.3% compared to SL9.
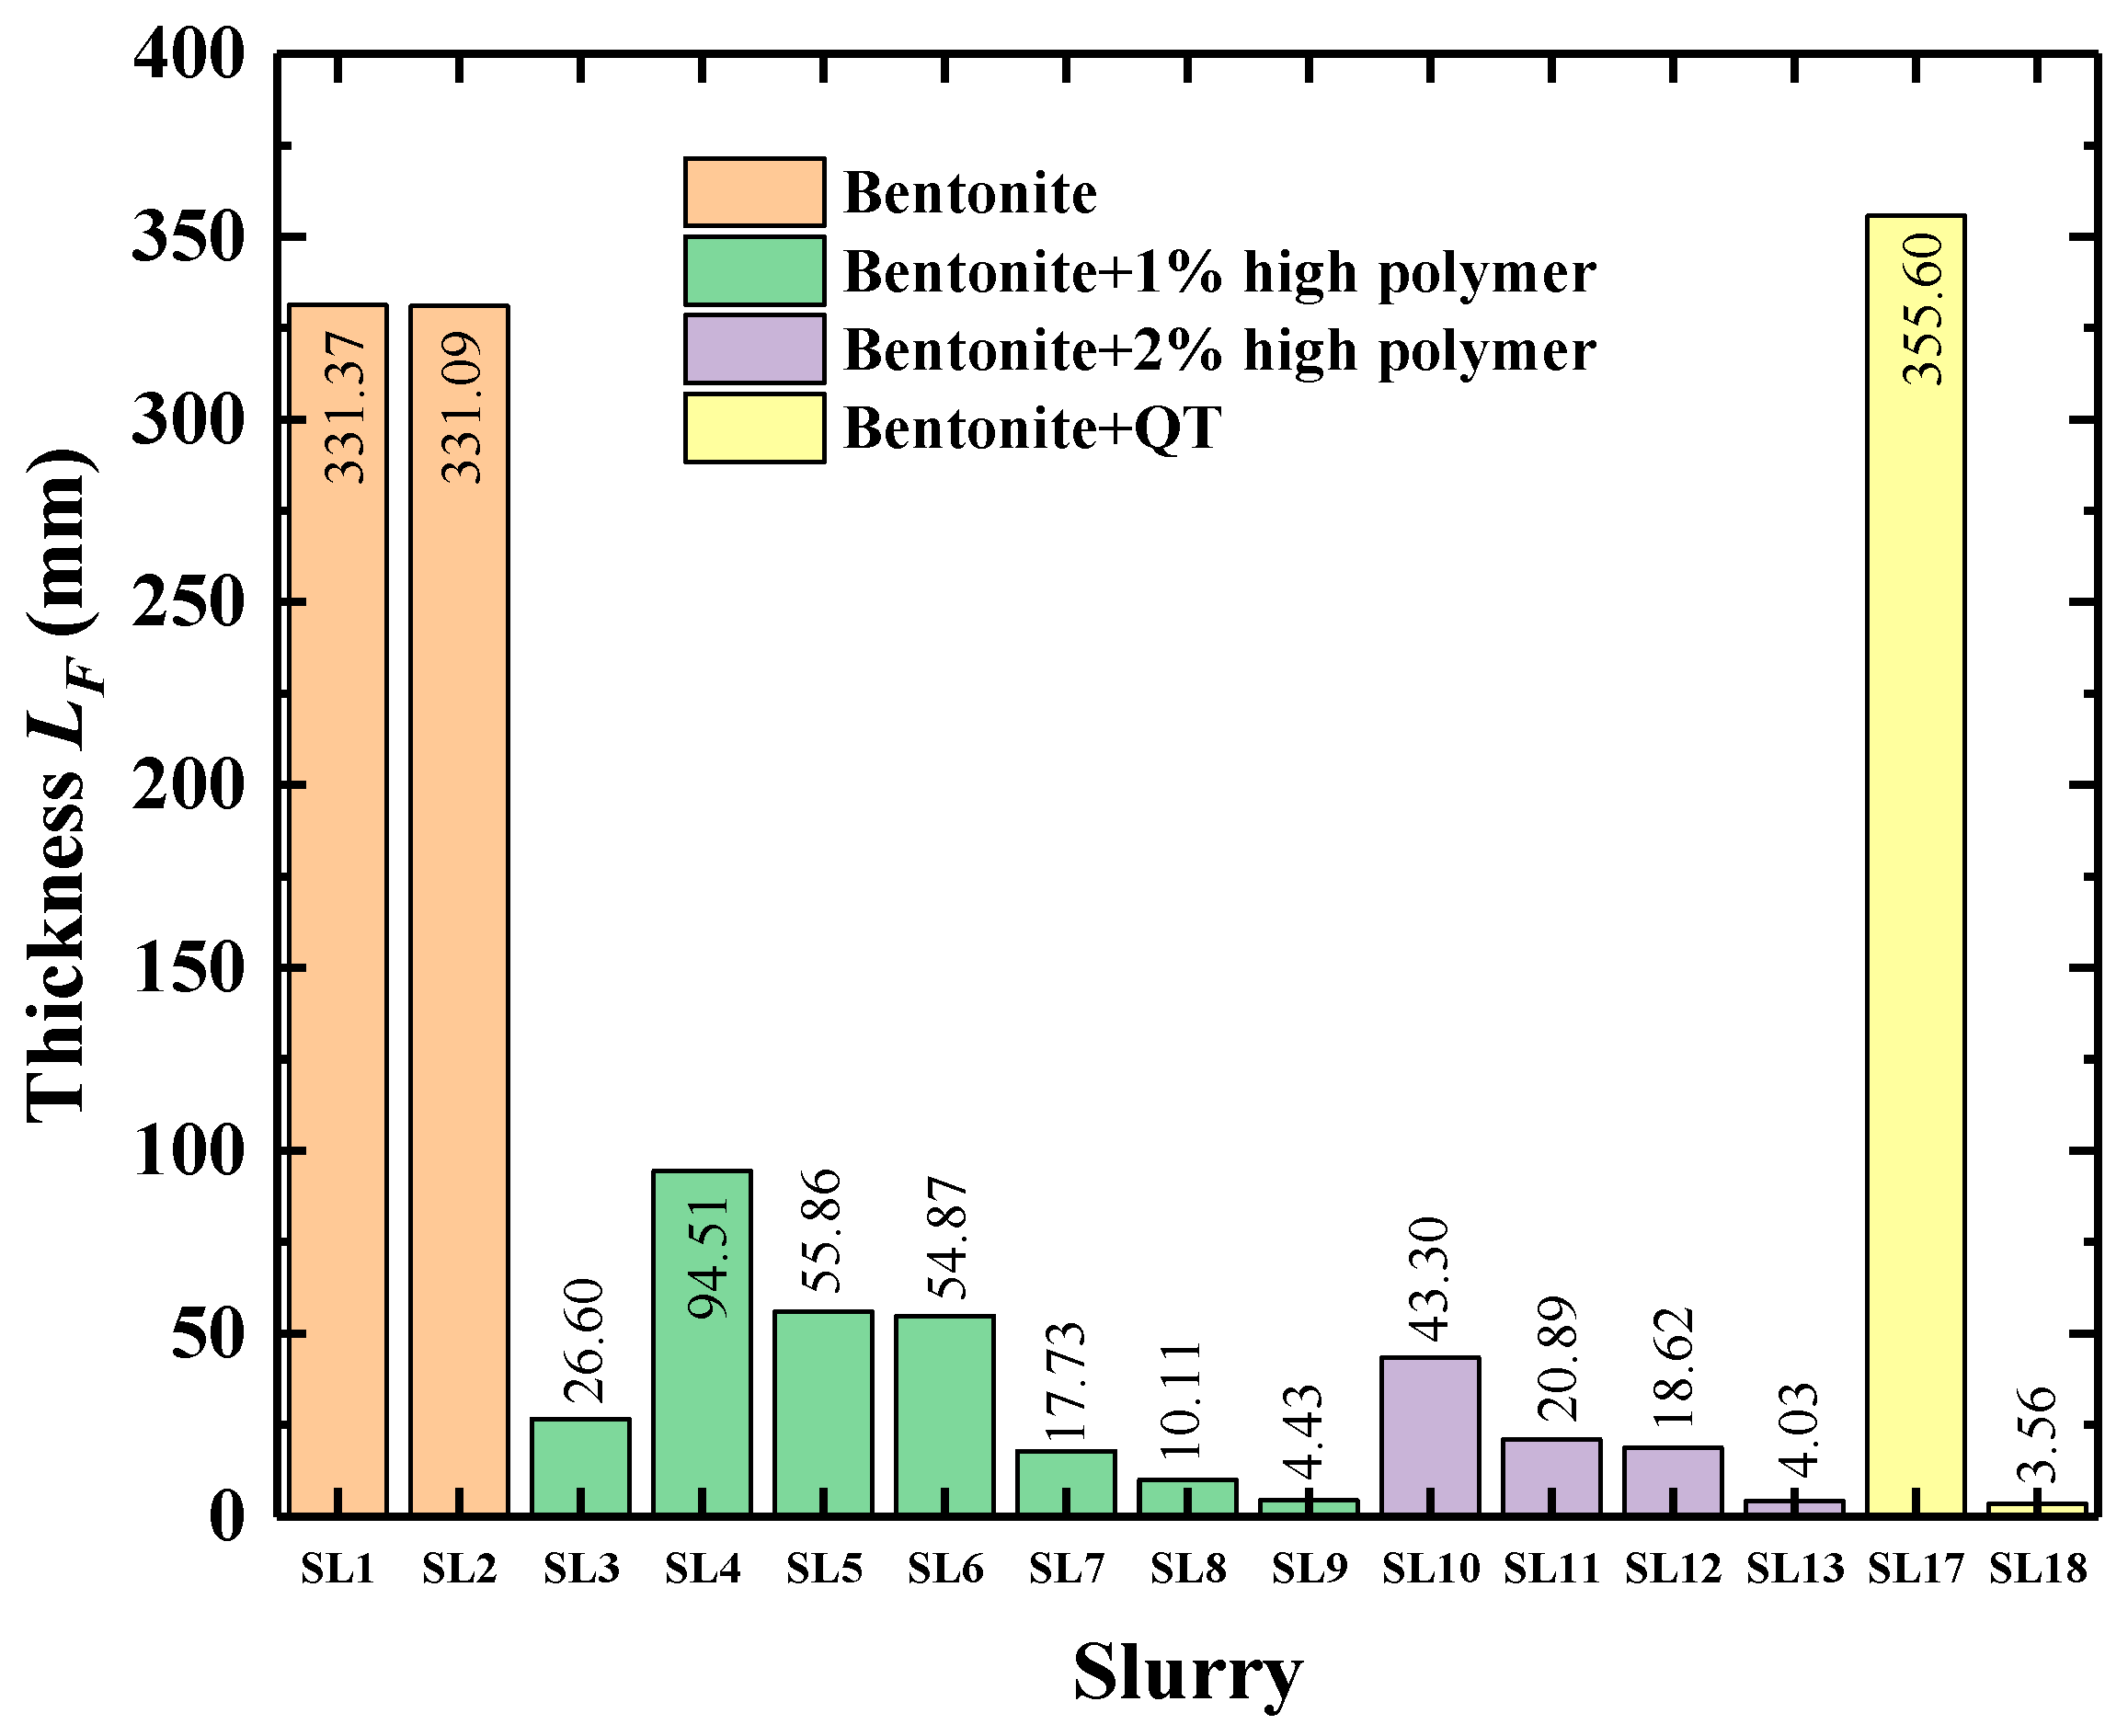
The filter cake thickness LF at ∆p = 20 kPa and t = 10 s was calculated from the data in Table 5 using Equation (15) to obtain the relationship between filter cake thickness LF and kc (see Figure 13). At 10 s of the dynamic filter cake formation period, the filter cake thickness of SL14 with QT was the largest at 355.60 μm. The filter cake thickness of pure bentonite slurry SL1 and SL2 was the second largest at 331.37 μm and 331.09 μm. The thickness of the filter cake was significantly reduced by the addition of polymeric materials, ranging from 4.03 μm to 94.51 μm. Compared with pure bentonite slurry, the filter cake thickness was reduced by 71.5% to 98.7%. The filter cake thickness of SL9 and SL13 with CMC-Na was the smallest, only 4.43 μm and 4.03 μm, which was about 1.3% of pure bentonite slurry with the same concentration.
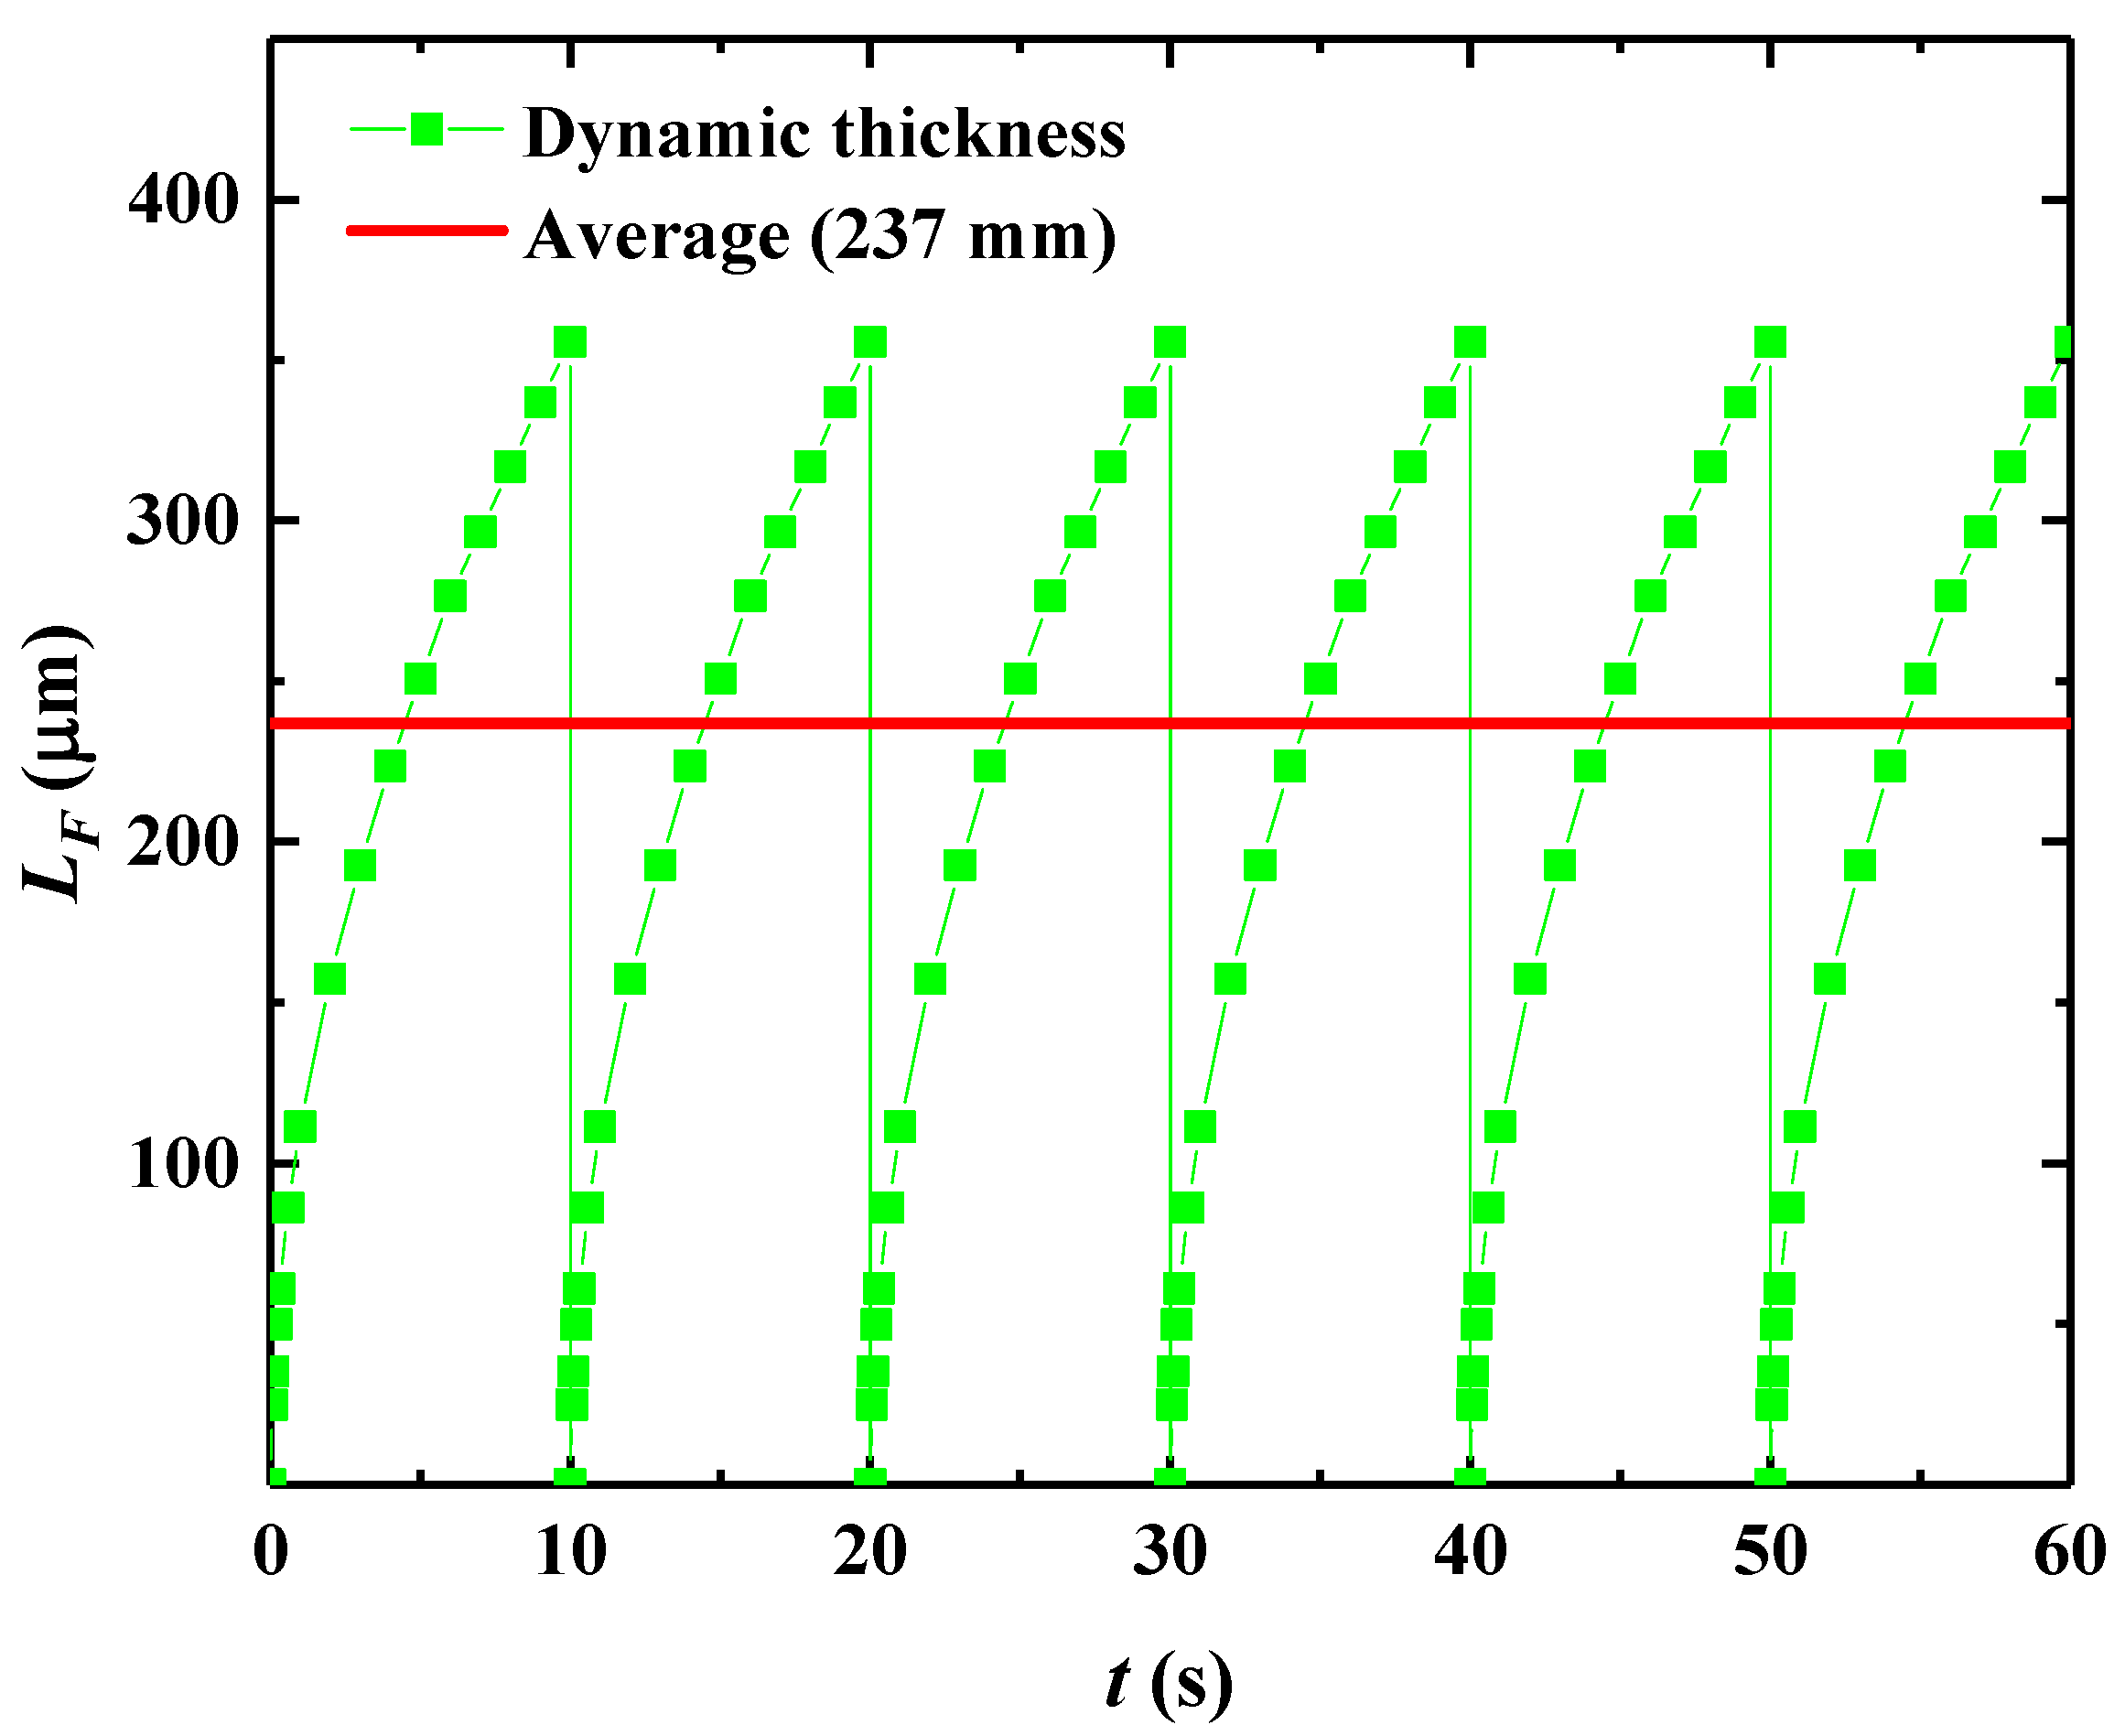
The cutter head periodically cuts the filter cake on the tunnel face during excavation, the filter cake thickness changes regularly with the development of time and cannot be quantitatively analyzed in engineering. Therefore, the filter cake thickness is integrated over each cutting cycle to calculation the average filter cake thickness as follows.
L ¯ F = 1 θ s 0 θ s L F Δ p , θ d θ = 2 3 2 Δ p k c β θ s γ w w ,
where L ¯ F is the average thickness of the filter cake (μm), θs is the angle between adjacent spokes, w is the angular speed of the cutter (rad/s).
Taking slurry SL14 as an example, when ∆p = 20 kPa, the variation in the filter cake over 10 s of the cutter cutting cycle is obtained (see Figure 14). It can be seen that the filter cake thickness varies cyclically in 10 s cycles. At t = 0 s there is no filter cake formation and the filter cake thickness is 0. As time progresses the filter cake thickness gradually increases until it reaches a maximum of 355.60 μm at t = 10 s. At this point the cutter rotates and the filter cake is cut and the filter cake thickness immediately becomes 0 at the next instant after t = 10 s. However, as the dynamic change in filter cake thickness cannot be quantified in practical engineering, the average thickness of the filter cake (for 2/3 times the maximum filter cake thickness) is obtained using Equation (13), which can be used as an indicator for evaluating filter cake thickness in engineering.

5.5. Relationship Between Dynamic Filter Cake Hydraulic Conductivity and Thickness

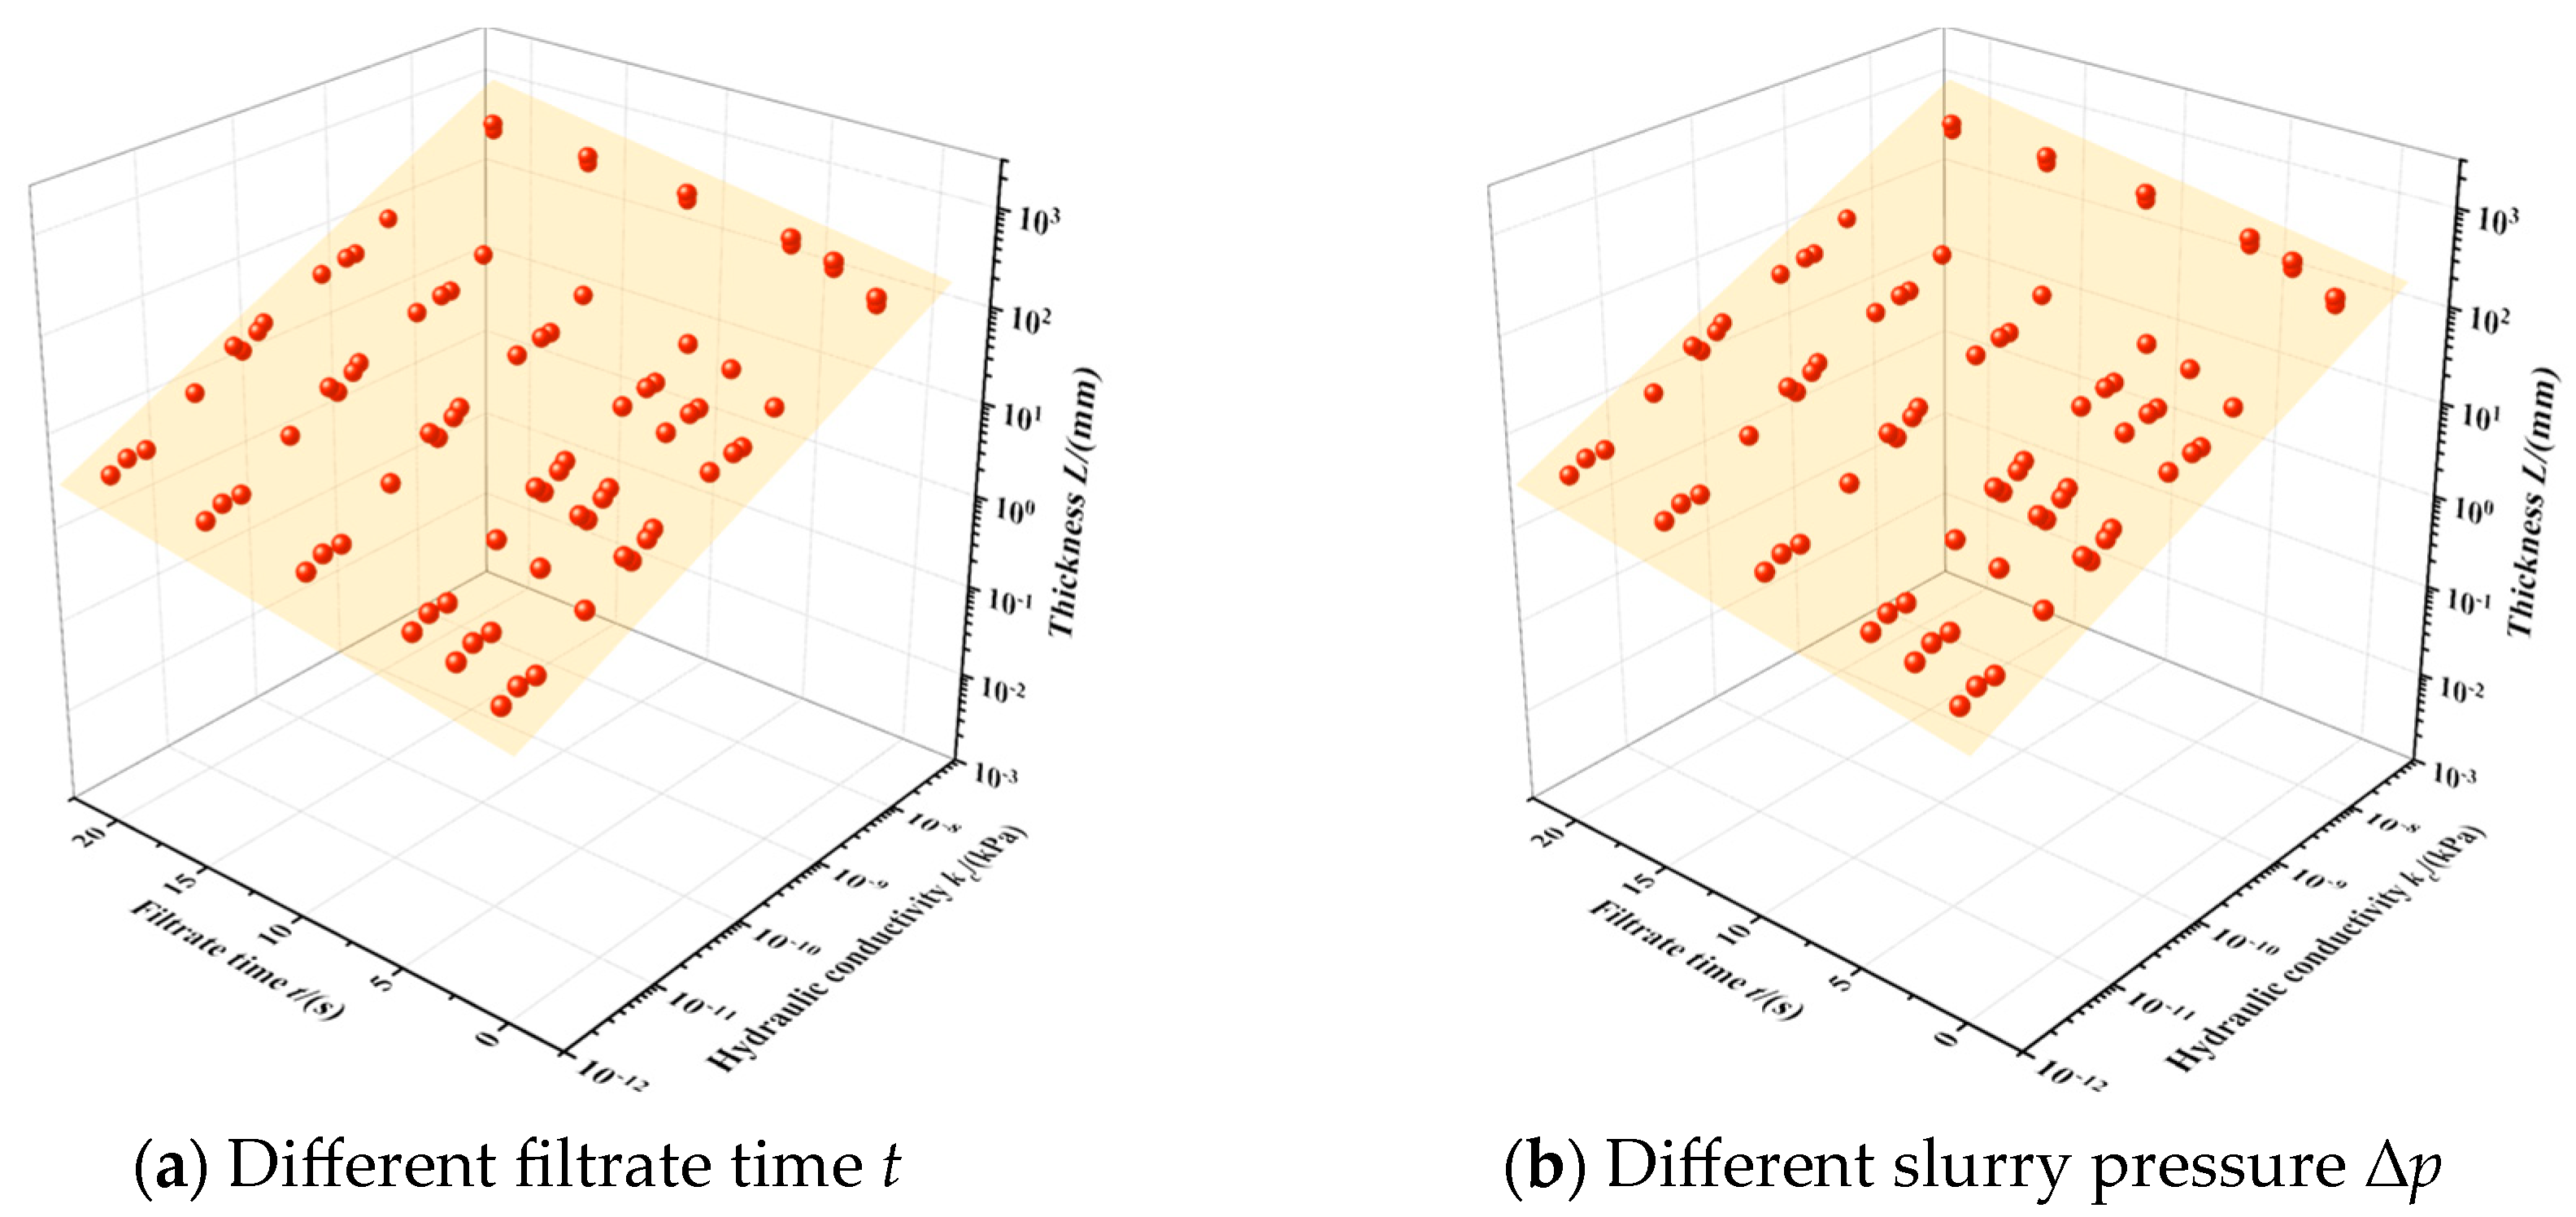
Based on the experimental results and model calculations, the filter cake hydraulic conductivity for SL1 to 13 were obtained as a function of thickness (see Figure 15). It is evident that there is a linear relationship between filter cake hydraulic conductivity and filter cake thickness, and the filter cake thickness increases with the increasing filter cake hydraulic conductivity. It can also be observed from Figure 15a,b that kc is linearly related to LF for different slurry pressure and filtrate time, and lies in the same plane. This indicates that the slope of the relationship between filter cake hydraulic conductivity and filter cake thickness is constant, i.e., the slope a in Equation (14) is stable. The linear relationship between lg(LF) and lg(kc) was obtained using a linear fit, as shown in Table 6. A linear slope a equal to 0.45594 can be obtained, and intercept b increases with increasing slurry pressure and also with increasing filtrate time, indicating that the intercept b is related to Δp and t. Therefore, to express intercept b as a function of slurry pressure, t needs to be specified.
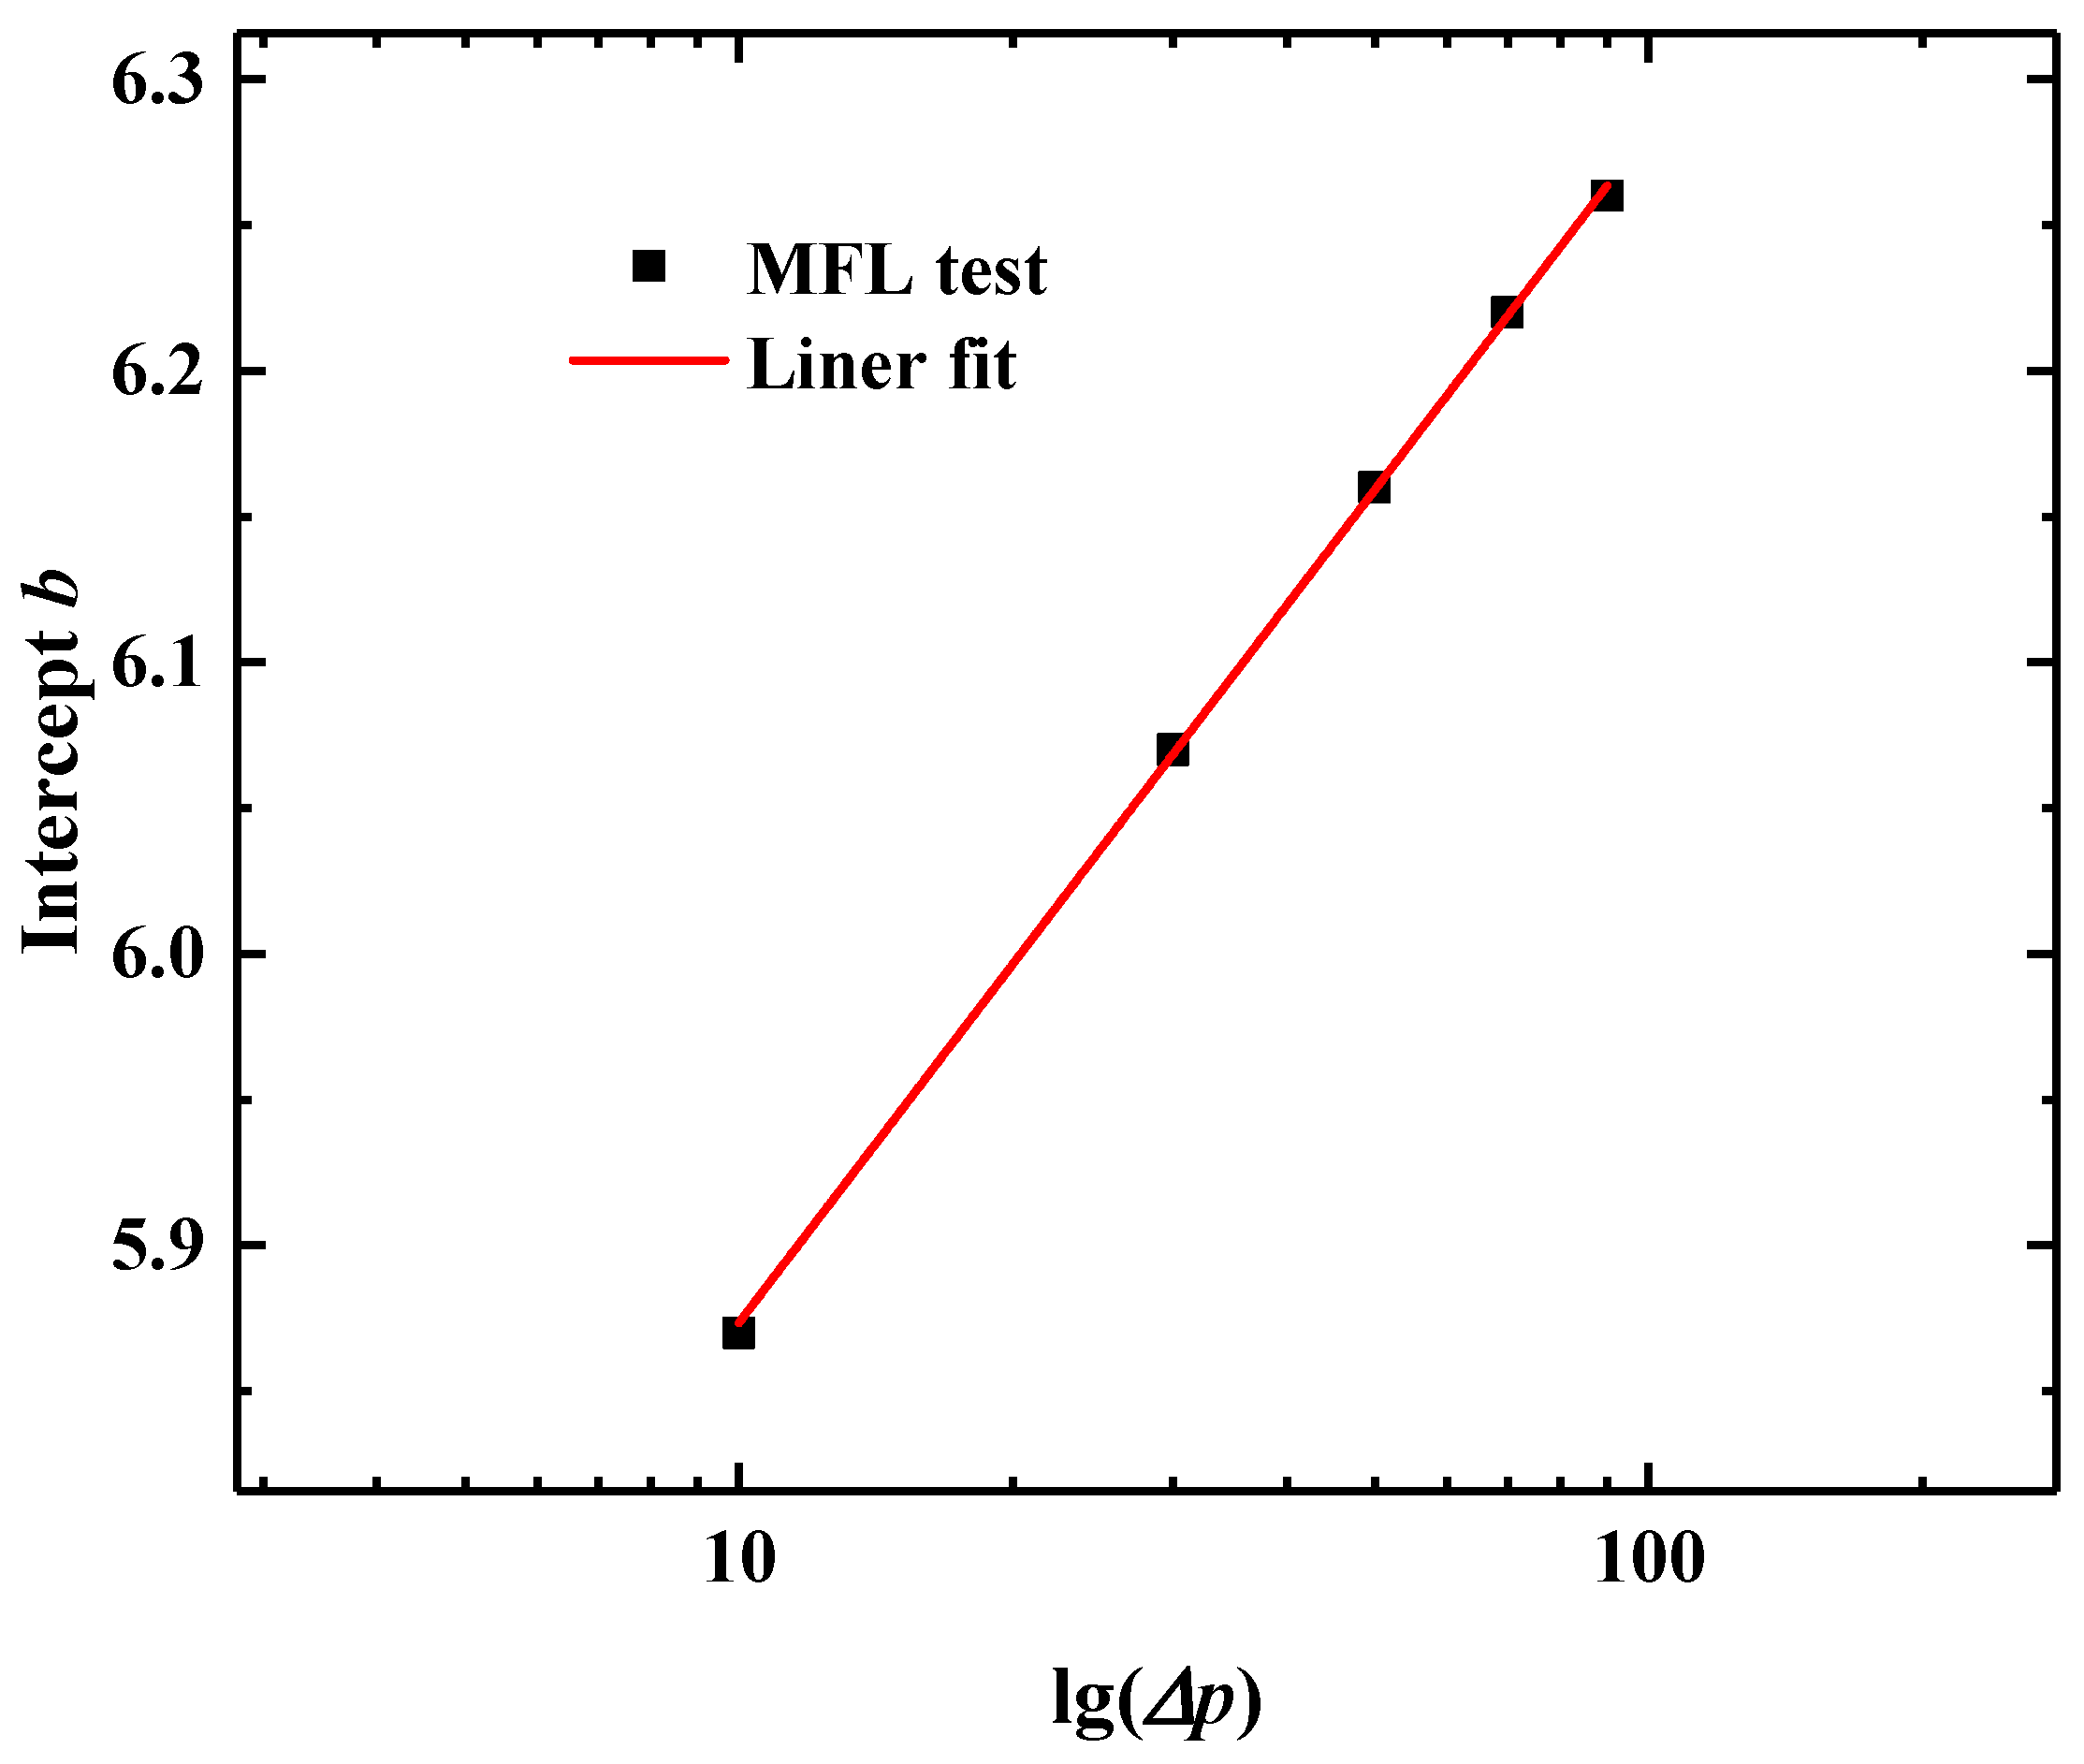
With a specified t, b shows a clear linear relationship with slurry Δp at this point, as shown in Figure 16. An empirical equation between LF and kc was obtained.
k c = 10 lg ( L F ) b a ,
where a is the slope, a = 0.456, b is the intercept, b = lg(Δp) + dc, c and d are calculated parameters.
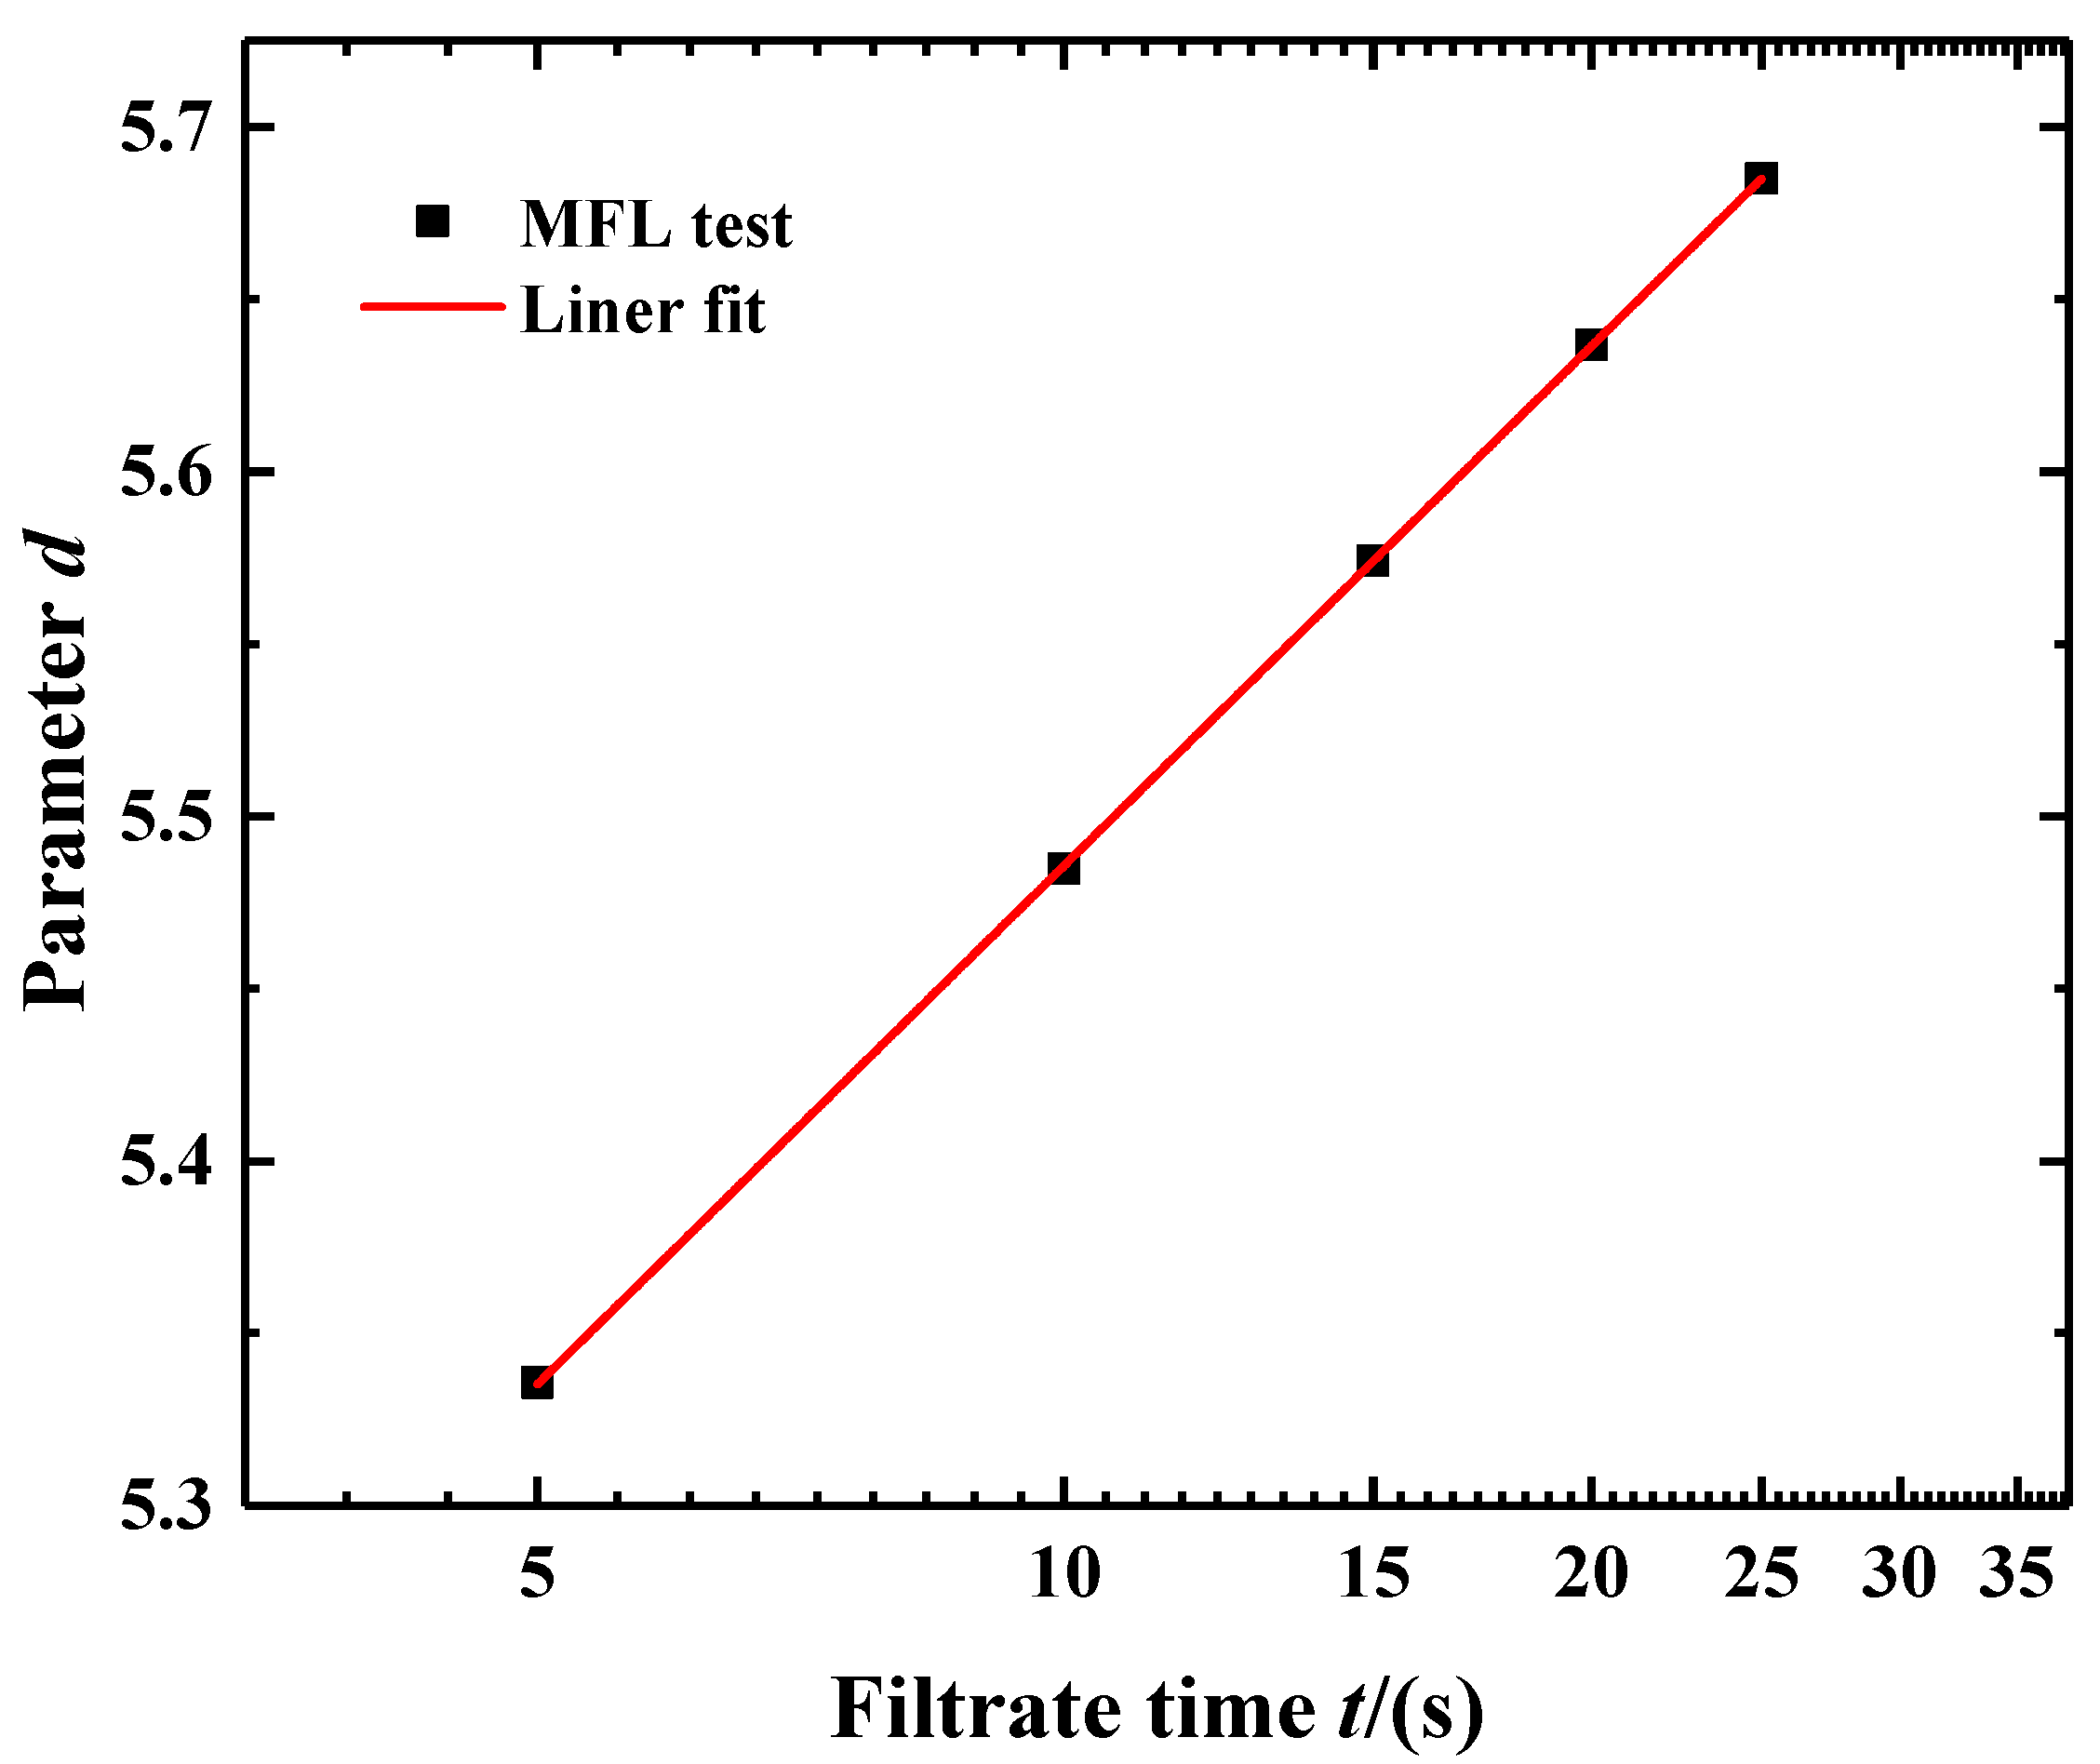
In the functional relationship between kc and LF, c was a constant (c = 0.3966) and the parameter b increased with increasing t (see Figure 17). Due to the uneven distribution of shield blade speed and blade props in actual slurry shield projects, the dynamic filter cake formation period varies. Therefore, the interpolation method can be used to obtain kc as a function of LF for a specified filtrate time via Figure 17. It should be noted that Equation (14) needs to be used with similar properties to SL1-13.
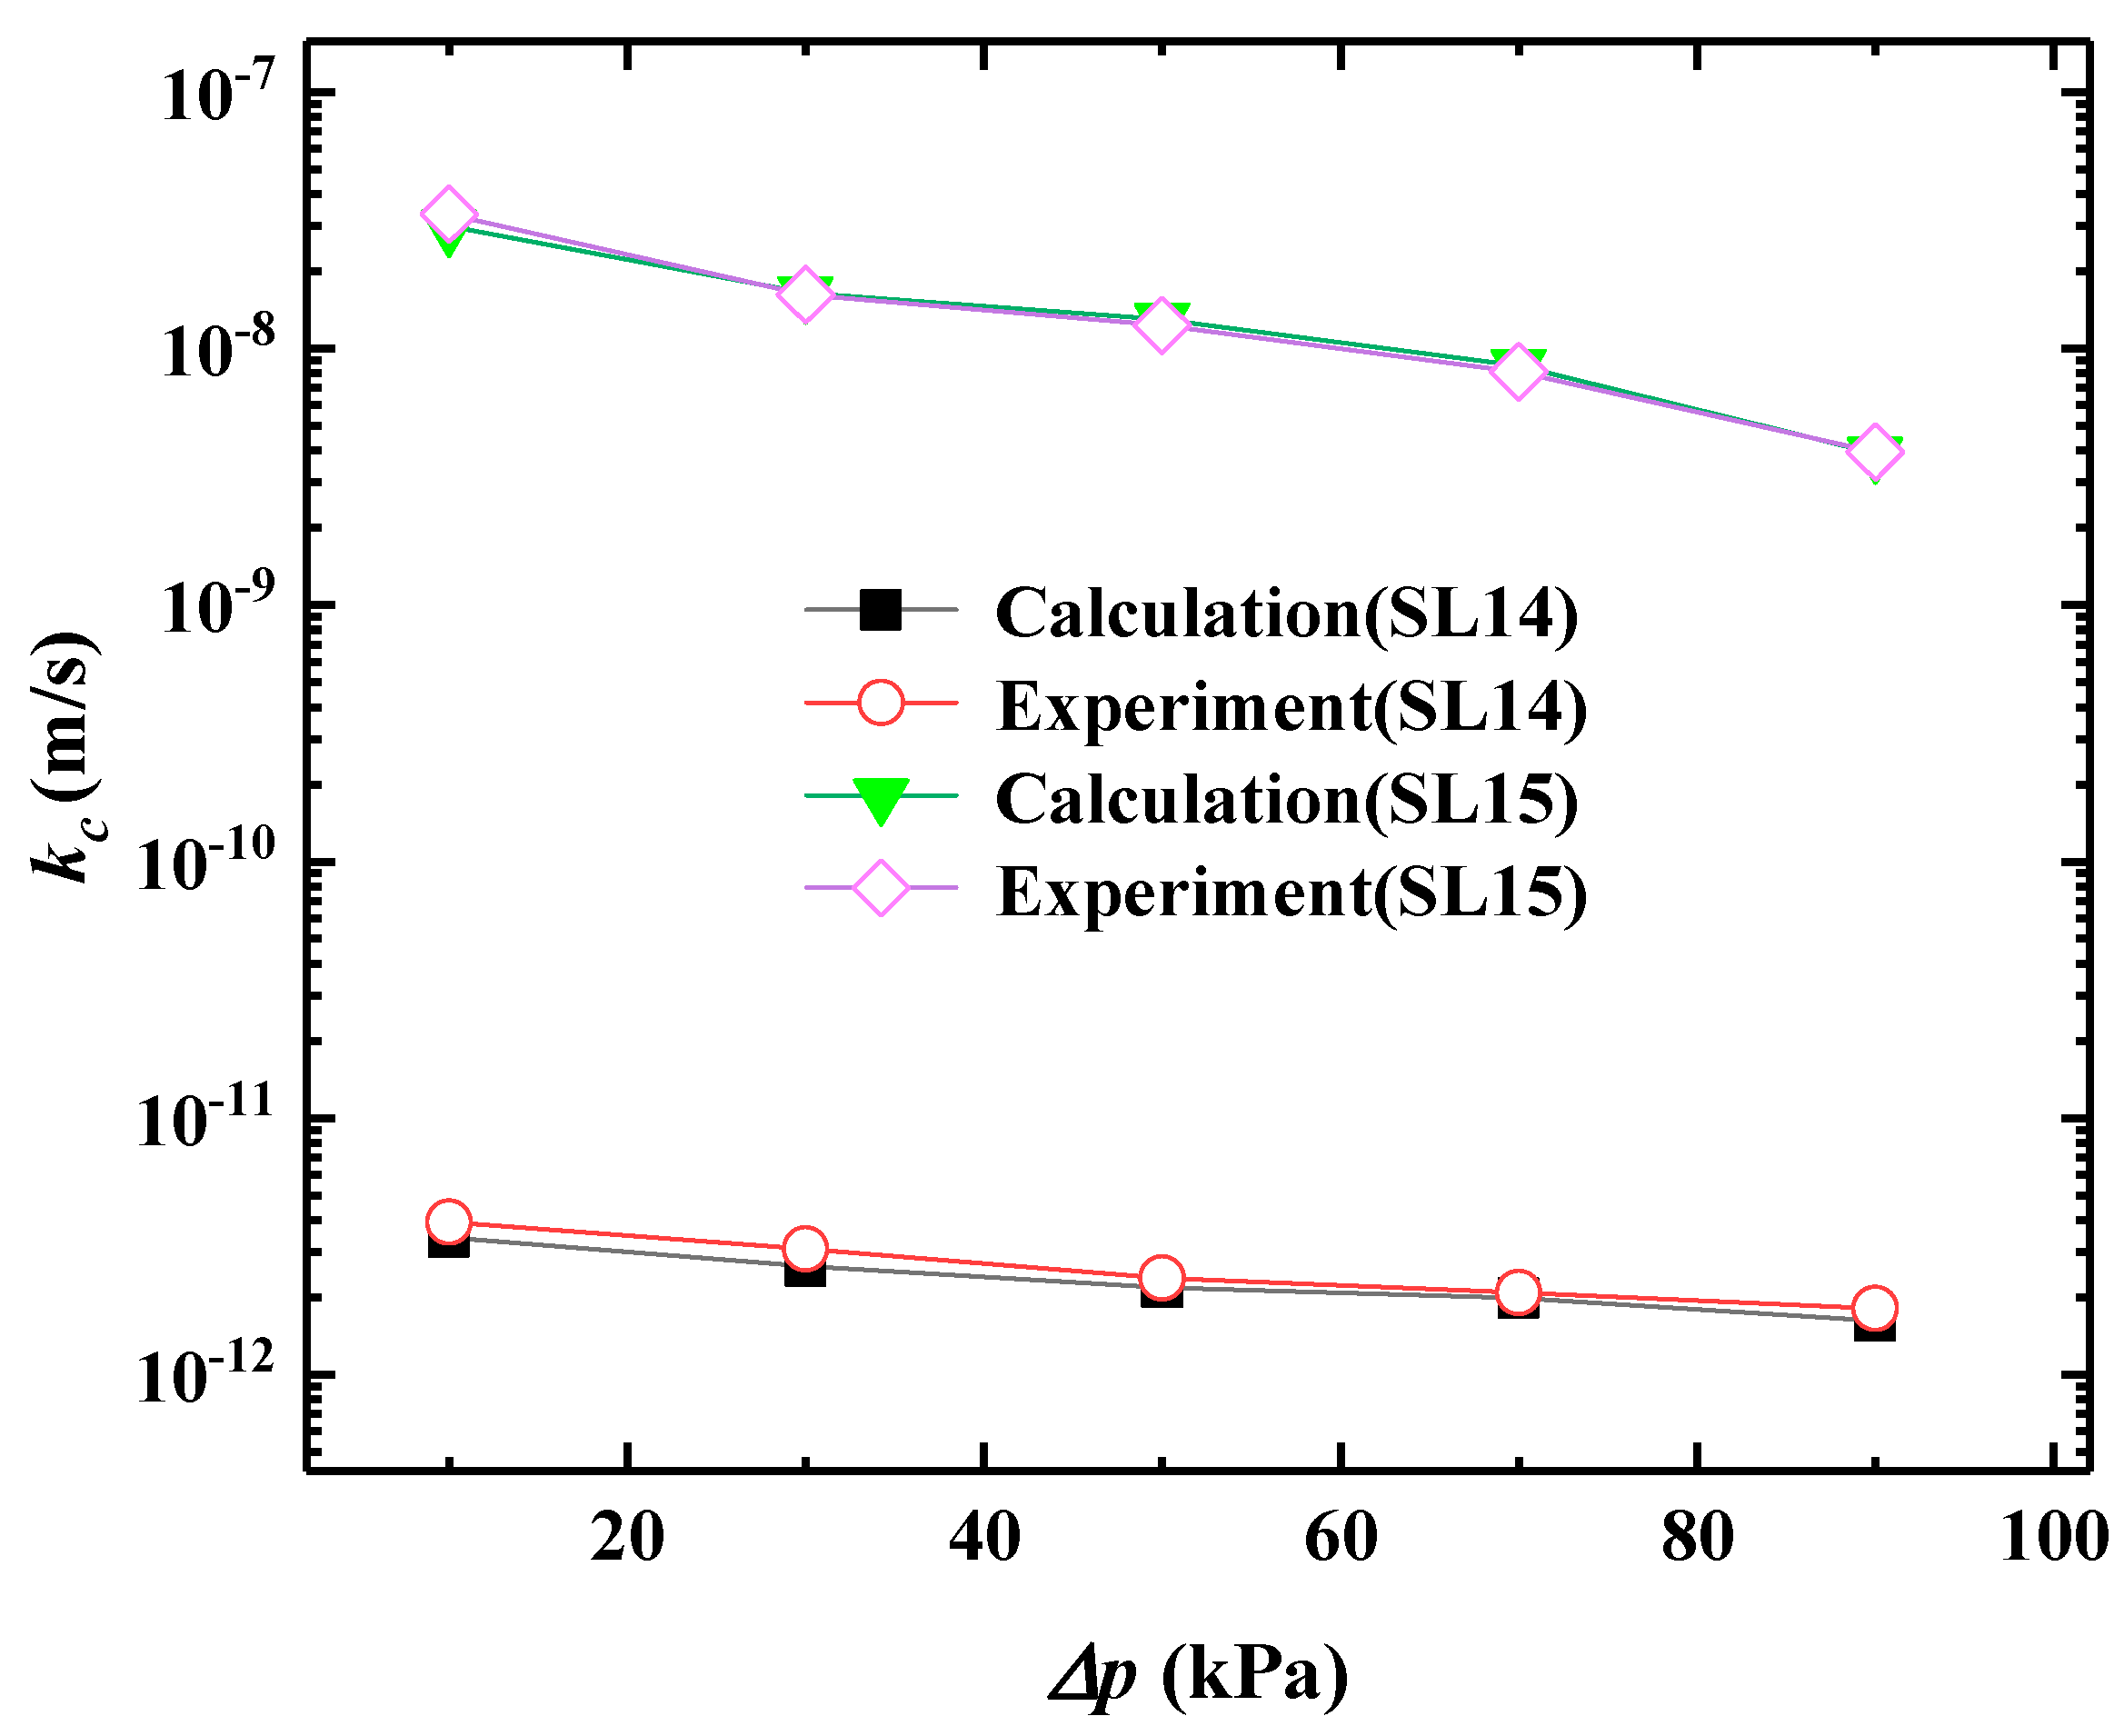
The dynamic filter cake formation period in this study was 10 s, so t was specified as 10 s, at which point c = 0.3966 and d = 5.4648 (see Figure 17). LF as a function of kc can be obtained according to Equation (15). The following is verified with mud SL14 and 15. The average hydraulic conductivity of the filter cake will be calculated using Equation (15) and compared with the measured average hydraulic conductivity of the filter cake (see Figure 18).
Figure 18 shows the comparison between the predicted and measured hydraulic conductivity. The close alignment of the data points with the 1:1 line of perfect agreement demonstrates the validity of the empirical equation (Equation (15)). The high reproducibility of the source data underpins the reliability of this correlation.
As can be seen from Figure 18, the predicted average hydraulic conductivity of the filter cake is in the same order of magnitude as the measured average hydraulic conductivity of the filter cake. For slurry SL14 and 15, the maximum relative error is 14% and the minimum relative error is 1%. The average relative error was less than 10% for both sets of slurries, indicating that Equation (15) can predict the filter cake hydraulic conductivity. The close clustering of data points around the 1:1 line validates the predictive model.

6. Discussion

It is important to acknowledge that the validation of the proposed mud spurt model and the filter cake constitutive parameters in this study was conducted primarily on Yangtze River sand (a specific chalk sand with a D15 of 0.159 mm). While the results are robust for this soil type, the general applicability of the models to a wider range of soils, such as coarse gravels or fine silts, requires further verification. Future research should focus on validating and potentially calibrating the model against experimental data from other geographically distinct and texturally different soils. Furthermore, investigating the performance of the proposed slurry design criteria (e.g., the optimal SL6 slurry) in these varied ground conditions would be a valuable extension of this work.
The selection of an optimal slurry for slurry shield tunneling is a multi-factorial engineering decision, where the paramount goal is to ensure face stability by controlling slurry infiltration and forming an effective filter cake. This study evaluated key selection criteria, including slurry penetration distance, filter cake hydraulic conductivity, and filter cake thickness. The data presented in Table 7 for hydraulic conductivity and thickness were obtained from Figure 12 and Figure 13, respectively. The error bars represent the standard deviation derived from varying the slurry pressure (Δp) by ±10% in the constitutive model. The mud spurt distance was calculated using the proposed mud spurt model solved via the Newton-Raphson method in MATLAB, with a convergence tolerance of 0.1%; the reported uncertainty (±0.1 cm) reflects the numerical precision of the iterative solution. Based on these results, an overall rank is assigned to each technically viable slurry through a multi-criteria evaluation that prioritizes low mud spurt, low hydraulic conductivity, and sufficient filter cake thickness for engineering stability. Based on common engineering requirements in China (e.g., a Russian funnel viscosity between 16 and 33 s) [38], nine slurries were identified as technically viable candidates, and their performance is summarized in Table 7.
As shown in Table 7, slurries SL6, SL7, SL9, SL10, SL11, and SL12 demonstrate superior overall performance, characterized by short penetration distances (2.3 to 4.8 cm) and the formation of filter cakes with very low hydraulic conductivity (10−12 to 10−10 m/s). Among these, SL6 (with PAA-Na (15 k)) presents a particularly balanced and robust technical profile. While SL9 (with CMC-Na) yields the lowest hydraulic conductivity (3.23 × 10⁻¹² m/s), it produces a very thin filter cake (4.43 μm), which might be susceptible to complete removal during the dynamic cutterhead rotation cycle, potentially compromising continuous face support. In contrast, SL6 forms a substantially thicker filter cake (54.87 μm), an order of magnitude greater than that of SL9, while still maintaining exceptionally low hydraulic conductivity (4.80 × 10⁻¹⁰ m/s). This greater thickness likely enhances the durability and effectiveness of the filter cake under actual excavation conditions.
Therefore, considering the critical engineering requirements for face stability, SL6 is identified as the most suitable slurry in this study due to its optimal balance of a short penetration distance, very low filter cake conductivity, and a substantial filter cake thickness. Its competitive cost further enhances its practicality for large-scale engineering applications. This analysis underscores that the optimal slurry choice involves balancing key technical parameters to achieve reliable and robust tunnel face support.

7. Conclusions

This study systematically investigated the mechanisms of filter cake formation and slurry penetration, leading to the development of practical tools and models for slurry shield tunneling. The key findings and their novelties and implications are summarized as follows:
(1)
Practical criterion for filter cake formation was established based on the readily measurable particle sizes (sand D15 and slurry d85). The novelty of this criterion lies in its simplicity and direct applicability in engineering practice, providing a rapid and reliable method for preliminary assessment of slurry-ground compatibility during the design phase, which surpasses the need for complex laboratory tests.
(2)
A novel mud spurt model was proposed and validated. Its primary novelty and advantage are its practicality; it predicts slurry penetration distance using parameters obtainable from standard geotechnical surveys and basic slurry property tests, effectively eliminating the dependency on time-consuming and specialized infiltration column tests required by previous models. The model demonstrates a high level of accuracy, with an error of approximately 6% compared to experimental data. This magnitude of error is considered fully acceptable for preliminary design and process control in tunneling engineering, where factors of safety are typically designed to accommodate uncertainties far exceeding this range, thus confirming the model’s robustness and suitability as a design tool.
(3)
Based on modified fluid loss (MFL) tests, constitutive model parameters for 15 different slurries were determined. The novelty here is the creation of a comprehensive and generalized dataset and predictive equations that enable the calculation of filter cake hydraulic conductivity and void ratio under any arbitrary slurry pressure. This moves beyond case-specific results, providing a valuable foundation for optimizing slurry recipes in various ground conditions.
(4)
The evolution of filter cake thickness during the dynamic excavation process was analyzed. A significant practical outcome of this analysis is the proposal of a simplified engineering approximation: the average filter cake thickness during a cutterhead rotation cycle can be reasonably estimated as two-thirds of the maximum thickness. It is crucial to state that this “2/3 rule” is derived from the analytical integration of the filter cake growth model in this study and serves as a practical, conservative approximation for stability evaluation. Future research involving direct in situ measurements can further validate this relationship across a wider range of conditions.
In summary, the major novelty of this work is the development of an integrated, practical framework for slurry selection and face stability assessment. The findings provide tunnel engineers with readily applicable criteria, a simplified predictive model, and a fundamental property database. These contributions are poised to enhance the safety, efficiency, and economy of slurry shield tunneling projects by informing better decision-making in slurry design and process control.

Author Contributions

Conceptualization, X.Y.; writing—review and editing, X.Y., G.W., Y.C. and Z.D.; funding acquisition, X.Y., G.W., Y.C. and Z.D.; software, X.Y. and Y.Z.; validation, Y.Z.; formal analysis, Y.Z.; investigation, Y.Z. and Z.D.; writing—original draft, Y.Z.; supervision, G.W.; resources, G.W.; methodology, Y.C. All authors have read and agreed to the published version of the manuscript.

Funding

This research was funded by National Natural Science Foundation of China, grant number 52178399, 52178400.

Data Availability Statement

The original contributions presented in this study are included in the article. Further inquiries can be directed to the corresponding author.

Conflicts of Interest

The authors declare no conflicts of interest.

References

  1. Cui, W.; Liu, D.; Song, H.F.; Pu, G.-J. Development and experimental study on environmental slurry for slurry shield tunneling. Constr. Build. Mater. 2019, 216, 416–423. [Google Scholar] [CrossRef]
  2. Mao, J.H.; Yuan, D.J.; Jin, D.L.; Liu, S. Influence of Cutting Tools on Filter Cake Formation during Slurry Shield Tunnelling. KSCE J. Civ. Eng. 2021, 25, 2261–2274. [Google Scholar] [CrossRef]
  3. Lin, Y.F.; Fang, Y.; He, C.; Wang, W. Experimental study on degree of match between slurry and ground based on particle retention rate. Tunn. Undergr. Space Technol. 2021, 116, 104105. [Google Scholar] [CrossRef]
  4. Li, Y.C.; Tong, X.; Chen, Y.; Wen, Y.-D.; Pan, Q. Non-monotonic piezocone dissipation curves of backfills in a soil-bentonite slurry trench cutoff wall. J. Zhejiang Univ.-Sci. A 2018, 19, 277–288. [Google Scholar] [CrossRef]
  5. Cui, Y.; Duong, T.V.; Tang, A.M.; Dupla, J.-C.; Calon, N.; Robinet, A. Investigation of the hydro-mechanical behaviour of fouled ballast. J. Zhejiang Univ.-Sci. A 2013, 14, 244–255. [Google Scholar] [CrossRef]
  6. Li, Y.; Wang, X.; Wei, G.; Lin, Z.; Wei, X.; Yan, Z.; Yan, J.; Shen, X. Numerical Study of Excavation Face Active Instability in Upward Shield Tunneling. Buildings 2025, 15, 3371. [Google Scholar] [CrossRef]
  7. Chen, F.; Xiong, H.; Yin, Z.Y.; Chen, X. Impermeable and mechanical stability of filter cake under different infiltration conditions via CFD-DEM. Acta Geotech. 2023, 18, 4115–4140. [Google Scholar] [CrossRef]
  8. Xu, T.; Bezuijen, A. Experimental study on the mechanisms of bentonite slurry penetration in. Tunn. Undergr. Space Technol. 2019, 93, 103052. [Google Scholar] [CrossRef]
  9. Broere, W. Tunnel Face Stability & New CPT Application. Ph.D. Thesis, Delft University of Technology, Delft, Netherlands, 2001. [Google Scholar]
  10. Talmon, A.; Masthergen, D.R. Invasion of pressurized clay suspensions into granular soil. J. Porous Media 2013, 16, 351–365. [Google Scholar] [CrossRef]
  11. Watanabe, T.; Yamazaki, H. Giant size slurry shield is a success in Tokyo. Tunn. Tunn. 1981, 13, 13–17. [Google Scholar]
  12. Min, F.L.; Zhu, W.; Han, X. Filter cake formation for slurry shield tunnelling in highly permeable sand. China J. Highw. Transp. 2013, 87, 423–430. [Google Scholar]
  13. Yin, X.S.; Chen, R.P.; Li, Y.; Qi, S. A column system for modeling bentonite slurry infiltration in sands. J. Zhejiang Univ.-Sci. A 2016, 17, 818–827. [Google Scholar] [CrossRef]
  14. Yin, X.S.; Chen, R.P.; Men, F.Y.; Ding, Z.; Cui, Y.; Hedayat, A.; Mooney, M. Face stability of slurry-driven shield with permeable filter cake. Tunn. Undergr. Space Technol. 2021, 111, 103841. [Google Scholar] [CrossRef]
  15. Yang, Y.; Yuan, D.; Du, C.; Jin, D.; Hao, J. Calculation method for the formation time of dynamic filter cake in slurry shield tunneling. Front. Struct. Civ. Eng. 2024, 18, 1337–1349. [Google Scholar] [CrossRef]
  16. Yin, Z.; Zhang, X.; Zheng, D.; Zhang, Q. Experimental study on infiltration behavior of slurry containing excavated sand into saturated sand. Phys. Fluids 2024, 36, 16. [Google Scholar] [CrossRef]
  17. Guo, S.; Li, R.; Zhang, M.; Zhang, Q.; Li, X.; Li, X.; Liu, Y.; Zheng, D. Experimental and mechanistic investigation of synergistic effects of particle size distribution and xanthan gum on rheological and infiltration properties of bentonite slurries. Phys. Fluids 2025, 37, 086608. [Google Scholar] [CrossRef]
  18. Zhang, Z.X.; Yin, T. A Coupled CFD-DEM Simulation of Slurry Infiltration and Filter Cake Formation during Slurry Shield Tunneling. Infrastructures 2018, 3, 15. [Google Scholar] [CrossRef]
  19. Yin, T.; Zhang, Z.X.; Huang, X.; Shire, T.; Hanley, K.J. On the morphology and pressure-filtration characteristics of filter cake formation: Insight from coupled CFD-DEM simulations. Tunn. Undergr. Space Technol. 2021, 111, 103586. [Google Scholar] [CrossRef]
  20. Cheng, H.; Wu, N.; Shi, Y.; Wang, B. Influence of Permeability of Filter Cake on Face Stability of Slurry Shield-Driven Tunnels in Sandy Gravel Stratum. In Proceedings of the 10th International Conference on Hydraulic and Civil Engineering & Engineering Safety and Disaster Prevention Forum, Nanjing, China, 18–20 March 2025; pp. 1495–1508. [Google Scholar]
  21. Liu, J. CFD-DEM Simulation of Slurry Particle Infiltration in Granular Soils. Ph.D. Thesis, University of Edinburgh, Edinburgh, UK, 2025. [Google Scholar]
  22. Liu, J.; Hanley, K.J. CFD–DEM Comparison of Slurry Infiltration in Laboratory Column Tests and in Real-World Tunnelling. Comput. Geotech. 2024, 176, 106816. [Google Scholar] [CrossRef]
  23. Ayasrah, M.; Qiu, H.; Zhang, X.; Daddow, M. Prediction of Ground Settlement Induced by Slurry Shield Tunnelling in Granular Soils. Civ. Eng. J. 2020, 6, 2273–2289. [Google Scholar] [CrossRef]
  24. Razakamanantsoa, A.R.; Barast, G.; Djeran, M.I. Hydraulic performance of activated calcium bentonite treated by polyionic charged polymer. Appl. Clay Sci. 2012, 59, 103–114. [Google Scholar] [CrossRef]
  25. Tien, C. Principle of Filtration; Elsevier: Amsterdam, The Netherlands, 2012. [Google Scholar]
  26. Zumsteg, R.; Puzrin, A.M.; Anagnostou, G. Effects of slurry on stickiness of excavated clays and clogging of equipment in fluid supported excavations. Tunn. Undergr. Space Technol. 2016, 58, 197–208. [Google Scholar] [CrossRef]
  27. Min, F.L.; Du, J.R.; Zhang, N.; Chen, X.; Lv, H.; Liu, L.; Yu, C. Experimental study on property change of slurry and filter cake of slurry shield under seawater intrusion. Tunn. Undergr. Space Technol. 2019, 88, 290–299. [Google Scholar] [CrossRef]
  28. Terzaghi, K.; Peck, R.B. Soil Mechanics in Engineering Practice; John Wiley & Sons: New York, NY, USA, 1951. [Google Scholar]
  29. Sherard, J.L.; Dunnigan, L.P.; Talbot, J.R. Basic properties of sand and gravel filters. J. Geotech. Eng. 1984, 110, 684–700. [Google Scholar] [CrossRef]
  30. Krause, T. Schildvortrieb Mit Flüssigkeits und Erdgestützter Ortsbrust; Universität Braunschweig: Braunschweig, Germany, 1987. [Google Scholar]
  31. Bezuijen, A.; Steeneken, S.P.; Ruigrok, J.A.T. Monitoring and analysing pressures around a TBM. In Proceedings of the 13th International Conference on Underground Construction, Prague, Czech Republic, 23–25 May 2016. [Google Scholar]
  32. Ye, F.; Yang, T.; Mao, J.H. Half-spherical surface diffusion model of shield tunnel backfill grouting based on infiltration effect. Tunn. Undergr. Space Technol. 2019, 59, 274–281. [Google Scholar] [CrossRef]
  33. Kim, J.S.; Lee, I.M.; Jang, J.H.; Choi, H. Groutability of cement-based grout with consideration of viscosity and filtration phenomenon. Int. J. Numer. Anal. Methods Geomech. 2010, 33, 1771–1797. [Google Scholar] [CrossRef]
  34. Li, Y.; Zhang, Z.X.; Zhang, G.J. Laboratory study on face stability mechanism of slurry shields. China J. Geotech. Eng. 2007, 29, 1074–1079. [Google Scholar]
  35. Ruth, B. Study in filtration. Ind. Eng. Chem. 1935, 27, 708–723. [Google Scholar] [CrossRef]
  36. Fehervari, A.; Gates, W.P.; Patti, A.F. Potential hydraulic barrier performance of cyclic organic carbonate modified bentonite complexes against hyper-salinity. Geotext. Geomembr. 2016, 44, 748–760. [Google Scholar] [CrossRef]
  37. Chung, J.; Daniel, D.E. Modified fluid loss test as an improved measure of hydraulic conductivity for bentonite. Geotech. Test. J. 2008, 31, 243–251. [Google Scholar] [CrossRef]
  38. Liu, X.Y.; Wang, F.M.; Yuan, D.J.; Fang, H.Y.; Zhang, S.L. Range of support pressures for slurry shield and analysis of its influence factors. Chin. J. Geotech. Eng. 2019, 41, 908–917. [Google Scholar]
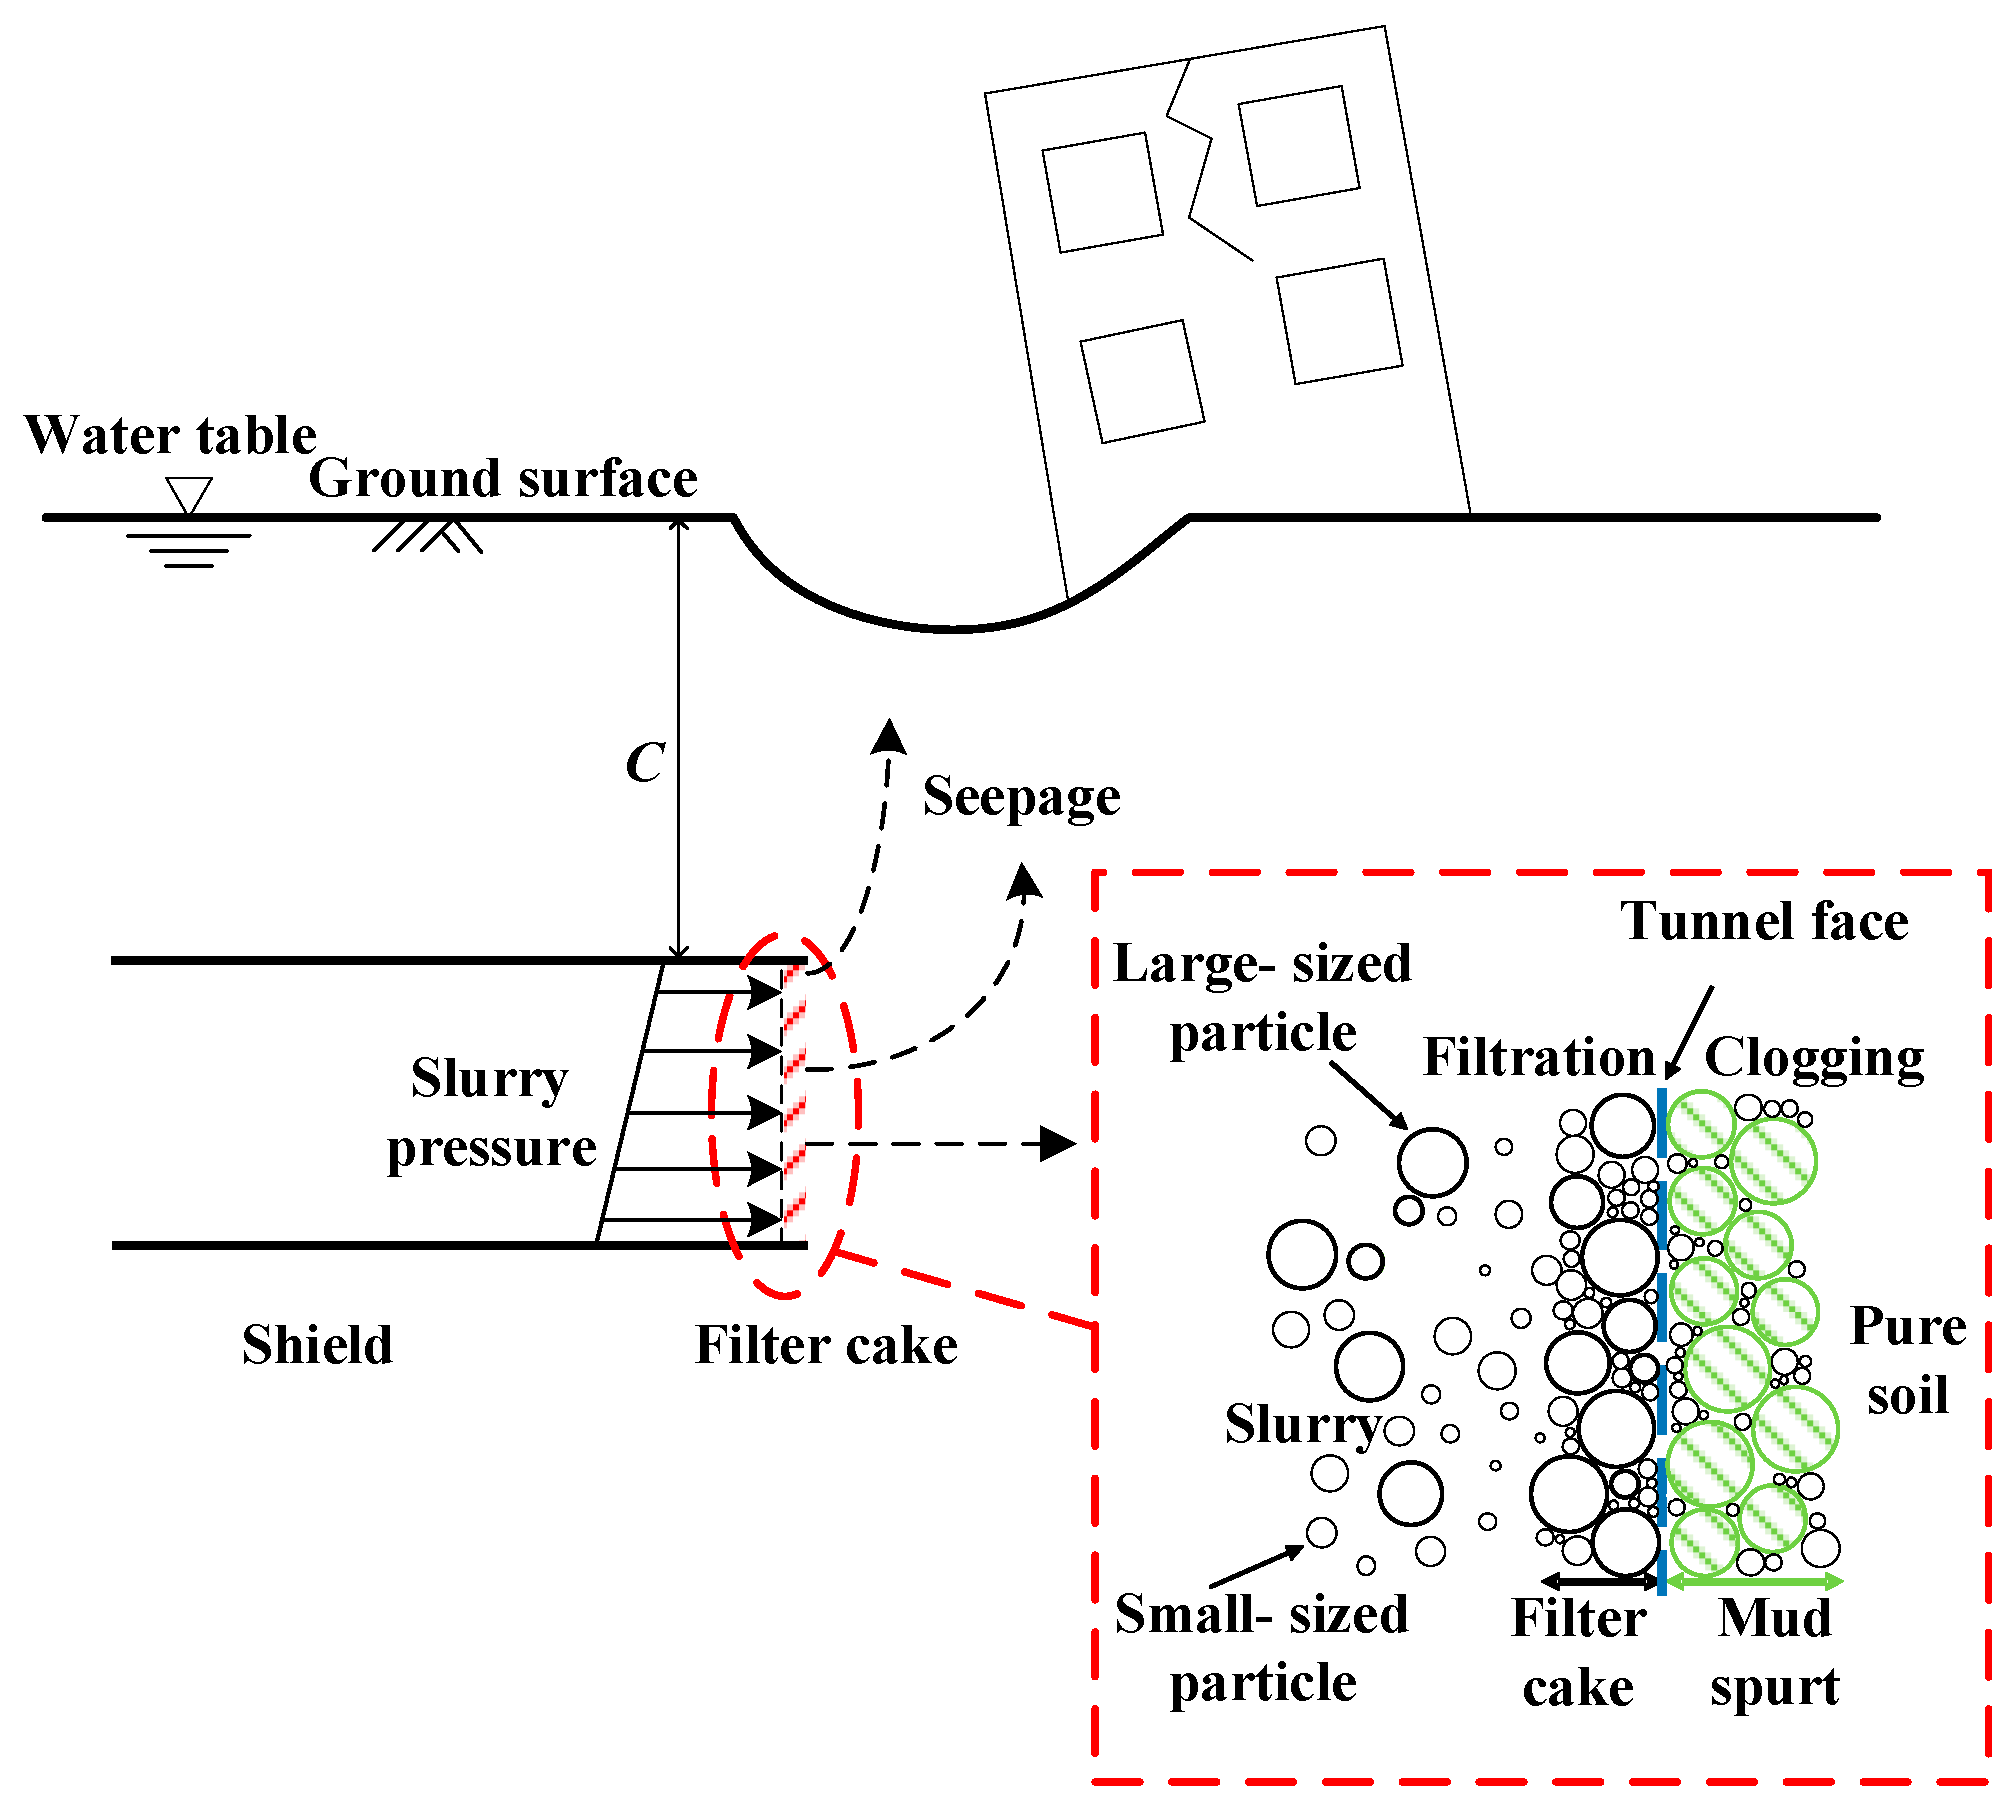
Figure 1. The slurry penetration into the strata on the tunnel face.
Buildings 15 03699 g001
Figure 2. Grading curve of slurry particles.
Buildings 15 03699 g002
Figure 3. The criteria of filter cake formation.
Buildings 15 03699 g003
Figure 4. Flow chart.
Buildings 15 03699 g004
Figure 5. Comparison between calculated model and measured distance. (a) Con_40; (b) Con_50; (c) Con_60 [8].
Buildings 15 03699 g005
Figure 6. Ratio relationship between mud spurt model and measured permeability distance.
Buildings 15 03699 g006
Figure 7. Fluid loss test device.
Buildings 15 03699 g007
Figure 8.pt/V-V relationship (SL1).
Buildings 15 03699 g008
Figure 9.pt/V2-∆p relationship.
Buildings 15 03699 g009
Figure 10. Relationship between slurry pressure and average void ratio of filter cake.
Buildings 15 03699 g010
Figure 11. Relationship between slurry pressure and filter cake average hydraulic conductivity.
Buildings 15 03699 g011
Figure 12. Average hydraulic conductivity of filter cake at 20 kPa.
Buildings 15 03699 g012
Figure 13. Thickness of filter cake at 20 kPa.
Buildings 15 03699 g013
Figure 14. Variation in filter cake thickness with time at 20 kPa.
Buildings 15 03699 g014
Figure 15. Relationship between average void ratio and thickness of filter cake. (a) Different filtrate time t. (b) Different slurry pressure Δp.
Buildings 15 03699 g015
Figure 16. Relationship between intercept b and slurry pressure Δp.
Buildings 15 03699 g016
Figure 17. Relationship between parameter d and filtrate time t.
Buildings 15 03699 g017
Figure 18. Verification of relationship between hydraulic conductivity and thickness of filter cake.
Buildings 15 03699 g018
Table 1. Properties of bentonites.
Typical AnalysisPercentage (%)Typical CharacteristicsTypical
Al2O313.74Sodium bentoniteTest Results
TiO20.15Fine Content (<0.075 mm)100%
SiO269.12Clay Content83.2%
Fe2O30.90Specific Gravity2.55
MgO2.73Liquid Limit242.8%
CaO1.13Plastic Limit72.6%
K2O0.98Plasticity Index Ip170.2
Na2O0.89Free Swell (mL/2 g)12.0
LOi10.32pH7
Hardness1–2
ColorCanary Yellow
Adsorptivity8–15
Table 2. Basic properties of slurry.
SlurryBentonite
/(g/L)
Adding MaterialMaterial Content/(%)Russian Funnel Viscosity/(s)Marsh Funnel Viscosity/(s)ρ/
(g/cm3)
τy/
(pa)
μ/
(mpa·s)
d85d50
SL150-016 ± 0.330 ± 2.11.030 ± 0.0180.150 ± 0.0061.50 ± 0.060.03310.0163
SL270-017 ± 0.531 ± 1.61.035 ± 0.0120.160 ± 0.0021.90 ± 0.030.03050.0146
SL350APAM (25 M)1.0253 ± 10.1472 ± 22.71.030 ± 0.0148.94 ± 0.22433.65 ± 1.040.04780.0167
SL450CPAM (16 M)1.019 ± 0.438 ± 2.51.030 ± 0.0200.100 ± 0.0015.80 ± 0.280.13510.0798
SL550PAA-Na (1.2 k)1.019 ± 0.534 ± 1.31.030 ± 0.0110.510 ± 0.0163.40 ± 0.070.06980.0338
SL650PAA-Na (15 k)1.022 ± 0.740 ± 3.01.030 ± 0.0151.280 ± 0.0246.05 ± 0.080.06690.0290
SL750CMC (41 k)1.023 ± 0.741 ± 2.31.030 ± 0.0192.200 ± 0.0849.15 ± 0.460.05960.0246
SL850CMC (57 k)1.0264 ± 8.4291 ± 10.81.030 ± 0.01332.040 ± 0.16063.35 ± 1.580.05090.0109
SL950CMC-Na (8 k)1.031 ± 0.951 ± 2.11.030 ± 0.0212.960 ± 0.06519.40 ± 0.720.06350.0153
SL1050PAA-Na (1.2 k)2.020 ± 0.436 ± 2.21.030 ± 0.0160.870 ± 0.0355.95 ± 0.090.04480.0218
SL1150PAA-Na (15 k)2.023 ± 0.438 ± 1.21.030 ± 0.0123.120 ± 0.0476.45 ± 0.260.08720.0365
SL1250CMC (41 k)2.029 ± 0.551 ± 4.01.030 ± 0.0193.730 ± 0.1237.75 ± 0.220.04990.0179
SL1350CMC-Na (8 k)2.0114 ± 4.4163 ± 9.61.030 ± 0.01519.210 ± 0.53856.50 ± 1.070.07020.0178
SL1450QT13.717 ± 0.431 ± 1.41.100 ± 0.0150.200 ± 0.0033.50 ± 0.120.03350.0143
SL1550QT13.749 ± 1.7114 ± 9.11.100 ± 0.0218.640 ± 0.30234.95 ± 1.610.07450.0292
CMC-Na1.0
The material content is the mass ratio of material to water.
Table 3. The criteria of filter cake formation.
NumberAuthorIndexFilter CakeFilter Cake and Mud SpurtNo Filter Cake
Terzaghi and Peck [28]d85/D15d85/D85 ≥ 0.25
Sherard et al. [29]d85/D15d85/D15 ≥ 0.190.095 < d85/D15 < 0.19d85/D15 ≤ 0.095
Min et al. [12]d85/D15d85/D15 ≥ 0.190.095 < d85/D15 < 0.19d85/D15 ≤ 0.095
Talmon & Masthergen [10]Dpore/d50Dpore/d50 < 33 ≤ Dpore/d50 < 14Dpore/d50 ≥ 14
Table 4. Test parameters [8].
Slurryτy/(Pa)L/(m)kb/(m/s)kb/(m/s)
Con_400.501.5638.0 × 10−57.5 × 10⁻⁵
Con_500.871.0425.0 × 10−54.5 × 10⁻⁵
Con_602.000.4344.0 × 10−54.0 × 10⁻⁵
Table 5. Parameters of constitutive model of filter cake.
Slurryαk0/(m/s)δe0
SL10.843.4 × 10−70.0753.763
SL20.903.9 × 10−70.0984.202
SL30.674.3 × 10−100.35026.308
SL40.404.9 × 10−90.1527.490
SL50.512.8 × 10−90.2839.230
SL60.683.7 × 10−90.0716.064
SL70.733.0 × 10−100.1369.963
SL80.373.2 × 10−110.27016.908
SL90.349.1 × 10−120.1186.736
SL100.671.9 × 10−90.19510.418
SL110.927.9 × 10−100.0868.824
SL120.712.3 × 10−100.08312.075
SL130.153.3 × 10−120.1098.454
SL140.823.2 × 10−70.1730.828
SL150.192.5 × 10−120.1192.217
The values in this table are derived from the curve fitting of a single, averaged dataset compiled from three replicate tests per slurry. The high reproducibility of the tests is confirmed by a coefficient of variation <5% for directly measured quantities (e.g., final cake thickness).
Table 6. Filter cake thickness and average hydraulic conductivity working table.
ConditionSlurry Pressure/(kPa)t/(s)abR2
110100.4565.870.99
220100.4566.000.99
330100.4566.070.99
450100.4566.160.99
570100.4566.220.99
690100.4566.260.99
720200.4566.150.99
820150.4566.090.99
92050.4565.850.99
102030.4565.740.99
112010.4565.500.99
Table 7. Comparison and selection of slurry application.
SlurryMud Spurt/(cm)Hydraulic Conductivity/(m/s)Thickness/(μm)
SL16.3 ± 0.1(2.71 ± 0.20) × 10−8331 ± 1.4
SL25.8 ± 0.1(2.61 ± 0.21) × 10−8331 ± 1.4
SL54.7 ± 0.1(6.08 ± 0.29) × 10−1055 ± 0.6
SL63.7 ± 0.1(4.80 ± 0.30) × 10−1054 ± 0.6
SL73.1 ± 0.1(3.37 ± 0.22) × 10−1117 ± 0.1
SL92.3 ± 0.1(3.23 ± 0.10) × 10−124 ± 0.1
SL103.8 ± 0.1(2.53 ± 0.15) × 10−1043 ± 0.2
SL113.5 ± 0.1(4.98 ± 0.41) × 10−1120 ± 0.1
SL123.3 ± 0.1(2.76 ± 0.18) × 10−1118 ± 0.1
Disclaimer/Publisher’s Note: The statements, opinions and data contained in all publications are solely those of the individual author(s) and contributor(s) and not of MDPI and/or the editor(s). MDPI and/or the editor(s) disclaim responsibility for any injury to people or property resulting from any ideas, methods, instructions or products referred to in the content.