Abstract
Urban–rural mountainous regions face persistent challenges in reconciling ecological conservation, cultural heritage preservation, and recreational demands, all of which are vital to advancing social sustainability. This study develops an integrated corridor framework for the Qinling–Daba region that couples ecological, heritage, and recreational networks within a socially sustainable planning perspective. Ecological sources were identified using Morphological Spatial Pattern Analysis (MSPA) combined with connectivity indices (IIC, PC, dPC). Heritage and recreation resources were inventoried through field surveys and prioritized using the Analytic Hierarchy Process (AHP). Function-specific corridors were modelled with a Minimum Cumulative Resistance (MCR) approach, and the three networks were synthesized through GIS overlay and hotspot analysis. The results indicate that there are 19 ecological sources and 28 corridors, 34 heritage nodes and 41 corridors, and 29 recreation nodes and 50 corridors. The composite network comprises 69 key nodes and 141 segments, classified into four node categories and three corridor types. Derived planning directives include graded buffer zones, continuity of riparian and forest belts, remediation of breakpoints with wildlife-friendly crossings, and universal accessibility standards for high-demand sites. By aligning ecological integrity, cultural values, and equitable access, the proposed framework offers a reproducible pathway to integrate people and places through multifunctional corridors. Beyond regional application, this research provides transferable insights for socially sustainable governance of urban–rural built environments in mountainous territories, supporting the achievement of Sustainable Development Goal 11.
1. Introduction
Urban–rural planning increasingly confronts intertwined pressures of ecological degradation, spatial fragmentation, and rising recreational demand. Research has shifted from single-function analyses to integrative frameworks. These frameworks aim to combine ecological integrity, cultural continuity, and human well-being [1,2,3,4,5]. In line with SDG 11, we treat corridors as planning tools that deliver social outcomes, such as equitable access, conflict mitigation, and safety, across both urban and rural mountain areas. This transition draws on theories of cultural ecology and resilience, emphasizing the role of connectivity in sustaining socio-ecological systems under disturbance [6,7,8,9,10].
The concept of corridors encompasses diverse types, including heritage corridors, ecological corridors, and recreational corridors [11,12,13]. Among these, greenways represent one of the earliest and most systematic linear landscape forms, providing a foundational theoretical and practical context for subsequent specialized corridor types [14,15]. Early greenway research, exemplified by Lewis’s (1964) work in Wisconsin, identified the concentration of natural and cultural resources along river valleys, presaging the development of dedicated heritage corridors [16,17]. Heritage corridors matured as a formal planning tool to conserve linear cultural landscapes, clustering resources like historic canals, railways, and river valleys to restore the contextual continuity of isolated heritage sites [18,19,20]. Concurrently, rising concerns over habitat fragmentation propelled research on the ecological functions of greenways, culminating in the focused study of “ecological corridors” since the late 1960s [21,22]. Grounded in island biogeography and landscape ecology, ecological corridors are defined as linear spaces that facilitate species movement between habitat patches, thereby protecting biodiversity and underpinning regional ecological security [23,24,25,26].
In recent years, the demand for integrated solutions to intertwined environmental, cultural, and social challenges has intensified [27]. While traditional single-function corridors are effective in their specific domains, they often overlook critical synergies and potential conflicts between different landscape functions [28]. Consequently, compound corridors that integrate ecological conservation, heritage preservation, and recreational services have become a key vehicle for achieving coordinated “nature-culture-society” development [29]. However, most integration efforts remain bi-functional (e.g., ecology–heritage or ecology–recreation) [30,31,32,33,34], with limited systematic coupling, incomplete treatment of trade-offs, and few implementation rules for cross-jurisdictional governance [35,36]. Accordingly, compound corridors should be appraised not only for biophysical connectivity but also for their ability to reconcile access with protection through explicit rules—graded buffers, time-phased access, and cross-jurisdictional coordination.
The Qinling–Daba Mountains constitute China’s primary north–south ecological boundary, a biodiversity stronghold, and a convergence area of multiple civilizations [37,38,39]. Yet the region faces accelerating habitat fragmentation, disrupted migration pathways, and under-managed access to rich heritage assets [40,41]. While strict ecological protection policies are essential, they can inadvertently constrain recreation and equitable public access, creating tensions with local development and tourism growth [42,43,44]. These tensions manifest in the over-use of iconic sites, under-use of secondary resources, and uneven accessibility across visitor groups. Addressing these challenges requires a corridor framework that not only protects biodiversity but also regulates human movement, ensures fair access, and provides clear planning directives for the built environment.
To this end, we develop a composite ecological–heritage–recreation corridor network for the Qinling–Daba Mountains and translate it into regional planning guidance. Our pipeline integrates MSPA to identify ecological sources, field surveys and AHP to weight heritage and recreation resources, and an MCR model with function-specific resistance surfaces to delineate single-function corridors. The three networks are then spatially coupled using overlay and hot spot analysis. We aim to (1) identify the distribution patterns of ecological, heritage, and recreational resources, as well as composite nodes and corridors; (2) deliver a reproducible MSPA–AHP–MCR workflow applicable to complex mountain regions; and (3) derive actionable planning measures for sustainable urban and rural built environments consistent with SDG 11.
2. Materials and Methods
2.1. Study Area
The Qinling–Daba Mountains, integrating the Qinling Range, Daba Range, and the adjacent upper reaches of the Han River Basin, extend across six provincial-level administrative regions: Gansu, Sichuan, Shaanxi, Chongqing, Henan, and Hubei. For the purpose of this research, the study area is demarcated in accordance with the Qinling–Daba Mountains Regional Development and Poverty Alleviation Plan [45].
Situated in central China, this region spans the latitude range of 30°17′–34°39′ N and longitude range of 103°45′–113°13′ E, covering a total of 81 counties within the aforementioned administrative divisions (Figure 1). The region constitutes China’s primary north–south ecological boundary, a biodiversity hotspot, and a cultural convergence zone. It also contains abundant scenic parks and recreational resources, offering strong potential for socially sustainable development that integrates conservation, heritage, and tourism.
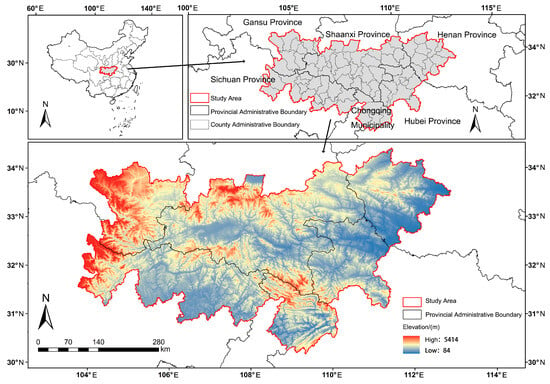
Figure 1.
Study area of the Qinling–Daba Mountains. Source of topographic data: Resource and Environment Science and Data Centre (https://www.resdc.cn).
2.2. Data Sources
The present study utilizes various datasets, including socioeconomic statistics and natural factor data, with details summarized in Table 1. To ensure data consistency, their projected coordinate systems were unified under WGS_1984_UTM_Zone_49N (Table 1).

Table 1.
Data Sources.
2.3. Study Methods
Focusing on the Qinling–Daba Mountains, this study established a research framework for constructing an ecological–heritage–recreational composite corridor network: it first integrated multi-source data to identify core ecological sources, cultural heritage nodes, and recreational potential areas via Morphological Spatial Pattern Analysis (MSPA), field surveys, and landscape value assessment; then quantified ecological, heritage, and recreational resistance using the Analytic Hierarchy Process (AHP) and simulated single-functional corridors with the Minimum Cumulative Resistance (MCR) model; subsequently conducted spatial coupling of the three corridor networks through hot spot analysis to form a unified composite network; and finally evaluated the network’s structural rationality using indices, aiming to address the region’s habitat fragmentation, cultural heritage degradation, and conservation–recreation conflicts (Figure 2).
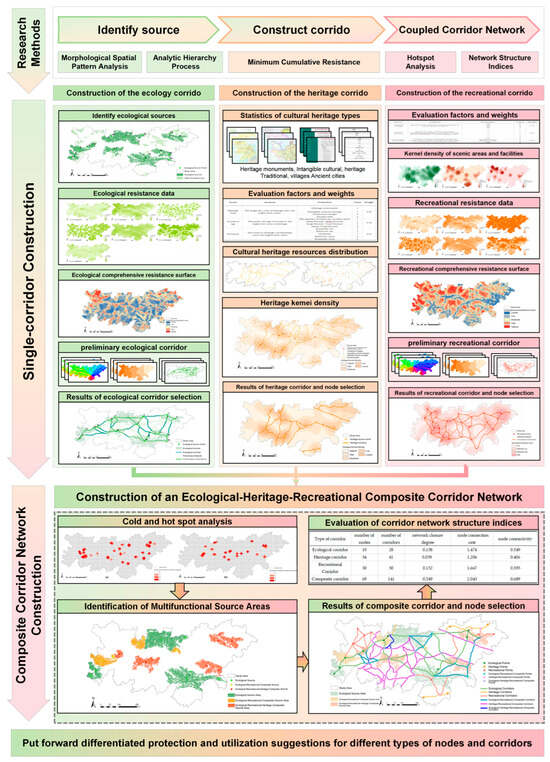
Figure 2.
Research framework for constructing the ecological–heritage–recreational composite corridor network. Source of topographic data: Resource and Environment Science and Data Centre (https://www.resdc.cn).
2.3.1. Morphological Spatial Pattern Analysis
The MSPA model, proposed by Vogt et al. [47], is a spatial analysis method used to assess structural connectivity by identifying ecological sources and constructing resistance surfaces. This method enables accurate differentiation of landscape types and provides a spatial representation of the distribution patterns of various landscape categories [48]. In this study, forestland, grassland, and water bodies were selected as foreground data because they serve as the main ecological carriers in the region, representing the primary habitats that maintain biodiversity and ecosystem stability. Based on MSPA, landscape patches were classified into seven structural categories: core areas, islets, perforations, edges, loops, bridges, and branches [49].
To identify ecological sources, the connectivity of core patches was quantitatively evaluated using the Integral Index of Connectivity (IIC), the Probability of Connectivity (PC), and the delta Probability of Connectivity (dPC) [50]. The IIC reflects overall landscape connectivity by considering the size and distribution of patches; PC integrates patch area and dispersal probability to capture functional connectivity; and dPC measures the relative decline in connectivity after the removal of a patch, highlighting its role as a key source. The formulas are expressed as follows:
where is the number of patches, and are the areas of patches and , is the number of links along the shortest path, is the maximum probability of dispersal between patches, and is the total landscape area. Larger values of and indicate stronger connectivity, while a higher highlights patches that are irreplaceable for maintaining network integrity.
2.3.2. Minimum Cumulative Resistance
The Minimum Cumulative Resistance (MCR) model estimates the least effort required to move across heterogeneous landscapes, thereby identifying optimal ecological corridors [51]. The model integrates the effects of geographic distance and resistance coefficients, where resistance reflects land use type, slope, and intensity of human disturbance. In this study, the MCR model was applied to construct corridor networks connecting ecological sources [52,53]. A smaller MCR value indicates a more ecologically feasible path, thereby providing an objective basis for corridor planning. The formula is
Here, denotes the minimum cumulative resistance value. The integral symbol captures the cumulative nature of resistance accumulation across spatial processes. functions to identify the minimum resistance path from the set of potential routes. typically represents the distance metric between landscape units and , while stands for the resistance coefficient inherent to landscape unit . Through computing the sum of resistance products across all feasible paths and extracting the minimum, the model quantifies the least-cost connectivity, facilitating evidence-based planning of corridors [54].
2.3.3. Analytic Hierarchy Process and Composite Index Method
The Analytic Hierarchy Process (AHP) is a structured decision-making method that decomposes complex problems into hierarchical levels and integrates qualitative and quantitative assessments [55,56,57]. In this study, twelve experts were consulted, including five ecologists, four cultural heritage scholars, and three tourism planners, to ensure balanced representation of relevant disciplinary expertise. Each expert conducted pairwise comparisons of criteria using a 1–9 scale. The resulting judgement matrices were aggregated using the eigenvalue method, and all matrices passed the consistency test with a consistency ratio (CR) below 0.1, confirming the reliability of the derived weights.
For cultural heritage, importance was evaluated based on three hierarchical dimensions: heritage type, age of existence, and spatial concentration. Suitability integrated both the aggregation of heritage nodes and their proximity to ancient roads, reflecting historical significance and spatial accessibility. For recreational resources, importance was assessed using official scenic spot ratings and user reviews from the Dazhong Dianping platform. Suitability was quantified through kernel density overlay analysis of scenic spots, public transportation stops, and commercial facilities.
In addition, for both cultural and recreational assessments, environmental and landscape factors, including land use type, vegetation cover, slope, elevation, and proximity to roads, rivers, and residential areas, were incorporated to construct resistance surfaces. Resistance values were assigned based on each factor’s relative influence on movement or accessibility, with lower values representing minimal constraints and higher values indicating greater impediments. The integration of expert-derived weights with these environmental resistance factors provides a consistent, quantitative, and reproducible assessment of the importance and suitability of cultural heritage and recreational resources, forming the basis for subsequent corridor identification and network analysis.
2.3.4. Hot Spot Analysis
Hot spot analysis is a spatial statistical method used to identify areas of significant clustering of high or low values, revealing spatial patterns and trends of geographical phenomena [58]. This method involves evaluating the attribute values of each spatial unit and comparing them with neighbouring units to determine regions of high-value clustering (hot spots) [59]. In this study, hot spot analysis was applied to identify intersection points after overlaying multiple ecological and recreational corridors. The analysis was performed using ArcGIS 10.8, ensuring reproducible spatial computations. The calculation of the statistic is expressed as follows:
In the formula, represents the attribute value of an element , is the spatial weight between elements and , and is the total number of elements. The statistic is expressed as a z-score, where a significantly positive z-score indicates high-value clustering, and a significantly negative z-score indicates low-value clustering. The magnitude of the z-score reflects the intensity of clustering, providing a quantitative basis for identifying priority areas for ecological conservation and tourism management.
2.3.5. Evaluation of the Corridor Network Structure
The structure of the corridor network was quantitatively evaluated using the α (network closure), β (network connectivity), and γ (network connectivity rate) indices, which together describe the completeness, complexity, and connectivity of the network [60,61]. These indices allow assessment of the structural rationality of ecological and recreational corridors. The indices are calculated as follows:
In the formula, is the number of ecological corridors, denotes the number of ecological nodes, the index ranges from 0 to 1. When it is close to 0, no loop forms, and when close to 1, the loop in the ecological corridor network reaches its maximum. The β index ranges from 0 to 3. A β value greater than 1 indicates high complexity in the corridor network, = 1 means only a single-loop network is formed, and β < 1 means the structure is tree-like with a simple corridor. The index ranges from 0 to 1, where a higher value indicates better network connectivity. Higher values reflect not only stronger ecological connectivity but also greater redundancy of access routes, fairer distribution of tourism opportunities, and resilience against overuse at single sites. Integrating these indices with resistance-based corridor modelling and hot spot analysis provides a comprehensive assessment of network structure and spatial functionality.
3. Results
3.1. Construction of the Ecology Corridor
3.1.1. Identify Ecological Sources
MSPA results indicate that the Qinling–Daba Mountains are dominated by core areas (36.39% of total area; 46.61% of green land), reflecting well-preserved large forest patches vital for biodiversity and ecosystem stability. Fragmented types—edges, perforations, and islets—account for approximately 10%, indicating localized human disturbance (Table 2). Overall, the region maintains an integrated and connected forest landscape, though targeted measures are needed to conserve core areas, enhance corridor functions, and restore fragmented zones.

Table 2.
MSPA classification statistical results.
Using MSPA, the landscape core areas were identified as potential ecological source zones. Taking into account the spatial scale, the suitability of habitat patches, and the dispersal capacity of wildlife composite communities, a 1000 m patch distance threshold was set, with a connectivity probability of 0.5. Conefor 2.6 software was used to evaluate the landscape connectivity of potential ecological source patches using the IIC, PC, and dPC indices. Finally, nineteen core areas with dPC > 1 were selected as ecological source zones, and their geometric centres were extracted as ecological source points (Figure 3; Table 3).
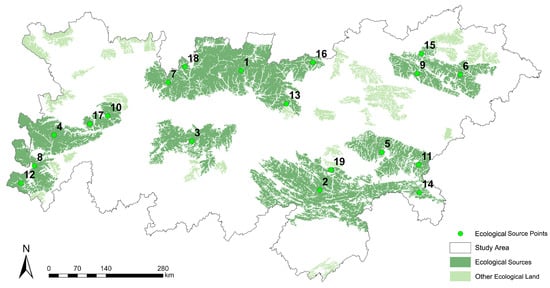
Figure 3.
Results of ecological source site extraction. Source of topographic data: Resource and Environment Science and Data Centre (https://www.resdc.cn).

Table 3.
Ranking of landscape connectivity index.
3.1.2. Construct the Resistance Surface of Ecological Corridors
In the construction of the resistance surface, factors influencing the protection and utilization resistance of ecological source points were considered. Based on the natural ecological environment and socio-economic conditions of the Qinling–Daba Mountains, seven types of data—elevation, slope, land use, NDVI, distance to rivers, roads, and residential areas—were selected as resistance factors. Resistance values for each factor were assigned on a scale from 1 to 9. The AHP was used to determine the weight of each factor (Table 4), (Figure 4). The comprehensive ecological resistance surface was constructed using the raster calculator in GIS (Figure 5).

Table 4.
Evaluation system of resistance surface.
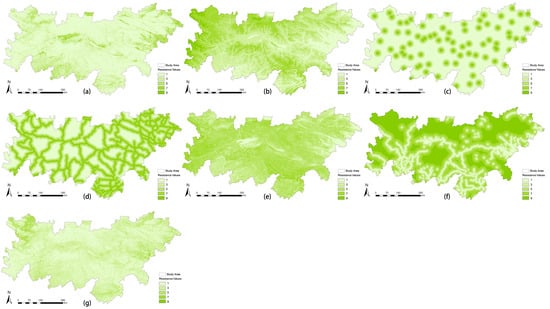
Figure 4.
Ecological resistance data. (a) Land use type; (b) slope; (c) distance to residential areas; (d) distance to roads; (e) elevation; (f) distance to rivers; (g) NDVI. Source of topographic data: Resource and Environment Science and Data Centre (https://www.resdc.cn).
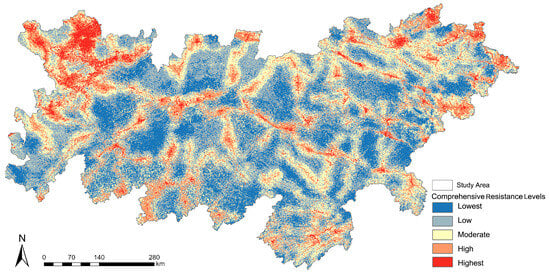
Figure 5.
Ecological Comprehensive Resistance Surface. Source of topographic data: Resource and Environment Science and Data Centre (https://www.resdc.cn).
3.1.3. Construction of the Ecological Corridor
Based on the ecological source points and the comprehensive resistance surface, the least-cost path model was used to extract cost-distance grids, back-link grids, and cost-path grids, calculating the minimum cost paths for each source point to form the preliminary ecological corridor network. On the other hand, Linkage Mapper was employed to extract the source areas. The existing corridor network was manually verified and corrected, with redundant and overlapping corridors removed, ultimately yielding the ecological corridor options, resulting in 28 corridors (Figure 6). Dense clusters occur at the Shaanxi–Sichuan junction, where river valleys and forest belts converge, creating multiple connectivity hubs. In contrast, corridors in Henan, Hubei, and Gansu are fewer and more fragmented, functioning mainly as peripheral linkages that connect isolated ecological sources to the central system. The spatial pattern indicates that the main north–south corridors secure large-scale ecological continuity essential for biodiversity and watershed protection, while peripheral corridors act as ecological shields for smaller communities.
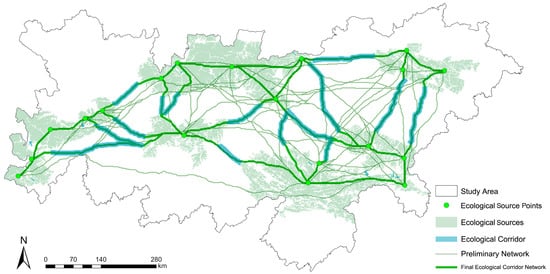
Figure 6.
Results of ecological corridor selection. Source of topographic data: Resource and Environment Science and Data Centre (https://www.resdc.cn).
3.2. Construction of the Cultural Heritage Corridor
3.2.1. Identify Cultural Heritage Sources
Cultural heritage sites serve as concentrated representations of the most iconic historical and cultural resources within a specific cultural region [62]. They act as spatial carriers of cultural exchange through time and play a crucial role in cultural transmission [63]. A total of 391 cultural heritage sites were documented, categorized into eight groups: National Famous Historical and Cultural Cities & Towns, traditional villages, ancient buildings, ancient tombs, ancient ruins, modern historical sites and buildings, grottoes and stone carvings, and intangible cultural heritage (Table 5). Three indicators—heritage type, age of existence, and spatial concentration—were selected, and the Analytic Hierarchy Process (AHP) was used to determine the weight of these factors (Table 6). A comprehensive evaluation of the cultural heritage sites’ significance in the Qinling–Daba Mountains was then conducted.

Table 5.
Statistics of cultural heritage types.

Table 6.
Evaluation factors and weights for cultural heritage.
Ancient roads, which facilitated cultural exchange between source regions via transportation routes, possess significant cultural value. This study identifies potential cultural corridors in the Qinling–Daba Mountains, including ancient postal routes, the Tea Horse Road, the Southern Silk Road, and the Sichuan Salt Road, by referencing historical documents such as The Shu Road of China: Transportation Routes and The Historical Atlas of China (Figure 7).
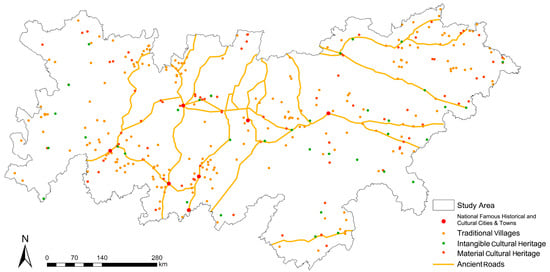
Figure 7.
Cultural heritage resources distribution. Source of topographic data: Resource and Environment Science and Data Centre (https://www.resdc.cn).
3.2.2. Construction of the Cultural Heritage Corridor
Based on the evaluation scores, representative cultural heritage source points in the Qinling–Daba Mountains were selected. Subsequently, considering both the accessibility of heritage sites and their proximity to ancient roads, 34 heritage sites were further identified as the final representative cultural source points. After integrating preliminary cultural heritage corridors with source points, those with higher source point density along the route were selected as the final 41 cultural heritage corridors (Figure 8). The 41 cultural heritage corridors largely follow historical transportation routes, aligning with the Chencang, Jinniu, and Micang Trails. Dense distributions are observed in southern Shaanxi and northern Sichuan, where ancient roads cluster and connect diverse heritage nodes. In contrast, Henan and Gansu host fewer but strategically important corridors, linking isolated cultural sites such as Dawangmiao Village (Henan) and Tianhe Village (Gansu) into the broader regional heritage network. The corridor density in the central region enhances access to a wide spectrum of cultural resources, while the extension of corridors to the eastern and western peripheries integrates smaller heritage sites into the network. This spatial configuration promotes cultural equity by broadening visibility and recognition of lesser-known villages and monuments, thereby strengthening community identity and inclusive cultural tourism.
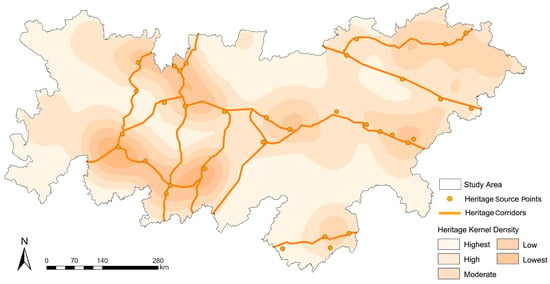
Figure 8.
Results of cultural heritage corridor and node selection. Source of topographic data: Resource and Environment Science and Data Centre (https://www.resdc.cn).
3.3. Construction of the Recreational Corridor
3.3.1. Identify Recreational Sources
Recreational corridors are composed of leisure and recreational nodes, recreational corridors themselves, and supporting service facilities [64]. Serving as linear spaces that connect urban–rural recreational resources, they possess multiple functions—including leisure and recreation, health and wellness, traffic and transportation, and ecological and resource conservation—and can cater to the daily needs of residents [65]. In this study, a total of 392 scenic spots and forest parks, 664 shopping and consumption facilities, and 420 infrastructure facilities were documented. The evaluation was assessed from three dimensions, specifically official scenic area rating systems, user reviews sourced from Chinese local life service platforms, and suitability assessment (Table 7), (Figure 9).

Table 7.
Evaluation factors and weights for recreational.

Figure 9.
(a) Kernel Density of Scenic Areas; (b) Kernel Density of Shopping and Consumption Facilities; (c) Kernel Density of Infrastructure Facilities. Source of topographic data: Resource and Environment Science and Data Centre (https://www.resdc.cn).
3.3.2. Construct the Resistance Surface of Recreational Corridors
In the construction of the Minimum Cumulative Resistance (MCR) surface, factors influencing recreational resistance were considered. Six factors, including elevation, slope, land use, and distances to roads, rivers, and historical trails, were selected as resistance factors. A resistance value range of 1–9 was set, and each resistance factor was assigned a specific value (Table 8), (Figure 10). The Analytic Hierarchy Process (AHP) was applied to determine the weights of these factors, and the Raster Calculator tool in GIS was used to construct the comprehensive resistance surface (Figure 11).

Table 8.
Evaluation factors and weights for recreational resistance.
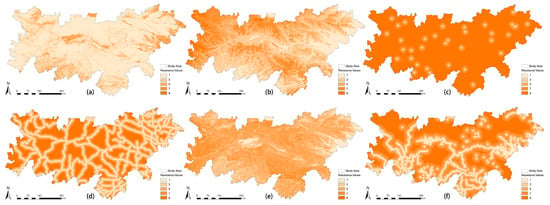
Figure 10.
Recreational resistance data. (a) Land use type; (b) slope; (c) distance to residential areas; (d) distance to roads; (e) elevation; (f) distance to rivers. Source of topographic data: Resource and Environment Science and Data Centre (https://www.resdc.cn).
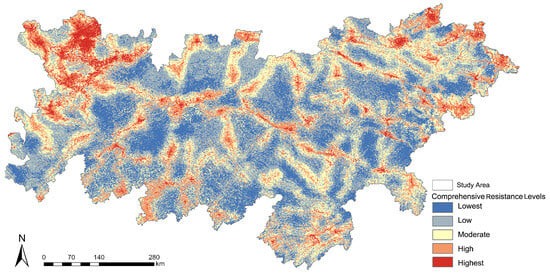
Figure 11.
Recreational Comprehensive Resistance Surface. Source of topographic data: Resource and Environment Science and Data Centre (https://www.resdc.cn).
3.3.3. Construction of the Recreational Corridor
Using recreational source points and the comprehensive resistance surface, cost-distance and cost-path rasters were extracted via the Minimum Cumulative Resistance (MCR) model. Minimum cost paths were derived, forming the initial recreational corridor network for recreation. With reference to the recreational suitability evaluation, 29 representative final recreational nodes were ultimately selected. The existing recreational corridor network was manually verified and corrected, with redundant and overlapping corridors removed, ultimately resulting in the selection of 50 recreational corridors (Figure 12). The 50 recreational corridors exhibit a clustered spatial distribution, with Sichuan and Shaanxi forming the densest recreational hubs due to the high concentration of scenic areas and consumer facilities. Peripheral provinces such as Henan, Hubei, and Gansu contain fewer corridors but host distinctive nodes, including Wudang Mountain (Hubei) and Laoshan–Jiguan Mountain (Henan), which serve as landmark destinations. Several recreational corridors follow major river valleys and transportation routes, linking urban centres with rural leisure sites. This distribution pattern highlights both opportunities and challenges for social sustainability. While clusters in core areas strengthen regional tourism competitiveness, they also risk congestion and overuse. Conversely, the sparser corridors in peripheral regions expand recreational opportunities and create new income channels for local communities, improving spatial equity in access to leisure services across urban and rural territories.
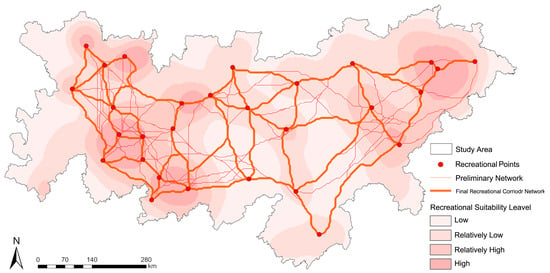
Figure 12.
Results of recreational corridor and node selection. Source of topographic data: Resource and Environment Science and Data Centre (https://www.resdc.cn).
3.4. Construction of an Ecological–Heritage–Recreational Corridor Network
3.4.1. Analysis of Composite Corridor Overlay
An overlay analysis was conducted on the three types of corridors (ecological, cultural heritage, and recreational corridors). The results revealed 180 intersection points between ecological and recreational corridors, as well as 36 intersection points between ecological and cultural heritage corridors. Subsequently, a hot spot analysis was performed using a distance threshold of 1000 m. Ecological–recreational intersection hot spots are widely distributed across Sichuan, Shaanxi, Henan, and Hubei. Meanwhile, ecological–heritage intersection hot spots are located in valley basins at the junctions of multiple provinces (Figure 13). Through this systematic process, 7 ecological–recreational composite source areas and 5 ecological–heritage–recreational composite source areas were ultimately identified (Figure 14).

Figure 13.
Hot spot analysis. (a) Ecological–Recreational Intersection Hot spot; (b) Ecological–Heritage Intersection Hot spot. Source of topographic data: Resource and Environment Science and Data Centre (https://www.resdc.cn).
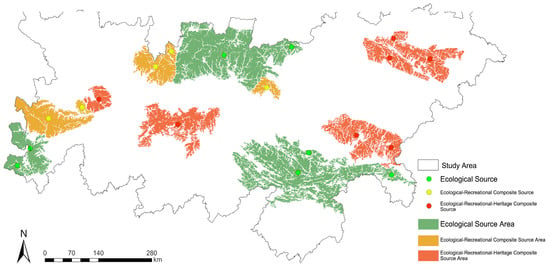
Figure 14.
Results of Composite Source site extraction. Source of topographic data: Resource and Environment Science and Data Centre (https://www.resdc.cn).
3.4.2. Construction of the Composite Corridor Network
By overlaying the three types of corridors with nodes and with reference to the distribution of composite source areas, the redundant corridor segments in the overlaid corridor system were systematically screened and eliminated. This optimization procedure was further guided by the intersection points of the multiple functional corridors, ensuring that only non-redundant, functionally synergistic segments were retained (Figure 15).
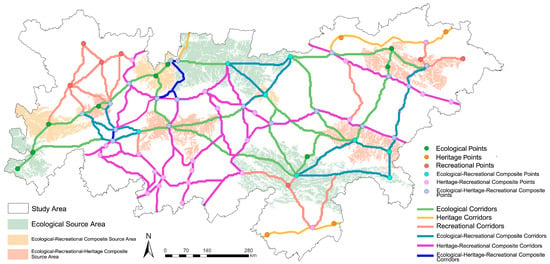
Figure 15.
Results of composite corridor and node selection. Source of topographic data: Resource and Environment Science and Data Centre (https://www.resdc.cn).
The composite network contains 69 multifunctional nodes and 141 corridors (Table 9). Its spatial distribution is uneven. Dense clusters appear in the central and southwestern Qinling–Daba Mountains—especially at the junction of Shaanxi, Sichuan, and Chongqing—where ecological, cultural, and recreational resources intersect to form multifunctional hubs. These hubs act as the backbone of the network. In contrast, Henan, Hubei, and Gansu have fewer but strategically important nodes, which are more scattered. For instance, Laoshan–Jiguan Mountain in Henan functions as a gateway node bridging eastern cultural resources with the central ecological system, while Wudang Mountain in Hubei integrates ecological and cultural values into a single hub of regional influence.

Table 9.
Classification of key nodes and corridors in the composite corridor network.
From a social sustainability perspective, this distribution highlights the dual role of core and peripheral areas. The central clusters provide dense multifunctional corridors that enhance regional connectivity, attract diverse tourism flows, and concentrate governance efforts. Meanwhile, peripheral nodes and corridors ensure long-distance continuity and extend ecological, cultural, and recreational benefits to more remote communities. This balance reduces spatial inequality, promotes cross-provincial collaboration, and strengthens urban–rural integration. By identifying multifunctional hubs at administrative boundaries, the composite network also provides a strategic foundation for coordinated governance across provinces, directly supporting SDG 11 objectives of inclusivity, resilience, and sustainability in urban–rural systems.
3.4.3. Analysis of Connectivity Evaluation Results for Composite Corridors
The α, β, and γ indices were adopted to analyze and evaluate the network structure of the composite corridors. From the evaluation results, the Composite corridor has the best overall connectivity: it has the largest number of nodes and corridors, with more comprehensive functional coverage and a denser network. Its key connectivity indices (network closure, node connection rate, node connectivity) are all higher than those of single-function corridors, indicating stronger closed-loop connectivity, more linkage paths, and improved network stability (Table 10). The composite network demonstrates how multifunctional corridors can serve as strategic instruments for cross-provincial governance, ensuring that conservation, tourism, and cultural heritage objectives are not pursued in isolation. Its higher connectivity indices translate into greater resilience, redundancy of access routes, and more equitable distribution of benefits.

Table 10.
Evaluation of corridor network structure indices.
4. Discussion
4.1. Interpretation of Corridor Network Characteristics
This study set out to design and evaluate a multi-functional corridor system that supports ecological processes, cultural continuity, and recreation across the Qinling–Daba region, with attention to what these patterns mean for urban and township neighbourhood. Composite nodes account for roughly 70% of all identified key nodes, indicating that most critical locations serve ecological, cultural, and recreational functions at the same time and therefore need management that recognizes their different roles. Ecological and recreational sites such as Panda Valley in Shaanxi call for calibrated visitor management, seasonal volunteer programme, tiered environmental interpretation, and temporary closures triggered by habitat-disturbance thresholds so that biodiversity protection and nature-based education proceed together. Heritage and recreational nodes along ancient routes, represented by the Dihua Scenic Area, benefit from integrated interpretation, facility design that respects traditional scales and materials, and continuous microclimate monitoring of heritage assets to maintain significance while improving the visitor experience. A small set of multi-functional nodes in locations such as Hanzhong City act as integrated hubs and require comprehensive monitoring of visitor flows, heritage microclimate, and vegetation health, together with threshold-based early warning and phased crowd management to prevent conflicts among uses.
Within the corridor network, composite corridors constitute approximately 57% of all linkages, underscoring the importance of routes that connect ecological sources, cultural resources, and recreational destinations. Ecological and recreational corridors along the Han River are best supported by differentiated trail designs such as natural-material observation paths and permeable greenways, complemented by riparian buffers, ecological service stations, and bank stabilization to minimize disturbance while enhancing education and safety. Heritage and recreational corridors in the Micang and Jinniu Mountains rely on restoration of traditional road structures, heritage-themed stopping points, and careful control of the massing and colour of modern facilities in key viewsheds to maintain linear cultural landscape integrity. Scarce multi-functional corridors such as the core Micang Ancient Road suit a hierarchical planning principle in which ecological connectivity is secured first, heritage preservation is then consolidated, and recreational accessibility is organized within defined carrying capacities. Protective measures including native vegetation buffers can create ecological isolation zones that shield sensitive habitats and enable coordinated multifunctional use. Overall, the network displays high connectivity with moderate loop formation. Together with the network indices, this indicates structural redundancy and robustness. The finalized system contains 69 key nodes and 141 corridors, supporting species movement and cultural linkages while highlighting places of strong functional synergy and potential. It is also important to note that areas not included in the finalized network still provide ecological and cultural value as local enclaves or alternative linkages, and should be preserved within the broader landscape to avoid monotony and loss of territorial diversity.
4.2. Planning Implications for Social Sustainability
International practice links green corridors, cultural routes, and everyday walking networks to support conservation and social sustainability [66]. Our results suggest a practical route for the Qinling–Daba context. We propose treating the corridor network as social-ecological infrastructure. Within spatial plans and national-park zoning, this view helps align mapped widths, connectivity targets, and restoration actions with local design controls. In core areas, ecological connectivity should take priority. In heritage zones, design should follow visual corridors and microclimate thresholds. In buffer areas, recreational access must stay within clear carrying capacities. At gateways to towns and cities, service hubs should link public transport with safe walking and cycling. These hubs can also ensure barrier-free access for older adults, children, and people with disabilities. During sensitive seasons, reservation or time-based entry can moderate use without excluding low-income groups by allocating off-peak or free quotas.
Operationally, breakpoints created by settlements, roads, or steep slopes can be treated with slope revegetation, wildlife crossings, and bank stabilization. Privacy-aware digital tools can track visitor flows and microclimate to trigger seasonal route adjustments for breeding, migration, heat waves, or floods, and reporting these adjustments to neighbourhood councils helps maintain procedural fairness and transparency. At the same time, planning should remain attentive to the perceptions of local communities and heritage custodians, ensuring that weighting decisions and management priorities reflect shared values and not only expert judgement. Institutionally, a basin- or region-level corridor committee can maintain inventories, approve alignments and standards, and operate shared databases. Implementation works best when co-produced with neighbourhood councils, heritage custodians, and user groups so that small-scale fixes such as shaded seating, way finding, and minor repairs are locally initiated while structural issues are escalated. In this framing, the corridor system advances SDG 11 by improving inclusive mobility, safeguarding cultural and natural heritage, and expanding safe, inclusive public and green spaces, while linking connectivity to neighbourhood outcomes in equity, cohesion, health, and participation.
4.3. Limitations and Future Research
Several limitations warrant further development. First, areas that did not reach the thresholds for inclusion were excluded from the final corridor network. Yet these sites remain ecologically and culturally valuable as enclaves, pockets, or potential alternative routes, albeit with reduced functional complexity. Future work should treat the corridor system as a ranking of valuable routes rather than a strict filter, so that territorial diversity and local identity are preserved and risks of monotony are avoided. Second, the resistance weightings in the AHP relied primarily on expert judgement. This reduces the social legitimacy of the model, as the perceptions of local communities, heritage custodians, and recreational users were only indirectly represented. Incorporation of participatory mapping, stakeholder surveys, and workshops would allow calibration of weights and thresholds, embedding analytical decision-making within a bottom-up perspective so that technical criteria are complemented by local aspirations. Third, the study targeted general wildlife communities; integration of habitat selection, activity ranges, and seasonal movement needs of the giant panda and the golden snub-nosed monkey would allow checks on corridor width, within-corridor microhabitats, and disturbance levels, with alternative routes and widening strategies proposed where bottlenecks are identified. Fourth, the socio-economic dynamics were not examined in detail. While equity and accessibility were highlighted, the study did not fully engage with potential conflicts among tourism development, heritage preservation, and the everyday needs of local communities. Future research should explicitly investigate these tensions and propose governance and compensation mechanisms that balance economic benefits with cultural safeguarding and community well-being. Finally, the model is strong in spatial representation but less so in temporal adaptability. Corridors must remain responsive to evolving drivers such as tourism pressures, land use change, and climate dynamics. Future refinements should distinguish between relatively stable datasets (e.g., topography, historical routes) and highly volatile datasets (e.g., visitor flows, seasonal wildlife movements), with mechanisms for periodic updates and scenario testing to sustain corridor relevance over time.
5. Conclusions
This study systematically constructed an ecological–heritage–recreational composite corridor network for the Qinling–Daba Mountains, identifying 19 high-connectivity ecological sources, 34 representative cultural heritage nodes, and 29 recreational nodes. By combining resistance surfaces with spatial coupling, we built a multifunctional network containing 141 corridor segments and 69 key nodes. Connectivity indices confirm the structural soundness of this network. It can simultaneously support species migration, cultural continuity, and sustainable recreation.
Beyond integrating conservation and development, the framework represents an innovative attempt to couple ecological, cultural, and recreational corridors in a single planning model. This integration directly enhances social sustainability by improving spatial equity, inclusive access, and cross-regional cooperation. From a practical perspective, the network provides a decision-support tool that informs biodiversity conservation, heritage protection, and sustainable tourism, while also offering guidance for urban–rural planning and built environment management. Aligned with China’s “14th Five-Year Plan,” the approach has transferable value for other ecologically and culturally significant regions worldwide [67].
Ultimately, the proposed network contributes to SDGs 11, 13, and 15, demonstrating how integrative corridor planning can strengthen ecological resilience, cultural preservation, and social well-being under growing socio-ecological pressures. Looking forward, recognizing the value of excluded areas, embedding participatory approaches, addressing socio-economic tensions, and ensuring temporal adaptability will allow future applications of this framework to remain inclusive, legitimate, and resilient under dynamic conditions. Although rooted in the Qinling–Daba context, the framework offers valuable lessons for other ecologically and culturally significant regions worldwide, providing practical guidance for advancing social sustainability in diverse urban and regional settings.
Author Contributions
T.C.: conceptualization, methodology, software, formal analysis, investigation, resources, data curation, writing—original draft preparation, writing—review and editing, visualization; C.L.: validation, supervision, writing—review and editing; Z.L.: conceptualization, project administration, funding acquisition, supervision, validation. All authors have read and agreed to the published version of the manuscript.
Funding
This research was funded by Social Science Research Program of the Ministry of Education of China, grant number 22YJA760045.
Data Availability Statement
The original contributions presented in this study are included in the article, and further inquiries can be directed to the corresponding author.
Acknowledgments
The figures and tables in this text were all drawn by the authors.
Conflicts of Interest
The authors declare no conflicts of interest.
Abbreviations
The following abbreviations are used in this manuscript:
| MSPA | Morphological Spatial Pattern Analysis |
| AHP | Analytic Hierarchy Process |
| MCR | Minimum Cumulative Resistance |
| NDVI | Normalized Difference Vegetation Index |
| POI | Point of Interest |
| IIC | Integral Index of Connectivity |
| PC | Probability of Connectivity |
| dPC | Delta Probability of Connectivity |
| DEM | Digital Elevation Model |
| SDGs | Sustainable Development Goals |
References
- Musacchio, L.; Ozdenerol, E.; Bryant, M.; Evans, T. Changing landscapes, changing disciplines: Seeking to understand interdisciplinarity in landscape ecological change research. Landsc. Urban Plan. 2005, 73, 326–338. [Google Scholar] [CrossRef]
- Nassauer, J.I.; Opdam, P. Design in science: Extending the landscape ecology paradigm. Landsc. Ecol. 2008, 23, 633–644. [Google Scholar] [CrossRef]
- Xie, H.; Zhu, Z.; He, Y.; Zeng, X.; Wen, Y. Integrated framework of rural landscape research: Based on the global perspective. Landsc. Ecol. 2022, 37, 1161–1184. [Google Scholar] [CrossRef]
- Wang, J.; Zhao, W.; Ding, J.; Liu, Y. Shifting research paradigms in landscape ecology: Insights from bibliometric analysis. Landsc. Ecol. 2025, 40, 63. [Google Scholar] [CrossRef]
- Cai, Z.; Fang, C.; Zhang, Q.; Chen, F. Correction to: Joint development of cultural heritage protection and tourism: The case of Mount Lushan cultural landscape heritage site. Herit. Sci. 2021, 9, 146. [Google Scholar] [CrossRef]
- Musacchio, L.R. The grand challenge to operationalize landscape sustainability and the design-in-science paradigm. Landsc. Ecol. 2011, 26, 1–5. [Google Scholar] [CrossRef]
- Renes, H.; Centeri, C.; Kruse, A.; Kučera, Z. The Future of Traditional Landscapes: Discussions and Visions. Land 2019, 8, 98. [Google Scholar] [CrossRef]
- Rędzińska, K.; Szulczewska, B.; Wolski, P. The landscape thresholds analysis as an integrated approach to landscape interpretation for planning purposes. Land Use Policy 2022, 119, 106141. [Google Scholar] [CrossRef]
- Mikusiński, G.; Blicharska, M.; Antonson, H.; Henningsson, M.; Göransson, G.; Angelstam, P.; Seiler, A. Integrating Ecological, Social and Cultural Dimensions in the Implementation of the Landscape Convention. Landsc. Res. 2012, 38, 384–393. [Google Scholar] [CrossRef]
- O’Farrell, P.J.; Anderson, P.M. Sustainable multifunctional landscapes: A review to implementation. Curr. Opin. Environ. Sustain. 2010, 2, 59–65. [Google Scholar] [CrossRef]
- Liu, Y.; Li, X.; Lu, S.; Xie, L.; Huang, Z. Identifying Landscape Character in Multi-Ethnic Areas in Southwest China: The Case of the Miao Frontier Corridor. Land 2025, 14, 1571. [Google Scholar] [CrossRef]
- Zhang, Q.; Sun, Y.; Tang, D.; Cheng, H.; Tu, Y. Construction and Zoning of Ecological Security Patterns in Yichang City. Sustainability 2025, 17, 2354. [Google Scholar] [CrossRef]
- Tang, H.; Li, W.; Yan, X. Spatiotemporal Evolution Characteristics and Influencing Factors of Cross-Regional Tourism Corridors: A Tourism Geography Perspective. Sustainability 2025, 17, 1126. [Google Scholar] [CrossRef]
- Fábos, J.G.; Ryan, R.L. International greenway planning: An introduction. Landsc. Urban Plan. 2004, 68, 143–146. [Google Scholar] [CrossRef]
- Fabos, J.G. Introduction and overview: The greenway movement, uses and potentials of greenways. Landsc. Urban Plan. 1995, 33, 1–13. [Google Scholar] [CrossRef]
- Lewis, P.H. Quality corridors for Wisconsin. Landsc. Archit. 1964, 54, 31–40. [Google Scholar]
- Fábos, J.G.; Ahern, J. (Eds.) Greenways: The Beginning of an International Movement; Elsevier: Amsterdam, The Netherlands, 1996; pp. 1–256. [Google Scholar]
- Jiang, L.; Cai, J.; Fan, Y. Spatiotemporal Distribution and Heritage Corridor Construction of Vernacular Architectural Heritage in the Cao’e River, Jiaojiang River, and Oujiang River Basin. Land 2025, 14, 1484. [Google Scholar] [CrossRef]
- Yu, Y.; Yu, B.; Zhang, X.; Ma, L.; Zhao, C.; Jia, Y.; Liu, B. Construction of symbiosis corridors for heritage resources and optimization of conservation strategies in the basin: A case study of the Yellow River basin in Shandong, China. Ecol. Indic. 2025, 178, 113962. [Google Scholar] [CrossRef]
- Liu, X.; Wu, T.; Xie, Z.; Yuan, W.; Yang, H. Creating the Spatial Utilization Pattern of Traditional Villages in the Yellow River by Connecting the Heritage Corridors System with the Assessment of Tourism Potential. Land 2025, 14, 1402. [Google Scholar] [CrossRef]
- Forman, R.T.T.; Godron, M. Landscape Ecology; Wiley: Hoboken, NJ, USA, 1986; p. 123. [Google Scholar]
- Popescu, O.-C.; Tache, A.-V.; Petrișor, A.-I. Methodology for Identifying Ecological Corridors: A Spatial Planning Perspective. Land 2022, 11, 1013. [Google Scholar] [CrossRef]
- Peng, J.; Zhao, H.; Liu, Y. Urban ecological corridors construction: A review. Acta Ecol. Sin. 2017, 37, 23–30. [Google Scholar] [CrossRef]
- Ding, G.; Yi, D.; Yi, J.; Guo, J.; Ou, M.; Ou, W.; Pueppke, S.G. Protecting and constructing ecological corridors for biodiversity conservation: A framework that integrates landscape similarity assessment. Appl. Geogr. 2023, 160, 103098. [Google Scholar] [CrossRef]
- Zhou, D.; Song, W. Identifying Ecological Corridors and Networks in Mountainous Areas. Int. J. Environ. Res. Public Health. 2021, 18, 4797. [Google Scholar] [CrossRef]
- Chen, R.; Carruthers-Jones, J.; Carver, S.; Wu, J. Constructing urban ecological corridors to reflect local species diversity and conservation objectives. Sci. Total Environ. 2024, 907, 167987. [Google Scholar] [CrossRef]
- Lin, S.; Maruthaveeran, S.; Yusof, M.J.M. Visitors’ recreational & leisure experiences in urban river corridors? A case study of Hutuo River in Shijiazhuang, China. Urban For. Urban Green. 2024, 98, 128416. [Google Scholar] [CrossRef]
- Dickens, S.J.M.; Gerhardt, F.; Collinge, S.K. Recreational Portage trails as corridors facilitating non-native plant invasions of the boundary waters canoe area wilderness (USA). Conserv. Biol. 2005, 19, 1653–1657. [Google Scholar] [CrossRef]
- Xu, H.; Plieninger, T.; Primdahl, J. A Systematic Comparison of Cultural and Ecological Landscape Corridors in Europe. Land 2019, 8, 41. [Google Scholar] [CrossRef]
- Shi, L.; Maruthaveeran, S.; Yusof, M.J.M.; Dai, C. Exploring Factors Influencing Recreational Experiences of Urban River Corridors Based on Social Media Data. Appl. Sci. 2024, 14, 4086. [Google Scholar] [CrossRef]
- Briffett, C. Is managed recreational use compatible with effective habitat and wildlife occurrence in urban open space corridor systems? Landsc. Res. 2001, 26, 137–163. [Google Scholar] [CrossRef]
- Hu, J.; Jiao, S.; Xia, H.; Qian, Q. Construction of Rural Multifunctional Landscape Corridor Based on MSPA and MCR Model—Taking Liukeng Cultural and Ecological Tourism Area as an Example. Sustainability 2023, 15, 12262. [Google Scholar] [CrossRef]
- Ge, Y.; Liu, Y.; Ma, Y.; Wang, Y.; Guo, Y.; He, J.; Mao, Y. Spatial identification and corridor network analysis of cultural heritage based on multi-model fusion: A case study of western Henan. Ecol. Indic. 2025, 178, 113859. [Google Scholar] [CrossRef]
- Li, Y.; Wang, X.; Dong, X. Delineating an Integrated Ecological and Cultural Corridor Network: A Case Study in Beijing, China. Sustainability 2021, 13, 412. [Google Scholar] [CrossRef]
- Zhao, Y.; Wu, H.; Fan, Y.; Jin, H.; Wang, Y.; Lu, L. Integrated study on the conservation of ecocultural heritage in the Tiantai Mountain area, China. Herit. Sci. 2024, 12, 290. [Google Scholar] [CrossRef]
- Sun, Y.; Wang, Y.; Liu, L.; Wei, Z.; Li, J.; Cheng, X. Large-scale cultural heritage conservation and utilization based on cultural ecology corridors: A case study of the Dongjiang-Hanjiang River Basin in Guangdong, China. Herit. Sci. 2024, 12, 44. [Google Scholar] [CrossRef]
- Feng, X.; Hu, M.; Somenahalli, S.; Bian, X.; Li, M.; Zhou, Z.; Li, F.; Wang, Y. A Study of Spatio-Temporal Differentiation Characteristics and Driving Factors of Shaanxi Province’s Traditional Heritage Villages. Sustainability 2023, 15, 7797. [Google Scholar] [CrossRef]
- Wang, X.; Wang, X.; Tu, Y.; Yao, W.; Zhou, J.; Jia, Z.; Sun, Z. Systematic conservation planning considering ecosystem services can optimize the conservation system in the Qinling-Daba Mountains. J. Environ. Manag. 2024, 368, 122096. [Google Scholar] [CrossRef]
- Zhang, Y.; Yin, H.; Zhu, L.; Miao, C. Landscape Fragmentation in Qinling–Daba Mountains Nature Reserves and Its Influencing Factors. Land 2021, 10, 1124. [Google Scholar] [CrossRef]
- Zhang, X.; Zhang, B.; Yao, Y.; Wang, J.; Yu, F.; Liu, J.; Li, J. Dynamics and climatic drivers of evergreen vegetation in the Qinling-Daba Mountains of China. Ecol. Indic. 2022, 136, 108625. [Google Scholar] [CrossRef]
- Wang, X.D.; Chen, G. Basic Types and Specific Characteristics of Village Landscape along the Sichuan Road in Guanzhong Area in Late Qing Dynasty. For. Chem. Rev. 2025, 2098–2108. Available online: http://www.forestchemicalsreview.com/index.php/JFCR/article/view/1069 (accessed on 17 September 2025).
- Song, M.; Li, S.; Paudel, B.; Pan, F. A Framework for Multifunctional Green Infrastructure Planning Based on Ecosystem Service Synergy/Trade-Off Analysis: Application in the Qinling–Daba Mountain Area. Land 2025, 14, 1287. [Google Scholar] [CrossRef]
- Jiang, Y.; Zhang, B.; Yao, Y.; Li, J.; Liu, J. Effects of the Qinling-Daba Mountains as Ecological Corridor on Patterns of Plant Distribution. Ecol. Evol. 2025, 15, e71633. [Google Scholar] [CrossRef]
- Yu, F.; Zhang, B.; Yao, Y.; Wang, J.; Zhang, X.; Liu, J.; Li, J. Identifying Connectivity Conservation Priorities among Protected Areas in Qinling-Daba Mountains, China. Sustainability 2022, 14, 4377. [Google Scholar] [CrossRef]
- Qinling-Daba Mountains Regional Development and Poverty Alleviation Plan. Available online: https://www.jianpincn.com/Themes/ueditor/net/upload/file/20160406/6359555476305731981942992.pdf (accessed on 1 September 2025).
- Tan, Q.X. Zhongguo Lishi Dituji [The Historical Atlas of China]; SinoMaps Press: Beijing, China, 1982. [Google Scholar]
- Vogt, P.; Riitters, K.H.; Estreguil, C.; Kozak, J.; Wade, T.G.; Wickham, J.D. Mapping spatial patterns with morphological image processing. Landsc. Ecol. 2007, 22, 171–177. [Google Scholar] [CrossRef]
- Zhou, Y.; Geng, J.; Liu, X. Urban Habitat Quality Enhancement and Optimization under Ecological Network Constraints. Land 2024, 13, 1640. [Google Scholar] [CrossRef]
- Lim, C.H. Establishing an Ecological Network to Enhance Forest Connectivity in South Korea’s Demilitarized Zone. Land 2024, 13, 106. [Google Scholar] [CrossRef]
- Saura, S.; Pascual, H.L. A new habitat availability index to integrate connectivity in landscape conservation planning: Comparison with existing indices and application to a case study. Landsc. Urban Plan. 2007, 83, 91–103. [Google Scholar] [CrossRef]
- Yang, K.; Cao, Y.-G.; Feng, Z.; Geng, B.J.; Feng, Y.; Wang, S.F. Research Progress of Ecological Security Pattern Construction Based on Minimum Cumulative Resistance Model. J. Ecol. Rural Environ. 2021, 37, 555–565. [Google Scholar] [CrossRef]
- Luo, L.; Yang, C.; Chen, R.; Liu, W. Comprehensive Land Consolidation Zoning Based on Minimum Cumulative Resistance Model—A Case Study of Chongqing, Southwest China. Land 2023, 12, 1935. [Google Scholar] [CrossRef]
- Liu, P.-X.; Liu, Y.; Li, T.-N.; Guo, W.-W.; Yang, A.-L.; Yang, X.; Li, E.-Z.; Wang, Z.-J. Identification and Trend Analysis of Ecological Security Pattern in Mudanjiang City Based on MSPA-MCR-PLUS Model. Sustainability 2024, 16, 9690. [Google Scholar] [CrossRef]
- Yao, L.; Gao, C.; Zhuang, Y.; Yang, H.; Wang, X. Exploring the Spatiotemporal Dynamics and Simulating Heritage Corridors for Sustainable Development of Industrial Heritage in Foshan City, China. Sustainability 2024, 16, 5605. [Google Scholar] [CrossRef]
- Zhao, J. Research on computation methods of AHP weight vector and its applications. Math. Prac. Theory 2012, 42, 93–100. [Google Scholar] [CrossRef]
- Lian, W.; Dimitrijević, B. Analytic Hierarchy Process-Based Industrial Heritage Value Evaluation Method and Reuse Research in Shaanxi Province—A Case Study of Shaanxi Steel Factory. Sustainability 2025, 17, 4125. [Google Scholar] [CrossRef]
- Kara, C.; Iranmanesh, A. Protection Boundary Development in Historical–Cultural Built Environments Using Analytical Hierarchy Process (AHP) and Geographic Information System (GIS). Urban Sci. 2025, 9, 173. [Google Scholar] [CrossRef]
- Wang, R.; Zhang, Y.; Zhang, H.; Yu, H. Social Value Assessment and Spatial Expression of National Park Ecosystems Based on Residents’ Perceptions. Sustainability 2022, 14, 4206. [Google Scholar] [CrossRef]
- Cao, Z.; Liu, T.; Li, X.; Wang, J.; Lin, H.; Chen, L.; Wu, Z.; Ma, W. Individual and Interactive Effects of Socio-Ecological Factors on Dengue Fever at Fine Spatial Scale: A Geographical Detector-Based Analysis. Int. J. Environ. Res. Public Health. 2017, 14, 795. [Google Scholar] [CrossRef] [PubMed]
- Chen, W.; Zhao, J.; Chen, G.; Lin, Y.; Yang, H.; Chen, Q. Ecological Network Optimization and Security Pattern Development for Kunming’s Main Urban Area Using the MSPA-MCR Model. Sustainability 2025, 17, 3623. [Google Scholar] [CrossRef]
- Luo, X.; Luo, X.; Yang, X.; Wang, J.; Liao, J.; He, Y.; Du, Y.; Yang, Y. Optimization of the Loess Plateau of the China Ecological Network Pattern Based on a PLUS Model. Land 2025, 14, 1488. [Google Scholar] [CrossRef]
- Travis, C. Heritage GIS: Deep Mapping, Preserving, and Sustaining the Intangibility of Cultures and the Palimpsests of Landscape in the West of Ireland. Sustainability 2025, 17, 6870. [Google Scholar] [CrossRef]
- Liu, R.; Meng, D.; Wang, M.; Gong, H.; Li, X. Analysis of Spatiotemporal Dynamics and Driving Mechanisms of Cultural Heritage Distribution Along the Jiangnan Canal, China. Sustainability 2025, 17, 5026. [Google Scholar] [CrossRef]
- Wilson, M.B.; Belote, R.T. The Value of Trail Corridors for Bold Conservation Planning. Land 2022, 11, 348. [Google Scholar] [CrossRef]
- Jing, Z.; Chen, P. Research on the Construction of a Composite Humanistic Forest Ecological Corridor in the Main Urban Area of Daqing City. Sustainability 2024, 16, 3122. [Google Scholar] [CrossRef]
- Meng, F.; Dong, L.; Zhang, Y. Spatiotemporal Dynamic Analysis and Simulation Prediction of Land Use and Landscape Patterns from the Perspective of Sustainable Development in Tourist Cities. Sustainability 2023, 15, 14450. [Google Scholar] [CrossRef]
- Yang, E.; Yao, Q.; Long, B.; An, N.; Liu, Y. Progress in the Research of Features and Characteristics of Mountainous Rural Settlements: Distribution, Issues, and Trends. Sustainability 2024, 16, 4410. [Google Scholar] [CrossRef]
Disclaimer/Publisher’s Note: The statements, opinions and data contained in all publications are solely those of the individual author(s) and contributor(s) and not of MDPI and/or the editor(s). MDPI and/or the editor(s) disclaim responsibility for any injury to people or property resulting from any ideas, methods, instructions or products referred to in the content. |
© 2025 by the authors. Licensee MDPI, Basel, Switzerland. This article is an open access article distributed under the terms and conditions of the Creative Commons Attribution (CC BY) license (https://creativecommons.org/licenses/by/4.0/).