Abstract
Acrylic is increasingly being used in structural engineering applications due to its characteristics of light weight, capability of bulk polymerization, and absence of self-destruction risk, compared to tempered glass. However, structural acrylic exhibits creep behavior when subjected to prolonged loading. In order to study the creep performance of structural acrylic base material and coupons connected using the bulk polymerization technique, short-term tensile tests and long-term creep tests were conducted, and the effect of annealing temperature controlled in the bulk polymerization process was considered. The results show that annealing temperature significantly affects the quality of bulk polymerization. The Burgers model accurately describes the viscoelastic behavior of acrylic, and the Prony series converted from the parameters in the Burgers model can be directly implemented in Abaqus and accurately simulates the creep behavior of acrylic. The equation proposed in this study, on the basis of the Findley model, is precise enough to predict the creep curves of acrylic base material and connecting coupons. The Time–Stress Superposition Principle is valid when the time is greater than the threshold value.
1. Introduction
Polymethyl methacrylate, commonly known as acrylic or PMMA, has emerged as a significant structural material in engineering. The performance of acrylic can be tailored through optimization of its formulation []. Acrylic employed in structural engineering applications, which is termed structural acrylic, is required to exhibit superior mechanical performance and resistance to aging. In comparison with conventional tempered glass typically employed in structures, structural acrylic exhibits three distinct advantages []: (a) significantly reduced weight (approximately 50% lighter than glass), (b) high mechanical strength [], stemming from its long-chain [] flexible molecular structure [], which endows it with excellent tensile and impact resistance, and (c) the feasibility of connecting various sheets through bulk polymerization technique, similar to welding of steel structures. Consequently, structural acrylic has gained increasing prominence in architectural and large-scale structural applications. For instance, the JUNO detector [] located in Jiangmen, China, features an ultra-large acrylic sphere with a diameter of 32.4 m, capable of containing 2000 tons of liquid scintillator. In these engineering applications, structural acrylic spliced components fabricated via bulk polymerization have been extensively utilized.
Structural acrylic exhibits high short-term tensile strength, exceeding 70 MPa according to GB/T 7134 [], which satisfies the essential requirements for engineering materials. However, Structural acrylic demonstrates pronounced creep behavior at ambient temperature, resulting in significantly reduced allowable stress under long-term loading conditions. As a viscoelastic material, acrylic exhibits dual deformation characteristics under external loading: instantaneous elastic deformation and time-dependent deformation. This fundamental mechanical behavior constitutes the essential mechanism of creep phenomenon in acrylic.
The Maxwell model, consisting of a spring and dashpot in series, was initially proposed by James Clerk Maxwell in 1867 to characterize viscoelastic constitutive relationships. Subsequently, the Kelvin model, featuring a parallel arrangement of a spring and dashpot, was developed. While these fundamental models serve as basic tools for analyzing material viscoelasticity, their simplistic formulations significantly limit their capability to accurately model creep behavior. Consequently, researchers have developed advanced viscoelastic constitutive models to study more complex creep mechanisms []. Notable developments include the standard linear solid Kelvin model [], standard linear solid Maxwell model [], Burgers model [], and Generalized Maxwell model []. Among these constitutive models, the Burgers model, which combines a Kelvin model and Maxwell model in series, has emerged as a widely adopted approach for characterizing polymer creep behavior due to its ability to accurately capture both the instantaneous elastic deformation (from the Maxwell spring), primary creep with its retarded elasticity (from the Kelvin unit), and the continuous secondary creep flow (from the Maxwell dashpot).
Beyond the well-established viscoelastic models, various theoretical frameworks, including the Andrade [], Norton [], Norton-Bailey [], and Findley models [], have been developed to characterize material creep behavior. While these models demonstrate excellent fitting capabilities for polymeric materials, their parameter definitions often lack physical clarity and interpretability.
Furthermore, the accurate prediction of long-term creep behavior in structural acrylic remains a critical challenge, significantly impacting its engineering applications. However, long-term creep testing under low stress conditions presents significant challenges due to its time-intensive nature and high experimental costs. A practical alternative involves extrapolating low-stress data from high-stress or high-temperature measurements, leveraging the Time–Temperature–Stress Superposition Principle (TTSSP) [,,]. Under isothermal conditions, TTSSP simplifies to the Time–Stress Superposition Principle (TSSP) [,]. The applicability of TSSP for predicting creep behavior in acrylic has been validated by Zhou [] through experimental studies on specimens immersed in liquid nitrogen. Wang [] derived a TSSP-based expression that accounts for physical aging and rheological damage, demonstrating excellent predictive capability for acrylic creep behavior.
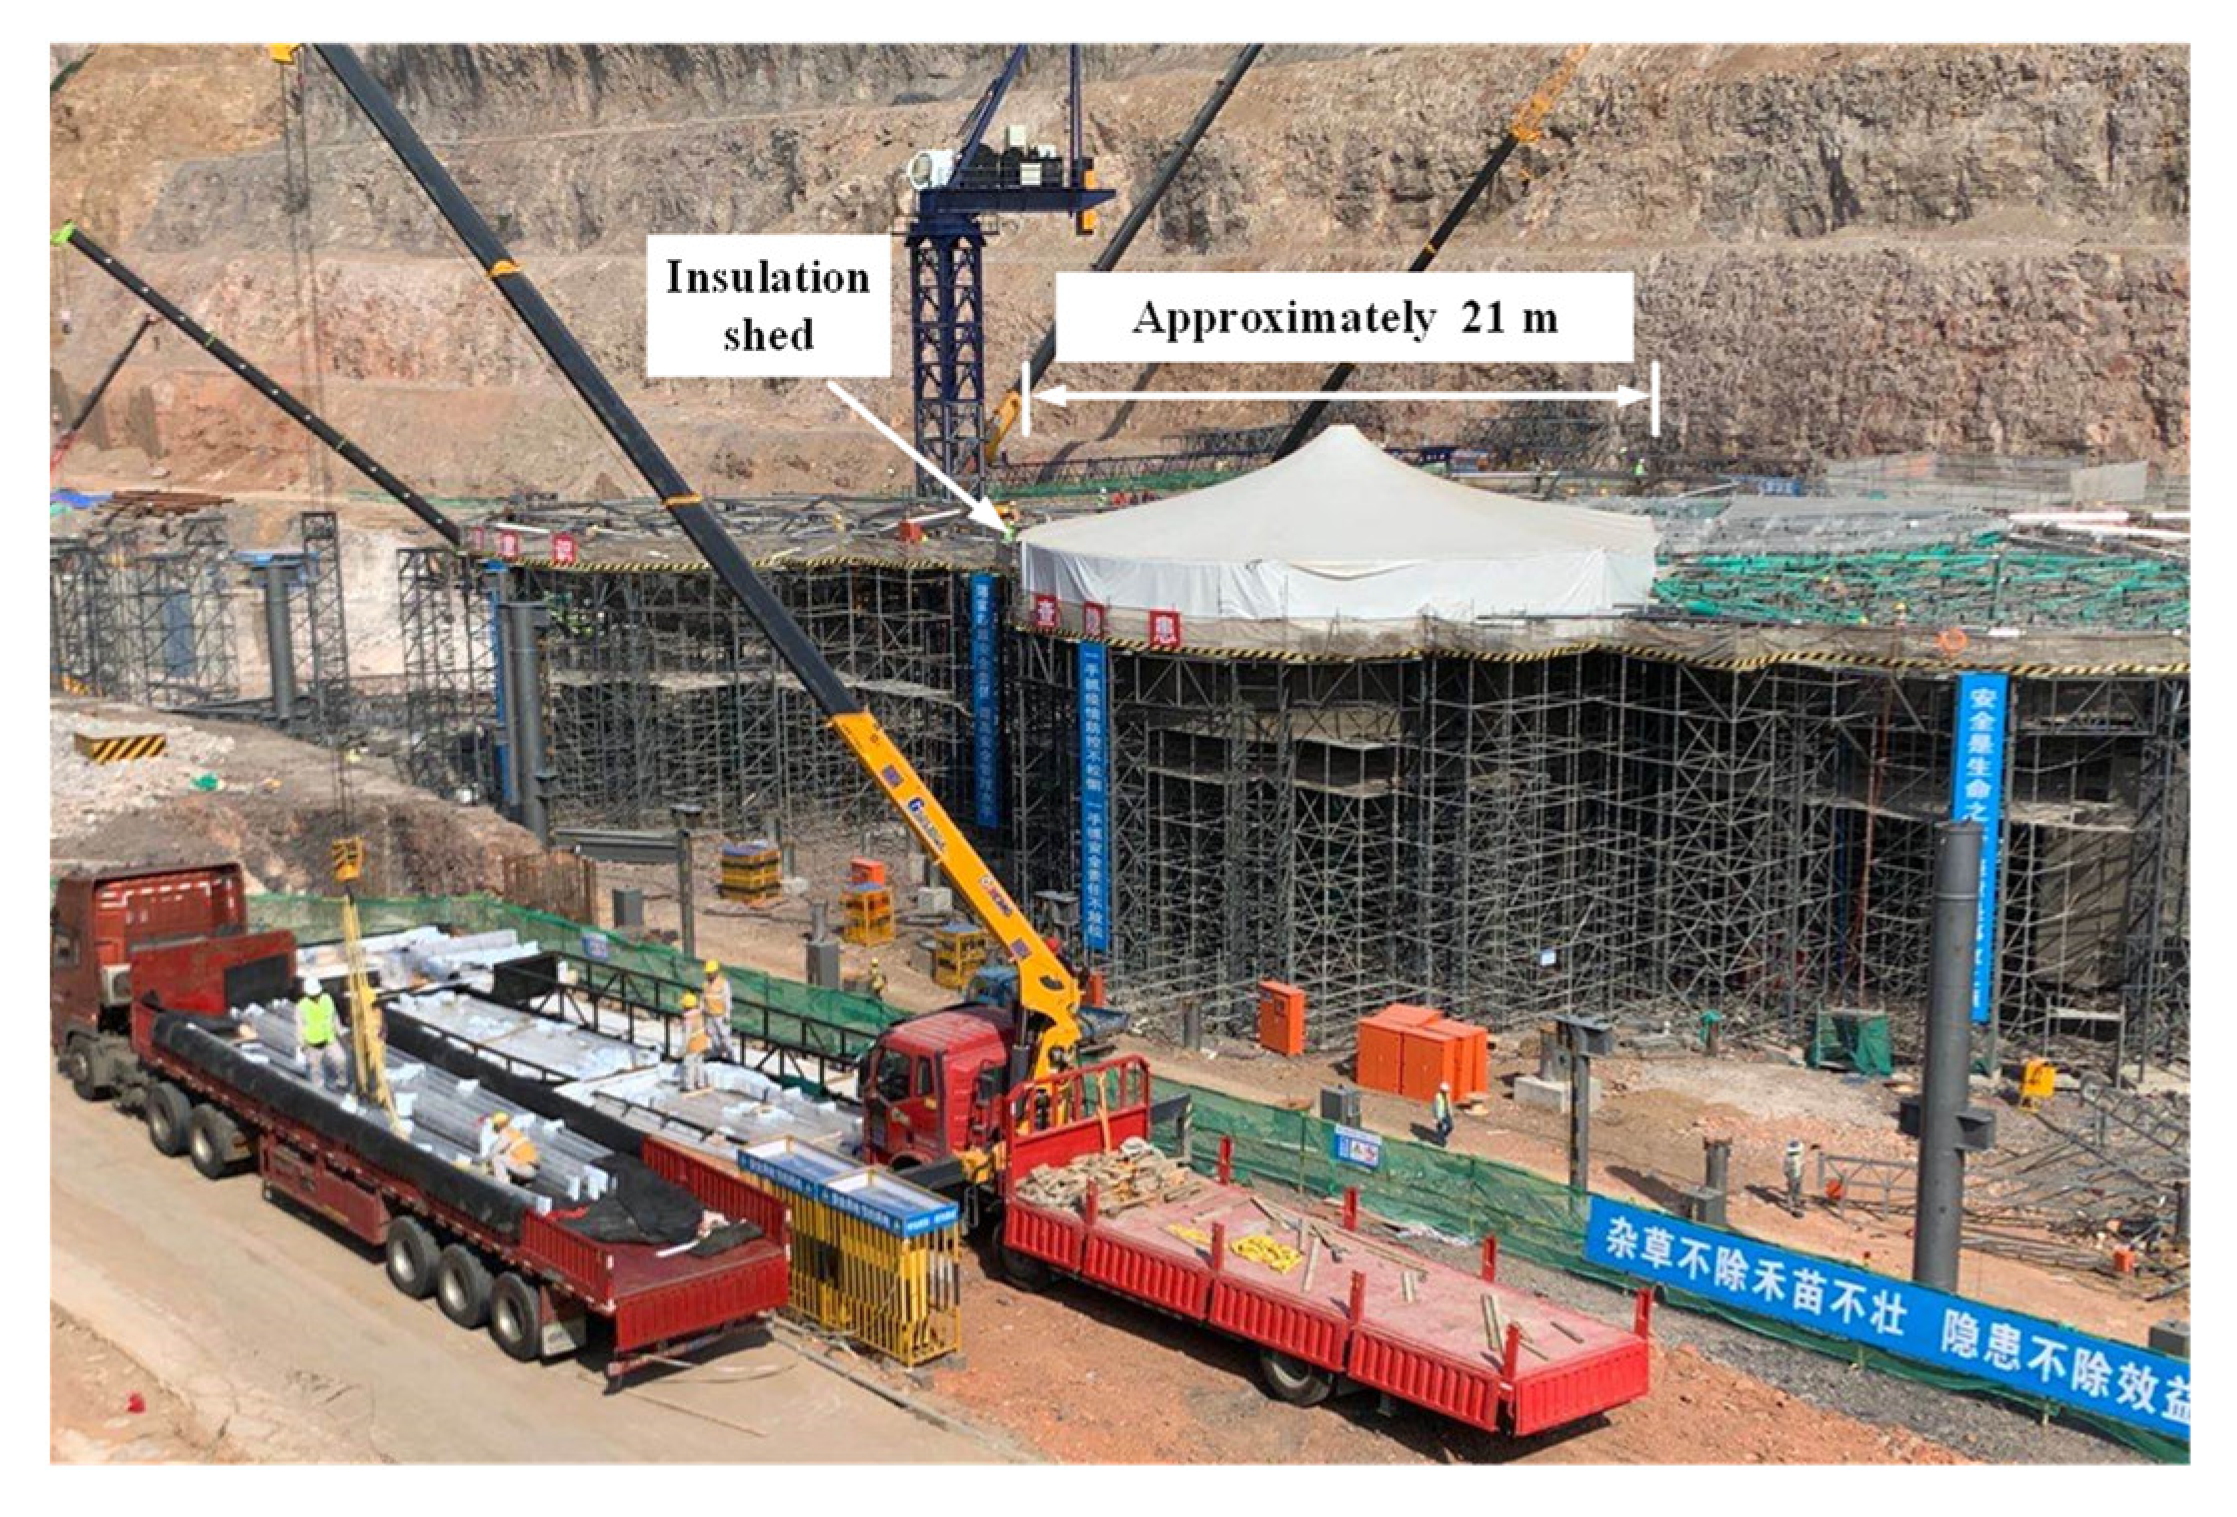
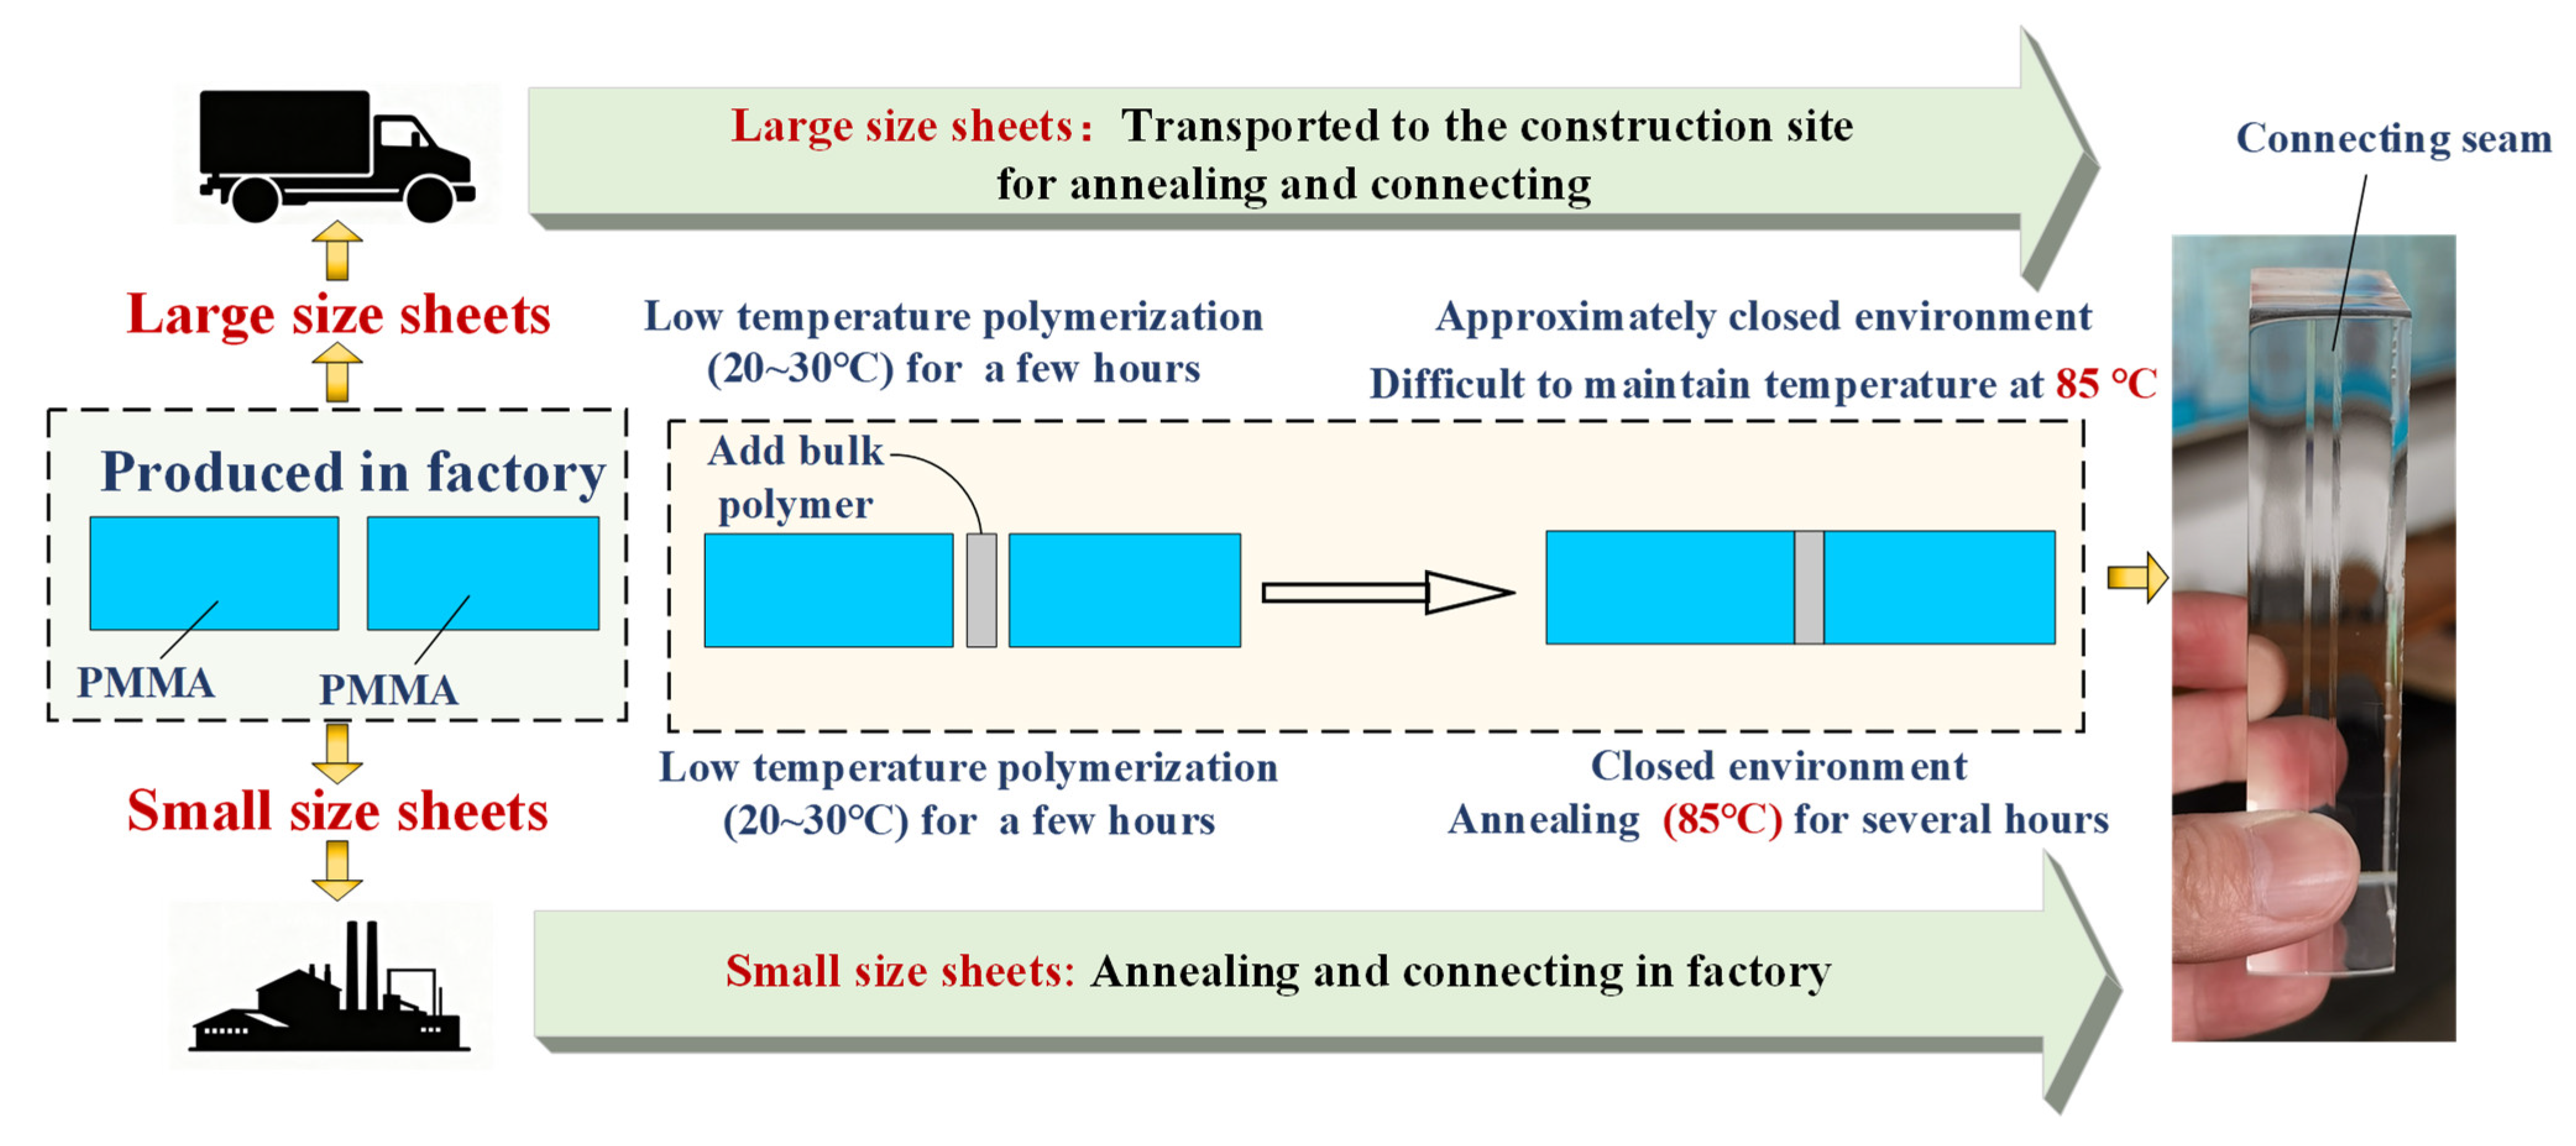
In contrast to the acrylic sheets utilized in aerospace applications, structural acrylic sheets typically exhibit significantly larger dimensions. The manufacturing and transportation constraints make factory production and subsequent delivery of such large sheets impractical. Consequently, on-site assembly through bulk polymerization of multiple smaller sheets becomes necessary (see Figure 1). However, this construction method introduces bulk polymerization connecting seams with mechanical strength inferior to that of the base material. The mechanical performance of these connected sheets is significantly influenced by annealing temperature of connecting seams, yet precise temperature control during on-site annealing is difficult task, particularly for large-scale structures. This challenge is exemplified in the construction of the Nanjing Future Garden (see Figure 2), where maintaining accurate and stable temperature control within a 21 m diameter insulated enclosure proved particularly difficult. As far as the authors are aware, limited research has been conducted on the combined effects of bulk polymerization connection seams and annealing temperature on the creep behavior of structural acrylic.

Figure 1.
Comparison of factory and on-site annealing connection for structural acrylic panels according to size.

Figure 2.
Construction site of the Nanjing Future Garden.
This study adopts a comprehensive experimental and numerical approach to investigate the creep behavior of structural acrylic base material and connecting coupons, with particular attention to the influence of annealing temperature. Short-term uniaxial tensile tests and long-term creep experiments were performed on both base materials and bulk-polymerized coupons annealed at 85 °C and 65 °C. The experimental data were analyzed using the Burgers model, and the fitted parameters were subsequently transformed into Prony series for finite element simulations in Abaqus, forming a validated constitutive framework for structural acrylic. Building upon the classical Findley model, a modified creep equation was developed, which substantially improves the predictive capability for long-term creep curves under various stress levels. Finally, the applicability of TSSP was rigorously examined, and its threshold values were identified, highlighting that the principle is not universally valid.
2. Experimental Test
2.1. Coupon Design
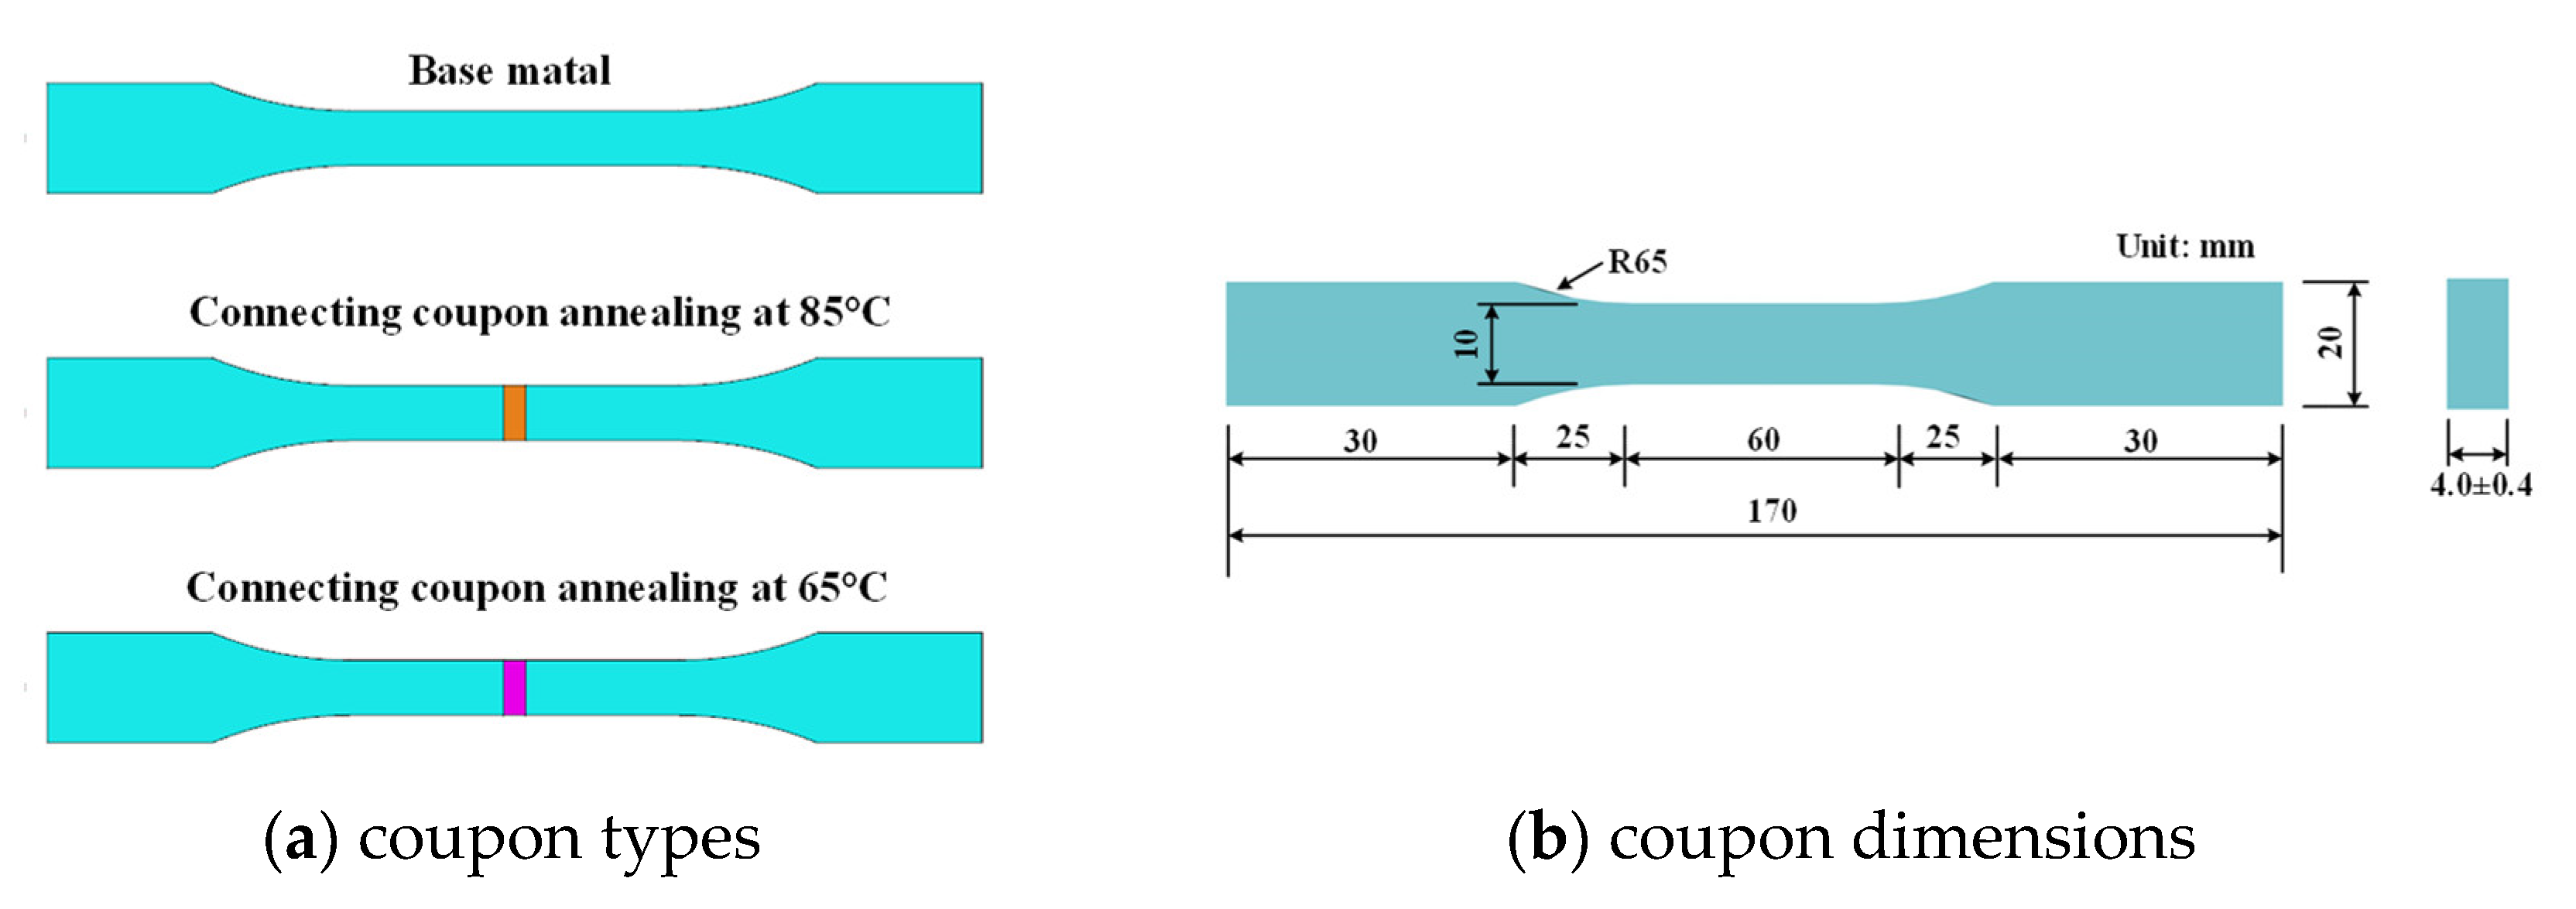
The test coupons, designed in accordance with Chinese standards GB/T 1040.1 [] and 11,546.1 [] (see Figure 3), maintained identical dimensions for both short-term tensile and long-term creep tests. The acrylic material complied with the specifications outlined in Chinese standard GB/T 7134 []. Considering the practical challenges in maintaining precise and stable temperature control during on-site bulk polymerization, where the nominal annealing temperature is typically 85 °C, two distinct sets of connecting coupons were prepared: one annealed at the standard 85 °C and another at a reduced temperature of 65 °C. Additionally, a set of base material tests was included for comparison. In total, 120 acrylic coupons (molecular weight = 1.020 × 10⁶ g/mol, polydispersity index = 2.09) were manufactured from Donchamp (Jiangsu) Materials Technology Company for experimental investigation.

Figure 3.
Coupon design.
2.2. Short-Term Uniaxial Tensile Test
Uniaxial tensile tests were performed in compliance with standard GB/T 1040.1 [] using a WDW-100 universal testing machine under displacement-controlled loading conditions. The coupons, with a consistent gauge length of 50 mm, were tested in five replicates to ensure statistical reliability and minimize data dispersion. All coupons exhibited brittle fracture behavior without demonstrating distinct yielding stages, with the experimental results represented by averaged values of key mechanical parameters. The short-term tensile test results are summarized in Table 1. The experimental data reveal comparable Young’s moduli but significant differences in ultimate strength among the three coupon types. Specifically, the connecting coupons annealed at 65 °C demonstrate lower ultimate strength compared to those annealed at 85 °C, with both values being inferior to the base material’s performance. These findings clearly indicate that bulk polymerization adversely affects the mechanical properties of acrylic, and the annealing temperature plays a crucial role in determining the quality of bulk polymerization.

Table 1.
Short-term tensile test results.
2.3. Creep Test
2.3.1. Test Program
The tensile creep behavior was investigated using a GT-7049-DH creep testing apparatus, which incorporated a precisely controlled environmental chamber with a dual-layer insulation system comprising rigid foam and heat-insulating cotton. This configuration ensured exceptional thermal stability throughout the extended testing periods. The system demonstrated remarkable measurement precision, with load control accuracy maintained within 1% and displacement resolution of 0.01 mm achieved through a magnetic scale sensor. To enhance testing efficiency, the apparatus was equipped with a multi-specimen loading fixture, enabling simultaneous testing of multiple coupons. The testing system incorporated an integrated automated control unit with real-time monitoring capabilities for operational parameters, data acquisition, and computational analysis. Coupons were securely mounted in the testing fixture, with applied tensile forces precisely monitored by a pressure sensor and regulated through a closed-loop feedback system. Creep-induced deformations were continuously recorded using a magnetic grating displacement sensor.
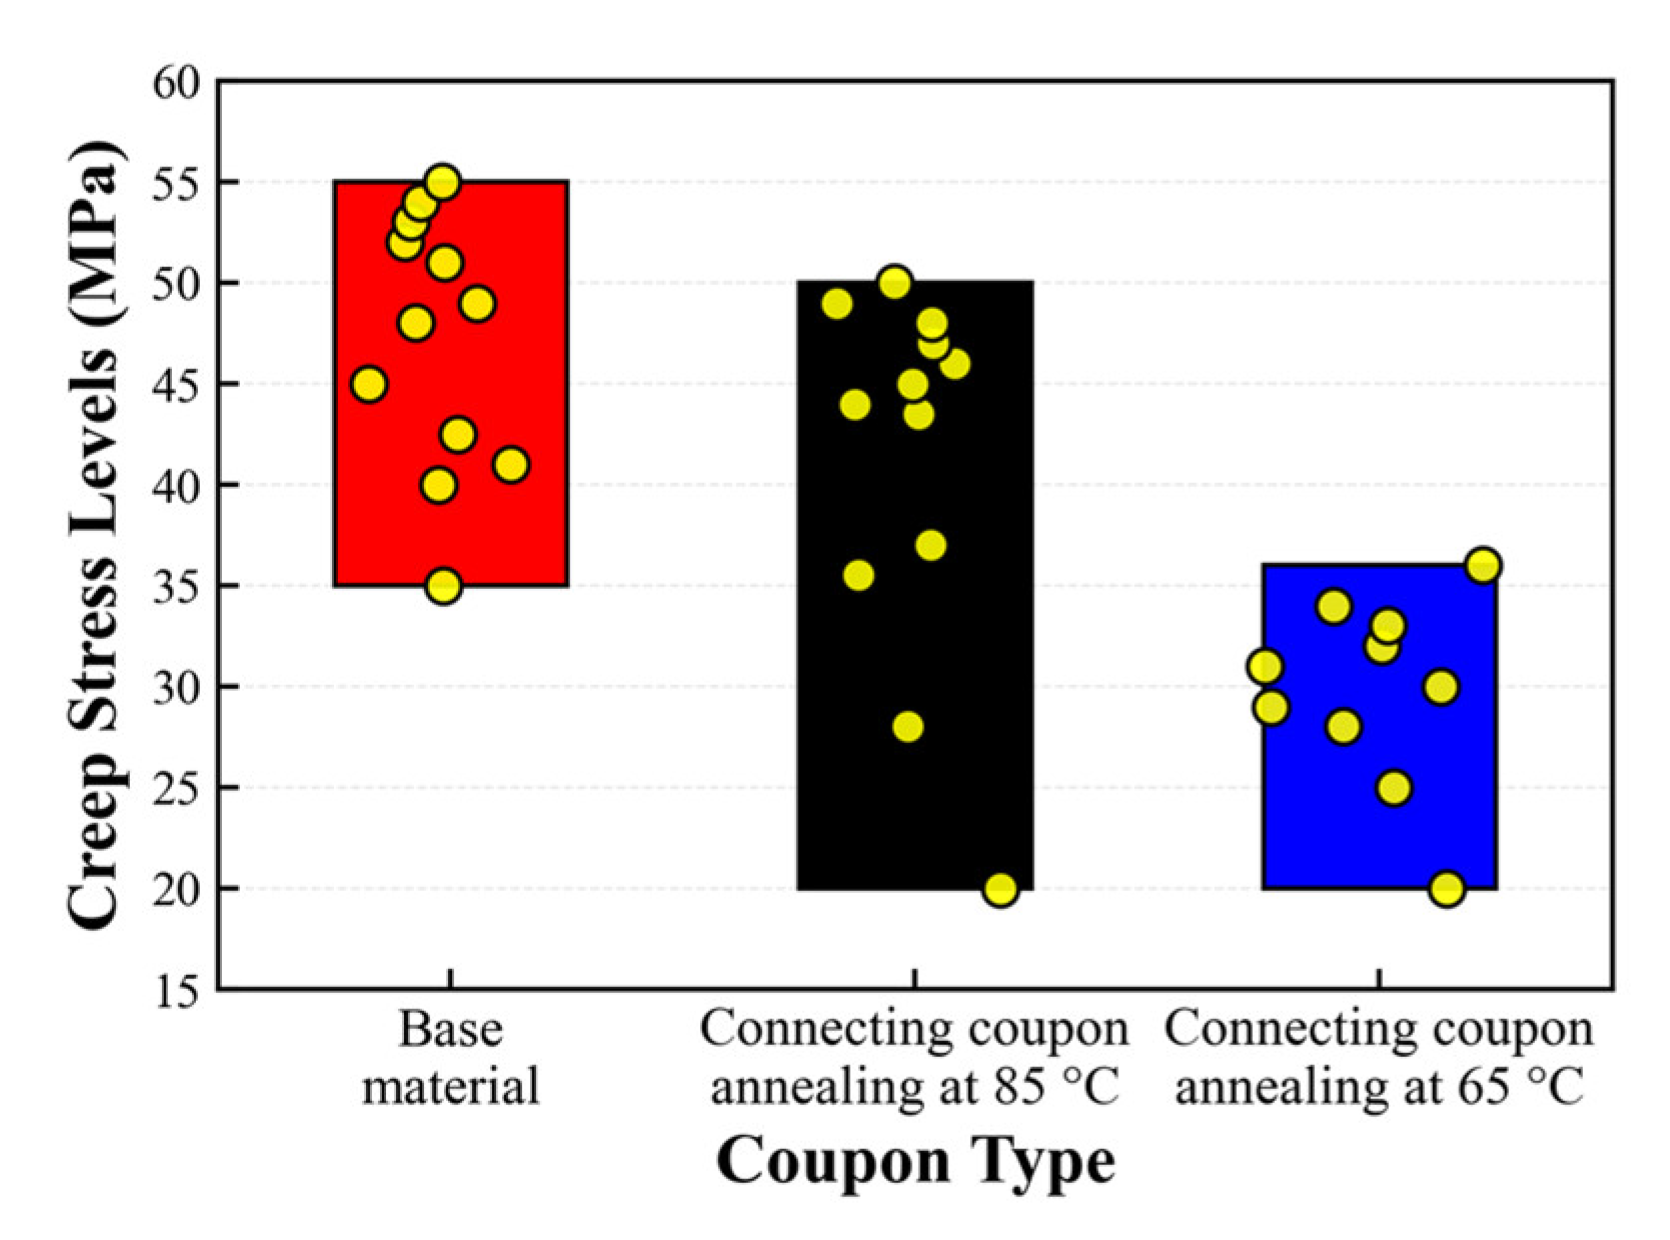
To obtain measurable creep deformation within a reasonable experimental timeframe while avoiding premature failure, the applied creep stress levels were carefully selected within the range of 31% to 78% of its short-term tensile ultimate strength for each type of coupon. The designed stress levels for the three coupon types are detailed in Table 2, and the corresponding stress distributions are visually summarized in Figure 4. There is almost no overlap between the stress ranges of the base material and the connecting coupons annealed at 65 °C. In contrast, the stress range of the connecting coupons annealed at 85 °C shows significant overlap with both the base material and the connecting coupons annealed at 85 °C. All tests were conducted at a constant temperature of 20 °C, with triplicate measurements performed at each stress level. The termination criteria for each test were either coupon failure or upon reaching the 12-day duration limit.

Table 2.
Designed stress levels for creep tests.

Figure 4.
The creep stress distribution range of the three types of coupons.
2.3.2. Creep Curves
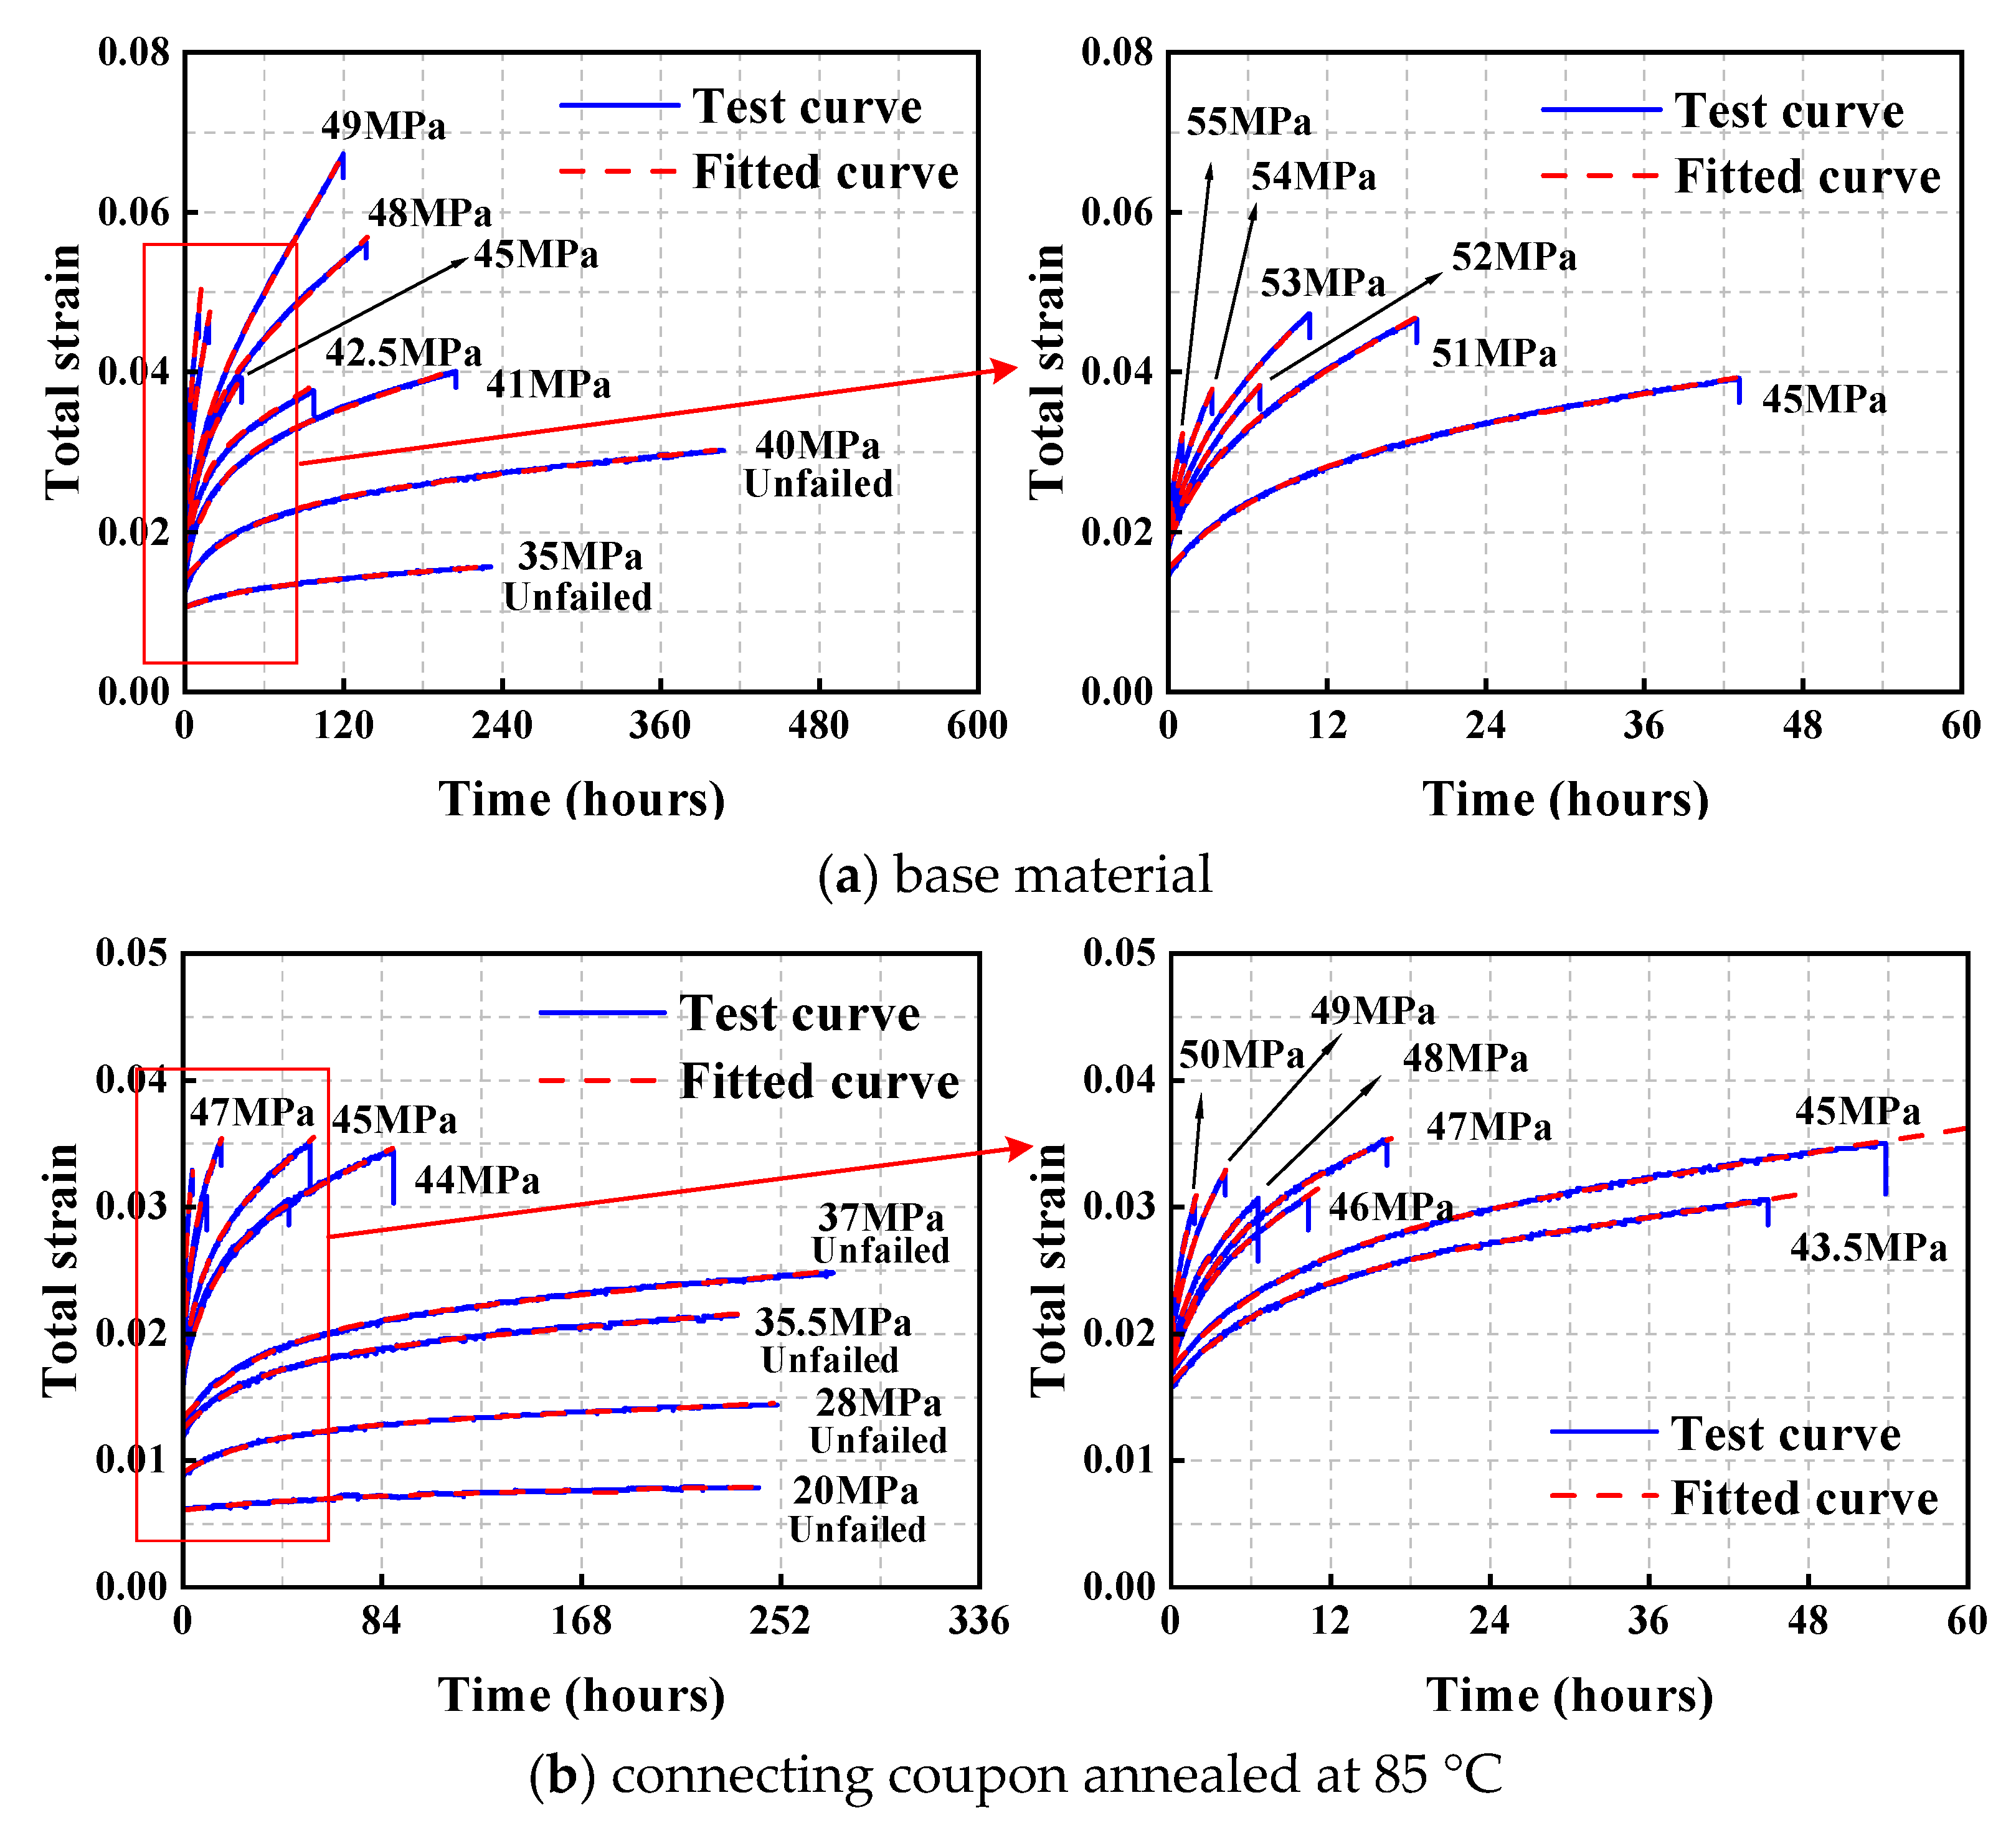
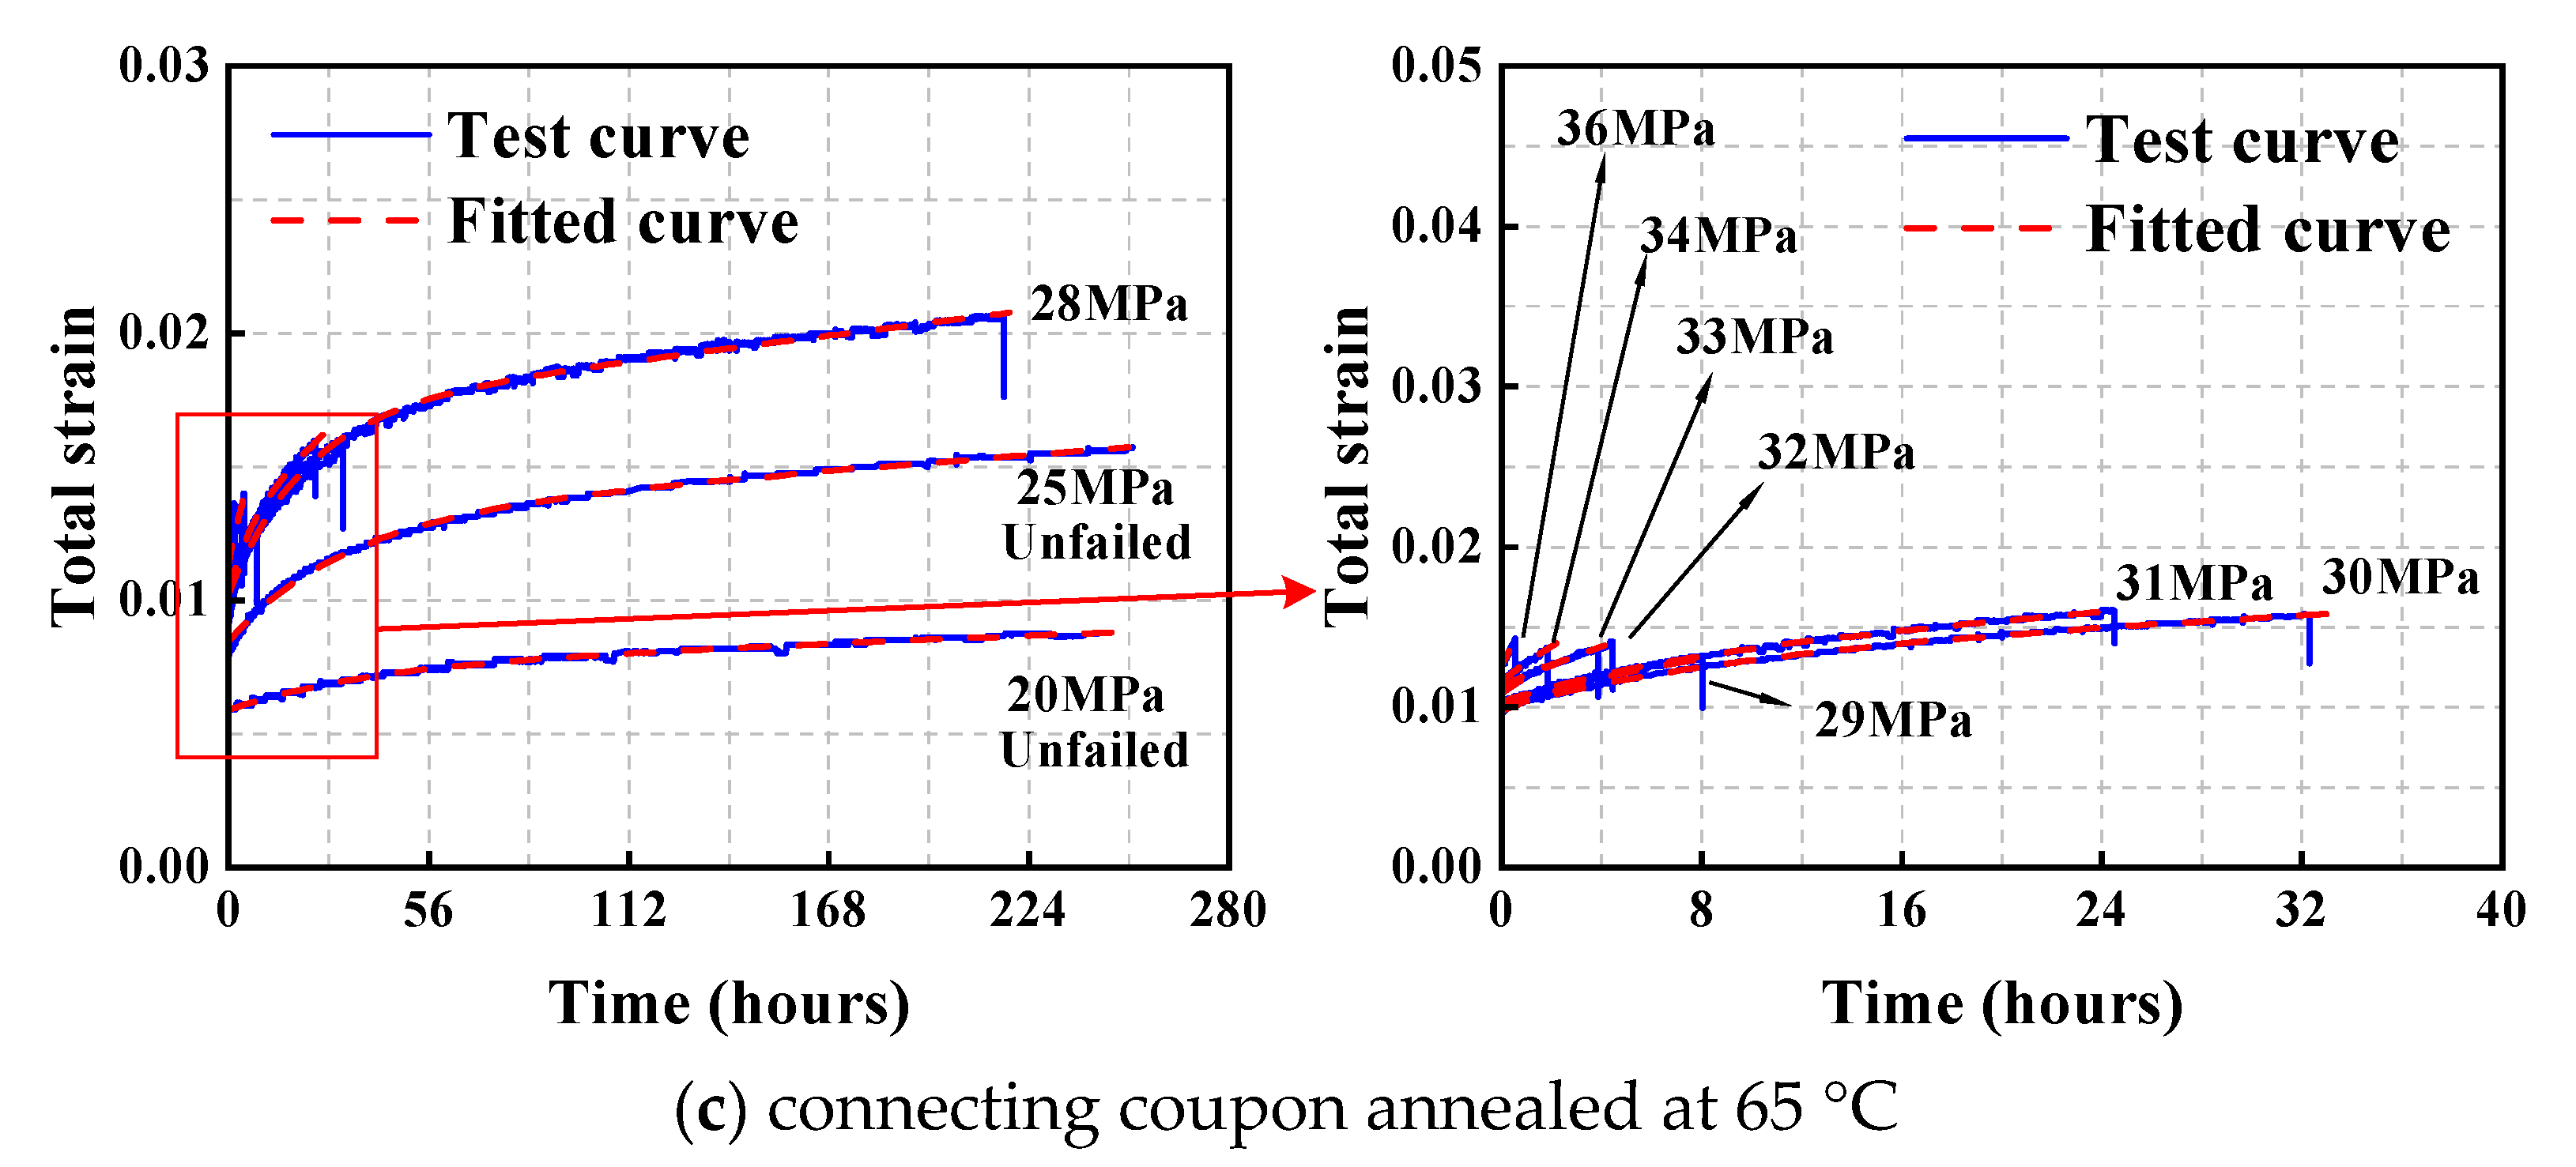
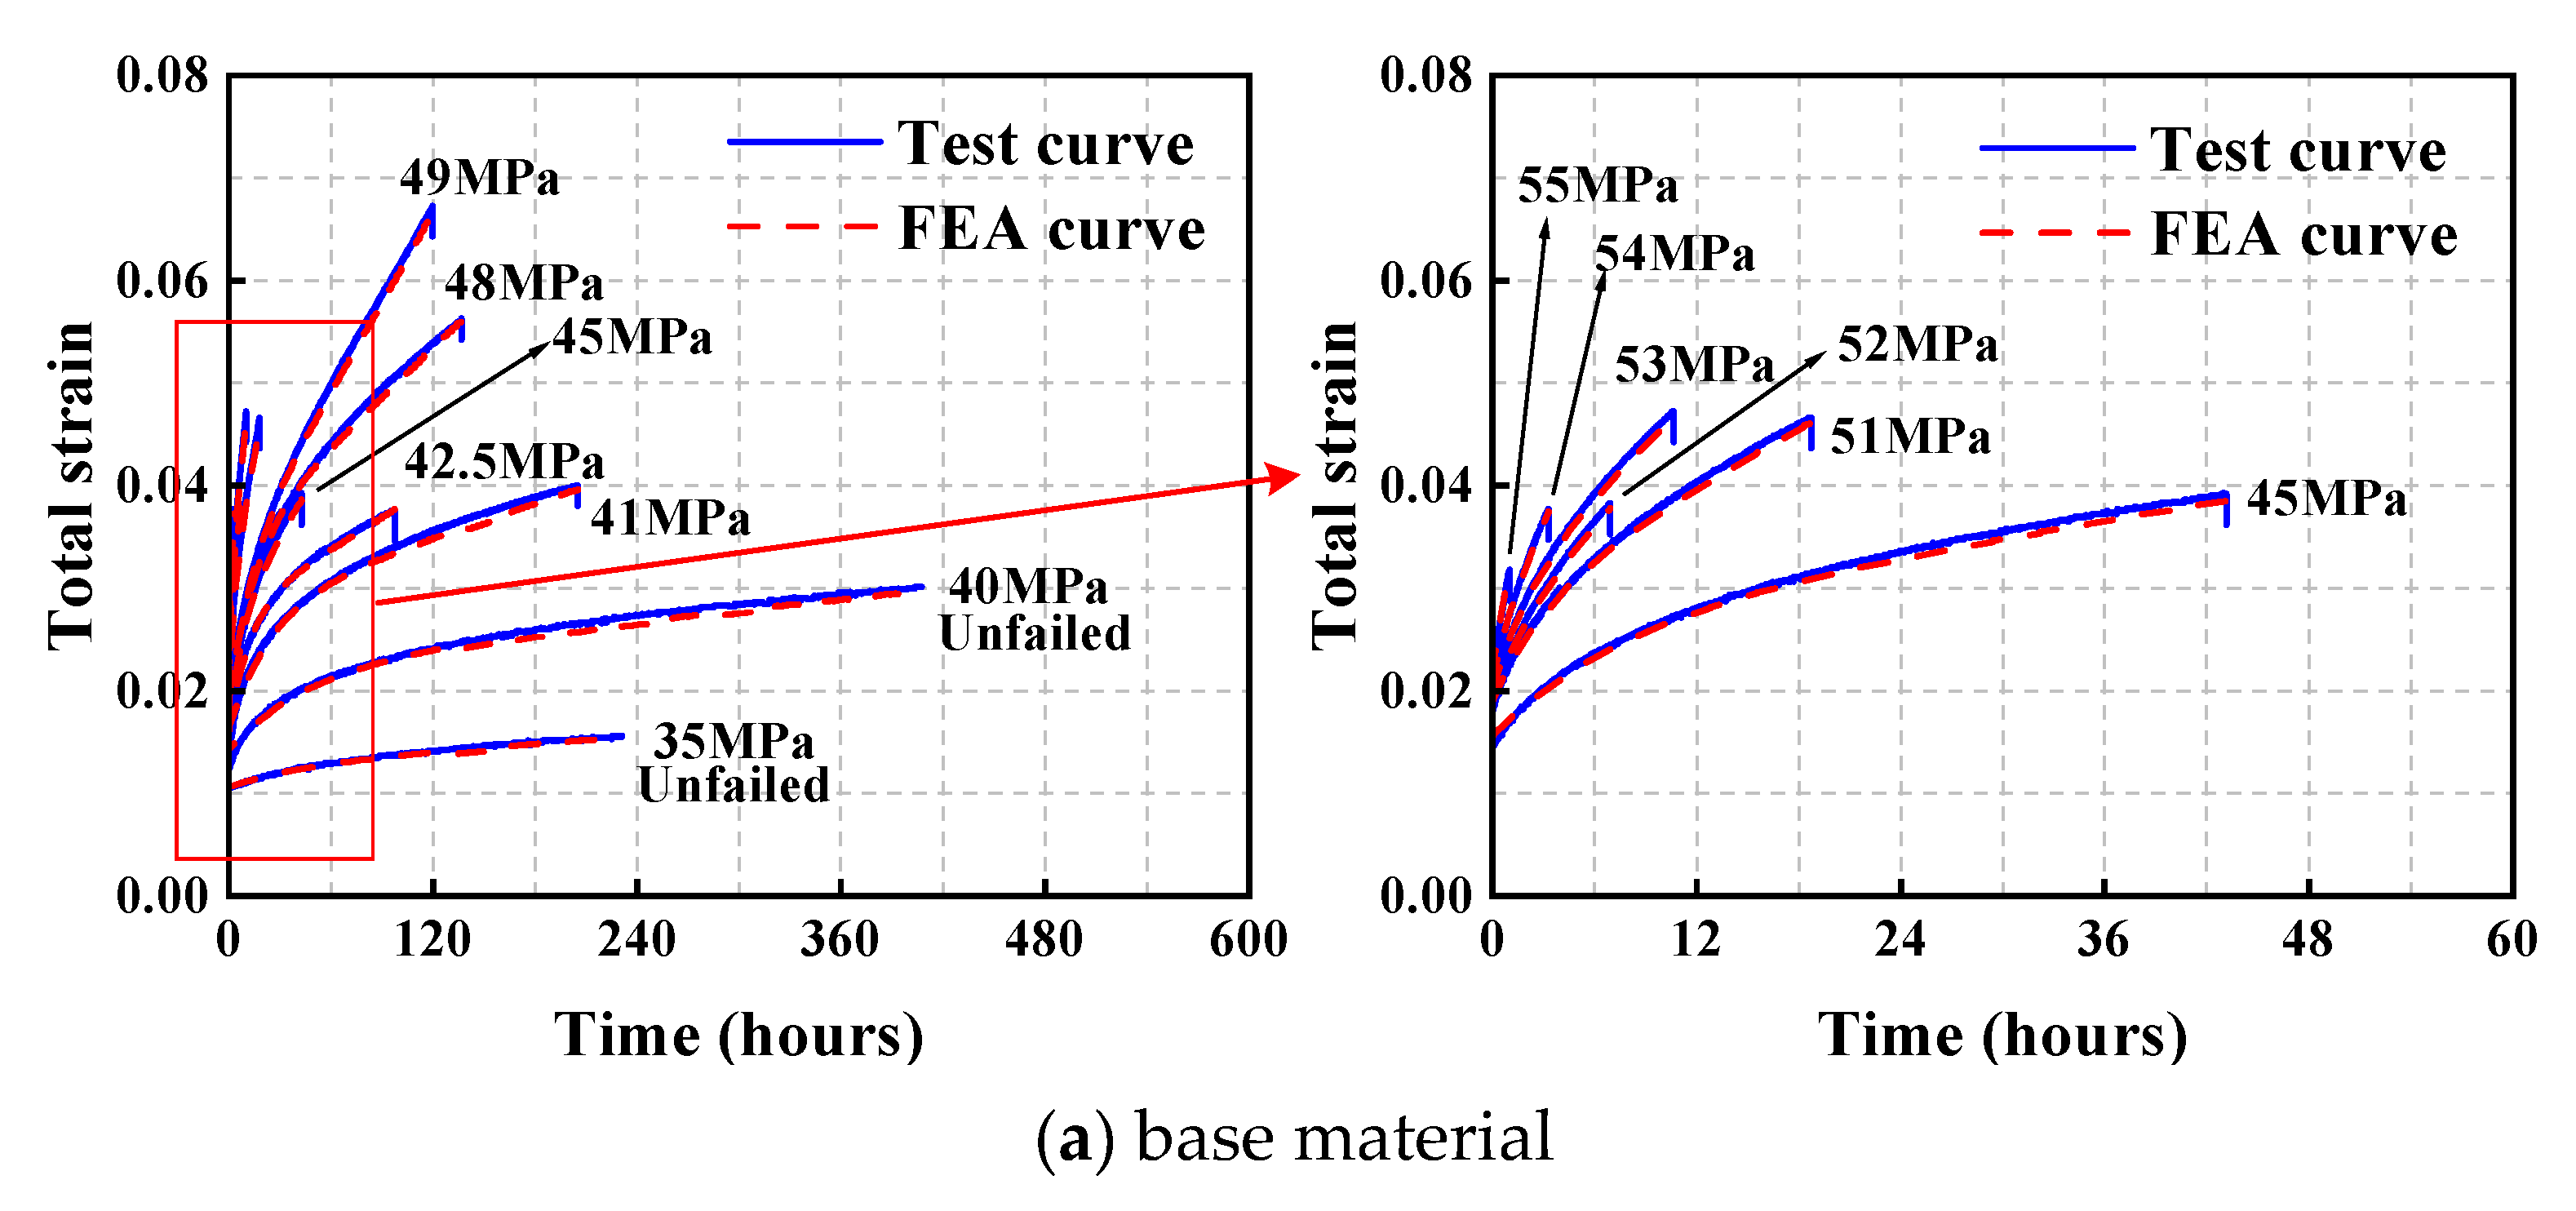
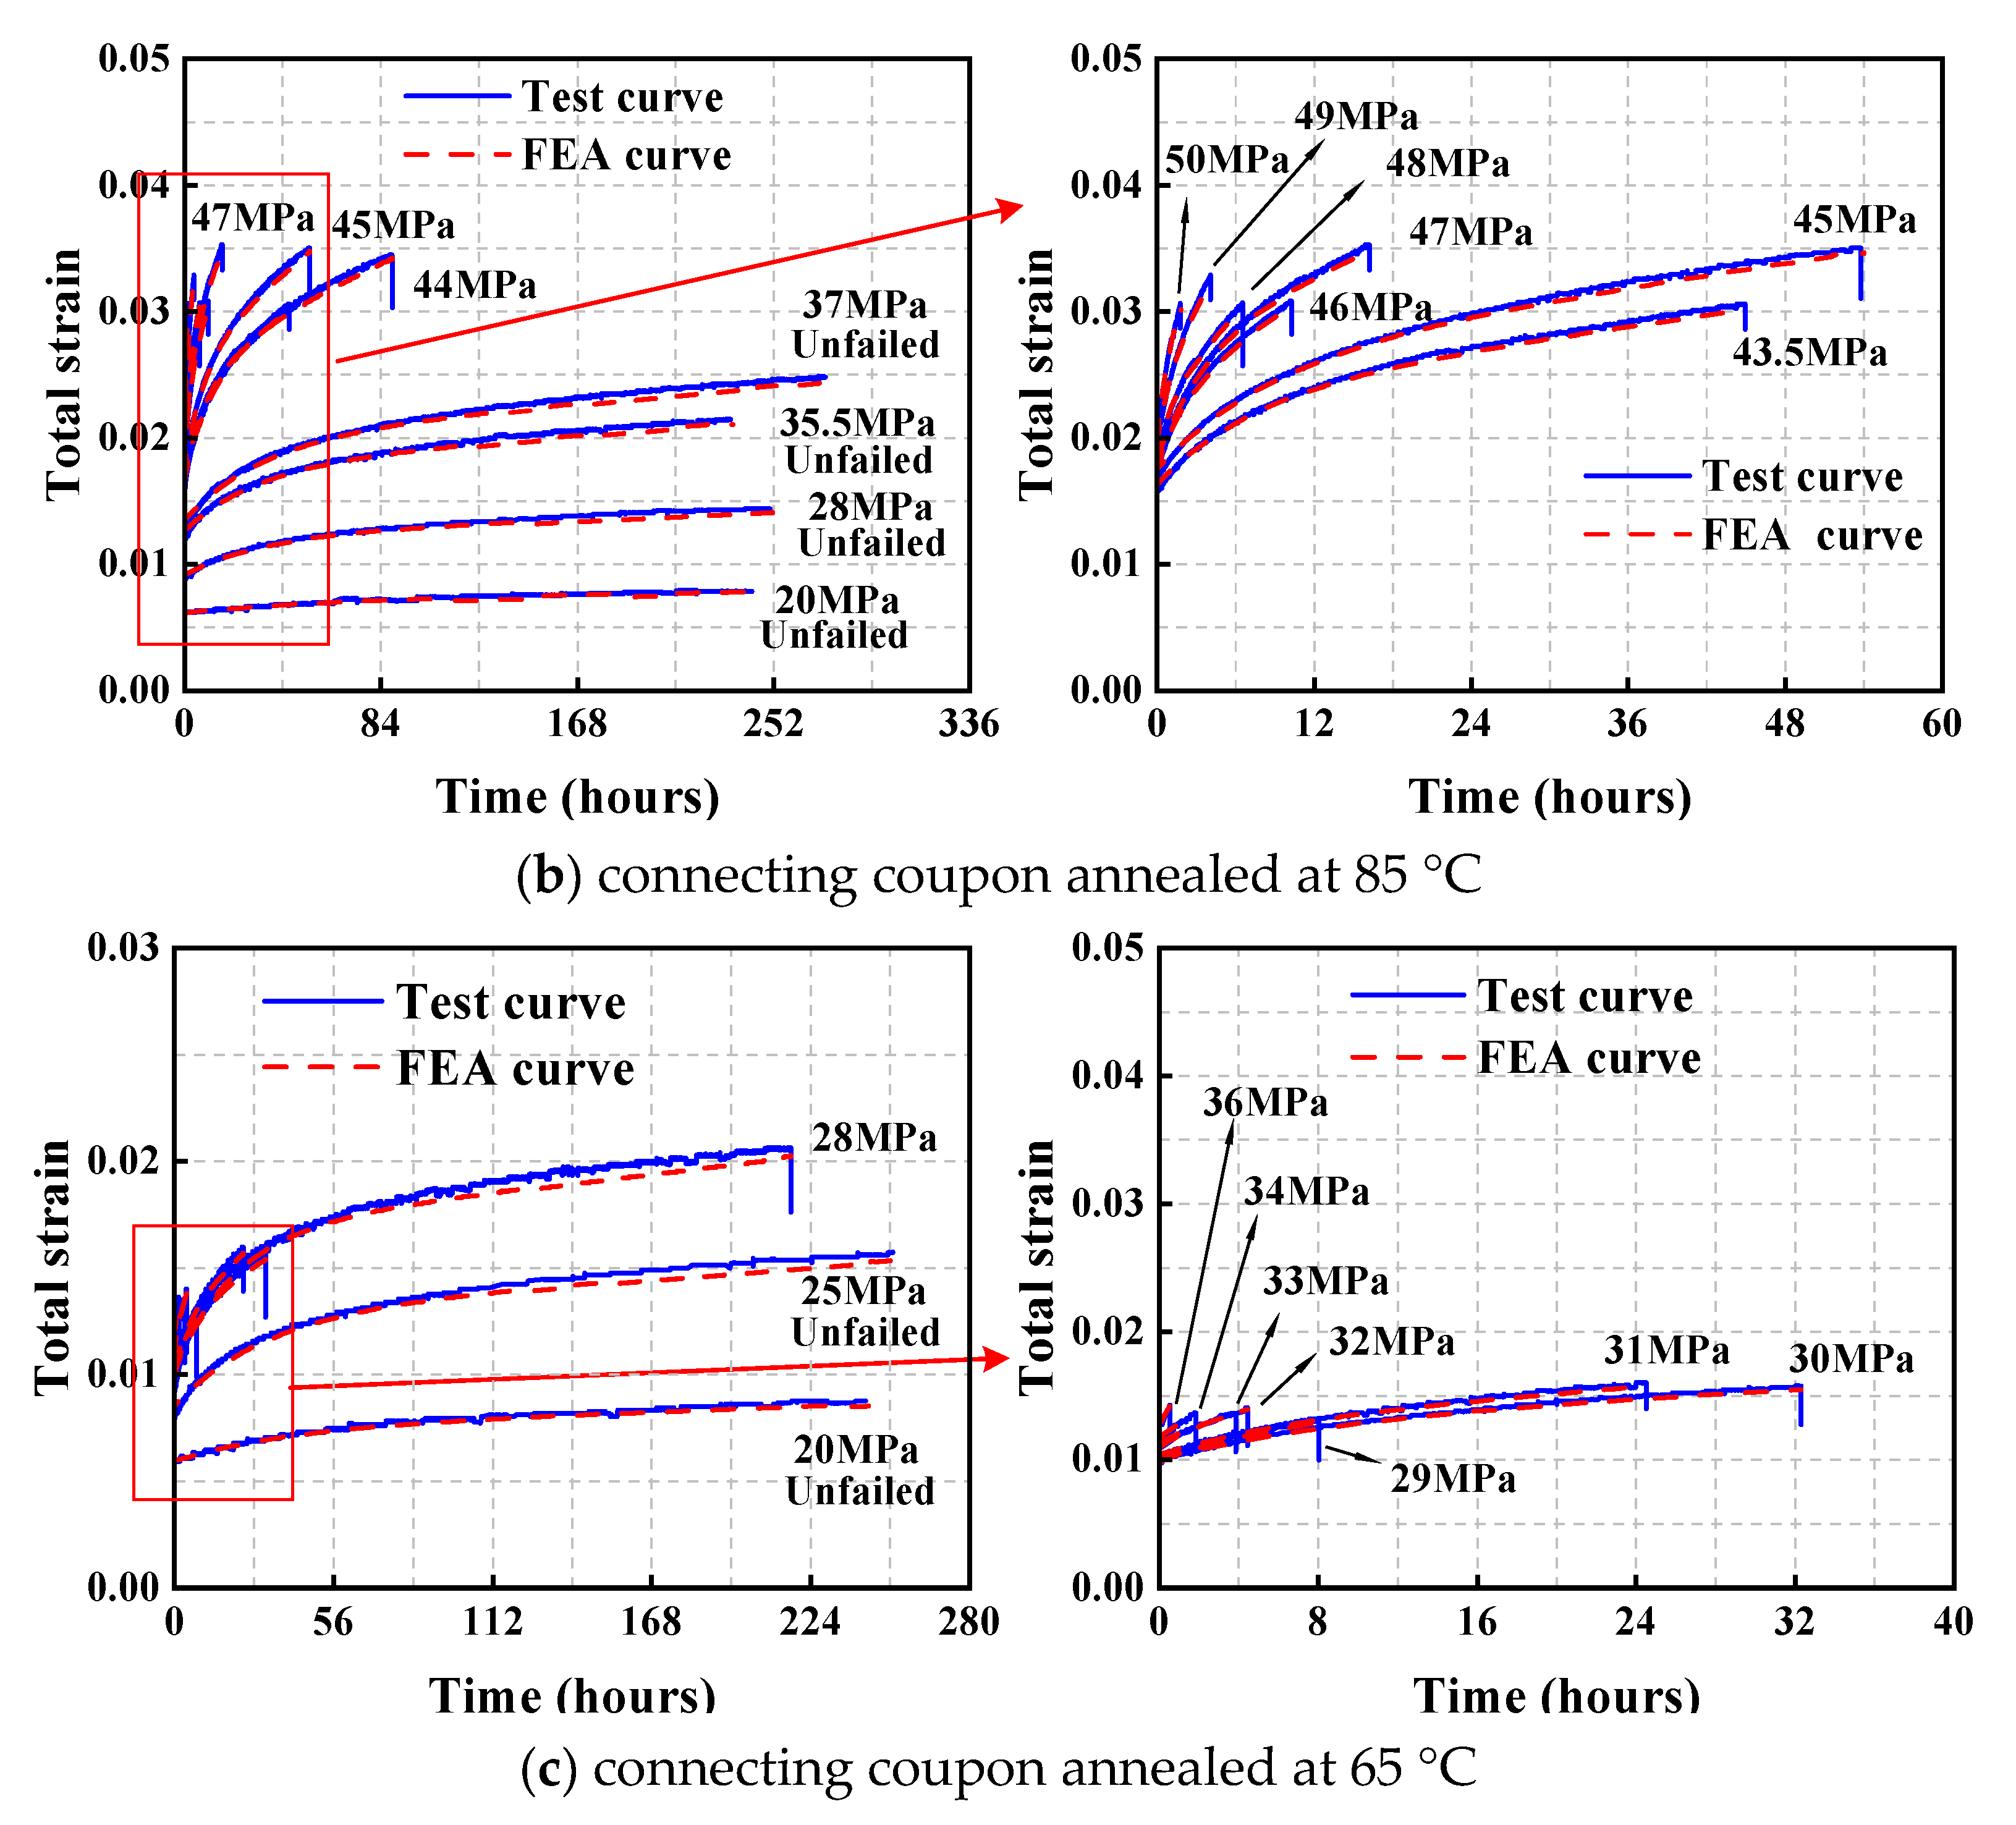
The creep behavior characteristics are presented in Figure 5, Figure 6 and Figure 7, which illustrate representative creep curves selected for clarity []. It should be emphasized that all strain measurements in this investigation represent true strain values. The initial strain values were determined based on the stress–strain relationships established through short-term loading tests. Two particularly noteworthy findings emerge from the experimental results: (a) certain coupons exhibited no failure at lower stress levels, and (b) some data points were unavailable due to instrumentation malfunctions. The test curves show a dispersion, which can be attributed to two primary factors: the scatters in material performance and potential load magnitude discrepancies among the three loading fixtures.

Figure 5.
Creep curves of base material.

Figure 6.
Creep curves of connecting coupon annealed at 85 °C.

Figure 7.
Creep curves of connecting coupon annealed at 65 °C.
Figure 8 presents a comparative analysis of the tensile creep performance of the three types of coupons. As shown in Figure 8a, under a creep stress of 35 ± 0.5 MPa, the time to failure of the connecting coupon annealed at 65 °C is significantly shorter than that of the other two types—only about 1020 s—making it nearly invisible on the time axis (0–240 h). In contrast, the base material and the connecting coupon annealed at 85 °C did not fracture even after prolonged exposure at 35 MPa and 35.5 MPa, respectively. Figure 8b shows that, under 49 MPa, the base material and the connecting coupon annealed at 85 °C fractured after 45 h and 17 h of creep, respectively. Meanwhile, Figure 8c reveals that at 28 MPa, the connecting coupon annealed at 85 °C survived beyond 240 h without fracture, whereas the connecting coupon annealed at 65 °C failed after 218 h. All three subfigures consistently demonstrate that, at comparable stress levels, the base material exhibits the lowest creep rate, followed by the connecting coupon annealed at 85 °C, while the connecting coupon annealed at 65 °C shows the highest creep rate. Therefore, based on comparisons of both creep duration and creep rate, it can be concluded that the base material exhibits the best creep performance. Furthermore, the connecting coupon annealed at 85 °C demonstrates significantly superior creep resistance compared to that annealed at 65 °C, indicating that the annealing temperature has a substantial influence on the creep behavior of acrylic.

Figure 8.
Comparative creep performance of different Coupons. (a) Comparison of three types of coupon. (b) Comparison of base material and connecting coupon annealed at 85 °C. (c) Comparison of connecting coupon annealed at 85 °C and 65 °C.
The experimental results demonstrate a clear correlation between applied stress and creep behavior: increasing stress levels generally lead to elevated creep rates and reduced creep life. Typically, creep strain evolution comprises three distinct phases: primary stage (transient creep), secondary stage (steady-state creep), and tertiary stage. However, the current investigation revealed an absence of tertiary creep behavior in all tested coupons. The absence of tertiary creep stages indicates limited plastic deformation capacity in the material.
3. Burgers Model and Finite Element Analysis
3.1. Determination of Parameters in Burgers Model
The Burgers model (see Figure 9) is frequently used to describe the viscoelastic behavior of polymers. The expression is
where σ0 represents the creep stress; E1 and η1 are the elastic and viscous parameters of the Maxwell series unit, respectively; E2 and η2 are the elastic and viscous parameters of the Kelvin parallel unit, respectively.

Figure 9.
Burgers model.
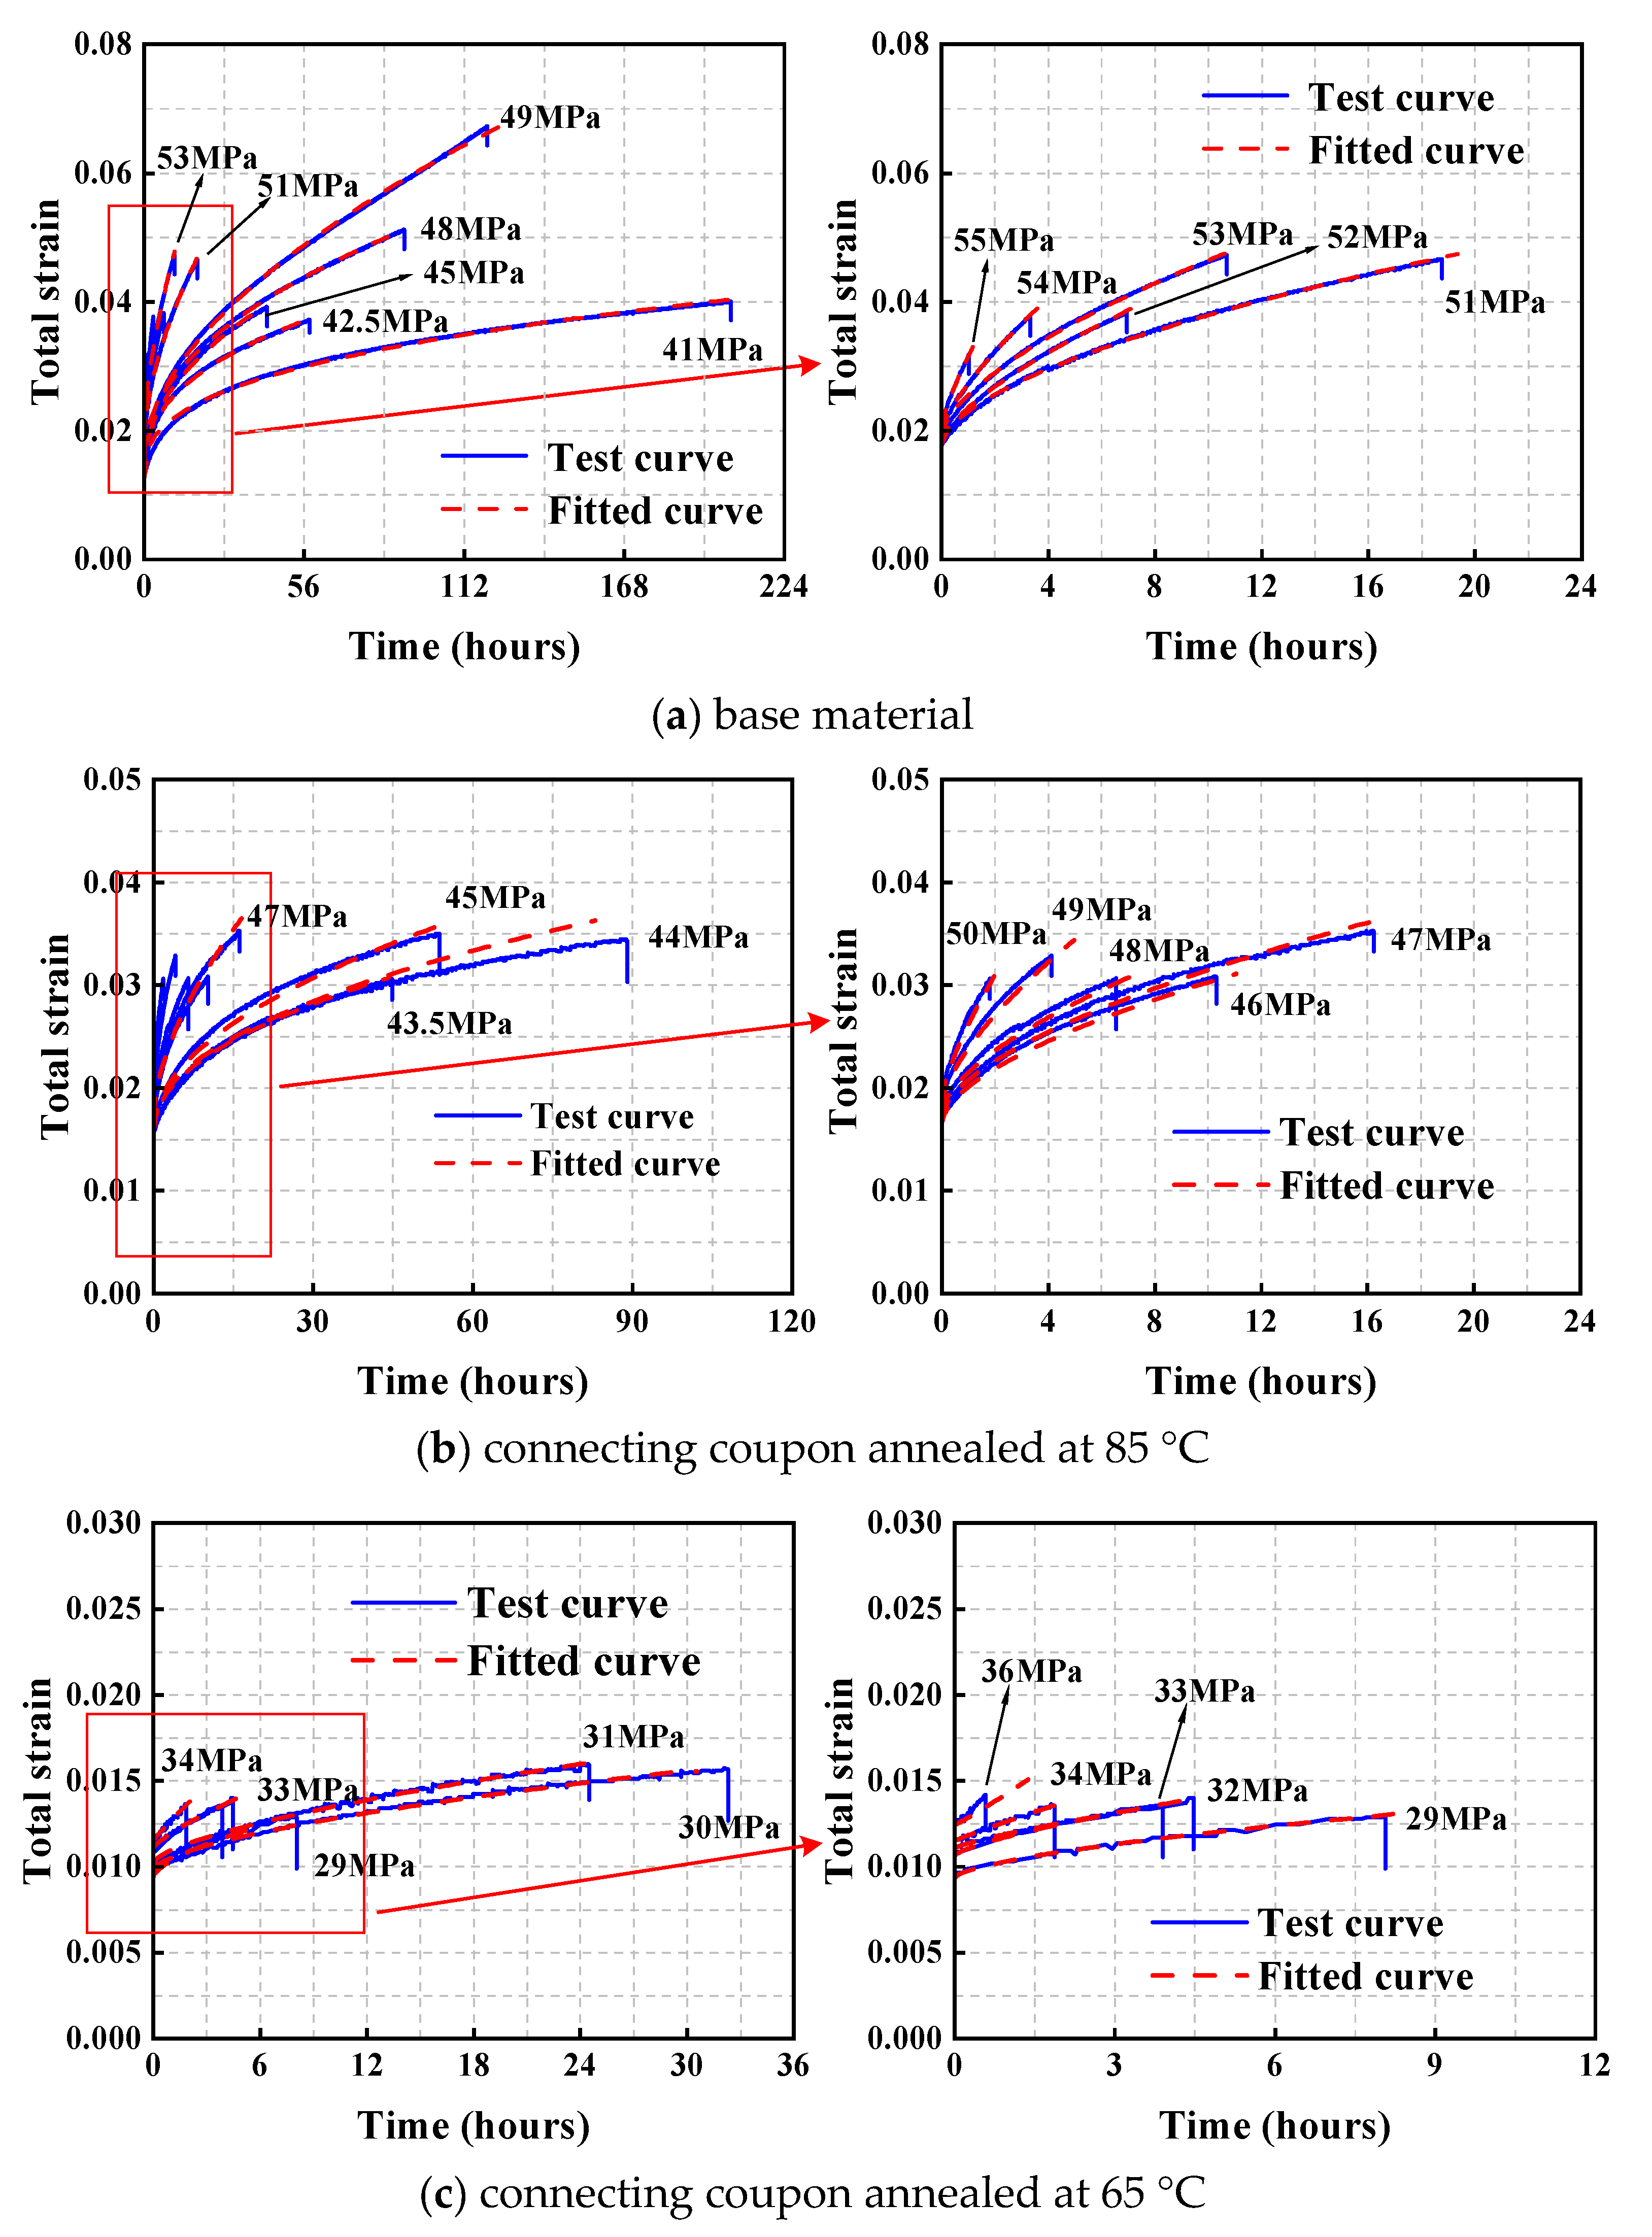
To validate the applicability of the Burgers model, creep data obtained from the tested coupons were analyzed through curve fitting, as illustrated in Figure 10 and summarized in Table 3. For clarity and simplicity, only one representative curve from the triplicate tests at each stress level was selected for the fitting process. The results demonstrate a strong correlation between the fitted and experimental curves, with all determination coefficients (R2) exceeding 0.96, indicating excellent agreement and robust fitting performance.


Figure 10.
Fitting results by using the Burgers model.

Table 3.
Fitting parameters of the Burgers model.
3.2. Prony Series
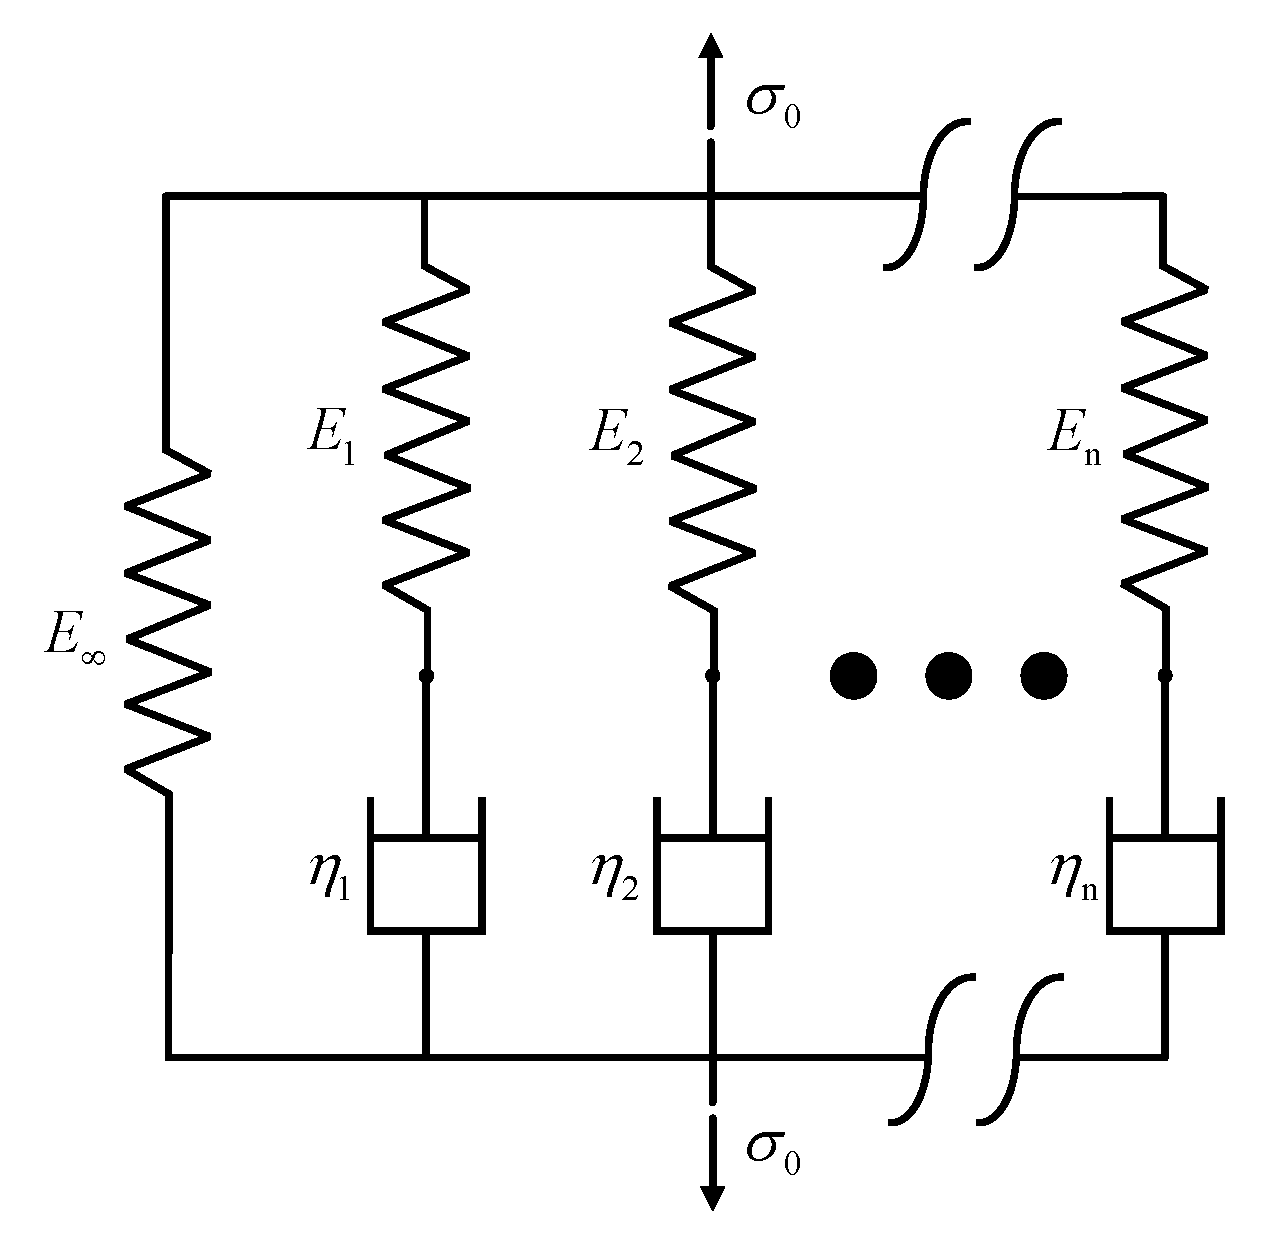
In Abaqus, a widely adopted comprehensive finite element analysis software, the Burgers model requires transformation into a Prony series representation for creep analysis due to its inherent incompatibility with direct implementation. The Prony series essentially represents the generalized Maxwell model [], which comprises a single elastic spring connected in parallel with n Maxwell units, as illustrated in Figure 11. The generalized Maxwell model comprehensively captures the deformation characteristics of viscoelastic materials. Through mathematical derivation, this model has been established to be equivalent to the Prony series formulation implemented in Abaqus, thereby enabling accurate numerical simulation of acrylic creep behavior through the Prony series functionality.

Figure 11.
The generalized Maxwell models.
The expression for the generalized Maxwell model is as follows []:
where and represent the tensile elastic moduli; represents the relaxation time. Since the elastic modulus , shear modulus and bulk modulus can be interchanged within the elastic range (, ), the generalized Maxwell expression for the relaxation moduli of bulk modulus and shear modulus, based on Equation (2), can be written as []:
In Equations (3) and (4), and represent the shear moduli; and represent the bulk moduli; and represent the relaxation times for shear and bulk moduli.
The initial bulk modulus can be separated from Equation (3), yielding Equation (5). The latter part of Equation (5) represents the Prony series formulation implemented in Abaqus for characterizing the viscoelastic behavior of materials.
where . . This initial bulk modulus form indicates that the modulus starts at its maximum value and gradually decreases over time.
Abaqus further simplifies Equation (5) by using a dimensionless relaxation modulus in the generalized Maxwell model to calculate the viscoelastic material properties []:
Although the built-in data fitting module provides a relatively straightforward approach for determining the required Prony series parameters, it presents several computational limitations. These include convergence difficulties during experimental data fitting and inadequate performance in simulating creep behavior under high-stress conditions. Consequently, the conventional practice in viscoelastic material characterization involves an alternative methodology: instead of directly importing experimental data into Abaqus, the creep data are first analyzed using the Burgers model to derive the necessary parameters, which are subsequently implemented in the finite element analysis.
As previously established, the Burgers model is characterized by four fundamental mechanical parameters: E1, E2, η1, and η2. These parameters require transformation into the corresponding Prony series parameters (gi, ki, τi), where ki represents the bulk modulus ratio (ki = Ki/K0) and τi denotes the relaxation time. In the context of tensile creep simulations, the bulk modulus parameters ki can be disregarded due to the predominant influence of shear deformation mechanisms. Consequently, ki values are typically set to zero, with the Prony series input primarily requiring the specification of shear modulus parameters gi and their corresponding relaxation times τi.
The constitutive equation governing the deviatoric response of the Burgers model can be expressed as follows []:
where , , and .
Through the mathematical combination of Equations (1) and (7), and following the theoretical derivation established by Zhang [], the constitutive relationship for the Burgers model can be formulated as follows:
where G(t) represents the shear modulus at time t. And , , , .
Through comprehensive mathematical derivation, the Burgers model can be systematically transformed into its equivalent Prony series representation, expressed as follows:
where , , , , , , . () are the parameters of the Prony series, and , are the initial elastic modulus and Poisson’s ratio, respectively.
It is crucial to note that the derivation process incorporates the assumption of a zero-equilibrium modulus (). However, this condition presents computational limitations in Abaqus, as the software cannot process a precisely zero equilibrium modulus. The derived Prony series parameters, where , inherently correspond to the Burgers model’s assumption of . Based on this theoretical framework, the Burgers model parameters presented in Table 3 have been systematically transformed into their corresponding Prony series representations, as detailed in Table 4.

Table 4.
Prony series parameters converted from the Burgers model parameters.
3.3. Finite Element Analysis
The finite element analysis was conducted using Abaqus (Version 2021), employing 1204 C3D8R solid elements to model the coupon geometry shown in Figure 3. The numerical simulation incorporated appropriate boundary conditions, with one end fully constrained while applying external loads at the opposite end. The viscoelastic material properties were implemented through the Prony series formulation within the software’s Viscoelastic module.
Table 4 summarizes the determined parameters g1, g2, τ1, and τ2, with k1 and k2 assigned zero values. In the developed FE models, the geometric details of the seams were omitted. Instead, their mechanical influence was captured solely by employing distinct constitutive models for the seam regions within the simulation. This geometric simplification is rationally justified because the adhesive and the substrate are composed of the identical chemical substance, polymethyl methacrylate, at the molecular level. The comparative analysis between experimental data and finite element predictions, as illustrated in Figure 12, demonstrates excellent agreement, validating the effectiveness of the Prony series formulation derived from Burgers model parameters in accurately predicting the creep behavior of acrylic materials.


Figure 12.
Comparison between FEA curves and tested curves.
4. Findley Model
The Burgers model demonstrates excellent capability in simulating the creep behavior of acrylic; however, its accuracy is inherently dependent on the availability of experimental data. For example, the test at 46 MPa has not been conducted for base material, and the parameters in Burgers model at 46 MPa are unavailable. To address this data limitation, the Findley model was implemented as an alternative approach for creep behavior prediction [].
The Findley power law model has been extensively validated for predicting long-term creep deformation in viscoelastic materials, as demonstrated by numerous experimental studies [,]. While the physical interpretation of the model parameters remains less defined, its mathematical formulation offers significant advantages in terms of simplicity and practical implementation. The constitutive relationship of the Findley model is expressed as follows:
where ε(t, σ) represents the strain; ε0 is the instantaneous strain; the parameters a and b are the stress-dependent functions.
It is important to note that the parameter determination in the Findley equation is significantly influenced by the temporal duration of creep curves. Consequently, experimental data from unfailed coupons were excluded from the analysis due to their incomplete creep curves, which could compromise the accuracy of parameter fitting. The fitting results obtained through the Findley equation are presented in Figure 13, demonstrating excellent agreement with the experimental data and validating the model’s predictive capability for acrylic creep behavior.

Figure 13.
Fitting results by using the Findley equation.
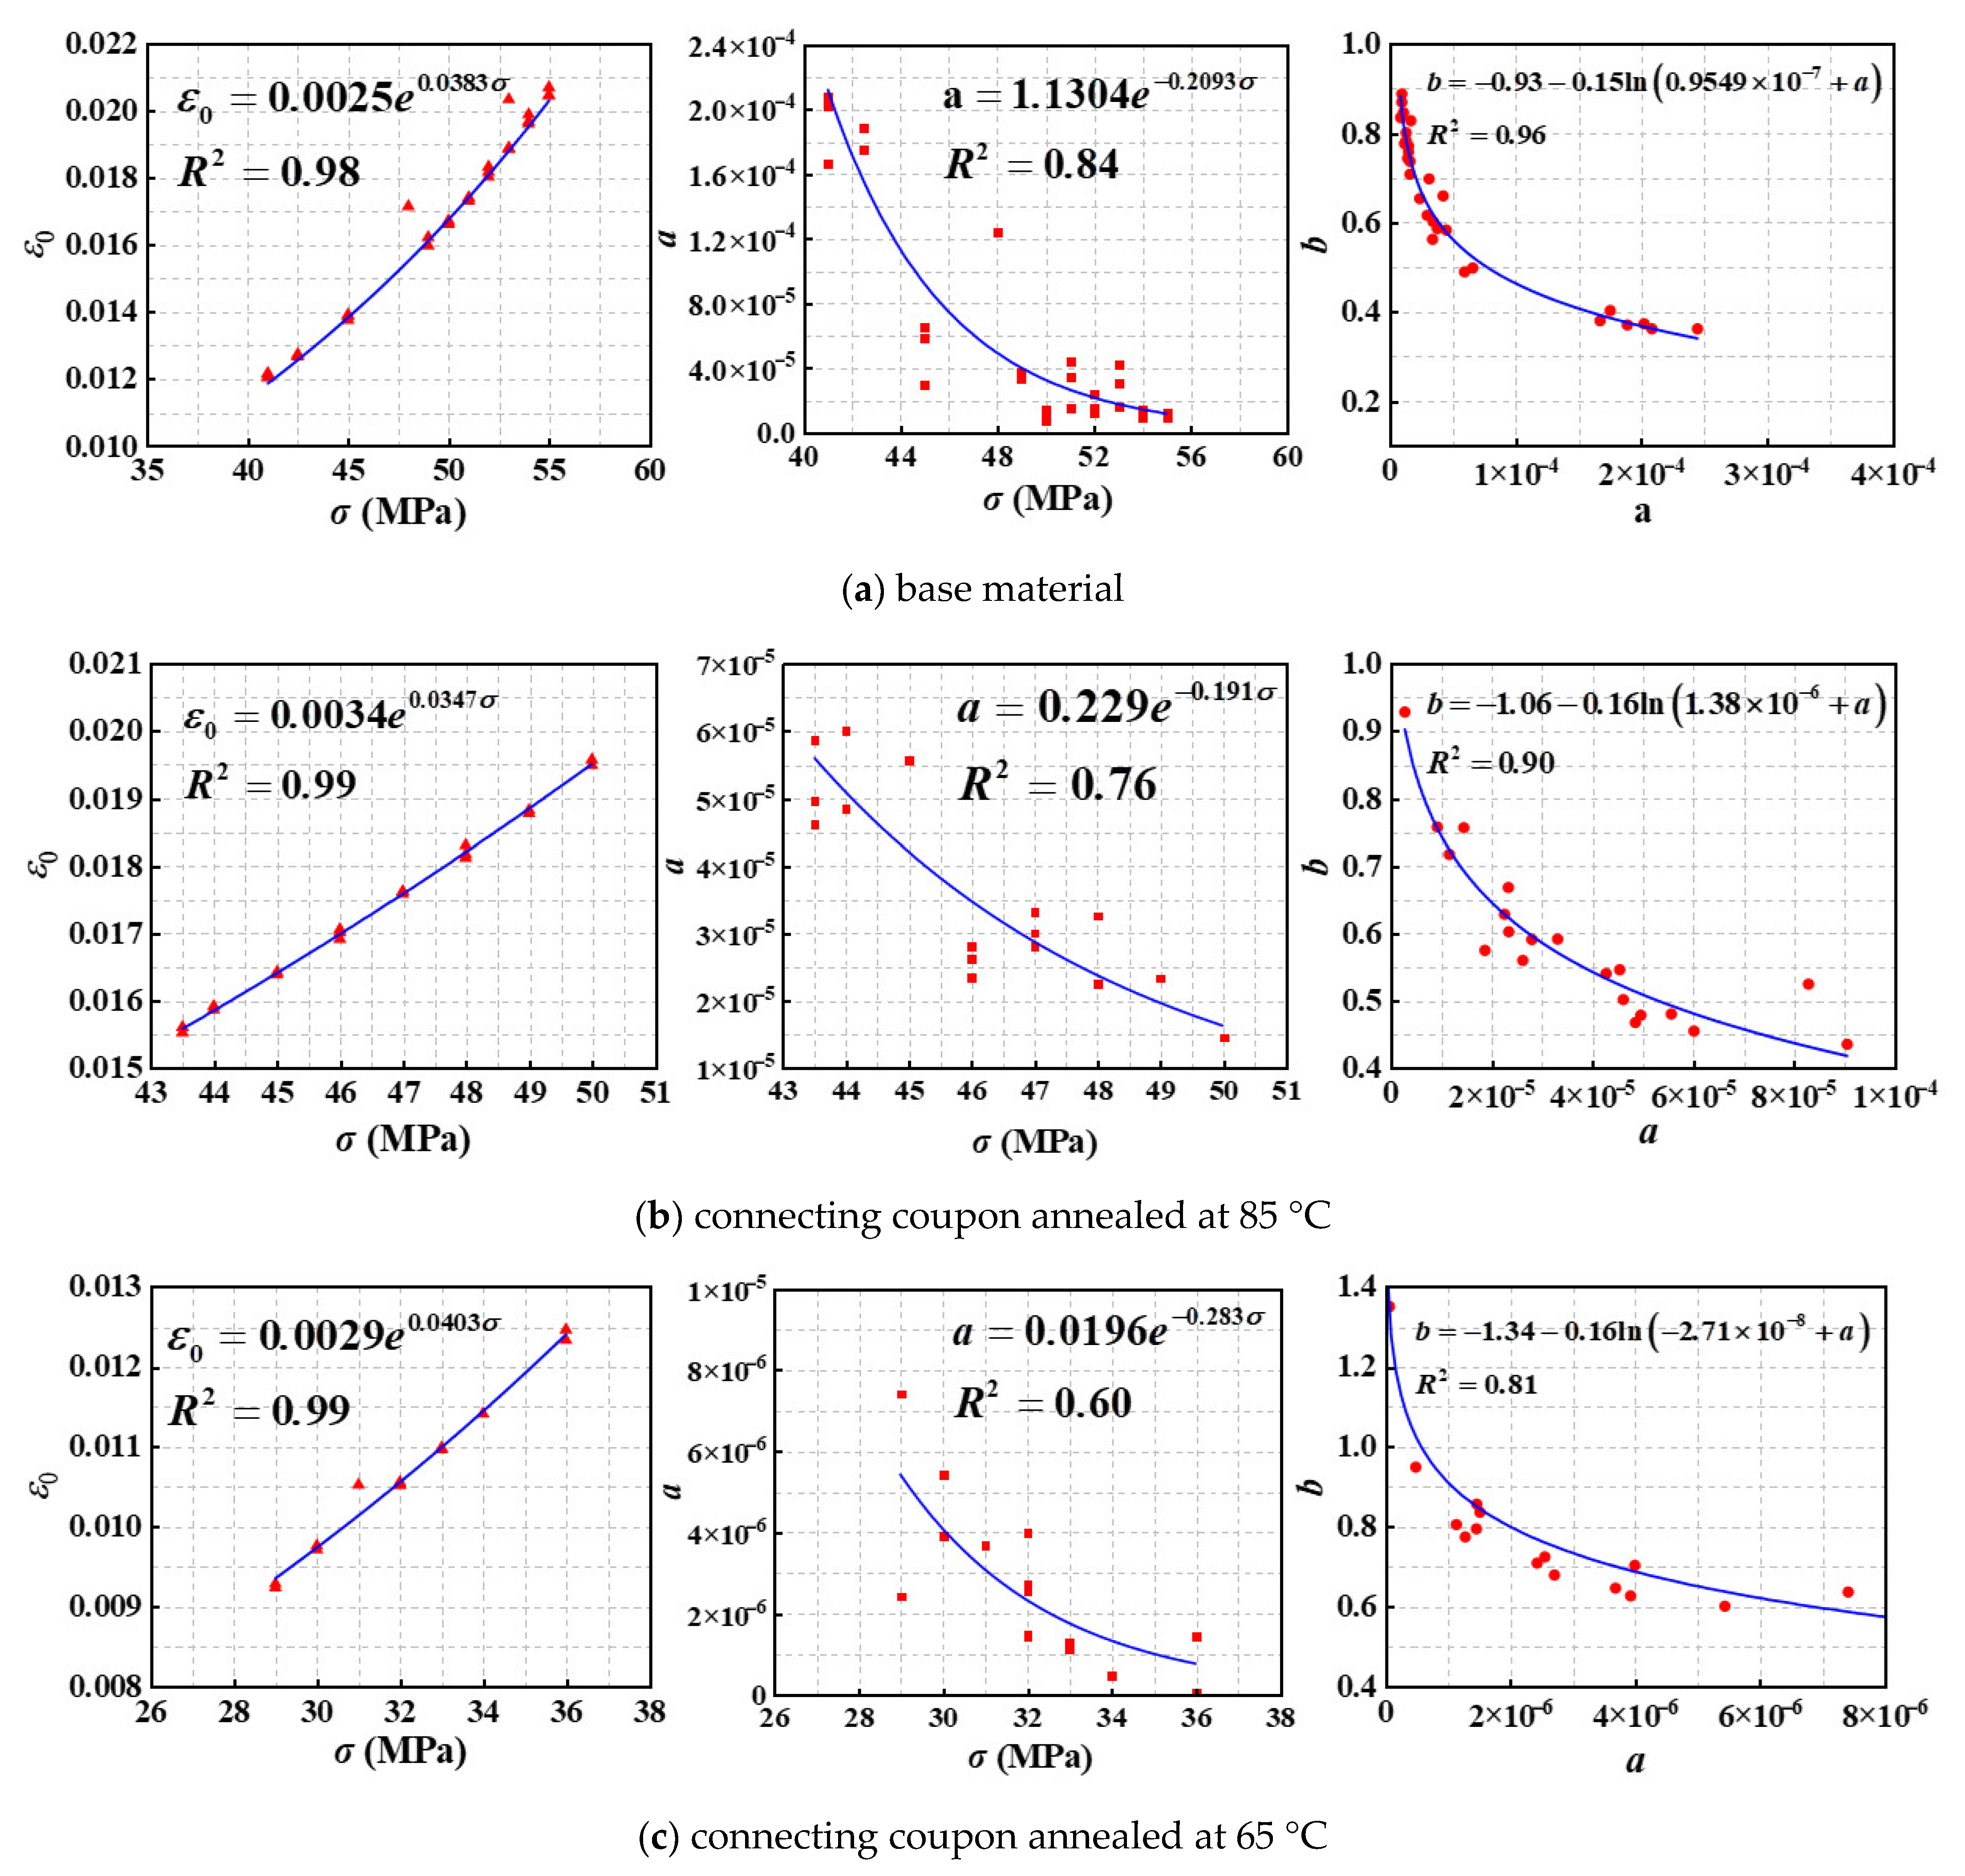
The establishment of functional relationships between the Findley model parameters (ε0, a, b) and applied stress (σ) enables the model to predict creep behavior across arbitrary stress levels. Based on the previously obtained fitting results, Figure 14 illustrates the characteristic relationships between ε0 and σ, a and σ, and b and a. These relationships were subsequently quantified through quadratic regression analysis. Notably, to enhance the statistical reliability of the parameter determination, the analysis incorporated all available experimental data from failed coupons, including replicate test results.

Figure 14.
Quadratic fitting of the parameters in the Findley model. The red triangles, rectangles, and dots represent the data points for the parameter ε0, parameter a, and parameter b, respectively.
As demonstrated in Figure 13, the quadratic fitting yields superior correlation for parameters ε0 and b compared to parameter a, indicating more reliable predictive capability for these parameters. Based on the established quadratic relationships presented in Figure 14, the Findley model can be mathematically expressed as follows:
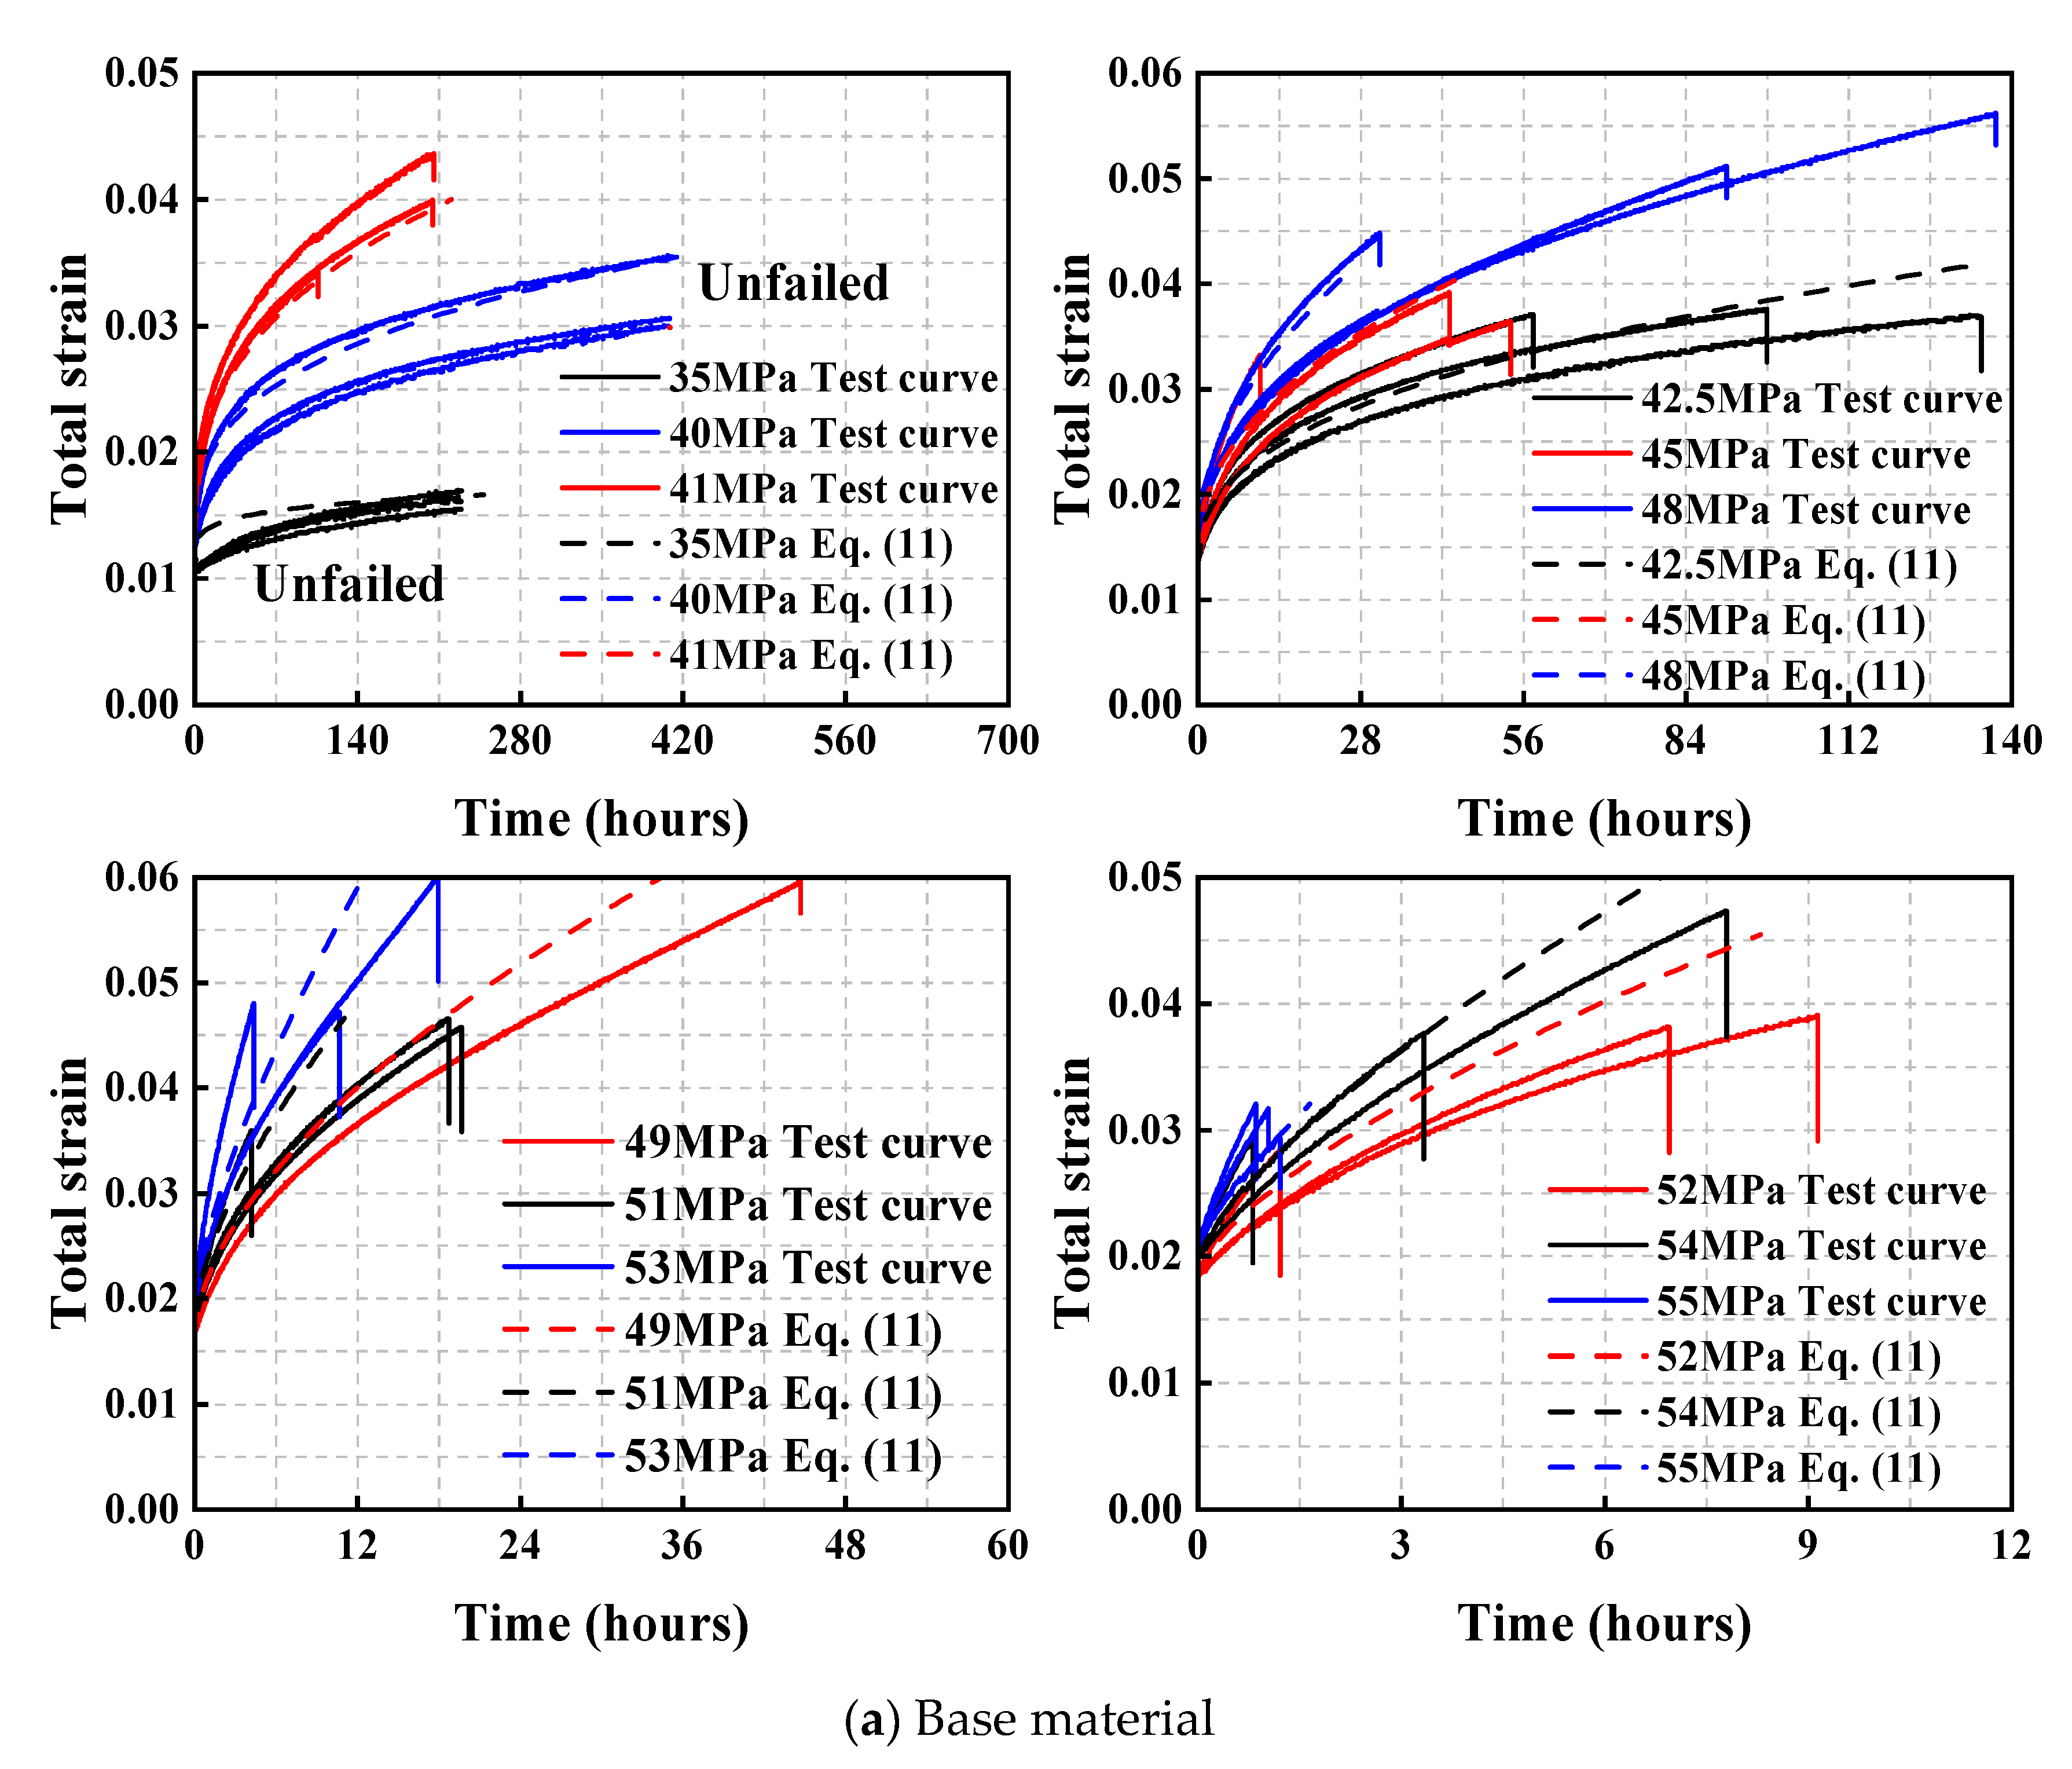
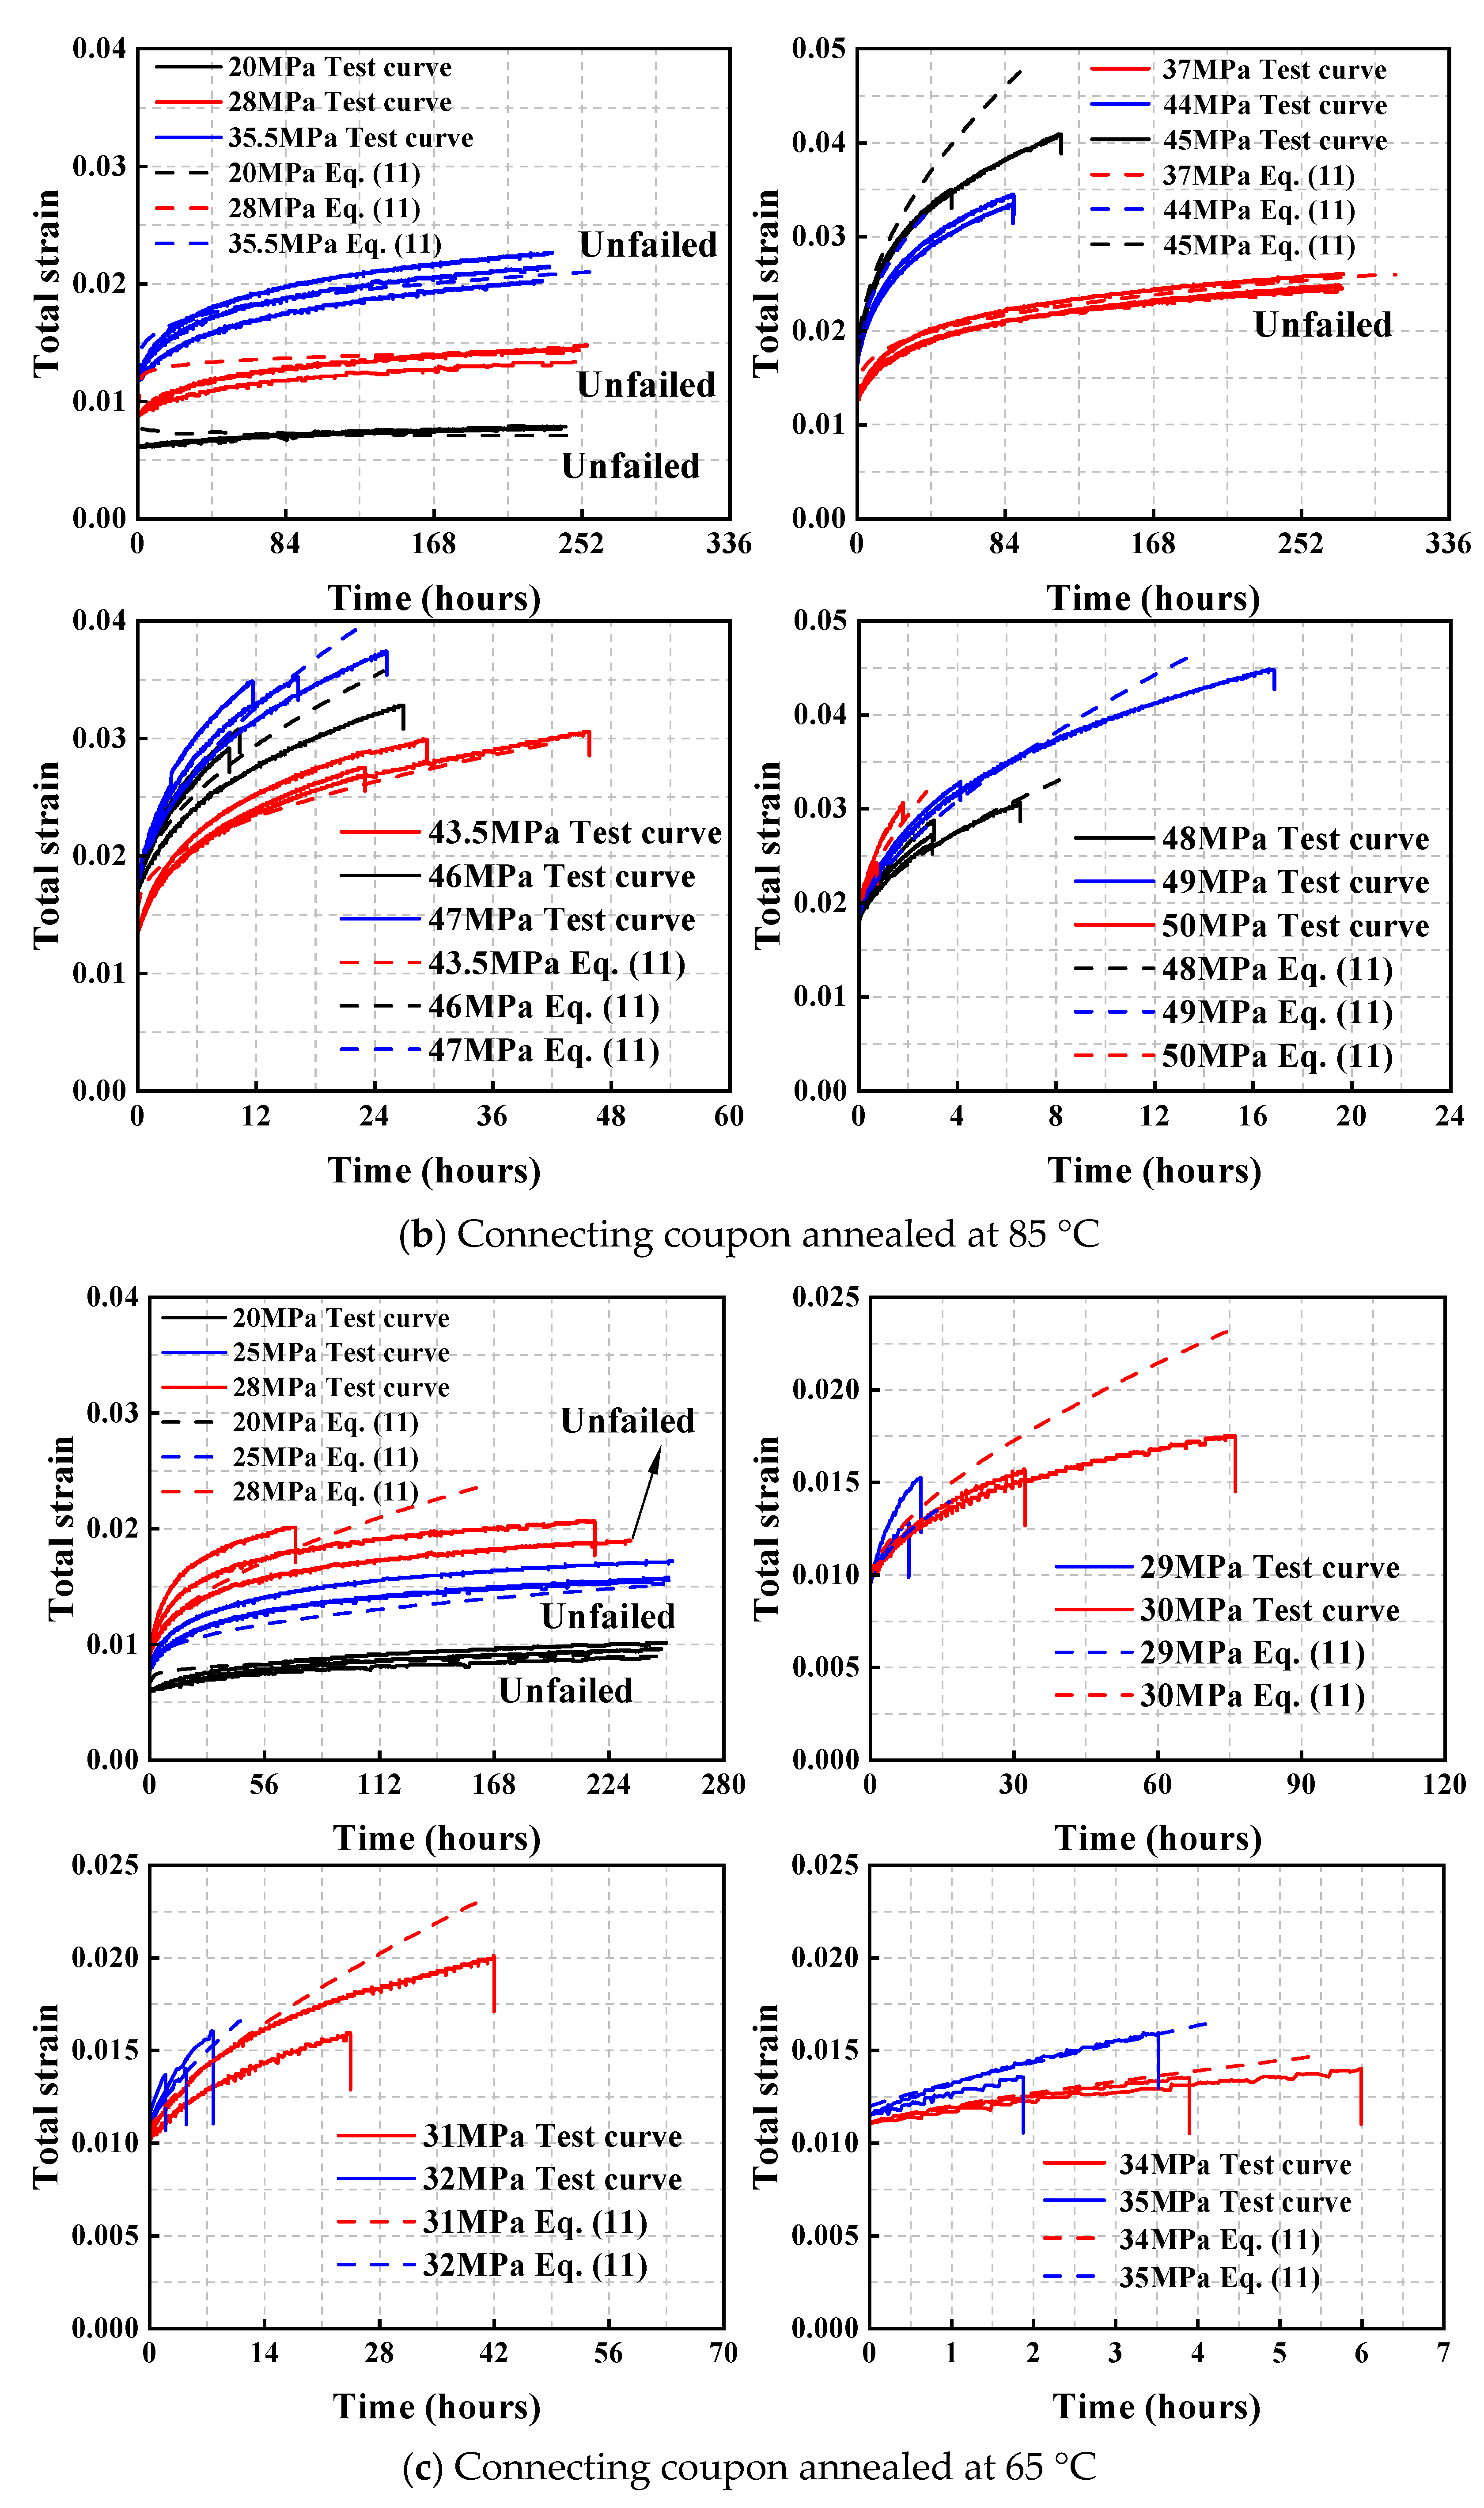
By implementing the experimental stress levels corresponding to the three coupon types into Equation (11), the predicted creep curves were generated. The comparative analysis presented in Figure 15 reveals excellent agreement between the predicted and experimental curves, validating the predictive accuracy of Equation (11). Notably, while the parameter fitting process excluded data from unfailed coupons to ensure parameter reliability, the derived equation demonstrates remarkable versatility by accurately describing the creep behavior of these unfailed coupons, suggesting robust predictive capability across different failure conditions.


Figure 15.
Comparison between Equation (11) and test curves.
5. Verification of Time–Stress Superposition Principle (TSSP)
Based on the TSSP, the long-term creep compliance of acrylic coupons under low stress conditions can be equivalently represented by the shifted short-term creep compliance at elevated stress levels, as expressed by the following relationship:
where J is the creep compliance, equal to the ratio of strain to stress, and φσ is the shift factor calculated according to the Williams–Landel–Ferry (WLF) equation (see Equation (13)).
As illustrated in Figure 16, the relationship between logarithmic creep compliance lgJ and logarithmic time lgt are presented for the tested coupons. The experimental results reveal distinct separation among creep compliance curves at different stress levels, providing clear evidence of stress-dependent viscoelastic behavior. This characteristic response confirms that acrylic exhibits nonlinear viscoelastic material properties, as its creep compliance demonstrates significant stress sensitivity.

Figure 16.
Creep compliance curves. (a) base material. (b) connecting coupon annealed at 85 °C. (c) connecting coupon annealed at 65 °C.
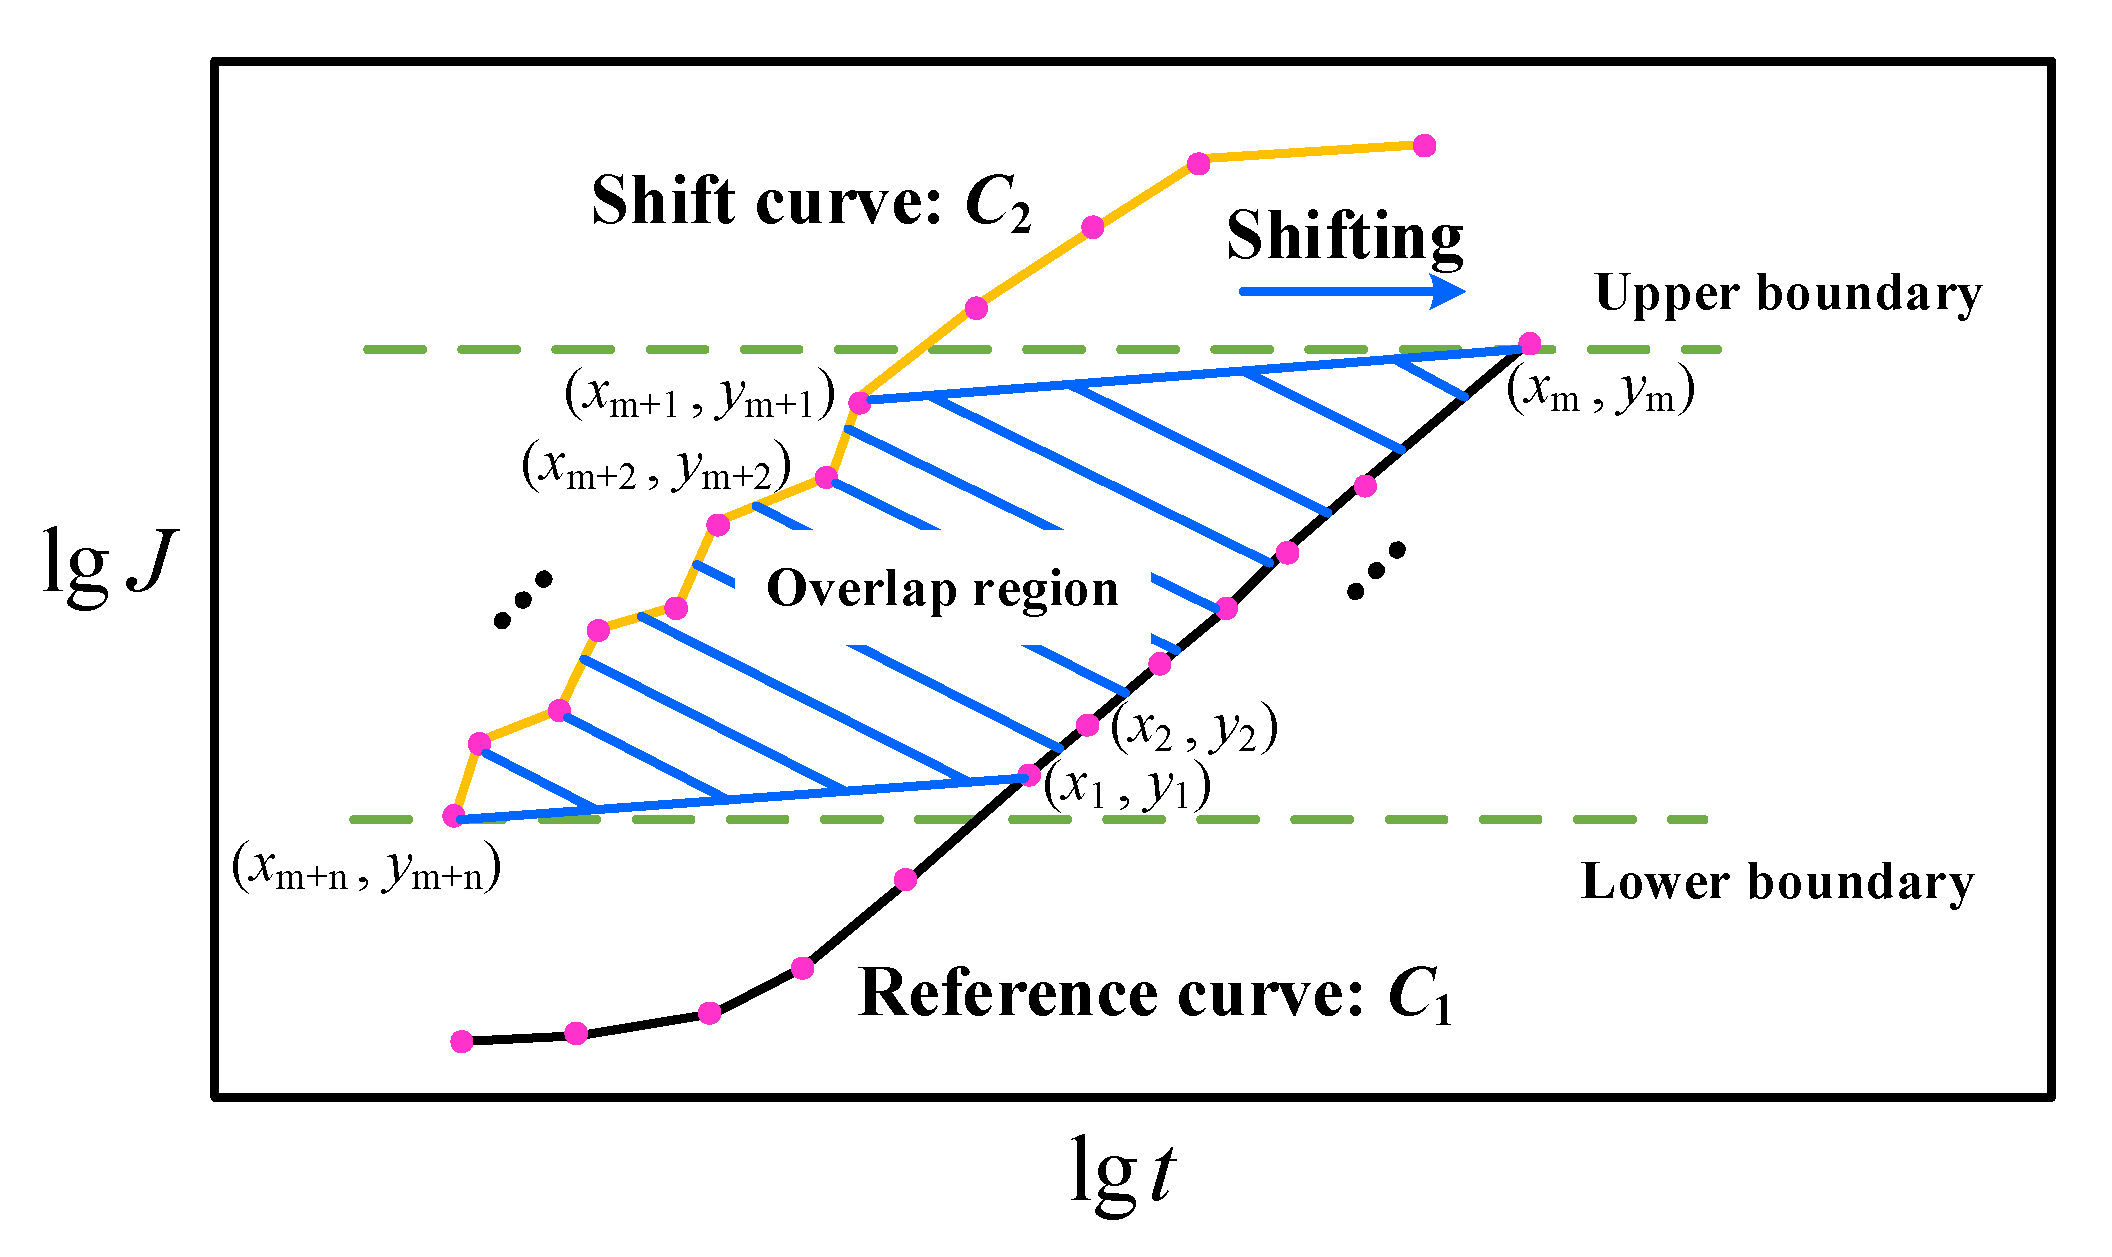
Liu [] proposed a method for constructing the master curve of viscoelastic materials and determining the corresponding shift factor, where the shift factor is defined as follow:
The schematic representation of the parameters in Equation (14) is presented in Figure 17, where C1 denotes the curve requiring horizontal shifting (referred to as the shift curve), and C2 represents the reference or target curve. The dataset {(x1, y1), …, (xm, ym)} corresponds to the coordinates of curve C1 within the overlapping region, whereas {(xm+1, ym+1), …, (xm+n, ym+n)} describes the coordinates of curve C2 in the same region. The numerator in Equation (14) quantifies the overlapping area between the two curves, while the denominator characterizes the mean height within the overlapping domain. This formulation yields a unique shift factor, effectively eliminating the subjectivity inherent in manual curve shifting and minimizing potential errors associated with numerical fitting procedures.

Figure 17.
Schematic diagram of shifting approach for constructing master curve.
The determined shift factors are systematically summarized in Table 5, with the corresponding master curves presented in Figure 18. The reference stresses were established as 35 MPa for the base material, 28 MPa for the connecting coupon annealed at 85 °C, and 25 MPa for the connecting coupon annealed at 65 °C. It should be noted that the connecting coupons exhibited negligible creep strain development during the 15-day monitoring period under a constant stress level of 20 MPa. This minimal strain evolution resulted in virtually constant creep compliance, which consequently led to the absence of a discernible overlap region between the reference curve and the shifted curve, thereby preventing the construction of a meaningful master curve for this specific condition.

Table 5.
Calculation results of shift factors.

Figure 18.
Comparison between master curves and experimental creep compliance curves. (a) base material. (b) connecting coupon annealed at 85 °C. (c) connecting coupon annealed at 65 °C.
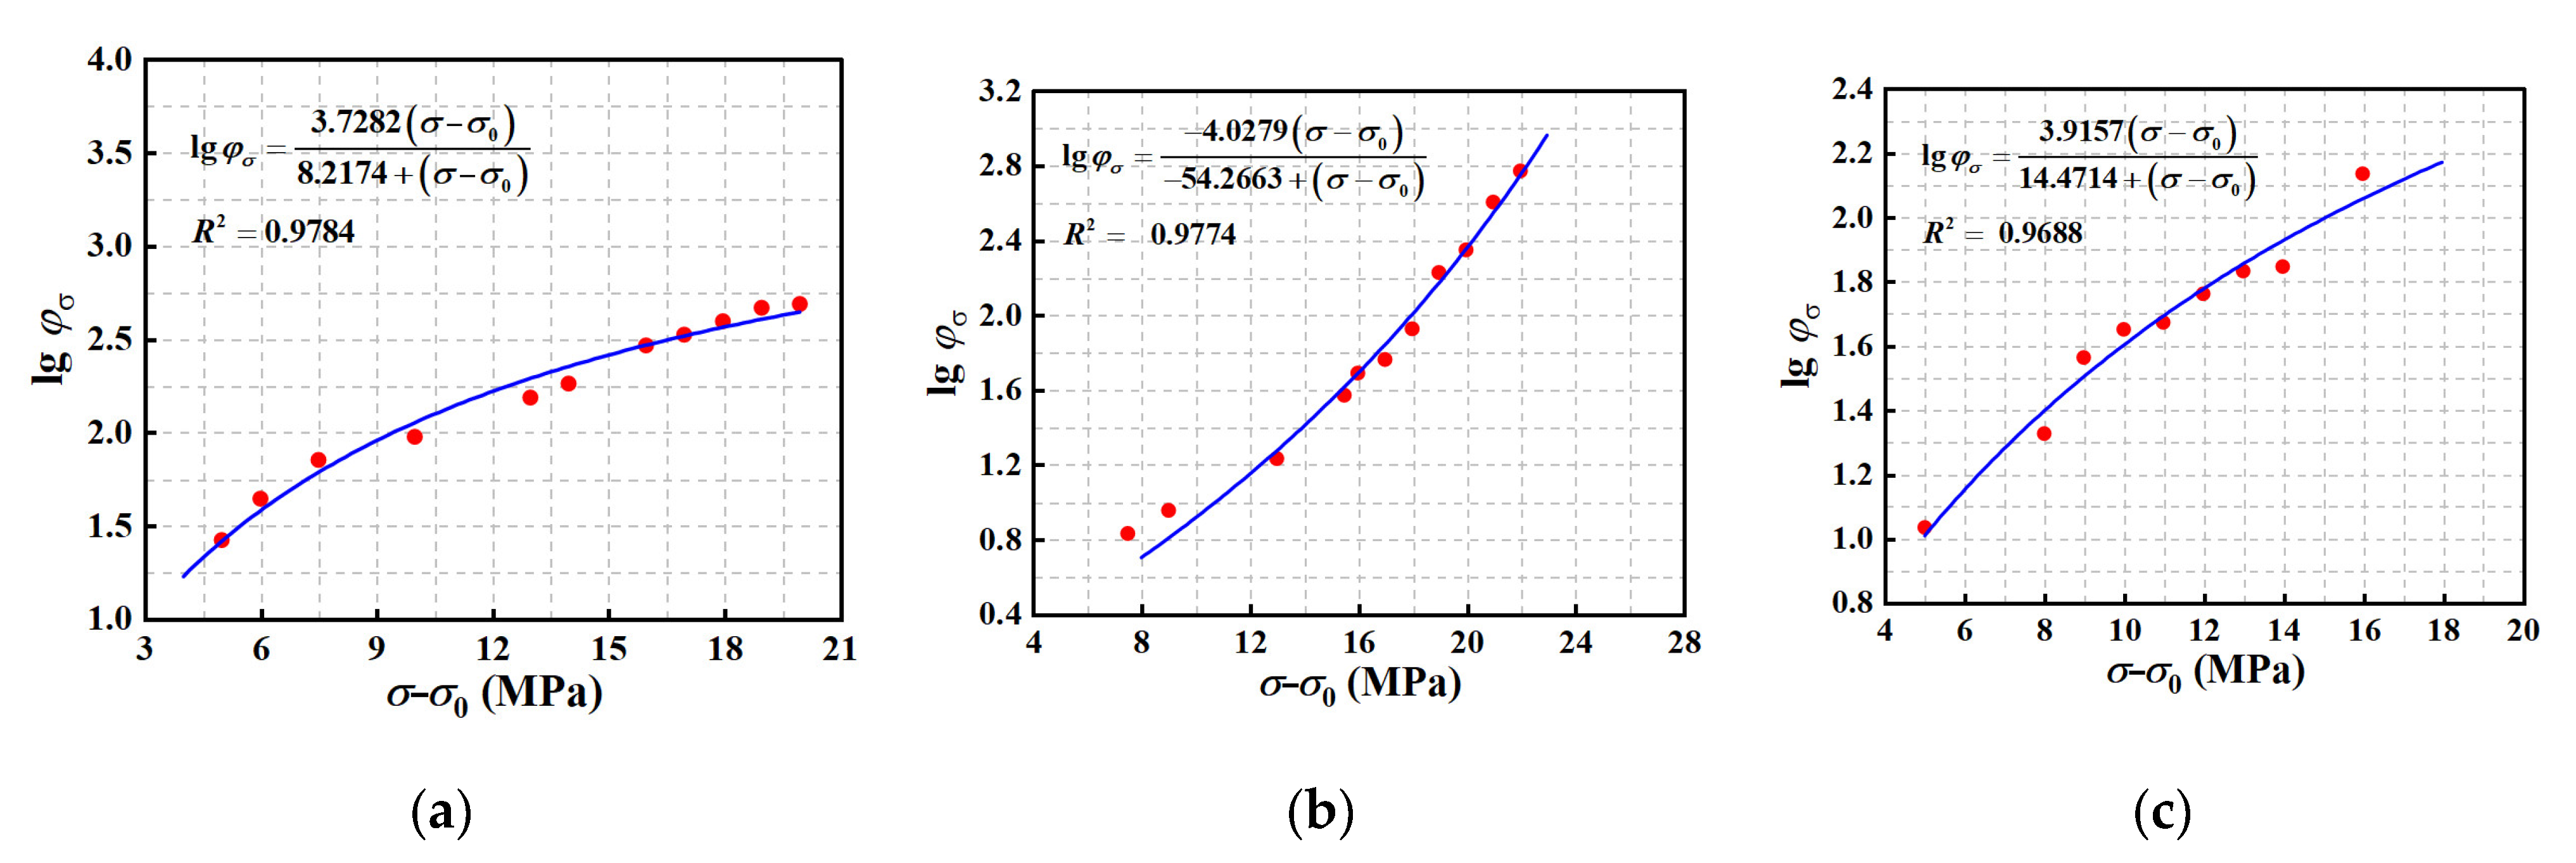
As evidenced by the comparative analysis in Figure 18, a noticeable discrepancy exists between the master curves and tested curves prior to reaching their respective threshold values. This divergence can be primarily attributed to variations in instantaneous strains across different stress levels, where the magnitude of deviation between the master curve and experimental data exhibits a positive correlation with the stress level difference. Notably, the master curves demonstrate excellent agreement with tested curve beyond the threshold values, which holds particular significance as the long-term creep behavior at reduced stress levels is of greater engineering relevance than short-term response. The determined threshold time values are 501,187 s for the base material, 316,227 s for the connecting coupon annealed at 85 °C, and 199,526 s for the connecting coupon annealed at 65 °C. Figure 19 illustrates the relationships between lgφσ and σ − σ0, with the fitting results obtained using Equation (15) shown for the three types of coupons.

Figure 19.
Relationship between lgφσ and σ − σ0. (a) base material. (b) connecting coupon annealed at 85 °C. (c) connecting coupon annealed at 65 °C.
6. Conclusions
The bulk polymerization technique is widely used for large-scale acrylic structures, and served as the foundation for this investigation into the creep performance of connecting coupons. Experimental coupons, including the structural acrylic base material and connecting coupons annealed at 85 °C and 65 °C, were specifically designed and fabricated. A comprehensive experimental program encompassing short-term uniaxial tensile tests and long-term creep tests was implemented. The viscoelastic characteristics of the coupons were characterized using the Burgers model, the parameters of which were subsequently transformed into Prony series parameters for FEA. A modified creep equation with enhanced stress-level applicability was developed based on the Findley model, extending its predictive capability. Furthermore, the feasibility of applying the TSSP to structural acrylic was investigated. The conclusions are as follows:
- (1)
- Bulk polymerization degrades the mechanical performance of structural acrylic. The ultimate strength of the connecting coupon annealed at 65 °C is significantly lower than that of the connecting coupon annealed at 85 °C, indicating that annealing temperature profoundly affects the quality of bulk polymerization.
- (2)
- The creep curves of the tested coupons have primary and secondary stages, whereas the tertiary stages were not found. The Burgers model effectively characterizes the viscoelastic behavior of both the structural acrylic base material and connecting coupons. The Prony series converted from the parameters in the Burgers model can be directly used in the Abaqus software for the creep analysis. The close correlation between FEA predictions and experimental results validates the effectiveness of both the Burgers model and its Prony series equivalent in capturing the creep characteristics of structural acrylic.
- (3)
- Although the physical interpretation of the parameters in the Findley model remains unclear, the model demonstrates remarkable accuracy in characterizing creep behavior. Equation (11) proposed in this study on the basis of the Findley model provides a reliable framework for predicting creep curves of both structural acrylic base material and connecting coupons.
- (4)
- The TSSP demonstrates applicability to both structural acrylic base material and connecting coupons annealed at 85 °C and 65 °C, with respective minimum time thresholds of 501,187 s, 316,227 s, and 199,526 s. Through curve fitting analysis, Equation (15) has been established as an effective predictor of the shift factor for structural acrylic.
Author Contributions
Conceptualization, Z.W.; Methodology, Z.W. and M.H.; Software, Y.L.; Validation, Y.W. and B.Z.; Formal Analysis, Z.W.; Investigation, Y.L., Y.S., W.C. and J.X.; Resources, Y.W.; Data Curation, Y.L.; Writing—Original Draft Preparation, Y.L.; Writing—Review and Editing, Z.W.; Visualization, Y.L.; Supervision, Y.W., B.Z. and J.X.; Project Administration, B.Z. and J.X.; Funding Acquisition, Z.W. All authors have read and agreed to the published version of the manuscript.
Funding
This work is financially supported by the National Natural Science Foundation of China (Nos. 52208169 and 12127808), and the Ministry of Science and Technology of China (No. 2022YFA1604704).
Data Availability Statement
The original contributions presented in this study are included in the article. Further inquiries can be directed to the corresponding author.
Acknowledgments
The author would like to express sincere gratitude to the three anonymous architectural experts for their valuable guidance. Their contributions have been indispensable to the success of this research.
Conflicts of Interest
Authors Bailun Zhang and Yulong Song were employed by the company China Resources Land Limited. Authors Jianxia Xiao and Wei Cheng were employed by the company Donchamp (Jiangsu) Materials Technology Co., Ltd. The remaining authors declare that the research was conducted in the absence of any commercial or financial relationships that could be construed as a potential conflict of interest.
References
- Tsai, S.N.; Chiag, H.T. Repair Effects of Offcut-Carbon-Fiber-Powder-Modified PU-PMMA Copolymer on Flexure-After-Impact Behaviors of Composite Laminate. Heliyon 2025, 11, e41476. [Google Scholar] [CrossRef]
- Zheng, Z.B.; Chen, S.Y.; Liu, X.D.; Wang, Y.; Bian, Y.; Feng, B.; Zhao, R.; Qiu, Z.; Sun, Y.; Zhang, H.; et al. A Bioactive Polymethylmethacrylate Bone Cement for Prosthesis Fixation in Osteoporotic Hip Replacement Surgery. Mater. Des. 2021, 209, 109966. [Google Scholar] [CrossRef]
- Zhou, W.; Huang, J.X.; Huang, W.; Liu, D. Dynamic Fracture Testing of Polymethylmethacrylate (PMMA) Single-Edge Notched Beam. Polym. Test. 2020, 91, 106833. [Google Scholar] [CrossRef]
- Vu, T.V.; Sim, J.H.; Choi, J.; Jeong, H.; Park, S.; Kim, S.; Baek, S.; Lee, H.; Kang, Y. Conformational Energy Inversion in PMMA Crystals Prepared via Thermal Quenching with Entropy Diluents. Polymer 2025, 326, 128318. [Google Scholar] [CrossRef]
- Ube, T.; Aoki, H.; Ito, S.; Horinaka, J.-I.; Takigawa, T. Conformation of Single PMMA Chain in Uniaxially Stretched Film Studied by Scanning Near-Field Optical Microscopy. Polymer 2007, 48, 6221–6225. [Google Scholar] [CrossRef]
- Wang, Z.Y.; Wang, Y.Q.; Du, X.X.; Zhang, T.; Heng, Y. Study on the Fracture Properties of the PMMA Structure for the JUNO Central Detector. KSCE J. Civ. Eng. 2019, 23, 2584–2597. [Google Scholar] [CrossRef]
- GB/T 7134-2008; Poly (Methyl Methacrylate) Cast Sheets. Standards Press of China: Beijing, China, 2008. (In Chinese)
- Cai, S.M.; Chen, Y.M.; Liu, Q.X. Development and Validation of Fractional Constitutive Models for Viscoelastic-Plastic Creep in Time-Dependent Materials: Rapid Experimental Data Fitting. Appl. Math. Model. 2024, 132, 645–678. [Google Scholar] [CrossRef]
- Poynting, J.H.; Thomson, J.J. Properties of Matter; C. Griffin and Co.: London, UK, 1902. [Google Scholar] [CrossRef]
- Williams, M.L. Structural Analysis of Viscoelastic Materials. AIAA J. 1964, 2, 785–808. [Google Scholar] [CrossRef]
- Li, X.Z.; Sha, A.M.; Jiao, W.X.; Song, R.M.; Cao, Y.S.; Li, C.; Liu, Z.Z. Fractional derivative Burgers models describing dynamic viscoelastic properties of asphalt binders. Constr. Build. Mater. 2023, 408, 133552. [Google Scholar] [CrossRef]
- Jalocha, D.; Constantinescu, A.; Neviere, R. Revisiting the Identification of Generalized Maxwell Models from Experimental Results. Int. J. Solids Struct. 2015, 67–68, 169–181. [Google Scholar] [CrossRef]
- Plazek, D.J.; Plazek, C.T. A History of Andrade Creep and the Investigation of the Dielectric Dipolar Andrade Creep. J. Non-Cryst. Solids 2021, 560, 120625. [Google Scholar] [CrossRef]
- Xiao, H.R.; Cai, L.X.; Han, G.Z. A Novel Theoretical Model for Obtaining Norton’s Law of Creep Materials Using Different Small Specimens. Int. J. Mech. Sci. 2024, 261, 108677. [Google Scholar] [CrossRef]
- Dong, S.L.; Gong, Z.; Chen, Z.Y.; Qu, Y.; Chen, R.; Liu, S.; Li, G. High Temperature Tensile Creep Behavior and Microstructure Evolution of Ti60 Alloy Rolled Sheet. Mater. Today Commun. 2024, 41, 110805. [Google Scholar] [CrossRef]
- Xu, S.X.; Gao, H.X.; Qiu, P.; Shen, W.; Cai, Y.; Liu, D. Stability Analysis of Acrylic Glass Pressure Cylindrical Shell Considering Creep Effect. Thin-Walled Struct. 2022, 181, 110033. [Google Scholar] [CrossRef]
- Mahdavi, R.; Goodarzi, V.; Jafari, S.H.; Saeb, M.R.; Shojaei, S. Experimental Analysis and Prediction of Viscoelastic Creep Properties of PP/EVA/LDH Nanocomposites Using Master Curves Based on Time–Temperature Superposition. J. Appl. Polym. Sci. 2018, 135, 46725. [Google Scholar] [CrossRef]
- Luo, W.B.; Wang, C.H.; Hu, X.L.; Yang, T.Q. Long-term creep assessment of viscoelastic polymer by time-temperature-stress superposition. Acta Mech. Solida Sin. 2012, 25, 571–578. [Google Scholar] [CrossRef]
- Jazouli, S.; Luo, W.; Bremand, F.; Vu-Khanh, T. Application of Time–Stress Equivalence to Nonlinear Creep of Polycarbonate. Polym. Test. 2005, 24, 463–467. [Google Scholar] [CrossRef]
- Wang, B.; Fancey, K.S. Application of Time–Stress Superposition to Viscoelastic Behavior of Polyamide 6,6 Fiber and Its “True” Elastic Modulus. J. Appl. Polym. Sci. 2017, 134, 44971. [Google Scholar] [CrossRef]
- Yang, Z.Q.; Wang, H.; Ma, X.F.; Shang, F.; Ma, Y.; Shao, Z.; Hou, D. Flexural Creep Tests and Long-Term Mechanical Behavior of Fiber-Reinforced Polymeric Composite Tubes. Compos. Struct. 2018, 193, 154–164. [Google Scholar] [CrossRef]
- Zhou, F.; Hou, S.J.; Qian, X.H.; Chen, Z.; Zheng, C.; Xu, F. Creep Behavior and Lifetime Prediction of PMMA Immersed in Liquid Scintillator. Polym. Test. 2016, 53, 323–328. [Google Scholar] [CrossRef]
- Wang, C.H.; Luo, W.B.; Liu, X.; Chen, X.; Jiang, L.; Yang, S. Application of Time-Temperature-Stress Equivalence to Nonlinear Creep in Poly(methyl methacrylate). Mater. Today Commun. 2019, 21, 100710. [Google Scholar] [CrossRef]
- GB/T 1040.1-2006; Plastics—Determination of Tensile Properties—Part 1: General Principles. Standards Press of China: Beijing, China, 2006. (In Chinese)
- GB/T 11546.1-2008; Plastics—Determination of Creep Behavior—Part 1: Tensile Creep. Standards Press of China: Beijing, China, 2008. (In Chinese)
- Wang, Z.Y.; Liu, Y.H.; Wang, Y.Q.; Huang, M.; Xiao, J.X.; Cheng, W. Creep Model of Base Material and Bulk Polymerization Connected Coupons of Structural Acrylic. J. Southeast Univ. (Nat. Sci. Ed.) 2025, 55, 1035–1043. (In Chinese) [Google Scholar] [CrossRef]
- Gutierrez-Lemini, D. Engineering Viscoelasticity; Oil States Industries: Arlington, TX, USA, 2014. [Google Scholar] [CrossRef]
- Luo, R.; Lv, H.J.; Liu, H.Q. Development of Prony Series Models Based on Continuous Relaxation Spectrums for Relaxation Moduli Determined Using Creep Tests. Constr. Build. Mater. 2018, 168, 758–770. [Google Scholar] [CrossRef]
- Zhang, Y.Q.; Birgisson, B.; Lytton, R.L. Weak Form Equation-Based Finite-Element Modeling of Viscoelastic Asphalt Mixtures. J. Mater. Civ. Eng. 2016, 28, 04015115. [Google Scholar] [CrossRef]
- Barbero, E.J. Finite Element Analysis of Composite Materials with Abaqus; CRC Press: Boca Raton, FL, USA, 2013. [Google Scholar] [CrossRef]
- Wang, C.; Anupam, K.; Kasbergen, C.; Erkens, S. Frequency Range Optimization for Linear Viscoelastic Characterization of Burger’s Model. Int. J. Mech. Sci. 2025, 285, 109817. [Google Scholar] [CrossRef]
- Zhang, X.Y.; Gu, X.Y.; Lv, J.X.; Zhu, Z.; Zou, X. Numerical Analysis of the Rheological Behaviors of Basalt Fiber Reinforced Asphalt Mortar Using ABAQUS. Constr. Build. Mater. 2017, 157, 392–401. [Google Scholar] [CrossRef]
- Amjadi, M.; Fatemi, A. Creep Behavior and Modeling of High-Density Polyethylene (HDPE). Polym. Test. 2021, 94, 107031. [Google Scholar] [CrossRef]
- Gao, D.D.; Wang, P.B.; Li, M.; Luo, W. Modelling of Nonlinear Viscoelastic Creep Behaviour of Hot-Mix Asphalt. Constr. Build. Mater. 2015, 95, 329–336. [Google Scholar] [CrossRef]
- Liu, X.; Luo, W.B.; Li, M. A Novel Approach for Constructing Master Curves of Rheological Simple Material. Chin. J. Solid Mech. 2015, 36, 223–232. (In Chinese) [Google Scholar] [CrossRef]
Disclaimer/Publisher’s Note: The statements, opinions and data contained in all publications are solely those of the individual author(s) and contributor(s) and not of MDPI and/or the editor(s). MDPI and/or the editor(s) disclaim responsibility for any injury to people or property resulting from any ideas, methods, instructions or products referred to in the content. |
© 2025 by the authors. Licensee MDPI, Basel, Switzerland. This article is an open access article distributed under the terms and conditions of the Creative Commons Attribution (CC BY) license (https://creativecommons.org/licenses/by/4.0/).