Article

A Hybrid Optimization Method for Rebar Cutting in Structural Reinforcement

1
Shanghai Construction Group Co., Ltd., Shanghai 201114, China
2
College of Civil Engineering, Tongji University, Shanghai 200092, China
*
Author to whom correspondence should be addressed.
Buildings 2025, 15(20), 3693; https://doi.org/10.3390/buildings15203693 (registering DOI)
Submission received: 4 September 2025 / Revised: 25 September 2025 / Accepted: 30 September 2025 / Published: 14 October 2025
(This article belongs to the Section Building Structures)

Abstract

With the growing application of digital technologies in construction, reinforcement detailing and cutting are becoming increasingly refined. However, existing cutting methods struggle to meet the dual requirements of low waste and high computational efficiency when facing diverse rebar types, multiple splice points, and complex constraints. This paper proposes a hybrid optimization algorithm for large-scale rebar cutting that achieves efficient joint optimization of splice positions and cutting schemes. Numerical simulations verify the performance of the proposed algorithm under normal and uniform length distributions, with comparisons against traditional methods. Results show that the proposed method maintains the waste ratio below 1% for large-scale numerical datasets while achieving much higher computational efficiency than heuristic algorithms with good stability and scalability. Two engineering examples further validate this approach. In column longitudinal reinforcement, the waste ratio in each story was kept below 1%, and in precast bridge segmental beams, the method flexibly incorporated customized raw rebar lengths, reducing the waste ratio to as low as 0.4%. The proposed method effectively balances material utilization and cutting efficiency, offering a practical solution for intelligent rebar cutting across a wide range of components and construction scenarios.

1. Introduction

After the completion of structural design and the transition to the construction stage, reinforcement detailing scheme must be carried out based on the structural drawings and actual site conditions. This process determines the arrangement and placement of reinforcement bars, ultimately producing the reinforcement construction plan and cutting list [1]. With the development of Building Information Modeling (BIM) technology, reinforcement detailing can be performed within BIM models [2]. Parametric modeling in BIM improves both the efficiency and accuracy of rebar detailing and provides technical support for standardized collaborative work. However, intelligent rebar cutting programs developed on BIM platforms remain in an early stage. Most current approaches rely on exhaustive search to determine the optimal cutting positions, but as the number of cutting points increases, the computational efficiency of exhaustive methods decreases sharply, affecting overall detailing performance. For cases with relatively few cutting points or rebar types, integer programming can be introduced to optimize rebar cutting [3]. Nevertheless, under practical engineering conditions, where numerous rebar types and cutting positions coexist with complex constraints, the efficiency of integer programming methods significantly deteriorates. Therefore, it remains necessary to develop an intelligent optimization algorithm specifically tailored for rebar cutting, with the goals of improving detailing efficiency and reducing material waste.
Intelligent optimization algorithms have demonstrated good performance in solving engineering problems characterized by complex constraints and multiple variables [4]. Hence, intelligent optimization algorithms can be considered for rebar cutting problems involving multiple cutting points, diverse rebar types, and multiple construction restrictions. For structural optimization problems with discrete design variables, intelligent algorithms such as genetic algorithms [5,6] and particle swarm optimization [7] can search for optimal solutions within high-dimensional and complex solution spaces. In engineering practice, when optimization problems exhibit stage-wise progression and process-dependent decision-making, they can be modeled as Markov decision processes, where optimal solutions are obtained through the optimization of state transition paths [8]. Specifically, in the splicing and installation of long rebars, the construction process often exhibits hierarchical progression with explicit logical connections between splicing positions. Such features align well with Markov process modeling, making Markov-based optimization methods suitable for improving decision-making in the rebar cutting process [9].
Most existing studies have focused on the load-carrying capacity [10] and bond performance between rebar and concrete [11] during the service phase of reinforced concrete, while research on issues arising during rebar construction remains limited. In practice, when rebar with large diameters is required, coiled steel bars cannot be used, and raw steel bars must be cut into the desired lengths. This necessitates not only ensuring accurate and standardized installation but also accounting for constructability and material utilization during the detailing process. Traditional rebar detailing often depends on the experience of construction personnel, relying on manual layout and cutting calculations. This approach is inefficient, involves repeated calculations, and frequently results in non-standard connections and high material waste due to improper cutting decisions. In recent years, several rebar cutting optimization methods have been proposed, aiming to maximize material utilization while complying with connection requirements. For example, researchers have constrained cutting positions and designed special length-matching strategies for beam elements, achieving a waste rate of less than 0.99% [12]. Although these methods achieved notable improvements in material savings, they often suffer from low computational efficiency when applied to large-scale rebar datasets. In particular, pure genetic algorithms and integer programming approaches become computationally prohibitive as the problem size increases, making them unsuitable for real-time and on-site optimization. Greedy algorithms offer high efficiency but typically result in high waste rates, which do not meet practical requirements for material utilization. Hybrid optimization methods can overcome the limitations of single metaheuristic algorithms to some extent. For example, the combination of the Harris hawks optimization algorithm, the whale optimization algorithm, and the particle swarm optimization algorithm has demonstrated faster convergence speed and a better balance between global exploration and local exploitation across multiple benchmark functions and engineering applications [13]. In recent years, hybrid optimization strategies have also been introduced into rebar optimization. For diaphragm wall structures, researchers have integrated Building Information Modeling with a greedy hybrid algorithm based on the Whale Optimization Algorithm for reinforcement layout and cutting optimization [14]. For pump station projects, an improved genetic algorithm combined with BIM technology has been developed to optimize rebar cutting, significantly reducing material waste and improving constructability [15]. Similarly, an intelligent optimization method combining integer linear programming and heuristic strategies has been applied at the construction site level, demonstrating clear advantages in cutting waste reduction and computational efficiency [16]. These studies highlight the potential of hybrid optimization in addressing rebar cutting and splicing-related constraints. However, challenges remain in terms of systematic reuse of rebars and maintaining computational efficiency in large-scale instances. To address these limitations, this paper proposes a rebar cutting optimization method that achieves both significant reductions in material waste and high efficiency when applied to large-scale rebar cutting problems.
This paper proposes an optimization method for rebar cutting. When the required rebar length exceeds the available raw material length, the splicing positions are modeled using a Markov Decision Process (MDP), ensuring that the spliced rebars satisfy engineering constraints such as splicing zones and staggered spacing. This approach avoids the potential convergence instability that could arise if complex construction constraints were directly embedded in subsequent optimization algorithms. In the later stage, during rebar cutting optimization that combines a greedy algorithm with global intelligent search, a reuse mechanism for remaining materials with mechanical connectors is introduced into the greedy algorithm, which helps minimize rebar waste. Once the greedy algorithm determines the optimized cutting scheme for the majority of rebars, a global heuristic optimization algorithm is applied to handle the small subset of rebars that are difficult for the greedy algorithm to address. The proposed method demonstrates excellent optimization performance even in complex scenarios involving long rebars, large quantities, and multiple construction constraints, making it more applicable to real-world construction and exhibiting robustness and applicability. This paper is organized as follows. Section 1 introduces the proposed rebar cutting optimization methods. Section 2 presents performance analyses of the proposed method. Section 3 demonstrates the application of the algorithm to longitudinal rebar cutting in columns. Section 4 discusses the application of the algorithm to rebar cutting in prefabricated bridge. Finally, Section 5 provides conclusions and future perspectives.

2. Rebar Cutting Optimization Methods

2.1. Optimization of Rebar Splice Points

For rebars in construction drawings whose required length exceeds the available raw rebar length, it is necessary on site to splice multiple shorter rebars into a rebar of the desired length. The determination of splicing points is subject to both code requirements and construction constraints. First, the splicing points must comply with design codes, such as being located within the allowable splicing zone of beams or columns, and maintaining a specified spacing between adjacent splices. Second, the locations are also restricted by construction conditions. For example, due to the height limitation of concrete placing equipment, the splice of longitudinal rebars in columns cannot be positioned too high within a story. Moreover, in order to minimize the type of rebar lengths and reduce the likelihood of installation errors, splicing points are often arranged in two staggered patterns (e.g., high and low rebars of the column in each story). Based on these requirements, this section proposes a Markov-based optimization method for rebar splicing points, which accounts for construction constraints.
For a rebar requiring splice locations, the process of successively connecting rebars of different lengths to achieve the target rebar length can be formulated as a Markov decision process (MDP). In this process, the next splicing point is determined by selecting an appropriate rebar length at each step, based on the current splice location. To implement this procedure, the initial lengths of two rebars la,1 and lb,1 are specified. The corresponding initial splice positions are denoted as Aa,1 and Ab,1. For these initial splice positions, the constraint can be written as:
1 = A LB , 1 A a , 1 A UB , 1 A LB , 1 A b , 1 A UB , 1 A a , 1 A b , 1 = l a , 1 l b , 1 = d t
where ALB,1 and AUB,1 are the lower and upper bounds of the permissible splice zone, and dt is the required length difference between two initial rebars.
The state transition of the first splice can then be expressed as:
S 1 = l a , 1 , l b , 1 S 2 = l a , 2 , l b , 2
where S1 and S2 denote the first and second connection states; la,2, and lb,2 are the lengths of the rebars after the second splice.
The corresponding action a1,2 for the first splice is:
a 1 , 2 = Δ l a , 1 , Δ l b , 1
where Δla,1 = la,2la,1 and Δlb,1 = lb,2lb,1 denote the incremental lengths of the two categories of reinforcement bars, respectively, and {l1, …, ln1} represents the set of n available discrete rebar lengths.
For the t times splice, the state transition and the action can be written as:
S t = l a , t , l b , t S t + 1 = l a , t + 1 , l b , t + 1
a t , t + 1 = Δ l a , t , Δ l b , t + 1
with the following constraint:
t = A LB , t A a , t A UB , t A LB , t A b , t A UB , t A a , t A b , t = l a , t l b , t = d t
where subscript t represents the t times splice.
According to relevant standards [17], parameters such as rebar diameter and material affect the height of the permissible splicing zone. Therefore, in the state transition process, the presence of t implies that the rebar parameters may influence the final splicing outcome.
The optimization objective of the MDP is to determine the optimal splice path:
max   E R S t , a t , t + 1 , S t + 1
R S t + 1 , S t , a t , t + 1 = 0 , S t + 1 t + 1 λ , S t + 1 t + 1
where E(·) is the expectation operator, R(St, at, t+1, St+1) is the reward function of the state transition, and λ is a relatively large penalty value, such as 106.
Since it is not permissible for a connection point to be located in a non-splicing zone at any step of the state transition, we impose a large negative penalty whenever an infeasible solution arises during the state transition. This ensures that infeasible paths are excluded, thereby guaranteeing that the MDP can obtain a feasible solution as long as one exists. Because the MDP performs a complete traversal of all possible states, it can terminate once the traversal is complete, without requiring numerical tolerances. In this context, the convergence criterion of the MDP is defined as the completion of traversing all possible states: if the final state can be reached from the initial state, a feasible splicing path exists; otherwise, under the given constraints, no feasible splicing path exists.
According to Equations (7) and (8), the feasible splice set can be expressed as:
A p = A a , 1 p , A b , 1 p , , A a , i p , A b , i p , , A b , r p , A b , r p
where A(p)a,i and A(p)b,i are the splice positions of the two types of bars at the i times connection, and r is the number of connections required to reach the target rebar length.
Since the Markov process determines the next state transition based on the current state, the optimal state transition path obtained during the optimization process is not necessarily unique. The corresponding rebar connection schemes may therefore be multiple, and all the resulting sets of cutting points can be expressed as:
S = A 1 , , A p , , A s
where S denotes the set of all splicing points, and s represents the number of splicing point sets obtained from the optimization.
By applying Equations (1)–(10), splicing points within permissible splice zones can be determined for a long rebar. To minimize waste and simplify construction, the available rebar lengths in Equation (3) are typically restricted to divisors of common raw rebar lengths (e.g., 9 m and 12 m), yielding the candidate set {2, 3, 4, 4.5, 6, 9, 12} m. This ensures that no intermediate waste is produced during state transitions.
Although intermediate waste is avoided, waste may still occur at the initial and terminal rebars, as their lengths are often not divisible by the raw rebar length. The terminal lengths can be calculated as:
l a , e n d = L l a , 1 i = 1 r Δ l a , i
l b , e n d = L l b , 1 i = 1 r Δ l b , i
where la,end and lb,end are the terminal lengths of the two types of bars, and L is the total length of the rebar.
Here, the rationale of the MDP method can be further explained using the theory of dynamic programming. If a feasible path from the initial state to the final state is denoted as F(end) = 1, then the Bellman equation on the directed acyclic graph (DAG) can be expressed as:
F S = max S ' s u c c F S F S '
where succF(S) denotes the feasible successor set of state S.
The recursive formulation in Equation (13) compares all feasible successors. Therefore, once the final state is reachable, the recursive process can return a feasible splicing sequence, which corresponds to an optimal solution.
In the DAG, let n denote the number of candidate splicing lengths at each step and r the maximum number of splices. Each state therefore has at most n feasible outputs. Accordingly, the MDP algorithm can identify the optimal solution by traversing all feasible edges with a time complexity of O(nr). In contrast, the greedy algorithm makes its next decision solely based on current information, without considering alternative feasible edges, and thus may fail to find a feasible path. The feasibility of results obtained by heuristic optimization algorithms, on the other hand, depends on randomness and algorithm parameters. Their time complexity is O(P·G·eval), where P is the population size, G is the number of iterations, and eval is the evaluation time of a single individual. This shows that the complexity of heuristic optimization algorithms is significantly higher than that of the MDP algorithm. In summary, when dealing with splicing-point problems, the MDP algorithm offers a dual advantage of computational efficiency and reliably obtaining the optimal solution.
According to Equations (11) and (12), due to the influence of the total length of rebars and their initial lengths, the length of the end bars generally cannot be exactly divided by the raw rebar length. Therefore, for both the initial and end rebars, it is necessary to apply the combinatorial optimization method introduced later to reduce material waste. By means of the algorithm presented in this section, the rational cutting-point positions within a given region can be rapidly determined. To ensure consistency of cutting points, other shorter rebars, such as anchorage rebars, must also be calculated based on the established cutting-point positions. Since the lengths of these bars likewise cannot be exactly divided by the raw rebar length, they also need to be incorporated into the subsequent combinatorial optimization process for rebar cutting, which is particularly common in the optimization of longitudinal rebar cutting for columns.
The MDP model can be summarized as follows: the objective is to maximize the expected value of the splicing scheme using the MDP algorithm, thereby obtaining a feasible splicing path. The expected value can be written as max ER(St, at,t+1, St+1)]. The model must satisfy the constraint set , which includes the requirements that splicing points must lie within the interval [ALB,t, AUB,t], and that the spacing between adjacent splicing points must be greater than dt. The parameter table of MDP model is shown in Table 1.

2.2. Hybrid Optimization Method for Rebar Cutting

Section 2.1 primarily addressed the determination of splice locations for long rebars requiring intermediate joints. Once the splice positions of longitudinal rebars in columns are determined, the corresponding anchorage rebar lengths can also be defined. The similar procedure can also be applied to beam. In addition to rebars whose lengths can be exactly divided from raw rebar stock, a significant number of rebars within a region have lengths that are not divisible by standard raw rebar lengths. For these rebars, a combined cutting optimization is required. Since the rebars within a region often vary widely in both length and quantity, it is necessary to develop an efficient optimization method that can handle large-scale rebar cutting problems with diverse requirements.
For a designated region, the cutting length of each rebar can be determined from detailing results. The total length Ldi and quantity Ndi of rebars with diameter di can be expressed as:
L d i = l 1 , , l i , , l n
N d i = N 1 , , N i , , N n
where li is the length of the ith type of rebar, Ni is the corresponding quantity, and n is the total number of rebar types in the region.
In practice, the number Ndi and the set of lengths Ldi can be very large. Direct application of intelligent optimization algorithms often results in either local optima or prohibitively low computational efficiency. Moreover, some rebars are relatively easy to optimize and can achieve satisfactory solutions through simple combinations. This section therefore proposes a two-stage rebar cutting optimization method. In the first stage, a greedy algorithm is used to provide cutting schemes for rebars that are easy to optimize. In the second stage, a genetic algorithm is employed for the remaining rebars where greedy optimization cannot provide satisfactory results. Although this approach may lead to suboptimal convergence in the first stage, thereby limiting the ability of the second stage to achieve a global optimum, it is a practical and feasible compromise in engineering applications involving thousands or tens of thousands of rebars, especially under dynamic on-site conditions where rebars may be added or removed.
For the rebar set described by Equations (14) and (15), the rebars are sorted in descending order of length to yield a new ordered set Ldi:
L d i ' = sort L d i
where sort(·) denotes descending order.
Based on Equation (16), the corresponding quantities Ndi can also be obtained. For the sorted set, rebars are combined, and the difference between the combined length and the raw rebar lengths is calculated as the waste length. A set of raw rebar lengths B is constructed as B = [9, 12, 18, 21, 24, 27, 30, 33, 36…], where values greater than 12 m represent spliced assemblies of two or more raw rebars. This allows the reuse of leftover rebars via mechanical couplers, ensuring minimal waste during the cutting process. In the process of reusing leftover materials, a constraint is imposed such that the remaining length must be greater than the minimum usable length, thereby ensuring that the reused segments are not too short to become waste rebar.
For each rebar li, it is assigned to a raw rebar whose remaining length can accommodate it, with the objective of minimizing leftover waste:
R j = min B j i = 1 k l i
where Rj is the waste length for the jth raw rebar with length Bj, and k is the number of rebars cut from the raw rebar.
If no existing raw rebar has sufficient remaining length to accommodate li, a new raw rebar is selected, and Equation (17) is recalculated. This process is repeated until all rebars are allocated.
After the first-stage optimization, most of the rebars already meet the requirement of minimizing cutting waste. In practice, more than 90% of the raw rebars typically achieve a cutting waste less than the predefined threshold t, and the corresponding rebar arrangement schemes are denoted as S(1)best. However, for the remaining rebars, when the sequential arrangement method described in Equations (14)–(17) is applied to solve the waste minimization problem of raw rebars, the results are often unsatisfactory. In this case, more complex combinatorial strategies should be considered, and heuristic optimization algorithms are employed to search for the global optimal solution of rebar arrangement. For each raw rebar, a threshold t is defined; when Rj > t, the k rebars obtained from cutting this raw rebar are extracted and placed into a new dataset of rebar lengths and quantities.
L d i R = l 1 R , , l i R , , l n R
N d i R = N 1 R , , N i R , , N n R
where superscript (R) represents the steel bars with a remaining length greater than the threshold after the first stage optimization.
For the new dataset shown in Equations (18) and (19), an initial population of raw rebars is randomly generated, and the rebars are randomly assigned:
C init = B 1 , , B j , , B n
where Cinit denotes the initial raw rebar set, Bj is the length of the jth raw rebar, and n is the number of rebars.
The fitness function for optimization can be expressed as:
f S 2 = j = 1 n R j + α
where S(2) denotes the cutting scheme in the second stage, Rj is defined by Equation (17), and α is a penalty term. The penalty term α is set to a large positive value if any Rj < 0, and α = 0 otherwise.
For the fitness function given in Equation (21), the arrangement schemes of the required rebars within the raw rebars can be optimized using a heuristic optimization algorithm. When f(S(2)) reaches its minimum, the optimal arrangement scheme S(2)best is obtained. Finally, the overall optimal rebar arrangement scheme is expressed as Sbest = [S(1)best, S(2)best]. By comparing Equations (17) and (21), it can be observed that Equation (17) only considers the minimum waste of the current raw rebar, whereas Equation (21) accounts for the minimum waste of all rebars to be optimized. Therefore, the optimization performance in the second stage is superior to that in the first stage. However, the heuristic optimization algorithm in the second stage requires a large number of iterative computations, with a computational cost much higher than that of the first stage. As a result, the number of rebars to be optimized in the second stage should not be excessively large.
The cutting optimization model can be summarized as follows: in the first stage, a greedy algorithm is employed to obtain the minimum waste length for each raw rebar R j = min B j i = 1 k l i , resulting in an arrangement scheme denoted as S(1)best. In the second stage, a heuristic optimization algorithm is applied to further minimize the waste length f S 2 = j = 1 n R j + α , yielding an arrangement scheme denoted as S(2)best. The final optimized rebar arrangement scheme is thus expressed as Sbest = [S(1)best, S(2)best]. The parameter table of cutting optimization model is shown in Table 2.

2.3. Framework of the Rebar Cutting Optimization Method

Section 2.1 and Section 2.2 introduced the optimization method for splice locations and the hybrid optimization method for rebar cutting, respectively. By integrating these two approaches, a general workflow for rebar cutting optimization is proposed. The workflow combines the determination of feasible splice points with the hybrid cutting strategy, thereby achieving both compliance with construction constraints and minimization of material waste.
The overall procedure of the rebar cutting optimization method is shown in Figure 1. All symbols appearing in the figure are consistent with those previously defined in the formulas of Section 2.1 and Section 2.2.

3. Numerical Example: Performance Analysis of the Algorithm

Before applying the proposed cutting optimization method to engineering practice, it is necessary to verify its effectiveness through numerical examples. In this section, a stochastic numerical example is constructed, and the proposed algorithm is compared against traditional optimization methods commonly used in rebar cutting optimization. Two datasets are generated to simulate the length distributions of rebars on site. The first dataset follows a normal distribution, designed to test algorithm performance when rebar lengths are concentrated within a specific interval, which is typical in rebar cutting optimization for a localized region. The second dataset follows a uniform distribution, designed to test algorithm performance under irregular length distributions, as is common in rebar fabrication plants where multiple projects are processed and optimized simultaneously. The proposed algorithm is tested on both datasets, and the sequential arrangement algorithm and the intelligent-only optimization algorithm are also evaluated for comparison.
The datasets are defined as follows: the first dataset (denoted as D1) follows a normal distribution with mean μ = 6.0 and standard deviation σ = 2.0. The second dataset (denoted as D2) follows a uniform distribution within the interval [0, 12]. For both D1 and D2, five dataset sizes are set to 200, 400, 600, 800, and 1000 rebars. For these 10 different datasets, three optimization methods are applied. The sequential arrangement method described in Equations (14)–(17) is denoted as M1, the intelligent optimization method described in Equation (21) is denoted as M2, and the hybrid optimization method combining Equations (14)–(21) is denoted as M3. Raw rebars with length 9 m and 12 m are considered. When the remaining length after cutting is less than 0.2 m, it is classified as scrap rebar and is not allowed to be reused.
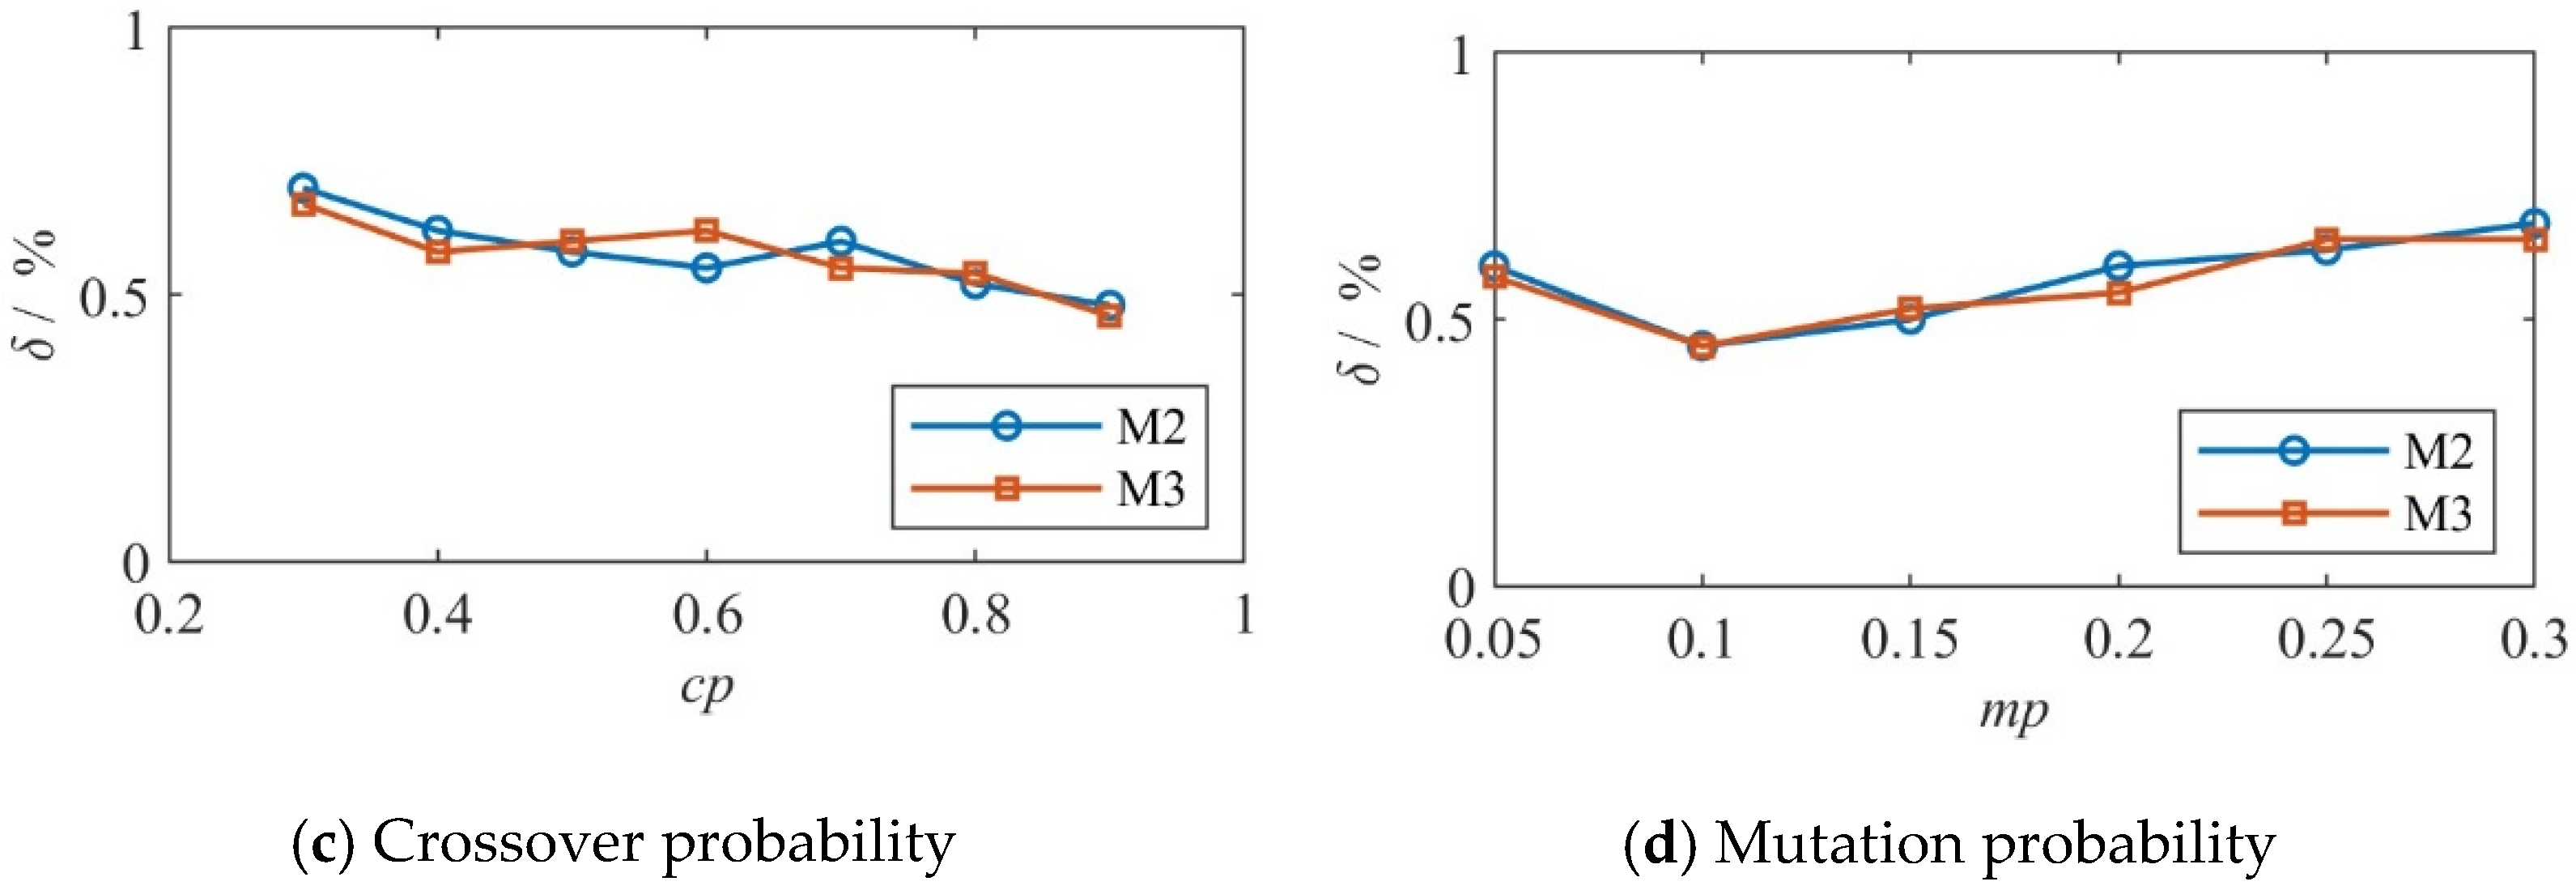
In this example, both M2 and M3 adopt a genetic algorithm (GA) as the intelligent optimization method. Before conducting the comparative analysis of algorithm performance, a sensitivity analysis of the genetic algorithm parameters is first required. In this study, four key parameters are selected as the objects of investigation: population size, maximum number of iterations, crossover probability, and mutation probability. The specific parameter ranges are set as follows: population size [20, 30, 40, 50, 60, 70, 80], maximum number of iterations [20, 30, 40, 50, 60, 70, 80], crossover probability [0.3, 0.4, 0.5, 0.6, 0.7, 0.8, 0.9]; and mutation probability [0.05, 0.1, 0.15, 0.2, 0.25, 0.3]. The baseline parameter values are set as follow: population size of 50, maximum number of iterations of 50, crossover probability of 0.9, and mutation probability of 0.1. During the analysis, when one parameter is treated as a variable, the remaining parameters are fixed at their baseline values. After optimization, the waste ratio and computation time are recorded for each case.
The results shown in Figure 2 represent the average waste rate obtained from 10 independent runs under identical conditions for each parameter set, ensuring both stability and representativeness of the outcomes. In Figure 2, p, it, cp, and mp represent population size, maximum number of iterations, crossover probability and mutation probability, respectively. The observed variation trends are as follows: when the population size is less than 50, the waste rate increases as the population size decreases. This indicates that a smaller population size leads to insufficient solution diversity, causing the algorithm to easily fall into local optima and resulting in higher waste rates. When the number of iterations is less than 50, the waste rate also increases with fewer iterations, implying that insufficient iterations prevent the algorithm from fully converging and achieving better solutions. When the crossover probability is less than 0.9, the waste rate rises as the crossover probability decreases. This shows that inadequate crossover operations weaken the global search ability, reducing solution quality. When the mutation probability is less than 0.1, the waste rate increases as the mutation probability decreases; however, when the mutation probability exceeds 0.2, the waste rate again increases with higher mutation probability. This demonstrates that moderate mutation helps maintain population diversity and prevents premature convergence, whereas an excessively high mutation probability makes the search overly stochastic, thereby reducing optimization performance. Hence, taking both accuracy and efficiency into account, the final parameter values adopted in this study for numerical analysis and engineering case studies are set as follows: population size of 50, maximum number of iterations of 50, crossover probability of 0.9, and mutation probability of 0.1.
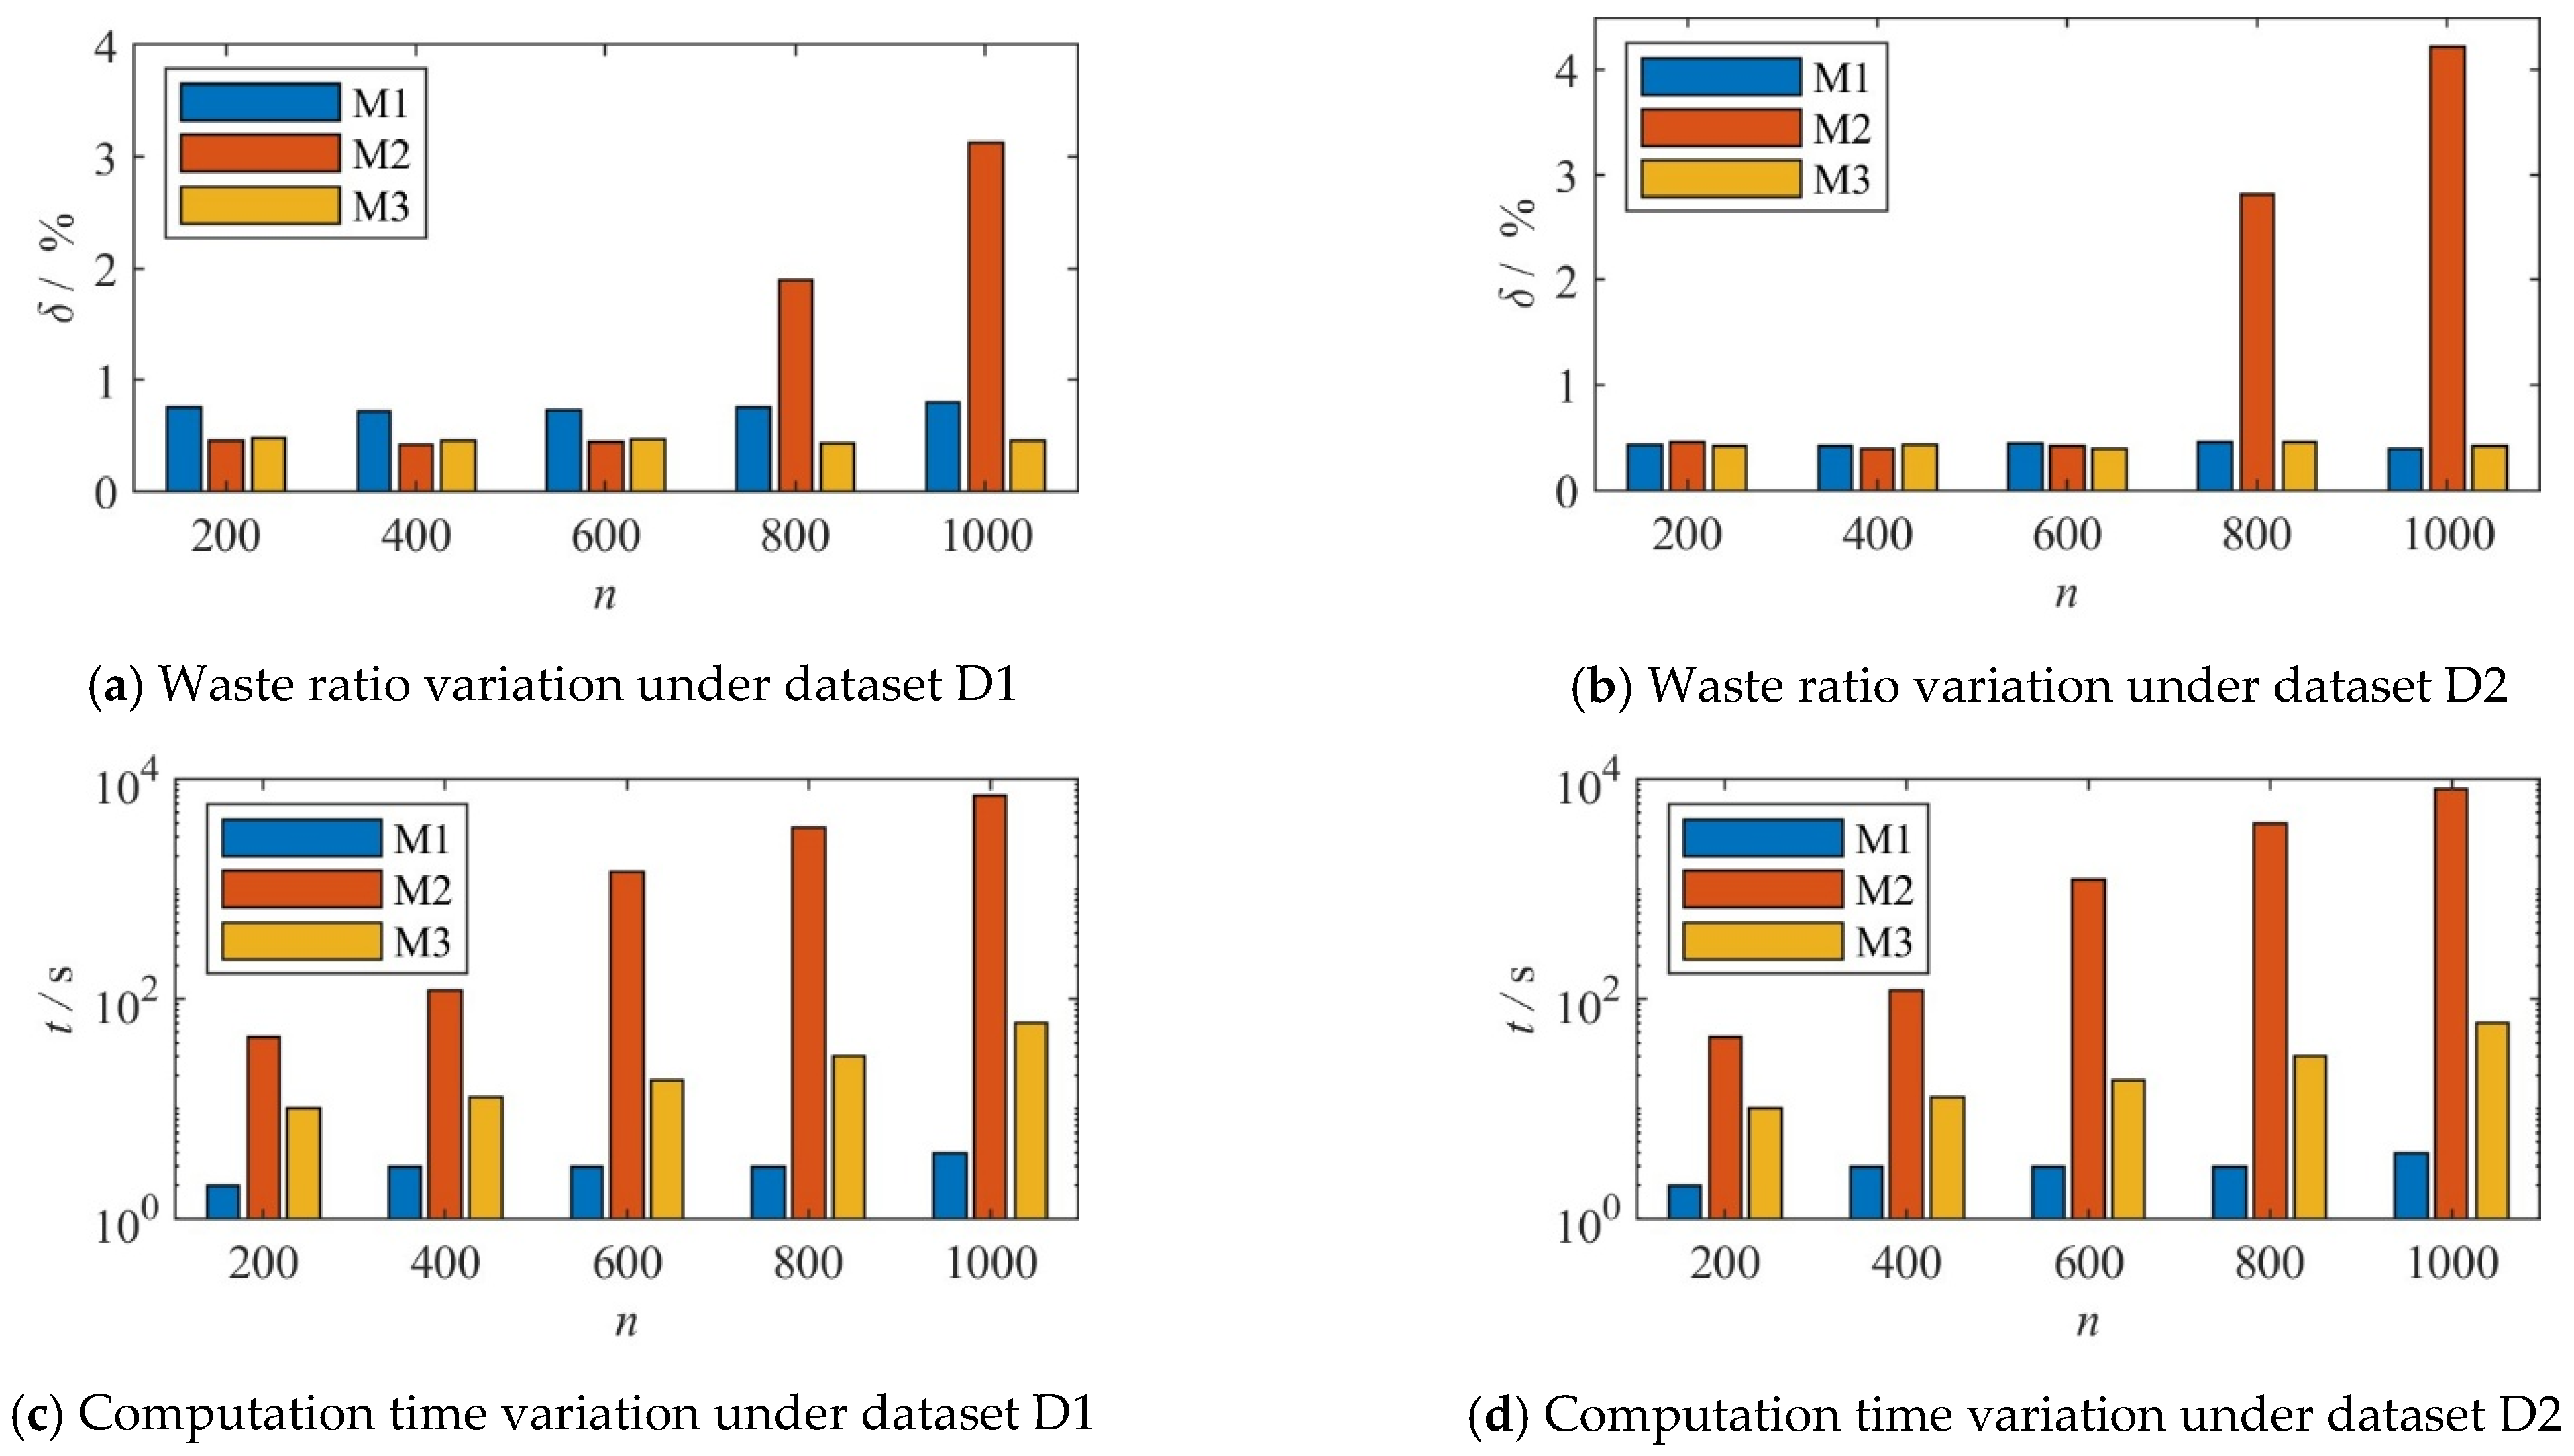
Cutting results obtained by M1, M2, and M3 shows that none of them reused scrap rebars, indicating that all three methods satisfy the constraint of prohibiting the reuse of residual rebars. This is because a large penalty factor is assigned to the reuse of scrap rebars in the algorithm design, effectively eliminating any solutions that violate this constraint. Therefore, the optimization results of M1, M2, and M3 all meet the construction and specification constraints, and their computational efficiency can be further compared. The variations of waste ratio under different datasets and optimization methods are shown in Figure 3a,b, while the corresponding computation times are shown in Figure 3c,d. In Figure 3, δ denotes the waste ratio, n is the number of rebars in the dataset, and t represents the computation time. For dataset D1, when the dataset size is below 600, the waste ratios of M1–M3 remain relatively stable. The waste ratio of M1 is significantly larger than those of M2 and M3, while M2 performs slightly better than M3. As the dataset size increases, the waste ratio of M2 rises sharply, whereas those of M1 and M3 remain nearly unchanged. For dataset D2, when the dataset size is below 600, the waste ratios of M1–M3 are similar and stable. When the dataset size exceeds 600, the waste ratio of M2 increases sharply, while those of M1 and M3 remain nearly unchanged. For computation time in Figure 3c,d, M1 exhibits the fastest performance. The computation time of M3 increases moderately with dataset size, whereas M2 shows a dramatic increase. Once the dataset size exceeds 400, the runtime of M2 grows to the order of hours.
The numerical results indicate that when dataset size is large, M2 fails to reliably obtain optimal solutions and requires prohibitively long computation times. Consequently, it cannot respond efficiently to changes in cutting demands, making it unsuitable for large-scale rebar cutting problems in practice. The M1 method exhibits clear limitations. The M1 performs relatively well under uniform distributions but poorly when rebar lengths follow concentrated distributions, thereby restricting its applicability. By contrast, the proposed hybrid method M3 successfully mitigates the efficiency decline of M2 under large-scale datasets, while consistently maintaining a low waste ratio across different length distributions. Therefore, in subsequent engineering practice, M3 is adopted as the preferred optimization method.

4. Engineering Example 1: Cutting Optimization of Column Reinforcement

In this section, the longitudinal reinforcement of cast-in-place columns in an industrial plant is selected as a case study for cutting optimization. The procedure involves three main steps. First, the splice positions of longitudinal rebars are determined using the optimization method described in Section 2.1. Second, based on the splice positions and reinforcement drawings, the lengths and quantities of rebars to be cut at each story are calculated. Finally, the hybrid optimization algorithm described in Section 2.1 is applied to determine the cutting scheme. By adjusting the splice positions of longitudinal rebars, the cutting scheme with the lowest waste ratio can be obtained.
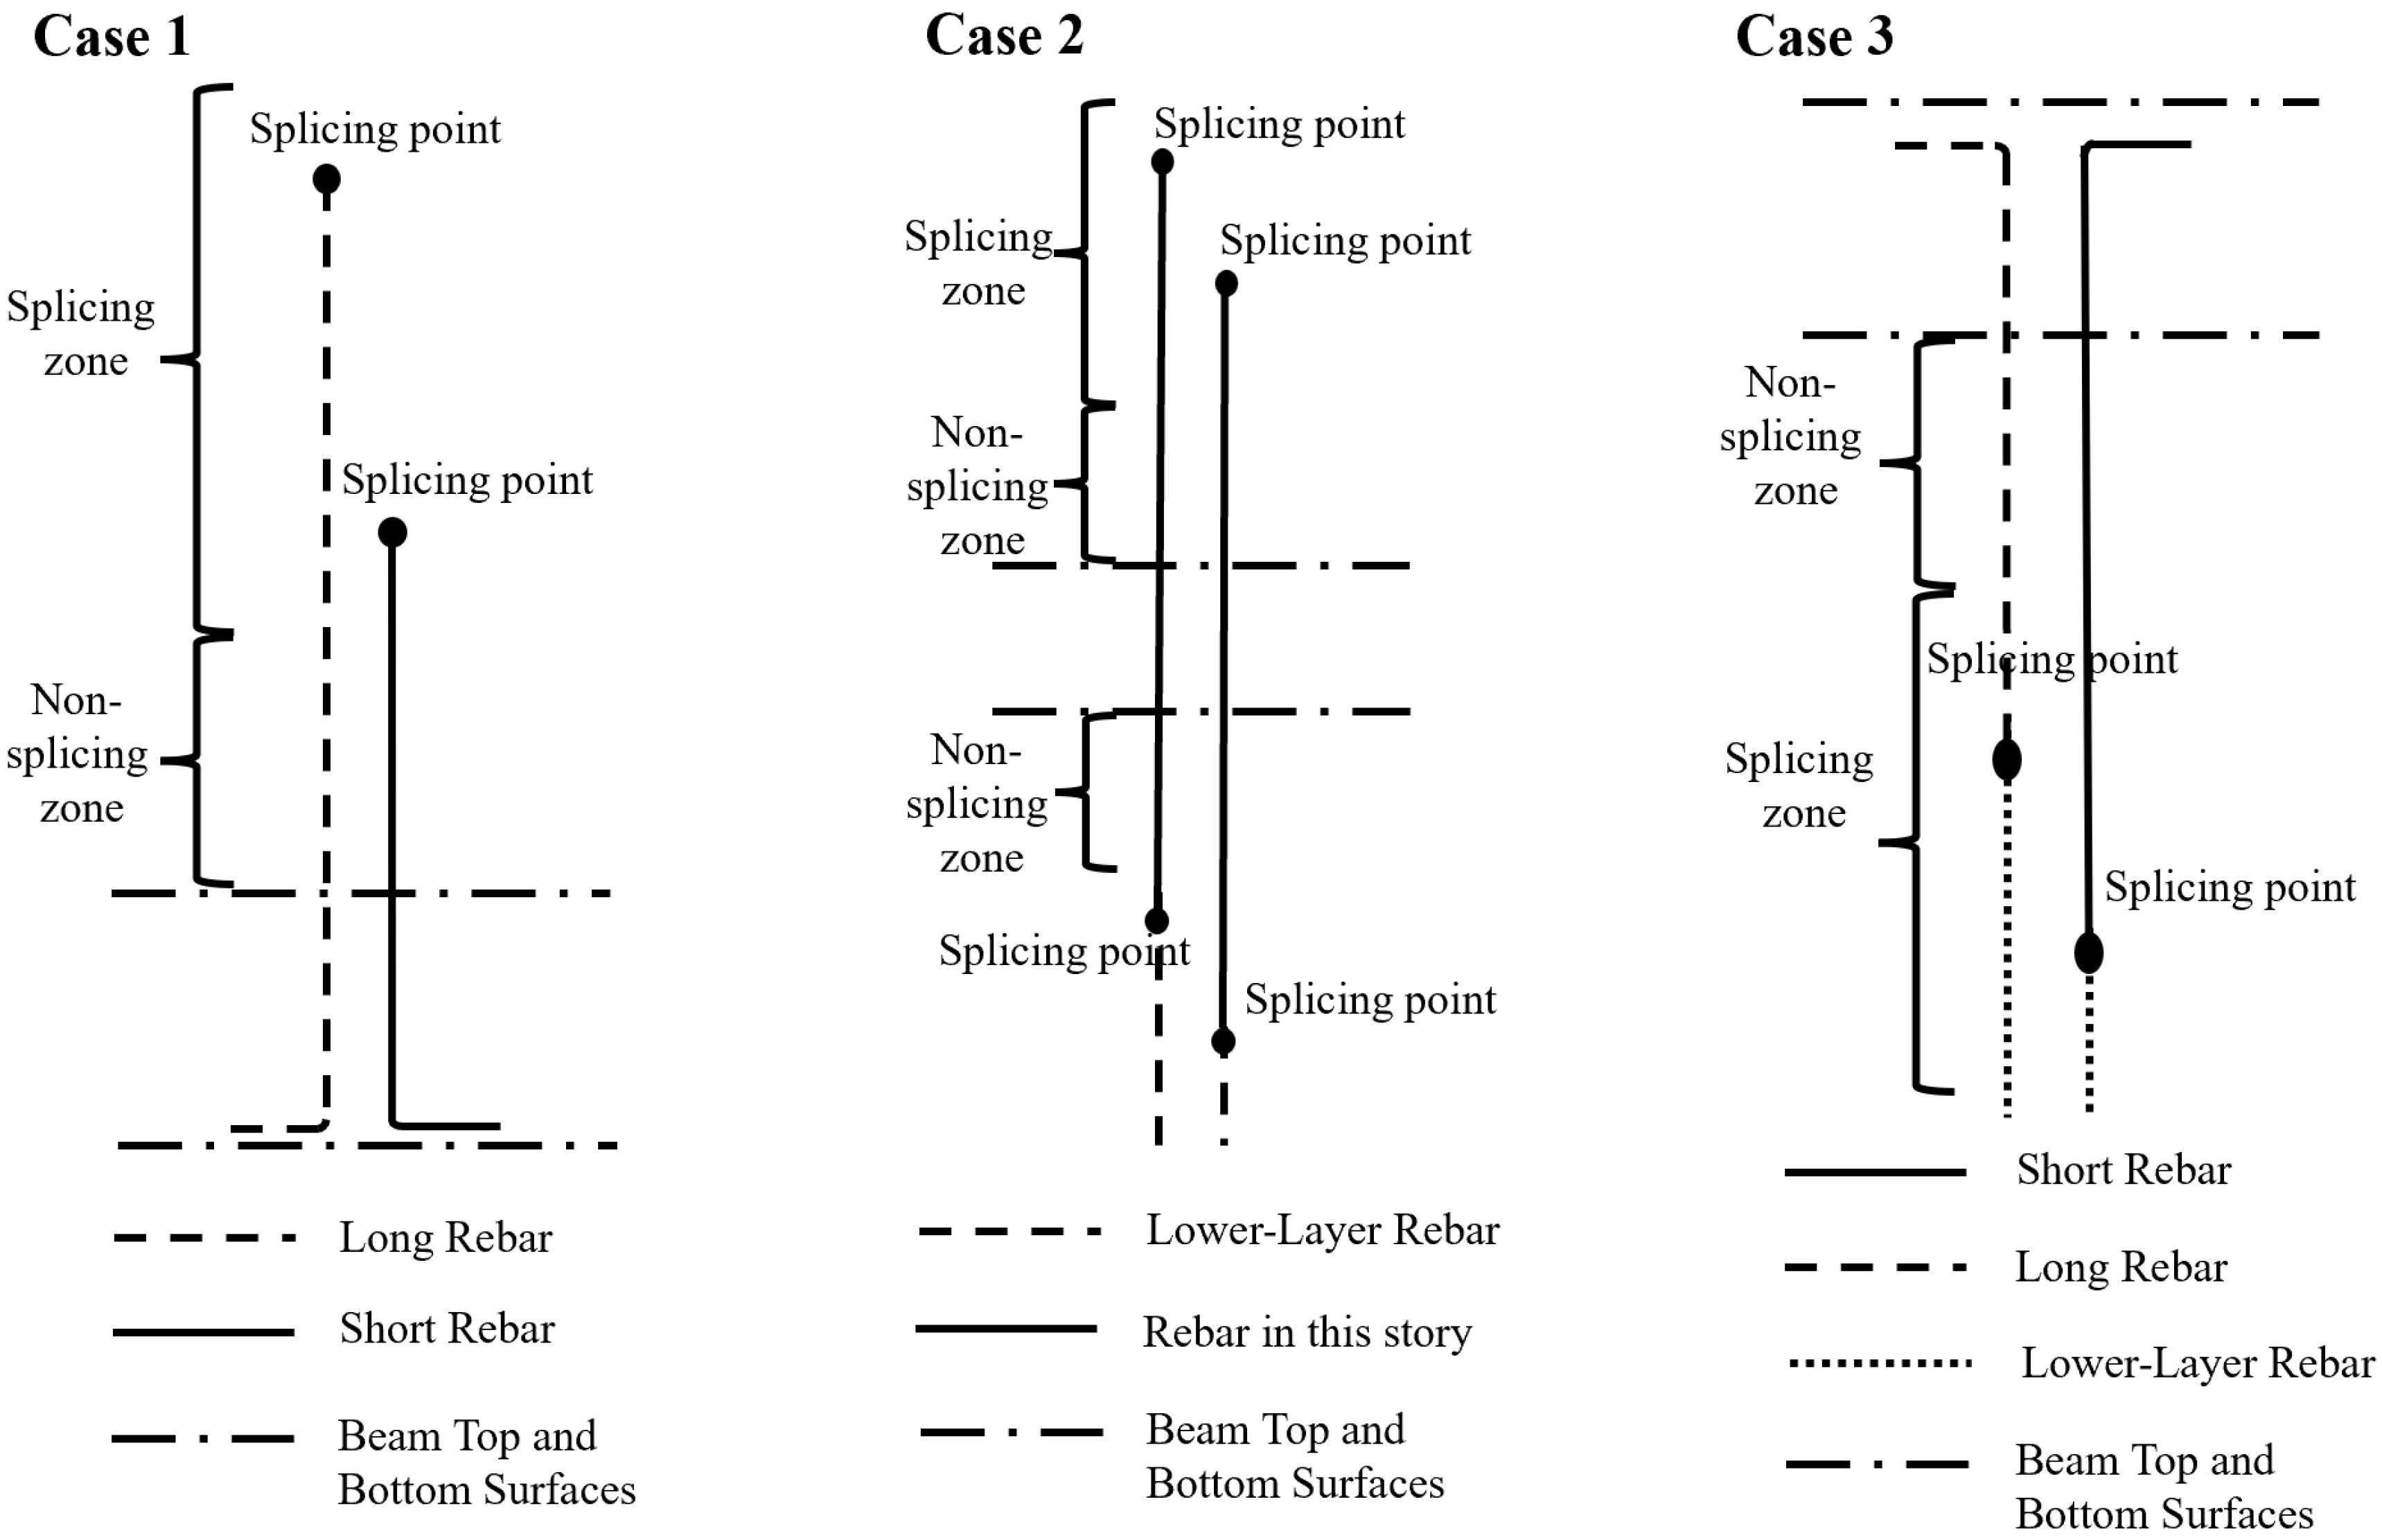
In the engineering case considered, no stiffened joints appear in the beam–column connections. For each story, the longitudinal rebars of the columns can only fall into three categories: (1) rebars anchored at the bottom of the story; (2) continuous rebars extending to the upper story; and (3) rebars anchored at the top of the story. From the ground story to the penultimate story, all three categories are present, whereas in the top story only categories (1) and (3) occur. A schematic illustration of the rebar connections is shown in Figure 4. As shown in Figure 5a, when the column dimension of the upper story (on the left side of the figure) differs from that of the current story (on the right side), the number of anchored rebars and continuous rebars is determined according to the reinforcement layout of the current and upper stories. Since the column in this case is neither an edge column nor a corner column, when the column dimension contracts, the upper rebars of the current story must be anchored at the top of this story (i.e., case (3)). Because all the top rebars of the current story are anchored, all the bottom rebars of the upper story must be treated as case 1. The numbers of anchored rebars can thus be calculated. As shown in Figure 5b, when the column dimensions of the upper and current stories are the same, the numbers of anchored rebars and continuous rebars can be determined by the difference in rebar counts between the two stories. Typically, the upper story has fewer rebars than the current story; in this case, the additional rebars of the current story must be anchored at the top of the story (i.e., case (3)), while the remaining rebars can be connected to the upper story using couplers (i.e., case (2)). If the rebar diameters differ, reducing couplers should be used. Conversely, if the upper story has more rebars than the current story, the excess rebars in the upper story should be treated as anchored at the bottom, corresponding to case 1.
Based on the above procedure for determining anchorage and continuous rebars, the quantities of bottom-anchored, top-anchored, and continuous rebars can be obtained for each story. Next, the lengths of each category of rebars are calculated according to the splice positions. For anchorage rebars, the total length depends not only on splice positions but also on the anchorage length within the concrete. According to the Code for Design of Concrete Structures (GB 50010-2010) [18], the basic anchorage length of tension rebars is given by:
l ab = α f y f t d
where lab is the basic anchorage length, fy is the design tensile strength of reinforcement, ft is the axial tensile strength of concrete, d is the diameter of the anchorage rebar, and α is the shape coefficient of the rebar (taken as 0.14 for ribbed longitudinal rebars in columns).
The actual anchorage length must account for modification factors:
l a = ζ a l ab
where la is the anchorage length, and ζa is the anchorage length modification factor. For column longitudinal rebars, ζa = 1.10 when diameter d > 25 mm, ζa = 0.8 when cover thickness is 3d, and ζa = 0.7 when cover thickness ≥ 5d, and linear interpolation is used for intermediate cases.
For seismic design, the anchorage length must further consider a seismic modification factor:
l aE = ζ aE l a
where laE is the seismic anchorage length and ζaE is the seismic anchorage modification factor.
According to the Code for Seismic Design of Buildings (GB 50011-2010) [19], the length of the stirrup-confinement region at column ends is taken as the maximum of the section depth, one-sixth of the clear column height, and 500 mm. Rebar splices are generally prohibited within the confinement region, which therefore defines the permissible splice zone. Table 3 presents the story heights of this structure and the corresponding permissible splice zones calculated from the code. Based on Equations (1)–(12), splice positions can then be determined. In practice, multiple feasible splice positions may exist within the permissible zone.
For the story heights and the corresponding splice zones shown in Table 3, the splice position constraints are established based on Equations (1) and (6). One feasible set of splice positions that satisfies these constraints is presented in Table 4. In Table 4, the splice position refers to the relative distance from the starting point, while the height difference from the story bottom refers to the vertical distance from the splice position to the bottom surface of the story. By comparing the permissible splice zones in Table 3 with the splice positions in Table 4, it can be confirmed that all splice positions lie within the allowable ranges, indicating that the scheme is valid. Since the story heights of this structure are relatively large, the splice scheme in Table 4 utilizes 9 m raw rebars. If such long rebars are inconvenient for practical construction, they may be cut at suitable locations and connected. In this case, the additional splice positions must also satisfy the splice constraints described earlier.
For column reinforcement, in order to ensure convenience and accuracy in construction, the splice positions of rebars in each story must remain consistent. Accordingly, the splice positions of anchorage rebars in each story must also match those given in Table 4, with high and low rebars arranged in a staggered manner. Based on the splice positions, the lengths of bottom-anchored and top-anchored rebars with different diameters can be calculated. For example, for seismic grade II, with C60 concrete strength in the first story and HRB400 rebars of 25 mm diameter, the anchorage length of bottom rebars is calculated to be 0.73 m. Thus, the total lengths of bottom-anchored rebars are 2.73 m or 1.73 m. For top-anchored rebars of the same type, the total lengths are 3.58 m or 4.58 m. Using this method, the lengths of all types of rebars in each story can be computed, and their quantities can be calculated. A dataset required for the rebar cutting optimization algorithm is then constructed according to Equations (12)–(14). For instance, in the first story, for HRB400 rebars with a diameter of 25 mm, the following rebars are obtained: 812 rebars of 2.73 m, 812 rebars of 1.73 m, 1203 rebars of 3.58 m, 1203 rebars of 4.58 m, and 782 rebars of 9.0 m. For the 782 rebars of 9.0 m, no optimization is required since they match the raw rebar length directly. Only their splice positions need to be considered on site. The remaining rebars are optimized using the proposed hybrid cutting method. The optimization results show that a total of 20,634 m of raw rebars are used, with 158.0 m of leftover, corresponding to a waste ratio of 0.77%. Table 5 summarizes the waste ratios of rebars in different stories. Since the anchorage lengths vary for rebars of different diameters, the waste ratios also differ by diameter. Furthermore, due to the variation in splice positions between stories, the waste ratios vary slightly across stories. As shown in Table 5, most waste ratios are around 0.6%, indicating that the proposed optimization method achieves stable control of waste ratio across different quantities and lengths, yielding consistently effective results.
Table 5 presents the optimized cutting scheme based on the splice positions given in Table 4. In practice, however, the splice scheme is not unique for a given initial height. By slightly adjusting the initial height, alternative splice positions can be obtained, which may lead to improved cutting results. Therefore, by enumerating all possible initial splice positions and their corresponding splice schemes, the waste ratios of different schemes can be calculated. This allows further optimization of the cutting strategy by selecting the scheme with the lowest waste ratio.

5. Engineering Example 2: Cutting Optimization of Beam Reinforcement

This section presents a case study of a standard precast bridge segmental beam. Compared with Engineering Example 1, this case has the following characteristics. Firstly, the reinforcement types of each category are explicitly given in the design drawings. Therefore, there is no need to determine splice positions; only the combination cutting optimization problem remains after preparing the detailing schedule. Secondly, some rebars are relatively long, and customized raw rebar lengths can be considered if necessary.
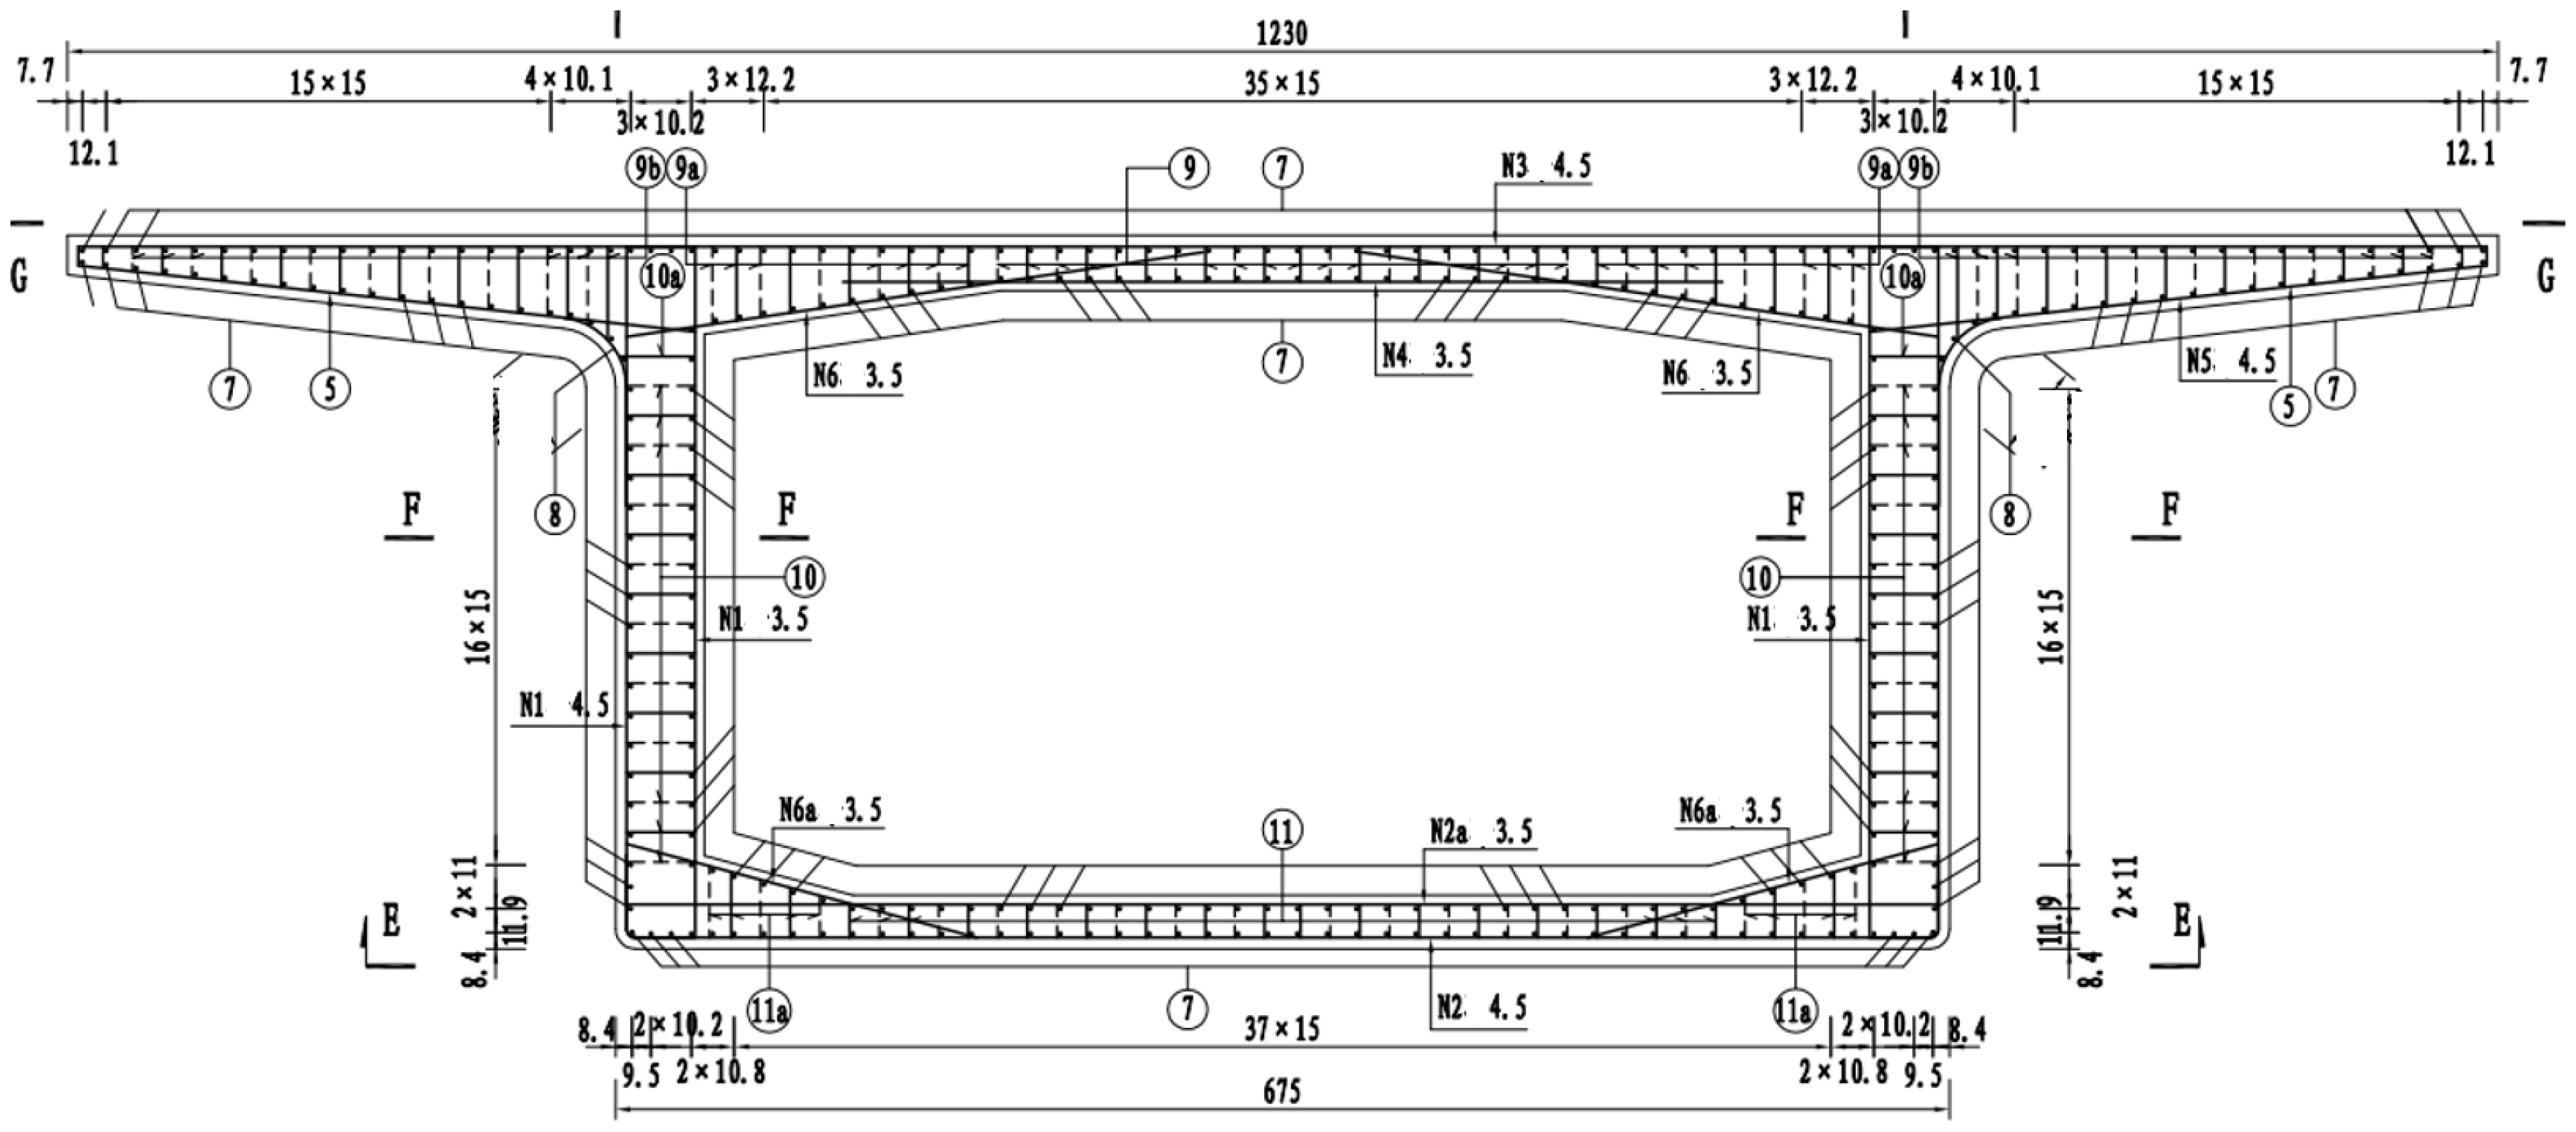
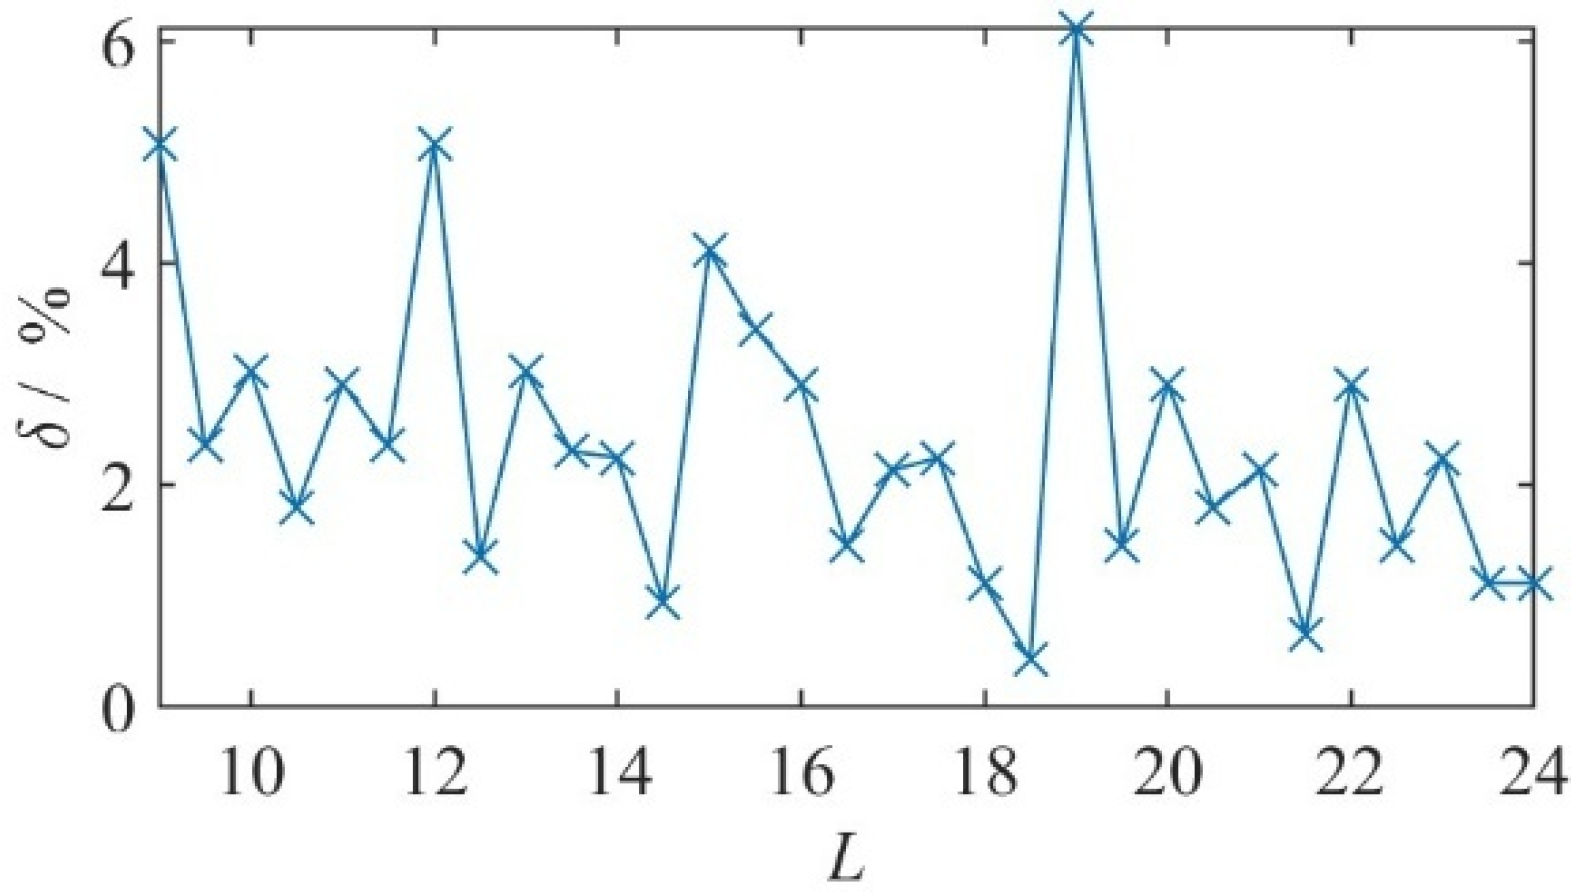
The segmental beam is shown in Figure 6. For this segmental beam, HRB400 rebars with diameters of 12 mm, 16 mm, and 20 mm were used. For rebars with diameters of 12 mm and 16 mm, coil rebars can be employed for cutting, in which case no cutting optimization problem arises. However, for 20 mm diameter rebars, raw rebars must be used, and thus a cutting optimization problem occurs. According to the rebar scheduling list, this standard segmental beam requires 40 rebars of 8.12 m, 40 rebars of 7.08 m, and 20 rebars of 12.32 m. Since some of the rebars to be cut exceed the standard raw rebar length, and because the on-site rebar processing plant has access to a waterway terminal with low transportation costs for overlength rebars, it is possible to reduce the waste ratio by using custom-sized raw rebars. Here, the candidate sizes of custom raw rebars are set as [9.5, 10.0, 10.5, 11.0, …, 24.0]. The same cutting optimization method as in Section 2.2 is applied to optimize the rebar cutting. According to on-site requirements, one custom raw rebar size must be selected. Therefore, different raw rebar sizes are considered sequentially, and based on each raw rebar size, a candidate dataset of raw rebars is constructed by incorporating leftover reuse between raw rebars. The waste ratios corresponding to different raw rebar sizes are shown in Figure 7, where the horizontal axis represents the length L of the custom rebars, and the vertical axis represents the waste ratio δ. In addition to the custom rebars, each cutting optimization also includes the traditional 9 m and 12 m raw rebars.
The results in Figure 7 show that adopting different customized rebar lengths significantly affects the final waste ratio. When only conventional raw rebars (9 m or 12 m) are used, i.e., without customization, the waste ratio reaches as high as 5.1%. Given the large number of identical standard segmental beams in this project, such a waste ratio would be economically unacceptable. By contrast, when customized rebars are introduced, the waste ratio is markedly reduced. In particular, when 18.5 m customized rebars are combined with 9 m and 12 m rebars, the waste ratio decreases dramatically to 0.4%. Considering that the price of customized rebars is approximately 25 RMB per ton higher than that of standard rebars, the proposed scheme still provides significant material savings and improved economic performance due to the large quantity of identical segmental beams used in this project.
Engineering example 1 and 2 validate the proposed method through beam and column examples, respectively. It should be noted that in slabs and walls, since the rebar diameter is generally less than 16 mm, coiled rebars are commonly cut on demand, generating almost no waste. However, when larger diameter rebars are used in slabs or walls and must be cut from raw materials to meet the required lengths, the proposed method can likewise be applied. Therefore, the method is generalized and can be extended to various raw rebar cutting scenarios.

6. Conclusions

This paper focuses specifically on the optimization of cutting points and cutting schemes for column and beam rebars in structural reinforcement. The study does not address broader aspects of reinforcement optimization such as material types, alloy classes, or placement arrangements; rather, it confines itself to the cutting and splicing problem under design code requirements and construction constraints. The method comprehensively considers design codes and construction constraints, employs a Markov state-transition model to optimize cutting-point locations, and develops a hybrid cutting optimization strategy combining local sequential arrangement and global combinatorial arrangement to efficiently solve complex rebar cutting problems. The applicability and effectiveness of the proposed algorithm are verified through numerical examples and two engineering case studies. The main conclusions are as follows:
  • A Markov-based cutting-point determination method for long rebars is proposed. The splicing process of long rebars during construction is modeled as a state-transition path, and the optimal cutting-point path is determined by a state-transition optimization function under the constraint of code-specified splice zones.
  • For large-scale combinations of rebars with varying lengths, a hybrid cutting optimization method is developed, integrating local sequential arrangement with global combinatorial arrangement. In the first stage, the local sequential method rapidly identifies rebars suitable for efficient combinations. In the second stage, the remaining rebars that are difficult to optimize are further processed using global combinatorial arrangement, thereby improving the overall solution quality while maintaining computational efficiency.
  • Numerical examples demonstrate that the proposed hybrid optimization algorithm exhibits excellent capability in controlling waste ratios under various length distributions and large-scale datasets, while significantly outperforming the pure global combinatorial arrangement method in terms of optimization time.
  • Engineering Case 1 shows that the proposed method can reduce the waste ratio of longitudinal column rebar cutting to below 1% at each story, achieving rapid and precise optimization of thousands of rebars. Engineering Case 2 further demonstrates that the algorithm can flexibly integrate custom raw rebar lengths to adjust cutting schemes, achieving significant material savings in the standard segment of a precast bridge.
In summary, the study demonstrates that focusing on cutting and splicing optimization for column and beam rebars can yield engineering benefits, including reduced material waste and improved computational efficiency. Furthermore, considering practical construction demands where rebar quantities dynamically vary due to transportation schedules, on-site losses, and design changes, future work will focus on extending the algorithm to handle real-time cutting optimization under dynamic rebar availability, thereby establishing a rapidly responsive optimization framework for intelligent rebar processing in complex construction environments.

Author Contributions

Conceptualization, J.Z. and F.L.; Methodology, J.Z. and F.L.; Data curation, J.Z.; Writing—original draft: J.Z.; Visualization: J.Z. and X.C; Software: X.C.; Validation: X.C. and F.L.; Investigation: X.C. and F.L.; Resources: X.C.; Writing—review & editing: X.C.; Project administration: X.C. All authors have read and agreed to the published version of the manuscript.

Funding

The research was funded by the National Key Research and Development Program of China under Grant No. 2023YFC3806100. All the authors have no conflicts of interest in this research.

Data Availability Statement

The data presented in this study are available on request from the corresponding author.

Acknowledgments

The authors gratefully acknowledge the Shanghai Construction Group Co., Ltd. for providing engineering project data.

Conflicts of Interest

Authors Jindong Zhang, Xiaoming Chen and Fanghong Lv were employed by the company Shanghai Construction Group Co., Ltd., Shanghai 201114, China. The authors declare that the research was conducted in the absence of any commercial or financial relationships that could be construed as a potential conflict of interest.

References

  1. Wang, Z.; Jia, L.; Lv, J.; Huang, J. Minimization of rebar cutting waste using BIM and cutting pattern-oriented multiobjective optimization. J. Constr. Eng. Manag. 2024, 150, 15104. [Google Scholar] [CrossRef]
  2. Widjaja, D.D.; Rachmawati, T.S.N.; Kim, S. A BIM-based intelligent approach to rebar layout optimization for reinforced concrete columns. J. Build. Eng. 2025, 99, 111604. [Google Scholar] [CrossRef]
  3. Ren, K.; Jia, L.; Huang, J.; Wu, M. Research on cutting stock optimization of rebar engineering based on building information modeling and an improved particle swarm optimization algorithm. Dev. Built Environ. 2023, 13, 100121. [Google Scholar] [CrossRef]
  4. Rozvany, G.I.N. A critical review of established methods of structural topology optimization. Struct. Multidiscip. Optim. 2009, 37, 217–237. [Google Scholar] [CrossRef]
  5. Rajeev, S.; Krishnamoorthy, C.S. Discrete optimization of structures using genetic algorithms. J. Struct. Eng. ASCE 1992, 118, 1233–1250. [Google Scholar] [CrossRef]
  6. Camp, C.V.; Pezeshk, S.; Hansson, H. Flexural design of reinforced concrete frames using a genetic algorithm. J. Struct. Eng. ASCE 2003, 129, 105–115. [Google Scholar] [CrossRef]
  7. Doğan, E.; Saka, M.P. Optimum design of unbraced steel frames to LRFD-AISC using particle swarm optimization. Adv. Eng. Softw. 2012, 46, 27–34. [Google Scholar] [CrossRef]
  8. Chen, A.; Trivedi, K.S. Optimization for condition-based maintenance: A semi-Markov decision process approach. Reliab. Eng. Syst. Saf. 2005, 90, 25–29. [Google Scholar] [CrossRef]
  9. Guo, C.; Ramadan, H.; Hovakimyan, N. A predictive Markov decision process for optimizing condition-based maintenance policies. Reliab. Eng. Syst. Saf. 2022, 226, 108683. [Google Scholar] [CrossRef]
  10. Wang, Y.; Xu, T.; Liu, Z.; Li, G.; Jiang, J. Seismic behavior of steel-reinforced concrete cross-shaped columns after exposure to high temperatures. Eng. Struct. 2021, 230, 111723. [Google Scholar] [CrossRef]
  11. Pan, R.; Liao, P.; Zou, J.; Zhou, X.; Li, C. Experimental investigation on bond performance of helically ribbed GFRP rebar embedded in Ultra-high performance concrete. Constr. Build. Mater. 2022, 357, 129295. [Google Scholar] [CrossRef]
  12. Widjaja, D.D.; Kim, S. Reducing rebar cutting waste and rebar usage of beams: A two-stage optimization algorithm. Buildings 2023, 13, 2279. [Google Scholar] [CrossRef]
  13. Uzer, M.S. New hybrid approaches based on swarm-based metaheuristic algorithms and applications to optimization problems. Appl. Sci. 2025, 15, 1355. [Google Scholar] [CrossRef]
  14. Widjaja, D.D.; Kim, S. Intelligent rebar optimization framework for urban transit infrastructure: A case study of a diaphragm wall in a Singapore Mass Rapid Transit station. Smart Cities 2025, 8, 130. [Google Scholar] [CrossRef]
  15. Fu, X.; Ji, K.; Zhang, Y.; Xie, Q.; Huang, J. Intelligent optimization method for rebar cutting in pump station based on an improved genetic algorithm with BIM. Buildings 2025, 15, 1790. [Google Scholar] [CrossRef]
  16. Widjaja, D.D.; Kim, S.; Kim, D.J. Optimizing rebar consumption and cutting waste in column reinforcement: Integrated mechanical couplers and a special-length-priority minimization algorithm. Buildings 2024, 14, 287. [Google Scholar] [CrossRef]
  17. JGJ 107-2016; Technical Specification for Mechanical Splicing of Steel Reinforcing Bars. Architecture & Building Press: Beijing, China, 2016.
  18. GB 50010-2010; Code for Design of Concrete Structures. Architecture & Building Press: Beijing, China, 2016.
  19. GB 50011-2010; Code for Seismic Design of Buildings. Architecture & Building Press: Beijing, China, 2024.
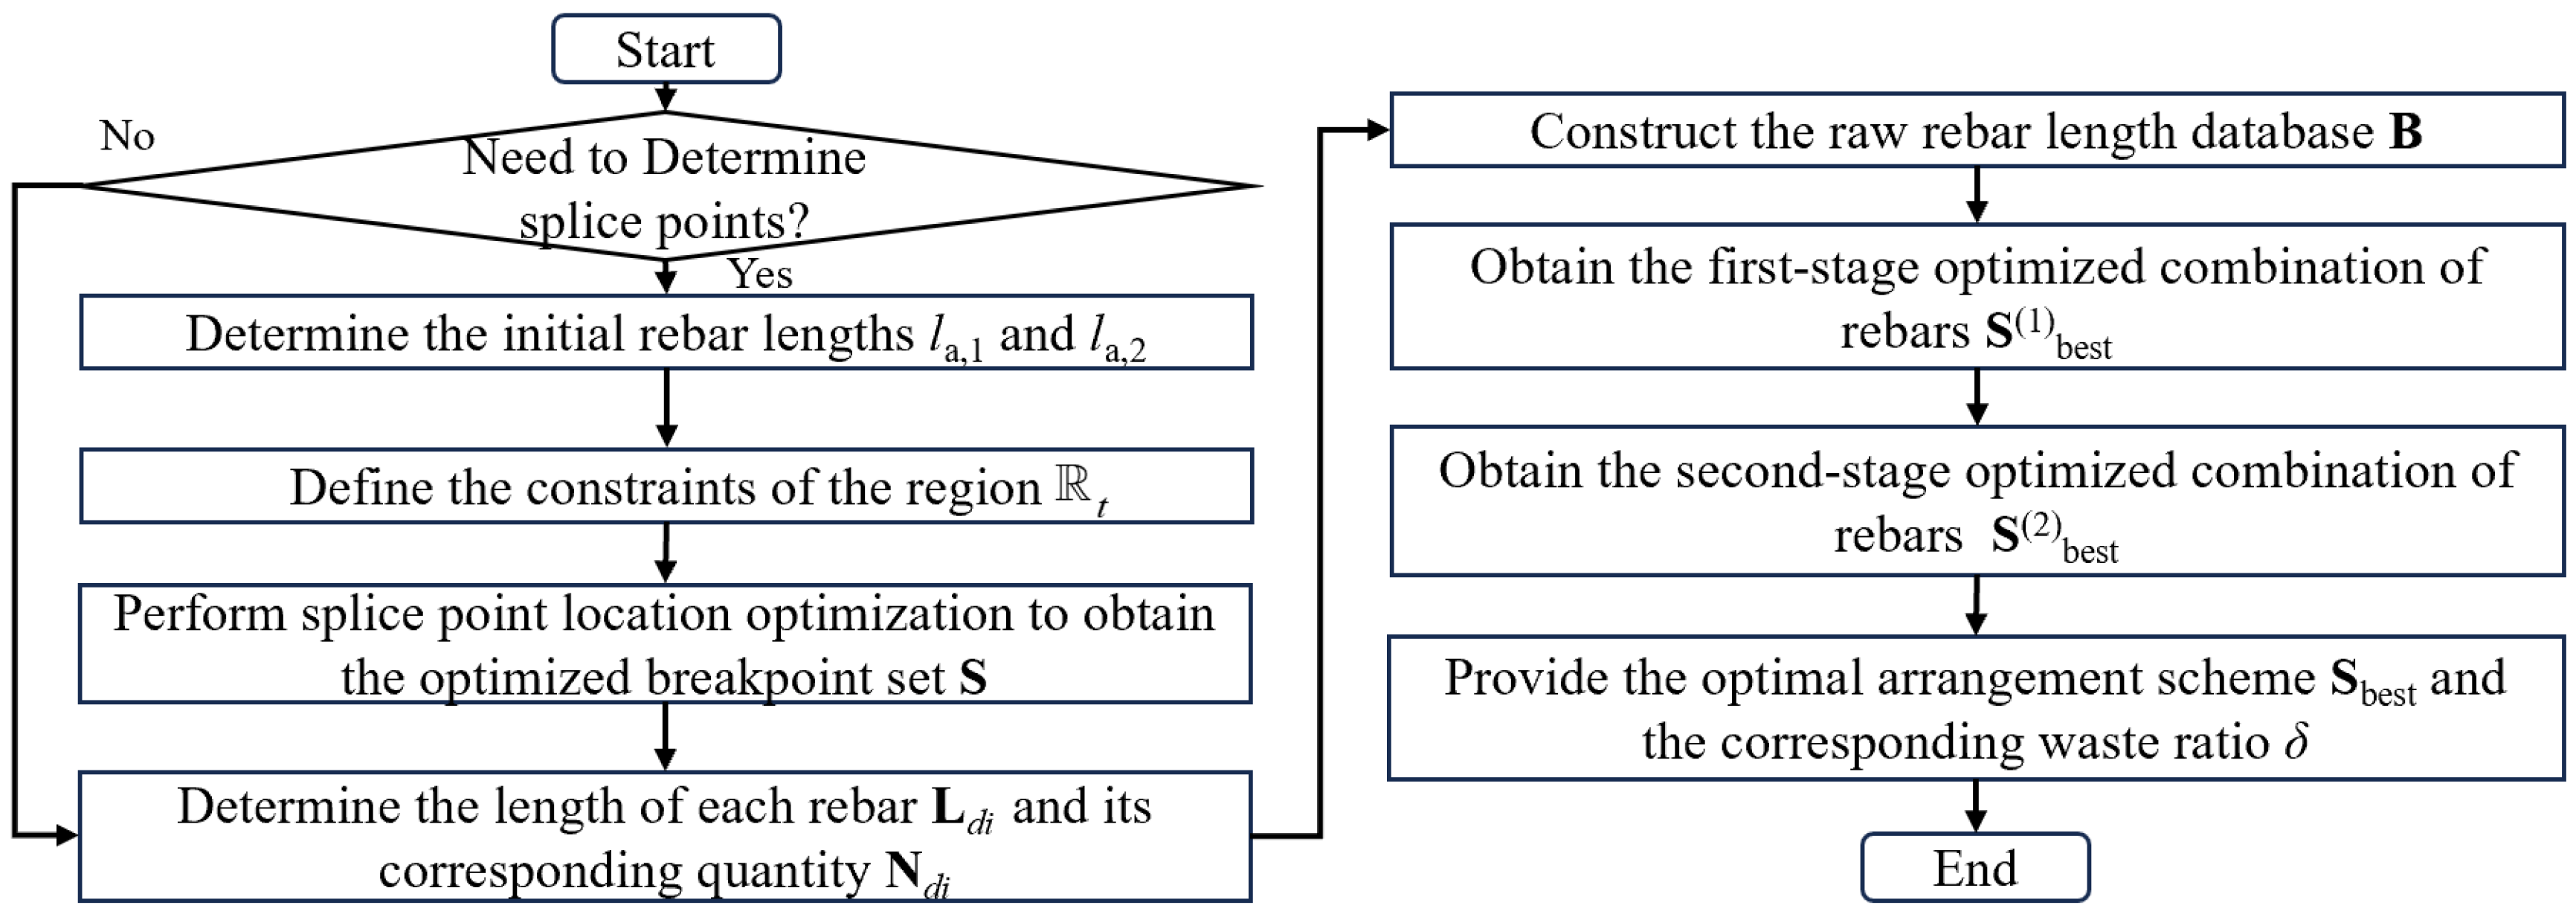
Figure 1. Framework of the rebar cutting optimization method.
Buildings 15 03693 g001
Figure 2. The variation of waste rate with GA parameters.
Buildings 15 03693 g002aBuildings 15 03693 g002b
Figure 3. Waste ratio and computation time of different optimization methods under datasets D1 and D2.
Buildings 15 03693 g003
Figure 4. Rebar Splicing Diagram.
Buildings 15 03693 g004
Figure 5. Rebar Arrangement of Current and Lower-Story Columns.
Buildings 15 03693 g005
Figure 6. Reinforcement layout of the standard precast segmental beam.
Buildings 15 03693 g006
Figure 7. Waste ratio for different customized rebar lengths.
Buildings 15 03693 g007
Table 1. Parameter table of MDP model.
SymbolTypeDescription
tindexthe splicing step
Ststate variablethe splicing state at step t
atdecision variablethe action taken at the t-th splicing step
R(St,at,St+1)reward functionthe benefit or penalty associated with the state transition
ALB,tparameterthe lower bound of the permissible interval for the t-th splicing
AUB,tparameterthe upper bound of the permissible interval for the t-th splicing
dtparameterthe minimum spacing between adjacent splicing points
Table 2. Parameter table of cutting optimization model.
SymbolTypeDescription
Rjparameterthe waste length of the j-th raw rebar.
Bjparameterthe length of the j-th raw rebar
kparameterthe number of rebars cut from the j-th raw rebar
S(2)decision variablethe cutting scheme in the second stage
f(S(2))functionthe fitness function of the second-stage optimization
αparameterthe penalty coefficient
S(2)bestresultthe optimal cutting scheme obtained in the second-stage
optimization
S(1)bestresultthe cutting scheme obtained in the first-stage greedy
optimization
Sbestresultthe overall optimal cutting scheme, combining both the first and second stages
Table 3. Story heights and permissible splice zones.
Number of Stories12–45–7
Floor Information
Story height/m5.957.807.00
Maximum beam depth/m1.101.101.10
Upper limit of splicing zone/m3.855.584.92
Lower limit of splicing zone/m1.001.120.98
Table 4. Splice positions corresponding to Table 1.
Number of StoriesBreakpoint 1/mHeight Difference from Floor Base/mBreakpoint 2/mHeight Difference from Floor Base/m
122.0011.00
2115.05104.05
3151.25162.25
4242.45253.45
5333.65344.65
637.51.1538.52.15
746.53.1547.54.15
Table 5. Waste ratio of rebars in different stories (%).
Number of Stories22 mm25 mm28 mm32 mm
10.300.770.420.55
20.560.670.440.61
31.100.680.460.59
40.720.840.770.62
50.440.800.690.23
60.690.500.520.33
70.900.620.660.89
Disclaimer/Publisher’s Note: The statements, opinions and data contained in all publications are solely those of the individual author(s) and contributor(s) and not of MDPI and/or the editor(s). MDPI and/or the editor(s) disclaim responsibility for any injury to people or property resulting from any ideas, methods, instructions or products referred to in the content.