1. Introduction
Deep foundation pit construction plays a vital role in urban infrastructure development, particularly in underground spaces and high-rise building projects [
1,
2]. With rapid urbanization and increasingly limited land resources, foundation pits are frequently located adjacent to existing structures and public utilities, which amplifies the environmental risks associated with excavation [
3,
4,
5]. Excavation inevitably alters the in situ stress equilibrium of soils, inducing redistribution of stresses, soil deformation, and ground settlement [
6,
7]. If excessive settlement occurs, it can compromise the stability of adjacent buildings, leading to wall cracking, differential settlement, tilting, and reduced bearing capacity [
8]. Beyond structural damage, such hazards threaten public safety, property, and the quality of life of surrounding communities [
9]. Consequently, accurate and reliable prediction of building settlement adjacent to foundation pits is crucial for risk management and early warning in geotechnical engineering [
10,
11].
Over the past decades, numerous approaches have been explored to predict building settlement during excavation, including empirical equations, laboratory and field experiments, numerical simulations, and machine learning. Empirical formulas are convenient but often lack sufficient accuracy for safety-critical applications [
12,
13,
14]. Physical model tests and in situ experiments, while informative, are time-consuming and costly, limiting their practicality for real-time applications. Numerical simulations are widely used but suffer from uncertainties in soil constitutive models and limited adaptability to highly variable ground conditions. In contrast, machine learning has recently emerged as a promising alternative [
15,
16,
17], offering advantages such as high accuracy, adaptability, efficiency, and robustness [
18,
19].
Significant progress has been achieved in machine learning-based settlement prediction. For example, Jiang et al. proposed a multi-parameter time-series (MPTS) model (integrating GS, NPSO, SVR) for interlayer soil settlement prediction in under-crossing construction, achieving 20.3% lower MAE, 46.7% lower MSE (outperforming 3 algorithms) and 79.97% reduced accumulated settlement via derived measures [
20]. Xu et al. proposed a multi-fidelity DeepONet framework (integrating low-fidelity finite element simulation subnet and high-fidelity monitoring data subnet) for mechanized tunneling ground settlement prediction, achieving R
2 around 0.9 (vs. 0.2 for pure simulation), robustness to 50% noisy data, and 20 min to <30 s training time reduction via transfer learning [
21]. Zhang et al. developed a novel hybrid model (NHM, combining joint denoising technique & EGWO-ν-SVR) for long-term settlement prediction, which suppresses measurement noise, outperforms other methods in accuracy/robustness, and identifies a 7:3 data division ratio & radial basis function as optimal for EGWO-ν-SVR [
22]. While these studies highlight the effectiveness of machine learning, three major problem remain: (1) many frameworks depend heavily on extensive monitoring data, causing redundancy and inefficiency; (2) most research emphasizes the behavior of the pit itself rather than the settlement of surrounding buildings, limiting its value for environmental risk assessment; and (3) prediction accuracy and robustness in real-world time-series applications remain insufficient for reliable early-warning systems.
To address these limitations, this study proposes a hybrid GWO-VMD-LSTM framework that integrates Grey Wolf Optimizer, Variational Mode Decomposition, and Long Short-Term Memory networks. The novelty of the framework lies in its dual optimization strategy: GWO is applied both to fine-tune the critical parameters of VMD (mode number and penalty factor) and to optimize hyperparameters of the LSTM network (units, epochs, learning rate, and L2 regularization). This ensures precise decomposition of complex settlement signals and enhances the predictive performance of the deep learning model. The contributions of this research are summarized as follows: (1) Settlement monitoring data from four representative points (GX1-GX4) adjacent to the Yongning Hospital foundation pit in Taizhou were collected over 79 consecutive days, providing a reliable dataset for time-series modeling of building settlement. (2) The VMD algorithm, optimized by GWO, was employed to decompose nonlinear and nonstationary settlement signals into intrinsic mode functions, which served as input features for prediction. (3) A GWO-optimized LSTM network was constructed to predict settlement, achieving superior accuracy compared to five benchmark models. Specifically, the proposed model attained an average R2 of 0.951, RMSE of 0.033, and MAPE of 1.324%, outperforming traditional EMD-LSTM and VMD-LSTM models by substantial margins. (4) The hybrid model was validated not only in terms of predictive accuracy but also robustness across multiple monitoring points, demonstrating its potential for real-time dynamic monitoring and early-warning applications in complex urban excavation projects. Ultimately, this study provides a reliable and practical predictive tool for settlement monitoring of buildings surrounding deep foundation pits, offering technical support for proactive risk management and contributing to safer and more sustainable underground construction in soft soil regions.
2. Methodology
2.1. Variational Mode Decomposition (VMD)
Variational Mode Decomposition (VMD) is an adaptive and mathematically rigorous signal decomposition method that aims to represent a given signal as a collection of intrinsic mode functions (IMFs), each with compact frequency support around a center frequency [
23,
24]. Compared with traditional approaches such as Empirical Mode Decomposition (EMD), VMD avoids mode mixing, provides stable decomposition results, and demonstrates strong robustness against noise. The method is based on constructing analytic signals via the Hilbert transform, demodulating them to the baseband, and measuring their bandwidth through the squared norm of the time derivative. The objective is to minimize the sum of the estimated bandwidths of all modes under the constraint that the modes reconstruct the original signal.
VMD reformulates the decomposition of a signal into oscillatory modes as a constrained variational optimization problem. The analytic signal of each mode is constructed using the Hilbert transform:
where
denotes the Hilbert transform. As shown in Equation (1), this representation shifts the spectrum to positive frequencies. The optimization target of VMD is to minimize the sum of the bandwidths of all modes:
where
represents the Dirac delta function,
denotes the imaginary unit,
indicates the convolution operation, and
corresponds to the estimated central frequency.
Subject to the reconstruction constraint,
Equations (2) and (3) jointly indicate that the original signal
must be perfectly reconstructed by the sum of all decomposed modes while ensuring compact frequency support. To solve this constrained problem, an augmented Lagrangian is constructed:
where
is a penalty factor controlling bandwidth compactness and
is the Lagrangian multiplier. The frequency-domain representation of bandwidth is given by:
which leads to iterative update equations derived under the Alternating Direction Method of Multipliers (ADMM):
where
is the dual ascent step size. As shown in Equations (6)–(8), the decomposition is achieved through iterative refinement of the modes, their center frequencies, and the Lagrangian multiplier.
Owing to its ability to isolate both trend components and high-frequency fluctuations, VMD is particularly suitable for settlement prediction of buildings adjacent to deep foundation pits, where monitoring signals are typically nonlinear, nonstationary, and multi-scale in nature.
2.2. Grey Wolf Optimizer (GWO)
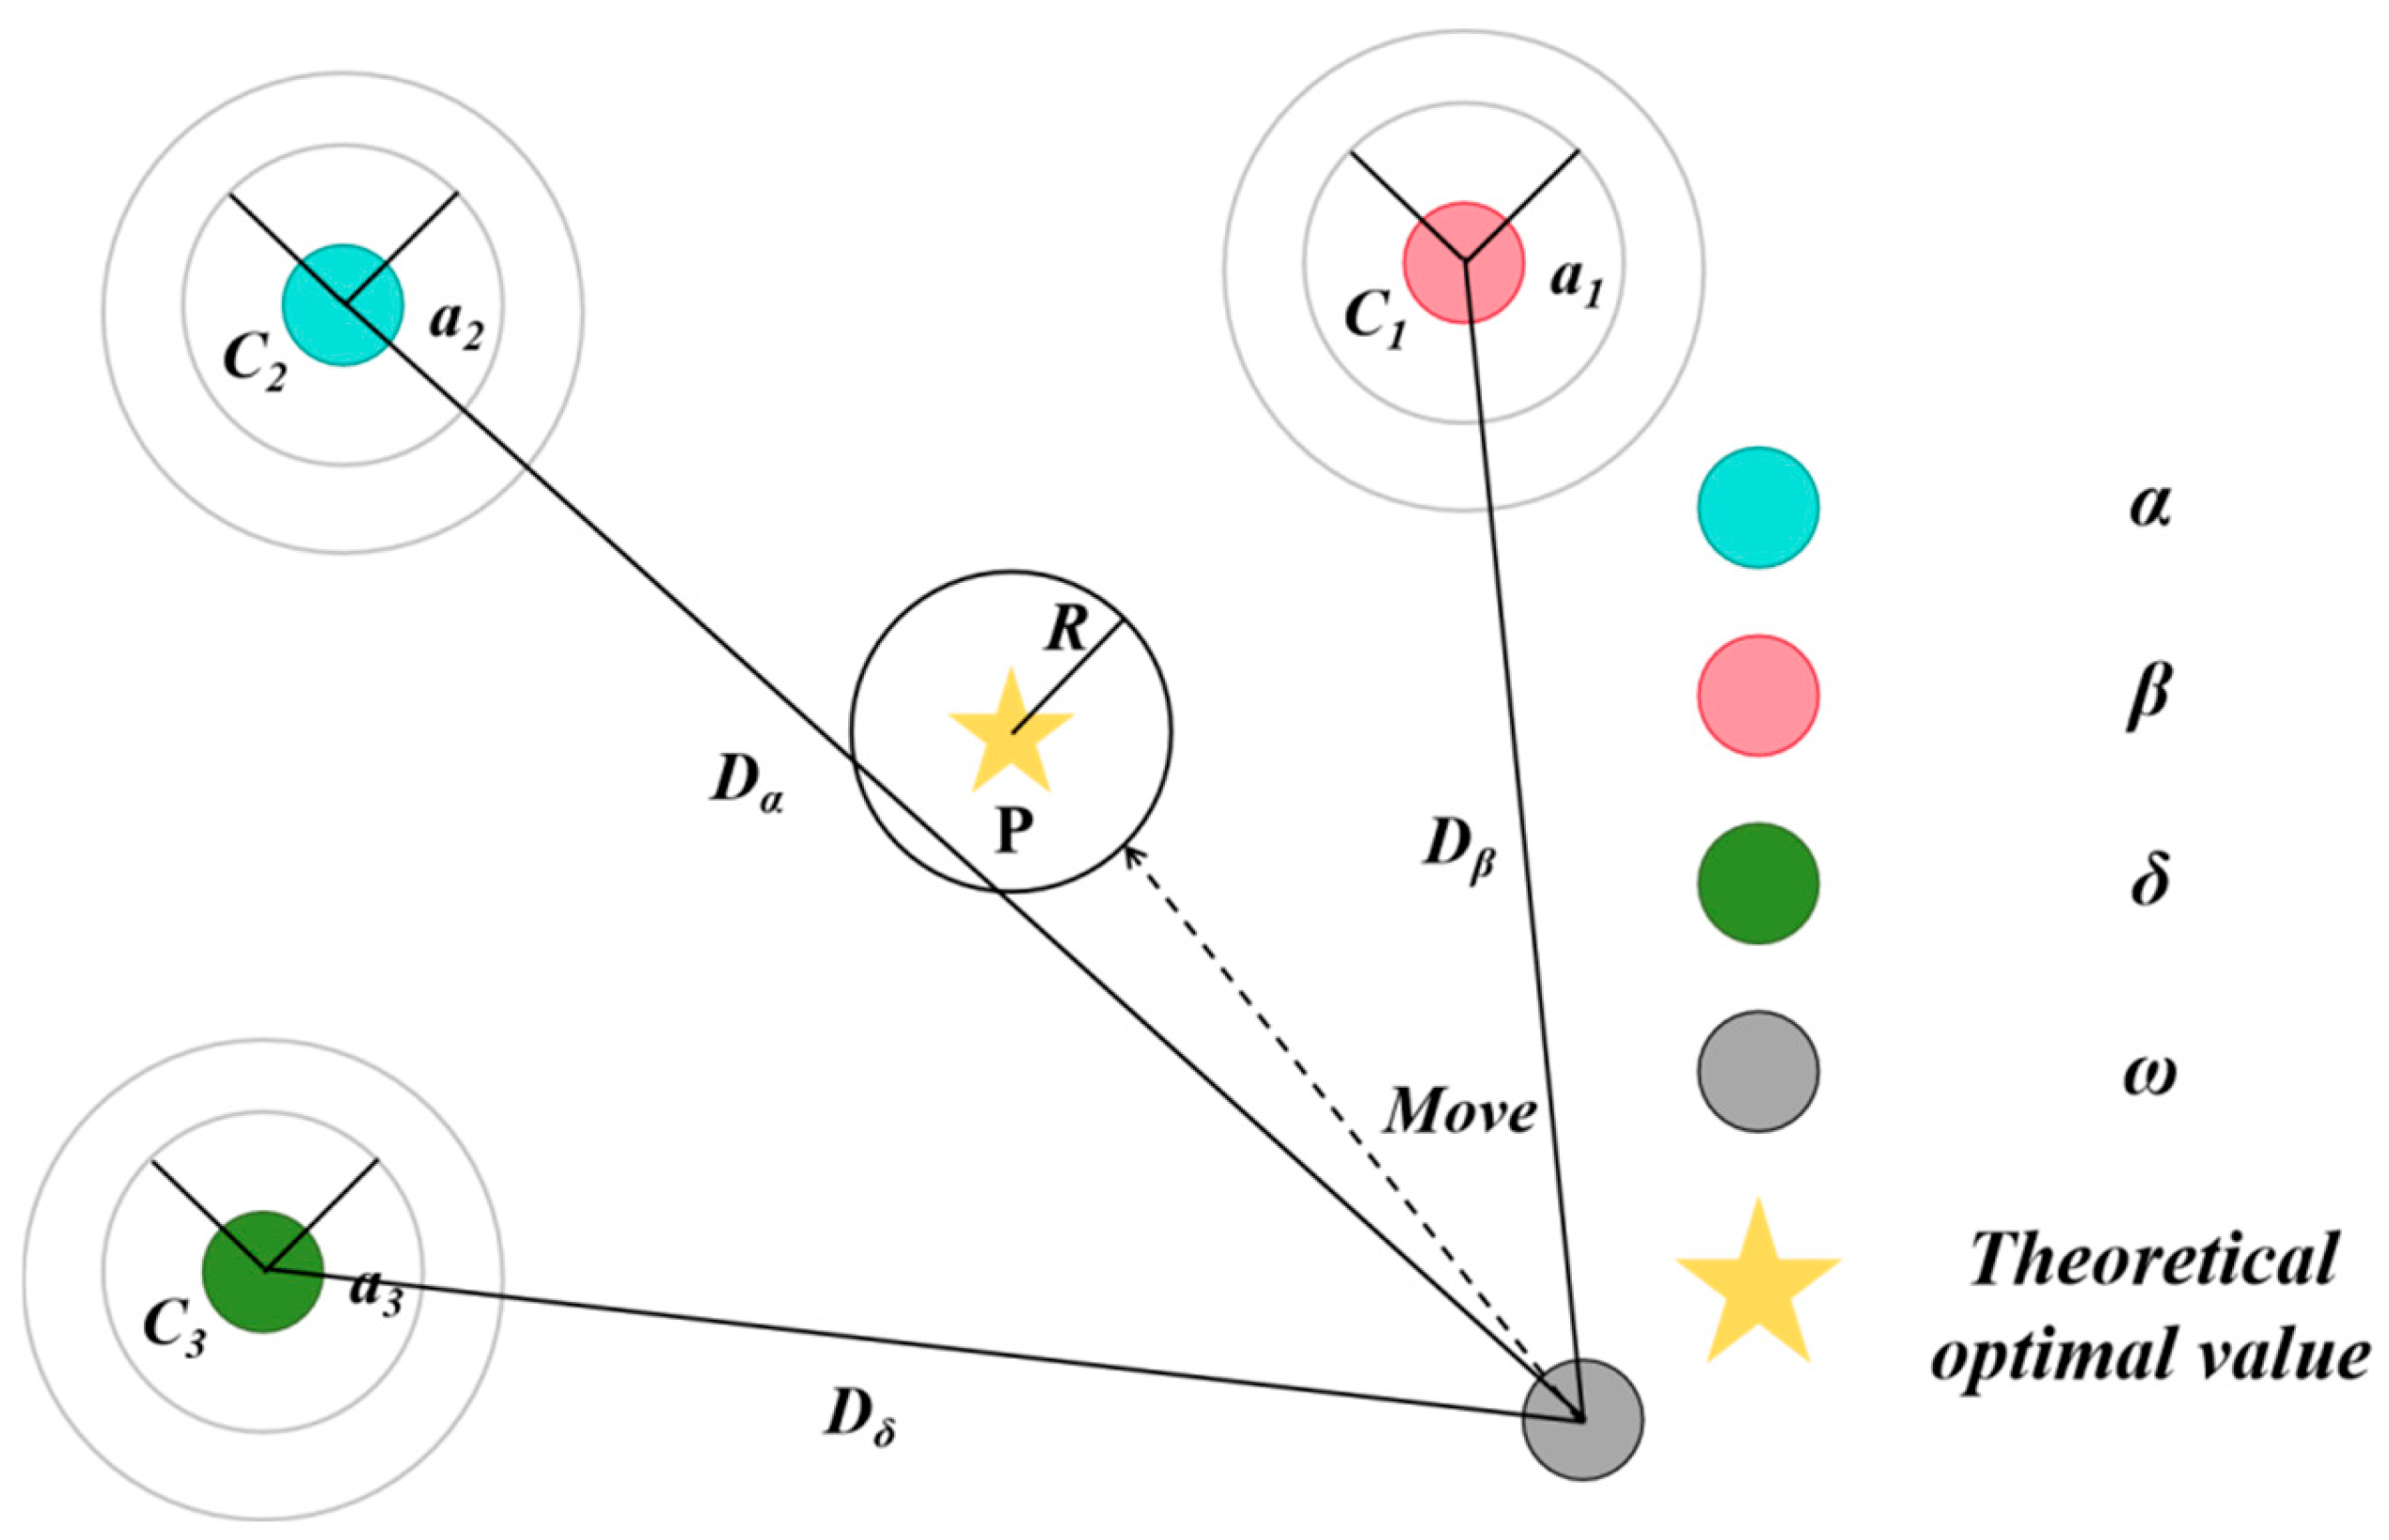
In 2014, Mirjalili et al. proposed the Grey Wolf Optimizer (GWO), a nature-inspired metaheuristic algorithm based on the leadership hierarchy and hunting mechanism of grey wolves in nature [
25,
26,
27]. Grey wolves are considered apex predators, and their social hierarchy can be categorized into four levels: alpha (
α), beta (
β), delta (
δ), and omega (
ω). In the algorithm, the best solution is considered as
α, the second-best as
β, and the third-best as
δ, while the remaining candidate solutions are regarded as
ω. The hunting process of grey wolves mainly involves three stages: encircling prey, hunting, and attacking. The framework diagram of the GWO optimization algorithm is shown in
Figure 1.
To mathematically model the encircling behavior, the following equations are defined:
where
represents the position vector of the prey,
denotes the position vector of the grey wolf at iteration
t,
and
are coefficient vectors, and
is the distance between the wolf and the prey.
The coefficient vectors are updated as follows:
where
decreases linearly from 2 to 0 over the course of iterations, and
and
are random vectors in the range [0, 1].
To simulate the social hierarchy of wolves during hunting, the position of each candidate solution is updated according to the three best wolves (
α,
β,
δ) as:
In Equations (13)–(16), , , and denote the positions of the three best wolves obtained so far, while and (i = 1,2,3) are coefficient vectors calculated as in Equations (11) and (12). This mechanism ensures that wolves update their positions based on the guidance of the best three solutions, thereby balancing exploration and exploitation.
2.3. Long Short-Term Memory (LSTM)
Long Short-Term Memory (LSTM) is a special type of recurrent neural network (RNN) proposed by Hochreiter and Schmidhuber in 1997, which was designed to overcome the vanishing and exploding gradient problems of conventional RNNs [
28,
29,
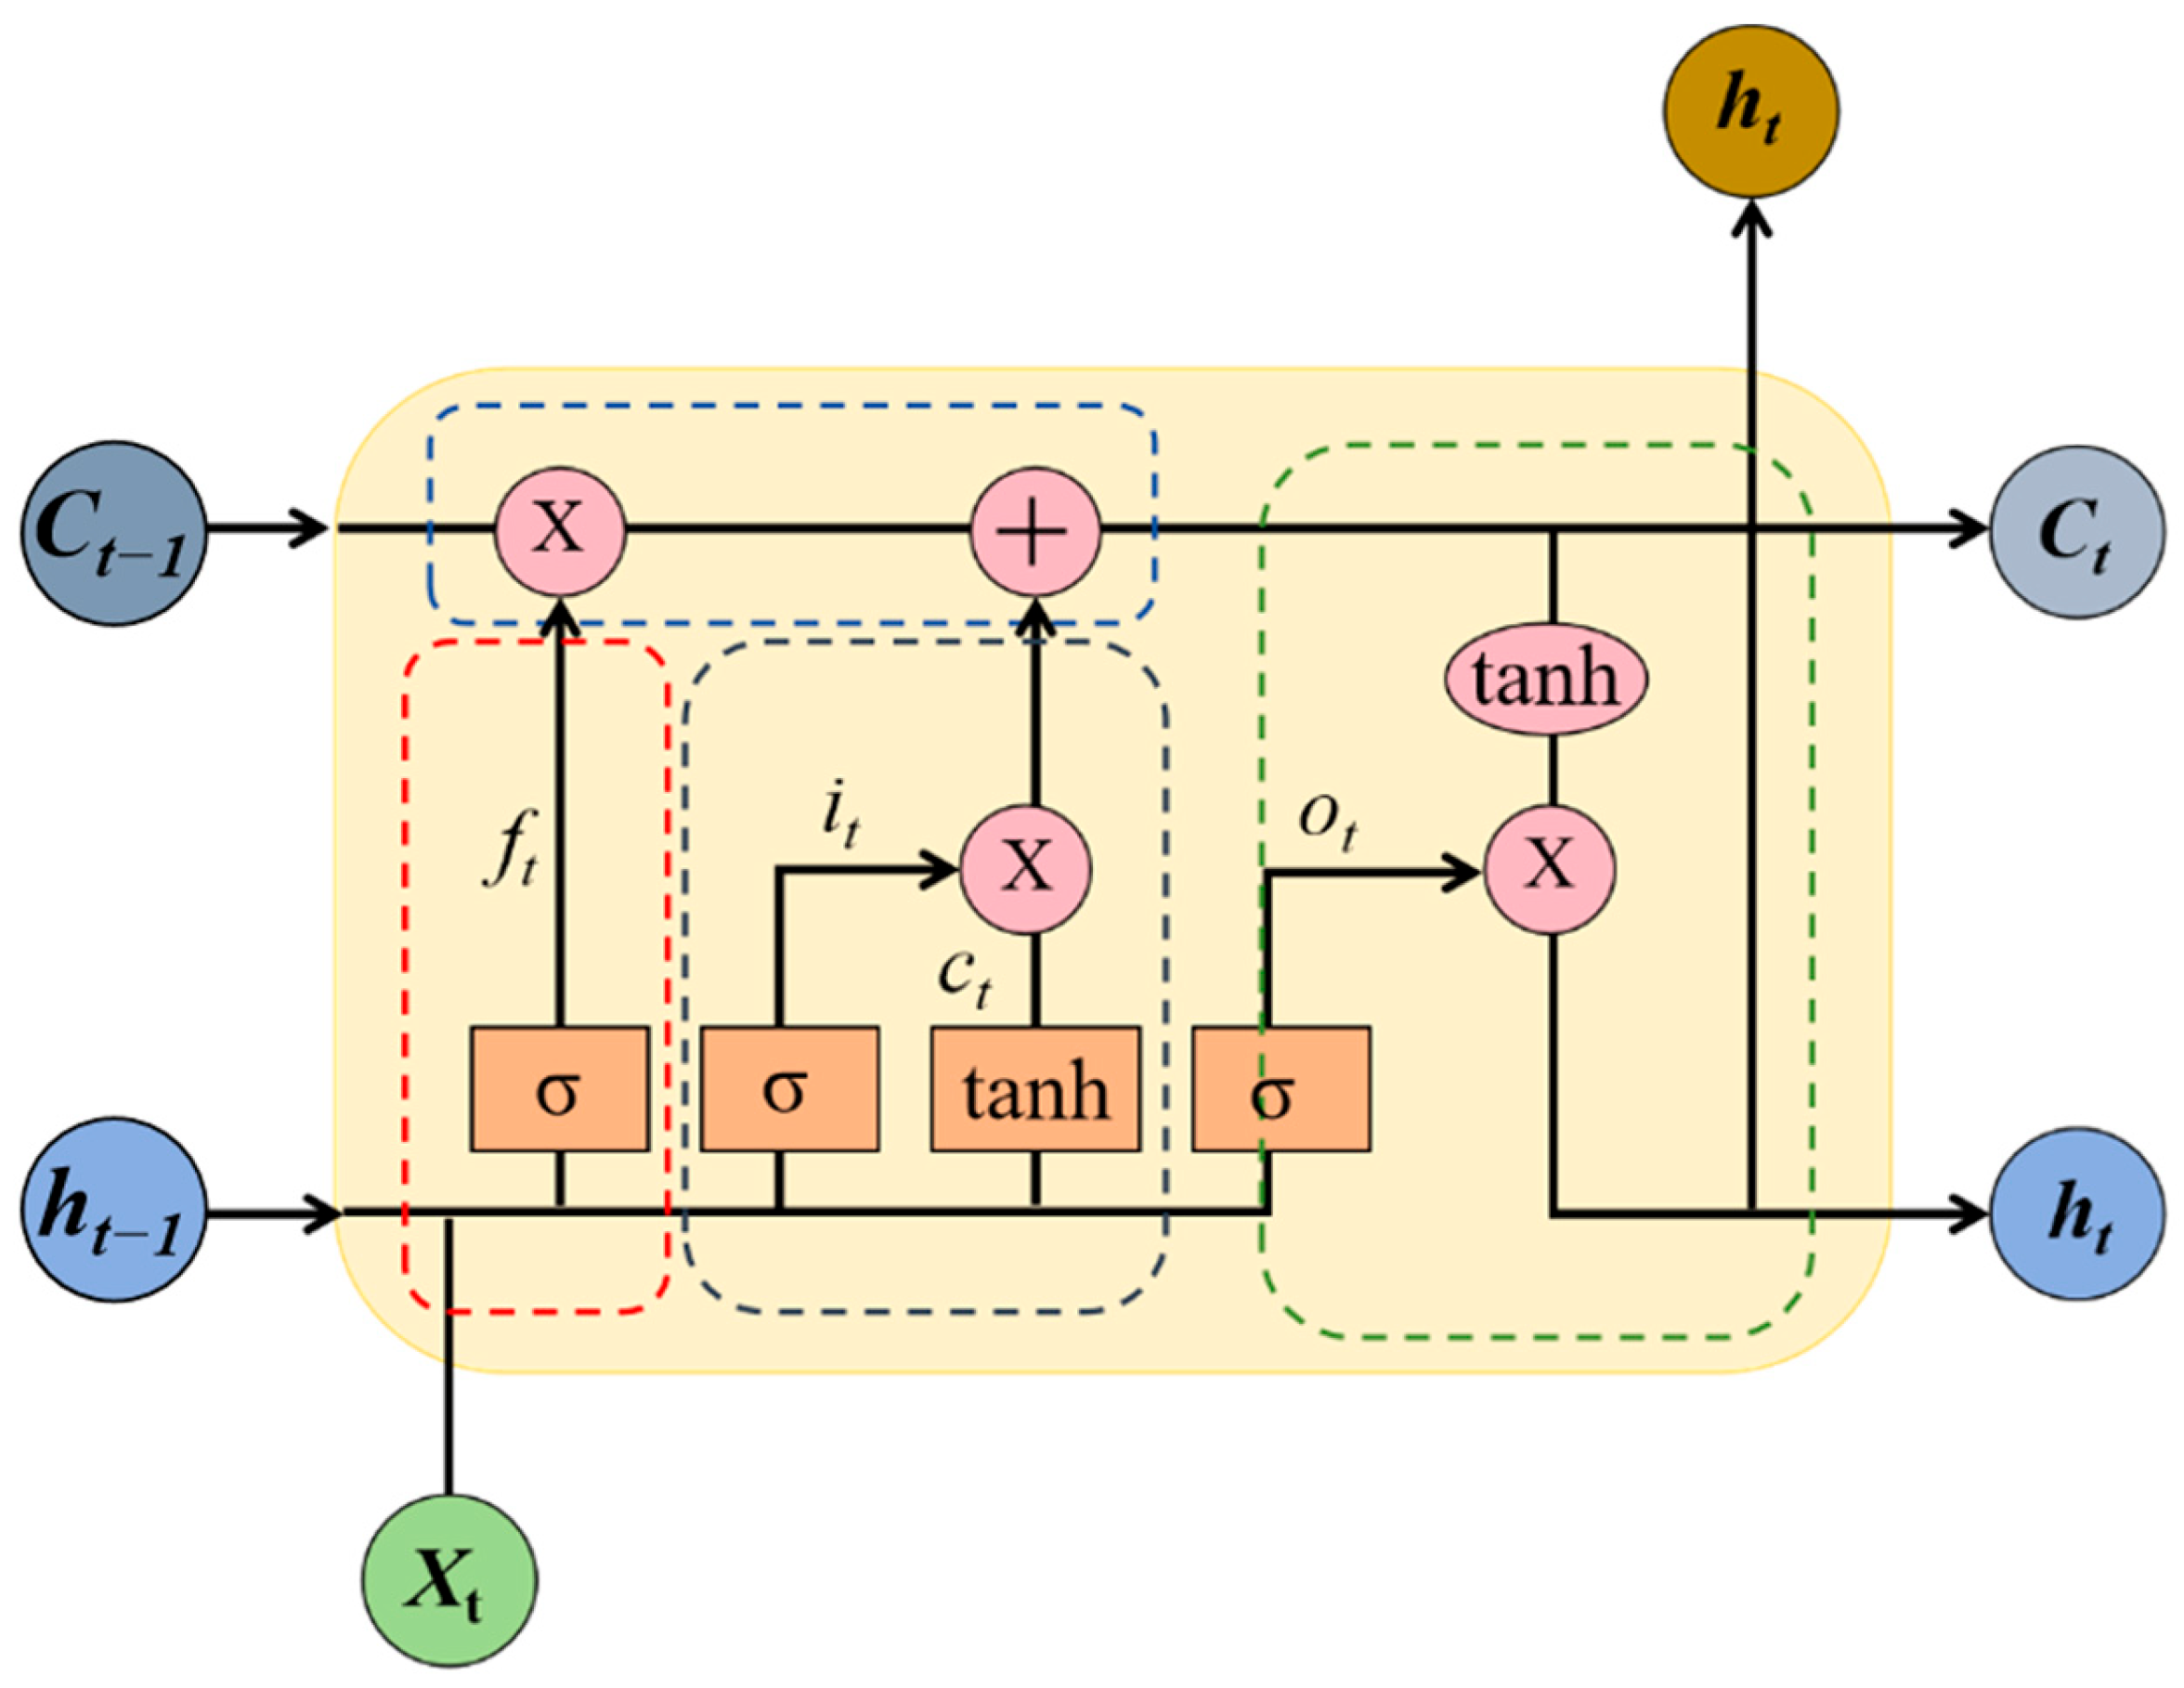
30]. By introducing memory cells and gating mechanisms, LSTM is able to capture both short-term dynamics and long-term dependencies in sequential data, making it particularly suitable for time-series forecasting and sequence modeling. The core structure of LSTM is defined by a set of gating functions that regulate the information flow: the forget gate, the input gate, the candidate state, and the output gate. The computation process of an LSTM cell can be expressed as follows:
In Equations (17)–(21), is the input vector at time step t, and hth represent the hidden states at times t − 1 and t, respectively, and and denote the cell states. , , and are the forget, input, and output gate activations, respectively. is the candidate cell state. , , , and , , , are the weight matrices and bias vectors of the respective gates. The functions and represent the sigmoid and hyperbolic tangent activation functions, while denotes element-wise multiplication.
Figure 2 shows the schematic representation of the LSTM model. Through these mechanisms, LSTM enables selective retention, updating, and output of information across time steps, allowing it to model long-term dependencies while mitigating gradient decay. This property makes LSTM highly effective in applications such as speech recognition, natural language processing, and particularly in the prediction of settlement sequences of buildings adjacent to deep foundation pits, where temporal dependencies and nonlinear patterns play a critical role.
2.4. GWO-VMD-LSTM Prediction Model
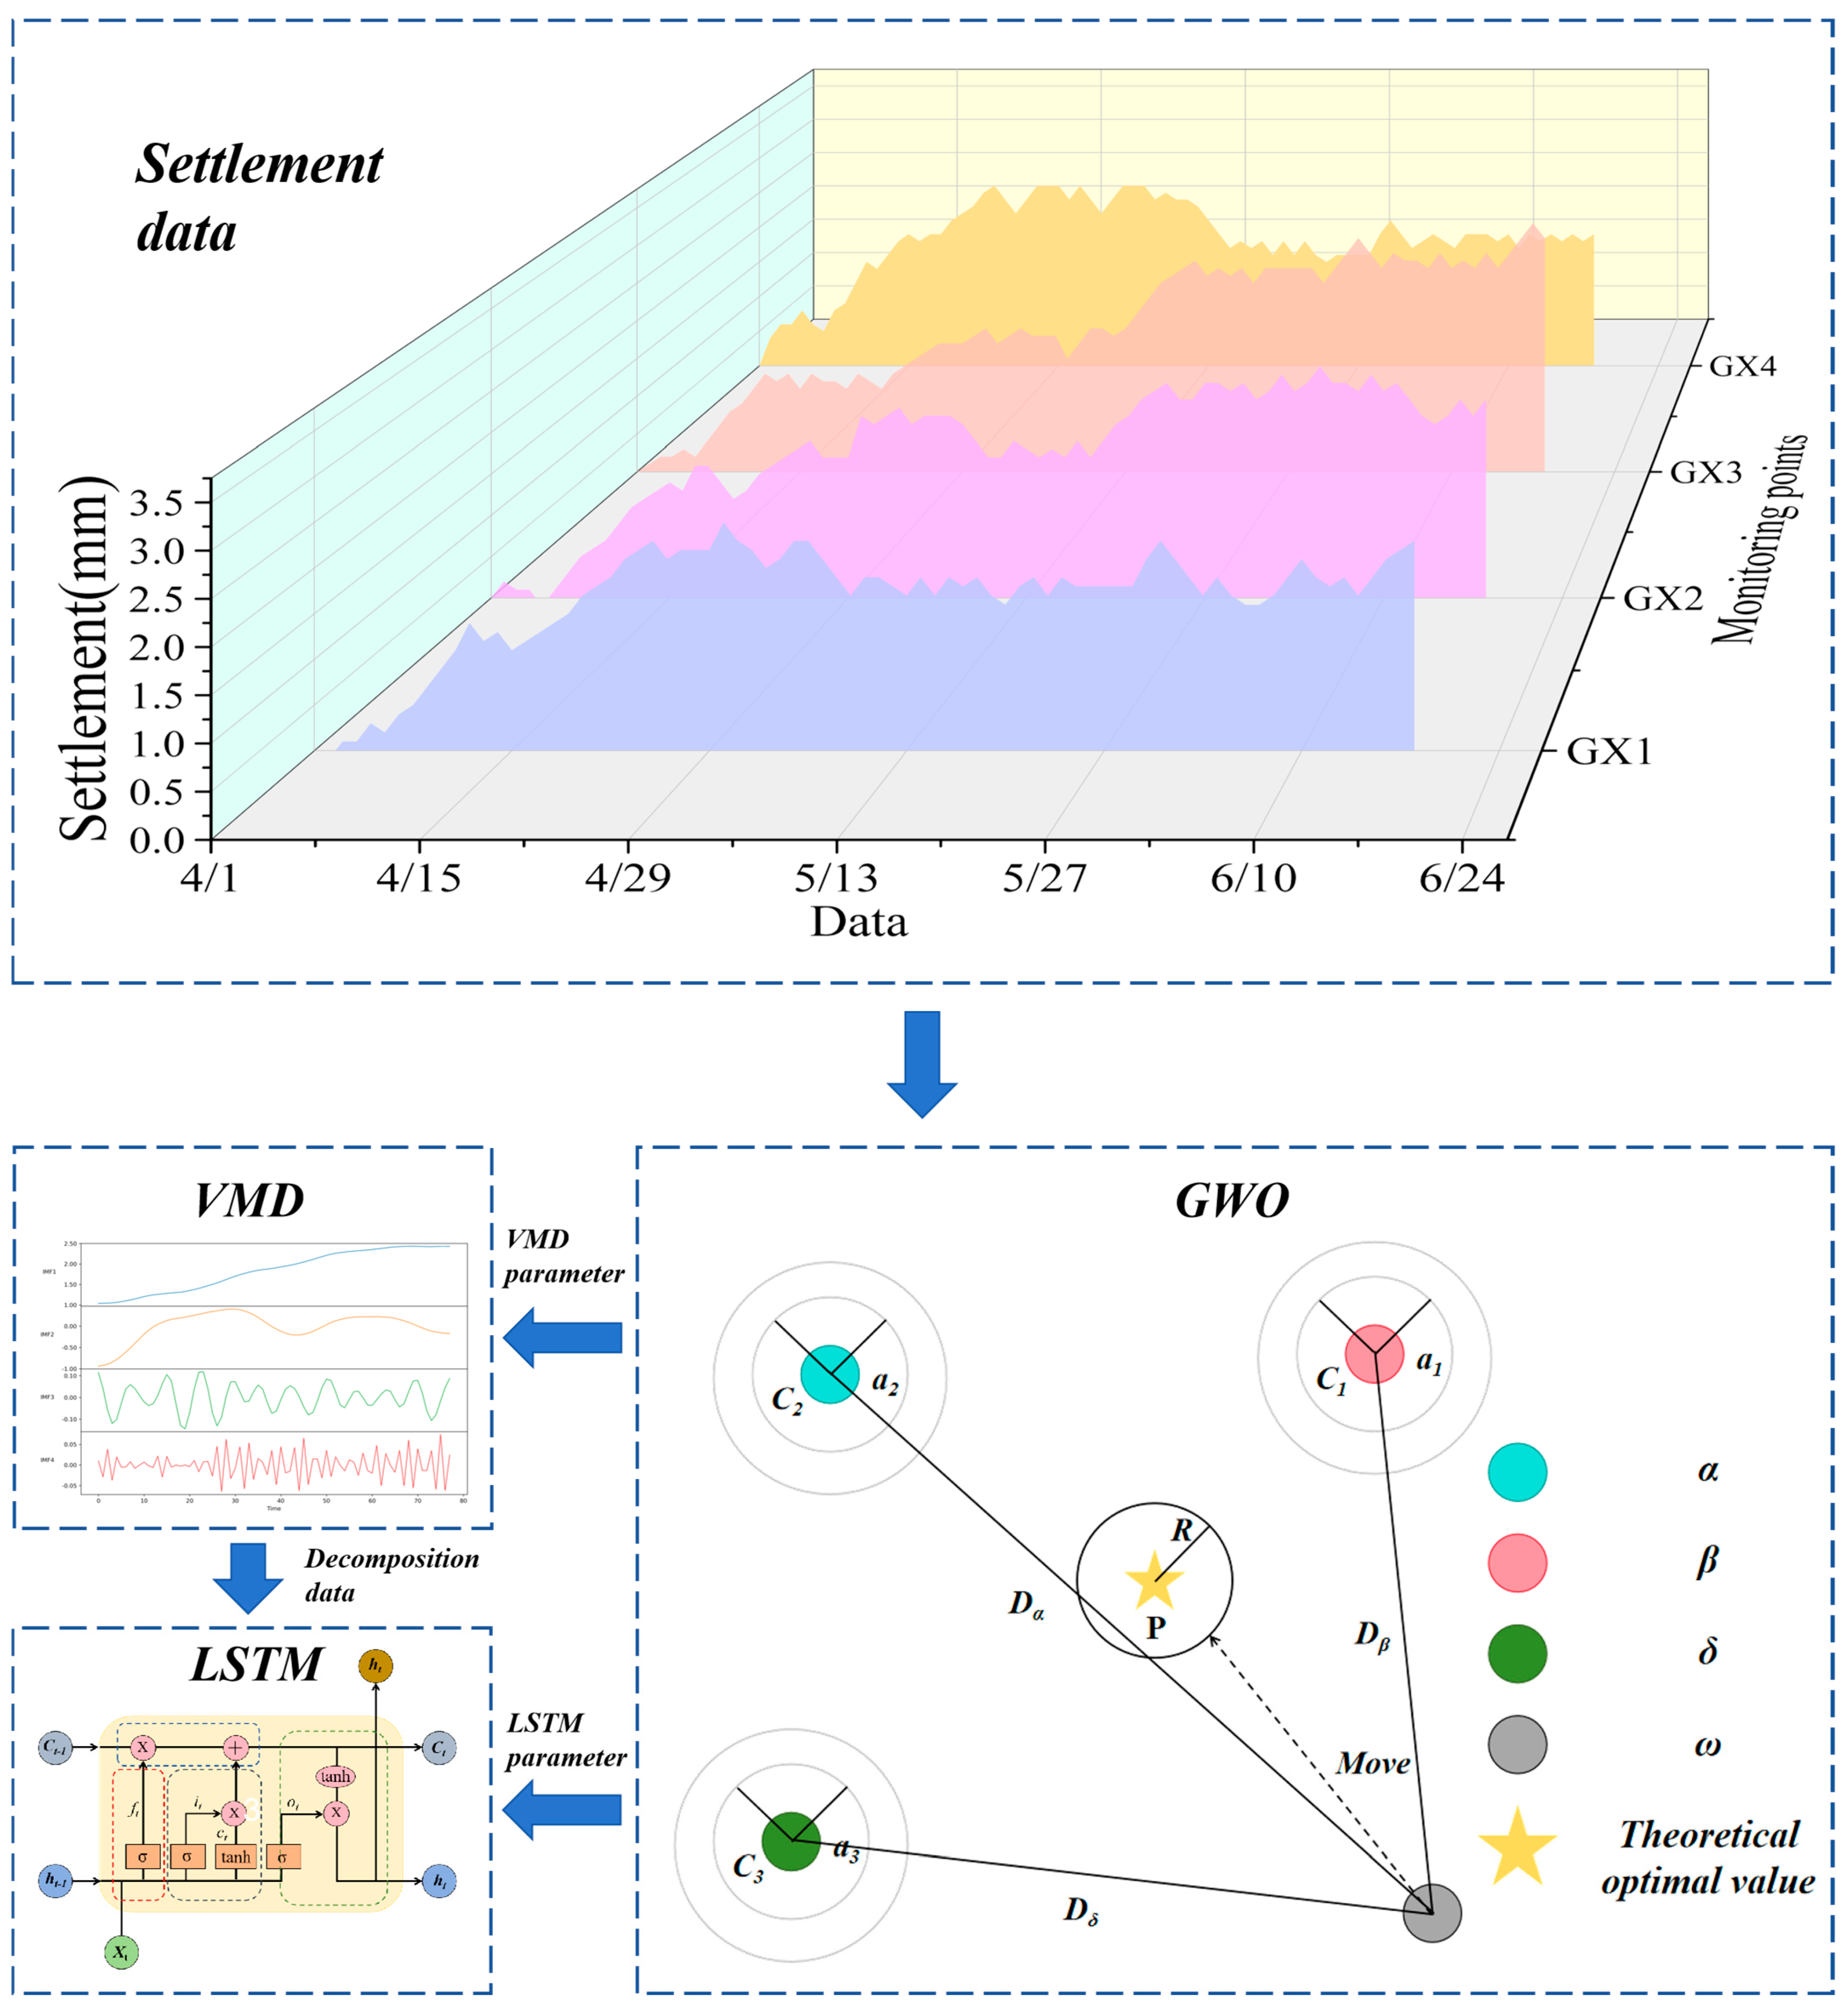
This section introduces the proposed GWO-VMD-LSTM settlement prediction model, with its structural framework illustrated in
Figure 3. The objective of this study is to explore settlement data prediction methods from the source by integrating signal decomposition techniques with the temporal modeling capabilities of LSTM networks. Such integration aims to provide a more effective prediction model for the settlement of buildings adjacent to deep foundation pits. The construction of the proposed GWO-VMD-LSTM model consists of the following steps.
Step 1: The collected time-series data (settlement of buildings around the foundation pit) are subjected to denoising, smoothing, and normalization. The processed settlement data are then organized into datasets to serve as the input signals for the VMD algorithm.
Step 2: The GWO is first employed to optimize two critical hyperparameters in VMD, namely the number of modes K and the penalty factor . In the GWO-based optimization of VMD parameters, envelope entropy was adopted as the fitness function because it effectively quantifies the complexity and independence of decomposed intrinsic mode functions. This criterion allows clearer separation of settlement trends and fluctuations compared with energy- or correlation-based metrics, thereby improving the interpretability and stability of signal decomposition. The fitness function is defined as the minimization of envelope entropy, ensuring that the decomposed IMFs retain effective signal features. The individual with the smallest fitness value is selected as the optimal parameter combination (K, ), which is then used in VMD to decompose the noise signal into N IMF components. Subsequently, GWO is further applied to optimize key hyperparameters of the LSTM model, including the number of units, number of epochs, L2 regularization, and learning rate, with the minimization of RMSE defined as the optimization objective.
Step 3: In the model construction process, the architecture of the LSTM network was designed, and a sliding time window with a length of L = 7 was established to capture temporal dependencies. The IMF components obtained through VMD were utilized as input features, while the original settlement sequence was designated as the prediction target. The dataset was subsequently divided into training and testing subsets at a ratio of 8:2 to ensure the generalization capability of the model during both training and validation stages.
Step 4: The LSTM is employed as the prediction module, with the decomposed IMF components as inputs and the original settlement series as the output. To evaluate the predictive performance of the model, five evaluation metrics are adopted, namely the coefficient of determination (R2), mean absolute error (MAE), mean squared error (MSE), root mean squared error (RMSE), and mean absolute percentage error (MAPE).
In summary, the proposed GWO-VMD-LSTM hybrid prediction model is composed of three primary components: GWO for parameter optimization, VMD for signal decomposition, and LSTM for time-series prediction. The core contribution of this model lies in leveraging the global optimization capability of GWO to determine the key parameters affecting both VMD and LSTM prediction performance. By doing so, the LSTM network can achieve improved prediction accuracy and robustness for settlement forecasting. This design strikes a balance between model complexity and generalization ability, making it particularly effective for handling non-stationary settlement data with multi-frequency characteristics decomposed by VMD.
2.5. Comprehensive Evaluation Metrics
To comprehensively evaluate the predictive performance of the proposed model, five statistical indicators are employed: the coefficient of determination (R
2), mean absolute error (MAE), mean squared error (MSE), root mean squared error (RMSE), and mean absolute percentage error (MAPE). As shown in Equations (23)–(27), the definitions of these metrics are expressed as follows:
where
is the observed value,
is the predicted value,
is the mean of observed values, and
n denotes the number of samples.
R
2 measures the goodness-of-fit of the model, MAE reflects the average magnitude of absolute errors, MSE penalizes larger deviations more heavily, RMSE provides the error in the same units as the original data, and MAPE expresses the prediction error as a percentage. Collectively, these indices provide a comprehensive evaluation of both accuracy and robustness of the prediction model [
31,
32].
3. Data Processing and Experimental Section
3.1. Data Collection
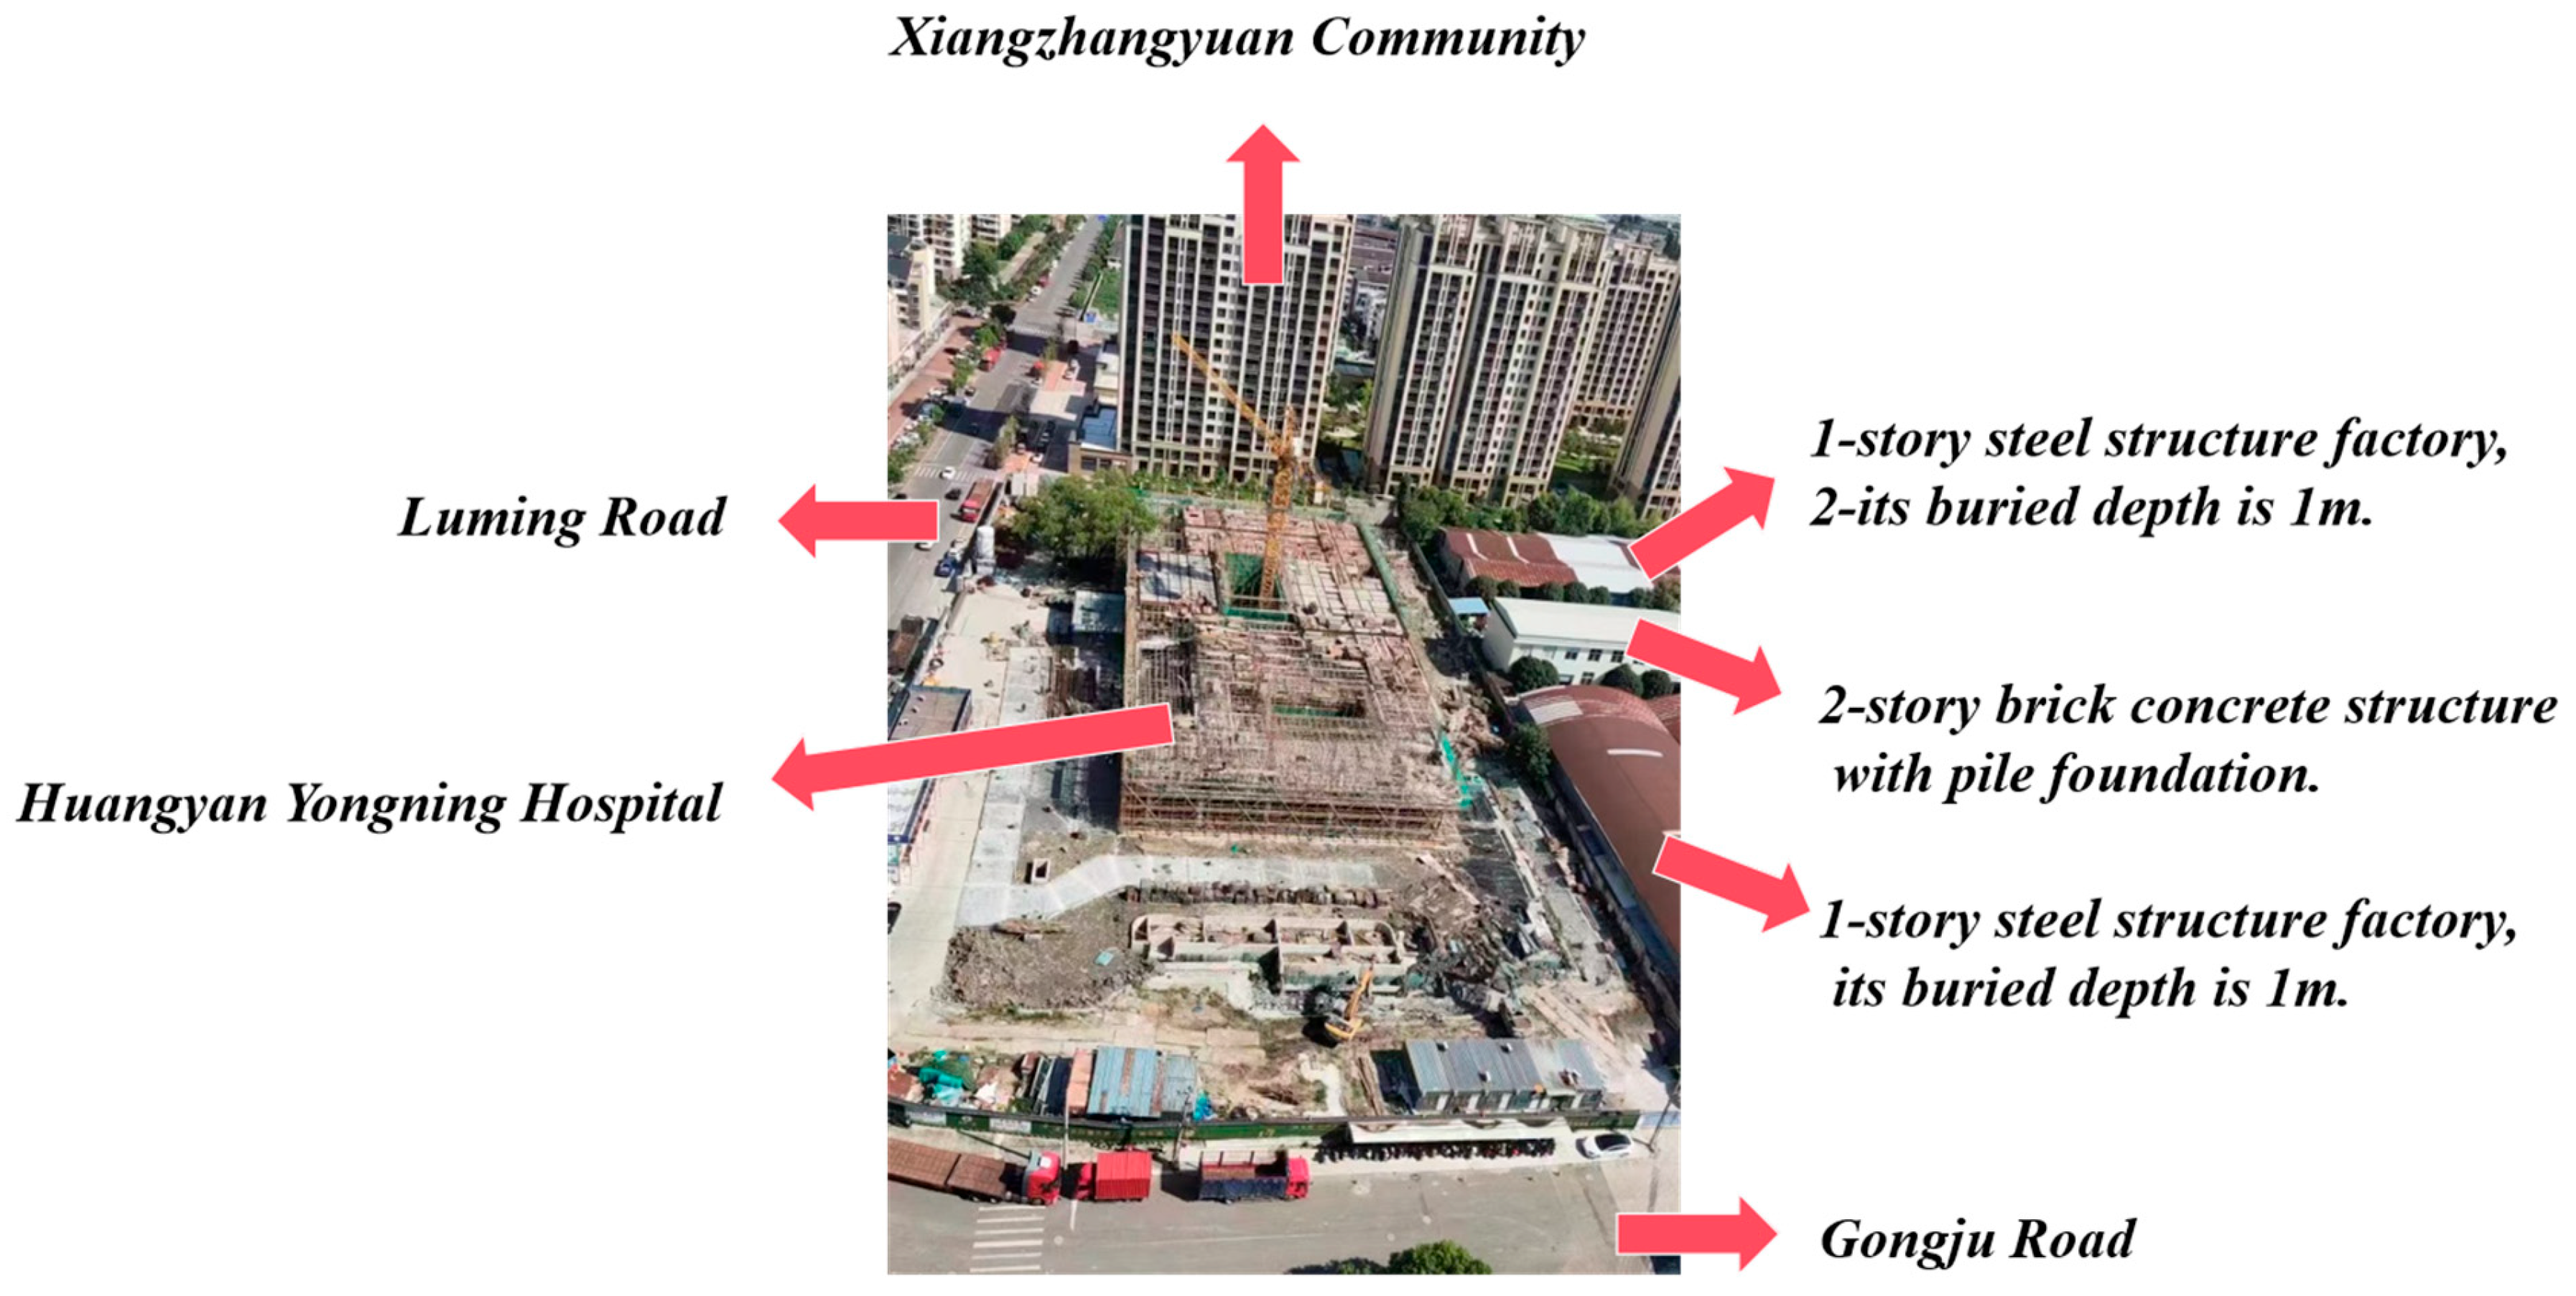
This study takes the Yongning Hospital Project in Huangyan District, Taizhou City, as the research object. The project is located to the east of Luming Road and to the north of Guanguan Road, as shown in
Figure 4. The total site area is 12,457 m
2, with a gross floor area of 24,397 m
2, including 18,555 m
2 aboveground and a single underground floor of 5842 m
2. The excavation depth of the foundation pit ranges from 5.850 to 6.650 m. The project is situated in a complex surrounding environment. To the north lies a completed residential community, consisting of 18-story high-rise buildings with pile foundations and one underground floor. To the east, there is a one-story steel structure factory building and a two-story brick-concrete factory building. The south side is adjacent to Guanguan Road, while the west side borders Luming Road. The site is located in a typical soft soil area, with the thickness of the soft soil layer exceeding 20 m. The geotechnical parameters of the soil layers are summarized in
Table 1. Due to the unfavorable engineering properties of the soft soil, such as high compressibility and low bearing capacity, and the high density and deformation sensitivity of the surrounding buildings and structures, reinforced concrete internal supports combined with pile walls were adopted as the excavation support system to control the environmental impact of foundation pit excavation.
The core monitoring task of this study is the vertical settlement of buildings adjacent to the foundation pit, with particular attention to the residential area on the north side (18-story high-rise buildings) and the factory buildings on the east side, so as to prevent potential safety hazards such as cracking and tilting induced by excavation. According to the monitoring layout principles defined in the Technical Standard for Building Foundation Excavation Monitoring (GB 50497-2019) [
33], four monitoring points (GX1–GX4) were selected and arranged on the buildings directly adjacent to one side of the foundation pit. The points were evenly distributed along this side, forming a continuous monitoring sequence with complete and reliable data throughout the excavation period. Each point was installed on the main load-bearing components of the buildings, enabling direct reflection of the overall structural settlement response. Owing to their representative distribution and data integrity, these points provide a solid basis for settlement time-series modeling. The adaptive optimization mechanism of the proposed GWO-VMD-LSTM model ensures its reliable performance under varying geological and structural conditions. Settlement monitoring was conducted using a DS05 digital level from 1 April 2023 to 18 June 2023, for a total duration of 79 consecutive days, with a monitoring frequency of once per day.
According to the Technical Standard for Building Foundation Excavation Monitoring (GB 50497-2019) and safety requirements of the surrounding buildings, the following settlement control criteria were adopted: vertical displacement ≤ 15 mm; differential settlement ≤ 6 mm between adjacent monitoring points; and building inclination ≤ 2‰.
3.2. Settlement Data Processing
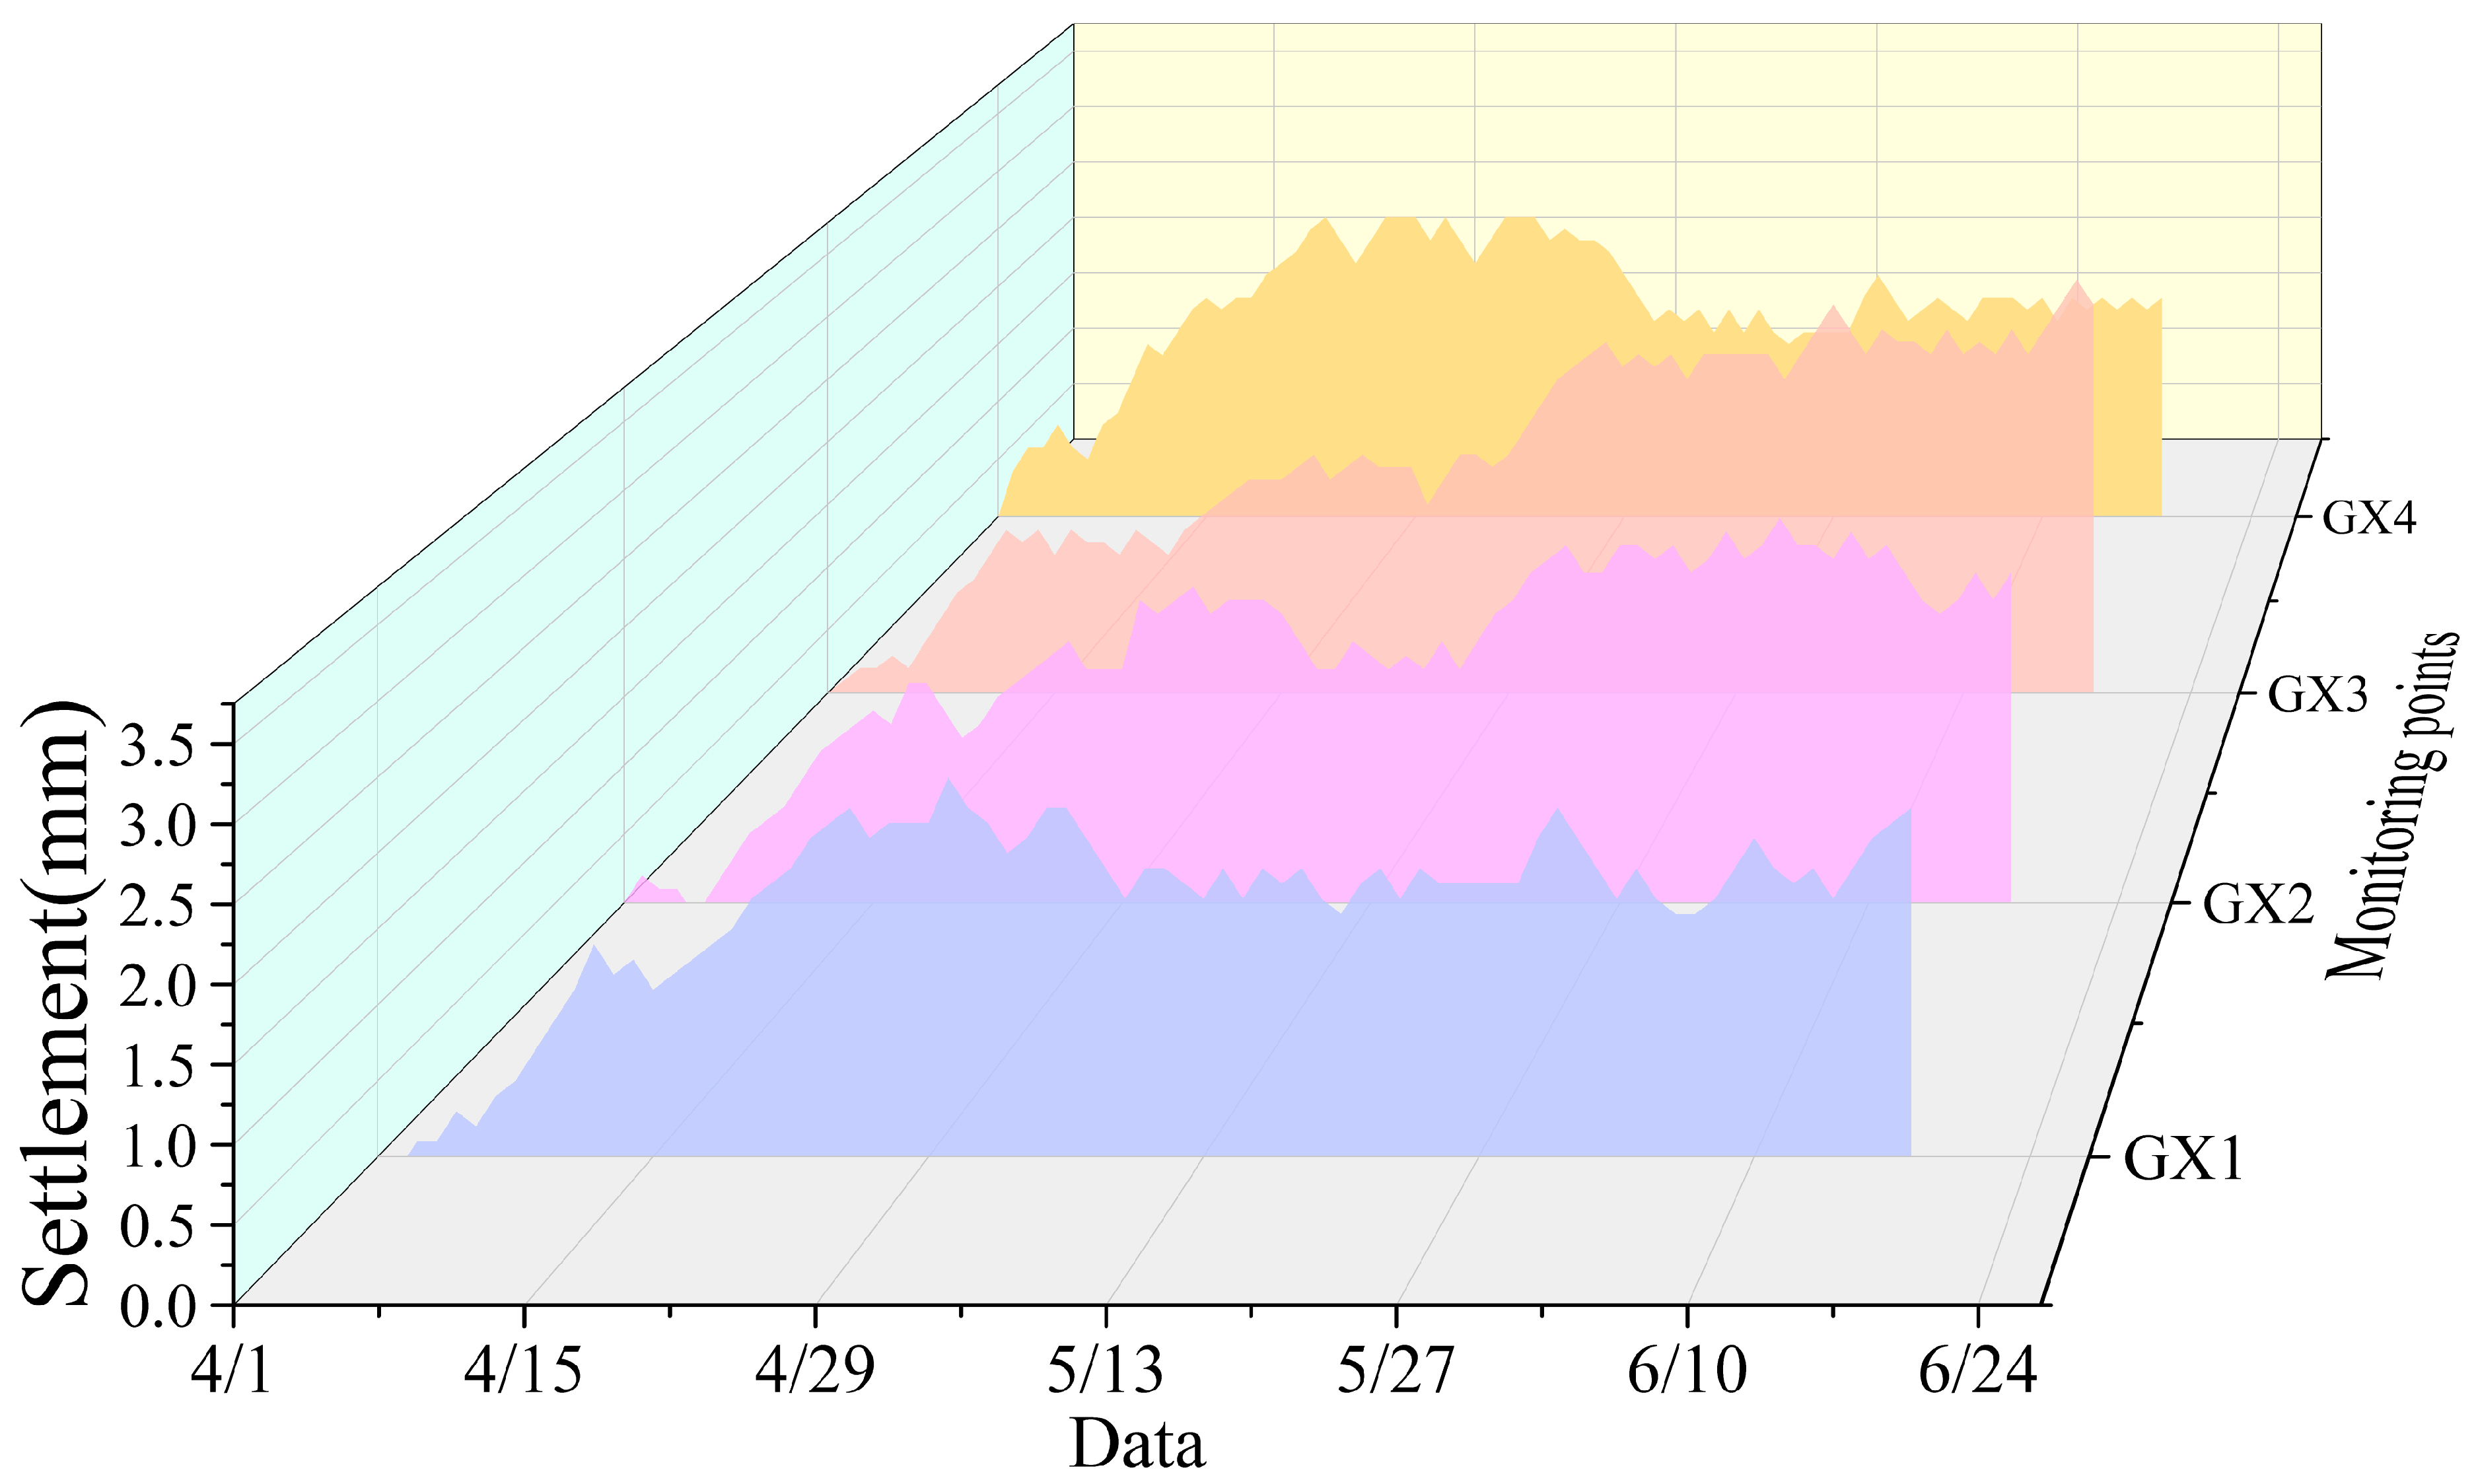
During the construction stage of the foundation pit at the Yongning Hospital project in Huangyan, dynamic data from 103 vertical settlement monitoring points (labeled GX1-GX103) around the adjacent buildings were continuously collected. To focus on the analysis of typical settlement characteristics, the settlement data from monitoring points GX1-GX4 were selected as the core research objects, and their temporal variation trends are illustrated in
Figure 5. According to the statistical analysis, the mean settlement values at the four monitoring points were 1.66 mm (GX1), 1.82 mm (GX2), 1.97 mm (GX3), and 1.94 mm (GX4). The standard deviations ranged from 0.60 to 0.87 mm, indicating that the settlement processes exhibited a certain degree of variability across different locations.
The maximum settlement values were observed at GX1 = 2.5 mm, GX2 = 2.8 mm, GX3 = 2.8 mm, and GX4 = 3.3 mm, whereas the minimum values were recorded as GX1 = −0.1 mm, GX2 = −0.1 mm, GX3 = 0 mm, and GX4 = 0 mm. Overall, all four monitoring points exhibited a settlement pattern characterized by initial minor fluctuations followed by a gradual increase, reflecting the significant influence of deep foundation pit excavation and construction activities on the settlement behavior of surrounding buildings in soft soil areas.
Prior to settlement data modeling, the dataset was partitioned using a time-series split method to preserve the temporal dependency of the data and avoid disruption caused by random partitioning. Specifically, 80% of the total data were assigned to the training set for parameter learning and model fitting, while the remaining 20% were designated as the testing set to validate the generalization performance of the model on unseen temporal data, thereby providing a reliable basis for subsequent model performance evaluation. In this study, the dataset was divided into training and testing sets in an 8:2 ratio based on published literature and prior experience in geotechnical time-series modeling. This configuration provided a balance between training sufficiency and testing representativeness, as a 9:1 ratio would leave too few samples for reliable validation, while a 7:3 ratio would limit the model’s ability to learn long-term temporal dependencies. For monitoring points with high noise levels (e.g., GX1), the 8:2 split also ensured sufficient data for both model learning and independent evaluation, thereby improving the robustness and generalization of the predictive framework.
3.3. Hyperparameter Optimization Process of the GWO-VMD-LSTM Model
In this study, the population size of the GWO was set to 10, and the maximum number of iterations was fixed at 30. The population size (10) and iteration number (30) of GWO were selected based on previously published optimization studies and empirical experience, which suggest that small-to-moderate configurations generally achieve stable convergence and efficient computation in hybrid machine learning frameworks. The upper and lower bounds of the optimization parameters were defined as
ub = [5000, 10] and
lb = [1000, 1], respectively.
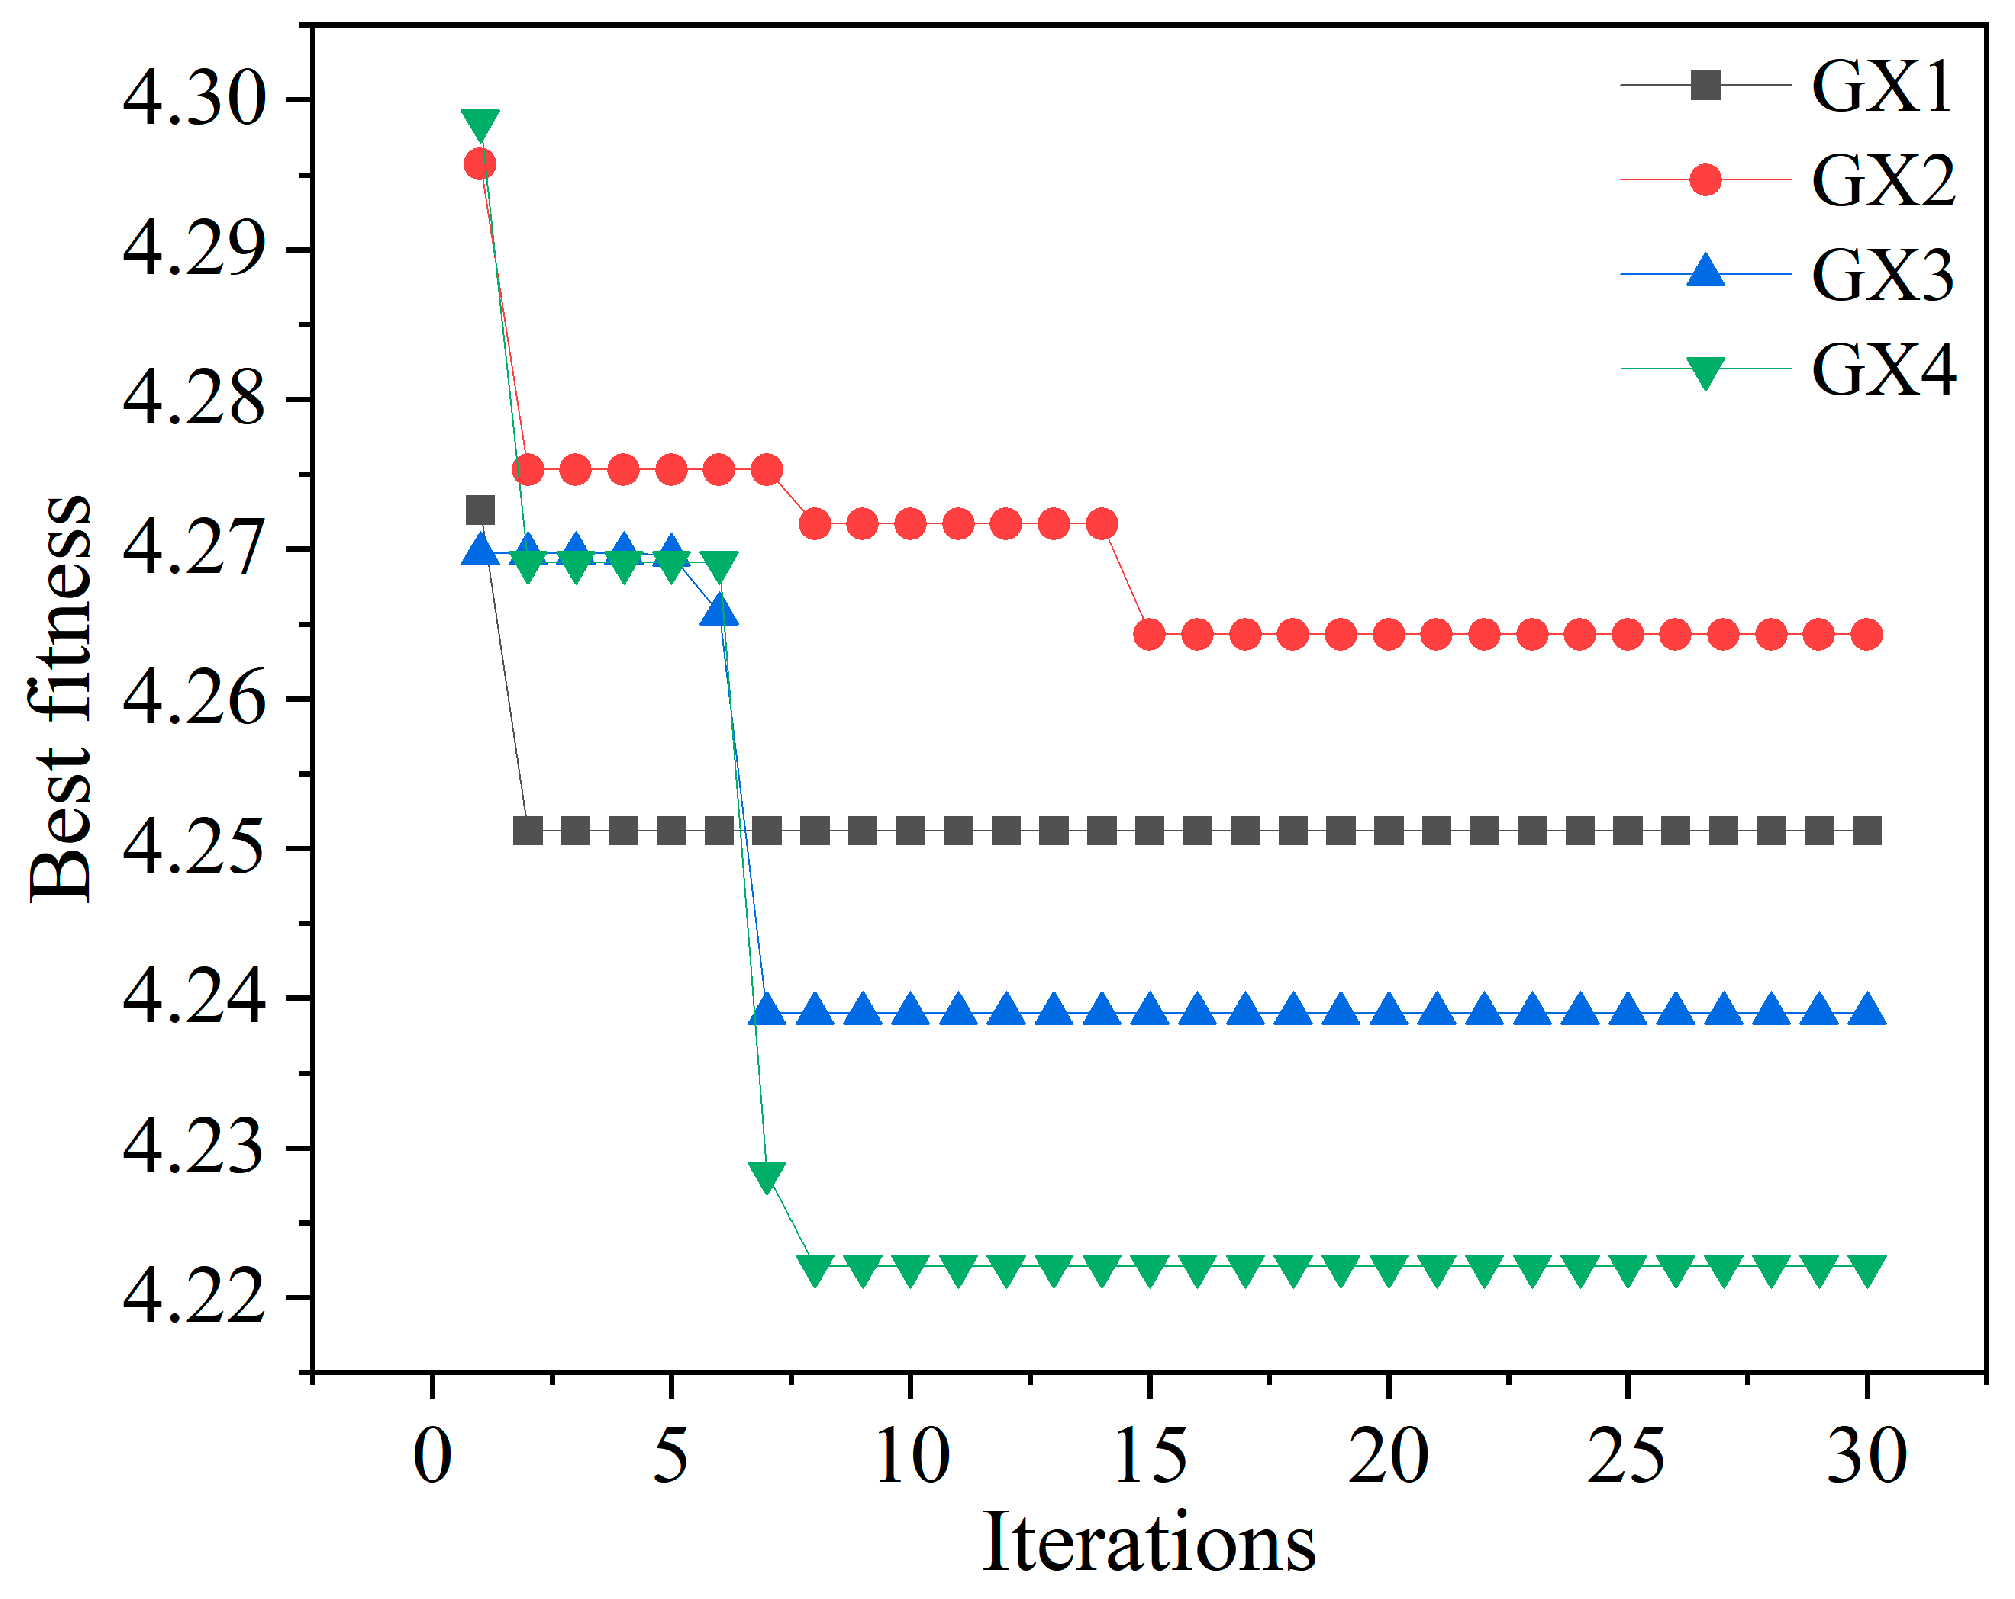
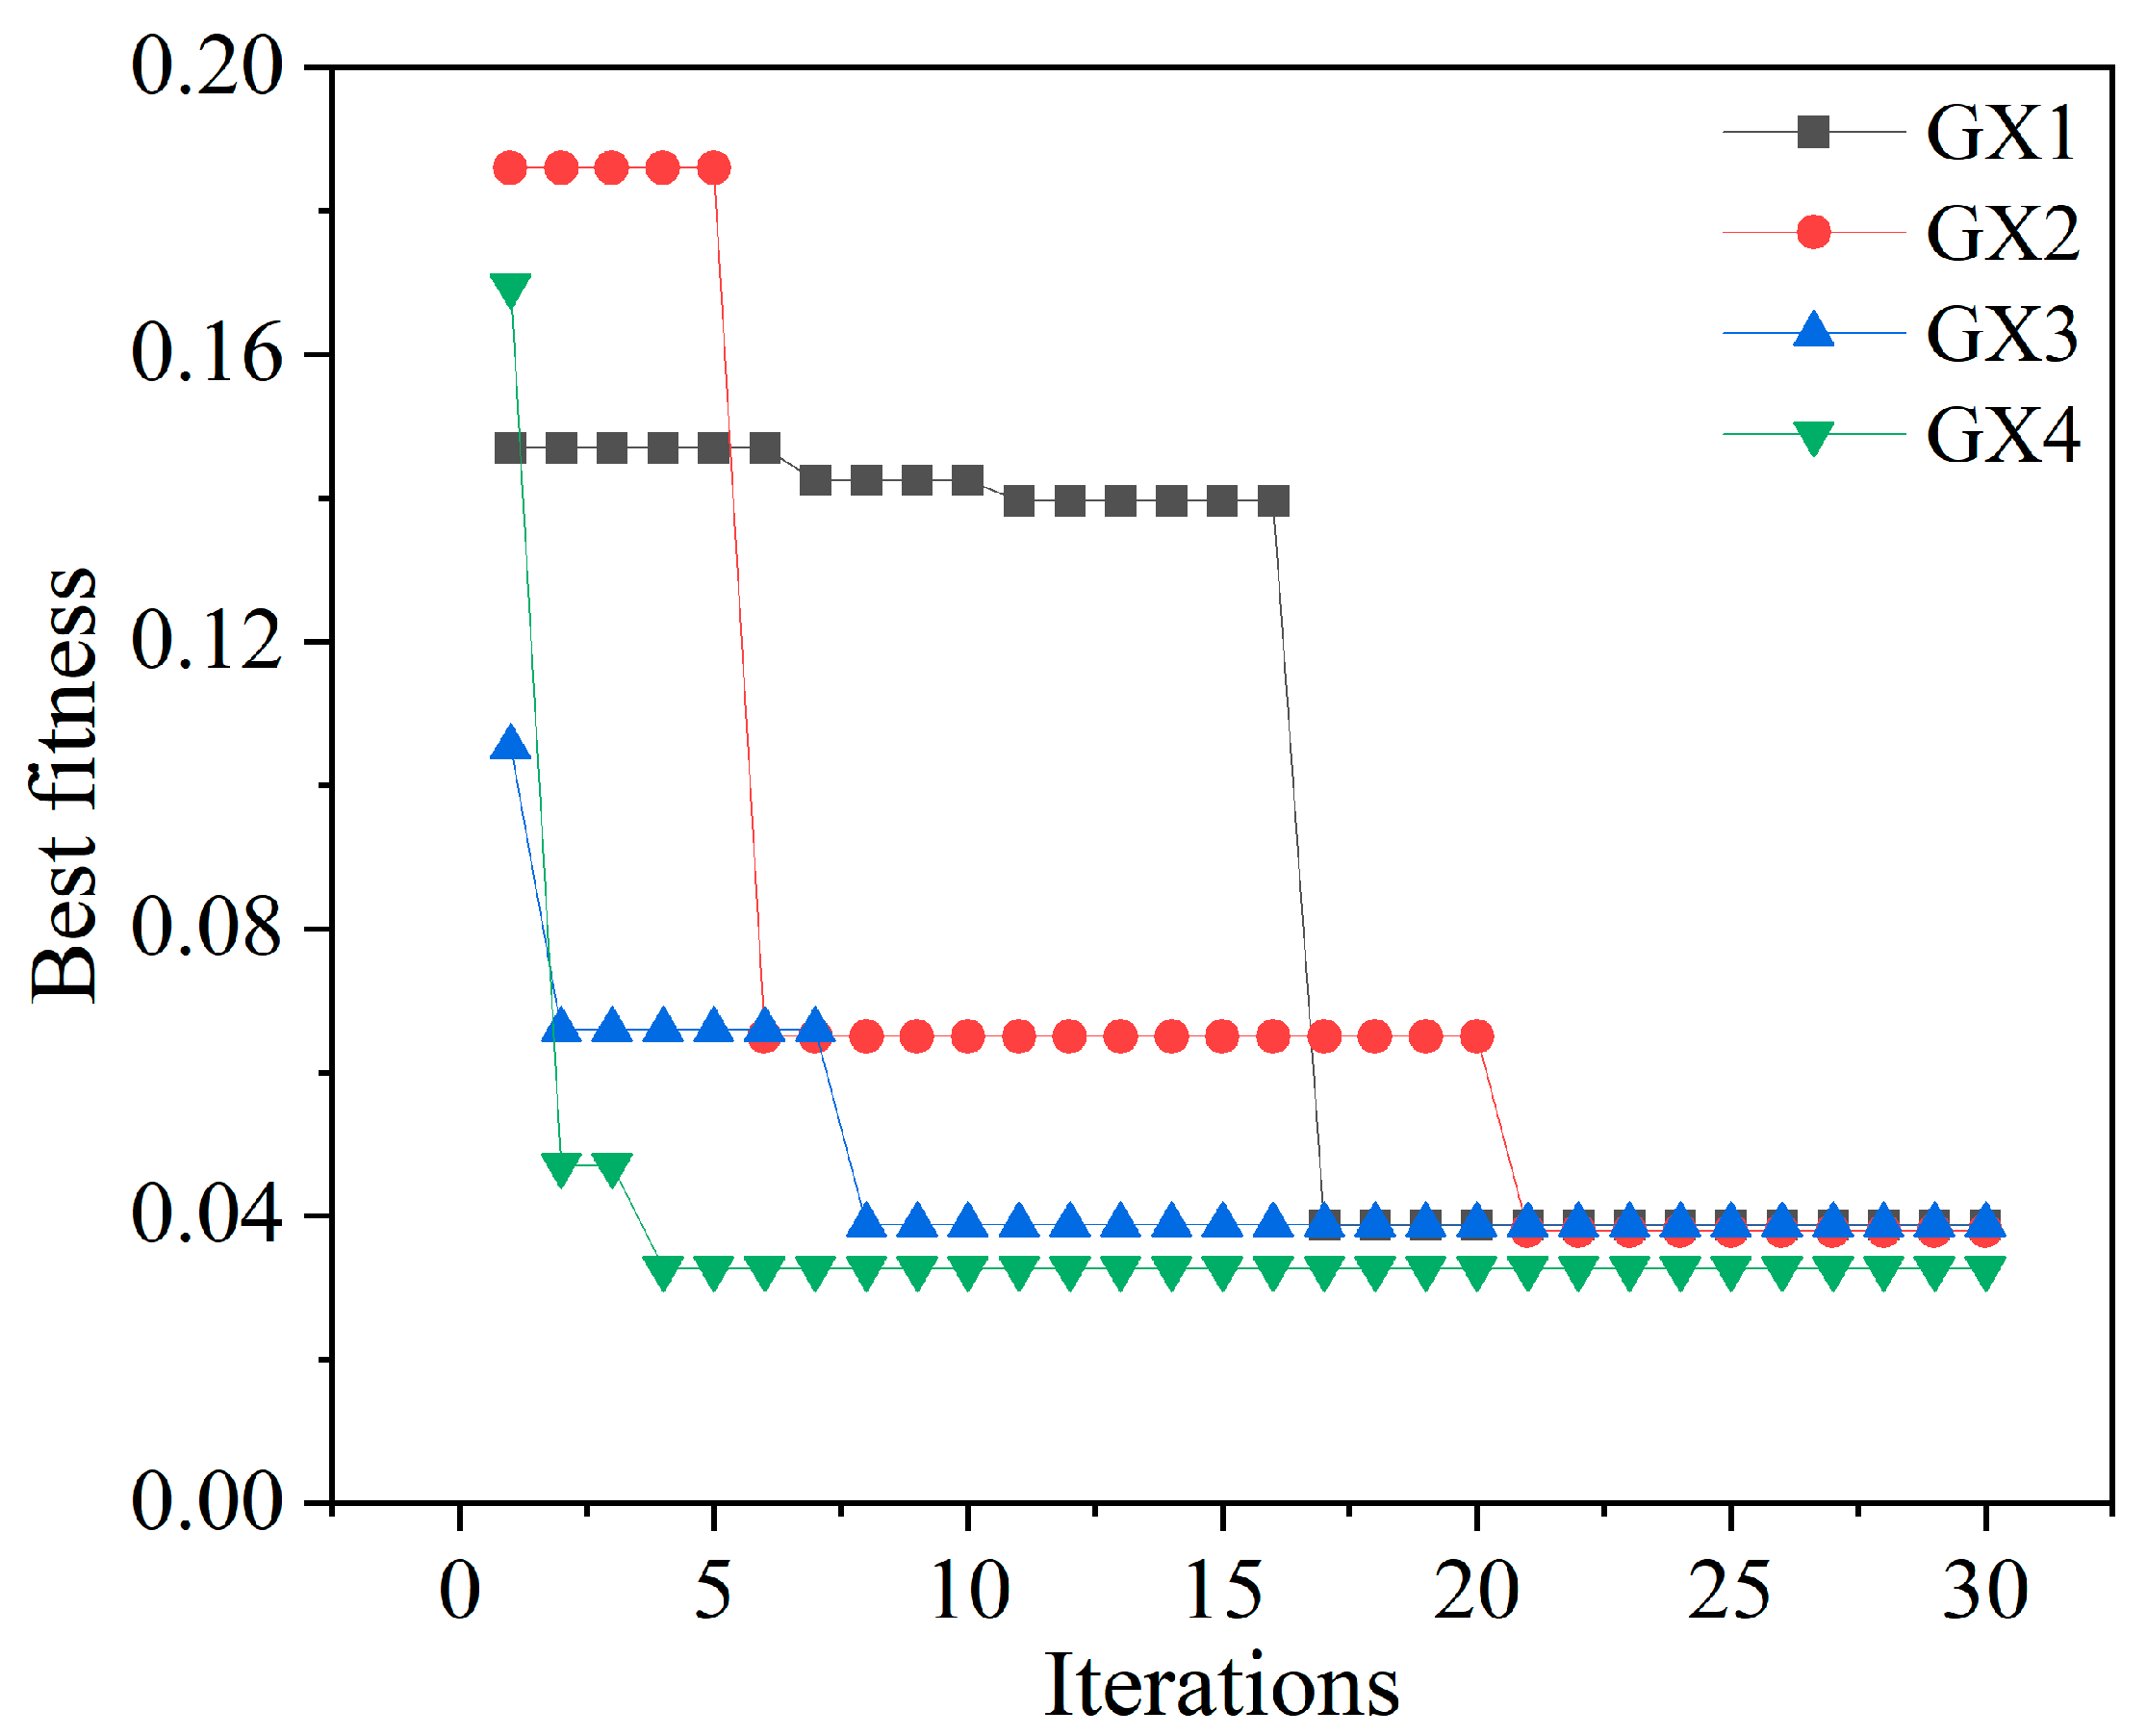
Figure 6 illustrates the minimum envelope entropy curve of the settlement data of adjacent buildings around the foundation pit after decomposition using the proposed GWO-VMD model. The average minimum envelope entropy of the four selected monitoring points (GX1–GX4) was calculated as 4.2468, indicating that the settlement data exhibit significant complexity and dynamic variability. This confirms that the application of GWO-VMD can effectively enhance feature extraction accuracy and decomposition performance.
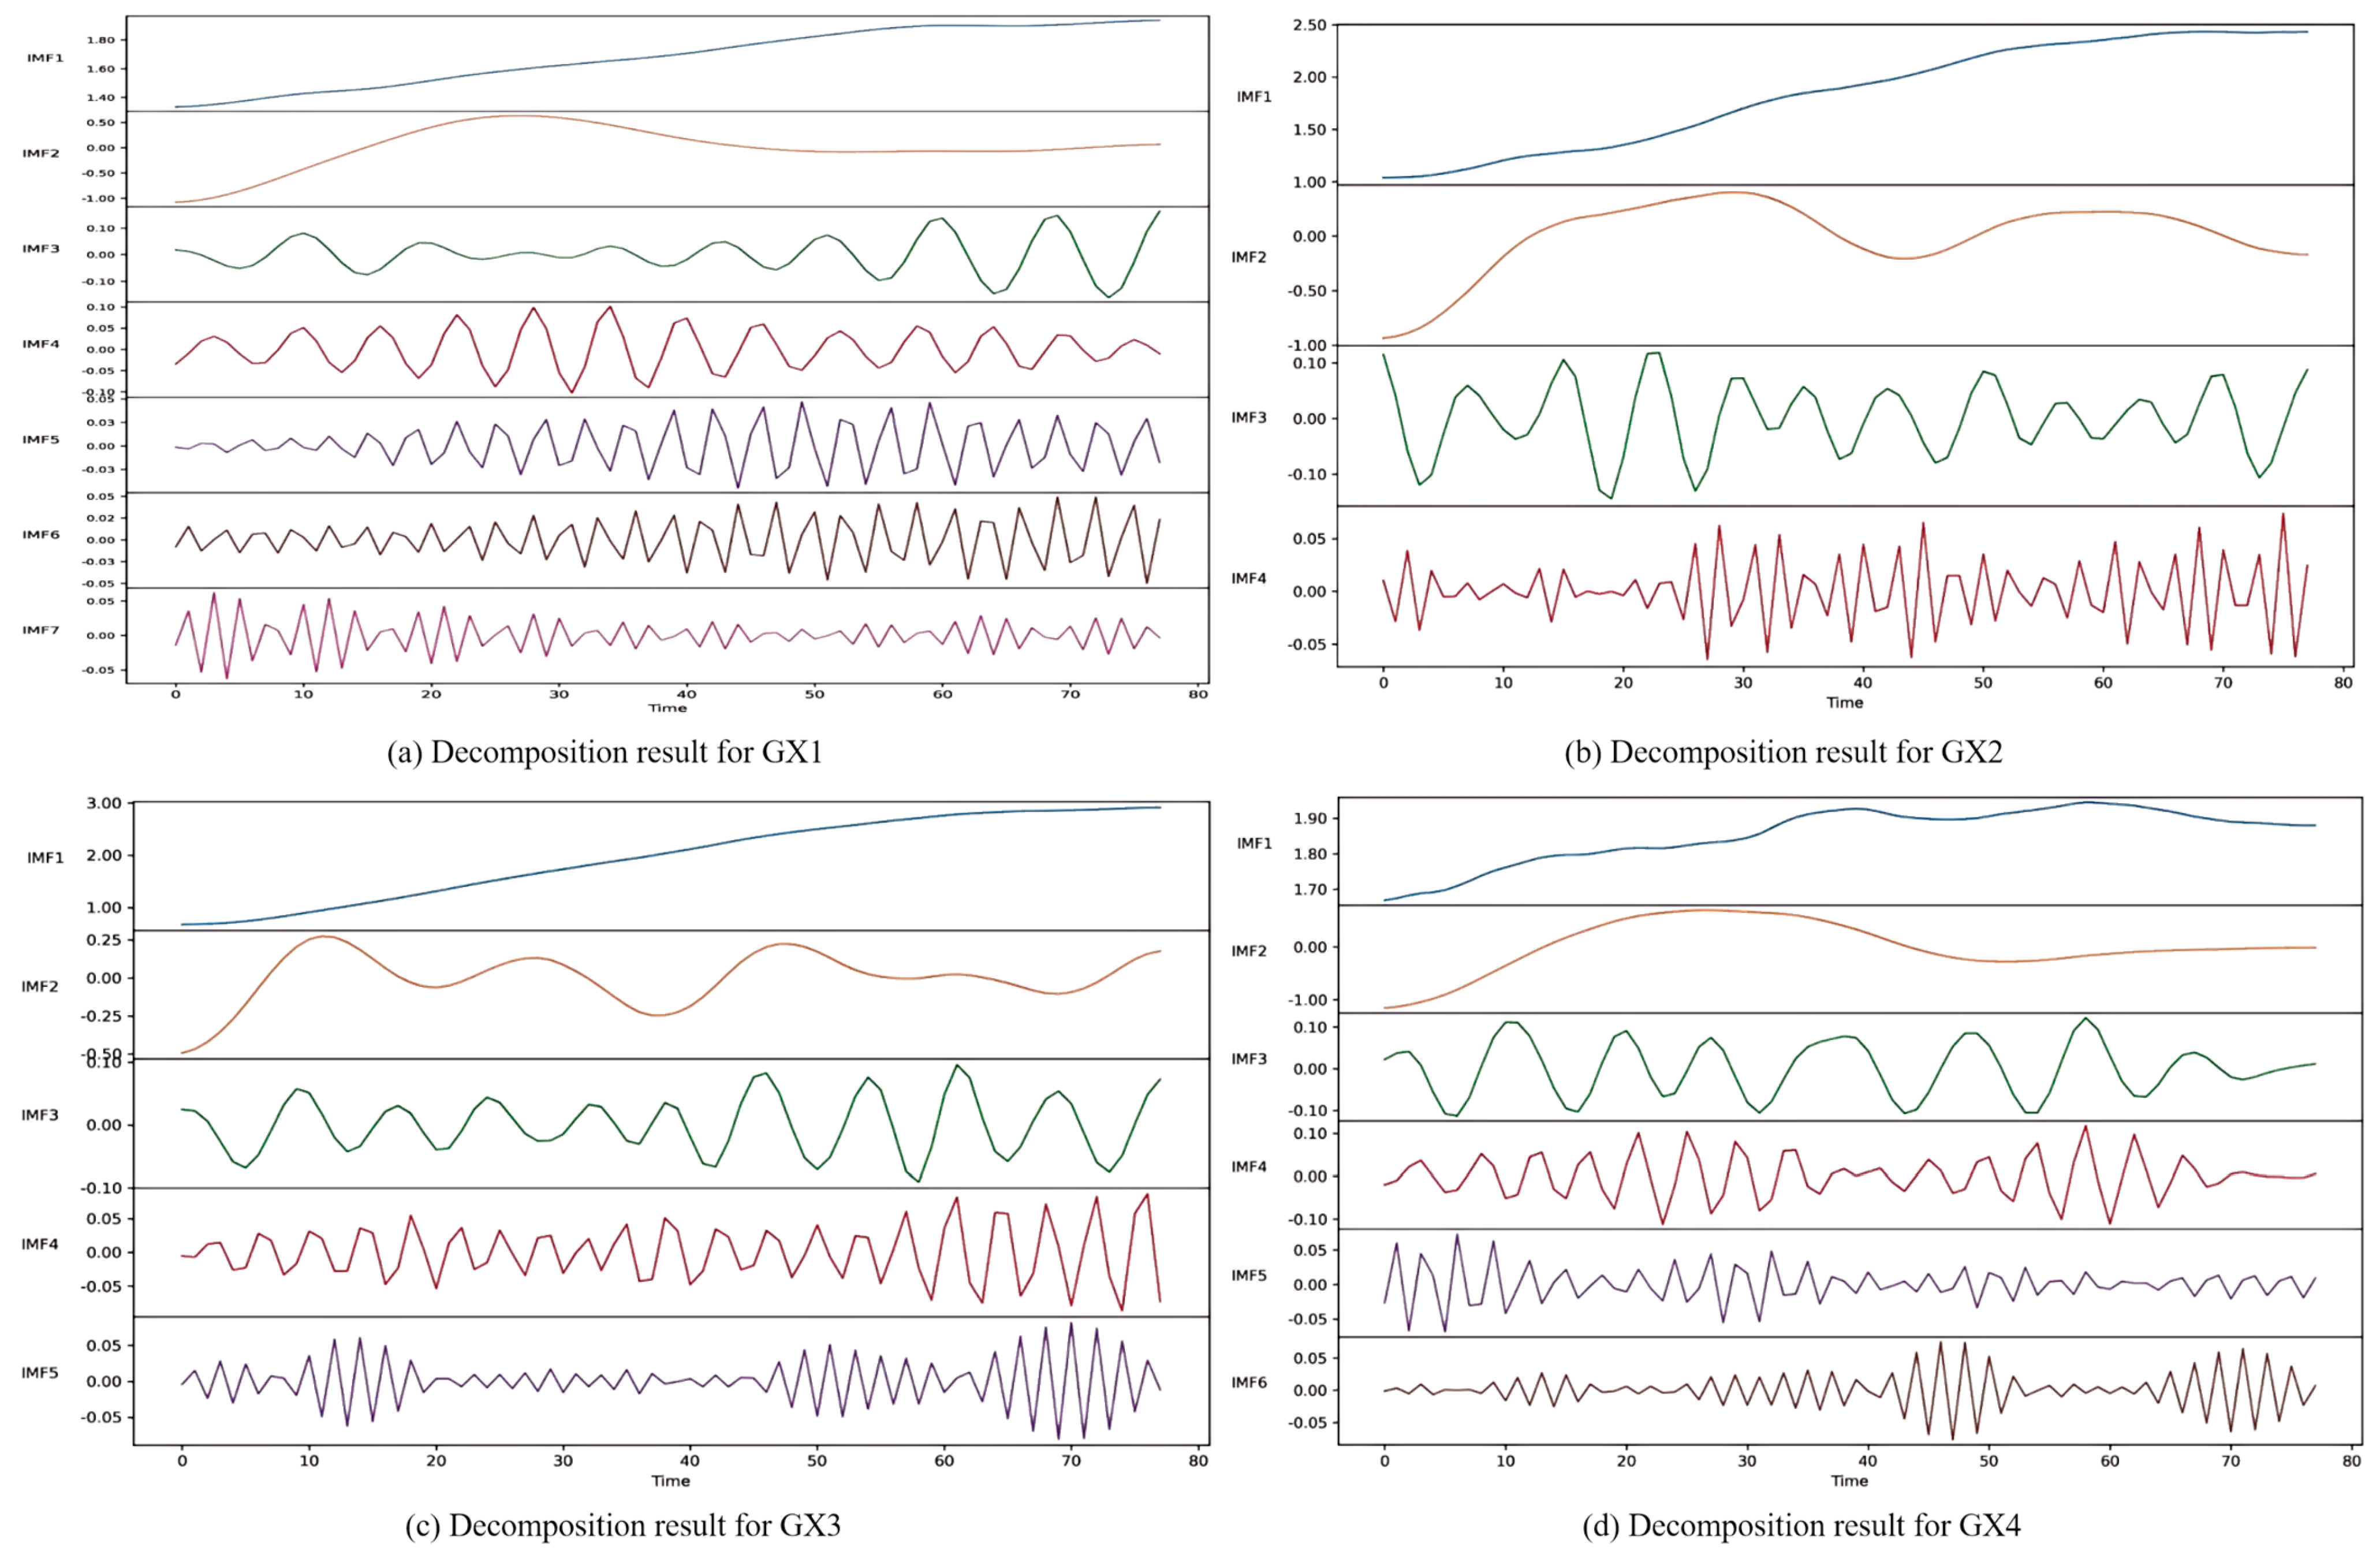
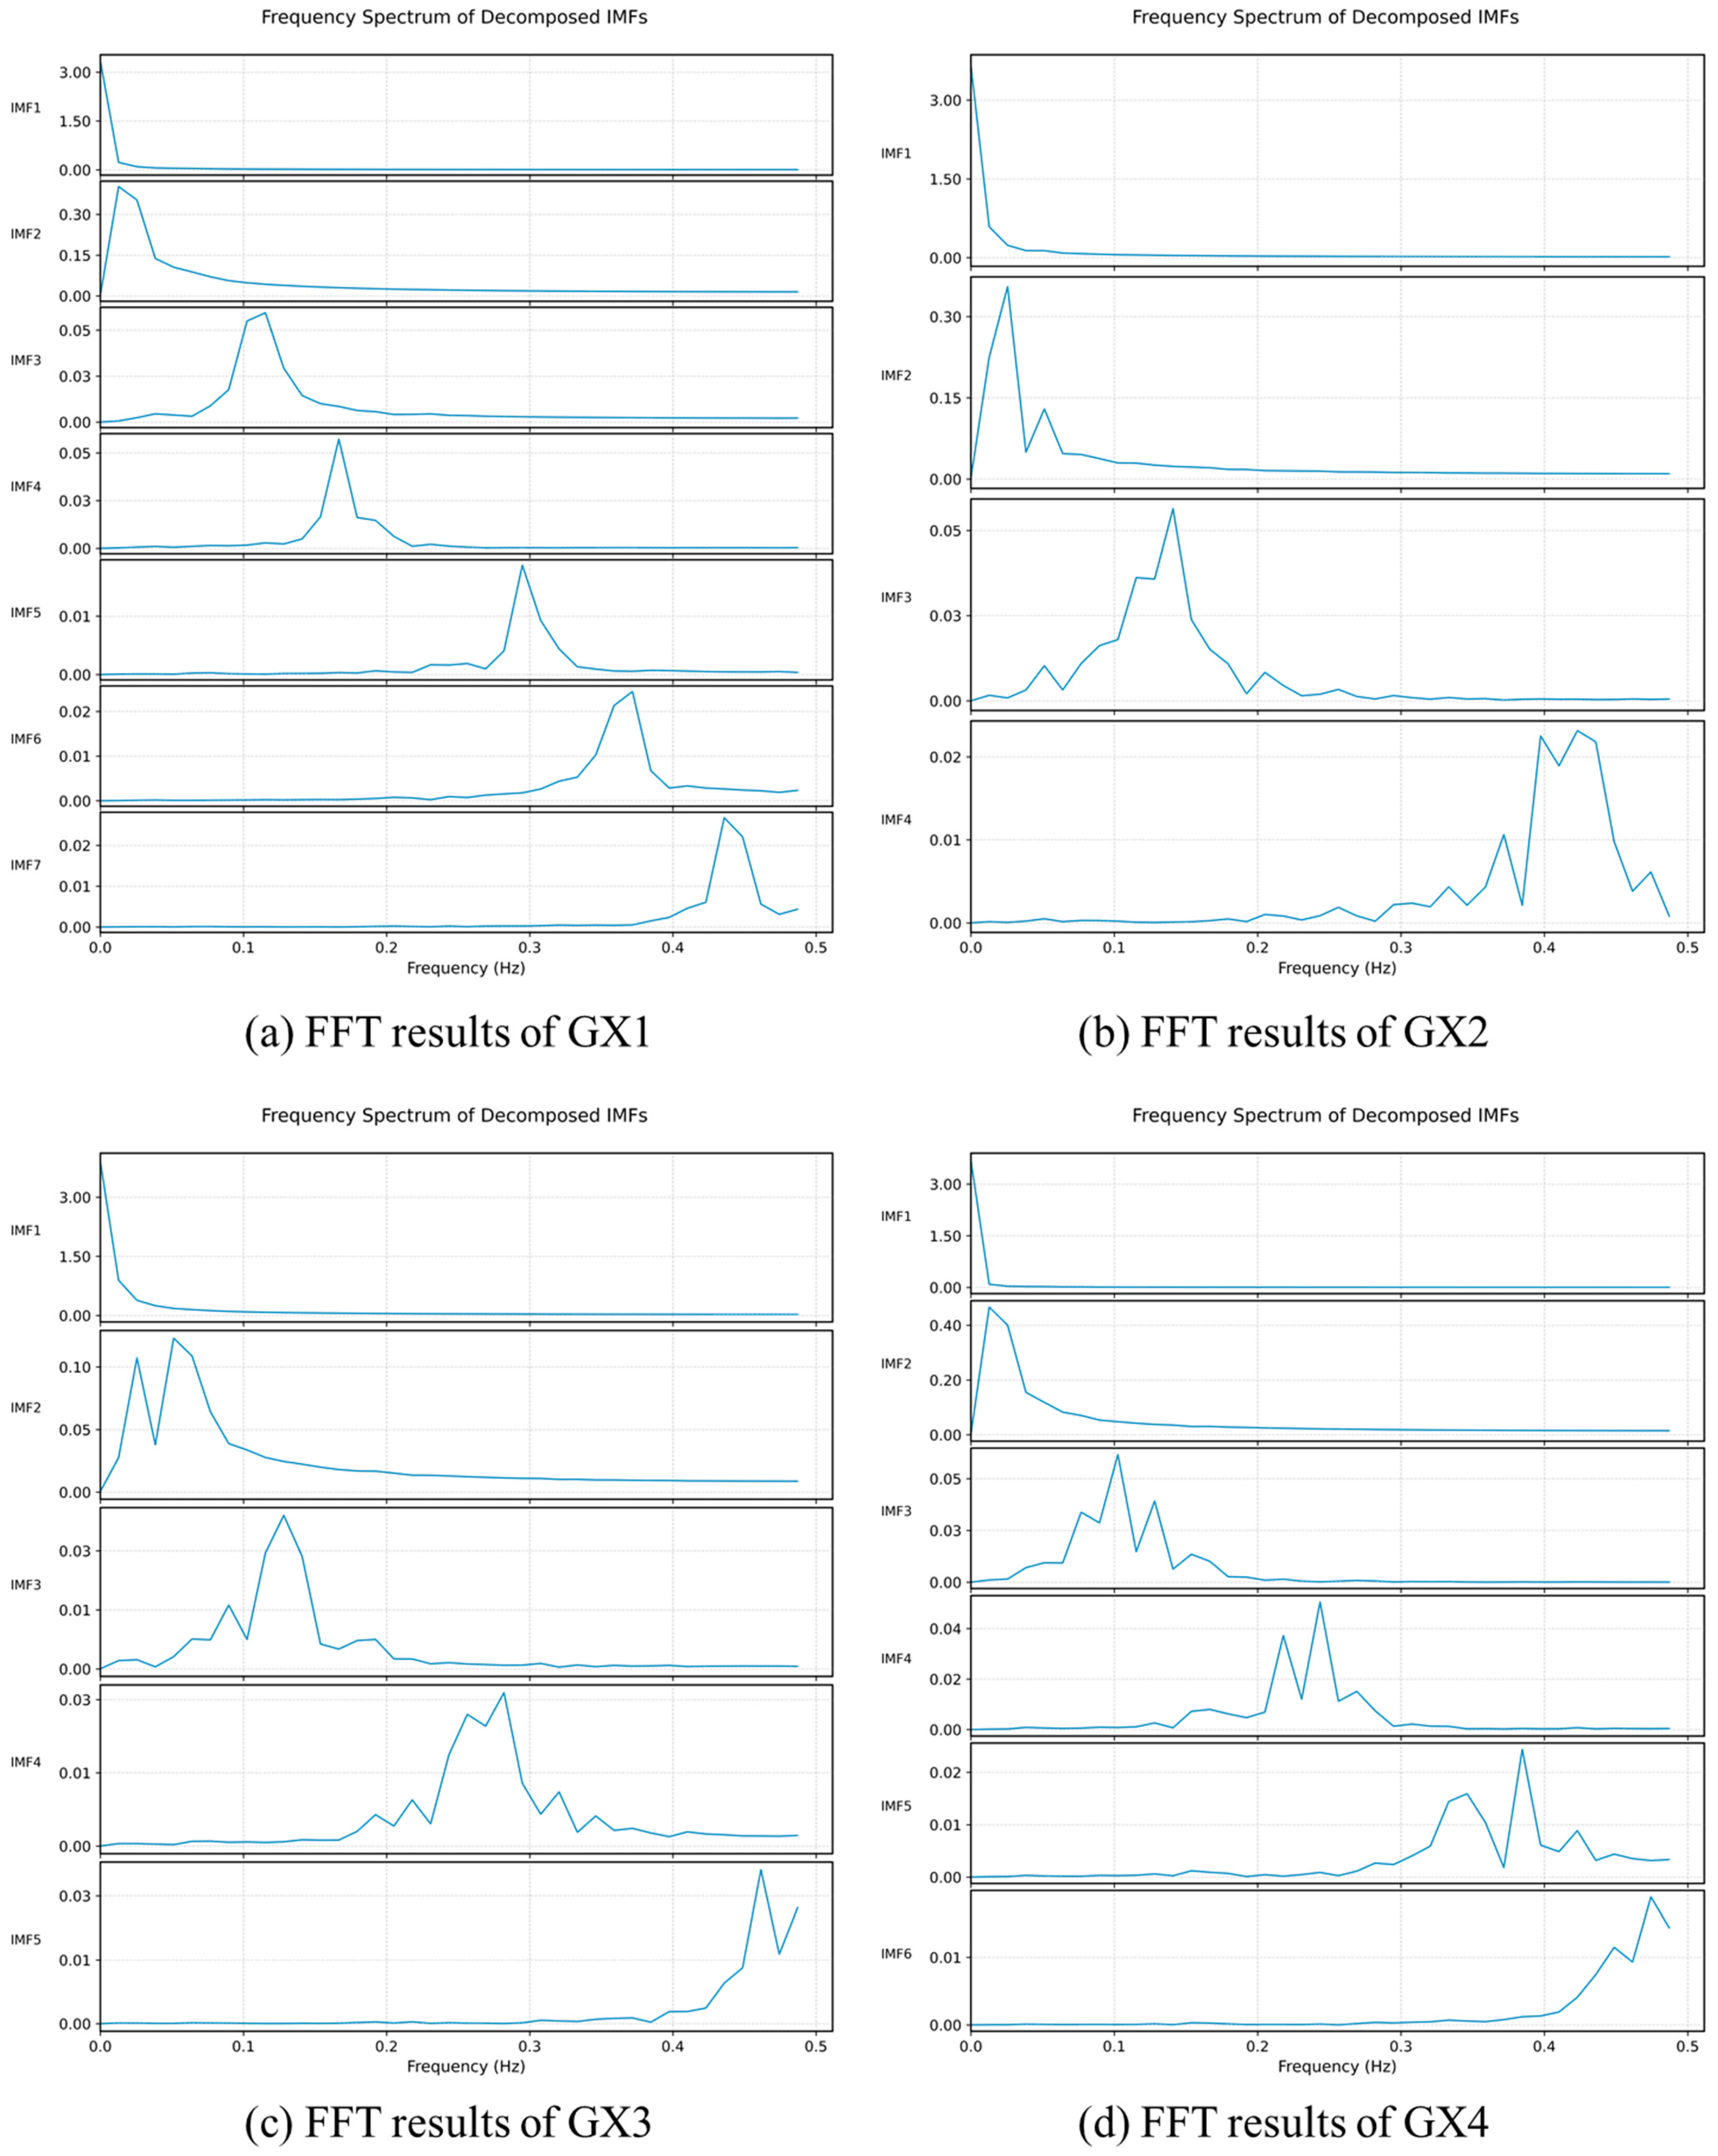
Figure 7 illustrates the settlement data after VMD. To further validate the decomposition results, the fast Fourier transform was applied to the settlement data from the four monitoring points, and the central frequencies of the IMFs obtained by GWO-VMD were calculated.
Figure 8 shows the central frequency distribution of the IMF components. As observed from the figure, the energy of the settlement data is concentrated in distinct frequency bands, demonstrating that the IMF components obtained by GWO-VMD are clearly separated without mode mixing, thereby ensuring their physical interpretability. These findings also further confirm the complexity of the settlement data, which consist of both high-frequency disturbances (e.g., short-term fluctuations and environmental noise) and low-frequency components (e.g., long-term settlement trends and construction-induced deformation).
Following decomposition, GWO was further employed to optimize the hyperparameters of the LSTM model, with the minimization of RMSE defined as the optimization objective. Four key hyperparameters were considered: the number of units [3, 100], the number of epochs [50, 400], the learning rate [0.001,0.1], and the
L2 regularization coefficient [0.0001,0.001].
Figure 9 illustrates the minimum envelope entropy curve of the adjacent building settlement data after using the LSTM model. Through this optimization process, the LSTM network achieved enhanced generalization capability and improved prediction accuracy. The settlement time series decomposed by GWO-VMD were subsequently used as input features, while the original settlement data served as the prediction targets in the proposed GWO-VMD-LSTM model. The optimal
K and
α data of each construction noise data are shown in
Table 2, while the optimal parameters for the LSTM model are shown in
Table 3.
3.4. Comparison of Predictive Performance Among Different Models
To evaluate the predictive performance of the proposed GWO-VMD-LSTM hybrid model, six different model configurations were selected for comparative analysis, including baseline models without GWO optimization and the newly developed hybrid framework. The baseline parameter settings of the unoptimized VMD-GRU and VMD-LSTM models are summarized in
Table 4.
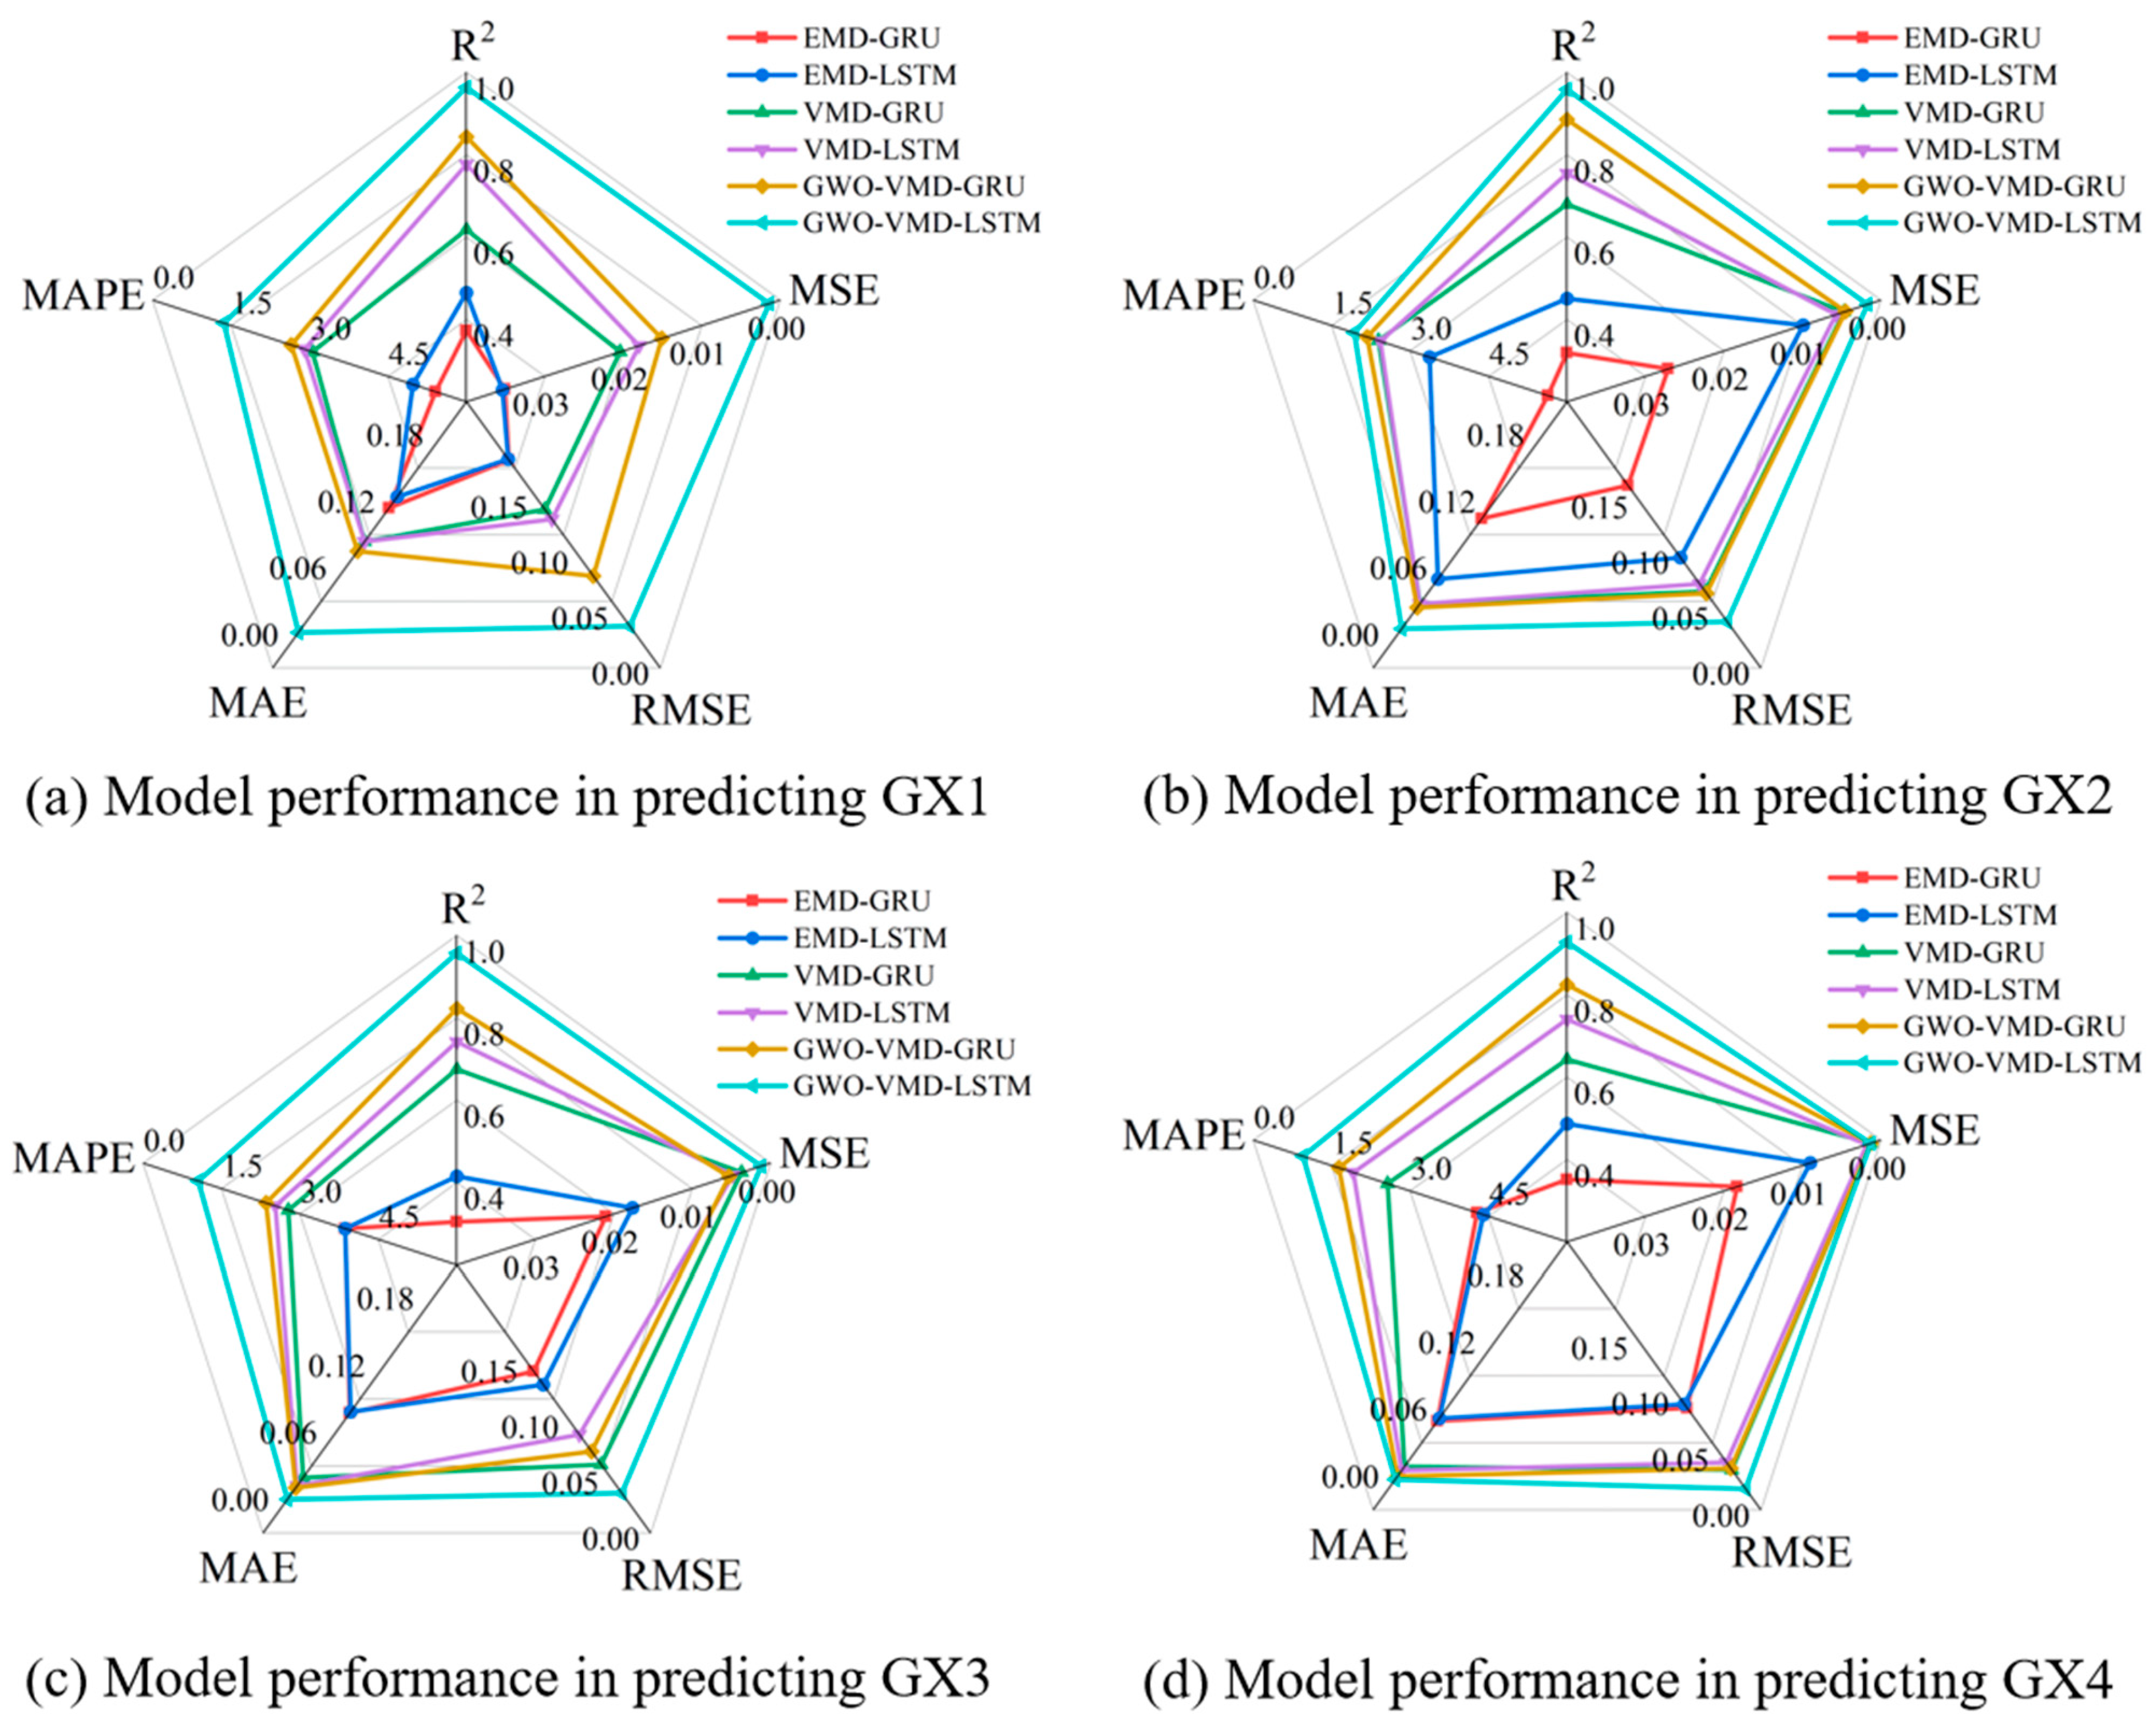
The results demonstrate that the proposed GWO-VMD-LSTM model consistently outperformed all other models in predicting settlement at the four monitoring points around the foundation pit. As shown in
Figure 10, it achieved the lowest values across RMSE, MSE, MAE, and MAPE, while simultaneously attaining the highest R
2, thereby confirming its superior predictive capability.
The comparative results across the four monitoring points (GX1–GX4) reveal clear spatial variability in model performance. At GX1, the prediction accuracy of most models was relatively unsatisfactory. For instance, the baseline EMD-LSTM achieved an R2 of only 0.465, with a high RMSE of 0.1883, but the proposed GWO-VMD-LSTM improved R2 to 0.964, with a relatively lower RMSE of 0.0379 compared to other models. This indicates that the inherent noise and irregular patterns in GX1 data may have constrained the models’ fitting capacity. In contrast, both GX2 and GX3 demonstrated more stable predictive performance, where the proposed GWO-VMD-LSTM consistently achieved the best trade-off between accuracy and error. Specifically, at GX2, the model yielded an R2 of 0.959, RMSE of 0.0418, MAE of 0.0354, and MAPE of only 1.933%; at GX3, the R2 remained high at 0.957, with RMSE and MAE of 0.0359 and 0.0303, respectively. These results confirm the robustness of the hybrid decomposition–optimization framework under moderately complex settlement signals.
The predictive error was the smallest at GX4, where the proposed model achieved an R2 of 0.928, RMSE of 0.0191, and MAPE of only 0.953%, representing the lowest error values among all four sites. It is noteworthy that despite a slight decrease in R2 compared with GX2 and GX3, the dramatic reduction in error indices suggests that the model captures the settlement dynamics at GX4 with greater precision.
Overall, these findings indicate that the proposed GWO-VMD-LSTM model consistently outperforms alternative approaches across all monitoring points, with particularly remarkable improvements in MAE and MAPE. However, the variation in R2 among sites also highlights the influence of local signal characteristics and structural conditions on model performance.
Although the GWO-VMD-GRU model also exhibited competitive performance, its average accuracy remained slightly inferior to that of the GWO-VMD-LSTM model. This difference can be attributed to the inherent structural characteristics of GRU: while its simplified gating mechanism improves computational efficiency, it is less effective than LSTM in capturing the long-term dependencies inherent in settlement time-series data.
Furthermore, a comparative analysis of decomposition techniques revealed that VMD-LSTM significantly outperformed EMD-LSTM across all evaluation metrics. This disparity is primarily due to the susceptibility of EMD to mode mixing during decomposition, which compromises the quality of the IMF components. In contrast, VMD provides more stable and physically meaningful decompositions, thereby reducing errors, particularly when handling signals with high-frequency noise.
In terms of computational efficiency, the proposed GWO-VMD-LSTM model was able to complete both training and testing within three minutes, while maintaining excellent predictive accuracy.
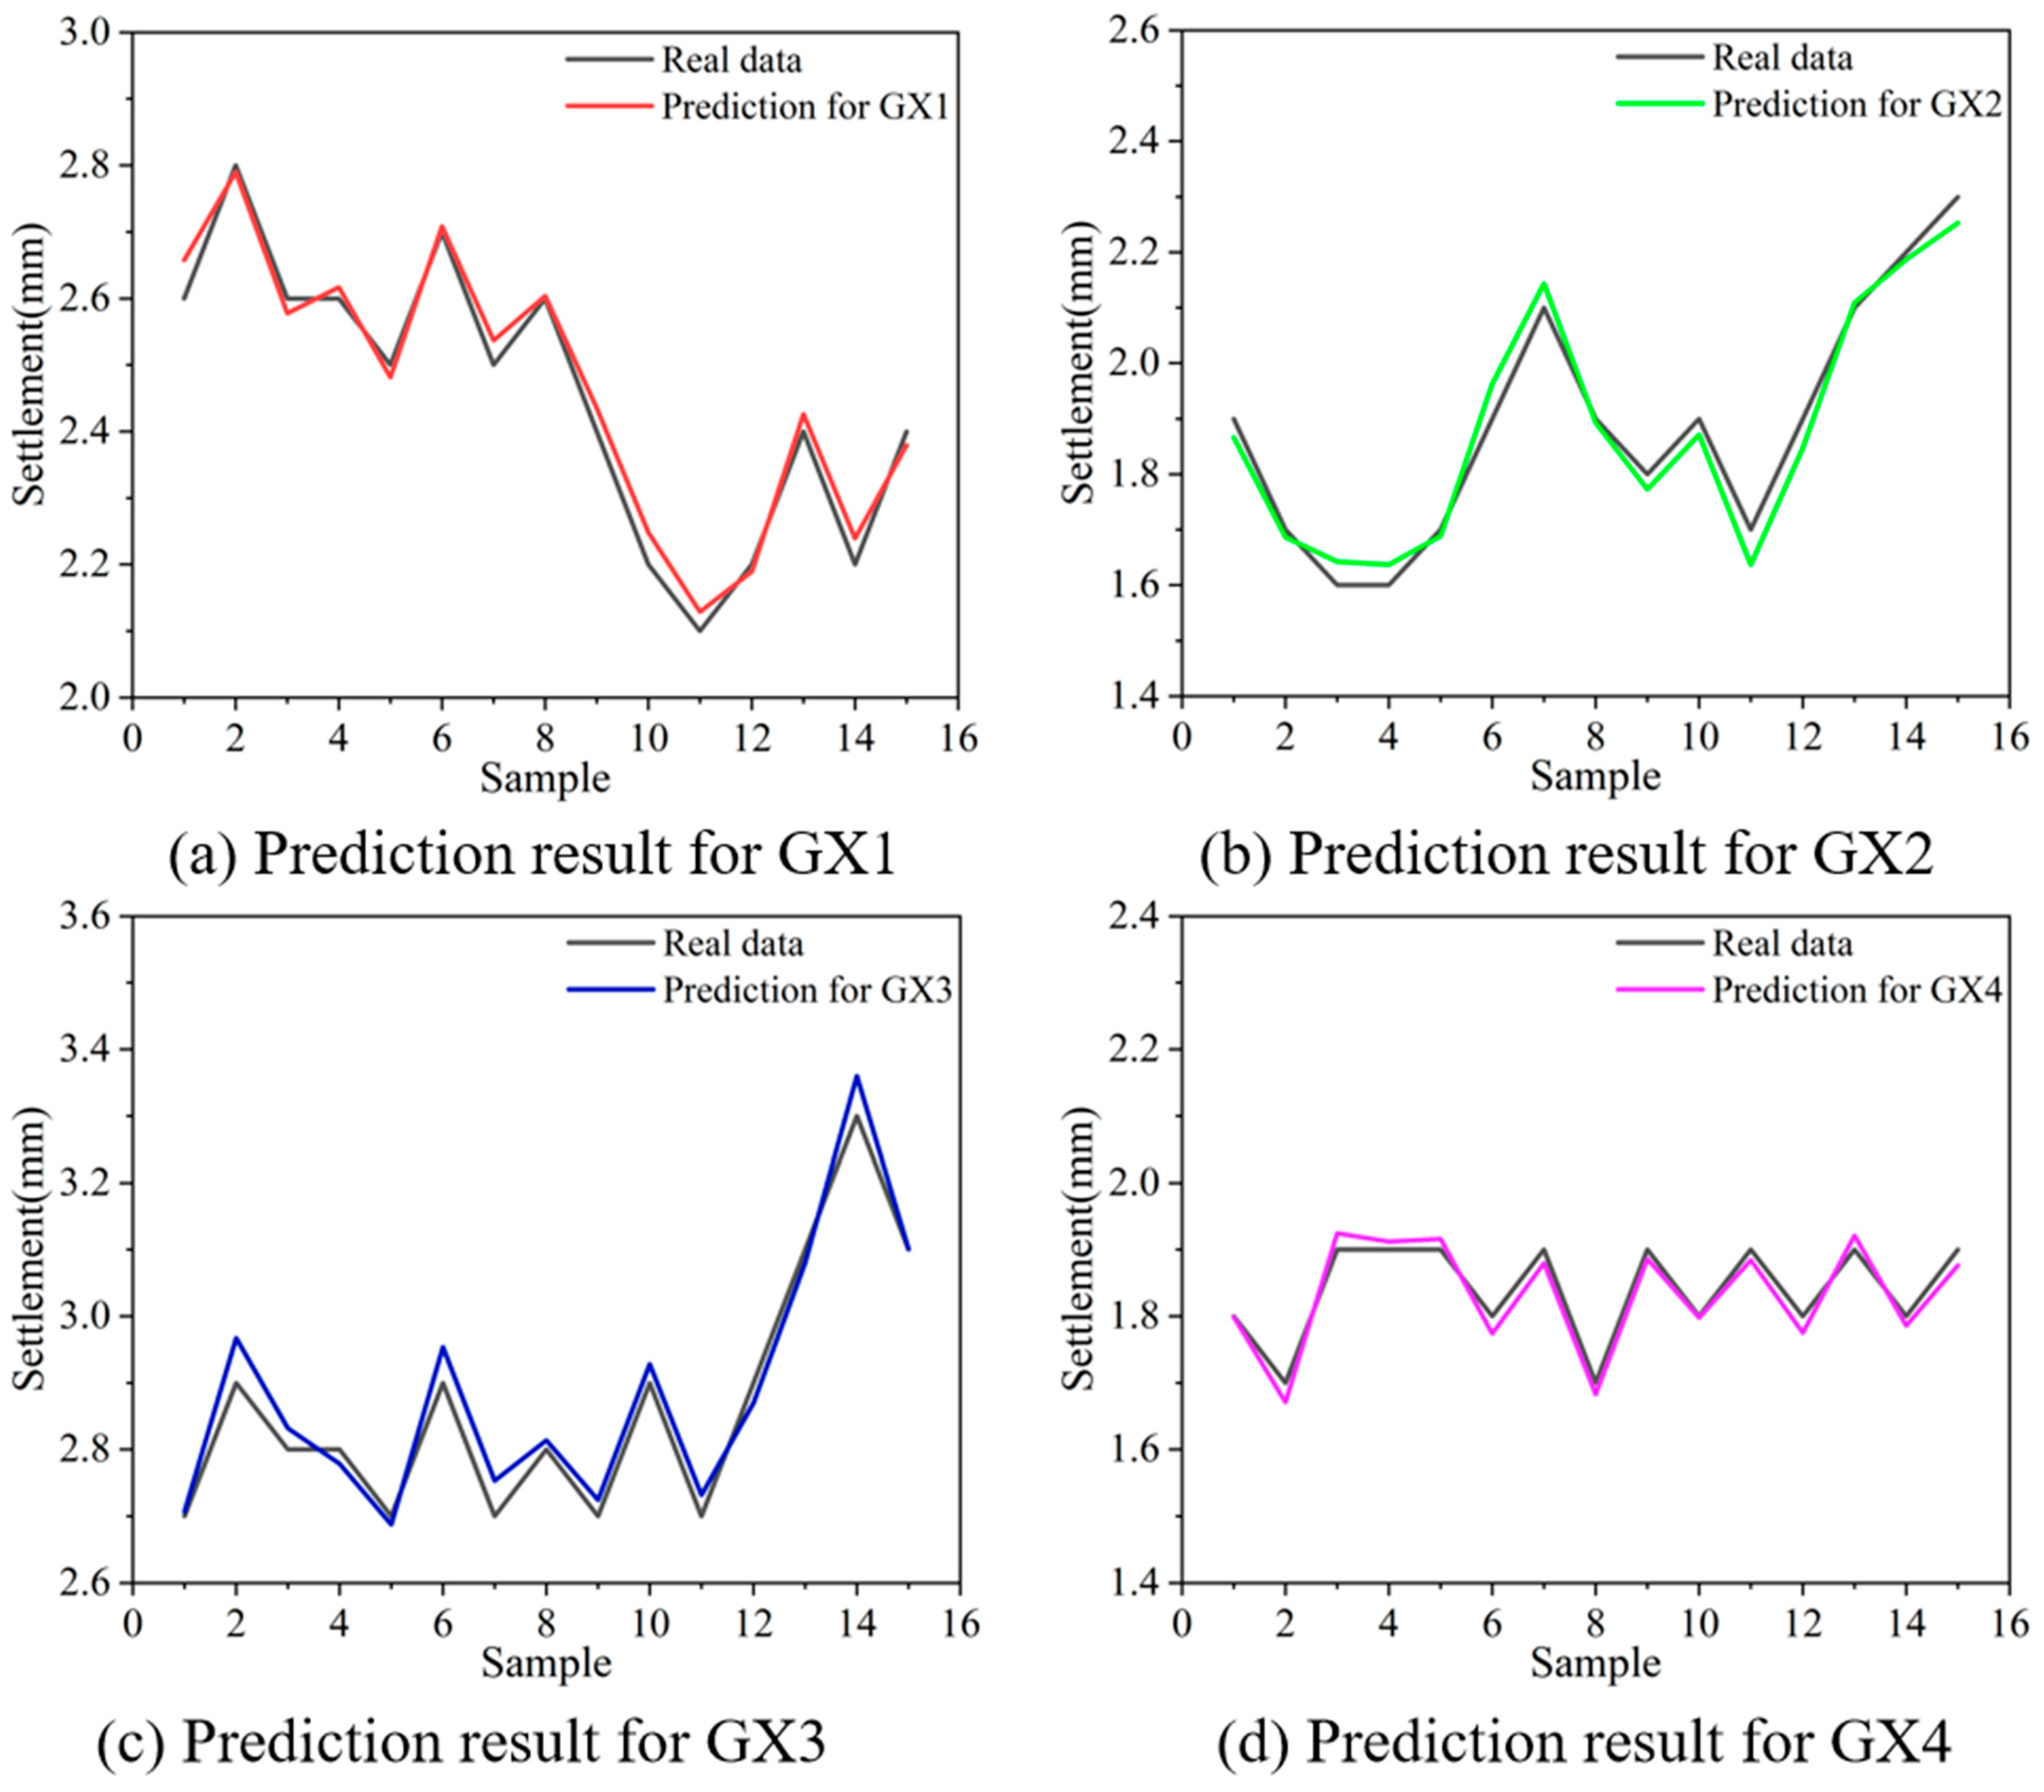
Figure 11 illustrates the prediction results at the four monitoring points, showing that the model reliably captured both short-term fluctuations and long-term settlement trends. The comprehensive evaluation metrics further confirmed that prediction errors remained consistently low and R
2 values consistently high across all monitoring points. These findings not only validate the model’s predictive accuracy but also underscore its robustness and reliability for practical engineering applications.
4. Discussion
The results presented in
Table 5 and
Table 6 demonstrate that the proposed GWO-VMD-LSTM model exhibits superior performance in predicting the settlement of buildings surrounding deep foundation pits. Specifically, the model achieved a coefficient of determination (R
2) of 0.951 across the four monitoring points, representing an improvement of 26.5% over VMD-LSTM (0.752) and an enhancement of 109.5% compared with the traditional EMD-LSTM (0.454). In terms of error metrics, the mean squared error (MSE) of the GWO-VMD-LSTM was only 0.002, approximately one-ninth of that of EMD-LSTM (0.018). The root mean square error (RMSE = 0.033 mm) decreased by 61.2% compared with VMD-LSTM (0.085 mm) and by 74.4% relative to EMD-LSTM (0.129 mm). Similarly, the mean absolute error (MAE) and mean absolute percentage error (MAPE) were reduced to 0.031 mm and 1.324%, respectively, which are substantially lower than those of all benchmark models (e.g., VMD-GRU: MAE = 0.065 mm, MAPE = 2.699%).
These findings underscore the critical role of GWO optimization in this study. On the one hand, GWO enables global hyperparameter tuning for VMD, thereby achieving more precise decomposition of different frequency components and avoiding the instability often caused by empirical parameter settings. On the other hand, the optimized VMD results, when coupled with LSTM networks, significantly enhance the model’s fitting ability and generalization performance. Notably, even for the same deep learning architecture, the predictive performance varies considerably depending on whether GWO optimization is applied. For example, the RMSE of GWO-VMD-LSTM was only 0.033 mm, whereas that of the non-optimized VMD-LSTM was 0.085 mm, representing a reduction of more than 60%. Similarly, GWO-VMD-GRU consistently outperformed VMD-GRU across all evaluation metrics, further highlighting the pivotal contribution of GWO to performance improvement.
In addition, comparison of decomposition methods reveals that VMD is markedly superior to EMD. Under EMD, the models generally produced larger errors and lower R2 values (e.g., EMD-GRU, R2 = 0.372). This is mainly attributed to the mode-mixing problem inherent in EMD when dealing with nonlinear and non-stationary signals. By contrast, VMD employs a constrained optimization framework that yields cleaner frequency separation, enabling subsequent models to capture more stable and physically meaningful features, thereby improving predictive accuracy.
Finally, the comparison of network architectures demonstrates the overall superiority of LSTM over GRU in settlement prediction tasks. Although the GRU network has a simpler structure and higher computational efficiency, it performs less effectively than LSTM in capturing the long-term temporal dependencies inherent in settlement time series. To further quantify the trade-off between accuracy and training efficiency, a comparative experiment was conducted under identical computing conditions (ASUS Laptop (Produced in Jiangsu Province, China, equipped with an AMD Ryzen 7 5800H processor and 32GB of RAM)). The GWO-VMD-LSTM model required an average of 3.1 min for full training and testing, whereas the GWO-VMD-GRU completed the process in approximately 2.2 min, achieving about 29% faster training speed. However, this computational advantage was accompanied by a moderate reduction in predictive accuracy: the average coefficient of determination (R2) decreased from 0.951 (LSTM) to 0.843 (GRU), and the mean absolute percentage error (MAPE) increased from 1.324% to 2.205%. Consistent trends were also observed in models without GWO optimization. For instance, the R2 of VMD-LSTM reached 0.752, compared with 0.653 for VMD-GRU, confirming that LSTM maintains superior performance even without global parameter optimization. Overall, these findings indicate that while the GWO-VMD-GRU model is preferable for real-time or resource-limited monitoring scenarios, the GWO-VMD-LSTM model remains more suitable for high-precision and long-term settlement forecasting, owing to its stronger ability to capture complex and long-range temporal dependencies.
As shown in
Table 7, the proposed GWO-VMD-LSTM model demonstrates a clear improvement in prediction performance compared with the study “Predicting existing tunnel deformation from adjacent foundation pit construction using hybrid machine learning.” The coefficient of determination (R
2) increased from 0.919 to 0.951, indicating that the proposed model explains a greater proportion of the variance in the target variable. Furthermore, all error-related metrics—MSE, RMSE, MAE, and MAPE—show significant reductions. The MSE decreased to 0.002, while RMSE and MAE declined from 0.112 and 0.106 to 0.033 and 0.031, respectively. The MAPE dropped from 3.94% to 1.324%, demonstrating a remarkable enhancement in predictive accuracy. These results suggest that the proposed GWO-VMD-LSTM model possesses stronger capability in capturing the nonlinear and non-stationary characteristics of deformation data compared with the aforementioned study. The VMD module effectively decomposes complex signals into intrinsic components, thereby improving feature representation, while the GWO algorithm optimizes the LSTM parameters for faster convergence and more stable performance. Consequently, the hybrid integration achieves superior robustness and generalization ability, yielding more accurate and consistent predictions than those reported in the related research.
Beyond soft-soil conditions, the proposed GWO-VMD-LSTM framework can be extended to other geological contexts such as sandy soils, low-compressibility cohesive soils, and mixed soil layers. The current parameter search ranges of GWO already cover a broad spectrum of possible VMD and learning parameters observed in practice; thus, model adaptation does not require adjusting these ranges manually. Instead, the GWO can be re-executed on new site data to automatically identify the optimal parameter combination within the existing bounds. This procedure preserves methodological consistency while allowing the model to adapt flexibly to site-specific signal characteristics. Consequently, the framework maintains its predictive robustness and generalization capability across diverse geotechnical environments.
5. Conclusions
Settlement prediction plays a pivotal role in ensuring foundation pit safety and enabling proactive risk management. However, traditional approaches often struggle to balance accuracy, efficiency, and cost-effectiveness, while many existing machine learning models still exhibit limitations in predictive accuracy, generalization capability, and practical applicability. In this context, based on settlement monitoring data of buildings adjacent to the Yongning Hospital foundation pit in Huangyan District, Taizhou City, collected from April to June 2023, this study proposes and develops a novel and efficient prediction model (GWO-VMD-LSTM) with the aim of achieving high-precision and rapid settlement forecasting. The main conclusions of this study are as follows:
(1) The application of VMD effectively addresses the problem of insufficient input information commonly encountered in time-series prediction. Compared with EMD, VMD demonstrates superior decomposition capability for settlement data, thereby providing a more reliable basis for subsequent modeling.
(2) For settlement data collected under different monitoring points and varying engineering conditions, the GWO is capable of identifying optimal parameters for both VMD and the LSTM network. This ensures that the two components operate at their best performance. Consequently, the proposed GWO-VMD-LSTM model achieves significantly higher prediction accuracy compared with the conventional VMD-LSTM framework.
(3) The average performance indicators of the GWO-VMD-LSTM model—coefficient of determination (R2 = 0.951), mean squared error (MSE = 0.002), root mean square error (RMSE = 0.0336 mm), mean absolute error (MAE = 0.0313 mm), and mean absolute percentage error (MAPE = 1.324%)—collectively demonstrate that this model outperforms all benchmark models considered in this study. These results confirm its capability to achieve highly accurate predictions of the settlement of surrounding buildings of the foundation pit.
Future research will focus on extending the model to scenarios with larger settlement magnitudes to further validate its predictive robustness under extreme deformation conditions.
In summary, this study developed a novel GWO-VMD-LSTM model for settlement assessment, integrating the Grey Wolf Optimizer, Variational Mode Decomposition, and Long Short-Term Memory networks. The proposed model is particularly well-suited for soft soil strata with similar geotechnical characteristics, and it can reliably perform short-term settlement prediction without requiring complex multi-source data integration. Moreover, it demonstrates superior predictive accuracy, generalization capability, and operational simplicity, thereby providing robust technical support for on-site settlement monitoring and risk early warning, and showing promising potential for practical engineering applications.
