Article

Creep and Fatigue Life Prediction of Bulk-Polymerized Spliced Acrylic

1
School of Civil and Hydraulic Engineering, Huazhong University of Science and Technology, Wuhan 430074, China
2
China Resources Land Limited, Shenzhen 518000, China
3
Department of Civil Engineering, Tsinghua University, Beijing 100084, China
4
Donchamp (Jiangsu) Materials Technology Co., Ltd., Taixing 225400, China
*
Author to whom correspondence should be addressed.
Buildings 2025, 15(20), 3677; https://doi.org/10.3390/buildings15203677 (registering DOI)
Submission received: 7 August 2025 / Revised: 8 September 2025 / Accepted: 9 October 2025 / Published: 13 October 2025
(This article belongs to the Section Building Materials, and Repair & Renovation)

Abstract

To evaluate the creep and fatigue fracture lives of structural acrylic spliced components fabricated via bulk polymerization, and to elucidate the associated fracture mechanisms, this study conducted creep and fatigue tests on spliced coupons annealed at 85 °C and 65 °C, as well as base material coupons. The experimental life data were fitted using log-log linear regression models. Based on statistical analysis, a simple yet robust statistical framework was established for life prediction, featuring three design curves: 97.7% survival curves, improved 95% confidence interval lower bounds, and one-sided tolerance curves. Fractographic examination using scanning electron microscopy (SEM) was performed to characterize macroscopic failure modes. The results indicate distinct threshold behavior between stress levels and both creep and fatigue life. The creep threshold stresses are 25 MPa for the base material, 29 MPa for the spliced coupons annealed at 85 °C, and 17 MPa for the spliced coupons annealed at 65 °C. Corresponding fatigue threshold stress amplitudes are 21 MPa, 22 MPa, and 31 MPa, respectively. Failure in the base material is primarily initiated by randomly distributed internal defects, whereas failure in the spliced coupons is mainly caused by defects within the seam or interfacial tearing.

1. Introduction

Acrylic (PMMA), due to its high optical transparency [1], excellent formability [2], superior weather resistance [3], and outstanding mechanical properties, has become a key transparent material in modern engineering applications. It is widely used in aerospace, structural engineering, and biomedical fields [4]. In this study, acrylic applied in building structures is specifically referred to as structural acrylic. The base material of structural acrylic differs from other grades in its manufacturing process. For instance, aerospace-grade acrylic [5] is often subjected to orientation stretching during fabrication for toughness enhancement [6,7], which increases strength in the oriented direction [8,9], while reducing both strength and ductility in other directions [10]. This anisotropic mechanical behavior poses potential risks to structural safety. Therefore, structural acrylic is not subjected to directional stretching treatments.
Structural acrylic has been successfully implemented in several large-scale architectural projects. The pioneering implementation of structural acrylic in major structures was exemplified by the Munich Olympic Stadium (1972), featuring a 74,000 m2 transparent acrylic roof, which established a significant milestone in large-scale acrylic applications. Recently, acrylic structures have garnered substantial attention from structures in China. A notable contemporary application is the 14,500 m2 acrylic roof system implemented in the Nanjing Future Garden of Jiangsu Garden Expo Park (2022), as illustrated in Figure 1a. Another standout example of modern acrylic architecture is the centerpiece of Project Jewel at Changi Airport (Figure 1b) [11], the largest monolithic acrylic structure ever built, spanning 7856 square feet. Comprising 40 seamlessly bonded panels, it forms a striking transparent feature rising five stories high. The Jinping neutrino detector, currently under construction, located in the deepest underground laboratory in the world, will also adopt a 9.96 m diameter acrylic sphere as its core vessel [12,13].
In structural engineering, acrylic components often require large sizes and complex shapes, such as curved or folded surfaces [14]. However, industrial-grade acrylic is limited by manufacturing equipment, necessitating a modular fabrication strategy: small acrylic panels are produced and then joined into larger assemblies via bulk polymerization splicing. The bulk polymerization splicing process for structural acrylic comprises [15] (Figure 2): (a) Maintaining a gap between two acrylic plates and injecting methyl methacrylate (MMA) monomer; (b) Sealing the seam and resting the assembly at 20 °C for several hours to remove bubbles; (c) Applying thermal treatment at 85 °C for several hours to complete polymerization and annealing. Since the monomer (MMA) used in the bulk polymerization is identical to the base acrylic material, the spliced seam is optically transparent and visually indistinguishable from the base material. Moreover, the mechanical strength of the connected seam can exceed 80% of the base material strength, enabling the entire acrylic structure to function as a continuous load-bearing system. Typical acrylic component splicing is conducted in a controlled high-temperature environment within the factory. When panel dimensions exceed transport limits, sections are shipped and spliced on site. However, on-site splicing often fails to reach the required 85 °C annealing temperature at some seam locations.
In modern engineering, structural acrylic has evolved from mere cladding to integrated load-bearing cladding elements. In structural applications, the design stress of acrylic is typically maintained well below its static ultimate strength, making failure due to static overload highly unlikely. Nevertheless, acrylic components are frequently subjected to two typical loading scenarios: (a) long-term static loading (e.g., self-weight and dead loads), and (b) high-frequency cyclic loading (e.g., wind-induced vibrations and water flow excitations). These conditions render creep and fatigue as the predominant failure mechanisms and the focal issues in engineering practice. In recent years, large-scale projects have driven significant advances in our understanding of structural acrylic’s creep and fatigue performance [16,17]. Acrylic exhibits pronounced creep behavior even under ambient temperature conditions. Therefore, creep is often the critical design consideration in structural acrylic applications. Adibeig et al. [18] proposed a 3% creep strain threshold as the failure criterion and estimated the corresponding creep life based on the Burgers and modified Burgers models. However, strain-based design approaches are less practical in engineering applications and may conflict with conventional stress-based design methodologies. Zhou et al. [19] derived a creep-life prediction for acrylic in liquid scintillator environments and used it to estimate its long-term durability. Yi et al. [20] applied time-temperature superposition to post-aging creep-life estimation. Compared to creep life studies, fatigue life investigations of acrylic have been more extensively conducted, particularly in the area of fatigue crack propagation. Liu et al. [21] predicted crack-initiation and crack-propagation lives of U-notch acrylic plates via fatigue-damage mechanisms, combining them to estimate total fatigue life. Huang et al. [22] conducted low-cycle fatigue tests at varying frequencies, revealing that creep damage affects fatigue performance and that fatigue life correlates strongly with loading rate. He et al. [23] proposed a continuum damage mechanics-based fatigue life model for acrylic shells, validated by finite-element simulations.
The mechanical properties of the spliced seam are generally inferior to those of the base material, thereby forming a critical weak spot in the acrylic component. Under prolonged service, localized stress concentrations develop at this seam, causing marked losses in fatigue and creep resistance. Ultimately, the structure’s safety and reliability are compromised. This limitation severely hinders the use of acrylic in structure. Consequently, Engineers face a trade-off: setting allowable stress too low drives up cost, whereas setting it too high erodes the safety margin.
Scanning electron microscopy (SEM), with its nanoscale resolution and large depth of field (typically 1–20 nm), is indispensable for characterizing polymer morphology. Using high-resolution SEM, researchers have correlated microstructural features with macroscopic mechanical properties of polymers [24,25,26]. Yan et al. [27] employed SEM to compare crack morphologies in conventional and orientation-stretched acrylic, revealing how alcohol exposure and machining affect crack-tip propagation. Sezavar et al. [28] examined acrylic/Al2O3 composite fracture surfaces, elucidating the roles of alumina dispersion and interfacial debonding in crack-propagation paths and elastic modulus. The failure of structural acrylic involves not only the intrinsic strength of the base material but also the bond strength of the spliced seam, resulting in fracture mechanisms distinct from those of monolithic polymers. SEM analysis of fracture behavior thus enables engineers to identify and safeguard vulnerable regions (e.g., connected seam) early in the design process.
Despite these contributions, simple and effective creep and fatigue life prediction methods for acrylic used in structures—particularly for bulk-polymerized spliced joints—are still lacking, and relevant experimental studies remain scarce. This gap places engineers in a difficult trade-off: (1) setting the allowable stress too low significantly increases construction costs; (2) setting it too high compromises structural safety; (3) strain-based life prediction approaches are difficult to implement in practical engineering design due to the lack of in-service strain monitoring and compatibility issues with conventional stress-based design codes. Moreover, the influence of suboptimal on-site annealing conditions on the long-term durability of bulk-polymerized spliced acrylic has not been systematically investigated. The fracture mechanisms under sustained and cyclic loading, particularly at the splice interface, also remain unclear.
To develop a practical, statistically robust, and mechanistically informed framework for the creep and fatigue life prediction of bulk-polymerized spliced structural acrylic, with explicit consideration of on-site annealing quality and failure mechanisms. First, this study systematically tested structural acrylic base material coupons and spliced coupons under various stress levels for creep and fatigue rupture. Secondly, three design curves are derived from the fitted log-log linear regression models: (i) 97.7% survival curves, (ii) improved 95% confidence interval lower bounds, which corrects the over-optimism of the traditional ASTM E739 method, and (iii) one-sided tolerance curves. Third, we identify distinct creep and fatigue threshold stresses for both base material and spliced coupons, leading to the derivation of recommended allowable stress and stress amplitude limit, filling a critical gap in current design practice. Finally, SEM was used to examine the fracture surfaces of failed coupons, revealing fundamentally different fracture mechanisms between base material and spliced seams.

2. Experimental Test

2.1. Coupon Design

To investigate the effect of annealing temperature on creep and fatigue life of structural acrylic, three coupon groups were prepared: spliced coupons annealed at 85 °C (85-CSC for creep, 85-FSC for fatigue), spliced coupons annealed at 65 °C (65-CSC for creep, 65-FSC for fatigue), and base material coupons (CBC for creep, FBC for fatigue). A spliced coupon annealed at 85 °C refers to a coupon spliced through bulk polymerization under an annealing temperature of 85 °C. Similarly, a spliced coupon annealed at 65 °C is a coupon spliced under an annealing temperature of 65 °C. The spliced coupons annealed at 65 °C simulate on-site polymerization under suboptimal thermal conditions, since field measurements show temperatures can drop to approximately 65 °C. This study included acrylic base material coupons as controls to quantify the extent to which annealing temperature affects creep and fatigue life.
Creep coupons (Figure 3a) were machined according to GB/T 1040.2-2022 [29] using Type 1A dimensions, while fatigue coupons (Figure 3b) followed ASTM D638 [30] Type I dimensions. However, to prevent slippage under cyclic loading due to the short standard grip length, the grip length was increased to 33 mm while maintaining the original gauge length. Compared with creep coupons, fatigue coupons were thinner, shorter, and featured a wider gauge section. For all spliced coupons, a 3 mm-wide seam was centered in the gauge region.

2.2. Short-Term Tensile Test

Short-term tensile failure tests were conducted on the structural acrylic used in this study to determine its mechanical properties prior to selecting stress levels for the creep and fatigue tests. The resulting baseline properties are summarized in Table 1, with each value representing the mean of five replicates.

2.3. Creep and Fatigue Failure Test

Creep and fatigue tests were performed at 20 °C. The creep tests were performed using a GT-7049-DH creep testing machine manufactured by Gotech Testing Machines Inc., located in Dongguan, China. This machine is equipped with a temperature-controlled environmental chamber to ensure thermal stability throughout the test duration. Deformation was recorded using magnetic scale displacement transducers. The system features three independent loading platforms, enabling simultaneous testing of three coupons under identical conditions. Tensile creep tests ran for up to 15 days and were terminated if no fracture occurred. The stress ranges for the creep tests were as follows: 41–55 MPa for the base material, 43.5–50 MPa for the spliced coupons annealed at 85 °C, and 28–36 MPa for the spliced coupons annealed at 65 °C [31].
Tensile fatigue tests followed GJB 2033-9432 [32]. According to this standard, the specified fatigue life corresponding to the endurance limit for aerospace acrylic is 5 × 10⁴ cycles. In this study, 1 × 10⁵ cycles was adopted as the conditional fatigue limit. Tests were performed on an INSTRON 8801 fatigue testing machine. A Digital Image Correlation full-field strain measurement system was integrated into the setup to enable precise coupons displacement. The stress ratio (R) was 0 and the frequency 1 Hz. Tests were terminated upon coupon fracture or upon reaching 1 × 10⁵ cycles. The stress amplitude ranges for the fatigue tests were 40–60 MPa for the base material, 35–50 MPa for the spliced coupons annealed at 85 °C, and 35–50 MPa for the spliced coupons annealed at 65 °C.

3. Analysis of Test Results

3.1. Coupon Fracture Morphology

The fracture morphologies of both base-material and spliced coupons under creep (Figure 4) and fatigue (Figure 5) loading exhibit a high degree of macroscopic consistency and are therefore analyzed together. Compared with traditional inorganic glass, the acrylic coupons showed superior resistance to creep and fatigue failure. Fractography reveals minimal overall deformation at creep and failure, with no significant necking within the gauge length. The fracture surfaces were generally flat and smooth, lacking protrusions or burrs, characteristic of a brittle failure mode.
Comparison of failure modes reveals that fracture locations on base material coupons are random, occasionally occurring outside the gauge length under fatigue loading. This phenomenon is likely related to the random distribution of microstructural defects within the base material, indicating a relatively uniform strength distribution. In contrast, the fractures in annealed spliced coupons were consistently localized at the mid-section of the coupon, specifically at the spliced seam. This behavior can be attributed to the lower strength of the spliced seam compared to the base material, which renders the seam the weakest region of the coupon. Accordingly, failure initiates at the spliced seam under both sustained and cyclic loading.

3.2. Creep and Fatigue Fracture Life

In the tensile creep tests, 33 valid creep fracture data points were obtained for the CBC, with 20 and 19 for the 85-CSC and 65-CSC, respectively. In the tensile fatigue tests, 29 valid fatigue fracture data points were obtained for the FBC, and 15 and 23 for the 85-FSC and 65-FSC, respectively. Some data points were excluded from the analysis for two main reasons: (a) tests terminated without fracture due to a creep duration exceeding 15 days or a fatigue cycle count exceeding 1 × 10⁵ cycles; (b) data invalidated by incidental factors, such as excessive load deviation in the testing apparatus.
The creep life data of structural acrylic are summarized in Table 2 and the fatigue test data in Table 3. Both base-material and spliced coupons show that higher stress levels correspond to shorter life. However, some anomalies occurred. For instance, the creep life of the first group of coupons under a constant load of 41 MPa (6438 min) was lower than that of the second group under a higher constant load of 42.5 MPa (8132 min). Similarly, the fatigue life of the first group under a stress amplitude of 40 MPa (3754 cycles) was shorter than that of the second group under a higher stress amplitude of 42 MPa (6062 cycles). These anomalies may be attributed to: (a) Machine error, such as clearance between the fixture and coupon or gear backlash in the testing system; (b) Human error, as perfect alignment between the coupon and the load-transmitting rod could not be guaranteed during installation; (c) Coupon variability, since coupons from the same batch can differ slightly in mechanical properties.

4. Statistical Analysis of Creep and Fatigue Life

4.1. Life Prediction Curves

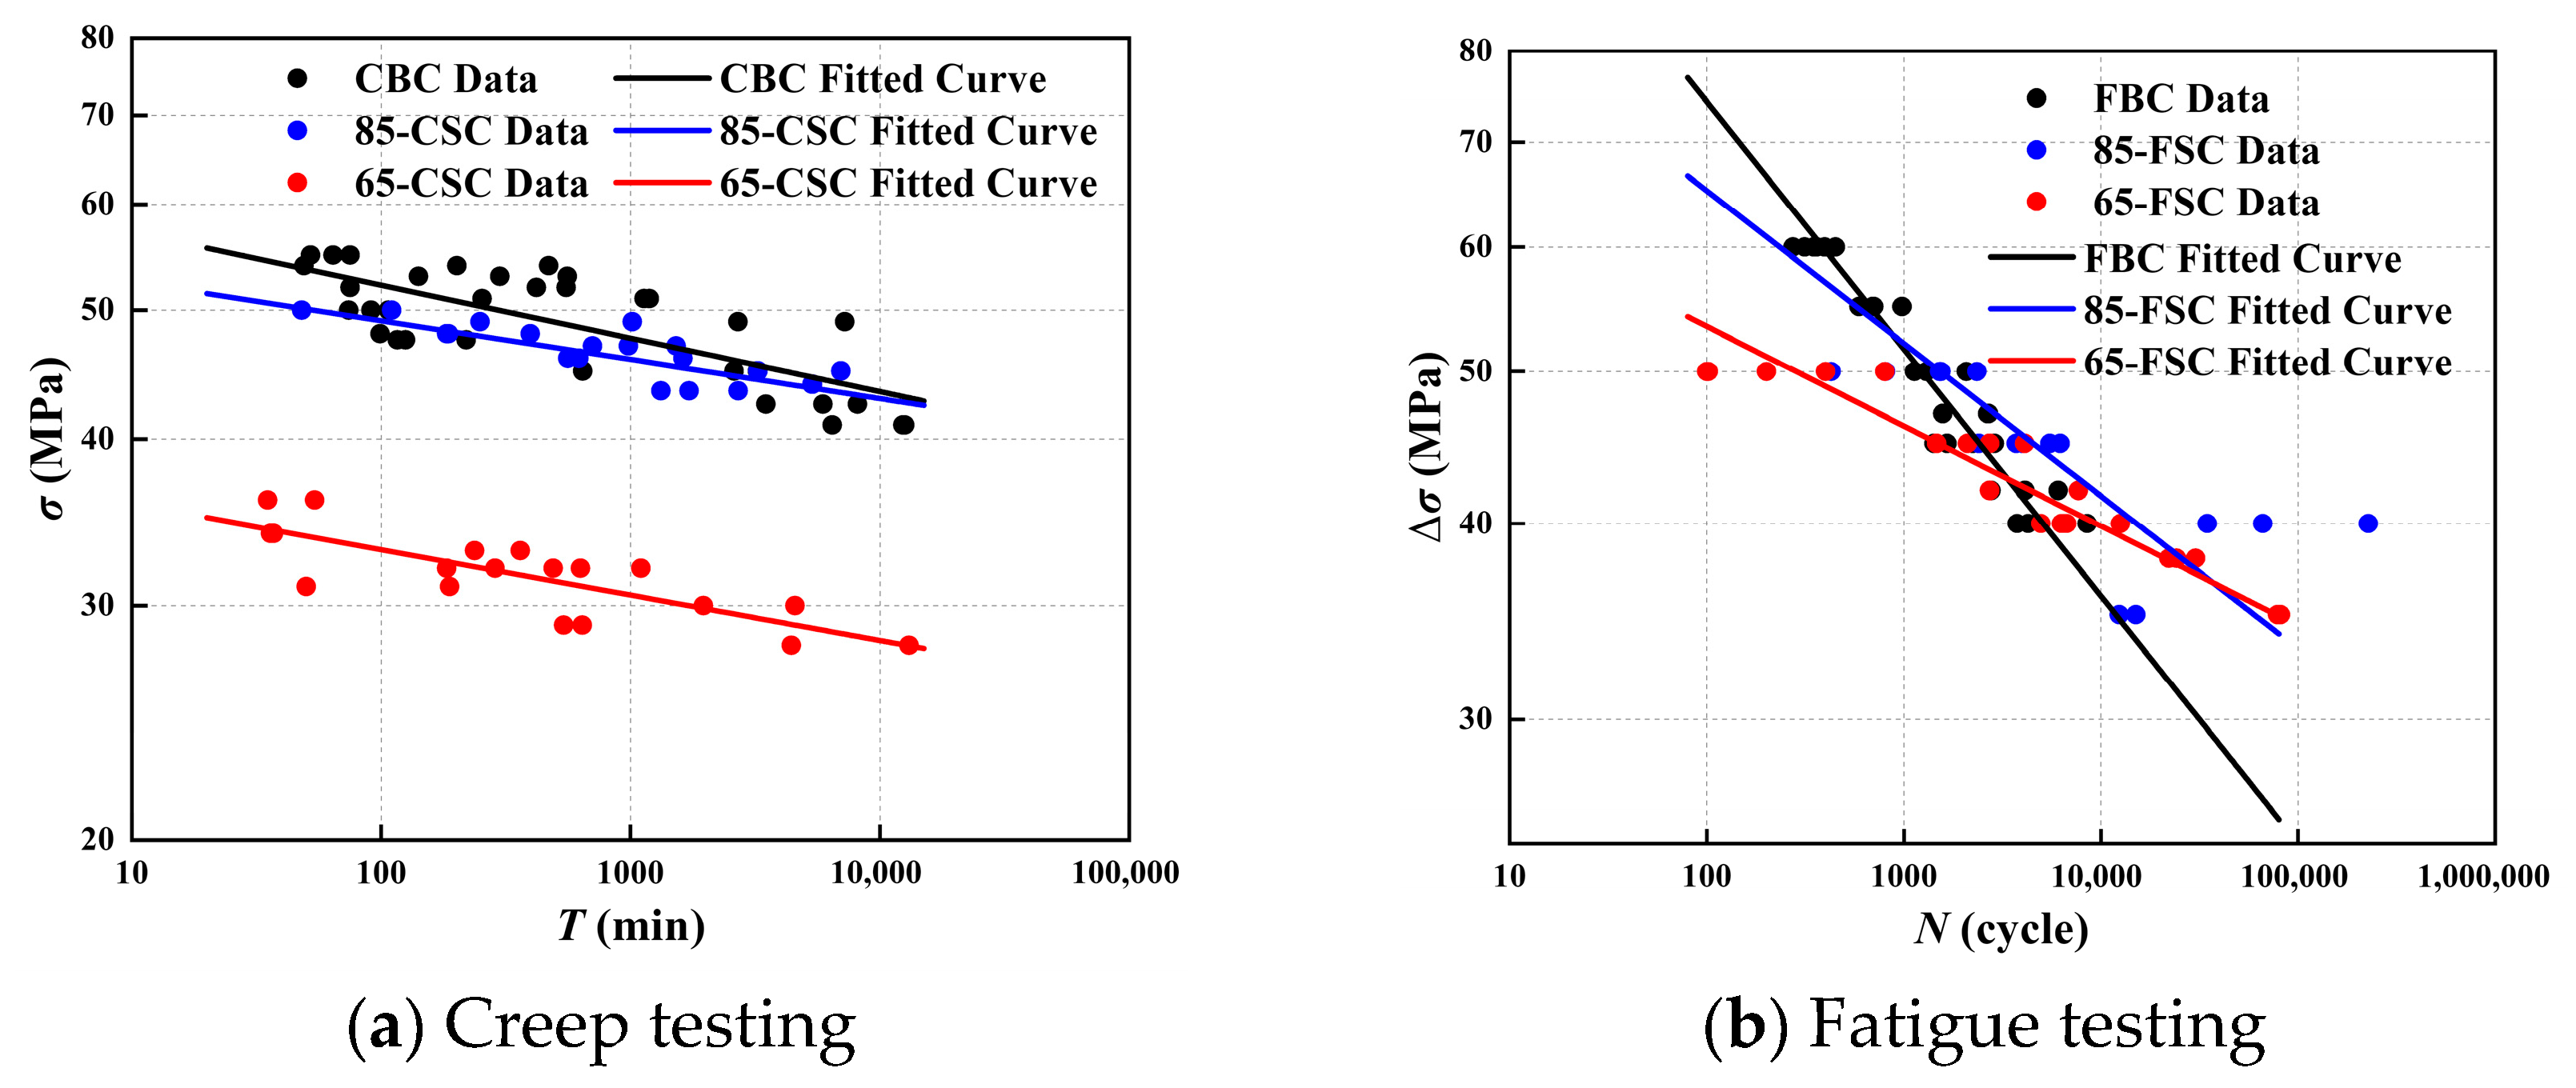
After applying a base-10 logarithmic transformation to the data in Table 2 and Table 3, a clear linear relationship is observed between lifetime and stress. A log-log linear regression model (log L = A + B log S) was employed to fit the data, as the power-law relationship effectively captures the nonlinear degradation behavior of acrylic, where a small increase in stress leads to a disproportionately large reduction in lifetime. The model’s simplicity and interpretability make it particularly suitable for engineering design applications, allowing for straightforward derivation of design curves and threshold stresses. For creep life fitting, L represents the creep life T and S denotes the creep stress σ; for fatigue life fitting, L corresponds to the fatigue lifetime N, and S refers to the stress amplitude Δσ. The resulting fitted curves are plotted in Figure 6.
The prediction equations for creep and fatigue life of the three coupon types are presented in Table 4. As shown in the table, relatively low R2 values are observed for the creep coupons and the 85-FSC specimens. To assess the statistical significance of the logarithmic regression models, an F-test based on the correlation coefficient was performed. The number of coupons n and the correlation coefficient r (r2 = R2 in simple linear regression) were substituted into Equation (1). It evaluates the null hypothesis that there is no linear relationship between the logarithmic life and logarithmic stress, and a significant F-test result allows us to reject this null hypothesis, confirming that the observed linear relationship is highly unlikely to be due to random chance. It is found that all models satisfied the statistical significance criteria. Therefore, at the 99.9% confidence level, it can be concluded that the logarithmic regression models reliably describe the linear relationships between the logarithmic life (creep and fatigue) and the applied stress level in acrylic.
As observed in Figure 6, the creep life curve of CBC lies slightly above that of the 85-CSC, while that of the 65-CSC is significantly lower than the other two. The CBC also exhibits a greater degree of data scatter compared to the spliced coupons. In Figure 6b, the fatigue life curves of FBC, 85-FSC and 65-FSC are relatively close, indicating comparable fatigue resistance among the three coupon types. Moreover, under low stress amplitude, the fatigue performance of the spliced coupons even exceeds that of the FBC. Significantly greater variability is observed in the 85-FSC data compared to the other two coupon types.
Comparison reveals that the R2 values of the creep data are generally lower than those of the fatigue data. This suggests that the fatigue fracture behavior of structural acrylic is more consistent than that under creep conditions. The difference in data dispersion is primarily attributed to the distinct failure mechanisms under creep and fatigue loading. A detailed discussion of this mechanism is provided in the following Section 5.
r > F 0.001 ( 1 , n 2 ) n 2 + F 0.001 ( 1 , n 2 ) = 0.547                     CBC   n = 33 , r = 0.763 0.679               85-CSC   n = 20 , r = 0.825 0.693               65-CSC   n = 19 , r = 0.804 0.470                     FBC   n = 29 , r = 0.947 0.633               85-FSC   n = 15 , r = 0.754 0.524               65-FSC   n = 23 , r = 0.952

4.2. 97.7% Survival Curve

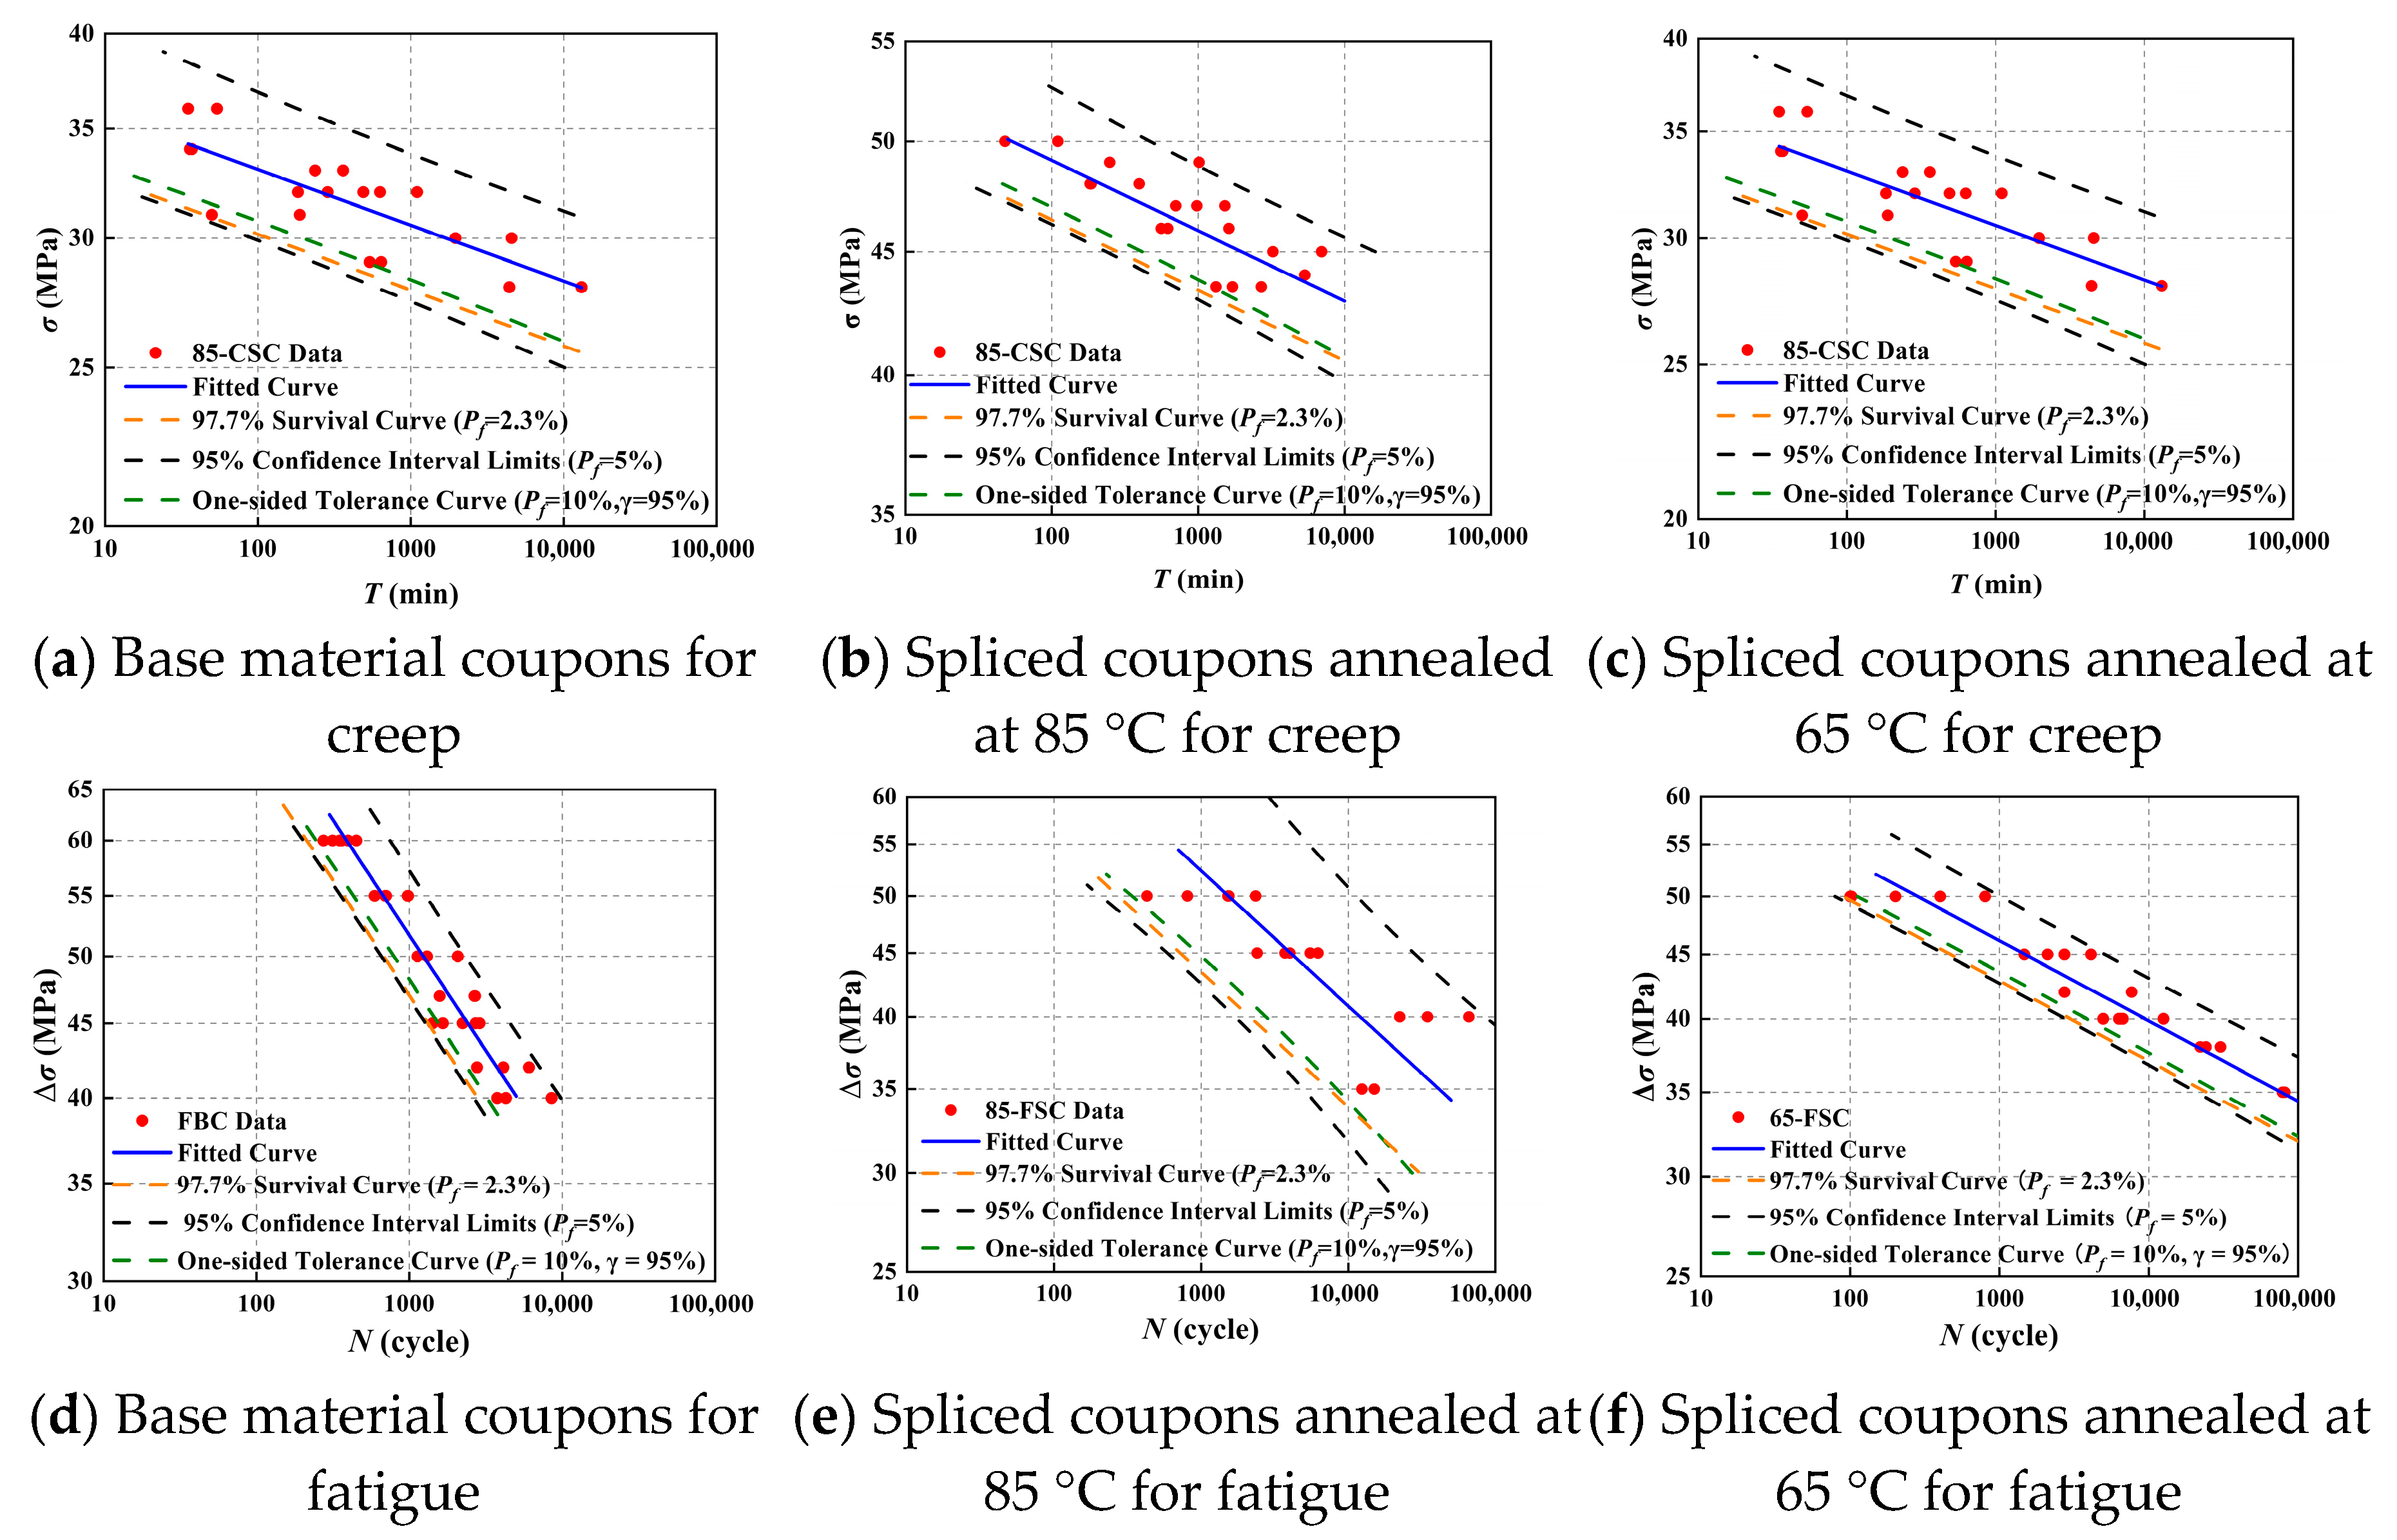
97.7% survival curve is particularly valuable for reliability-based design, where the goal is to ensure that the vast majority of components in a large structure will perform reliably over their service life. It provides a clear, conservative design target that balances performance and safety. Under the assumption of a normally distributed lifetime dataset, the 97.7% survival probability curve was obtained by shifting the life prediction curve downward by two standard deviations (2s) on the double-logarithmic plot. The formula for calculating the standard deviation (s) is provided in Equation (2) and summarized in Table 4. The resulting 97.7% survival curves are plotted in Figure 7. The failure probability Pf is defined as the probability that the lifetime is less than a specific value L under a given stress level. The 97.7% survival curves correspond to a Pf of 2.3%. Equations (3) and (4) present the 97.7% survival life prediction models for the three types of coupons.
s = i = 1 n ( y i y i ) 2 n 2
      Creep             CBC       lg T = 43.70 25.06 lg σ       85-CSC       lg T = 59.09 34.26 lg σ       65-CSC       lg T = 45.35 29.30 lg σ
      Fatigue             FBC       lg N = 13.62 6.35 lg σ       85-FSC       lg N = 18.15 9.25 lg σ       65-FSC       lg N = 28.66 15.72 lg σ

4.3. 95% Confidence Interval Limits

There exists a deviation between the actual creep and fatigue lifetime values y0 and estimated values y 0 . To better characterize this deviation and enhance the fault tolerance of lifetime predictions, confidence interval methods from statistical theory were adopted in the model formulation. The confidence level γ was defined as the probability that true-life value falls within the constructed interval. The confidence bounds were formulated according to Equation (5). The 95% confidence interval has a 95% probability of containing the true-life value. While the 97.7% survival curve accounts for the variability within the population of material strengths, the 95% confidence interval lower bound specifically addresses the uncertainty inherent in the regression model itself, which is derived from a finite sample of test specimens rather than the entire population. By providing a statistically conservative estimate of the average performance, this lower bound ensures that design decisions are not based on an over-optimistic interpretation of the limited experimental data.
ASTM E739 [33] provides a statistical approach for constructing confidence intervals in fatigue life data. The corresponding deviation term is given in Equation (6). Although ASTM E739 was originally published in 2014 and withdrawn in 2024, its methodology remains widely used in engineering practice. However, analysis revealed that applying the 95% confidence interval based on Equation (6) to the experimental data in this study resulted in excessively narrow confidence bands across the stress range. More than half of the observed data points fell outside the 95% confidence limits. Such a result would lead to an overestimation of the lower bound and could compromise structural safety. Given the limited number of datasets in this study, which constitutes a small sample size (n < 33), the deviation term in ASTM E739 was replaced with a t-distribution-based formulation to compute the 95% confidence interval, as presented in Equation (8).
( y 1 ( x ) = y δ ( x ) , y 2 ( x ) = y + δ ( x ) )
δ ( x ) = 2 F γ s 1 n + ( x x ¯ ) 2 i = 1 n ( x i x ¯ ) 2
δ ( x ) = t ( 1 γ ) / 2 ( n 2 ) s 1 + 1 n + ( x x ¯ ) 2 i = 1 n ( x i x ¯ ) 2
Here, t ( 1 γ ) / 2 ( n 2 ) denotes the t-distribution critical value, s represents the standard deviation given in Table 4, and n represents the total number of experimental coupons.
At the 95% confidence level, the degrees of freedom (n − 1) were used to determine the critical t-value t0.025, yielding tCBC = 2.04, t85-CSC = 2.10, t65-CSC = 2.11 for creep coupons, and tFBC = 2.05, t85-FSC = 2.16, t65-FSC = 2.08 for fatigue coupons. These t-values were then substituted into Equation (7), in combination with Equation (5), to compute the confidence intervals for creep and fatigue life curves. The lower bound of the confidence interval corresponds to a confidence level γ of 97.5%. The equations for the lower confidence bounds are presented as Equations (8) and (9). The upper and lower confidence limits are plotted in Figure 7.
      Creep             CBC       lg T = 45.04 25.06 lg σ 1.37 1 + 1 / 33 + ( lg σ 1.69 ) 2 / 0.054       85-CSC       lg T = 59.93 34.26 lg σ 0.882 1 + 1 / 20 + ( lg σ 1.67 ) 2 / 0.008       65-CSC       lg T = 46.51 29.30 lg σ 1.22 1 + 1 / 19 + ( lg σ 1.50 ) 2 / 0.019
      Creep             CBC       lg N = 13.88 6.35 lg σ 0.27 1 + 1 / 29 + ( lg σ 1.63 ) 2 / 0.11       85-CSC       lg N = 18.90 9.25 lg σ 0.81 1 + 1 / 15 + ( lg σ 1.64 ) 2 / 0.04       65-CSC       lg N = 29.16 15.72 lg σ 0.52 1 + 1 / 23 + ( lg σ 1.63 ) 2 / 0.05

4.4. One-Sided Tolerance Curve

To comprehensively account for the combined effects of Pf and γ, one-sided tolerance curves serve as an essential tool in engineering design. Unlike confidence interval limits, one-sided tolerance curves are derived to ensure that a specified proportion of the population is covered at a given confidence level, thereby integrating both Pf and γ into a unified framework. The one-sided tolerance curve offers greater flexibility and broader applicability than either the confidence interval or the survival probability curve, making it particularly suitable for reliability-based design assessments. It is considered the gold standard for risk-averse engineering applications because it provides a comprehensive guarantee: with a specified confidence level (e.g., 95%), a defined proportion of the population (e.g., 90%) will exceed the predicted life. This level of assurance is essential for large-scale, high-visibility, and safety-critical structures, where the failure of any single component could have significant consequences. The lifetime corresponding to a given stress level, Pf and γ is given by Equation (10) [34].
y P ( γ ) = y ^ + k s 1 + 1 n + ( x x ¯ ) 2 i = 1 n ( x i x ¯ ) 2
Here, k represents the one-sided tolerance factor, whose formulation is given in Equation (11). In Equation (11), u γ ,   u P represents the standard normal deviate corresponding to the specified γ and Pf.
k = u P u γ 1 n 1 u γ 2 2 ( n 1 ) + u P 2 2 ( n 1 ) 1 u γ 2 2 ( n 1 )
The one-sided tolerance factor k was calculated from Equation (11) at γ = 95% and Pf = 10%. The resulting values are as follows: kCBC = −1.43, k85-CSC = −1.54, k65-CSC = −1.55 for creep coupons; kFBC = −1.45, k85-FSC = −1.64, k65-FSC = −1.50 for fatigue coupons. The statistical meaning of the selected one-sided tolerance curves is defined in Equation (12). It indicates that, with 95% confidence, no more than 10% of the true-life population falls below the predicted life defined by the tolerance curves. The one-sided tolerance prediction curves are plotted in Figure 7. The corresponding formulations for the three coupon types are given in Equations (13) and (14).
P ( P f 10 % ) 95 %
      Creep             CBC       lg T = 45.04 25.06 lg σ 0.96 1 + 1 / 33 + ( lg σ 1.69 ) 2 / 0.054       85-CSC       lg T = 59.93 34.26 lg σ 0.65 1 + 1 / 20 + ( lg σ 1.67 ) 2 / 0.008       65-CSC       lg T = 46.51 29.30 lg σ 0.90 1 + 1 / 19 + ( lg σ 1.50 ) 2 / 0.019
      Creep             CBC       lg N = 13.88 6.35 lg σ 0.19 1 + 1 / 29 + ( lg σ 1.69 ) 2 / 0.11       85-CSC       lg N = 18.90 9.25 lg σ 0.61 1 + 1 / 15 + ( lg σ 1.64 ) 2 / 0.04       65-CSC       lg N = 29.16 15.72 lg σ 0.38 1 + 1 / 23 + ( lg σ 1.63 ) 2 / 0.05

4.5. Life Threshold Value

The three design curves explore reliable life estimates from distinct statistical perspectives (survival probability, model uncertainty, and population tolerance), thereby establishing a comprehensive framework for life prediction under uncertainty. As shown in Figure 7, the majority of life data points are encompassed by the one-sided tolerance curves for all three coupon types. Only three observations (CBC at 31 MPa, 65-FSC at 50 MPa, and 65-CSC at 31 MPa) are located below the curves. This indicates that the constructed design curves are statistically reasonable and conservative in nature.
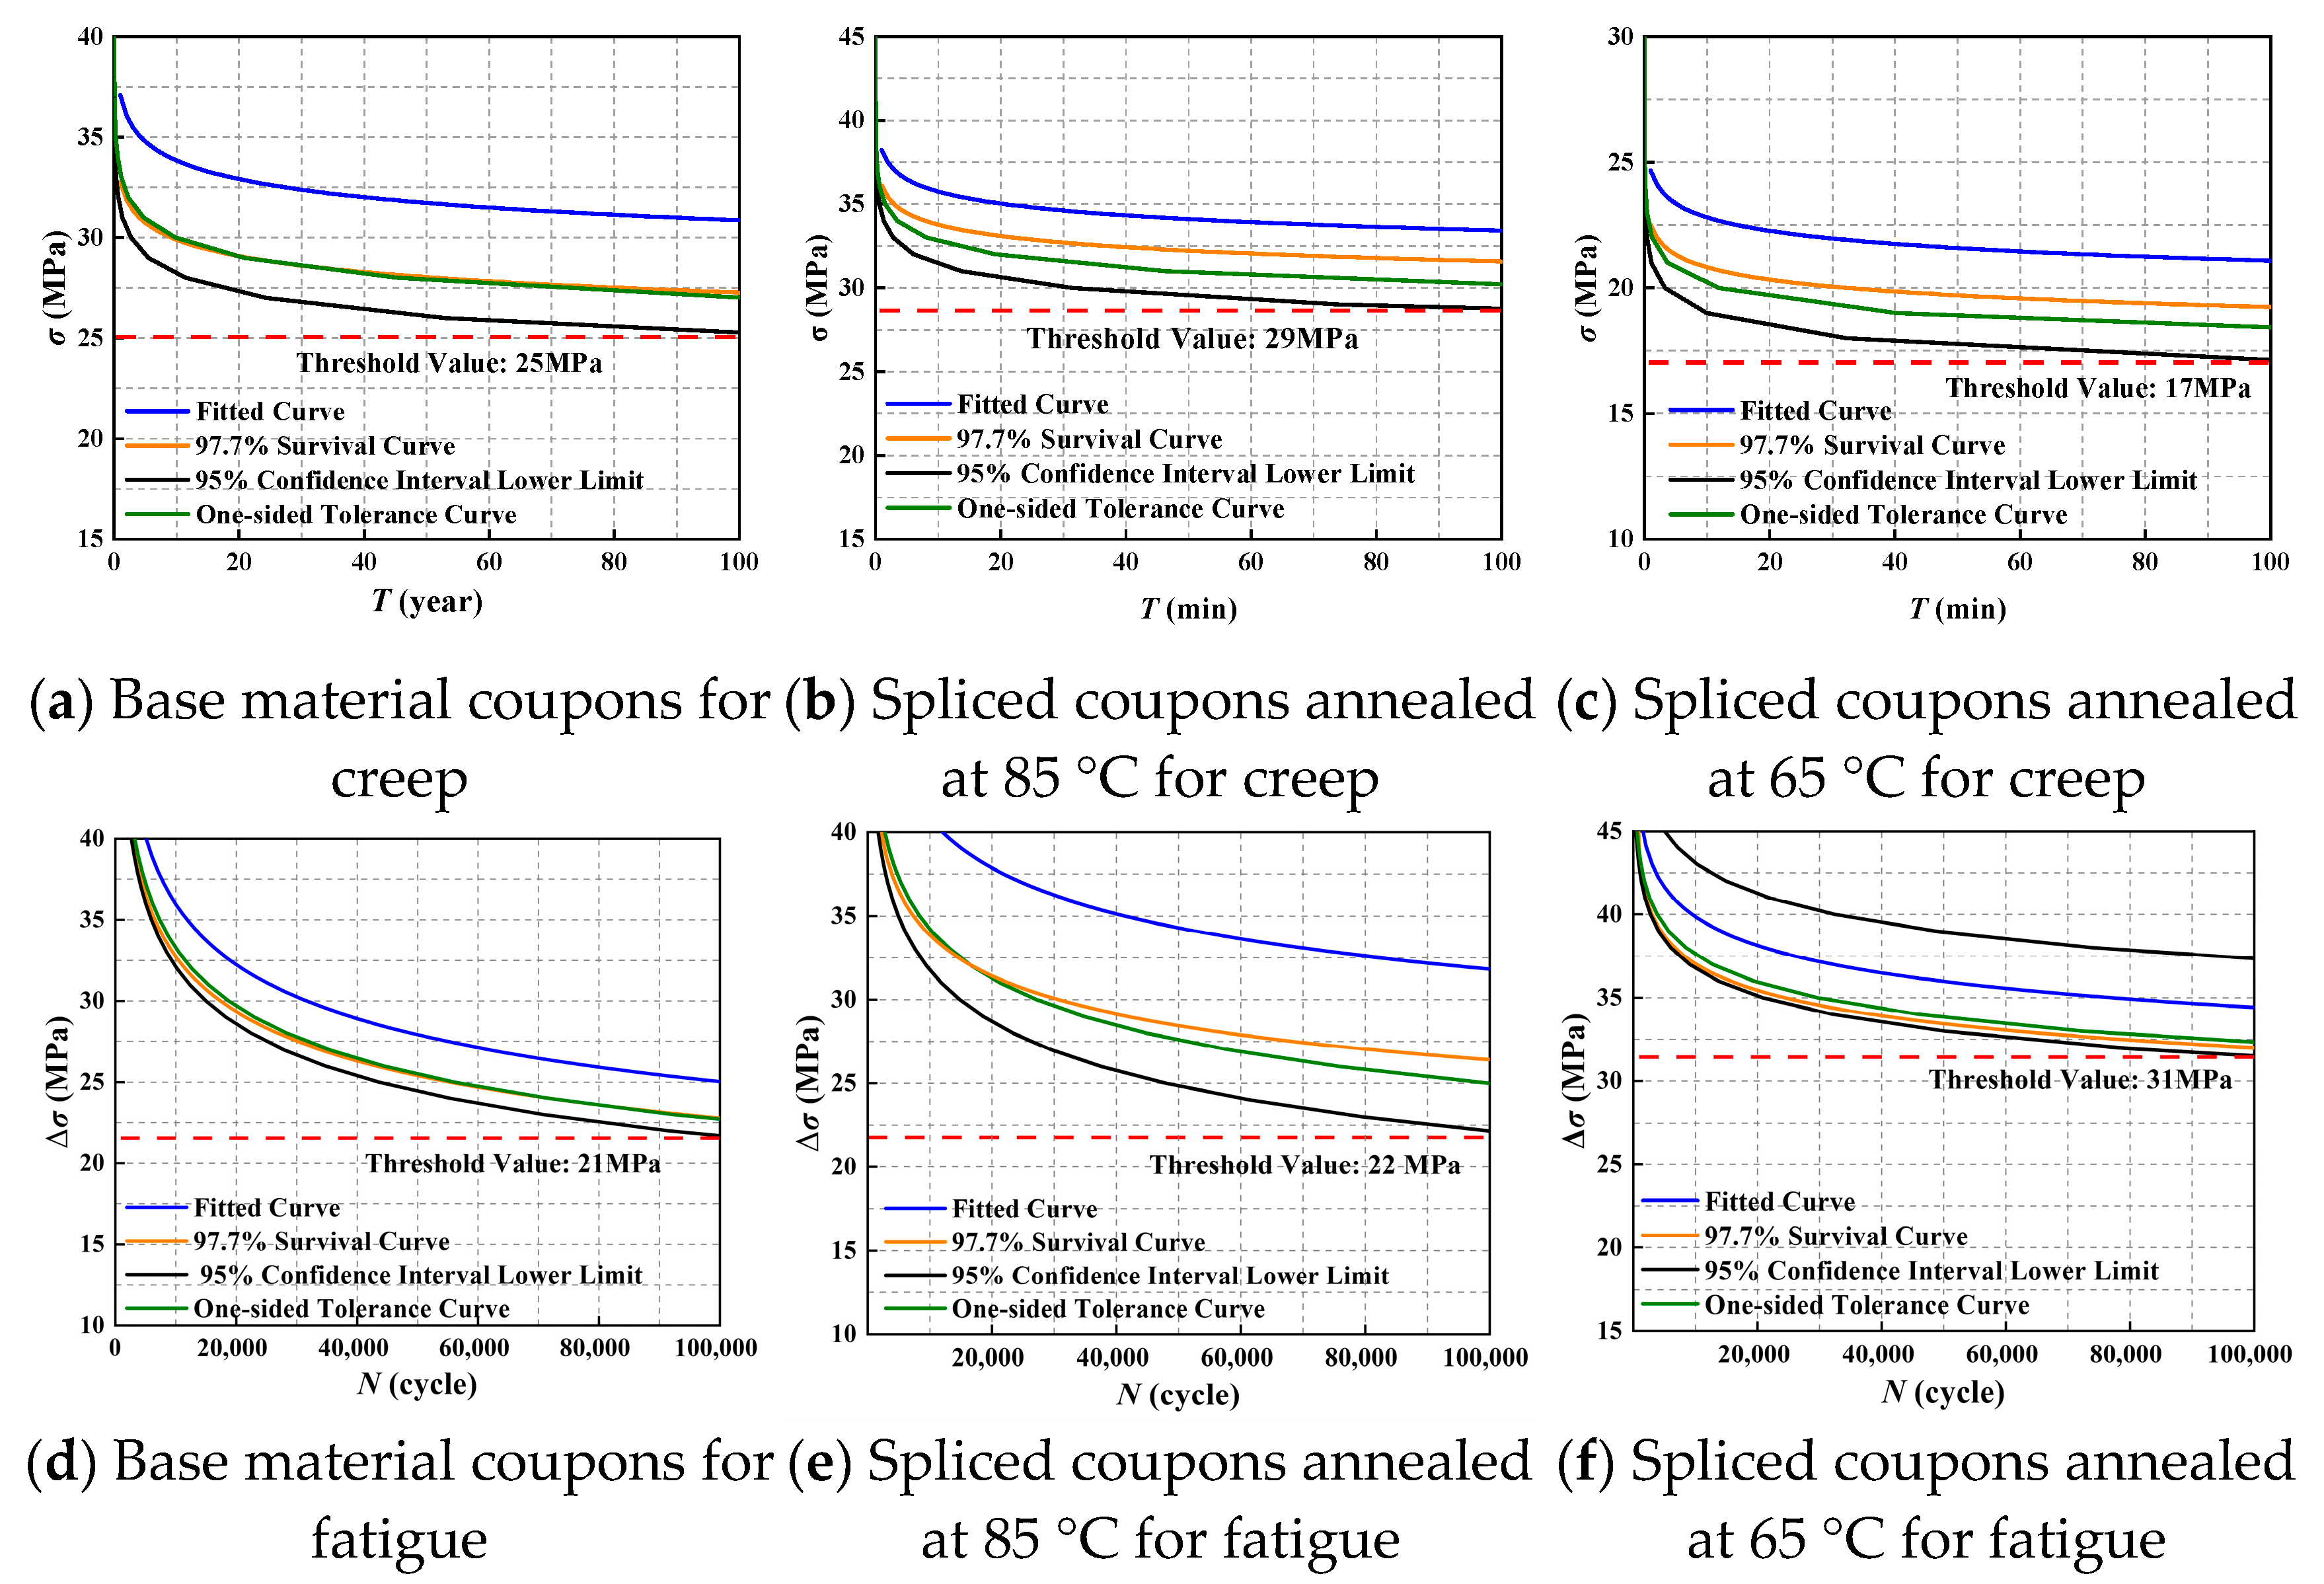
The predicted trends of the creep and fatigue life curves, as well as the three types of design curves for structural acrylic coupon, in the low-stress region are plotted in Figure 8. It is observed that the 95% confidence interval lower limit provides significantly lower life predictions than both the one-sided tolerance curve and the 97.7% survival curve. A notable threshold effect is revealed in the relationship between life and creep stress (or stress amplitude). By taking 100 years as the limiting creep life and 1 × 10⁵ cycles as the limiting fatigue life, it can be inferred that failures will not occur under stress levels for which the predicted creep life exceeds 100 years or the predicted fatigue life exceeds 1 × 10⁵ cycles. Such levels are defined as the creep threshold stress and the fatigue threshold stress below which damage accumulation is negligible over the service life, respectively. The creep threshold values for the CBC, 85-CSC, and 65-CSC coupons are 25 MPa, 29 MPa, and 17 MPa, respectively. The corresponding fatigue threshold values for the FBC, 85-FSC, and 65-FSC coupons are 21 MPa, 22 MPa, and 31 MPa, respectively.
As shown in Figure 6a, the creep performance of spliced coupons is generally inferior to that of the CBC. However, the creep threshold value of the 85-CSC (29 MPa) is higher than that of the CBC (25 MPa). It is explained by the fact that, in the low-stress region, the predicted lifetime of the 85-CSC coupons exceeds that of the CBC coupons, indicating that superior creep resistance is exhibited by the 85-CSC under low-stress conditions. The crossover point is identified at 42 MPa based on the prediction curves.
In Figure 6b, comparable fatigue performance is observed for the FBC, 85-FSC, and 65-FSC within the tested stress amplitude range. In the low-stress amplitude region, the prediction curves indicate that superior fatigue resistance is exhibited by the spliced coupons relative to the FBC. As the applied stress amplitude decreases, the fatigue life of the 65-FSC coupons exceeds those of both the FBC and the 85-FSC by a marked point.
When determining the allowable stress and stress amplitude limit for structural acrylic, the following factors should be considered: 1. The shortage effect—The lowest threshold value should be used as the baseline to ensure that the design meets the minimum strength requirements of the material. 2. Brittle failure characteristics—Since creep and fatigue failures in structural acrylic exhibited brittle behavior, sufficient safety margins should be reserved to account for potential failure risks. 3. Limitations of the log-log regression model—While the log-log linear model effectively captures the overall stress-life trend, it is a phenomenological model that does not explicitly represent complex failure mechanisms, especially in the presence of multiple damage modes. Furthermore, due to the limited number of test specimens (small sample size, n < 33), the regression coefficients are sensitive to data variability and potential outliers. As a result, extrapolation of the model to very low stress levels, which is beyond the tested range, carries significant uncertainty. Therefore, an additional design margin is necessary when applying the model for long-term life prediction in actual engineering projects.

5. SEM Fracture Analysis

5.1. Creep Fracture Surface

Figure 9 shows the SEM micrographs of creep fracture surfaces of CBC tested under various creep stress levels. The micrograph in Figure 9a corresponds to a stress of 47 MPa. A clear regional differentiation is observed, with two distinct zones separated by a sharp boundary [35,36]: the shining region and the blunted region [37]. The blunted region corresponds to the stable crack propagation zone, with a characteristic radius of 2.45 mm. The shining region corresponds to the unstable crack propagation zone. Once the crack extends beyond the boundary of the blunted region into the shining region, rapid fracture occurs. High-magnification SEM further reveals numerous microcracks within the blunted region [38]. Crack initiation originates from an initial flaw at the coupon edge (with a width of 0.52 mm), where macroscopically visible major cracks rapidly develop around the flaw [39]. Under creep loading, these major cracks are long and continuous, and multiple such cracks eventually coalesce into a single dominant crack. As the blunted region evolves, radial striations aligned with the crack propagation direction are formed on the fracture surface. When the crack enters the shining region, flower-like patterns are observed in the early stage of shining region [40], which represent newly formed microcracks. These microcracks absorb part of the energy during their formation and are also called the mist region [41]. Based on the above features, the crack propagation process is classified into three stages: 1. Primary Creep Stage: from initial crack to formation of major crack. 2. Secondary Creep Stage, Crack propagates along the micro-radial patterns to the boundary of the blunted region. 3. Tertiary Creep Stage, Rapid fracture after crack enters the shining region. By comparing the creep fracture morphologies of the CBC tested under 47 MPa and 48 MPa (Figure 9d), it is evident that the area of the blunted region significantly decreases with increasing creep stress. This indicates that under higher creep stress, cracks more easily transition into the rapid propagation stage, thereby leading to a reduction in the creep life of the CBC.
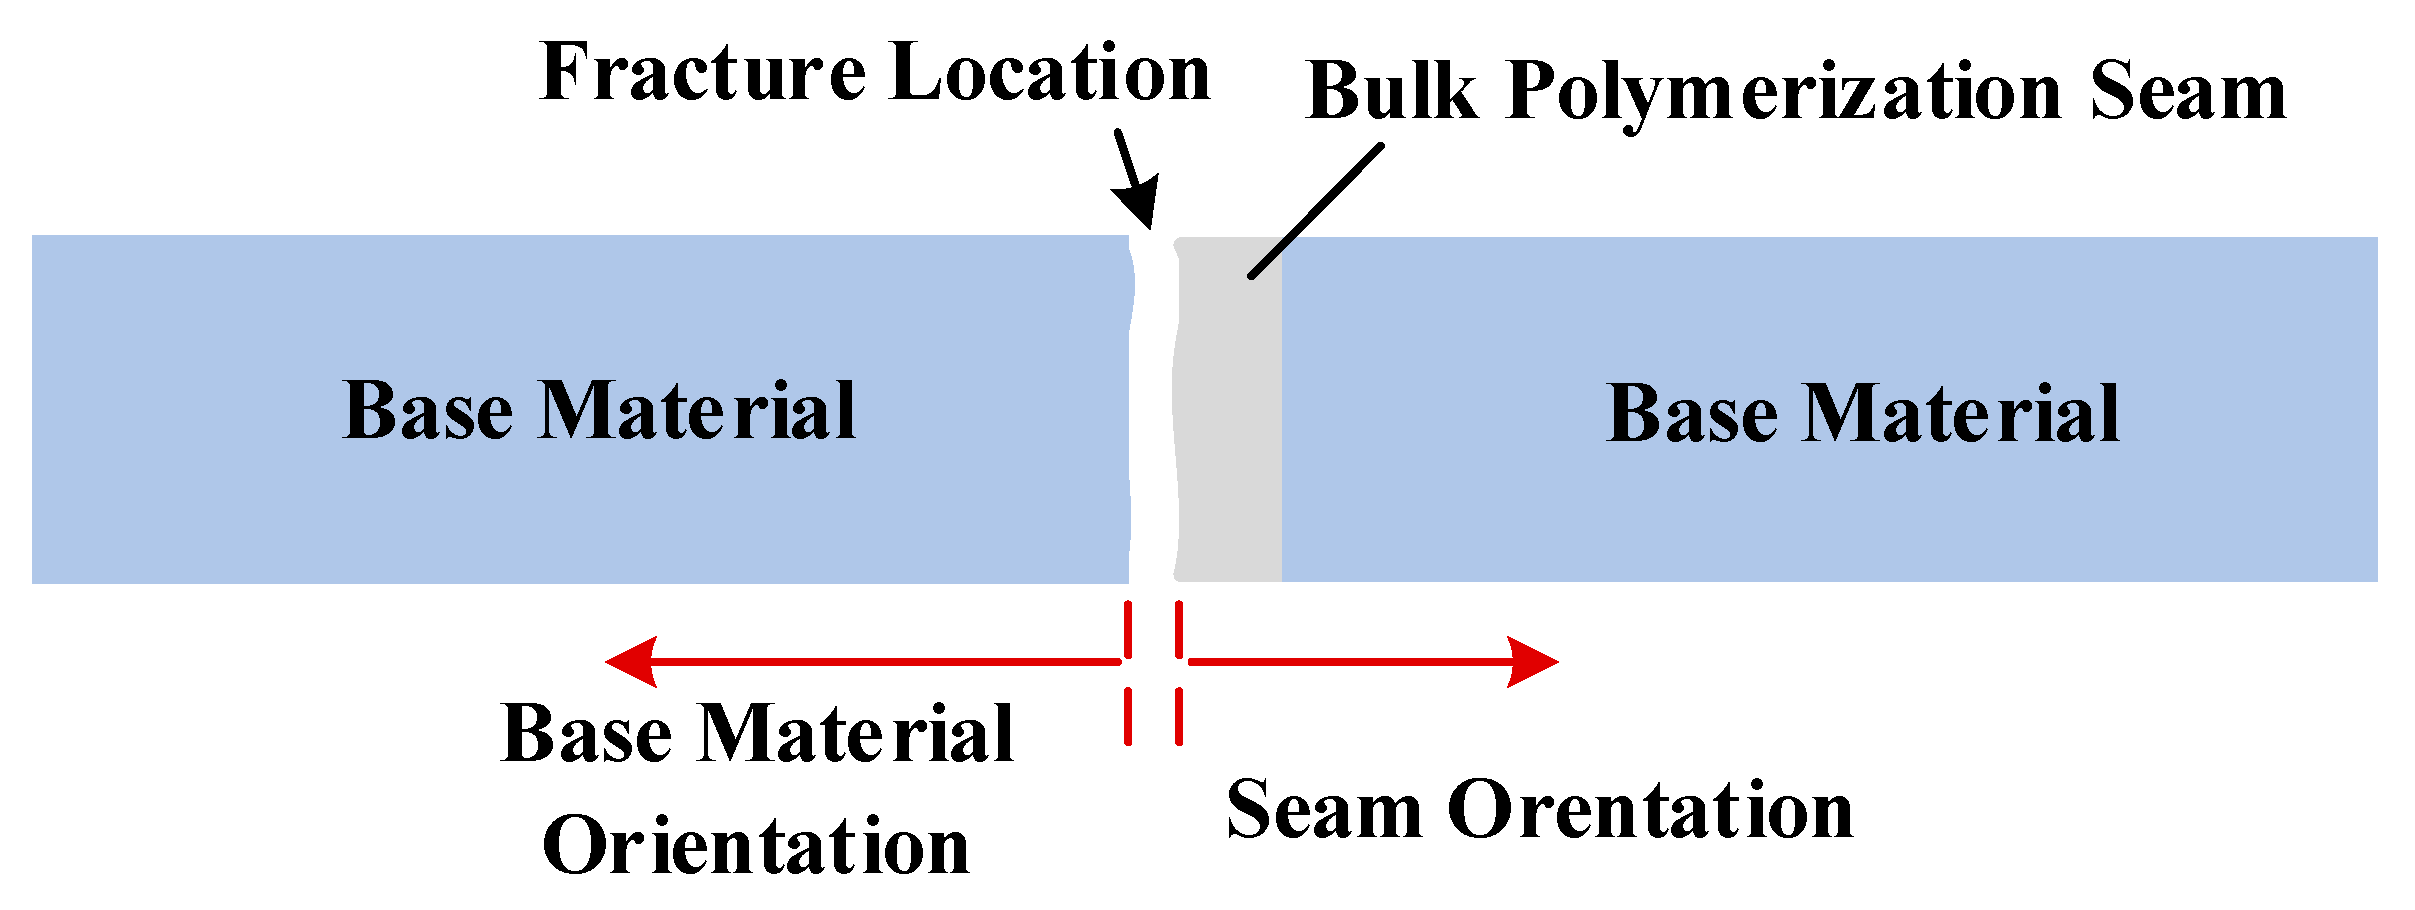
The creep fractures of the spliced coupons were consistently observed at the interface between the base material and the spliced seam. The fracture surfaces can be examined in two orientations: base material orientation and seam orientation (as shown in Figure 10). Figure 9b displayed the fracture morphology along the base material orientation of the 85-CSC under a creep stress of 45 MPa. Unlike the CBC, the blunted region in the 85-CSC exhibited a band-like morphology, extending uniformly inward from the coupon edge with an approximate width of 0.3 mm, instead of forming a fan-shaped zone. The central region of the fracture surface features a rectangular shining region, measuring 8.07 mm in length and 2.86 mm in width. This morphological feature suggests a distinct creep fracture mechanism in the 85-CSC compared with that of the CBC. Due to the adhesive bonding between the base material and the spliced seam, the interface becomes the mechanically weakest zone of the coupon. Under creep loading, tear initiation is triggered at the outer edge of the interface and gradually propagates inward. Once the tear reaches a critical width, it crosses the boundary of the blunted region, leading to rapid fracture and leaving behind plate-like remnants of the bulk polymer adhesive on the base material surface. High-magnification observation of the widest portion of the blunted region (0.91 mm) reveals the presence of extensive lamellar delamination, which clearly indicates adhesive separation from the base material surface. On the surface of the shining region, distinct wavy striped structures are observed. These features originate from the flow and solidification process of the adhesive during injection, with the stripe orientation perpendicular to the adhesive injection direction. Figure 9e presents the fracture morphology along the spliced seam orientation of the 85-CSC under a higher creep stress of 50 MPa, where the width of the blunted region is significantly reduced to 0.21 mm. This observation further confirms that as the creep stress increases, the area of the blunted region in the 85-CSC decreases, the crack propagation rate accelerates, and consequently, the creep life is reduced.
As shown in Figure 9c, the 65-CSC coupon exhibited a distinct fracture morphology compared with that of the 85-CSC. Although the macroscopic fracture still occurs at the base material-spliced seam interface under a creep stress of 35 MPa, microstructural observations reveal that crack initiation actually originates within the bulk polymer adhesive layer, subsequently propagating along the interface between the spliced seam and the base material. The maximum width of the blunted region reaches 5.2 mm, and radial striations indicating the crack propagation direction are observed within this region. High-magnification SEM images further reveal a relatively thick layer of solidified adhesive, suggesting a considerable depth of crack propagation within the spliced seam. The boundary between the blunted region and the shining region exhibited a lamellar parabolic morphology. Since the crack propagates internally within the spliced seam, which is essentially composed of MMA, flower-like microcracks are also observed at the edge of the shining region. Figure 9f displays the fracture morphology on the spliced seam side of the 65-CSC under a creep stress of 32 MPa, where the maximum width of the blunted region reaches 7.7 mm, further confirming deep internal crack propagation within the spliced seam. These observations indicate that creep failure in the 65-CSC originates from intrinsic defects within the spliced seam. The results suggest that the annealing temperature of 65 °C not only significantly affects the bonding quality at the base material-spliced seam interface but also influences the intrinsic structural integrity of the spliced seam.

5.2. Fatigue Fracture Surface

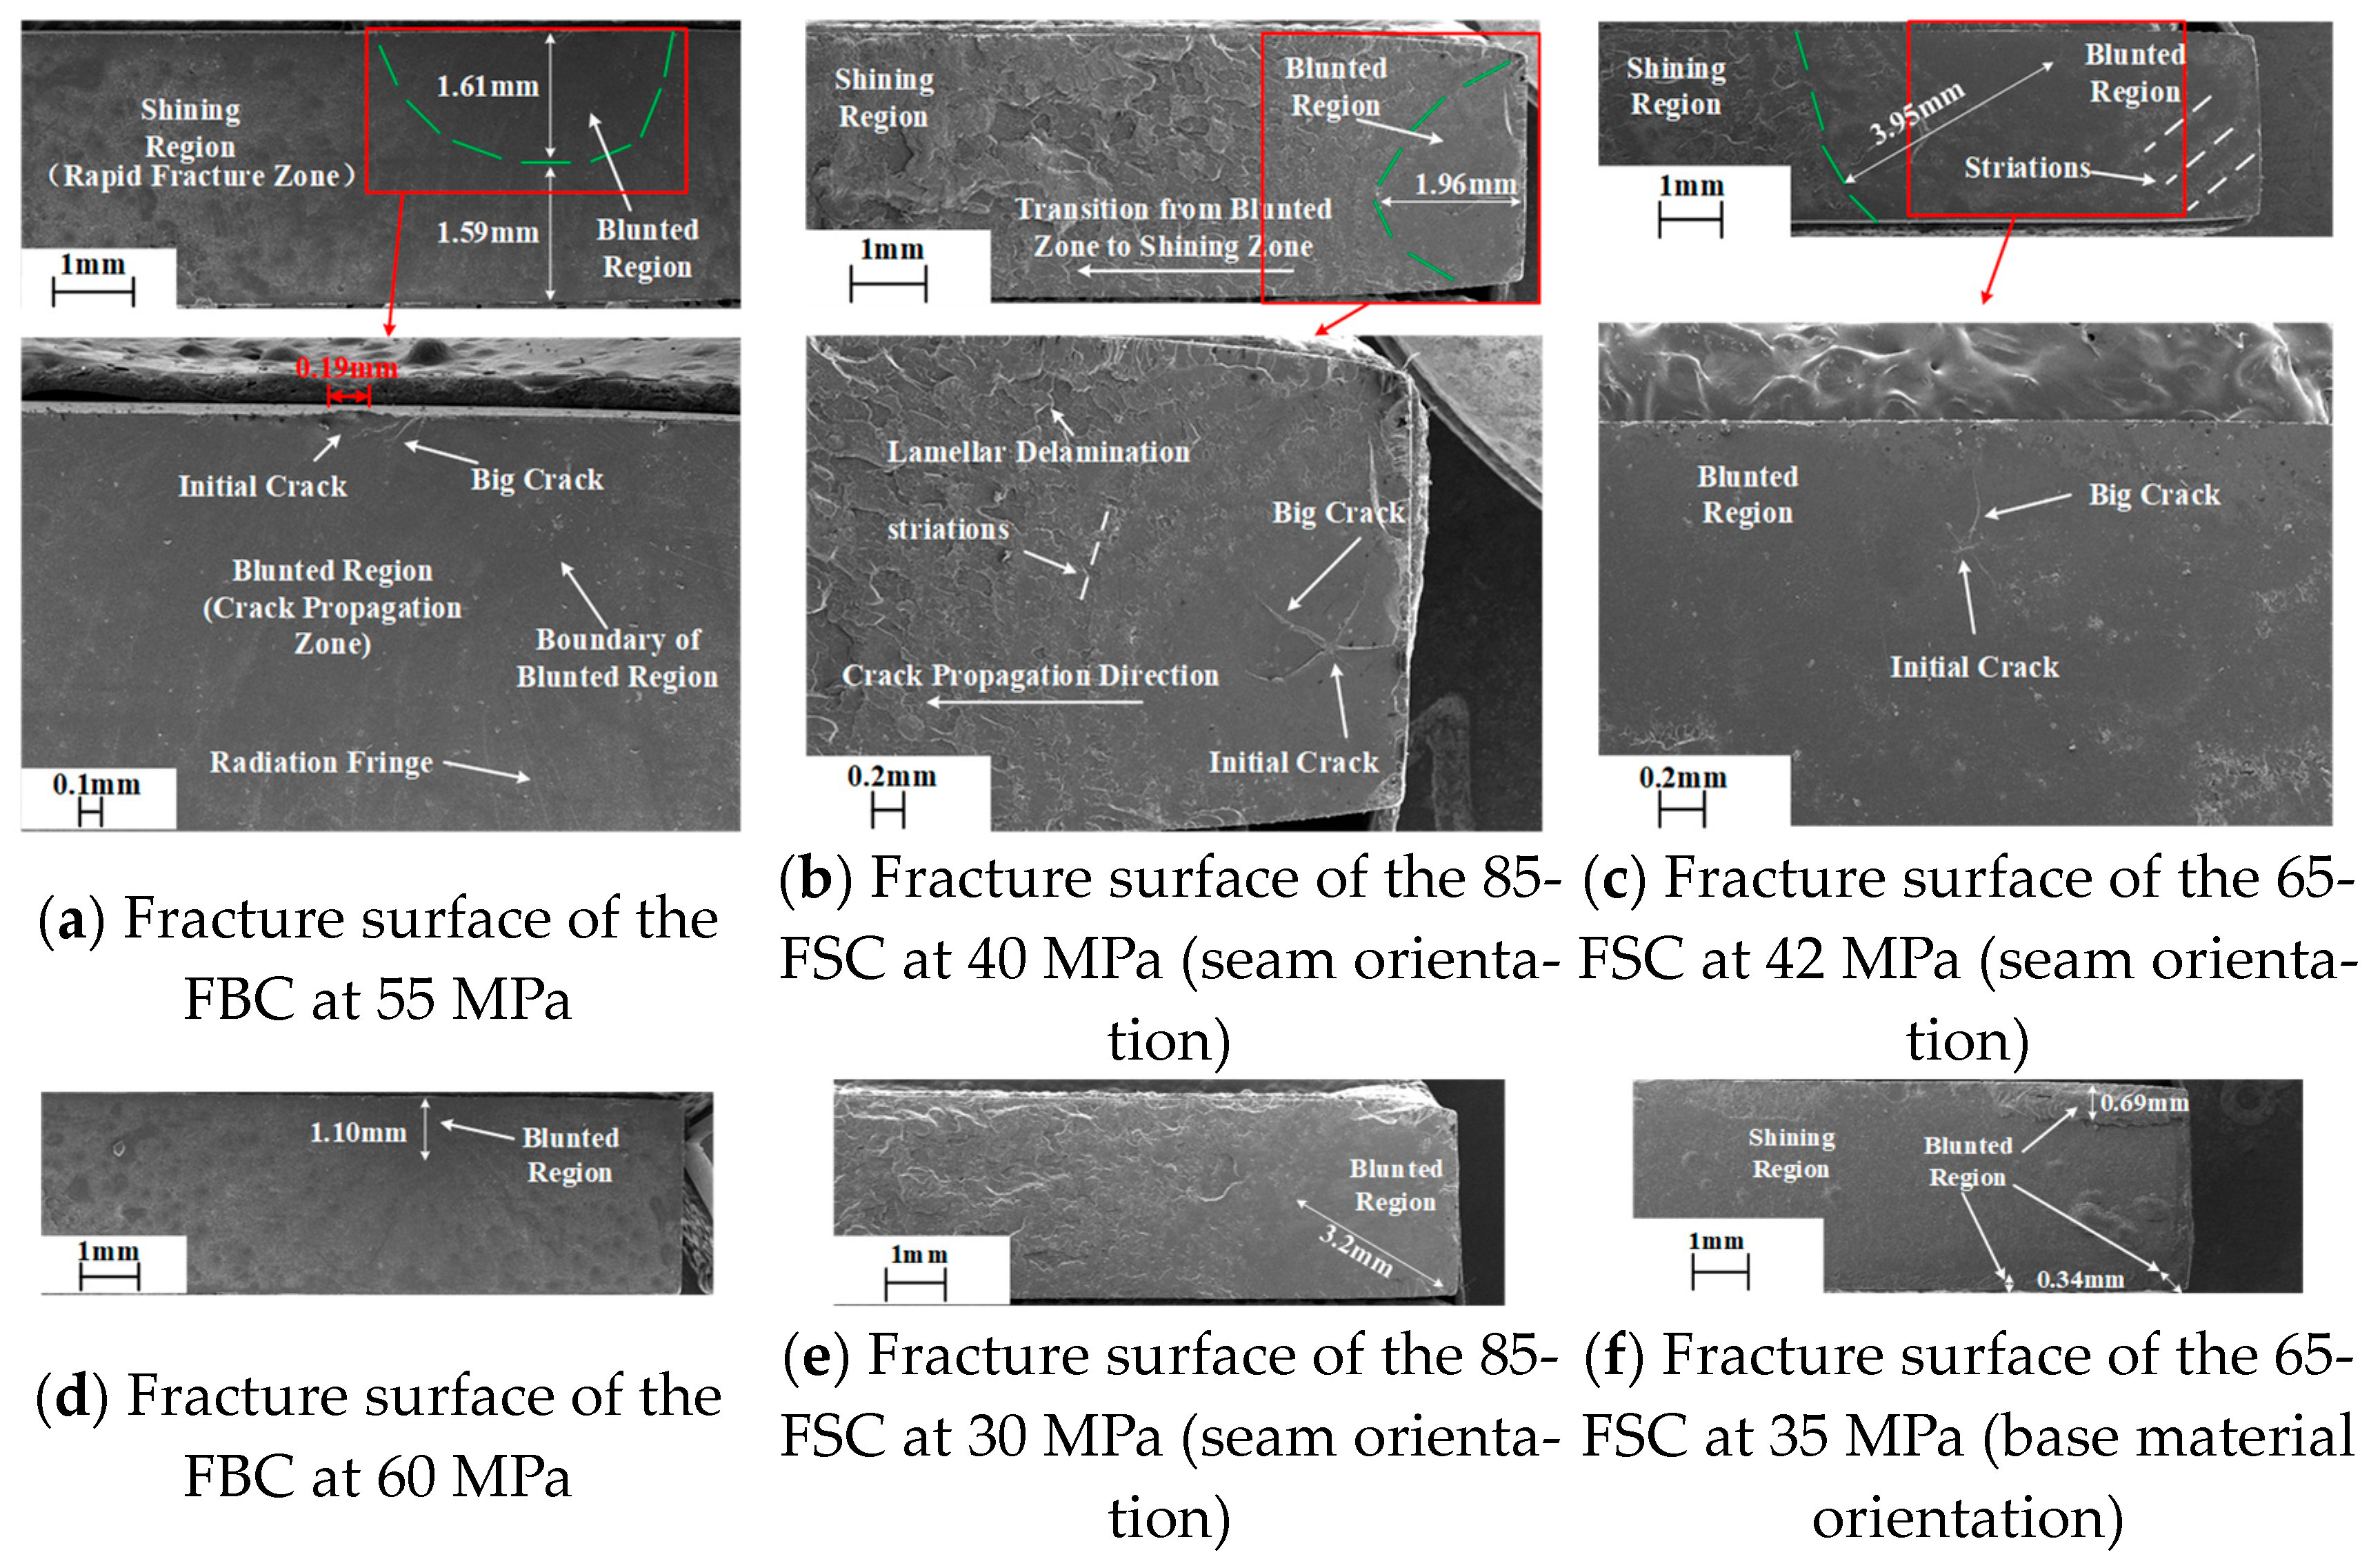
Figure 11 presents the SEM micrographs of fatigue fracture surfaces of FBC tested under various stress amplitudes. As shown in Figure 11a, the fracture surface at a stress amplitude of 55 MPa reveals that the fatigue failure process is similar to that observed in CBC. Crack initiation was traced to a flaw approximately 0.19 mm in width, which subsequently developed into a macroscopic crack under cyclic loading. In contrast to the long, continuous cracks formed under creep loading, fatigue-induced cracks are characterized by discontinuous propagation and shorter lengths. Subsequent crack growth entered the blunted region, where radial striations parallel to the crack propagation direction were observed. These striations were attributed to the initial defect, which served as the nucleation center. The crack ultimately propagated into the shining region, leading to rapid fracture. In the early stage of shining region, flower-like patterns can also be identified, indicating newly formed microcracks. Unlike the CBC, the radial striations in FBC extend continuously into the shining region. Moreover, the boundary of the blunted region in FBC was indistinct, being regarded as a transitional zone. These observations suggest that under fatigue loading the blunted region and shining region developments occur as a continuous process rather than via abrupt transitions, as seen in creep failure. With increasing stress amplitude, the blunted region was found to narrow. Specifically, the width of the blunted region under 55 MPa was measured at 1.61 mm, whereas at 60 MPa it decreased to 0.79 mm Figure 11d, indicating a significant reduction in fatigue life. Fatigue failure in FBC is also governed by initial defects inherent in the base material.
Figure 11b presents the SEM micrograph of the fracture surface of the 85-FSC under a stress amplitude of 45 MPa. Fatigue failure was found to initiate within the adhesive seam, in contrast to its failure behavior under creep stress. A blunted region with a radius of approximately 1.96 mm was defined. Within the shining region, the fracture surface exhibited complex lamellar delamination features. A distinct transition zone between the shining and blunted regions was observed, where fatigue striations are present. The striations were characterized by a progressive increase in lamellar size, indicating the crack propagation direction. In the central portion of the blunted region, an initial crack was detected, surrounded by radially propagating major cracks that formed a star-shaped morphology. Figure 11e shows the fracture surface of the 85-FSC tested at a reduced stress amplitude of 30 MPa, in which the blunted region radius increased to 3.2 mm and the shining region was again characterized by intricate lamellar delamination. These observations indicate that the crack development and failure mechanisms of the 85-FSC are fundamentally different from the 85-CSC. In the 85-FSC, the crack initiates and propagates within the adhesive seam itself, whereas in the 85-CSC, crack initiation typically occurs at the interface and progresses via tearing at the seam–base material interface.
The 65-FSC exhibited different fatigue failure mechanisms depending on the applied stress amplitude. Figure 11c shows the SEM micrograph of the fracture surface along the spliced seam orientation for a 65-FSC subjected to a stress amplitude of 42 MPa. Similar to that of the 85-FSC, Fatigue failure was initiated from a star-shaped primary crack, followed by development of a blunted region with a radius of approximately 3.95 mm. Distinct fatigue striations were clearly observed within the blunted region. In contrast, the shining region displayed markedly simpler lamellar delamination structures than those in the 85-FSC, indicating lower energy dissipation capacity and reduced fatigue resistance in the 65-FSC. Under lower stress amplitude, a different failure mechanism was observed. Figure 11f presents the fracture surface of a 65-FSC tested at 35 MPa, where failure occurred primarily through interfacial tearing between the seam–base material interface. The widest portion of the blunted region in this case reaches 0.69 mm. Based on these observations, two fatigue failure mechanisms are proposed for the 65-FSC: 1. Under high stress amplitude, crack initiation and propagation occur within the adhesive seam. 2. Under low stress amplitude, failure is governed by interfacial tearing at the seam–base material interface.
When prediction curves intersect, coupons exhibiting interfacial failure perform better under low creep stress or low stress amplitude conditions. This finding is supported by the experimental data in Figure 6. For the 85-CSC, in which interfacial tearing occurs, the predicted creep life is lower than that of the CBC at high creep stress. Under reduced creep stress, however, the predicted life of the 85-CSC increases and eventually surpasses that of the CBC. Similarly, the 65-FSC, which is dominated by interfacial failure under low stress amplitudes, is predicted to have a fatigue life below those of both the CBC and the 85-FSC at high amplitudes but to exceed them as the stress amplitude decreases.

6. Conclusions

The creep and fatigue life of structural acrylic are among the key concerns in structural design. In this study, creep and fatigue fracture tests were conducted on base material coupons, 85 °C annealed spliced coupons, and 65 °C annealed spliced coupons of structural acrylic. Based on the experimental results, life prediction models for both creep and fatigue failure were established through regression analysis. Subsequently, three types of design curves for creep and fatigue life were developed using different statistical approaches. Finally, the fracture surfaces of the coupons were examined via SEM, and the failure mechanisms were analyzed and interpreted based on the observed morphologies. The following conclusions are as follows:
(1) A log-log linear regression model is employed to establish the creep and fatigue life prediction equations for structural acrylic. The statistical significance of these models is validated using an F-test, confirming that the fitting equations are statistically significant at the 99.9% confidence level. This result supports the reliability of the lifetime prediction models from a statistical standpoint. Based on the derived life prediction equations, three types of design curves were constructed: the 97.7% survival curve, 95% confidence interval curve lower limit and the one-sided tolerance curve. In terms of conservatism, the 95% confidence interval lower limit is the most stringent, followed by the 97.7% survival probability curve, while the one-sided tolerance curve is relatively less conservative.
(2) Structural acrylic demonstrates a pronounced threshold effect in both creep and fatigue life with respect to applied stress. Using a creep life of 100 years as a reference, the corresponding creep threshold stresses are 25 MPa for the CBC, 29 MPa for the 85-CSC, and 17 MPa for the 65-CSC. Likewise, based on a fatigue life of 1 × 10⁵ cycles, the fatigue threshold stresses are 21 MPa for the FBC, 22 MPa for the 85-FSC, and 31 MPa for the 65-FSC.
(3) The failure of CBC and FBC is primarily governed by the distribution of intrinsic defects within the base material. In contrast, the failure of 85-CSC is mainly determined by the bonding strength at the interface between the base material and the spliced seam. For both 65-CSC and 85-FSC, the fracture initiates from initial defects located near the adhesive interface within the spliced seam. For the 65-FSC, failure under high stress amplitude originates from internal defects within the spliced seam, whereas under low stress amplitude, it shifts to interfacial debonding at the seam–base material interface.
(4) Both the creep and fatigue blunted regions in structural acrylic exhibit a pronounced stress dependence: as the applied stress increases, the size of the blunted region decreases significantly. When the lifetime prediction curves are comparable or exhibit crossover behavior, coupons that fail via interfacial tearing at the spliced seam demonstrate superior performance under low creep stress or low stress amplitude conditions compared to those failing due to internal material defects.

Author Contributions

Conceptualization, Z.W.; Methodology, Z.W.; Software, Y.L.; Validation, B.Z. and Y.W.; Formal analysis, Z.W.; Investigation, Y.L., J.X., Y.S. and W.C.; Resources, Y.W.; Data curation, Y.L.; Writing—original draft, Y.L.; Writing—review & editing, Z.W.; Visualization, Y.L.; Supervision, B.Z., Y.W. and J.X.; Project administration, B.Z. and J.X.; Funding acquisition, Z.W. All authors have read and agreed to the published version of the manuscript.

Funding

This work is financially supported by the National Natural Science Foundation of China (Nos. 52208169 and 12127808), and the Ministry of Science and Technology of China (No. 2022YFA1604704).

Data Availability Statement

The original contributions presented in this study are included in the article. Further inquiries can be directed to the corresponding author.

Acknowledgments

The author would like to express sincere gratitude to the three anonymous architectural experts for their valuable guidance. Their contributions have been indispensable to the success of this research.

Conflicts of Interest

Authors Bailun Zhang and Yulong Song were employed by the company China Resources Land Limited. Authors Jianxia Xiao and Wei Cheng were employed by the company Donchamp (Jiangsu) Materials Technology Co., Ltd. The remaining authors declare that the research was conducted in the absence of any commercial or financial relationships that could be construed as a potential conflict of interest.

References

  1. GB/T 2680-2021; Glass in Building—Determination of Light Transmittance, Solar Direct Transmittance, Total Solar Energy Transmittance, Ultraviolet Transmittance and Related Glazing Factors. Standards Press of China: Beijing, China, 2021. (In Chinese)
  2. Reggente, M.; Harhash, M.; Kriegel, S.; He, W.; Masson, P.; Faerber, J.; Pourroy, G.; Palkowski, H.; Carradò, A. Resin-Free Three-Layered Ti/PMMA/Ti Sandwich Materials: Adhesion and Formability Study. Compos. Struct. 2019, 218, 107–119. [Google Scholar] [CrossRef]
  3. Shi, Z.L.; Zhao, G.Q.; Wang, G.L.; Zhang, L.; Wei, C.; Chai, J. Development of Ultralight, Tough and Hydrophobic Polymethylmethacrylate/Polyvinylidene Fluoride Shape Memory Foams for Heat Insulation Applications. Mater. Des. 2023, 225, 111527. [Google Scholar] [CrossRef]
  4. Pawar, E. A Review Article on Acrylic PMMA. IOSR J. Mech. Civ. Eng. 2016, 13, 1–4. [Google Scholar] [CrossRef]
  5. Wang, J.; Xu, Y.J.; Zhang, W.H. Finite Element Simulation of PMMA Aircraft Windshield Against Bird Strike Using a Rate and Temperature Dependent Nonlinear Viscoelastic Constitutive Model. Compos. Struct. 2014, 108, 21–30. [Google Scholar] [CrossRef]
  6. Du, Y.M.; Pei, P.H.; Suo, T.; Gao, G. Large Deformation Mechanical Behavior and Constitutive Modeling of Oriented PMMA. Int. J. Mech. Sci. 2023, 257, 108520. [Google Scholar] [CrossRef]
  7. Guo, H.; Lu, C.; Chen, Y.; Tao, J.; Chen, L. Thermal-Mechanical Coupling Behavior of Directional Polymethylmethacrylate under Tension and Compression. Polymers 2018, 10, 1279. [Google Scholar] [CrossRef]
  8. Weon, J.I.; Creasy, T.S.; Sue, H.J. Mechanical Behavior of Polymethylmethacrylate with Molecules Oriented via Simple Shear. Polym. Eng. Sci. 2005, 45, 249–256. [Google Scholar] [CrossRef]
  9. Gao, Z.Z.; Liu, Z.Q.; Liu, W.; Yue, Z.F. Experimental and Constitutive Investigation on Tensile and Compressive Behavior of MDYB-3 at Different Temperatures and Loading Rates. Int. J. Polym. Mater. Polym. Biomater. 2011, 60, 340–350. [Google Scholar] [CrossRef]
  10. National Institute of Standards and Technology. Molecular and Microscopic Structure of Oriented Polymers and Their Influence on Mechanical Behavior; NIST Special Publication 960-16e3; National Institute of Standards and Technology: Gaithersburg, MD, USA, 1985. [Google Scholar]
  11. Reynolds Polymer Technology. Jewel Changi Airport. Reynolds Polymer. 2019. Available online: https://www.reynoldspolymer.com/projects/jewel-changi-airport/ (accessed on 30 April 2025).
  12. Xu, X.J.; Wang, Z.; Chen, S.M. Solar Neutrino Physics. Prog. Part. Nucl. Phys. 2023, 131, 104043. [Google Scholar] [CrossRef]
  13. Wang, Z.Y.; Liu, Y.H.; Chen, S.M.; Wang, Y.; Wang, Z.; Huang, M. Structural Design of the Acrylic Vessel for the Jinping Neutrino Experiment. J. Instrum. 2024, 19, P07041. [Google Scholar] [CrossRef]
  14. Wilson, J.D. Thermally-Driven Scintillator Flow in the SNO+ Neutrino Detector. Nucl. Instrum. Methods Phys. Res. Sect. A Accel. Spectrom. Detect. Assoc. Equip. 2023, 1055, 168430. [Google Scholar] [CrossRef]
  15. Qian, X.H.; Ma, X.Y.; Heng, Y.K.; He, W.; Tang, H.; Hou, S.; Pei, Y. Application of Non-Contact Strain Measurement Based on CCD Camera in PMMA Material Constitutive Model. Mater. Res. Express 2021, 8, 095305. [Google Scholar] [CrossRef]
  16. Guo, W.W.; Zhang, X.Q.; Su, J. Fatigue Damage Mechanism Analyses of Oriented Sheets of Polymethyl Methacrylate Glasses. Key Eng. Mater. 2011, 462, 36–41. [Google Scholar] [CrossRef]
  17. Okeke, C.P.; Thite, A.N.; Durodola, J.F.; Greenrod, M.T. Fatigue Life Prediction of Polymethyl Methacrylate (PMMA) Polymer under Random Vibration Loading. Procedia Struct. Integr. 2019, 17, 589–595. [Google Scholar] [CrossRef]
  18. Adibeig, M.R.; Hassanifard, S.; Vakili-Tahami, F. Optimum Creep Lifetime of Polymethyl Methacrylate (PMMA) Tube Using Rheological Creep Constitutive Models Based on Experimental Data. Polym. Test. 2019, 75, 107–116. [Google Scholar] [CrossRef]
  19. Zhou, F.; Hou, S.J.; Qian, X.H.; Chen, Z.; Zheng, C.; Xu, F. Creep Behavior and Lifetime Prediction of PMMA Immersed in Liquid Scintillator. Polym. Test. 2016, 53, 323–328. [Google Scholar] [CrossRef]
  20. Yin, W.H.; Xie, Z.Y.; Yin, Y.M.; Yi, J.; Liu, X.; Wu, H.; Wang, S.; Xie, Y.; Yang, Y. Aging Behavior and Lifetime Prediction of PMMA under Tensile Stress and Liquid Scintillator Conditions. Adv. Ind. Eng. Polym. Res. 2019, 2, 82–87. [Google Scholar] [CrossRef]
  21. Liu, W.; Yao, X.; Ma, Y.; Chen, X.; Guo, G.; Ma, L. Prediction on Fatigue Life of U-Notched PMMA Plate. Fatigue Fract. Eng. Mater. Struct. 2017, 40, 300–312. [Google Scholar] [CrossRef]
  22. Huang, A.F.; Yao, W.X.; Chen, F. Analysis of Fatigue Life of PMMA at Different Frequencies Based on a New Damage Mechanics Model. Math. Probl. Eng. 2014, 1, 352676. [Google Scholar] [CrossRef]
  23. He, Z.H.; Wang, F.; Gaidai, O.; Qu, W.; Li, C. Lifetime Assessment of Deep-Sea Manned Cabin with PMMA Pressure-Resistant Hull Prior to Micro-Cracks. Ocean Eng. 2024, 306, 118119. [Google Scholar] [CrossRef]
  24. Said, B.L.; Hentati, H.; Wali, M.; Ayadi, B.; Alhadri, M. Damage Investigation in PMMA Polymer: Experimental and Phase-Field Approaches. Polymers 2024, 16, 3304. [Google Scholar] [CrossRef]
  25. Ahmed, M.A.M.; Jurczak, K.M.; Lynn, N.S.; Mulder, J.-P.S.H.; Verpoorte, E.M.J.; Nagelkerke, A. Rapid Prototyping of PMMA-Based Microfluidic Spheroid-on-a-Chip Models Using Micromilling and Vapour-Assisted Thermal Bonding. Sci. Rep. 2024, 14, 2831. [Google Scholar] [CrossRef]
  26. Lauterwasser, B.D.; Kramer, E.J. Microscopic Mechanisms and Mechanics of Crazing Growth and Fracture. Philos. Mag. A 1979, 38, 469–495. [Google Scholar] [CrossRef]
  27. Yan, Y.; Sun, Y.; Su, J.; Li, B.; Zhou, P. Crazing Initiation and Growth in Polymethyl Methacrylate under Effects of Alcohol and Stress. Polymers 2023, 15, 1375. [Google Scholar] [CrossRef] [PubMed]
  28. Sezavar, A.; Zebarjad, S.M.; Sajjadi, S.A. A Study on the Effect of Nano Alumina Particles on Fracture Behavior of PMMA. Technologies 2015, 3, 94–102. [Google Scholar] [CrossRef]
  29. GB/T 1040.2-2022; Plastics—Determination of Tensile Properties—Part 2: Test Conditions for Moulding and Extrusion Plastics. Standards Press of China: Beijing, China, 2022. (In Chinese)
  30. ASTM D638-22; Standard Test Method for Tensile Properties of Plastics. ASTM International: West Conshohocken, PA, USA, 2022.
  31. Wang, Z.Y.; Liu, Y.H.; Zhang, B.L.; Wang, Y.Q.; Xiao, J.X. Creep Life Analysis of Acrylic Base Material and Bulk Polymerized Connected Coupons Annealed at Different Temperatures. J. Southeast Univ. Nat. Sci. Ed. 2025, in press. Available online: https://link.cnki.net/urlid/32.1178.n.20250609.1341.002 (accessed on 6 August 2025). (In Chinese).
  32. GJB 2033-94; Test Method for Fatigue of Aircraft Transparent Materials. General Equipment Department of the PLA: Beijing, China, 1994. (In Chinese)
  33. ASTM E739-15; Standard Practice for Statistical Analysis of Linear or Linearized Stress-Life (S-N) and Strain-Life (ε-N) Fatigue Data. ASTM International: West Conshohocken, PA, USA, 2015.
  34. Yang, X.H. Fatigue and Fracture, 2nd ed.; Huazhong University of Science and Technology Press: Wuhan, China, 2020. [Google Scholar]
  35. Jiao, D.; Qu, T.R.; Zhang, Z.F. Macroscopic Bifurcation and Fracture Mechanism of Polymethyl Methacrylate. Adv. Eng. Mater. 2015, 17, 1454–1464. [Google Scholar] [CrossRef]
  36. Atkins, A.G.; Lee, C.S.; Caddell, R.M. Time-Temperature Dependent Fracture Toughness of PMMA. J. Mater. Sci. 1975, 10, 1381–1393. [Google Scholar] [CrossRef]
  37. Kuleyin, H.; Gümrük, R.; Çalişkan, S. The Effect of ABS Fraction on the Fatigue Behavior of PMMA/ABS Polymer Blends. Mater. Today Commun. 2022, 33, 104139. [Google Scholar] [CrossRef]
  38. Simsiriwong, J.; Shrestha, R.; Shamsaei, N.; Lugo, M.; Moser, R.D. Effects of Microstructural Inclusion on Fatigue Life of Polyether Ether Ketone (PEEK). J. Mech. Behav. Biomed. Mater. 2015, 51, 388–397. [Google Scholar] [CrossRef]
  39. Gómez, E.C.; Almaraz, M.G.D.; Juarez, J.C.V. Crack Initiation and Propagation on CT Specimens of Two Polymers (ABS and PMMA) under Cyclic Constant Displacement Loading. Theor. Appl. Fract. Mech. 2019, 100, 55–64. [Google Scholar] [CrossRef]
  40. Ravi-Chandar, K.; Yang, B. On the Role of Microcracks in the Dynamic Fracture of Brittle Materials. J. Mech. Phys. Solids 1997, 45, 535–563. [Google Scholar] [CrossRef]
  41. Kopp, J.B.; Girardot, J. Dynamic Fracture in a Semicrystalline Biobased Polymer: An Analysis of the Fracture Surface. Int. J. Fract. 2020, 226, 121–132. [Google Scholar] [CrossRef]
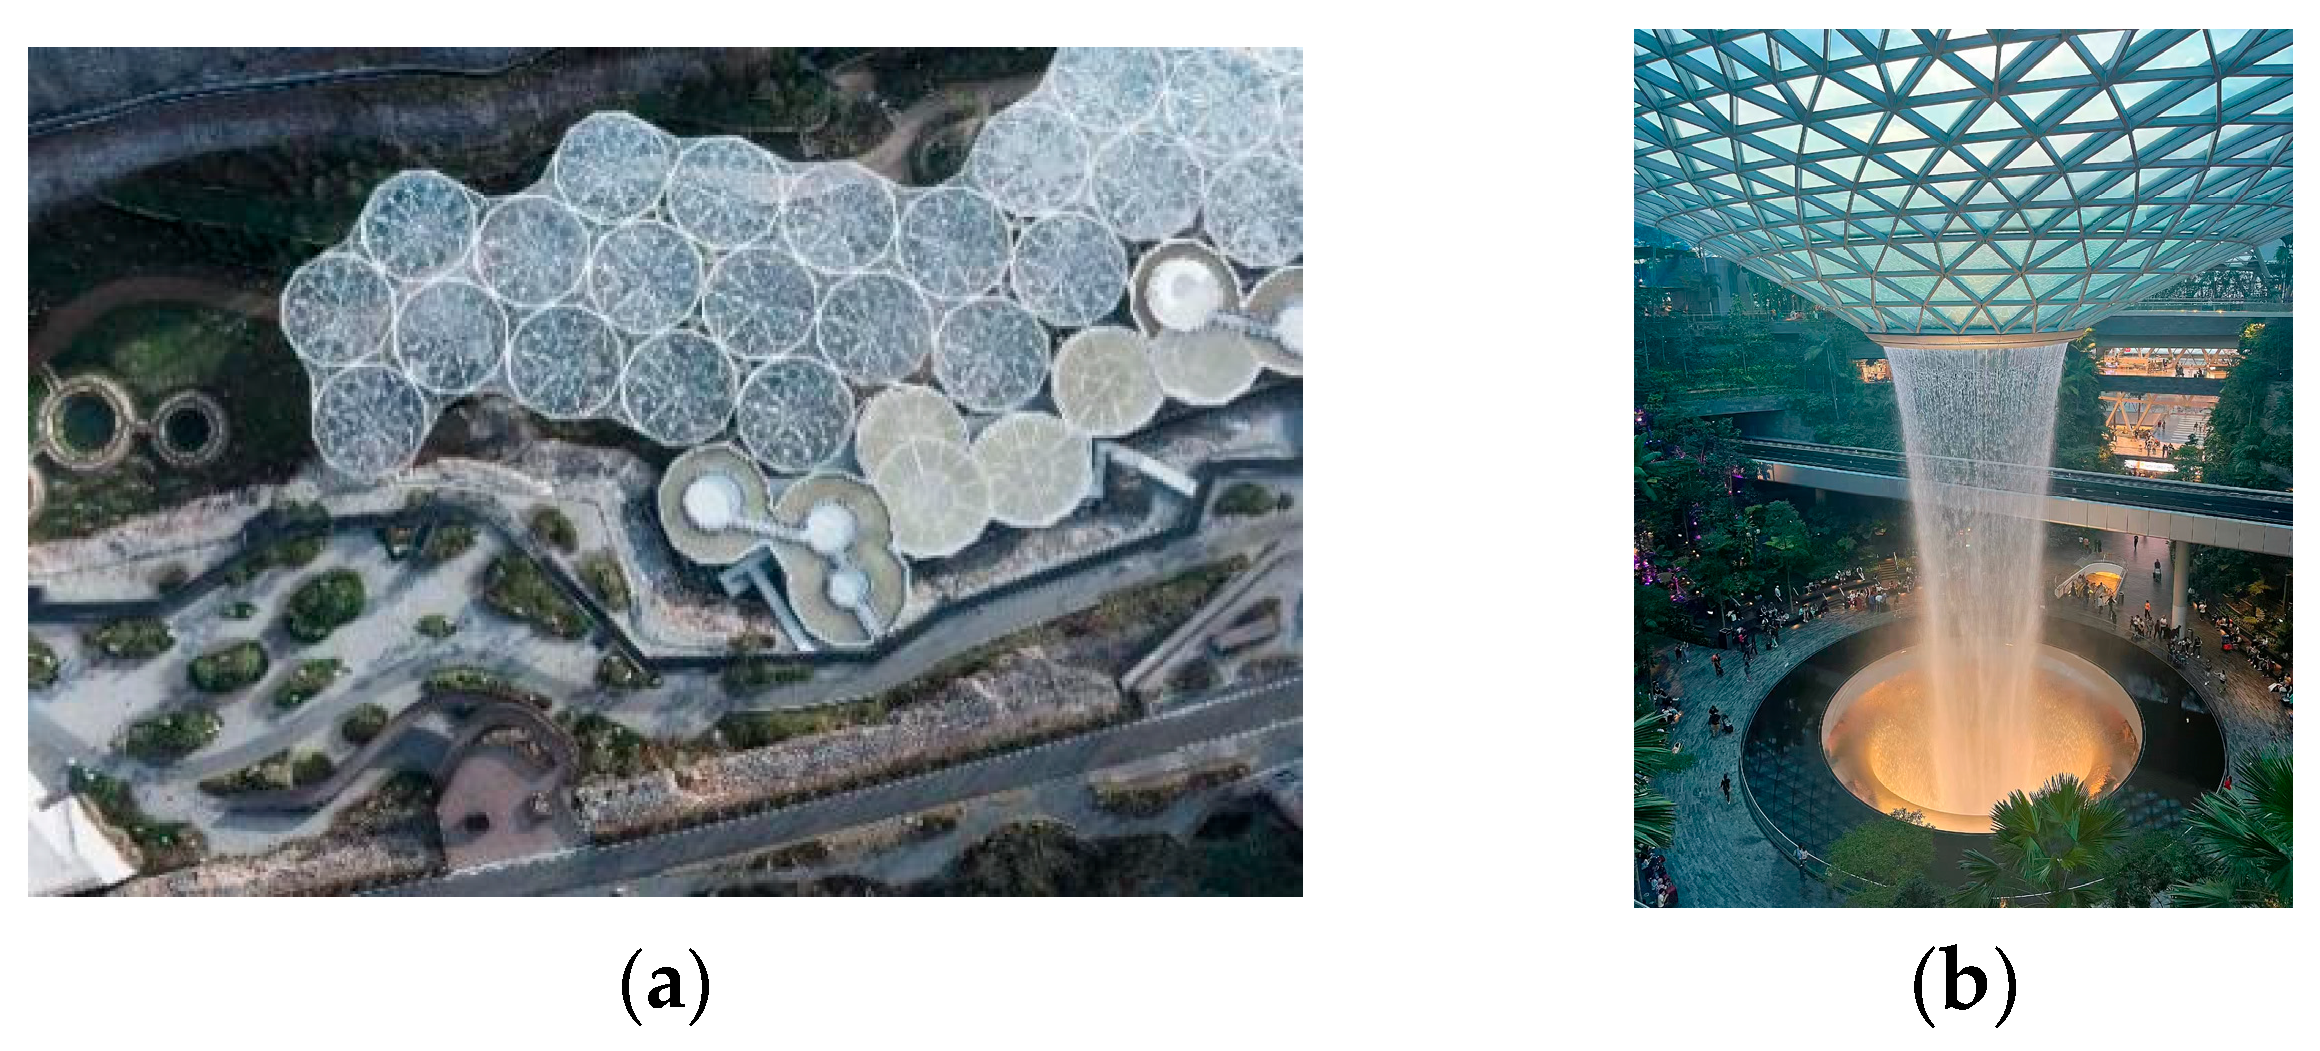
Figure 1. Application of acrylic in structural engineering. (a) Nanjing Future Garden; (b) Jewel at Changi Airport [11].
Buildings 15 03677 g001
Figure 2. The bulk polymerization process of structural acrylic.
Buildings 15 03677 g002
Figure 3. Coupon size (mm).
Buildings 15 03677 g003
Figure 4. Creep fracture coupon.
Buildings 15 03677 g004
Figure 5. Fatigue fracture coupon.
Buildings 15 03677 g005
Figure 6. Life prediction curves.
Buildings 15 03677 g006
Figure 7. Design Curves for Creep and Fatigue Life.
Buildings 15 03677 g007
Figure 8. Life prediction curve and design curve under low stress level.
Buildings 15 03677 g008
Figure 9. SEM micrograph of the creep fracture surface.
Buildings 15 03677 g009
Figure 10. Observation direction of the fracture surface of spliced coupon.
Buildings 15 03677 g010
Figure 11. SEM micrograph of the fatigue fracture surface.
Buildings 15 03677 g011
Table 1. Short-term tensile test results.
Coupon TypeUltimate Strength (MPa)Elastic Modulus (GPa)
Base material coupon74.4 ± 4.33.36 ± 0.22
85 °C annealing spliced coupon64.3 ± 3.63.34 ± 0.31
65 °C annealing spliced coupon52.8 ± 1.43.41 ± 0.53
Note: Each value in the table represents the mean of 5 replicate test results.
Table 2. Creep life of structural acrylic.
TypeCreep Stress (MPa)Creep Life (min)Creep Stress (MPa)Creep Life (min)
CBC416438; 12,574; 12,3615091; 107; 74
42.53492; 8132; 590551254; 1132; 1188
45643; 2602; 32295275; 552; 419
47125; 116; 21953141; 299; 558
48995449; 201; 469
492675; 72335552; 75; 64
85-CSC43.51323; 2700; 171747704; 980; 1523
445368; 534748186; 396; 183
453245; 6974491015; 249
46560; 1622; 62050110; 48
65-CSC284410; 13,07532183; 286; 489; 1100; 630; 361
29539; 64033361; 237
304564; 19583436; 37
31188; 503635; 54
Table 3. Fatigue life of structural acrylic.
TypeStress Amplitude (MPa)Fatigue Life (Cycle)Stress Amplitude (MPa)Fatigue Life (Cycle)
CBC403754; 8504; 4274501303; 2074; 1131
424116; 6062; 277155592; 696; 704; 977; 980
451421; 2233; 1421; 2712; 1878; 165760397; 450; 314; 274; 361; 350
472666; 1578; 2689--
85-CSC3512,401; 15,022456221; 5510; 3713; 4009; 2402
4066,201; 22,401; 34,601501521; 428; 807; 2346; 1542
65-CSC3578,742; 81,400422728; 2718; 7683
3822,127; 24,157; 30,247452101; 4101; 1468; 2728; 2718
406301; 6699; 6547; 12,549; 495650801; 401; 201; 102; 100
Table 4. Life prediction equation.
Coupon TypeLife Prediction EquationsrR2
CBC lg T = 45.04 25.06 lg σ 0.67−0.7630.582
85-CSC lg T = 59.93 34.26 lg σ 0.42−0.8250.680
65-CSC lg T = 46.51 29.30 lg σ 0.58−0.8040.646
FBC lg N = 13.88 6.35 lg σ 0.13−0.9470.898
85-FSC lg N = 18.90 9.25 lg σ 0.37−0.8100.657
65-FSC lg N = 29.16 15.72 lg σ 0.25−0.9520.906
Note: s denotes the standard deviation, r represents the correlation coefficient, and R2 refers to the coefficient of determination.
Disclaimer/Publisher’s Note: The statements, opinions and data contained in all publications are solely those of the individual author(s) and contributor(s) and not of MDPI and/or the editor(s). MDPI and/or the editor(s) disclaim responsibility for any injury to people or property resulting from any ideas, methods, instructions or products referred to in the content.