Article

Analytical Investigation of CFRP- and Steel Plate-Strengthened RC Beams with Partially Unbonded Reinforcement

Department of Civil and Environmental Engineering, Syracuse University, Syracuse, NY 13244, USA
*
Author to whom correspondence should be addressed.
Buildings 2025, 15(20), 3665; https://doi.org/10.3390/buildings15203665 (registering DOI)
Submission received: 2 September 2025 / Revised: 23 September 2025 / Accepted: 5 October 2025 / Published: 11 October 2025
(This article belongs to the Special Issue Assessment and Retrofit of Reinforced Concrete Structures)

Abstract

This study investigates the flexural behavior of reinforced concrete (RC) beams strengthened with externally bonded Carbon Fiber Reinforced Polymer (CFRP) or steel plate (SP), with partial debonding between internal steel reinforcement and surrounding concrete. A finite element model was developed using ABAQUS (v2021) and validated against existing experimental data by others. A total of 296 beam models were analyzed to assess the effects of shear span-to-depth ratio ( a v / d ), reinforcement ratio ( ρ ), debonding degree ( λ ), strengthening material type (CFRP/SP), and material thickness ( t ) on residual flexural strength. Based on the finite element analysis (FEA) results, analytical models were proposed using a dimensionless parameter Ψ , defined as the ratio of equivalent plastic region length to neutral axis depth. Analytical models were developed in IBM SPSS Statistics (Version 30) and showed strong agreement with FEA results. The findings provide insight into the influence of reinforcement debonding on structural behavior and support improved prediction of residual flexural capacity in strengthened RC beams with partially unbonded reinforcement.

1. Introduction

RC is widely used for its strength, durability, and cost-effectiveness; however, bond deterioration between steel reinforcement and concrete, often caused by frequent overloading, corrosion, or fatigue, can markedly reduce flexural performance. Experimental studies consistently confirm this trend. Minkarah and Ringo [1] reported a strength reduction of about 21% when 63% of the span was unbonded. Cairns and Zhao [2] and Raoof and Lin [3] observed further reductions as the unbonded ratio or length increased, with the effect especially severe in regions of high bending moment. Jeppsson and Thelandersson [4] found that 80% bond loss resulted in a substantial 33% drop in load capacity, underscoring the critical importance of bond integrity. Jnaid and Aboutaha [5] demonstrated that beams with over 90% unbonded length lost up to 35% of their flexural strength, particularly in heavily reinforced sections. In contrast, Mousa [6] recorded only moderate reductions, limited to about 13%, which he attributed to localized bonding at stirrup locations. More recently, Yang and Wang [7] showed that when the unbonded ratio exceeded 40%, flexural capacity decreased by approximately 15%, while lower ratios had negligible influence. Collectively, these findings highlight the significant loss of strength associated with extensive bond deterioration.
Extensive experimental studies have demonstrated that externally bonded reinforcement (EBR) systems, particularly CFRP and SP, can substantially improve the flexural performance of RC beams. CFRP has been shown to increase ultimate load capacity by 13–90%, enhance stiffness, and improve crack control [8,9,10,11,12], although these gains are often accompanied by reductions in ductility of up to 50–60% and premature failures such as debonding or cover delamination. Its efficiency is most evident in under-reinforced beams and decreases in heavily reinforced members. Similarly, SP strengthening frequently provides strength gains exceeding 50%, and in some cases more than doubles the capacity of control beams [13,14,15], but ductility loss and plate-end debonding remain recurring limitations. Experimental findings consistently indicate that proper anchorage—through methods such as extended bonded length, mechanical bolts, or U- and L-shaped wraps—is indispensable for both CFRP and SP systems [16,17,18] to prevent premature debonding, improve ductility, and ensure reliable utilization of the strengthening materials. Overall, while CFRP and SP are effective in flexural strengthening, their long-term efficiency depends critically on rational anchorage design, bonding quality, and reinforcement configuration.
FEA has been employed in studies of RC beams, including those strengthened with externally bonded CFRP and SP using platforms such as ANSYS (v10.0), ABAQUS (v2009), ADINA (v2004a), and [19,20,21,22,23,24,25,26]. These models reproduce both global and local responses with good agreement to experimental tests, and advanced strategies such as concrete damage plasticity (CDP), cohesive elements, and traction–separation laws have successfully captured premature debonding, cover delamination, and anchorage effects. However, applications explicitly addressing beams with partially unbonded reinforcement remain very limited. Previous work examined either unbonded reinforcement in conventional RC beams or strengthening effects in fully bonded members. To date, no finite element studies have systematically and explicitly investigated the influence of partially unbonded reinforcement along the beam length in strengthened members, and no analytical models are available to predict their residual flexural capacity.
This study develops and validates an ABAQUS finite element model to simulate RC beams, strengthened RC beams, and beams with partially unbonded reinforcement along the length of the beam. While some previous studies have considered unbonded reinforcement in conventional beams and it is included here only as a reference, the main objective is to explore the effects of partially unbonded reinforcement in strengthened members. CFRP and SP are adopted as external strengthening systems. The numerical model evaluates the effects of bond deterioration on force transfer, deformation characteristics, and residual flexural capacity through a large-scale parametric study. Furthermore, two analytical models—one for CFRP-strengthened beams and the other for SP-strengthened beams—are proposed and calibrated against numerical and experimental results to predict the residual flexural capacity under partial bonding. By addressing both unstrengthened and strengthened members, this work provides new insights into the impact of bond deterioration mechanisms on RC beams and delivers simplified tools for design and assessment.

2. FEA Model

A total of 296 beam models were analyzed to assess the effects of shear span-to-depth ratio ( a v / d ), reinforcement ratio ( ρ ), debonding degree ( λ ), strengthening material type (CFRP/SP), and material thickness ( t ) on residual flexural strength. The symbols used in this study are summarized in Appendix B for reference.

2.1. Cross-Section Design of Specimens

Figure 1 shows the cross-section of a 250 mm (9.84 in) × 550 mm (21.65 in) RC beam (effective depth 500 mm [19.69 in]) externally strengthened with CFRP or SP. The beam includes three bottom bars, two top bars, and stirrups at 250 mm (9.84 in) spacing. CFRP sheets and SP were bonded using a 1 mm epoxy layer. All strengthening materials, including the adhesive, had a uniform width of 200 mm (7.87 in). All reinforcing bars were G60 steel with a yield strength of 414 MPa (60 ksi). The concrete compressive strength was 21 MPa (3.06 ksi).

2.2. Parametric Framework

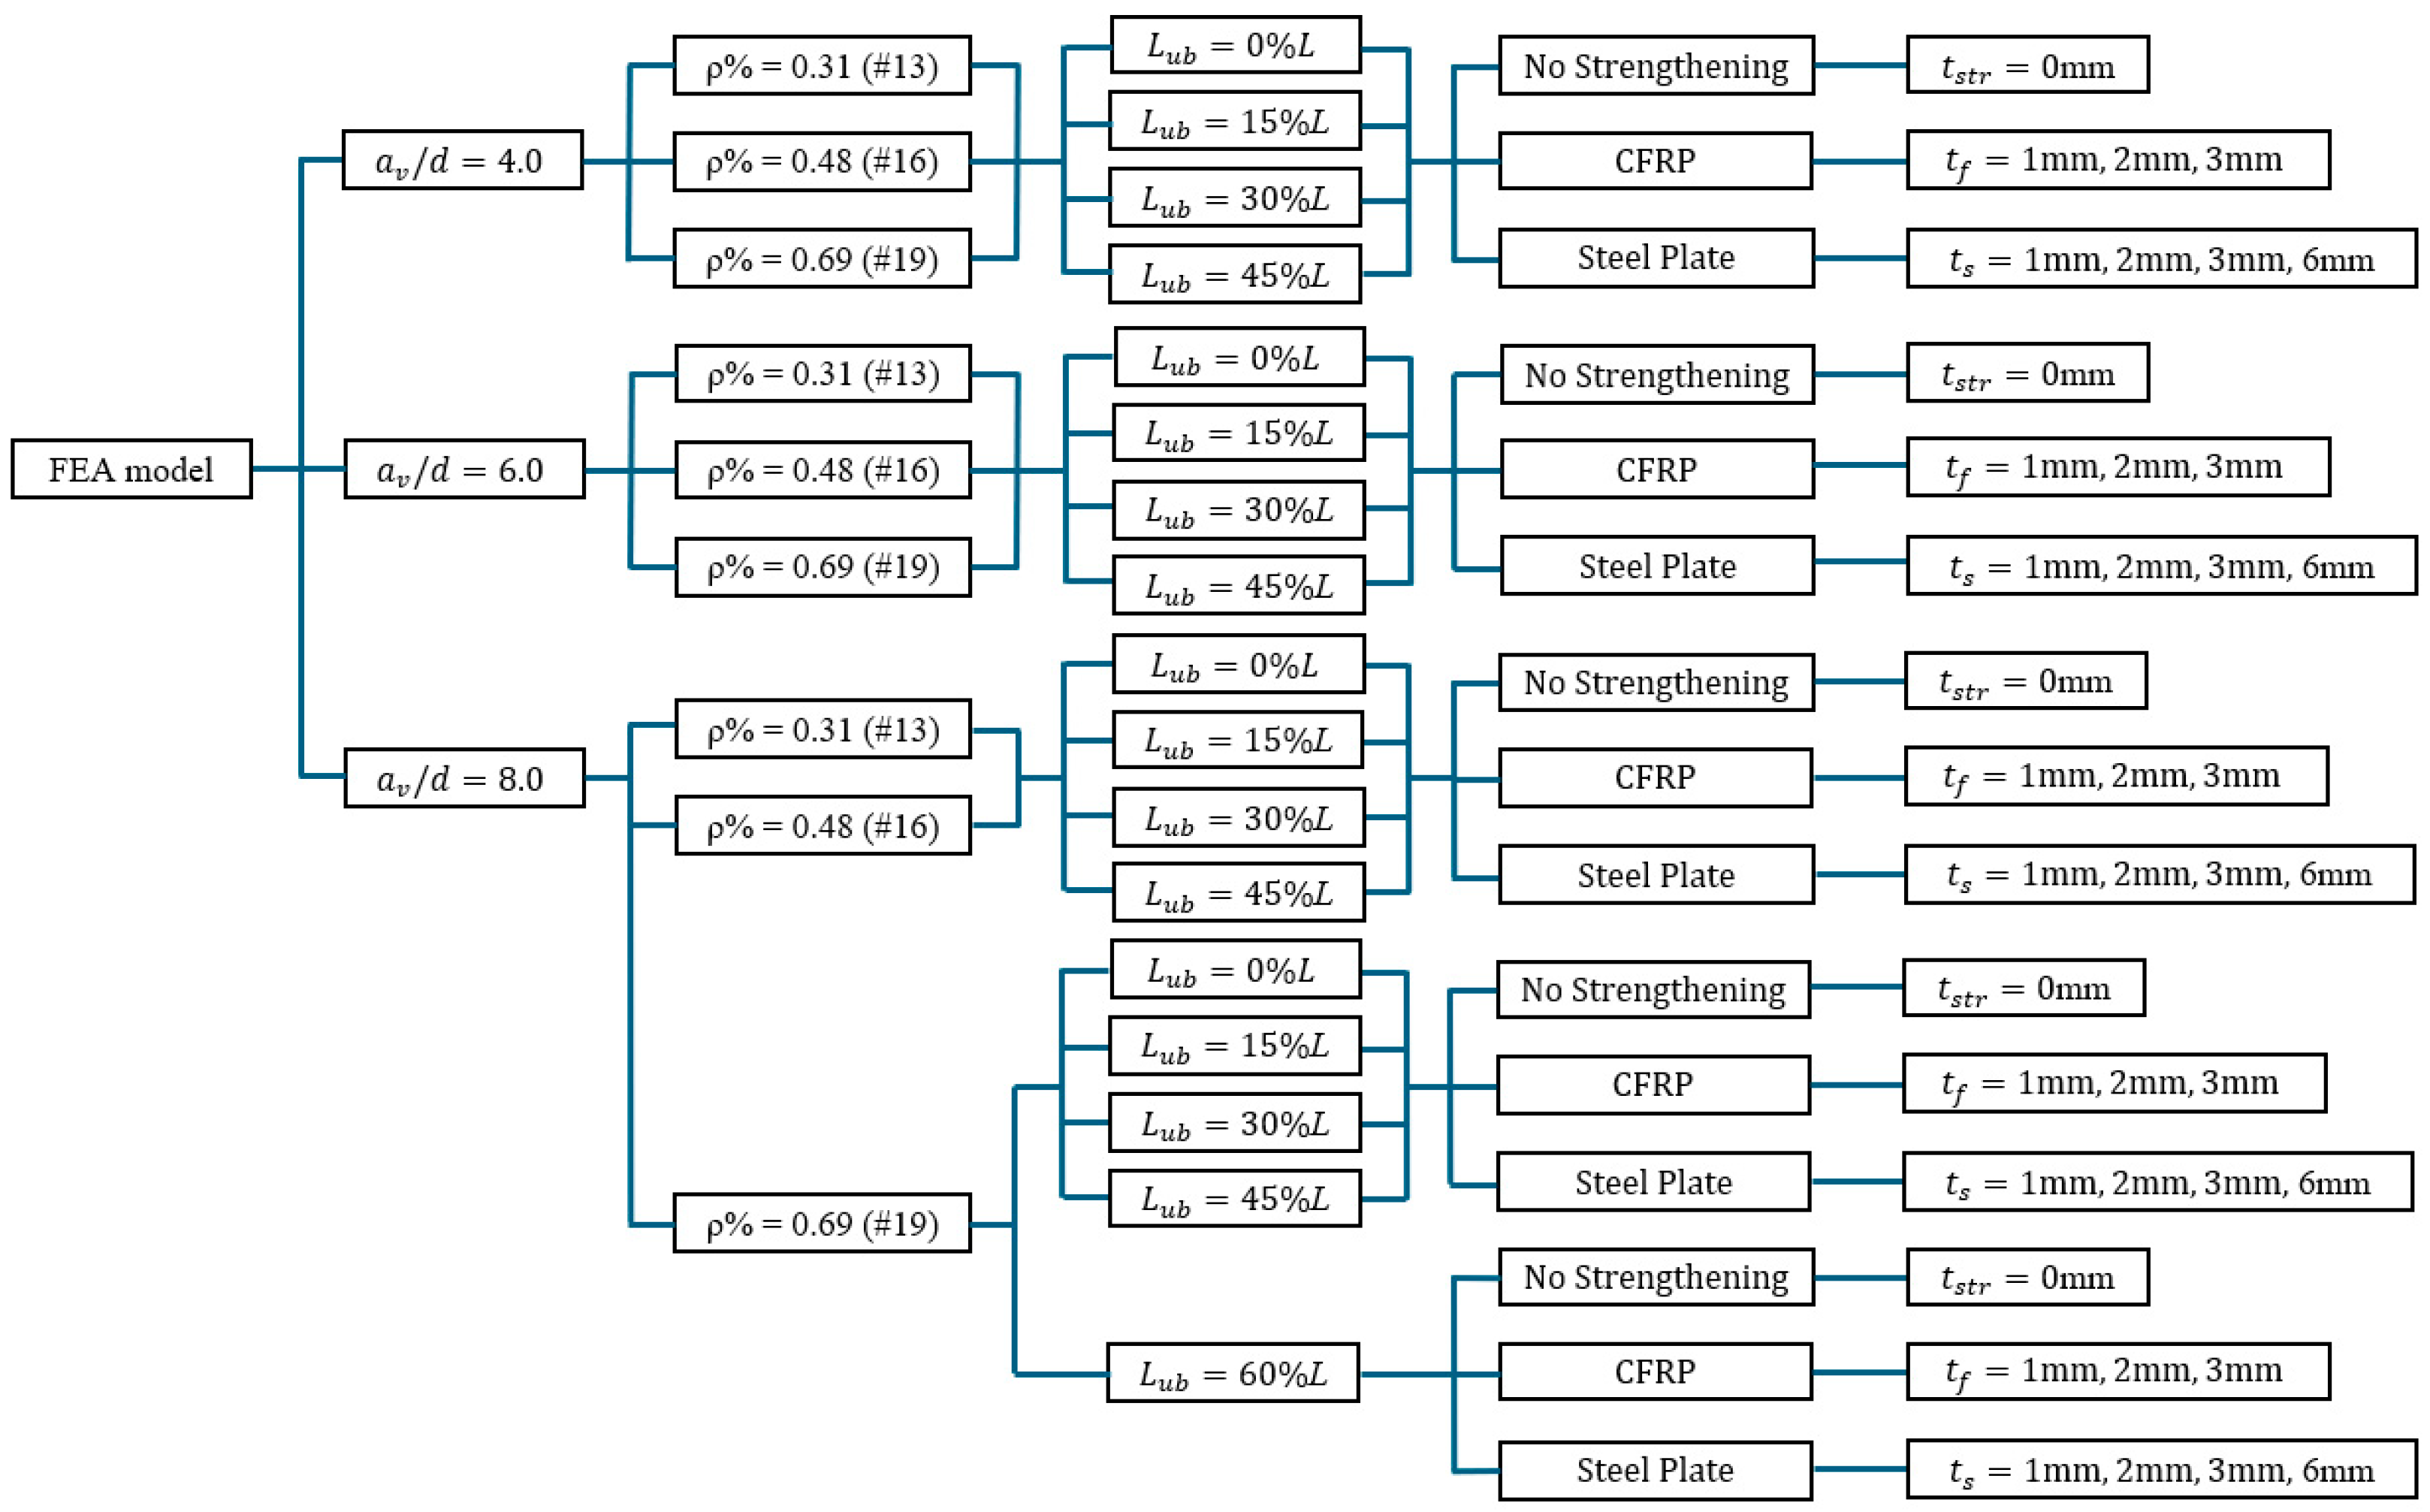
In this study, the parametric framework (Figure 2) was constructed using five key variables: shear span-to-depth ratio ( a v / d ), reinforcement ratio ( ρ ), debonding degree ( λ ), strengthening material type (CFRP/SP), and material thickness ( t ). These parameters were selected because they collectively govern the flexural performance of RC beams: the shear span-to-depth ratio defines the balance between shear and flexure; the reinforcement ratio reflects the effect of steel content on strength and ductility; the debonding degree quantifies bond deterioration between concrete and steel; and the strengthening material type and thickness capture the influence of external reinforcement systems. SP and CFRP were specifically chosen because they represent the two most widely adopted external strengthening techniques: SP as the conventional metallic method, offering high stiffness and ductility but susceptible to corrosion and added weight, and CFRP as the most common composite alternative, providing a high strength-to-weight ratio and corrosion resistance.
The shear span-to-depth ratios ( a v / d ) considered in this study were 4.0, 6.0, and 8.0. These values were selected to represent the transition from intermediate beams, where shear effects are still significant, to slender beams, where flexural behavior dominates. Lower ratios (e.g., a v / d = 2.0) were not included because they are typically associated with shear-dominated brittle failures, which fall outside the flexural focus of this study. Similarly, very large ratios (e.g., a v / d ≥ 10.0) were excluded because they correspond to extremely slender beams that exhibit nearly pure flexural behavior and are rarely adopted in practice.
The reinforcement ratios ( ρ ) adopted in this study are ρ = 0.31% (#13), 0.48% (#16), and 0.69% (#19). The lowest ratio of 0.31% was chosen because it approximately satisfies the minimum longitudinal reinforcement requirement prescribed by ACI 318-22 [27], thereby ensuring adequate crack control and ductility. The other two ratios, 0.48% and 0.69%, correspond to standard bar sizes (#16 and #19) that are frequently used in laboratory beam tests and in practical structural design.
The debonding degree ( λ ) was defined as the ratio of the unbonded reinforcement length to the clear span ( L u b / L ). It should be noted that the debonding degree is idealized in this study as a fixed segment located at the maximum moment region to highlight flexural effects. In practice, bond deterioration may occur locally due to corrosion, fatigue, or overloading, and this represents a limitation of the adopted simplification. Values of 0%, 15%, 30%, and 45% were adopted to capture the progressive influence of bond deterioration from fully bonded to severely unbonded conditions. The upper bound of 45% was chosen because preliminary simulations showed that at this level the flexural capacity experienced a noticeable reduction, making it a practical limit for systematic investigation. An extreme value of 60% was examined only for the slenderest beam ( a v / d = 8.0) with the highest reinforcement ratio (#19), since prior studies and the present literature review indicate that beams with larger shear-span ratios (flexure-dominated) and higher reinforcement ratios are more sensitive to unbonded effects. This case was included as a reference point to illustrate the potential maximum impact of debonding under favorable flexural conditions.
For external strengthening, two materials were considered: CFRP sheets and SP. CFRP thicknesses ( t f ) of 1 mm, 2 mm, and 3 mm were selected to reflect typical multi-layer applications in practice, since CFRP sheets are commonly applied in thin layers and excessive thickness is rarely used due to cost and constructability considerations. SP thicknesses ( t s ) of 1 mm, 2 mm, 3 mm, and 6 mm were adopted. The first three levels (1–3 mm) provide a direct comparison with CFRP at equivalent thicknesses, while the additional 6 mm plate represents a practical upper bound frequently employed in strengthening applications. This selection ensures that both materials are investigated within realistic ranges while allowing meaningful comparisons of their strengthening efficiency.

2.3. Strengthening Scheme

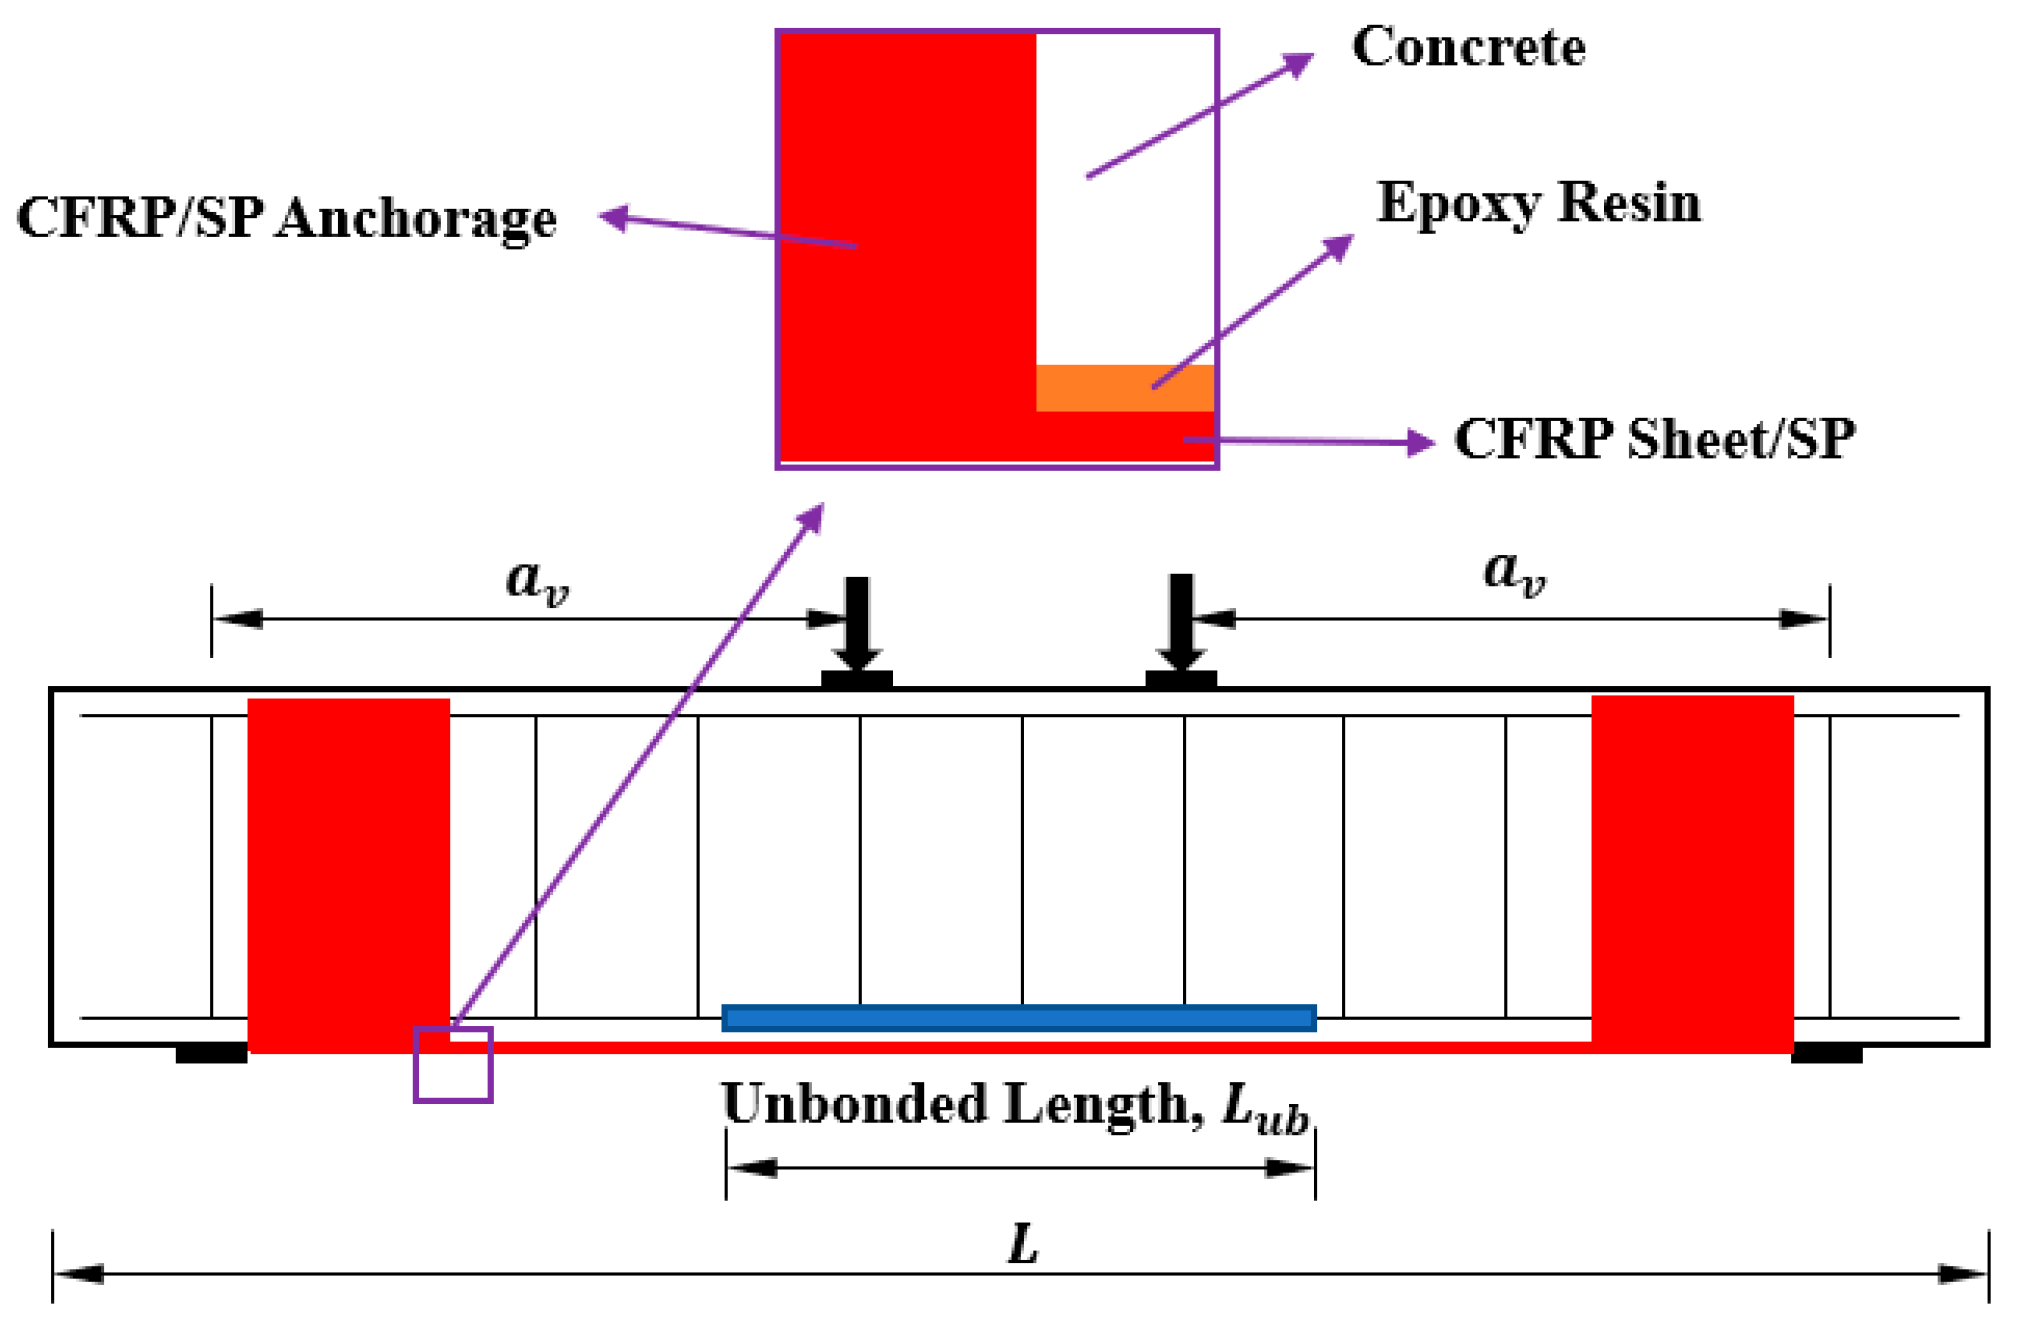
Two strengthening methods were used to improve beam flexural behavior: CFRP sheets and SP. To isolate flexural capacity while preventing anchorage failure, CFRP used U-shaped end wraps in addition to end bonding to suppress premature debonding (Figure 3), whereas SP anchorage was provided by full bonding at the plate ends. In both systems, the strengthening layers were surface-bonded to the beam soffit, and full bonding was assumed in the anchorage zones to ensure effective load transfer. CFRP sheets with a tensile strength of 2800 MPa (406 ksi) were bonded using Sikadur®-30 (Sika AG, Zurich, Switzerland) epoxy with a failure strength of 24.8 MPa (3.6 ksi). SP made of Grade 50 steel with a yield strength of 345 MPa (50 ksi) were applied with matching widths. For FEA modeling, perfect bonding was assumed in the anchorage zones so that the structural effects could be isolated.

2.4. Materials

2.4.1. Concrete

The stress–strain behavior of concrete depends on factors such as loading rate, binder type, mix ratio, and aggregate properties. In this study, concrete was modeled using two established constitutive laws: the compressive response followed Yang et al. [28], and the tensile response was based on Nayal and Rasheed [29], both validated for representing concrete under compressive and tensile loading.
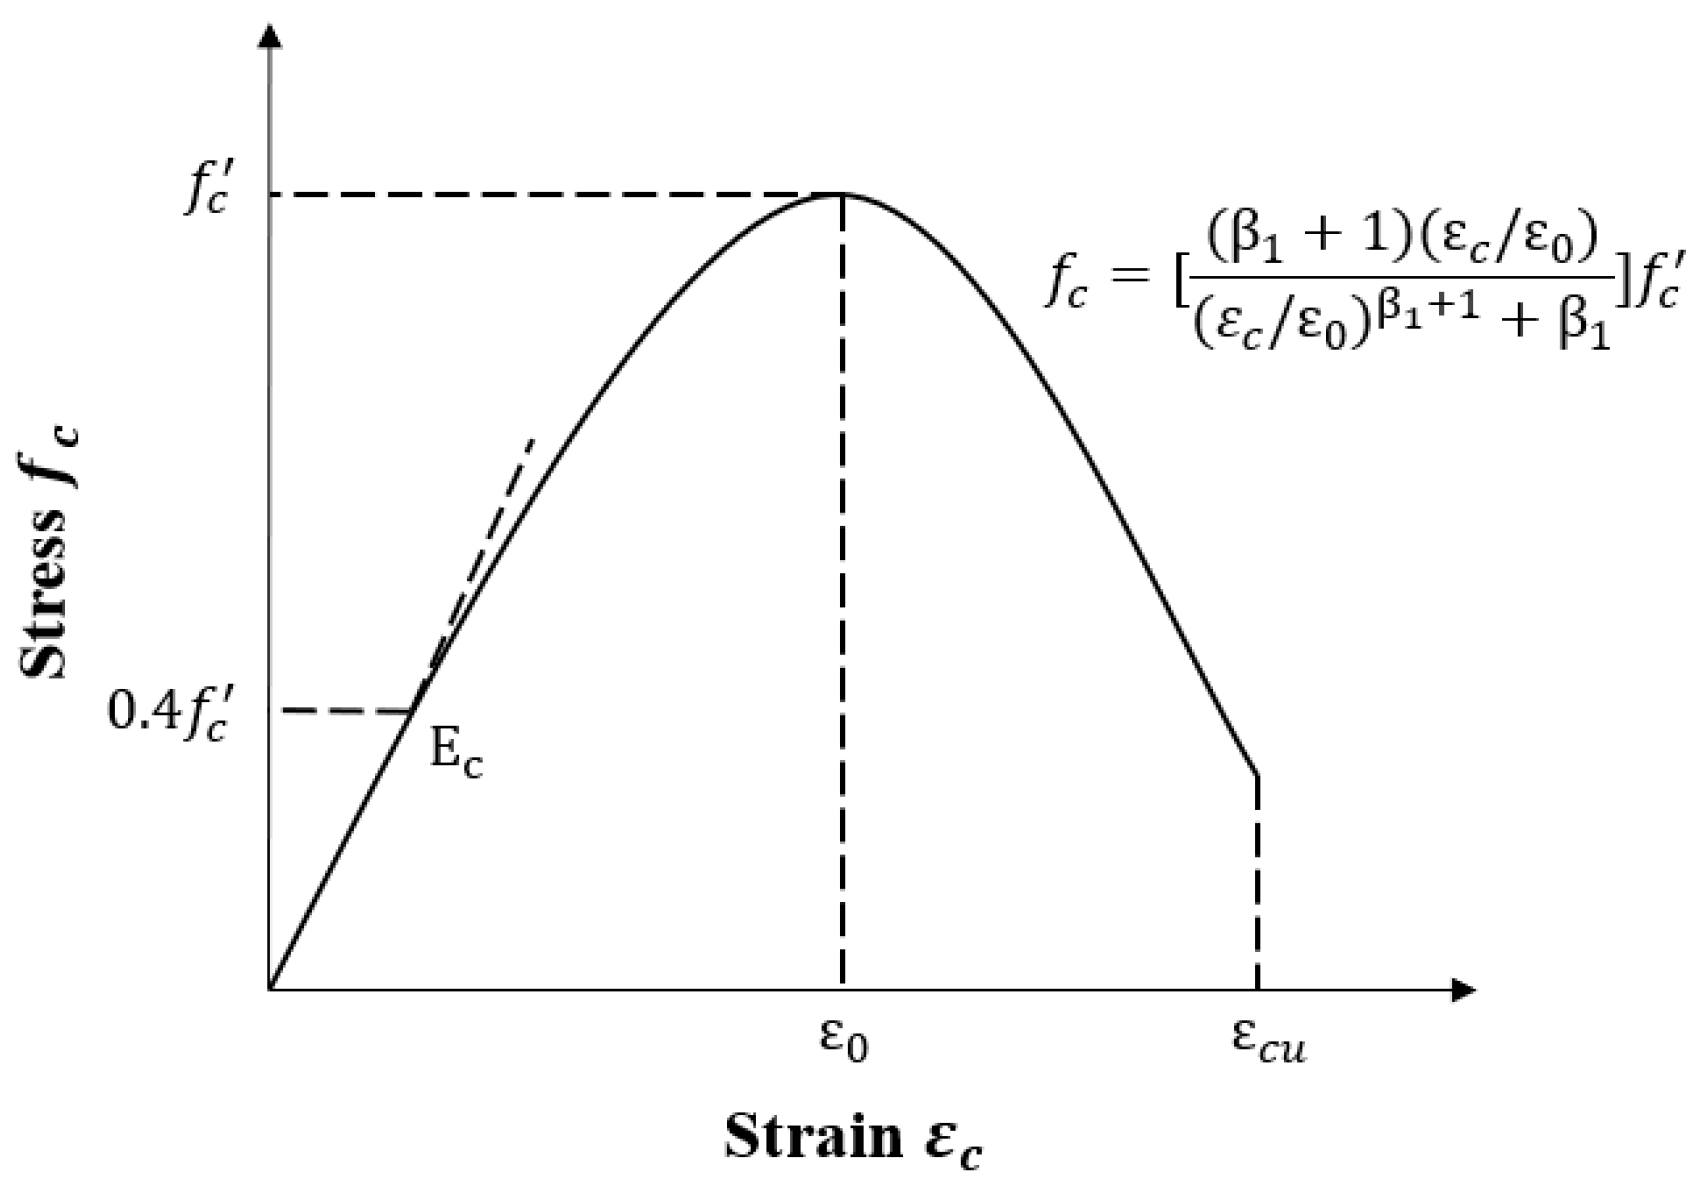
Figure 4 illustrates the compressive stress–strain relationship of concrete based on Yang et al. [28], capturing its elastic stage, peak strength, and post-peak softening. In this model, the modulus of elasticity is defined as the slope of the line from the origin to 40% of the peak stress and is calculated as Equation (1):
E c = A 1 f c a w c w 0 b  
where f c is the compressive strength of concrete; w c is the density of concrete, use 2400 k g / m 3 ; w 0 = 2300 k g / m 3 is a reference value for concrete density; the best-fit values of A 1 , a, and b in Equation (1) are 8470, 1/3, and 1.17.
The nonlinear stress–strain curve is then expressed as:
f c = ( β 1 + 1 ) ( ε c ε 0 ) ( ε c ε 0 ) β 1 + 1 + β 1 f c
where the peak strain ε 0 is given by:
ε 0 = 0.0016 e x p 240 ( f c E c )
The coefficient β 1 , which controls the ascending and descending branches, is defined as:
β 1 = 0.2 · exp 0.73 ξ ,                 f o r   ε c < ε 0 0.41 · exp 0.77 ξ ,             f o r   ε c > ε 0
with ξ expressed as:
ξ = ( f c f 0 ) 0.67 ( w 0 w c ) 1.17 ,   f 0 = 10   M P a
According to the AASHTO Bridge Design Specifications [29], the tensile strength of concrete is approximated by:
f t = 0.23 f c
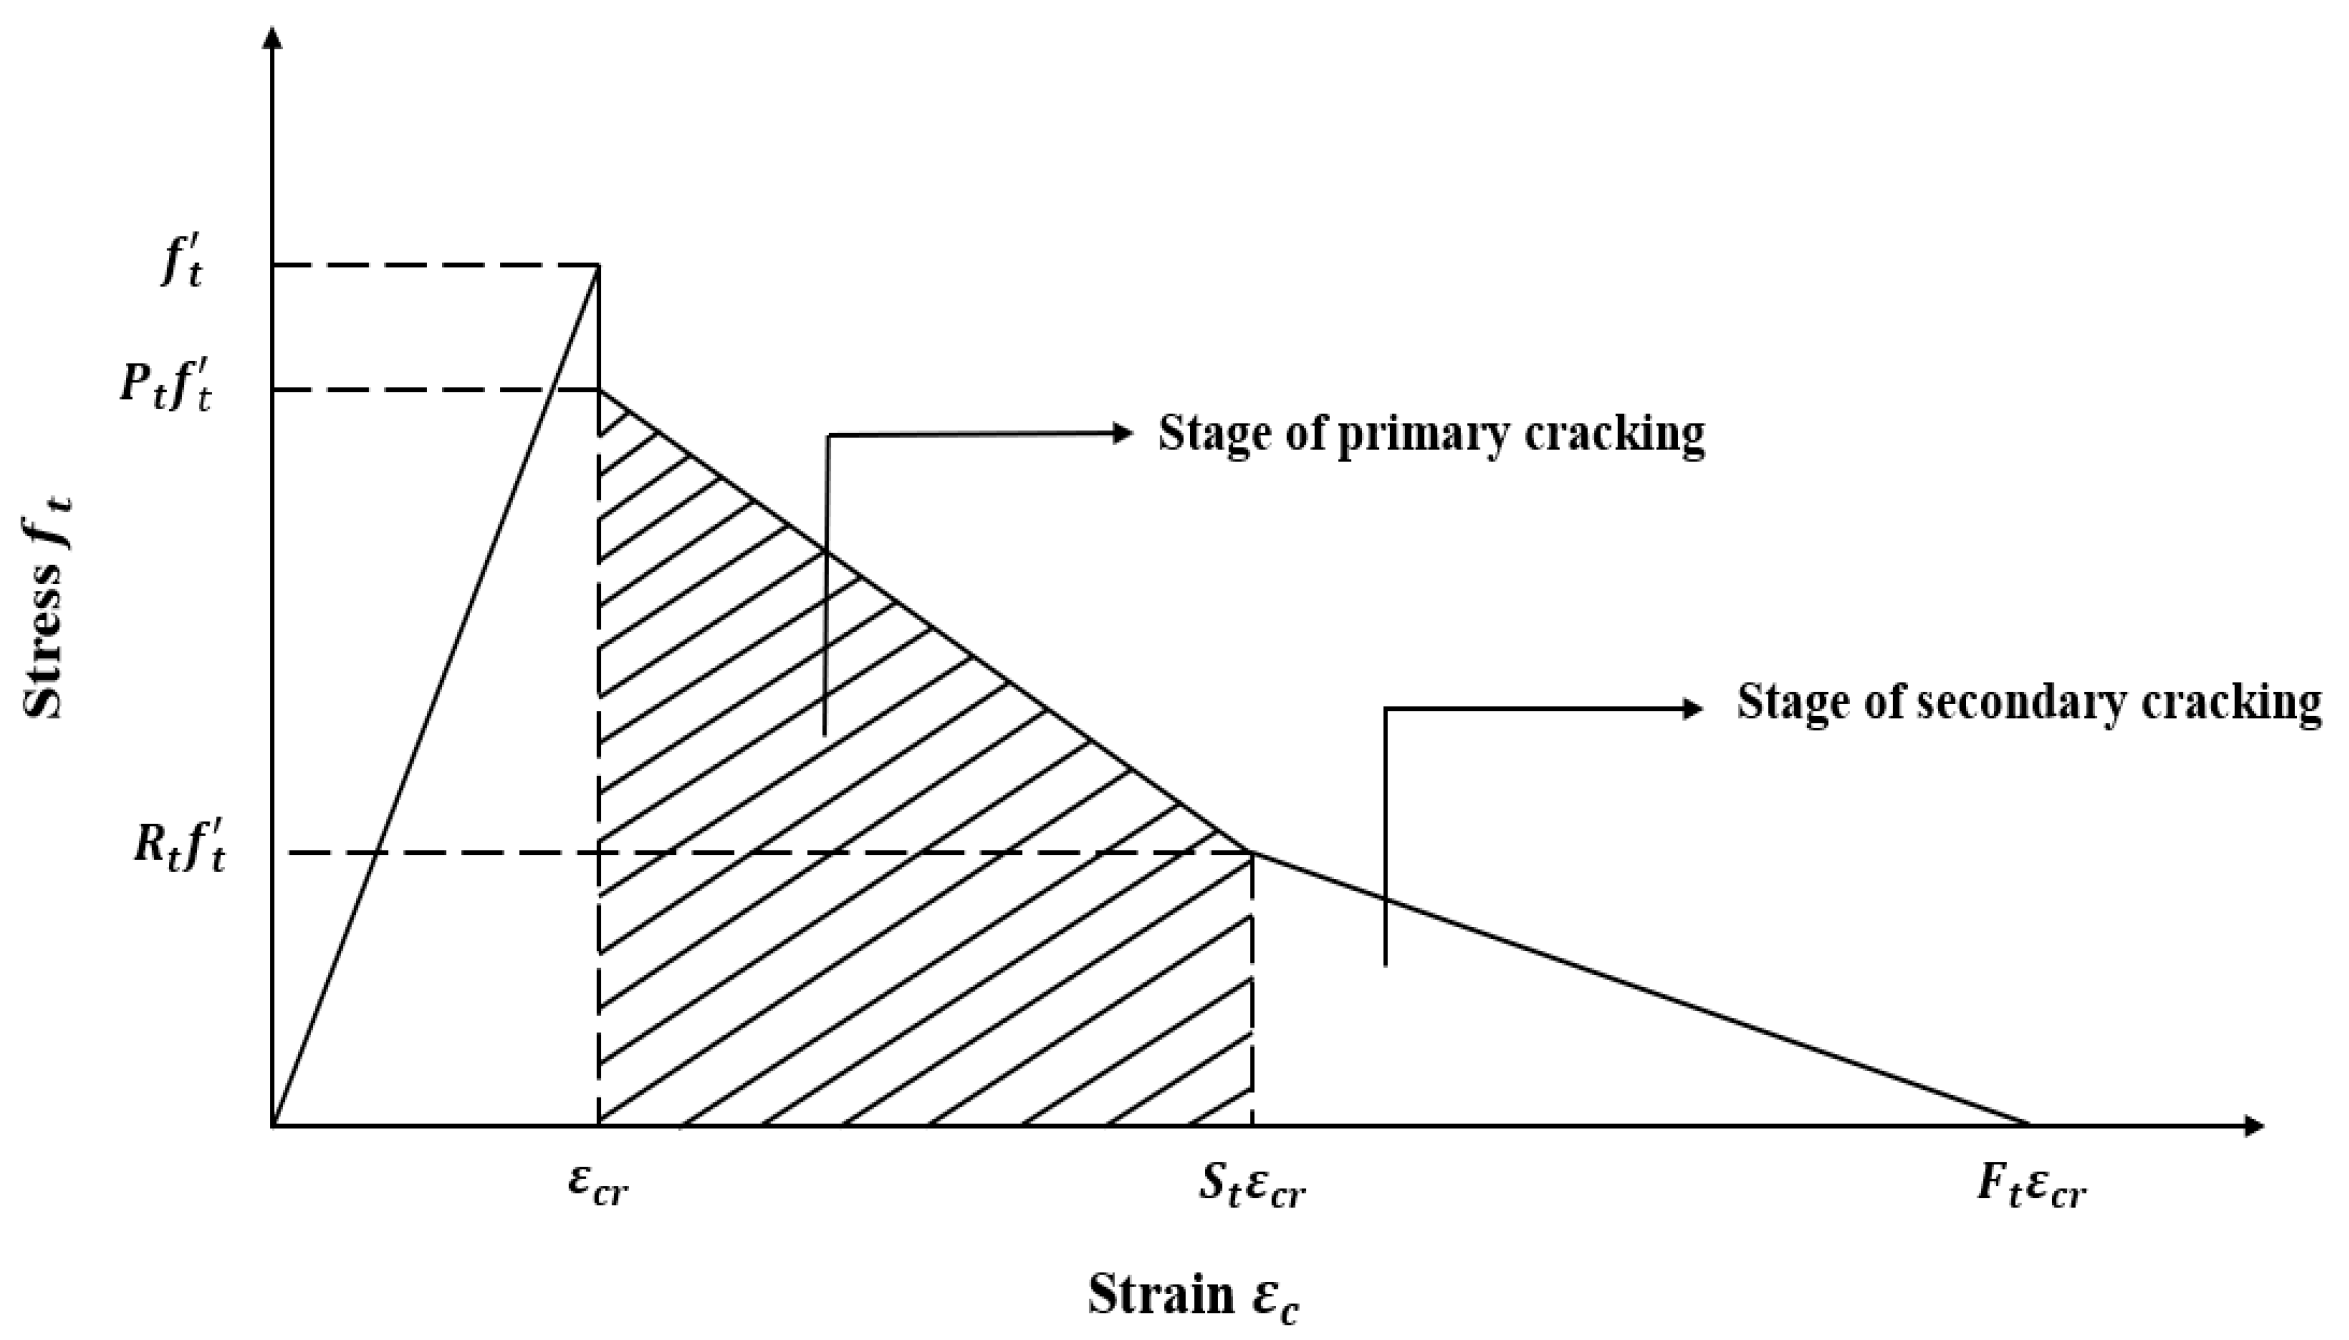
As shown in Figure 5, concrete exhibits linear elastic behavior up to the cracking strain, after which post-cracking softening occurs. This stage is governed by tension stiffening, where stresses are gradually transferred to reinforcement as cracks propagate.
To model this response, the formulation of Nayal and Rasheed [29] is adopted with calibrated parameters R t = 0.45, P t = 0.8, S t = 4, and F t = 10. Their model inherently accounts for tension stiffening and bond effects, eliminating the need for a separate bond–slip relationship in FEA.

2.4.2. Steel

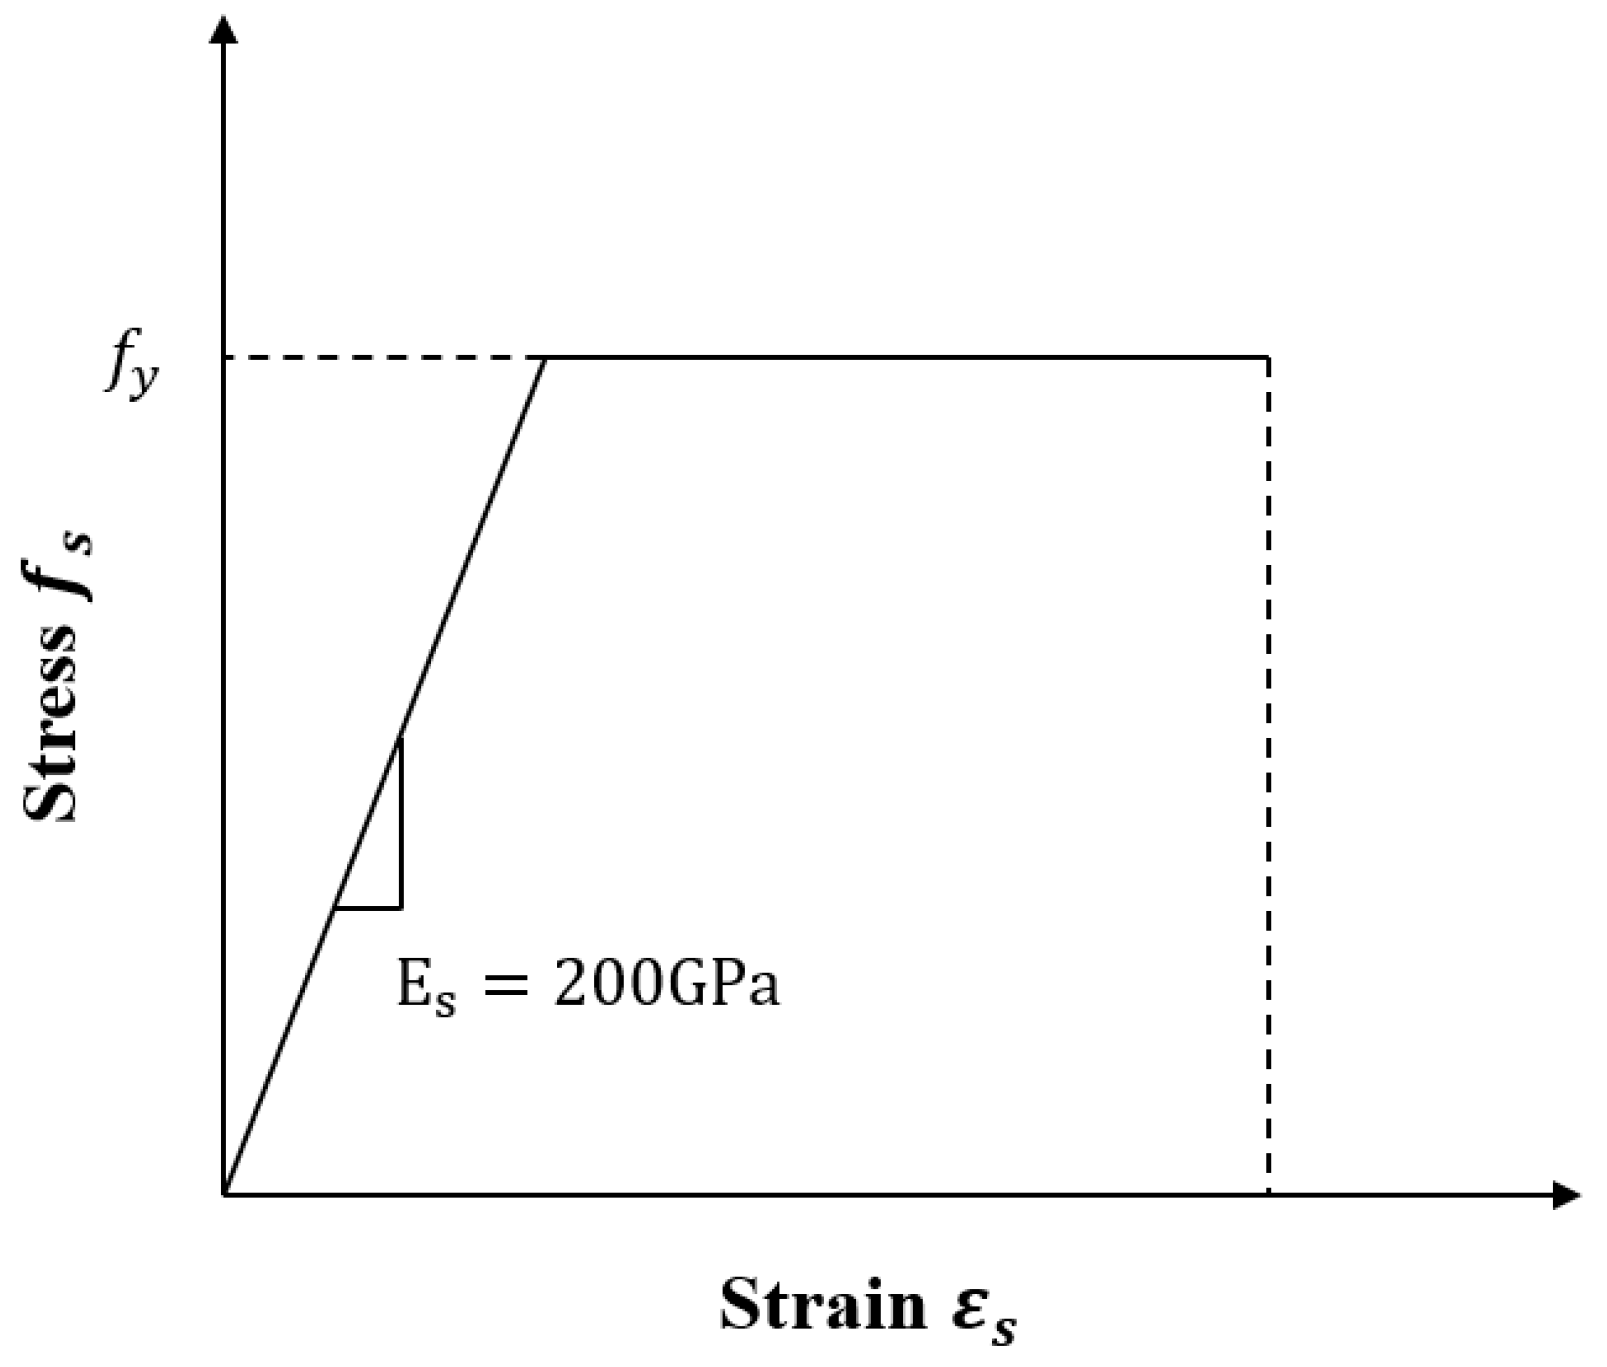
For finite element simulations in ABAQUS, the realistic stress–strain model of reinforcing steel may cause convergence difficulties in nonlinear analyses involving concrete cracking and plasticity. To improve computational efficiency and stability, an idealized bilinear stress–strain model is commonly adopted, as illustrated in Figure 6. This approach retains the elastic modulus E s = 200,000 MPa (29,000,000 psi) while assuming perfect plasticity beyond yielding [30]. The simplification enhances convergence while providing adequate accuracy for structural behavior analysis.
In this research, which examines the effect of unbonded reinforcement on strengthened RC beams, G60 reinforcing steel was adopted for stirrups, tension, and compression reinforcement to ensure strength, ductility, and energy absorption. In the finite element model, the tensile reinforcement was represented by C3D6 solid wedge elements to capture potential bond degradation and displacement discontinuities at the steel–concrete interface, while the compression reinforcement and stirrups were modeled with T3D2 truss elements for computational efficiency under axial load transfer. For the strengthening SP, G50 structural steel was adopted to enhance ductility, energy dissipation, and compatibility with the concrete substrate. In the finite element model, the plates were rep-resented by C3D8R solid brick elements, which allow through-thickness stress distribution and interfacial behavior with the adhesive and concrete to be accurately captured, thereby providing a reliable basis for assessing the local and global performance of the strengthened system.

2.4.3. CFRP

CFRP is a composite material composed of high-strength carbon fibers in an epoxy matrix, offering a high strength-to-weight ratio and durability for structural strengthening. In this study, the CFRP sheet was modeled using C3D8R solid elements to ensure compatibility with steel components and to capture large in-plane deformations efficiently. The constitutive behavior was defined in two stages: the undamaged sheet, represented as a linearly elastic orthotropic solid, and the damaged sheet, characterized by Hashin’s intralaminar failure criteria.
The general form of the orthotropic elasticity model used in this study follows the formulation provided in the ABAQUS Analysis User’s Manual [32], and can be written as:
σ = C · ε
where σ and ε are the stress and strain vectors in Voigt notation, and C is the 6 × 6 stiffness matrix defined by the material’s elastic properties. For a 3D orthotropic material, the stress–strain relationship expands as:
σ 11 σ 22 σ 33 σ 23 σ 13 σ 12 = C 11 C 12 C 13 0 0 0 C 12 C 22 C 23 0 0 0 C 13 C 23 C 33 0 0 0 0 0 0 C 44 0 0 0 0 0 0 C 55 0 0 0 0 0 0 C 66 = ε 11 ε 22 ε 33 γ 23 γ 13 γ 12
The stiffness matrix components are functions of the elastic constants, which can alternatively be defined through the compliance matrix S , as:
S = 1 E 1 υ 12 E 1 υ 13 E 1 0 0 0 υ 21 E 2 1 E 2 υ 23 E 2 0 0 0 υ 31 E 3 υ 32 E 3 1 E 3 0 0 0 0 0 0 1 G 23 0 0 0 0 0 0 1 G 13 0 0 0 0 0 0 1 G 12
The matrix C is obtained by inverting the compliance matrix S . This relationship captures the coupling effects between normal and transverse deformations, which is critical for modeling anisotropic composite behavior.
The CFRP sheet used in this study corresponds to the Sika® CarboDur® S (Sika AG, Zurich, Switzerland) product, an epoxy-reinforced carbon fiber composite with a fiber volume content of 68%. The required elastic constants, extracted from the product datasheet and listed in Table 1, were defined in ABAQUS using the “Engineering Constants” option, which internally constructs the stiffness matrix for finite element analysis.
CFRP sheets consist of high-strength carbon fibers embedded in an epoxy matrix, where fibers carry the load and the matrix transfers stress between them. Failure typically occurs through intralaminar fiber or matrix failure, which is modeled in ABAQUS using Hashin’s 3D failure theory [32]. This criterion distinguishes four modes—fiber tension, fiber compression, matrix tension, and matrix compression—each expressed by a quadratic interaction of stresses and strength parameters. Damage initiates when the corresponding failure index exceeds unity, as summarized in Equations (10)–(13).
Fiber tension failure ( σ 11 > 0 ):
σ 11 X T 2 + σ τ 12 S 12 2 + τ 13 S 13 2 1
Fiber compression failure ( σ 11 < 0 ):
σ 11 X C 2 1
Matrix tension failure ( σ 22 > 0 or σ 33 > 0 ):
σ 22 + σ 33 Y T 2 + τ 12 S 12 2 + τ 13 S 13 2 1
Matrix compression failure ( σ 22 < 0 or σ 33 < 0 ):
σ 22 + σ 33 2 S 12 2 + τ 12 S 12 2 + τ 13 S 13 2 1
Here, X T and X c denote the fiber tensile and compressive strengths, Y T and Y c the transverse matrix strengths, and S 12 and S 13 the in-plane and through-thickness shear strengths. These properties define the Hashin failure initiation criteria in ABAQUS and are summarized in Table 2.

2.4.4. Cohesive Element Between Strengthened Materials and Concrete

Cohesive elements are specifically designed to simulate interface behavior such as bonding, delamination, and adhesive layer failure, and are widely applied in finite element analysis of concrete and composite structures. In this study, COH3D8 was employed to represent the adhesive layers at both CFRP–concrete and SP–concrete interfaces. As a three-dimensional hexahedral cohesive element with eight nodes and three degrees of freedom per node, COH3D8 provides high accuracy and stability in capturing the mechanical response of bonded interfaces, making it particularly suitable for modeling thick adhesive layers in repair engineering applications [32].
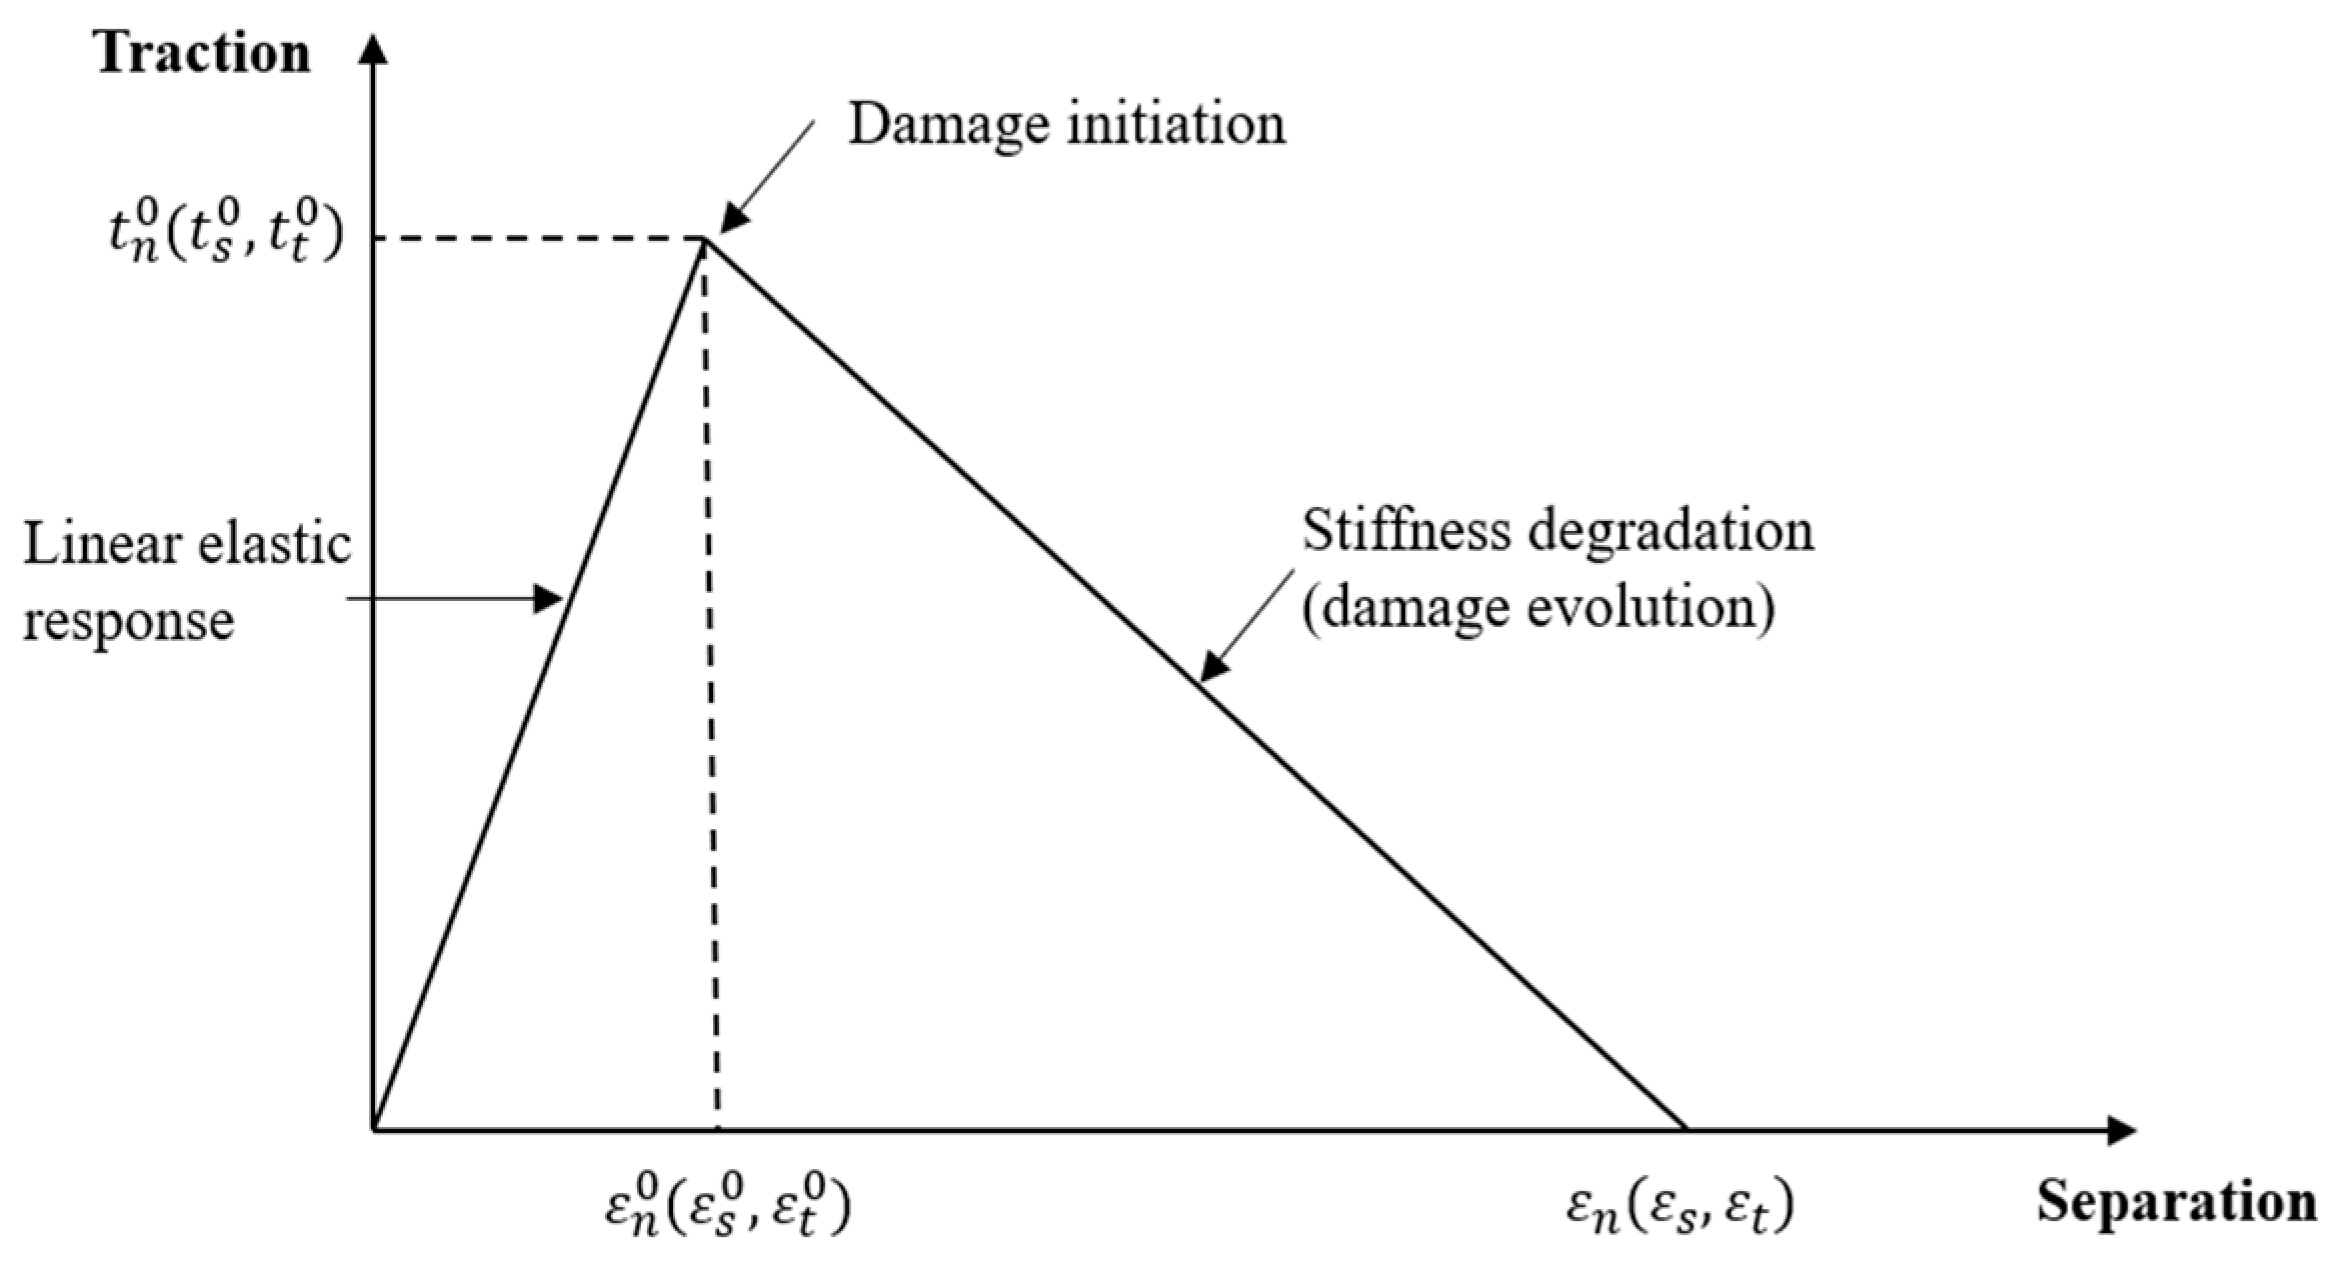
The constitutive behavior of cohesive elements is described by a traction–separation law, consisting of an initial linear elastic phase, damage initiation, and damage evolution (Figure 7). In the elastic stage, tractions increase proportionally with separation until a critical threshold is reached, at which point damage initiates according to predefined criteria. In this study, the quadratic stress criterion was adopted for damage initiation (Equation (14)). After initiation, stiffness degrades following a linear softening law governed by energy dissipation, with mixed-mode fracture behavior captured using the Benzeggagh–Kenane criterion (Equation (15)).
t n t n 0 2 + t s t s 0 2 + t t t t 0 2 = 1
G n C + G s C G n C G S G T η = G C
Here, t n , t s and t t are the normal and shear stresses with peak values t n 0 , t s 0 and t t 0 ; G n C and G s C are the critical fracture energies in the normal and shear directions; The total shear energy is the sum of G S and G T ; and η = 1.5. The interface properties (Table 3) were obtained from Sikadur®-30, a high-performance epoxy adhesive widely recognized for its strength, stiffness, and long-term durability in bonding concrete, steel, and composites. To isolate flexure-controlled behavior, the CFRP/SP–to-concrete interface was modeled as fully bonded. In this regime, adhesive properties chiefly affect debonding prevention rather than the nominal flexural capacity M n . Sikadur-30 properties were taken from manufacturer-consistent values without case-wise recalibration, and claims are confined to adequately anchored beams.

2.5. Interaction Properties

In the finite element model, several interaction definitions were applied to simulate the behavior of RC beams with unbonded reinforcement:
  • Supports and loading points: Rigid plates were introduced at supports and loading locations to ensure uniform load transfer and realistic boundary conditions, connected to the concrete through tie constraints.
  • Stirrups and compressive reinforcement: These were embedded in the concrete using the Embedded constraint, assuming full bond and ensuring displacement compatibility while improving computational efficiency.
  • Tensile reinforcement in unbonded regions: Modeled with Hard contact in the normal direction (compression transfer only) and frictionless tangential behavior, allowing free sliding without shear transfer.
  • Tensile reinforcement in bonded regions: A Tie constraint was applied, with bond–slip and tension stiffening effects implicitly captured by the constitutive model, ensuring stable load transfer without explicit bond-slip definitions.

2.6. Boundary Conditions and Loading

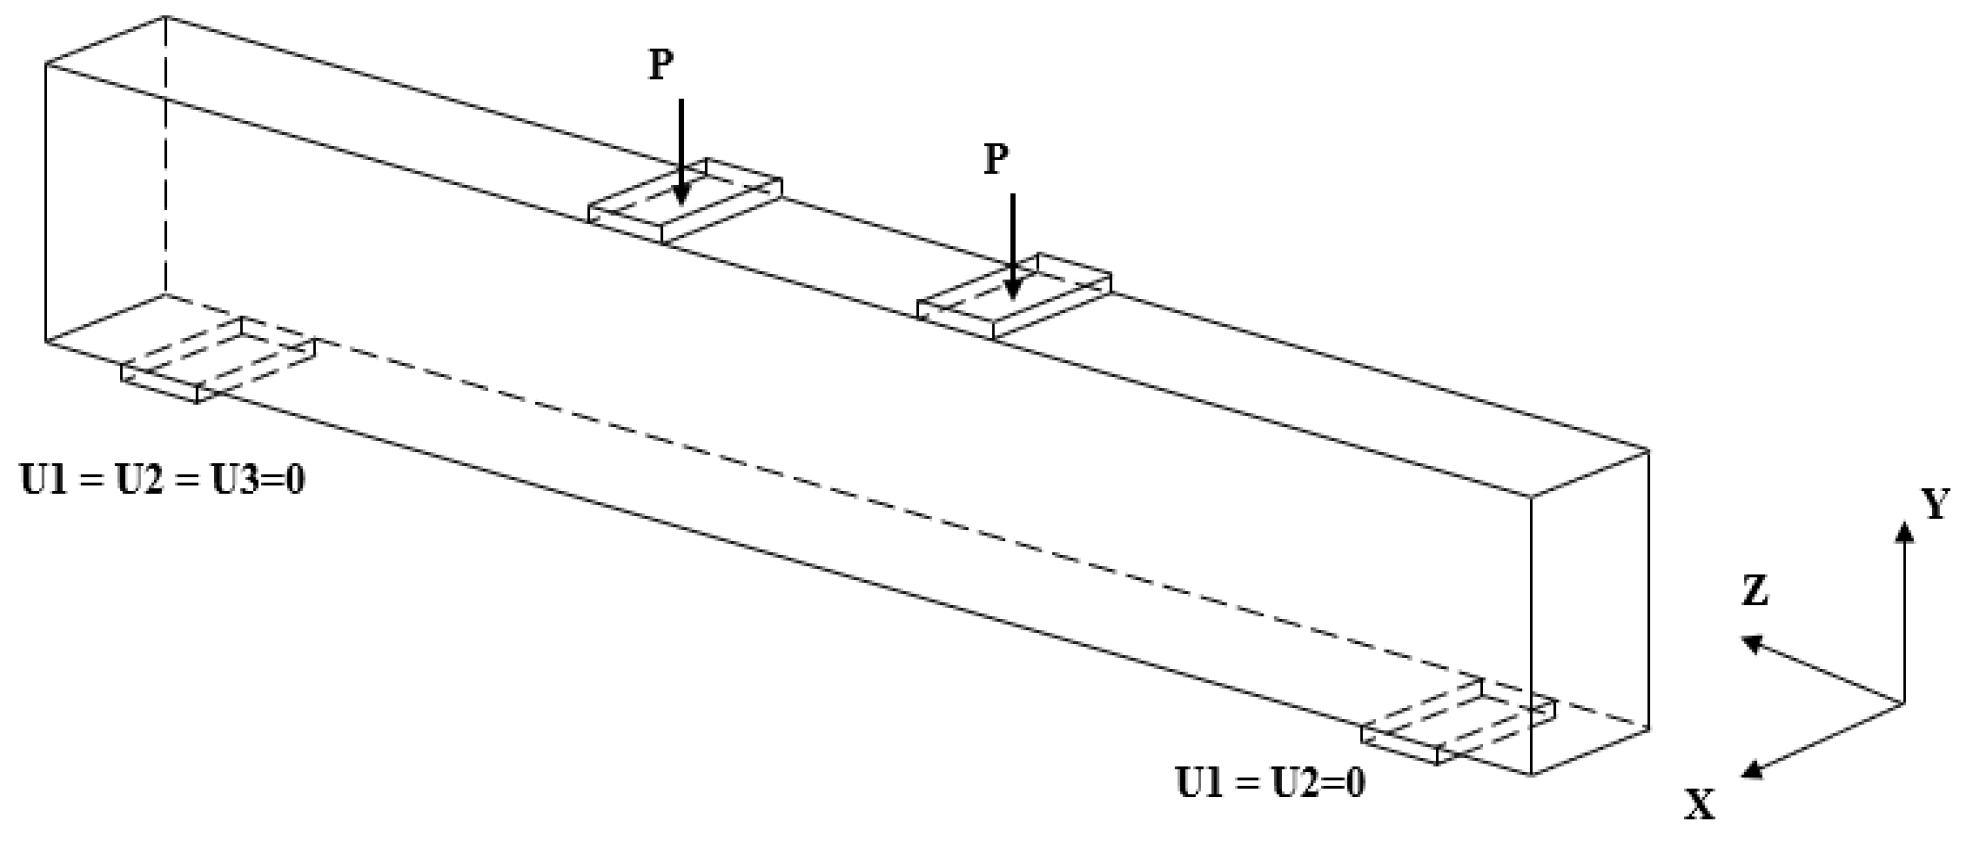
Boundary conditions define structural interaction with the environment and prevent rigid body motion. The beam was modeled with simple support: the left end pinned (U1 = U2 = U3 = 0) and the right end roller-supported (U1 = U2 = 0, free in U3), as shown in Figure 8. The coordinate system was set with the z-axis along the beam length, the y-axis vertical, and the x-axis transverse.
Loading was applied through a force-controlled four-point bending scheme, with two vertical concentrated loads ( P ) transferred via rigid plates to ensure uniform stress distribution and avoid local concentrations.

3. FEA Model Verification and Convergence Study

3.1. FEA Model Verification

Previous experimental studies have provided the basis for validating the developed FEA model. Suleymanova et al. [33] examined the influence of shear span-to-depth ratio ( a v / d ) on RC beam behavior, showing a transition from shear-dominated failure at lower ratios to flexure-dominated response at higher ratios; specimen TB1 ( a v / d = 4.0) was selected for validation. Mousa [6] investigated the effect of bond degradation, observing that larger unbonded lengths primarily influenced crack width and distribution, while the overall flexural strength of specimen B5 remained largely unaffected because the unbonded region was located away from the maximum moment zone, where the bonded reinforcement could still develop sufficient anchorage. Alabdulhady et al. [34] studied beams with different concrete strengths strengthened with CFRP, highlighting reduced strengthening efficiency for higher-strength concretes due to bond limitations; specimen B2 (with f c = 36.1 MPa [5.24 ksi]) was chosen for validation. Saleh et al. [15] evaluated RC beams strengthened with SP and emphasized the importance of anchorage details for both capacity and ductility; specimen B2 with U-shaped anchorage was included in the validation set.
The numerical predictions showed close agreement with the experimental responses, demonstrating the capability of the FEA model to capture the flexural behavior of strengthened beams with partial reinforcement debonding. It should be emphasized that the validation primarily addresses the response up to the ultimate load, as most reference tests were load-controlled and did not capture extensive post-peak behavior. The comparison between experimental and numerical results is illustrated in Figure 9.
To clarify the relationship between the validation database and the broader parametric space, a coverage matrix is summarized in Table 4. The table lists the main modeling variables—such as shear span ratio, reinforcement ratio, debonding degree, material properties, and anchorage—and indicates which ranges were directly represented in the validation tests and which fall outside. Variables categorized as covered are consistent with the experimental cases, whereas those marked as extrapolated extend beyond the validated domain and should therefore be interpreted with greater caution. This mapping makes explicit the extent of experimental support for the parametric study and highlights where the numerical predictions rely on extrapolation.
Table 5 presents the quantitative error metrics comparing experimental and FEA results for the validation specimens. The peak load predictions show good agreement, with errors mostly within ±10%, indicating that the model can reliably capture the ultimate capacity. For example, Suleymanova et al. (TB1) [33] exhibited a slight overestimation of 9.7%, while Mousa (B5) [6] showed a minor underestimation of 1.6%. The initial stiffness predictions demonstrated somewhat larger deviations, ranging between 7.7% and 15.8%, which can be attributed to the sensitivity of the elastic response to cracking and bond parameters. The RMSE values (3–7 kN) and the limited bias (1–3.6 kN) further confirm the overall consistency of the model. These numerical indicators collectively verify the robustness of the FEA in reproducing the flexural response up to the peak load. As illustrated in Figure 9, the error metrics correspond well with the close match observed in the load–deflection curves, further supporting the adequacy of the proposed model for subsequent parametric investigations.

3.2. Sensitivity Analysis

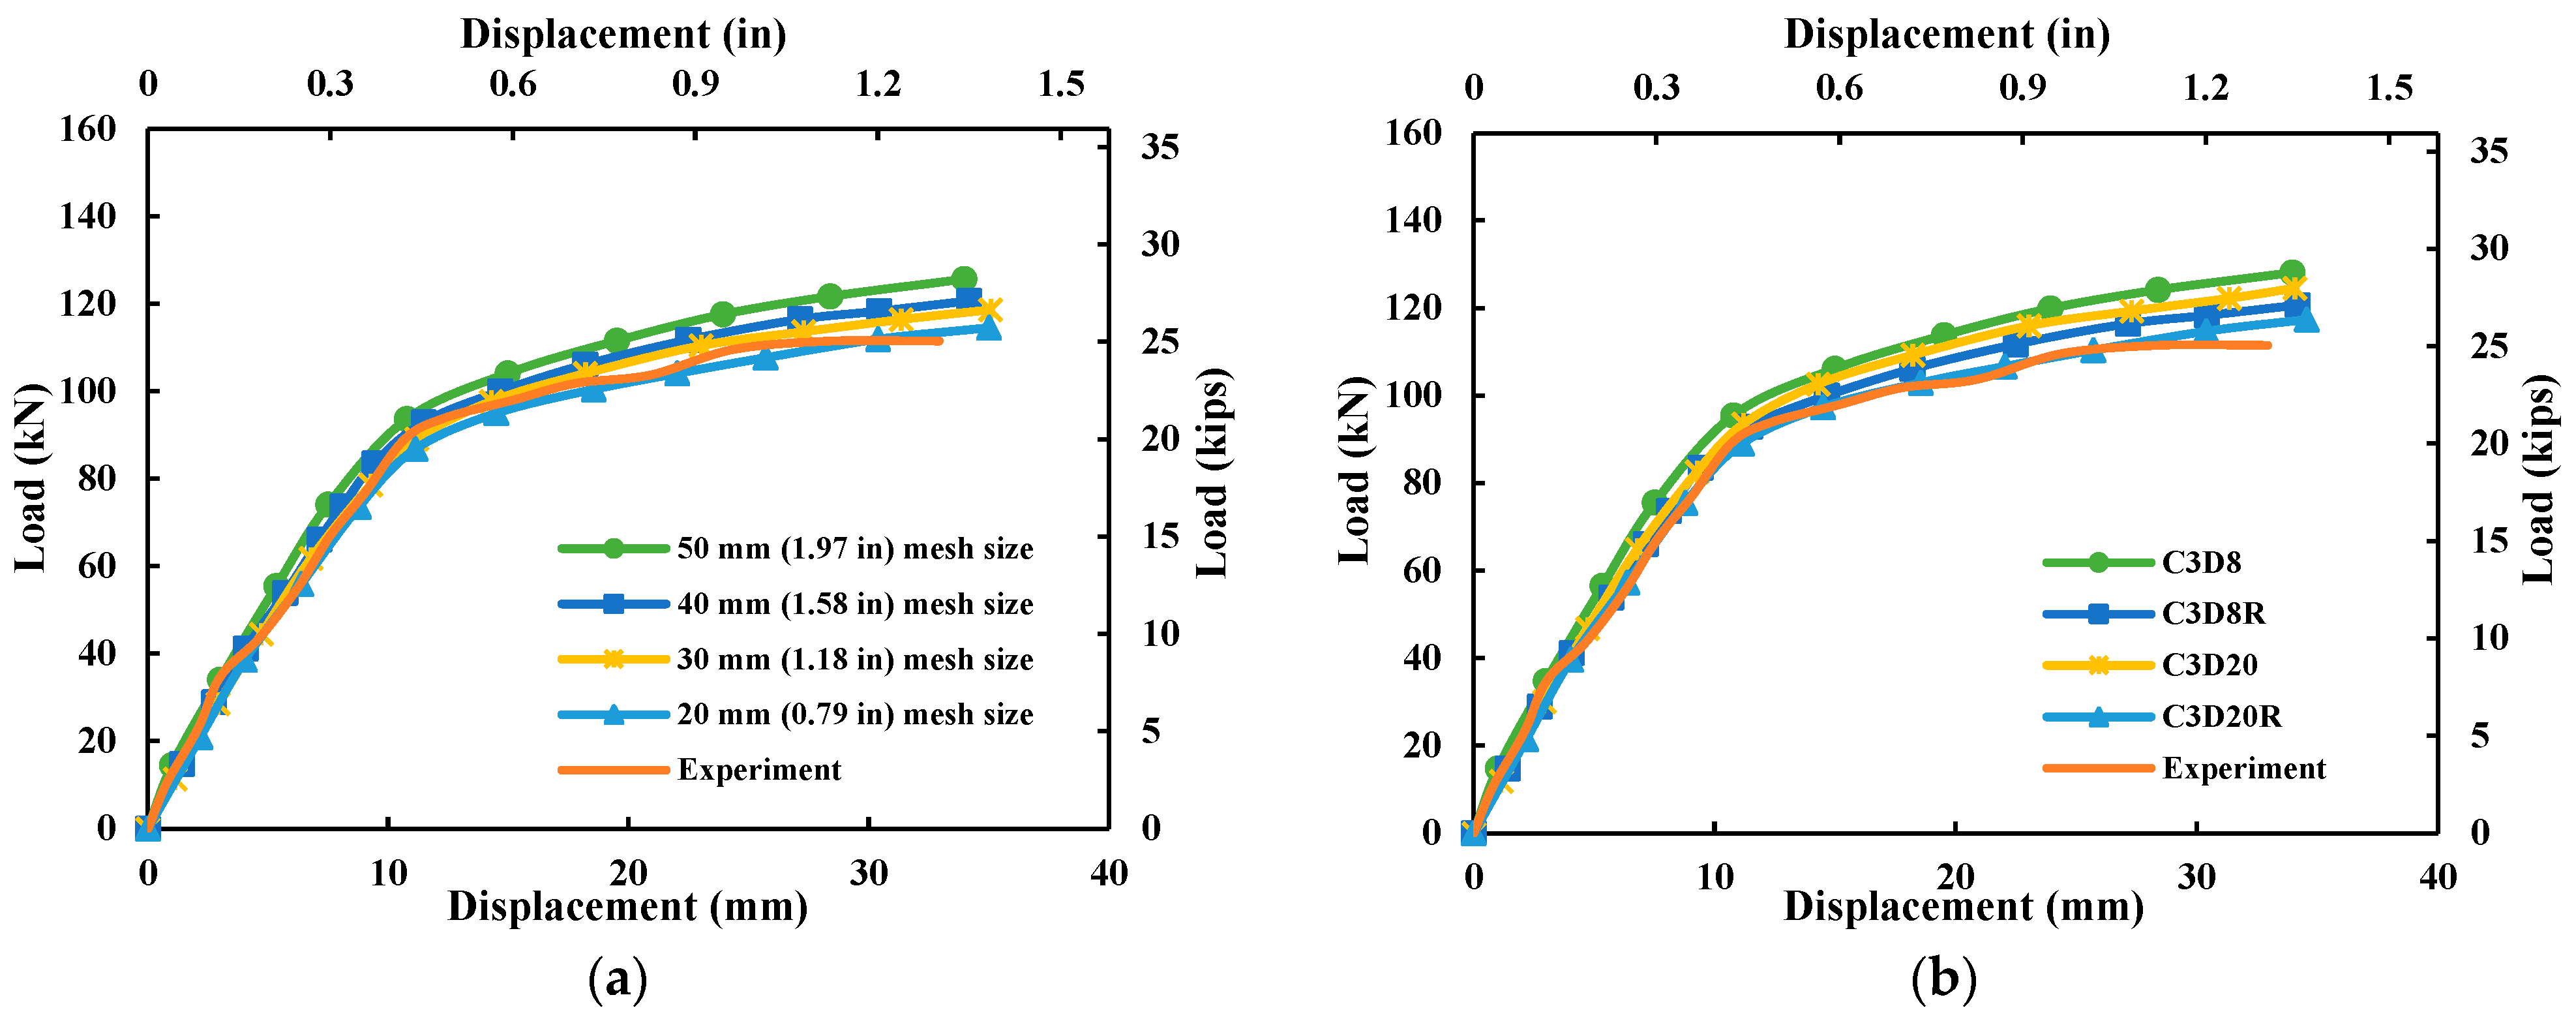
Parametric studies were conducted to assess how concrete material modeling—specifically mesh density and element type—affects FEA results. Using specimen TB1 from Suleymanova et al. [32] as a reference, simulated load–deflection, stiffness, and peak load were compared with experiments to evaluate model sensitivity.
A mesh sensitivity study (Figure 10a) showed that coarser meshes, especially 50 mm (1.97 in), underestimated stiffness and peak load. The 20 mm (0.79 in) mesh best matched experimental data, while the 40 mm (1.58 in) mesh still provided acceptable accuracy. To balance accuracy and efficiency, a 40 mm (1.58 in) mesh was adopted in this study.
A sensitivity study compared four element types (C3D8, C3D8R, C3D20, C3D20R) for load–deflection accuracy (Figure 10b). C3D20R showed the best match with experimental data but had high computational cost. C3D8R offered a good balance of accuracy and efficiency and was thus selected for the analysis.

4. Results and Discussion

Beams were classified as unstrengthened and externally strengthened. For each, flexural capacity Mub was compared to the nominal capacity Mn of a fully bonded beam section, per ACI 318-22.

4.1. Unstrengthened Beams

To isolate the influence of unbonded reinforcement, the behavior of unstrengthened RC beams was first examined. Key variables included shear span-to-depth ratio ( a v / d ), reinforcement ratio ( ρ ), and debonding degree (λ).

4.1.1. Shear Span-to-Depth Ratio ( a v / d )

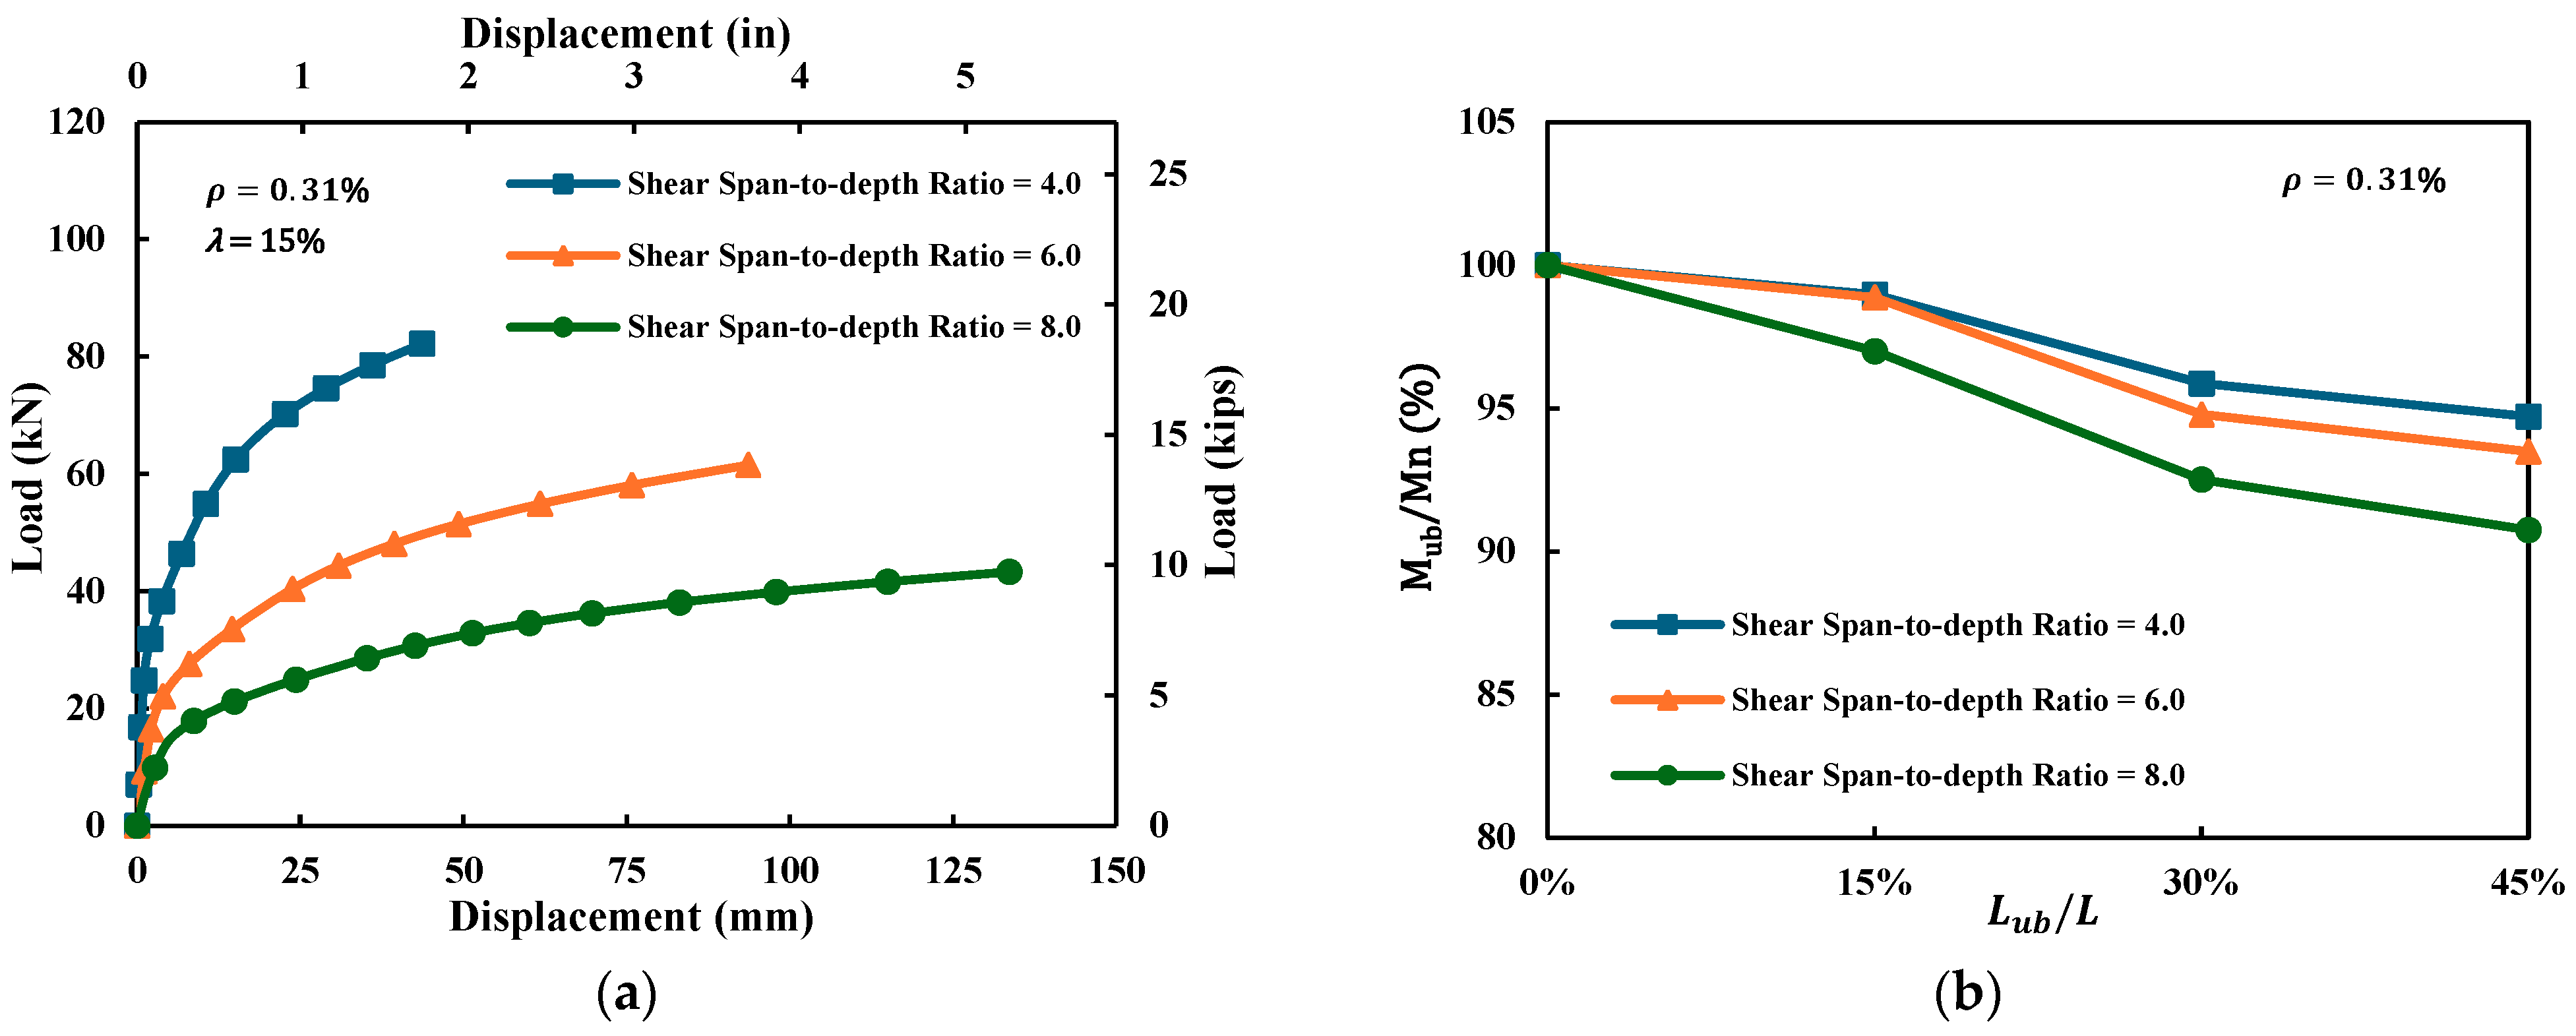
Figure 11 examines the effects of shear span-to-depth ratio ( a v / d ) and debonding degree ( λ ) on RC beam performance, both under a reinforcement ratio of 0.31%. In Figure 11a (with 15% debonding degree), beams with a v / d = 4.0, 6.0, and 8.0 show decreasing strength and increasing ductility as a v / d increases, indicating a transition from shear-dominated to flexure-dominated behavior, with a v / d = 6.0 marking the midpoint. Figure 11b explores increasing debonding degree from 0% to 45% under the same reinforcement ratio. Normalized moment capacity (Mub/Mn) drops by 5.3%, 6.5%, and 9.2% for a v / d = 4.0, 6.0, and 8.0, respectively. Longer spans are more sensitive to debonding degree due to greater flexural demand. Together, these results highlight the combined influence of shear span-to-depth ratio and bond condition on flexural performance, stressing the need to address both in design.

4.1.2. Reinforcement Ratio ( ρ )

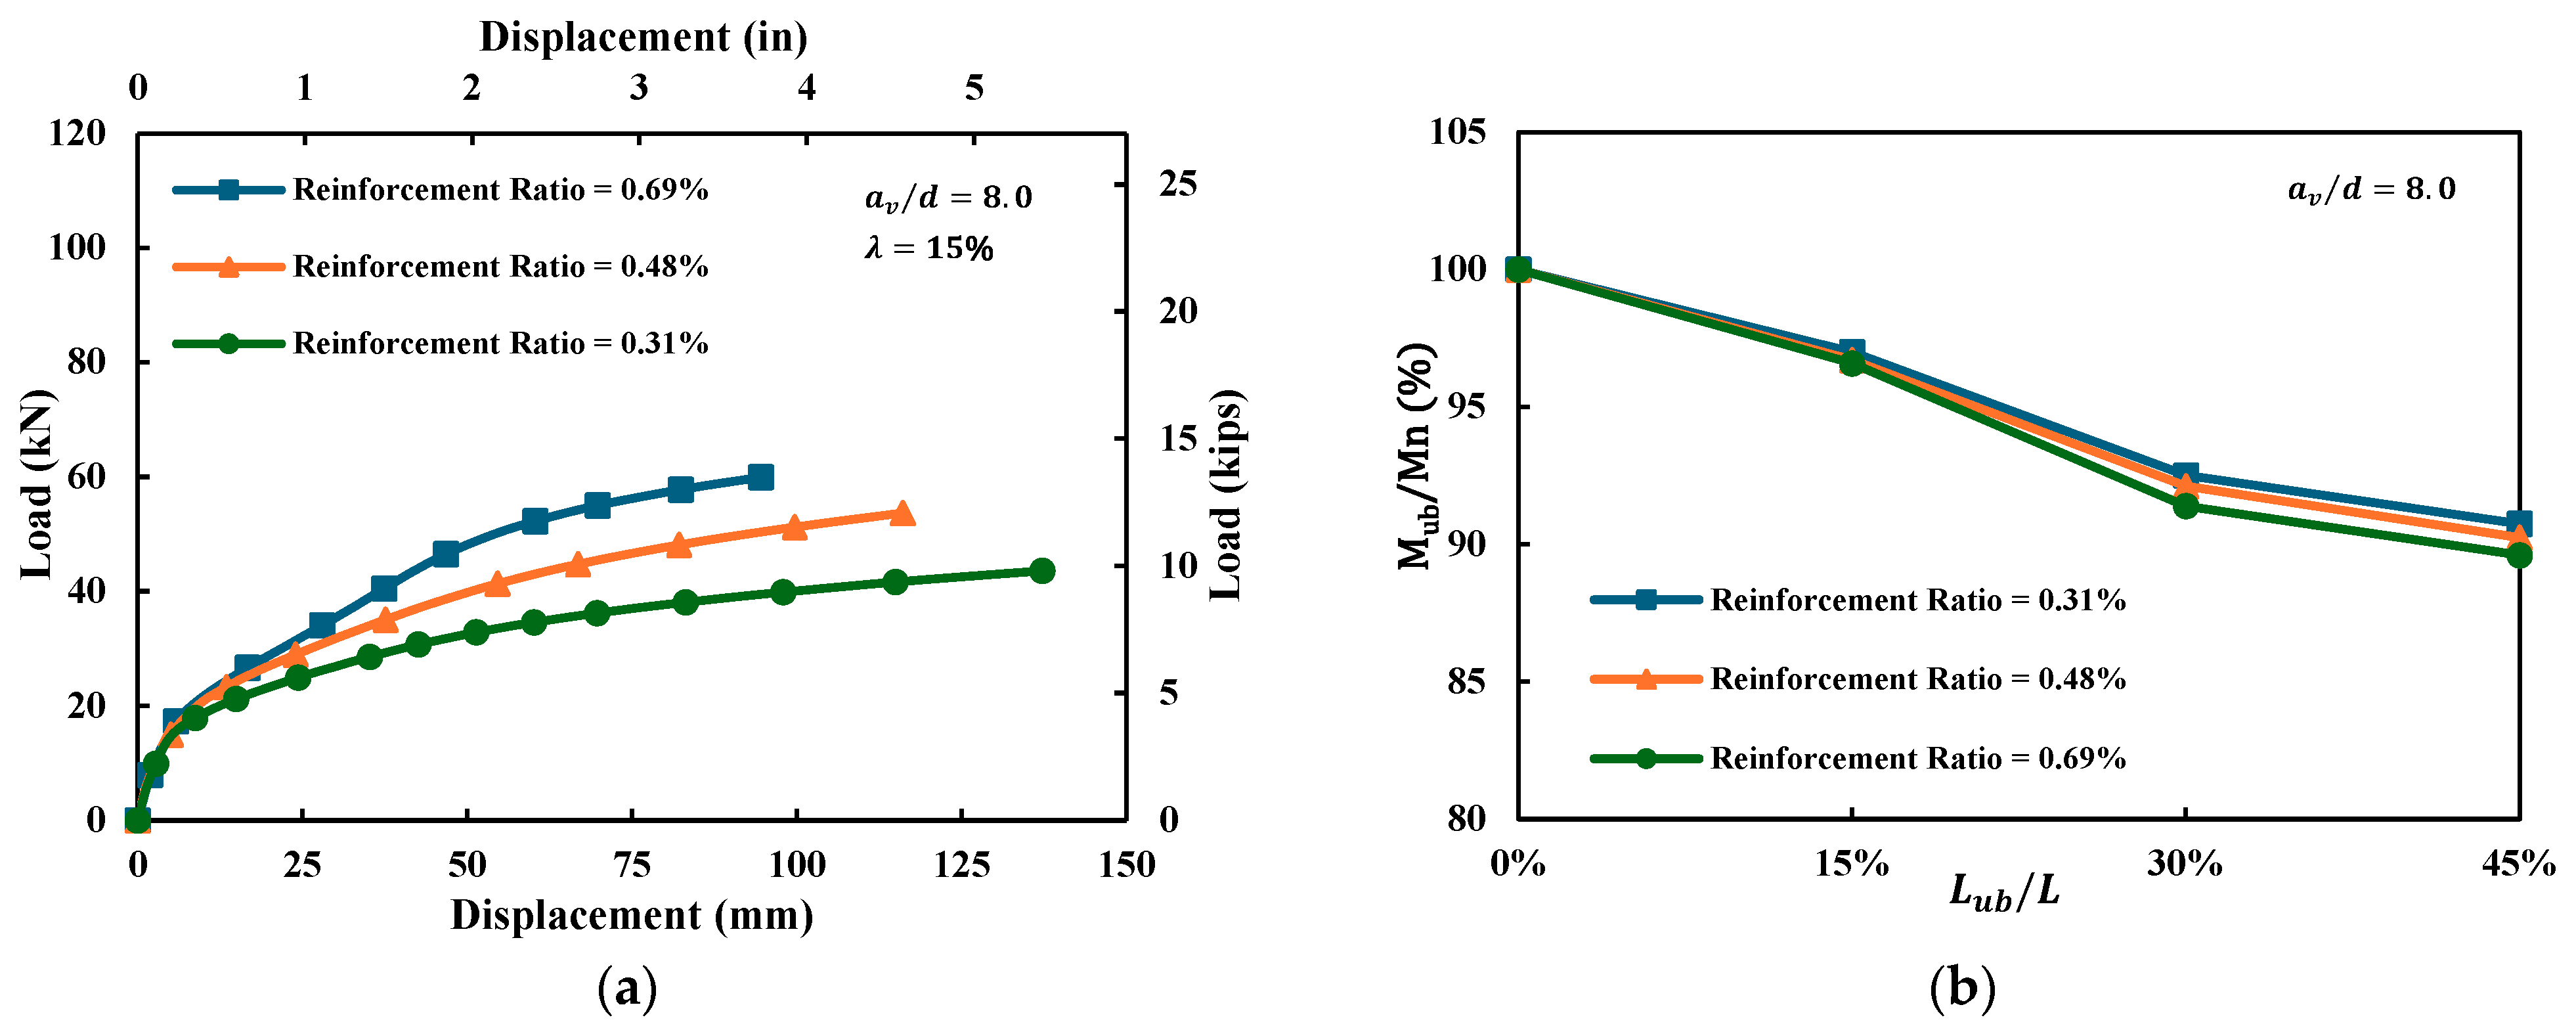
Under a shear-span-to-depth ratio of 8.0, Figure 12 analyzes how the reinforcement ratio ( ρ ) and debonding degree ( λ ) affect RC beam behavior. As shown in Figure 12a, higher reinforcement ratios improve load capacity and stiffness but reduce ductility due to limited crack development and plastic hinge formation. Figure 12b indicates that increasing debonding degree from 0% to 45% leads to similar reductions in normalized moment capacity (Mub/Mn) across all ratios (9.25–10.4%), suggesting reinforcement ratio has minimal effect in mitigating debonding-related strength loss. These results highlight that under flexure-dominated conditions, bond quality outweighs reinforcement quantity, emphasizing the need for bond-enhancing or ductility-based design strategies.

4.1.3. Debonding Degree ( λ )

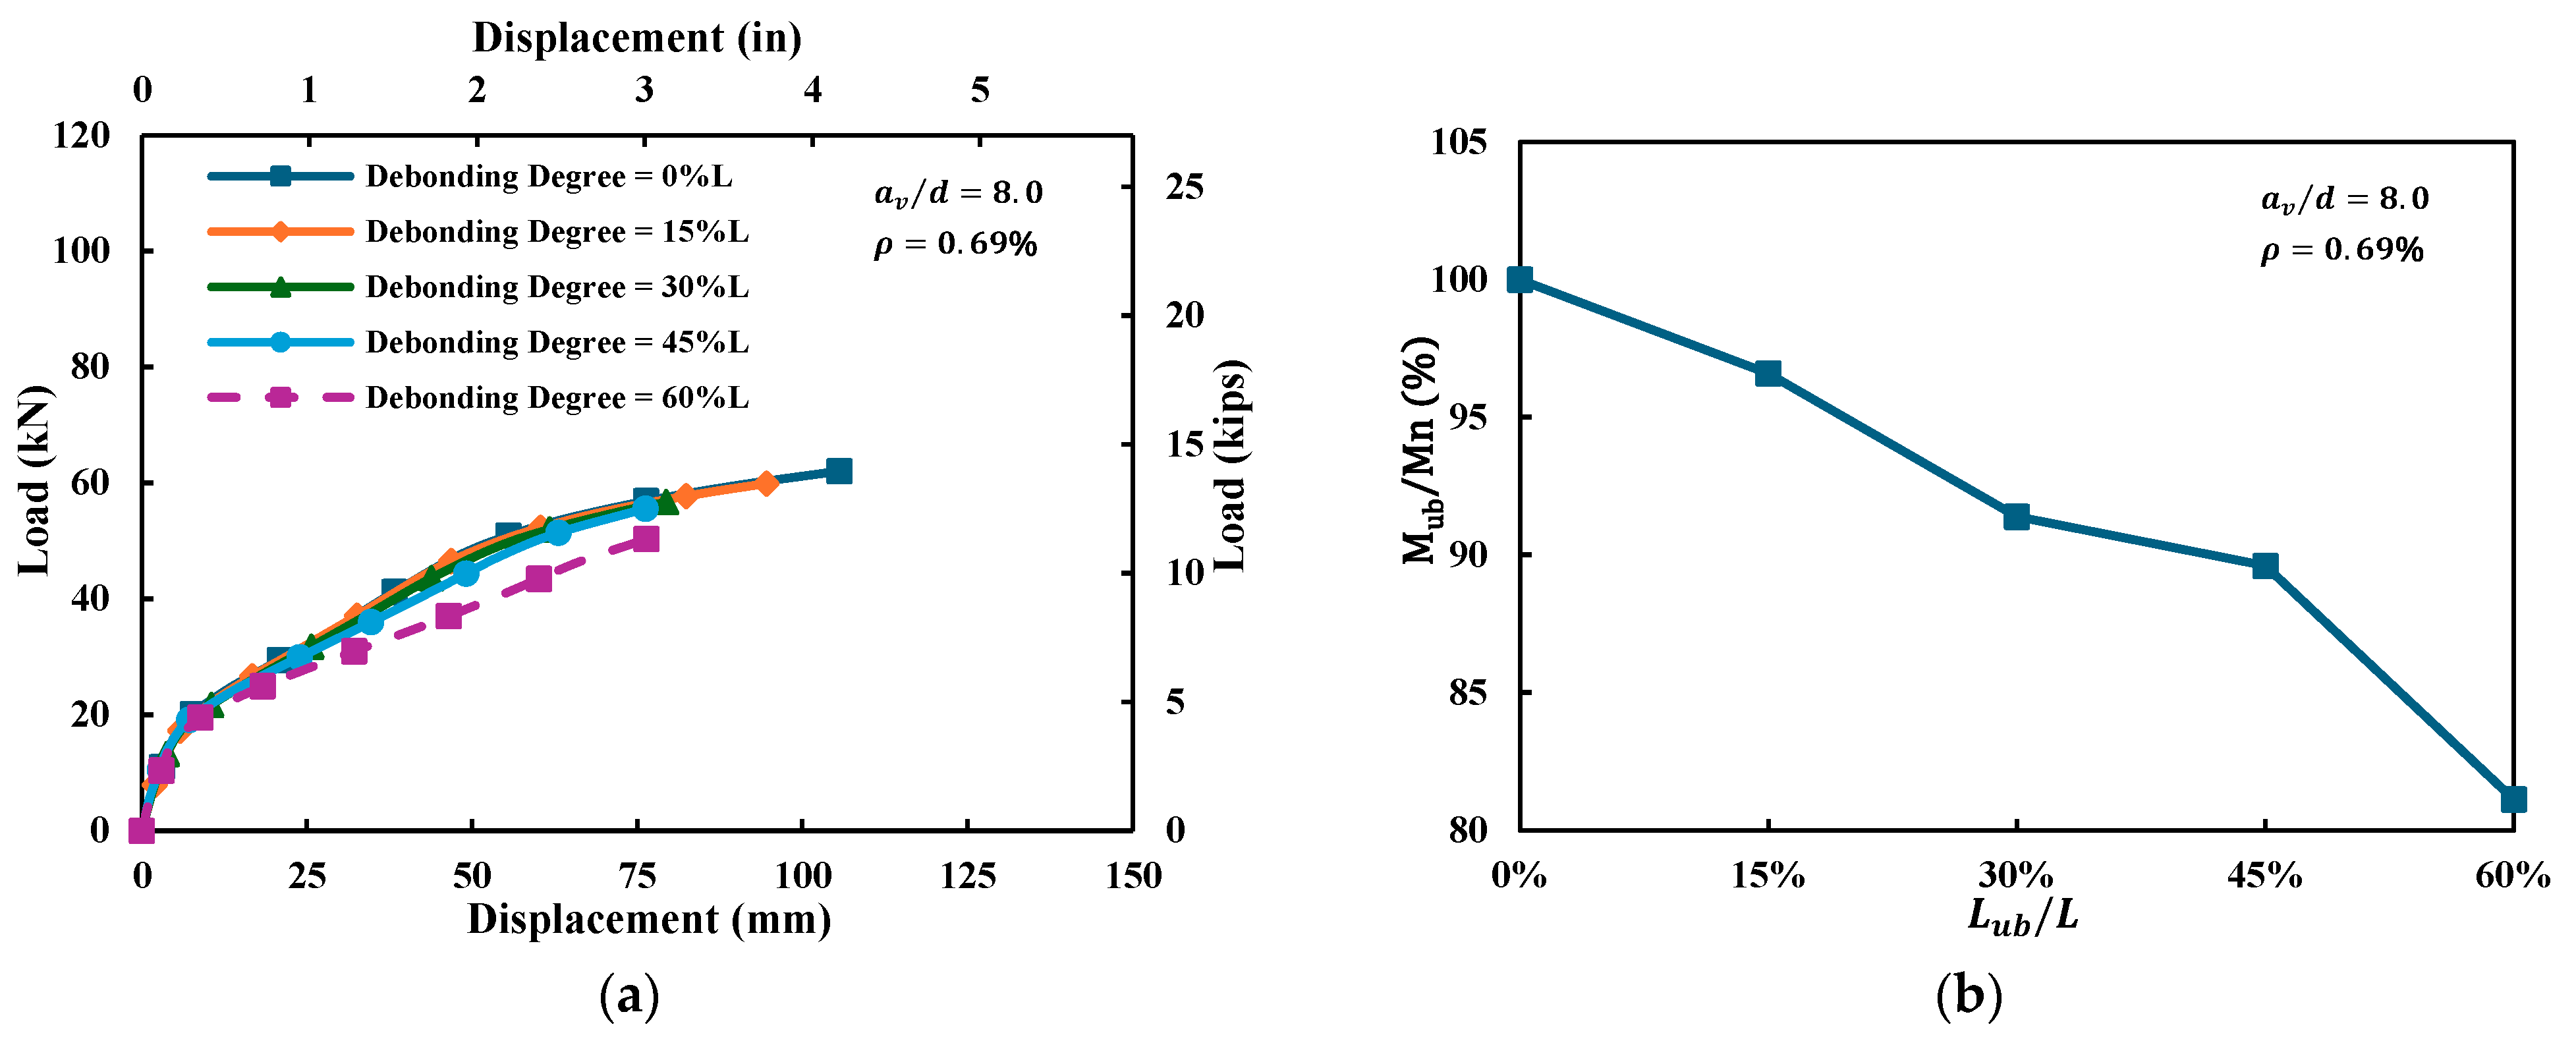
Figure 13a shows that with a v / d = 8.0 and ρ = 0.69%, increasing debonding up to 45% leads to gradual declines in load capacity, stiffness, and ductility. At 60% debonding, a sharp drop in strength and stiffness indicates a critical threshold. Correspondingly, normalized moment capacity (Mub/Mn) in Figure 13b decreases by 3.41% at 15%L, 8.61% at 30%L, 10.39% at 45%L, and 18.88% at 60%L. These results suggest that moderate debonding is tolerable, but beyond 45%, bonded length becomes insufficient for anchorage, leading to brittle failure. Under flexure-dominated behavior, limiting debonding degree is essential to preserve structural performance.
In this study, an unbonded length of approximately 45% was identified as the point where flexural capacity loss became severe. However, this threshold is not universal; it depends on specimen geometry, reinforcement layout, and strengthening details. To clarify this limitation, Table 6 summarizes the sensitivity of the threshold to three key parameters based on the discussion in Kazemi et al. [34]. As shown, higher concrete strength or reinforcement ratios tend to lower the threshold, while greater strengthening thickness or effective anchorage can increase it.

4.2. Strengthened Beams

Building on prior analysis of unstrengthened RC beams, this section extends the study to strengthened beams using CFRP and SP. It investigates the effects of shear span-to-depth ratio ( a v / d ), reinforcement ratio ( ρ ), debonding degree ( λ ), and type (CFRP/SP) and thickness of strengthening materials ( t ) on flexural performance.

4.2.1. Shear Span-to-Depth Ratio ( a v / d )

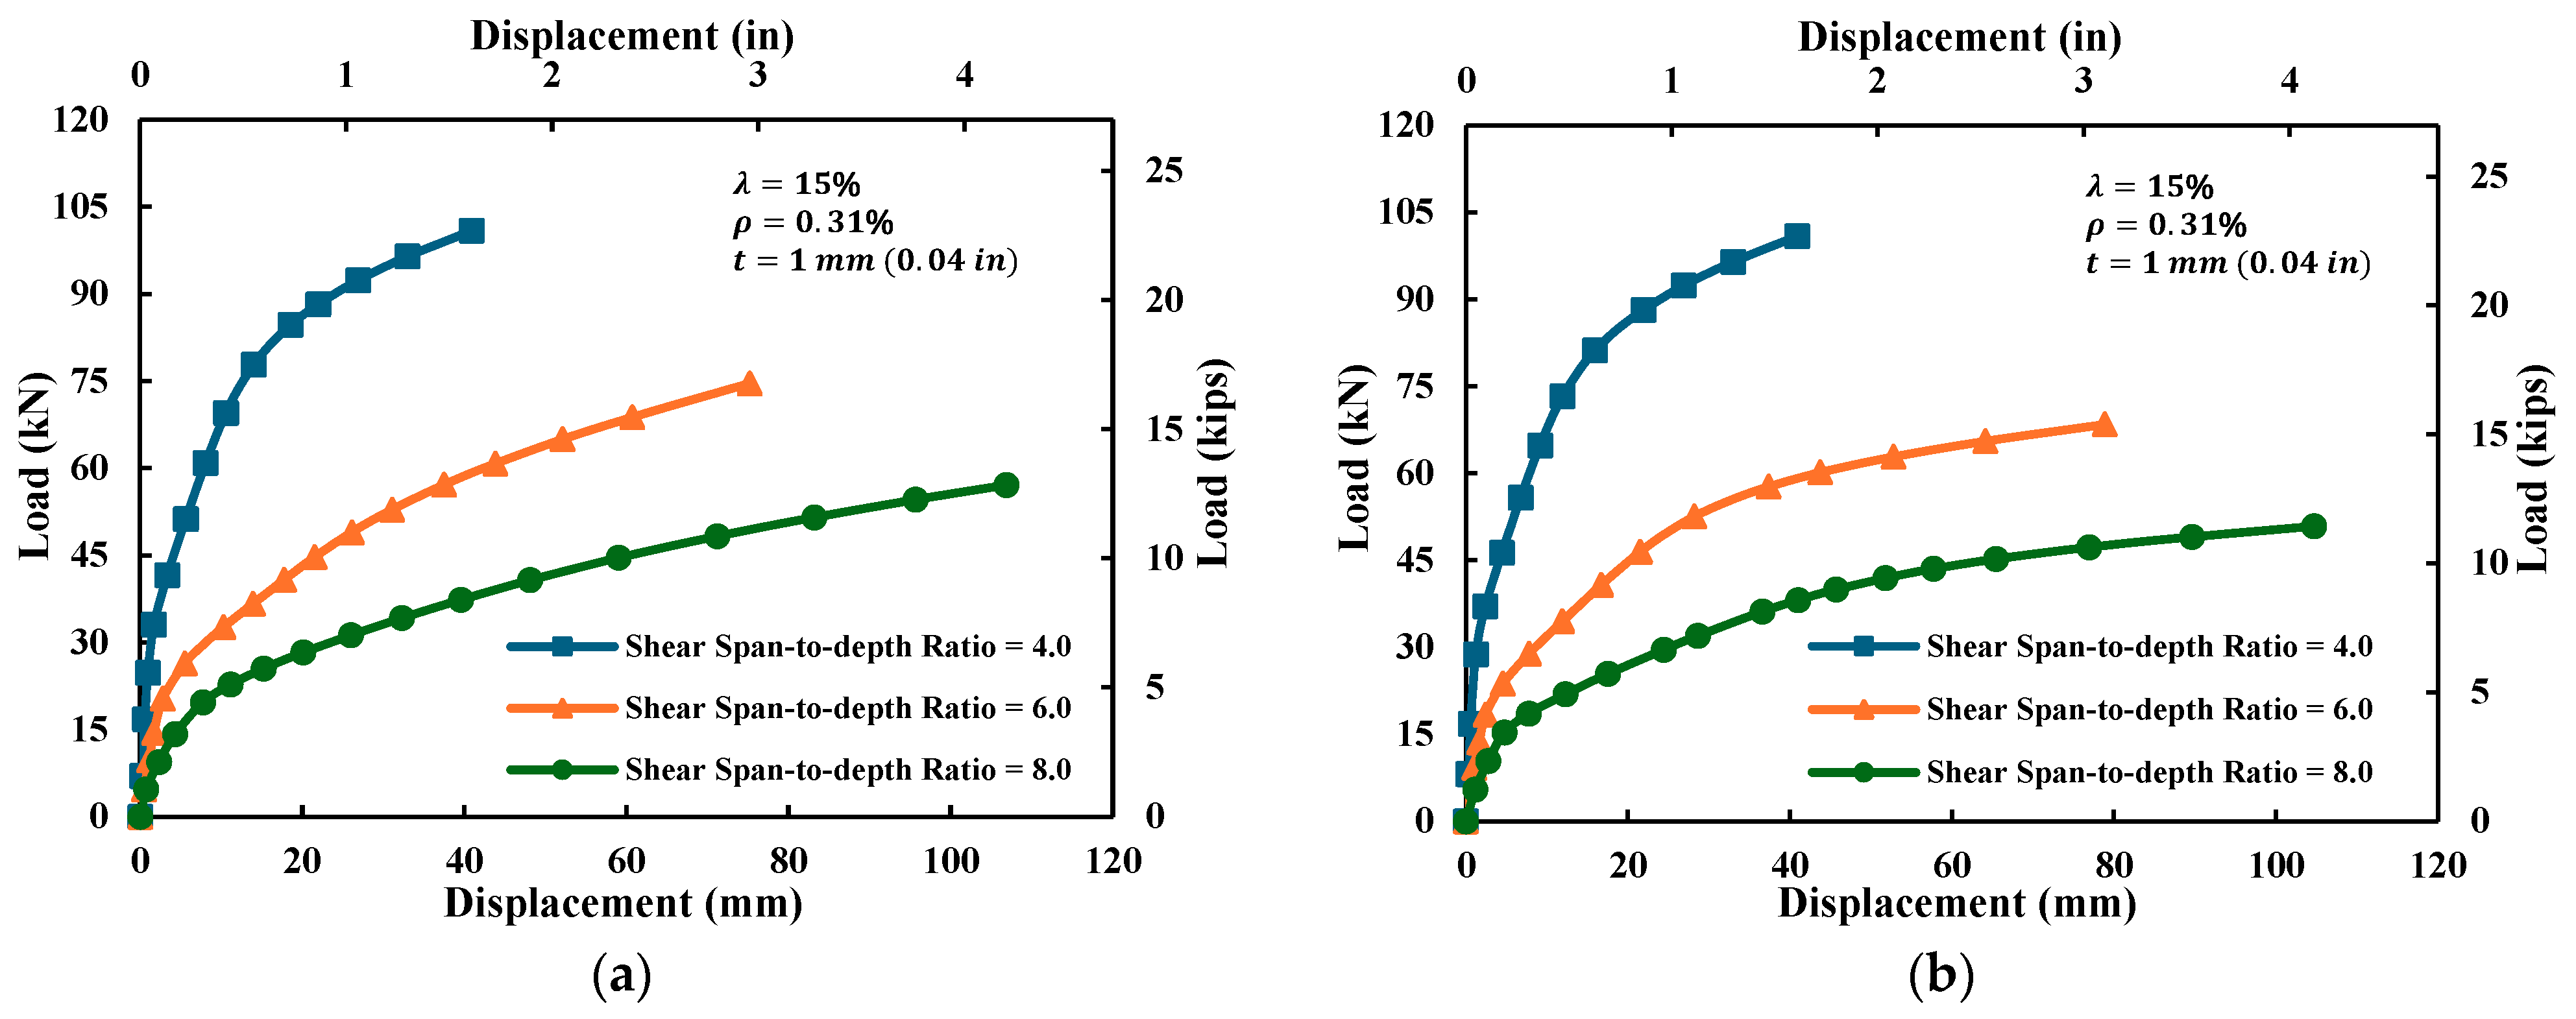
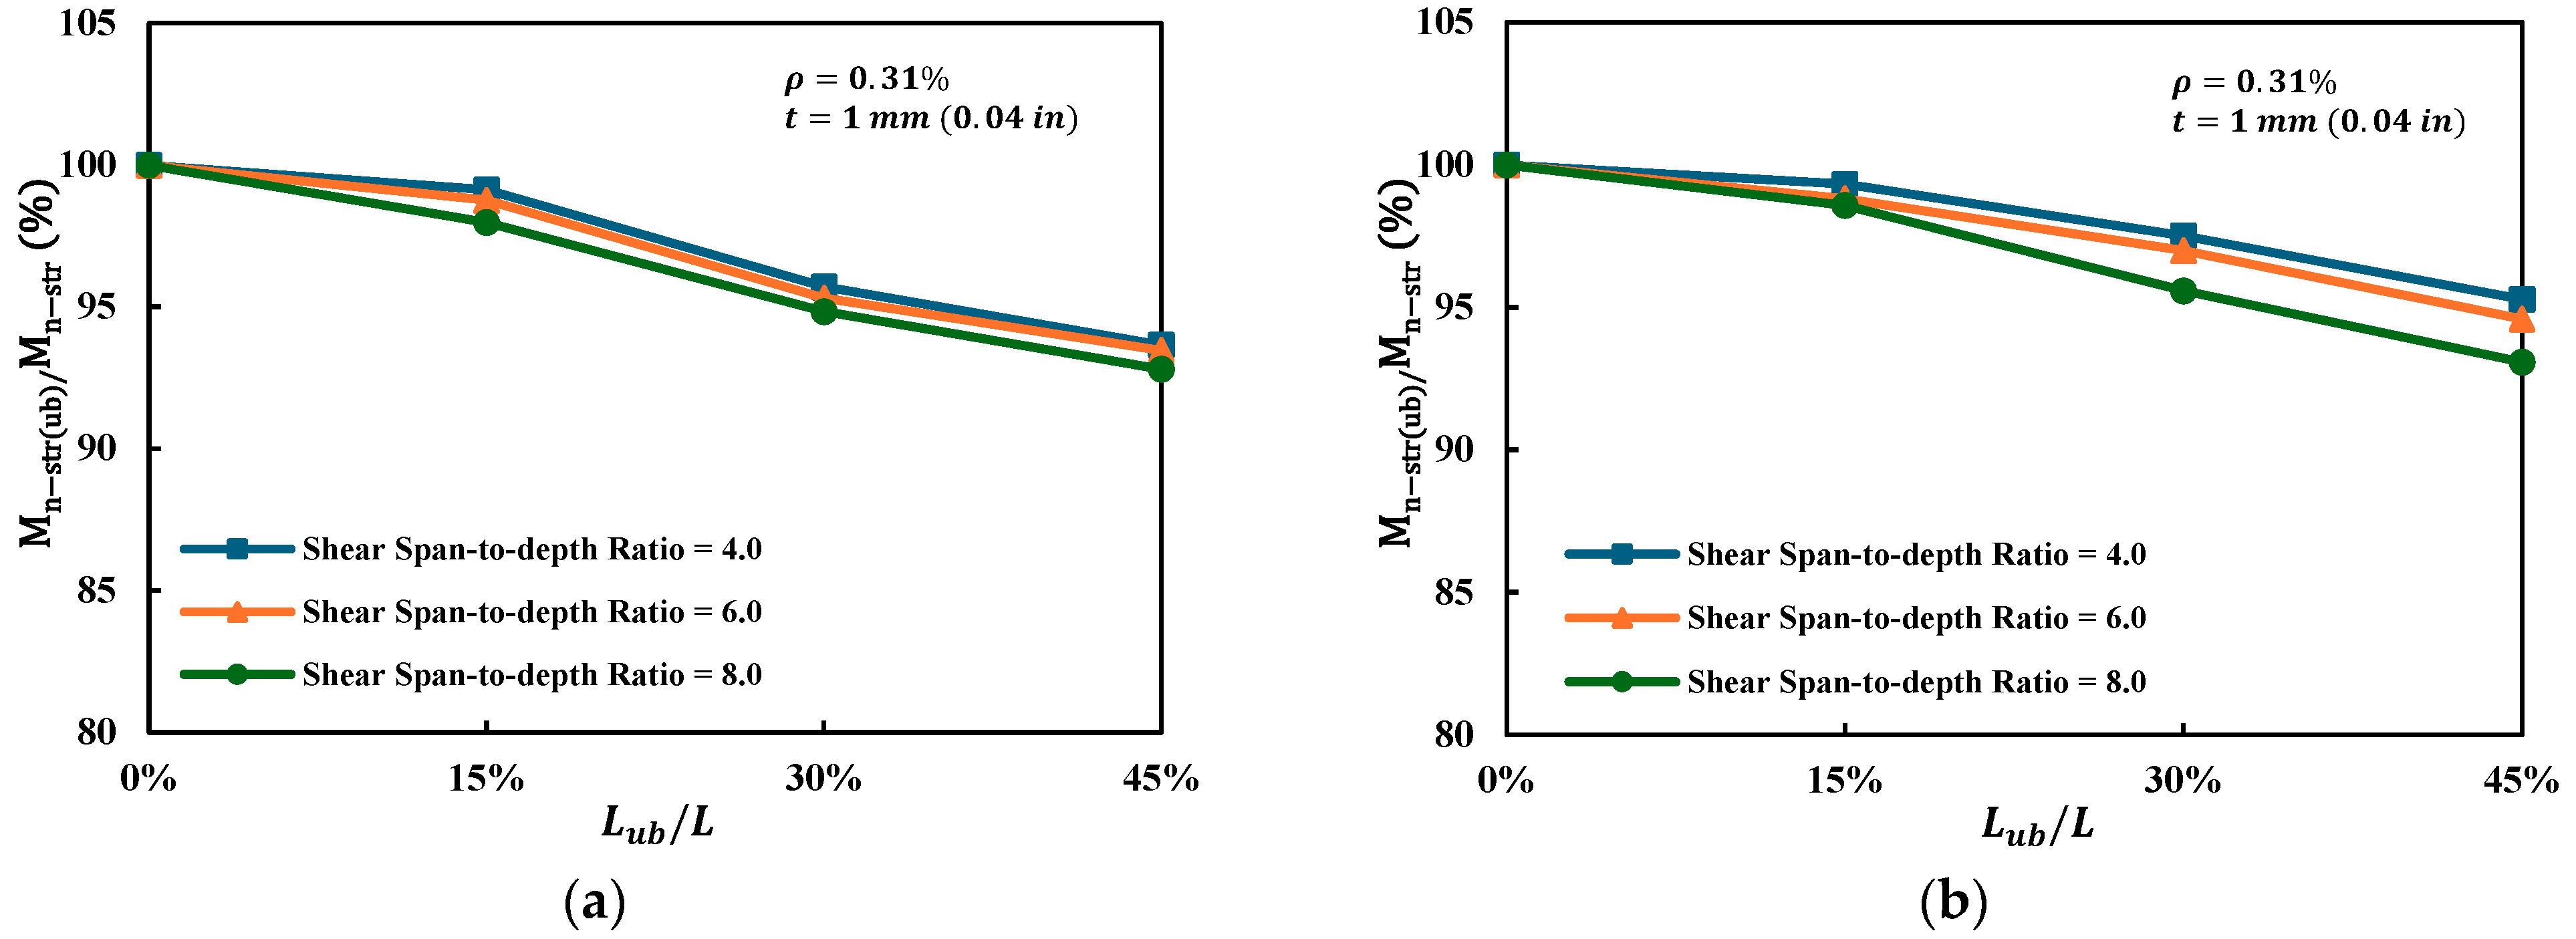
Figure 14 shows that RC beams strengthened with 1 mm (0.04 in) CFRP or SP ( ρ = 0.31%, λ = 15%) exhibit lower strength and stiffness but higher ductility as shear span-to-depth ratio increases from 4.0 to 8.0. This trend reflects a shift from shear- to flexure-dominated failure modes. Unbonded reinforcement further reduces flexural capacity and stiffness, especially at higher shear span-to-depth ratio, where full composite action is critical. The effects are consistent across both strengthening types.
Figure 15 shows that the normalized moment capacity (Mn-str(ub)/Mn-str) of RC beams—all with a constant reinforcement ratio of 0.31%—strengthened using 1 mm (0.04 in) thick CFRP or SP, decreases with increasing unbonded reinforcement length across all shear span-to-depth ratios. Although higher shear span-to-depth ratios (from 4.0 to 8.0) exacerbate the reduction in flexural capacity, this effect is significantly mitigated in strengthened beams. For CFRP-strengthened beams, the capacity reduction between a v / d = 4.0 and 8.0 is only 0.86%, and for SP-strengthened beams, 2.18%, compared to 3.9% in unstrengthened beams. This reduced sensitivity is attributed to the added stiffness and crack-bridging capability of external strengthening materials, which help maintain flexural performance even under partial debonding, thereby diminishing the influence of span geometry.

4.2.2. Reinforcement Ratio ( ρ )

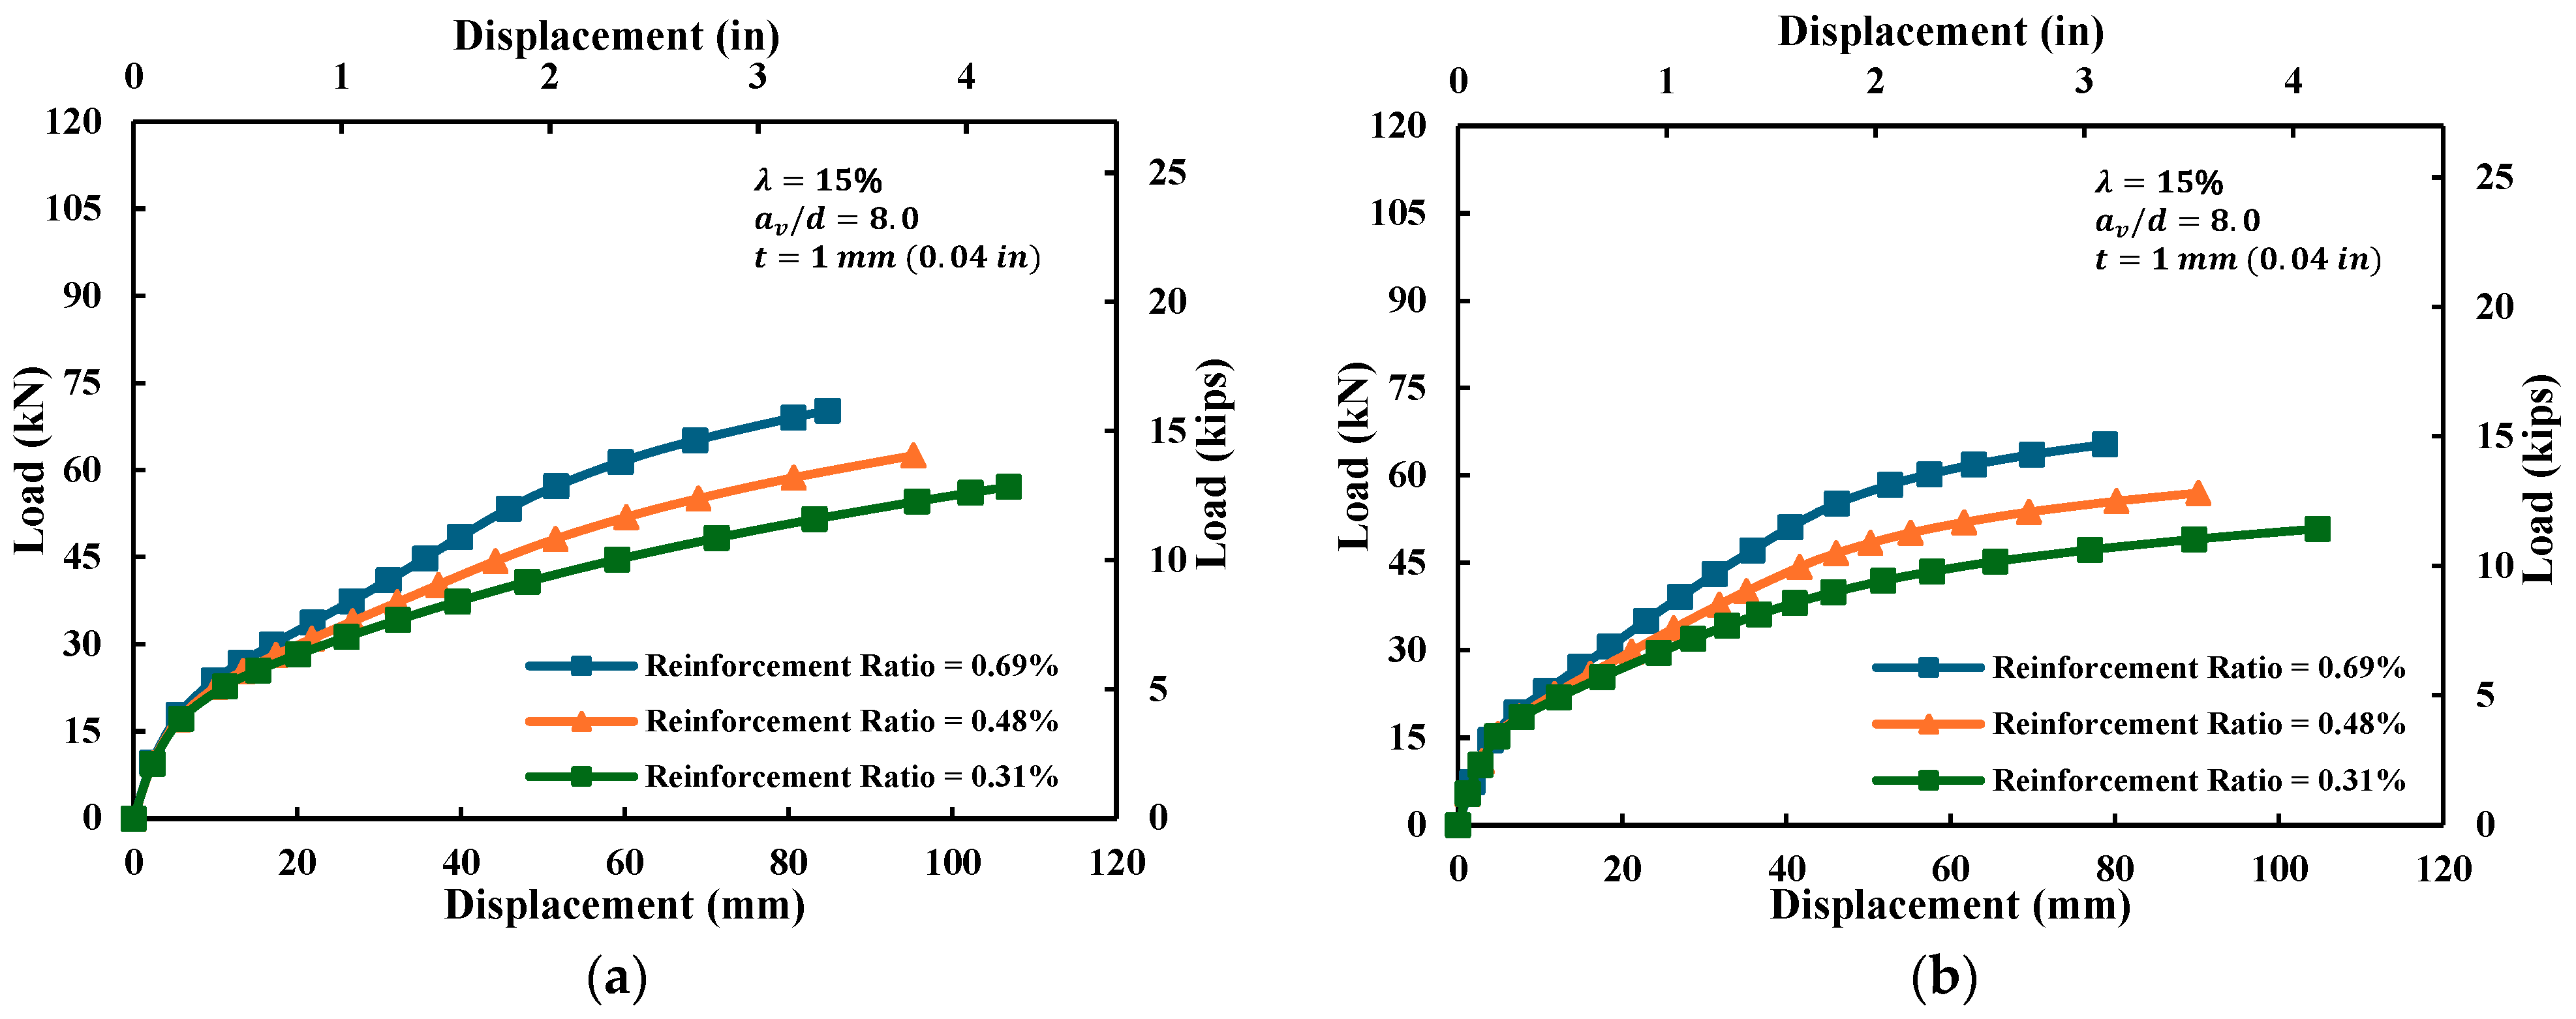
Based on Figure 16, increasing the reinforcement ratio from 0.31% to 0.69% leads to noticeable improvements in both load-carrying capacity and initial stiffness in CFRP- and SP-strengthened beams. Higher reinforcement ratios result in steeper load–deflection curves and reduced deflections at peak load, indicating a stiffer but less ductile response. This trend is consistent across both strengthening types under the same shear span-to-depth ratio and debonding condition.
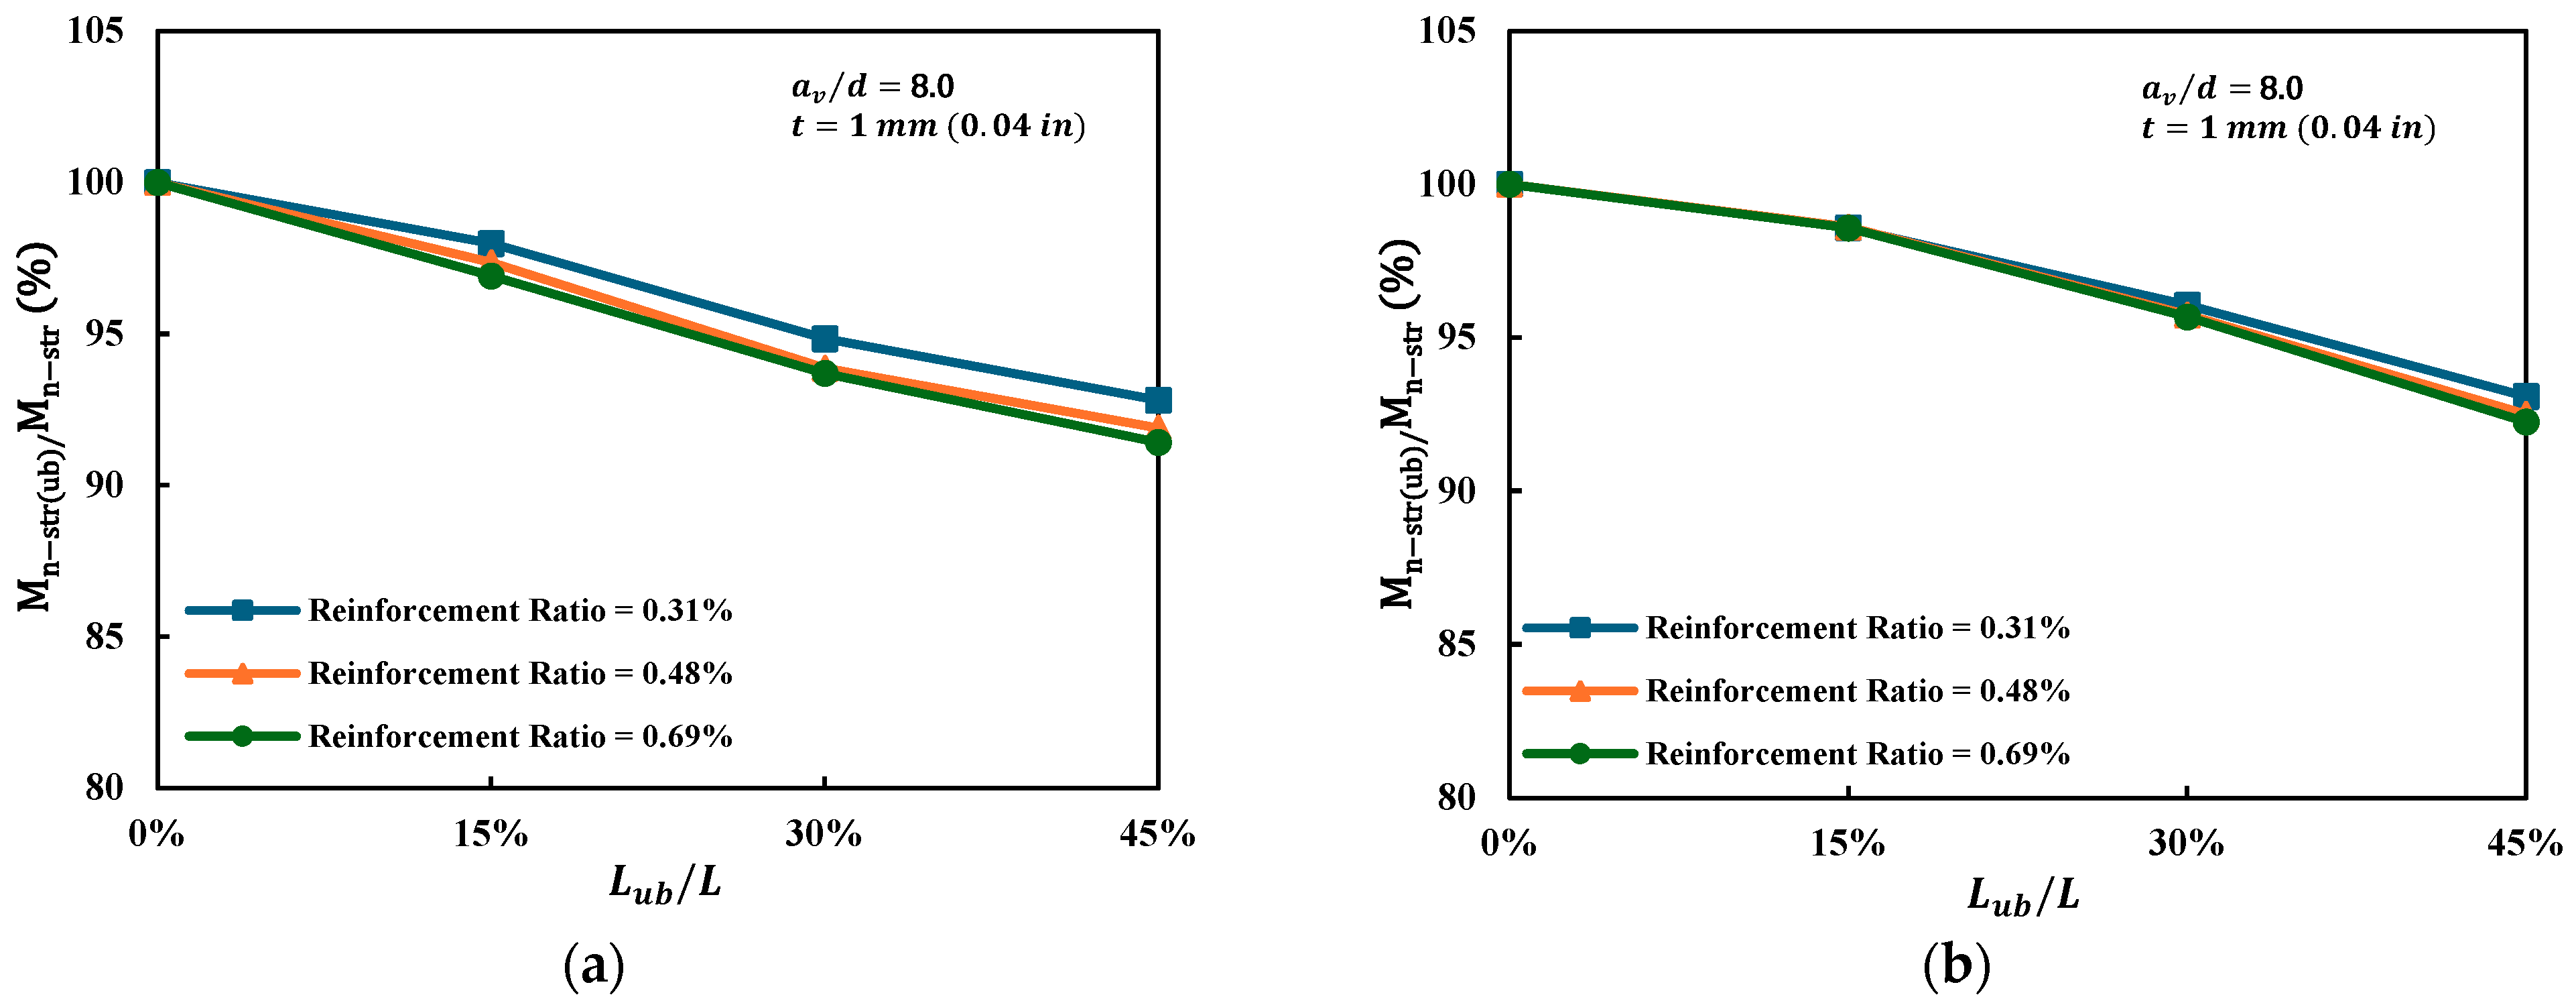
Figure 17 demonstrates that while increasing reinforcement ratio generally enhances flexural strength, its influence on debonding-induced capacity loss is minimal for RC beams strengthened with 1 mm (0.04 in) CFRP or SP. As debonding increases to 45%, moment reduction varies only slightly across reinforcement ratios—from 7.19% to 8.58% for CFRP, and 6.92% to 7.75% for SP—similar to unstrengthened beams. This is because unbonded steel cannot fully engage, regardless of amount, while external strengthening compensates for the reduced internal force transfer. Thus, reinforcement ratio has limited impact on capacity degradation under partial debonding when sufficient external reinforcement is present.

4.2.3. Debonding Degree ( λ )

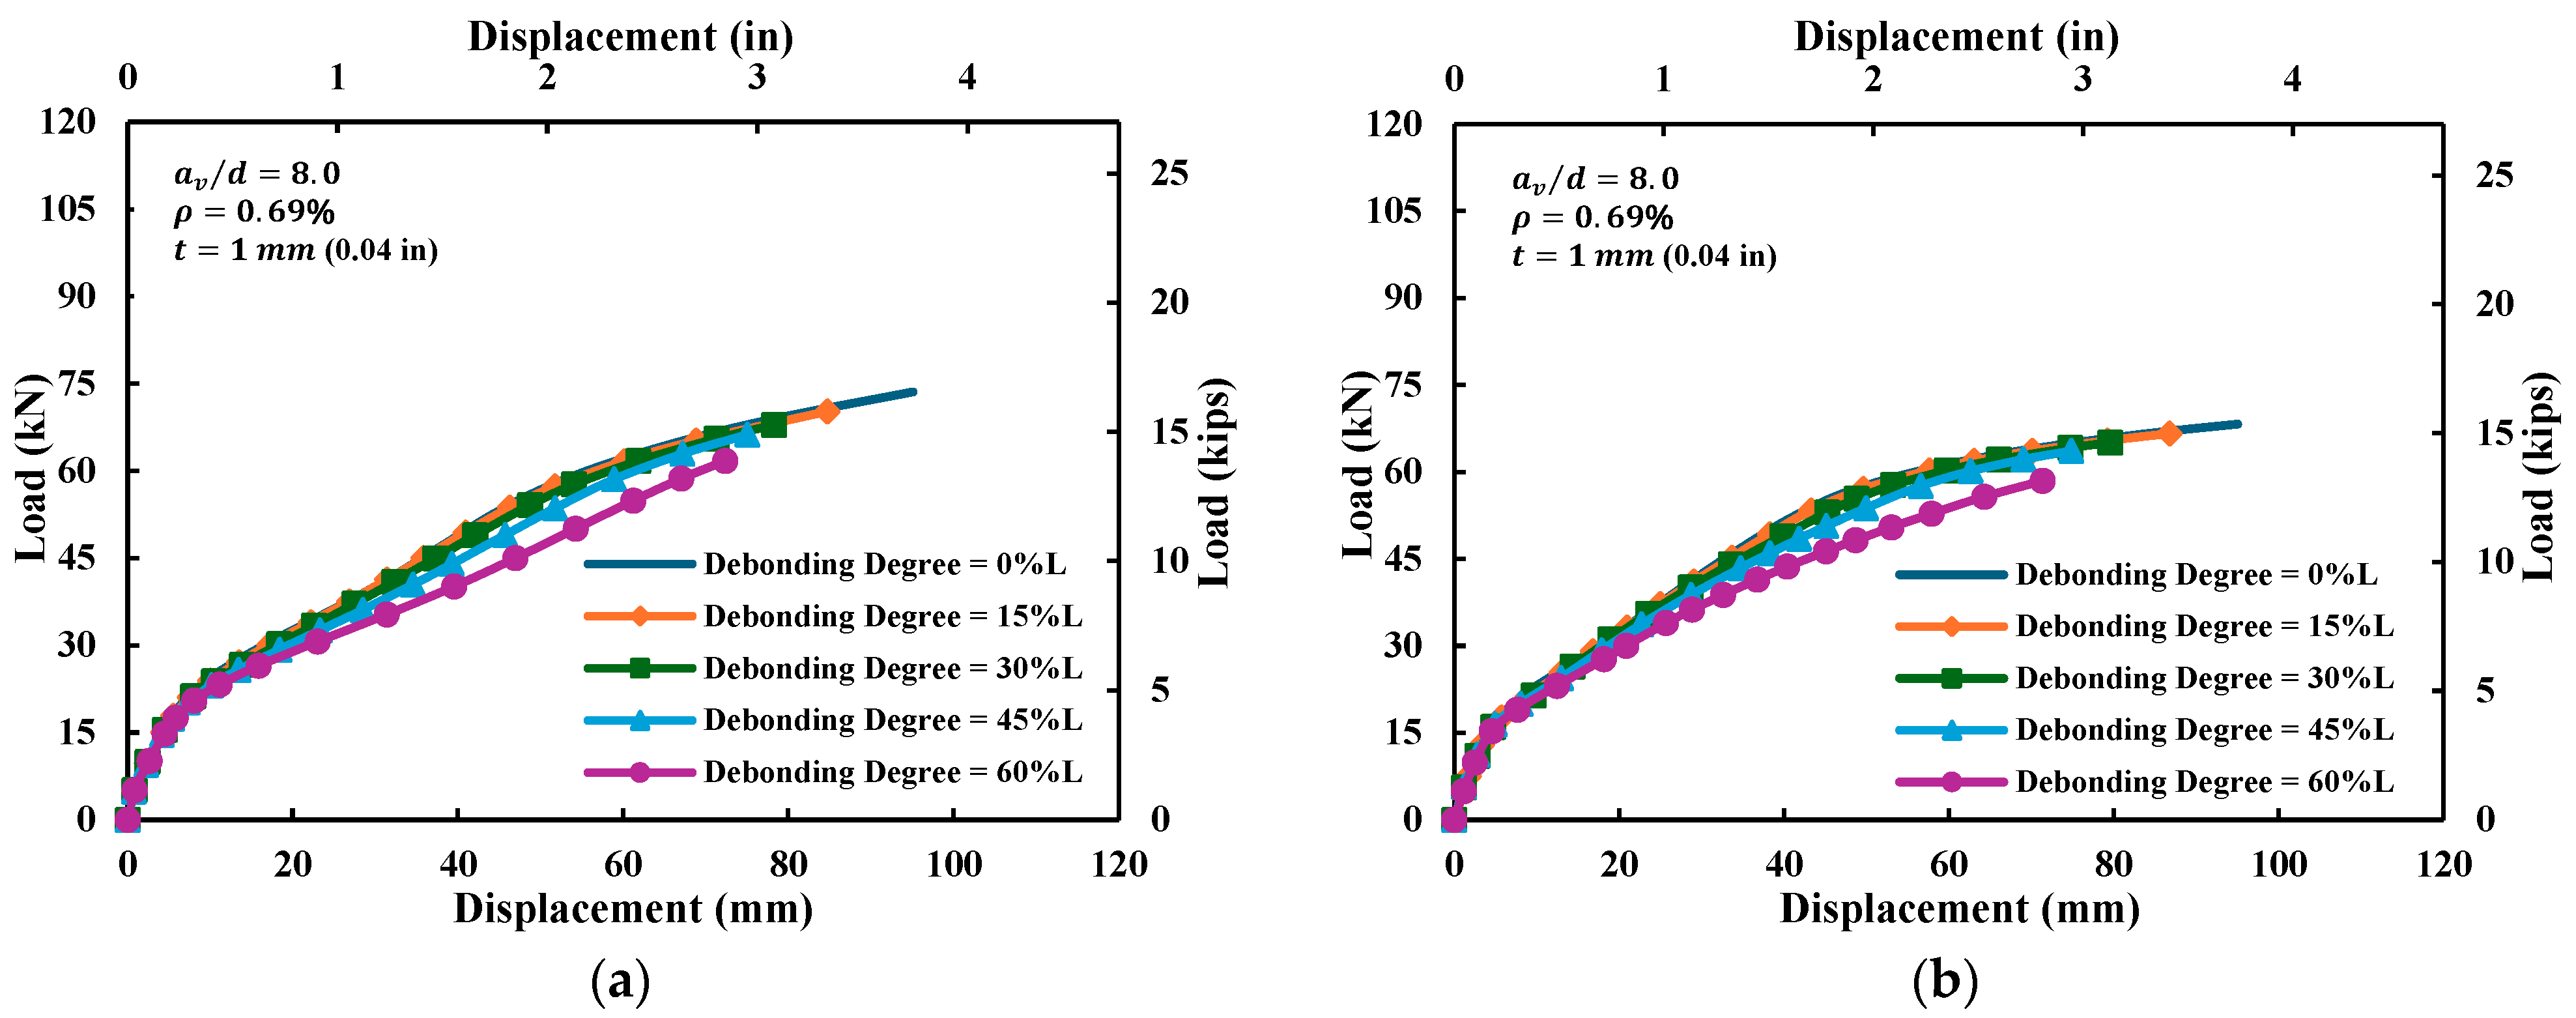
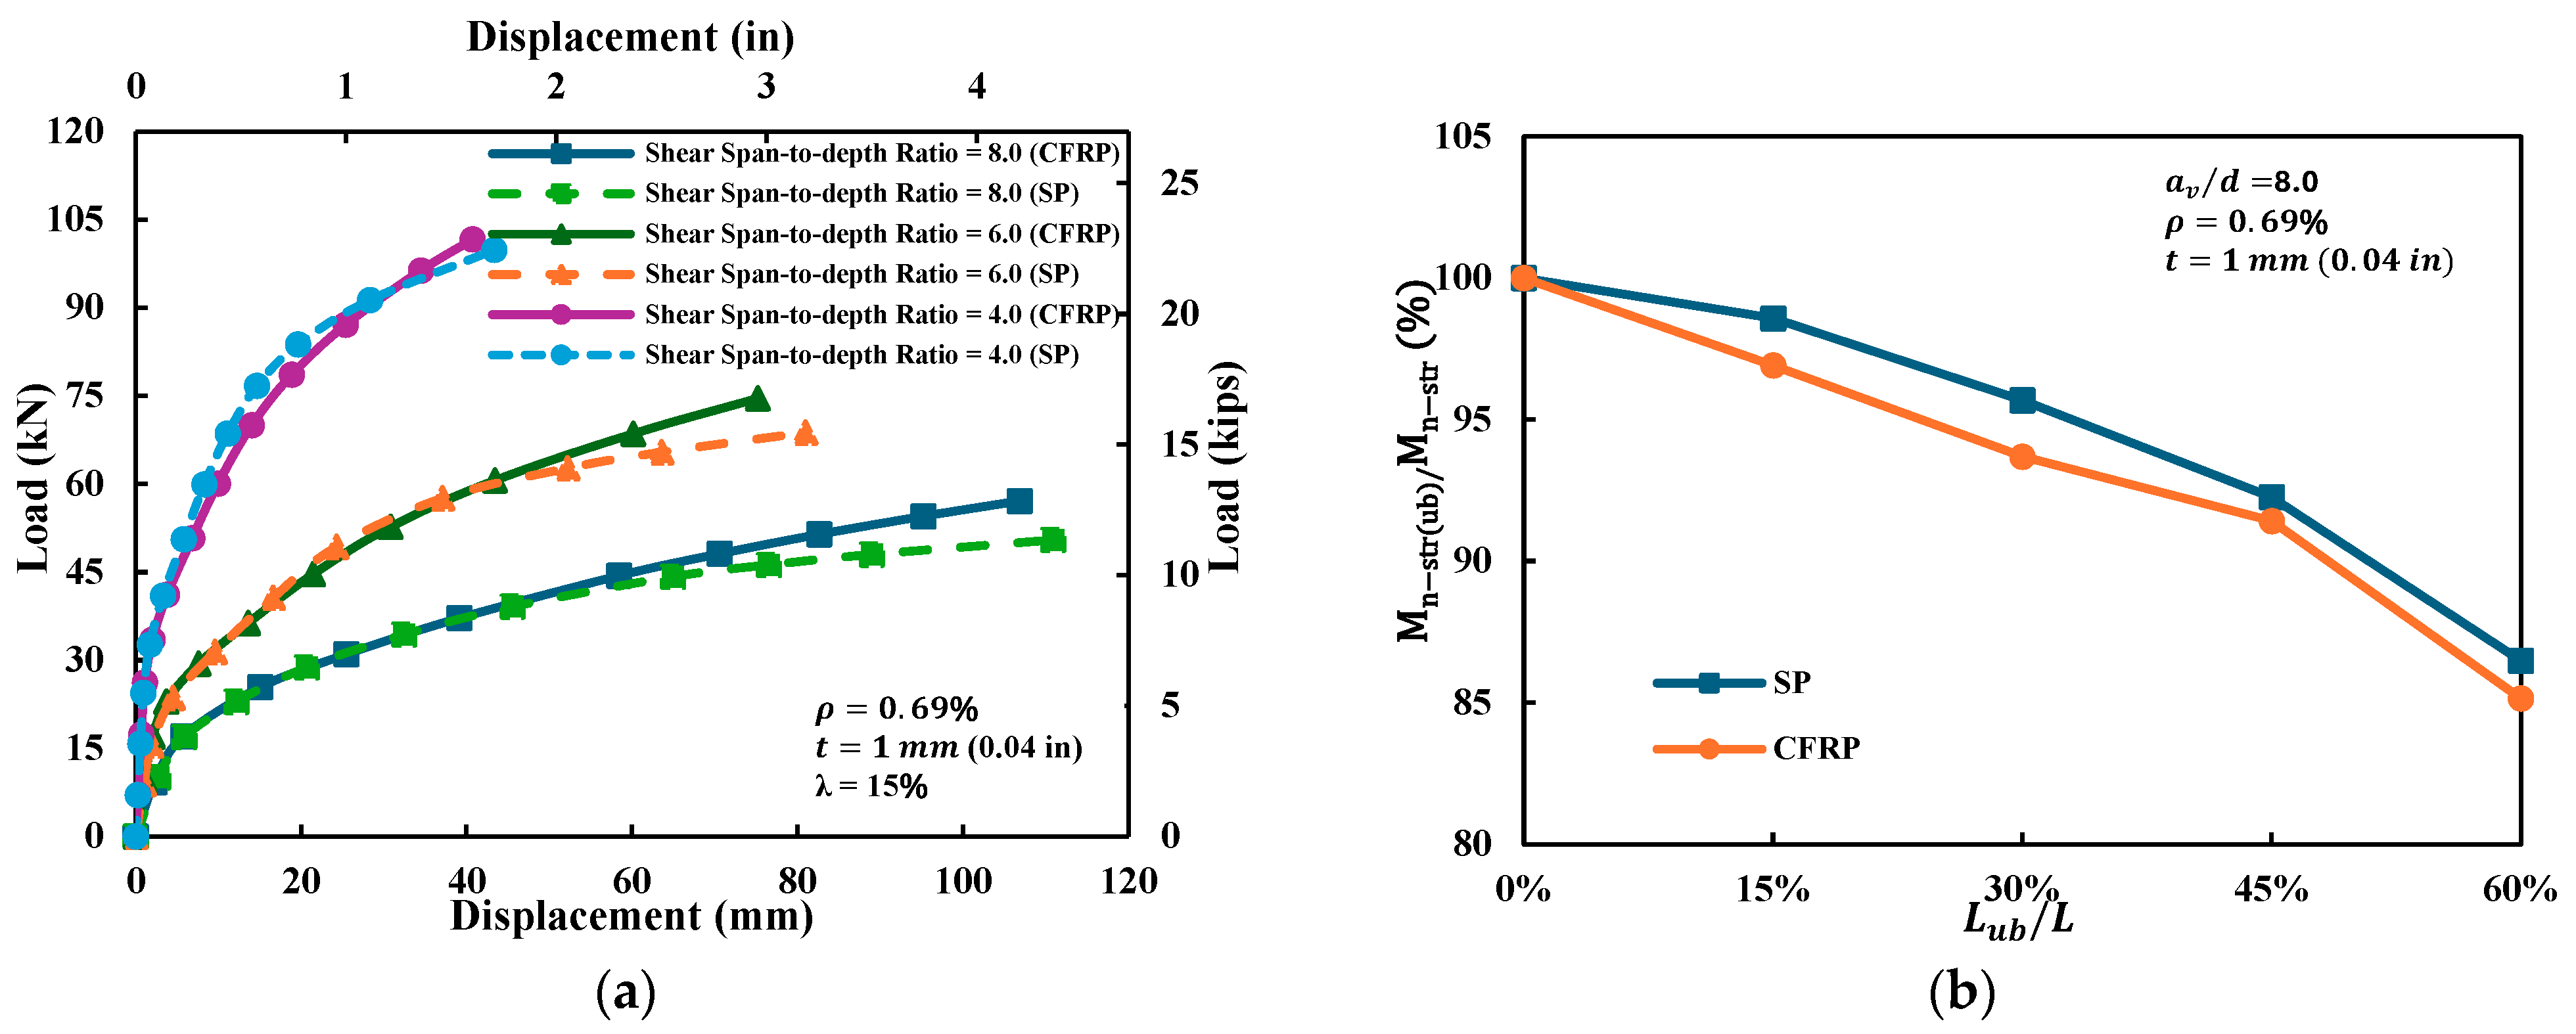
The load–deflection responses for RC beams with 1 mm (0.04 in) CFRP and 1 mm (0.04 in) SP strengthening, evaluated over multiple reinforcement debonding degrees, are shown in Figure 18 ( a v / d = 8.0, ρ = 0.69%). As debonding increases, all specimens exhibit reduced stiffness, ductility, and load capacity. For CFRP-strengthened beams, the ultimate load drops by about 10% from 0% to 45% debonding, with an additional 7% loss at 60%. SP-strengthened beams show a 7% and 8% reduction over the same intervals. These declines result from weakened force transfer between concrete and steel, limiting internal reinforcement effectiveness. CFRP systems are more sensitive to debonding, especially at higher levels, due to their reliance on bond-dependent load sharing. In contrast, SP—with greater stiffness and ductility—better maintains performance at moderate debonding, but both systems degrade significantly at 60%, underscoring the need for reliable bond integrity in strengthened beams.
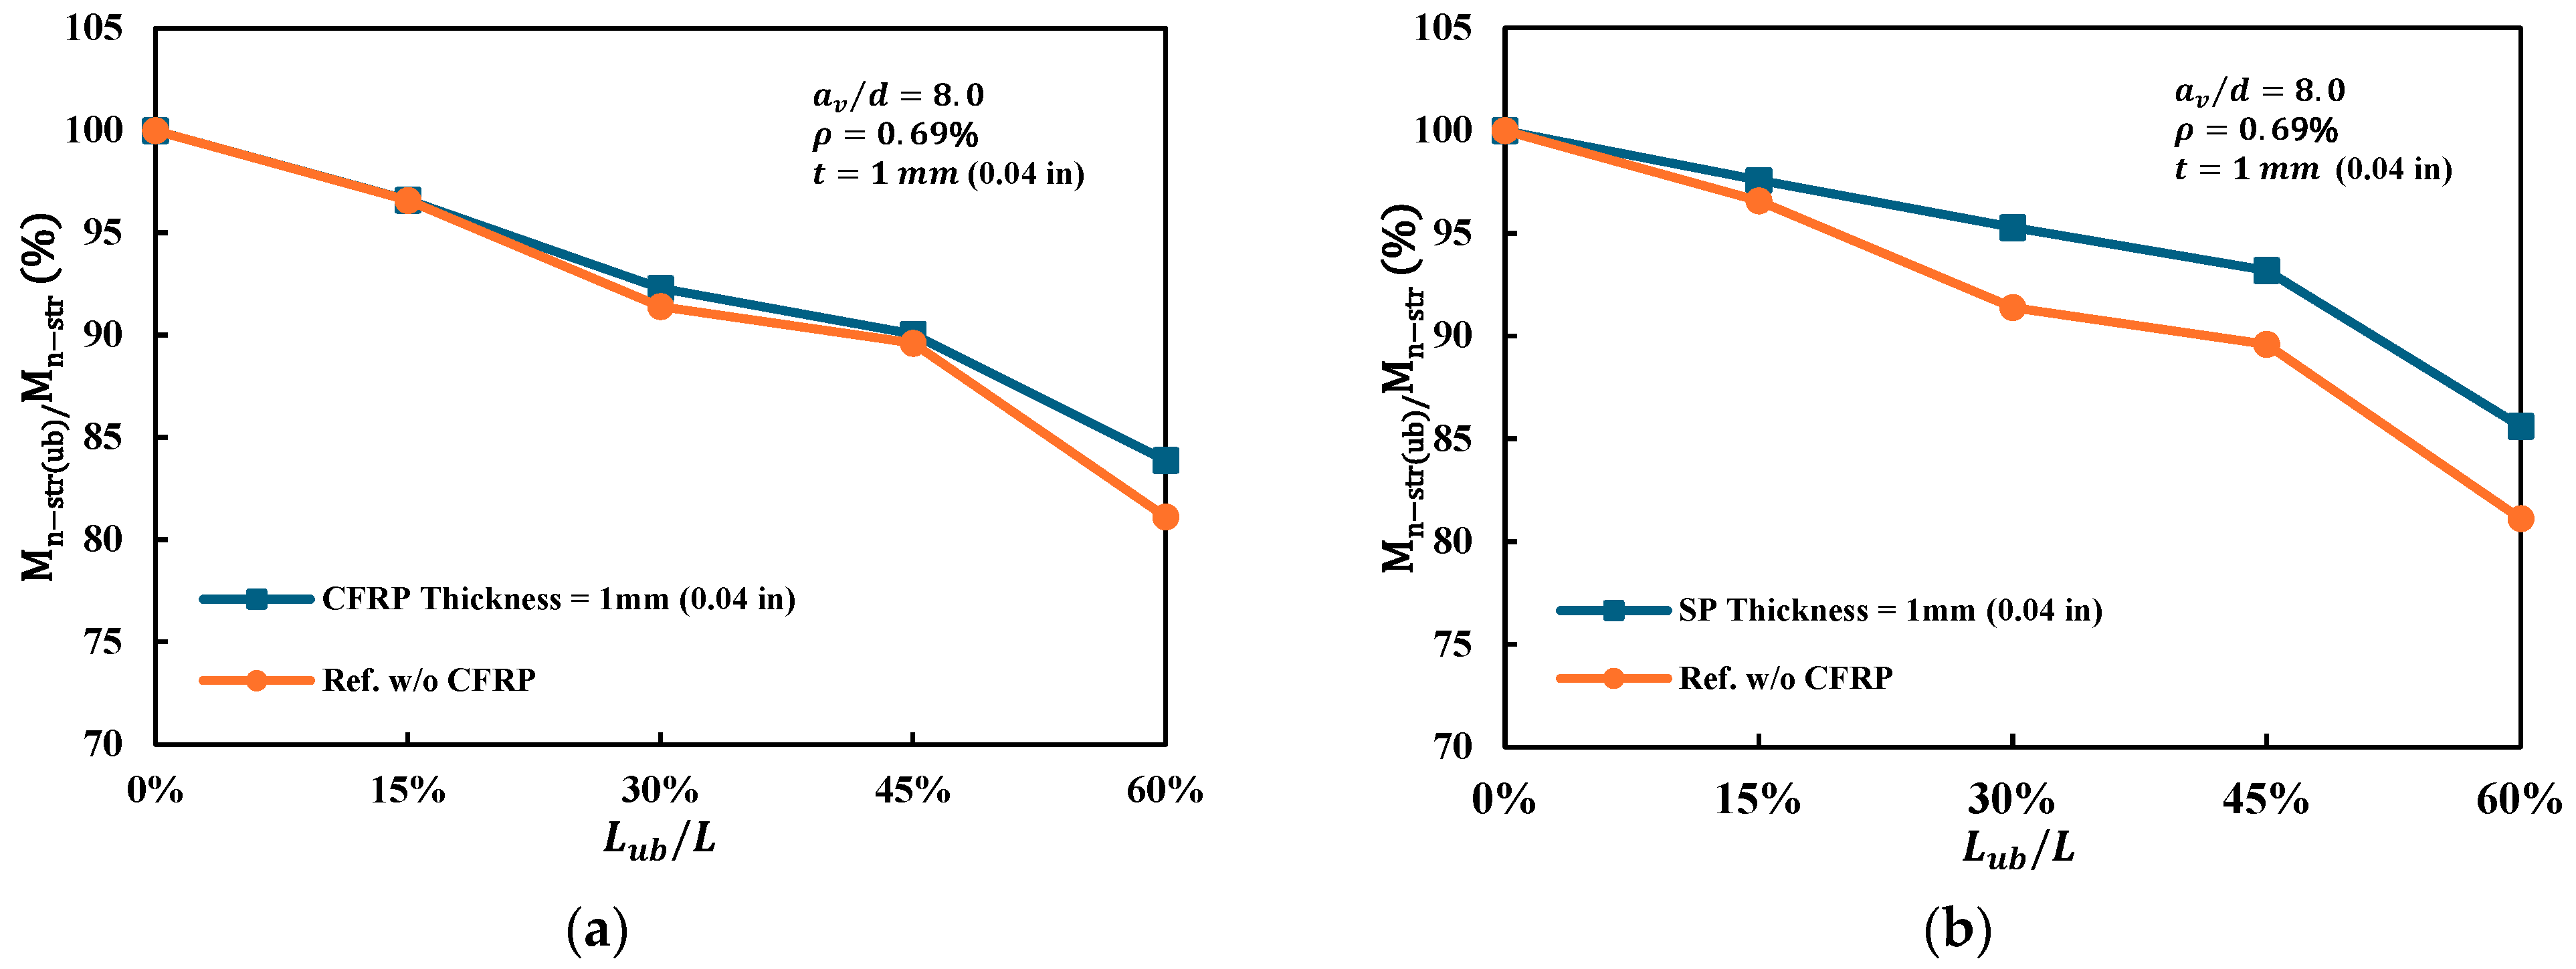
Figure 19 shows the effect of increasing debonding on the normalized flexural capacity for RC beams strengthened with 1 mm (0.04 in) CFRP and SP, respectively, under identical conditions ( a v / d = 8.0, ρ = 0.69%). In both cases, moment capacity declines with greater unbonded length. However, strengthened beams consistently retain more capacity than unstrengthened ones. At 60% debonding, CFRP-strengthened beams retain about 84% capacity vs. <80% for unstrengthened, while SP shows an even greater margin. This improvement is due to the added tensile contribution from CFRP or SP, which partially compensates for the reduced bond in internal steel. SP performs better at higher debonding levels, likely due to its greater stiffness and ductility. These results confirm that even thin external strengthening significantly enhances resistance to bond-related degradation.

4.2.4. Type of Strengthening Materials (CFRP/SP)

Figure 20 compares RC beams strengthened with 1 mm CFRP and SP under identical conditions. CFRP consistently achieves higher ultimate loads across all shear span-to-depth ratios due to its superior tensile strength and sustained stiffness, while SP provides higher initial stiffness but better ductility after yielding. As the unbonded length ratio L u b / L increases to 60%, normalized moment capacity (Mn-str(ub)/Mn-str) drops by 14.85% for CFRP and 13.52% for SP, indicating that CFRP is more sensitive to reinforcement debonding. This is attributed to CFRP’s reliance on effective anchorage in tension zones, whereas SP maintains more stable performance through its higher stiffness and bearing action. These results highlight the need to ensure adequate bond integrity, especially in CFRP-strengthened beams.
To further quantify the strength–ductility trade-off between CFRP- and SP-strengthened beams, Table 7 summarizes key flexural performance indicators obtained from the FEA results. In addition to the peak load ( P m a x ) and initial stiffness ( K i n i ), the table reports yield and ultimate deflections ( y , u ), displacement ductility ratio ( μ ), and energy absorption indices ( J S L S ) derived from the load–deflection curves. The results confirm that CFRP consistently provides higher ultimate strength but lower ductility, while SP achieves greater deformability and energy dissipation capacity after yielding. These quantitative metrics support the qualitative trends observed in Figure 20 and link them to serviceability (through P S L S ) and energy absorption demands relevant for design.
Based on these comparative results, practical guidelines can be drawn for strengthening design: CFRP are preferable when weight reduction and corrosion resistance are critical, but their effectiveness depends more on reinforcement–concrete bond conditions; steel plates remain a viable option where high initial stiffness and ductility are desired, though they add self-weight and require corrosion protection.

4.2.5. Thickness of Strengthening Materials ( t )

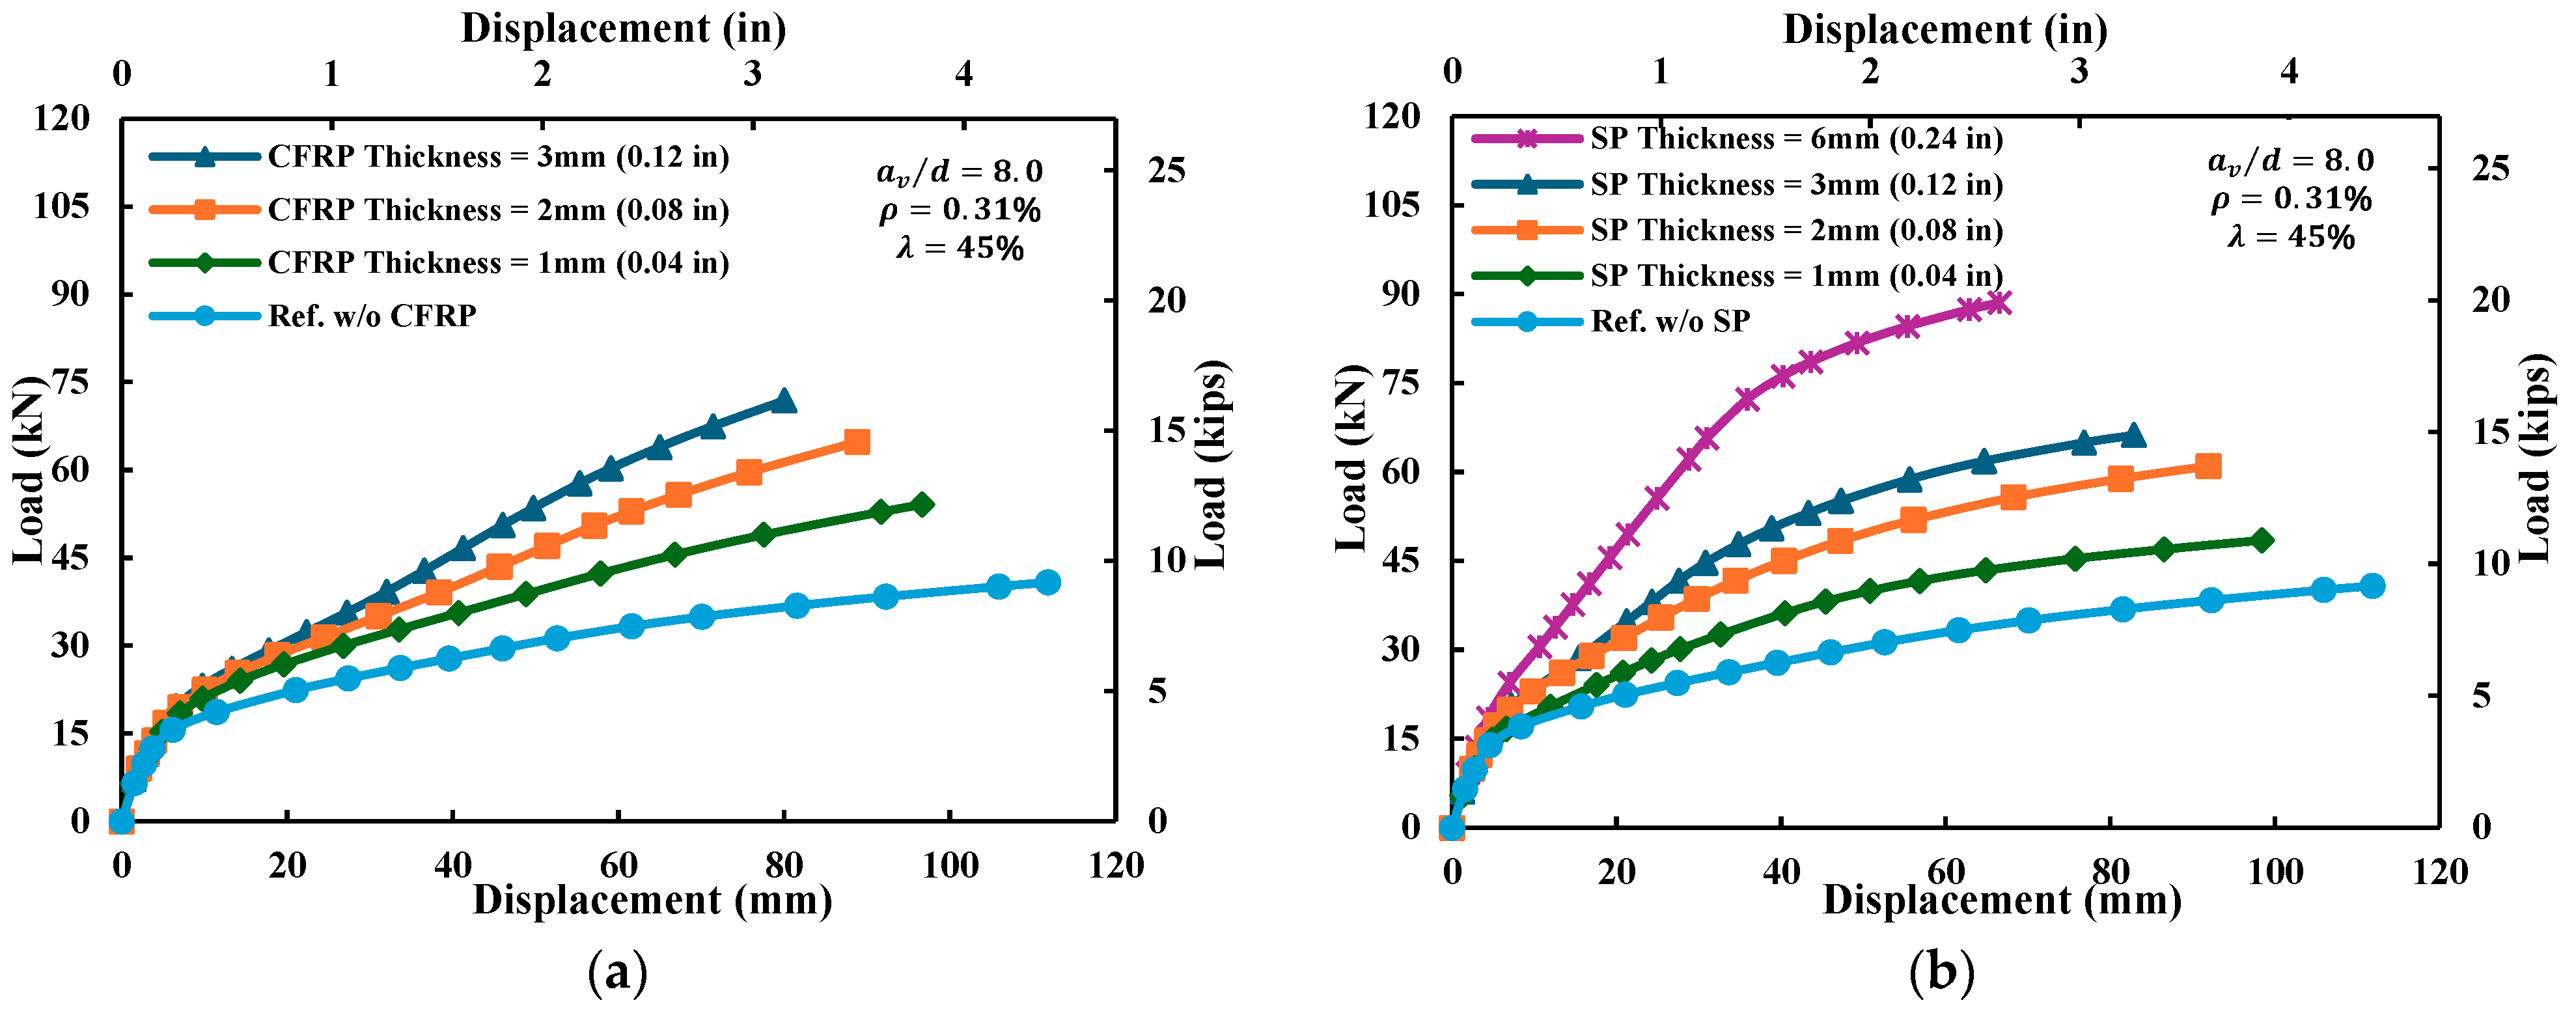
Figure 21 shows the load–deflection responses of RC beams strengthened with varying CFRP and SP thicknesses, respectively. Under identical test conditions ( a v / d = 8.0, ρ = 0.31%, λ = 45%), increased thickness generally improves strength and stiffness. The 3 mm (0.12 in) CFRP yields a 76% load increase but exhibits reduced ductility and brittle failure due to stiffness and potential debonding. In contrast, 6 mm SP achieves a 117% strength gain while maintaining better ductility and energy absorption. However, excessive thickness in either system may lead to stiffness-dominated behavior. These results underscore the need to balance strength, stiffness, and ductility when optimizing strengthening thickness under debonding conditions.
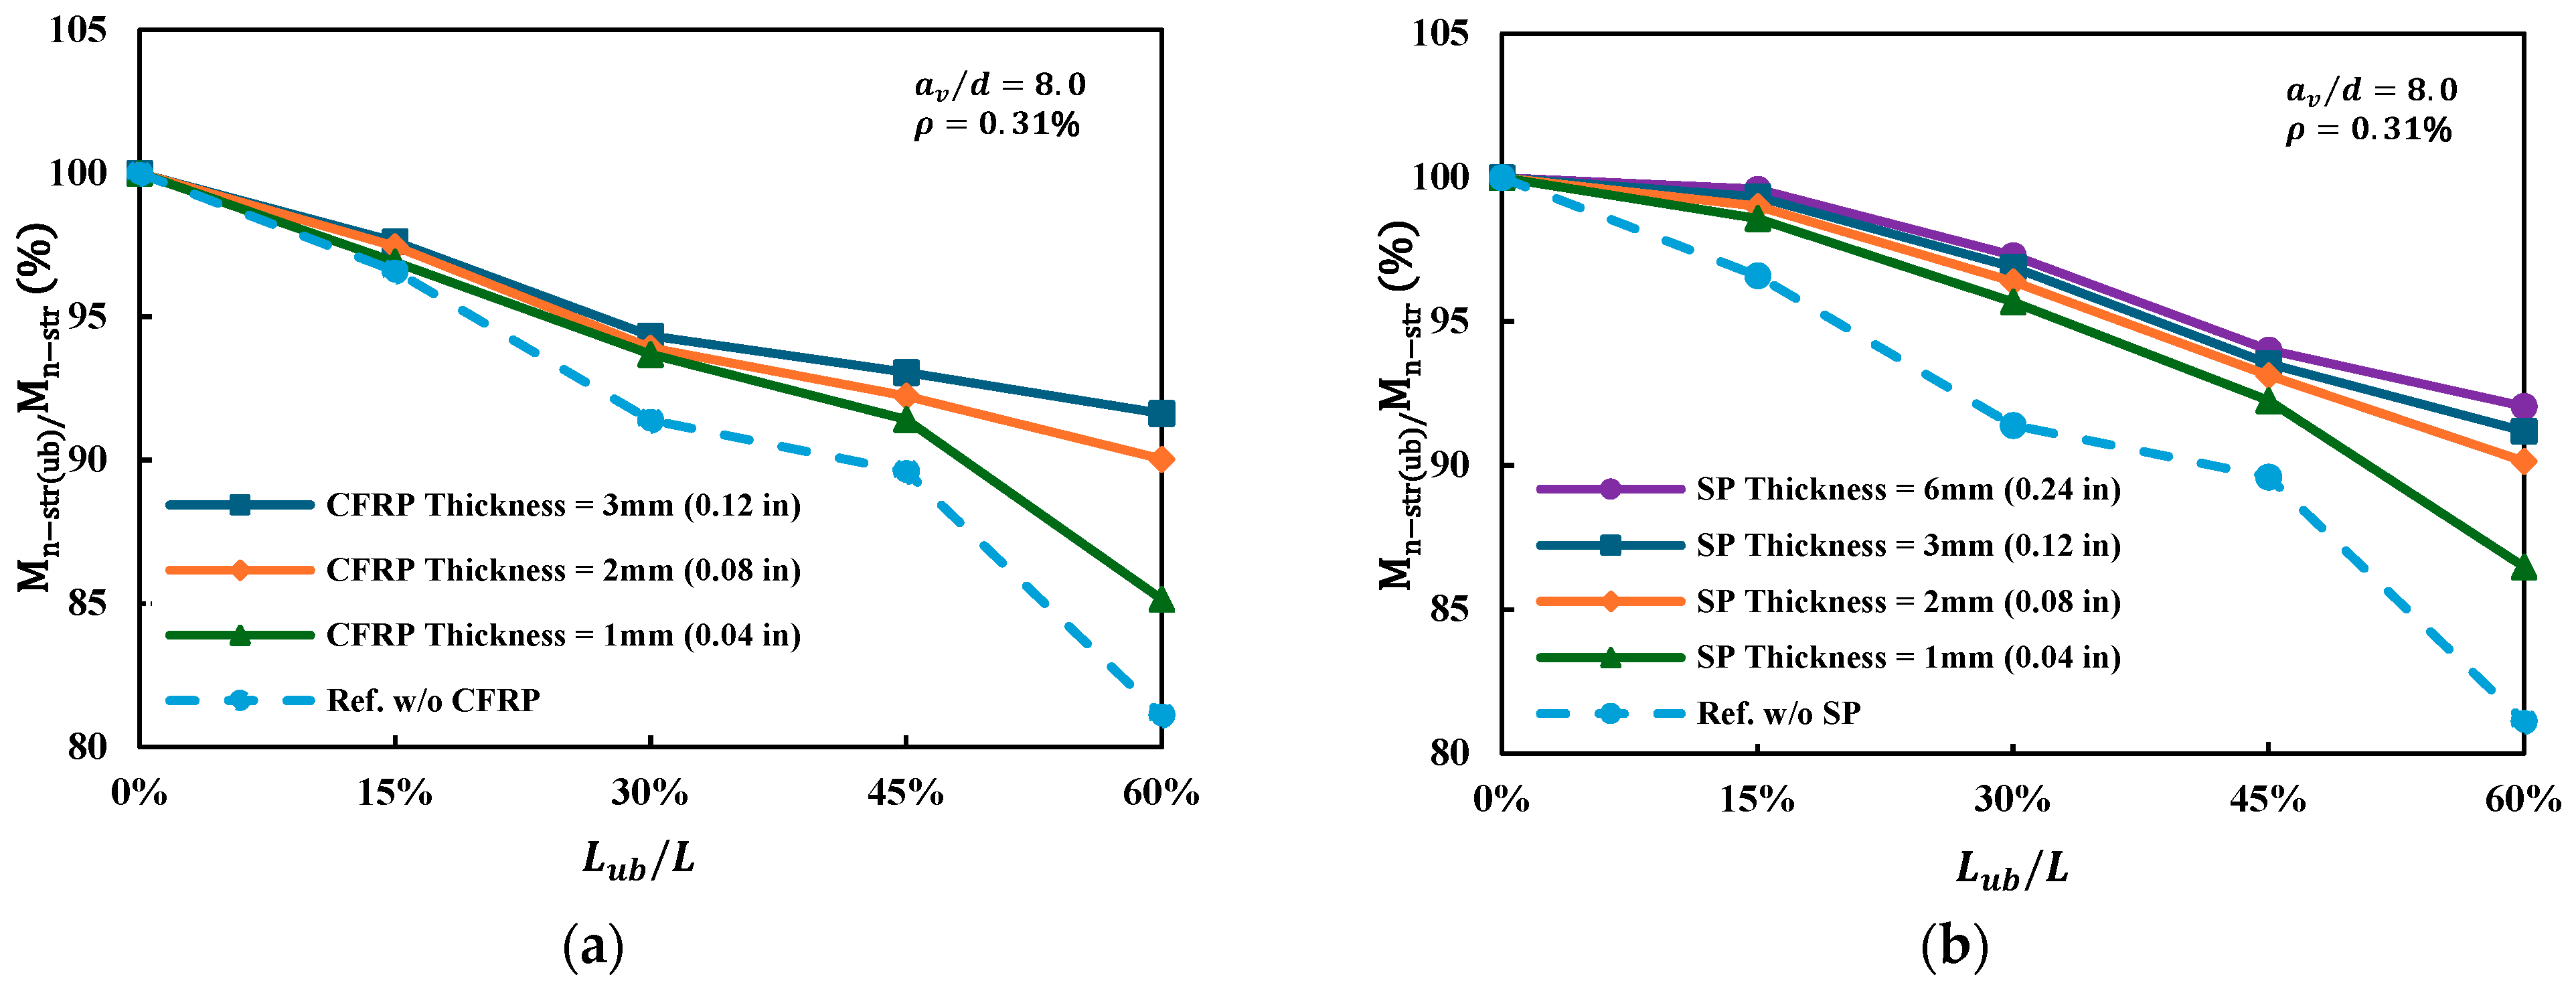
With a v / d =8.0 and ρ = 0.69% fixed, Figure 22 presents the dependence of Mn-str(ub)/Mn-str on CFRP/SP thickness under escalating reinforcement debonding. Since tie constraints were applied at the interface, reductions are solely due to internal debonding. For both CFRP and SP, moment capacity remains relatively stable up to 45% debonding regardless of thickness. At 60%, thicker layers are clearly more effective: 3 mm (0.12 in) CFRP shows only an 8.4% reduction versus 14.9% for 1 mm (0.04 in); similarly, 6 mm (0.24 in) SP limits the drop to 8% compared to 13.5% for 1 mm (0.04 in). In contrast, unstrengthened beams show an 18.8% reduction. These results highlight that while both CFRP and SP mitigate debonding effects, thicker strengthening layers are more effective under severe debonding conditions.

5. Analytical Models

Fully bonded RC beams maintain strain compatibility, allowing classical flexural theory to predict ultimate strength. In unbonded beams, this compatibility is lost, leading to reduced capacity and altered behavior. Like unbonded tendons in prestressed concrete, stress development depends on global deformation. This study adopts a neutral-axis-based method [35] to estimate the strength of RC beams with unbonded reinforcement by accounting for the independent behavior of steel and concrete.
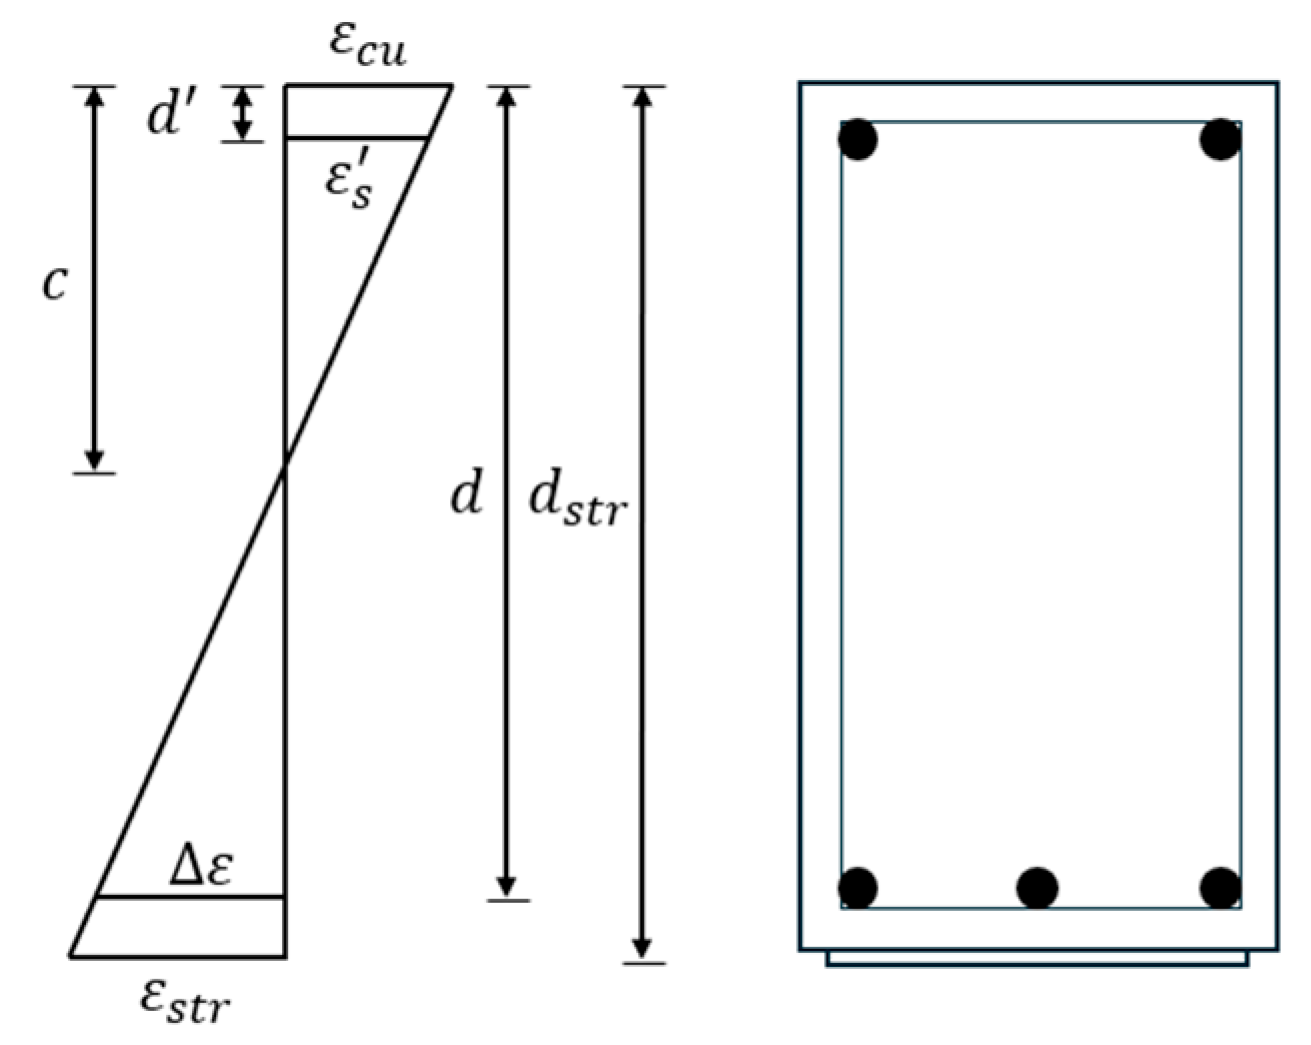
The strain profile in an RC beam with partially unbonded reinforcement is illustrated in Figure 23, where the absence of bond causes the steel and concrete to deform independently. Concrete strain is assumed to follow a linear (triangular) distribution, and a virtual strain increment Δε is defined to capture the strain at the reinforcement level. Since the initial strain is zero, Δε directly reflects the current concrete strain based on this distribution.
ε = ε c u d c c  
With deformation concentrated in a plastic region, the corresponding concrete elongation can be derived.
L 0 = ε · L 0
The equivalent plastic length L 0 is further assumed to be proportional to the neutral axis depth c, with the proportionality expressed through a dimensionless coefficient Ψ .
L 0 c = Ψ
In this study, unbonded reinforcement is considered mechanically independent from the surrounding concrete, with no bond stress or slip effects. Although strain compatibility is absent, steel and concrete are assumed to undergo the same total elongation, which is uniformly distributed along the unbonded length L u b to calculate the mean steel strain.
ε s = L 0 L u b
Substituting Equations (16)–(18) into the above expression yields:
ε s = ε c u d c L d b Ψ
This final expression provides a compact and practical estimation of the tensile strain in the unbonded reinforcement as a function of the concrete ultimate strain ε c u , geometric parameters ( d , c , and L u b ), and the empirical coefficient Ψ . It forms the theoretical foundation for the analytical model developed in this study.
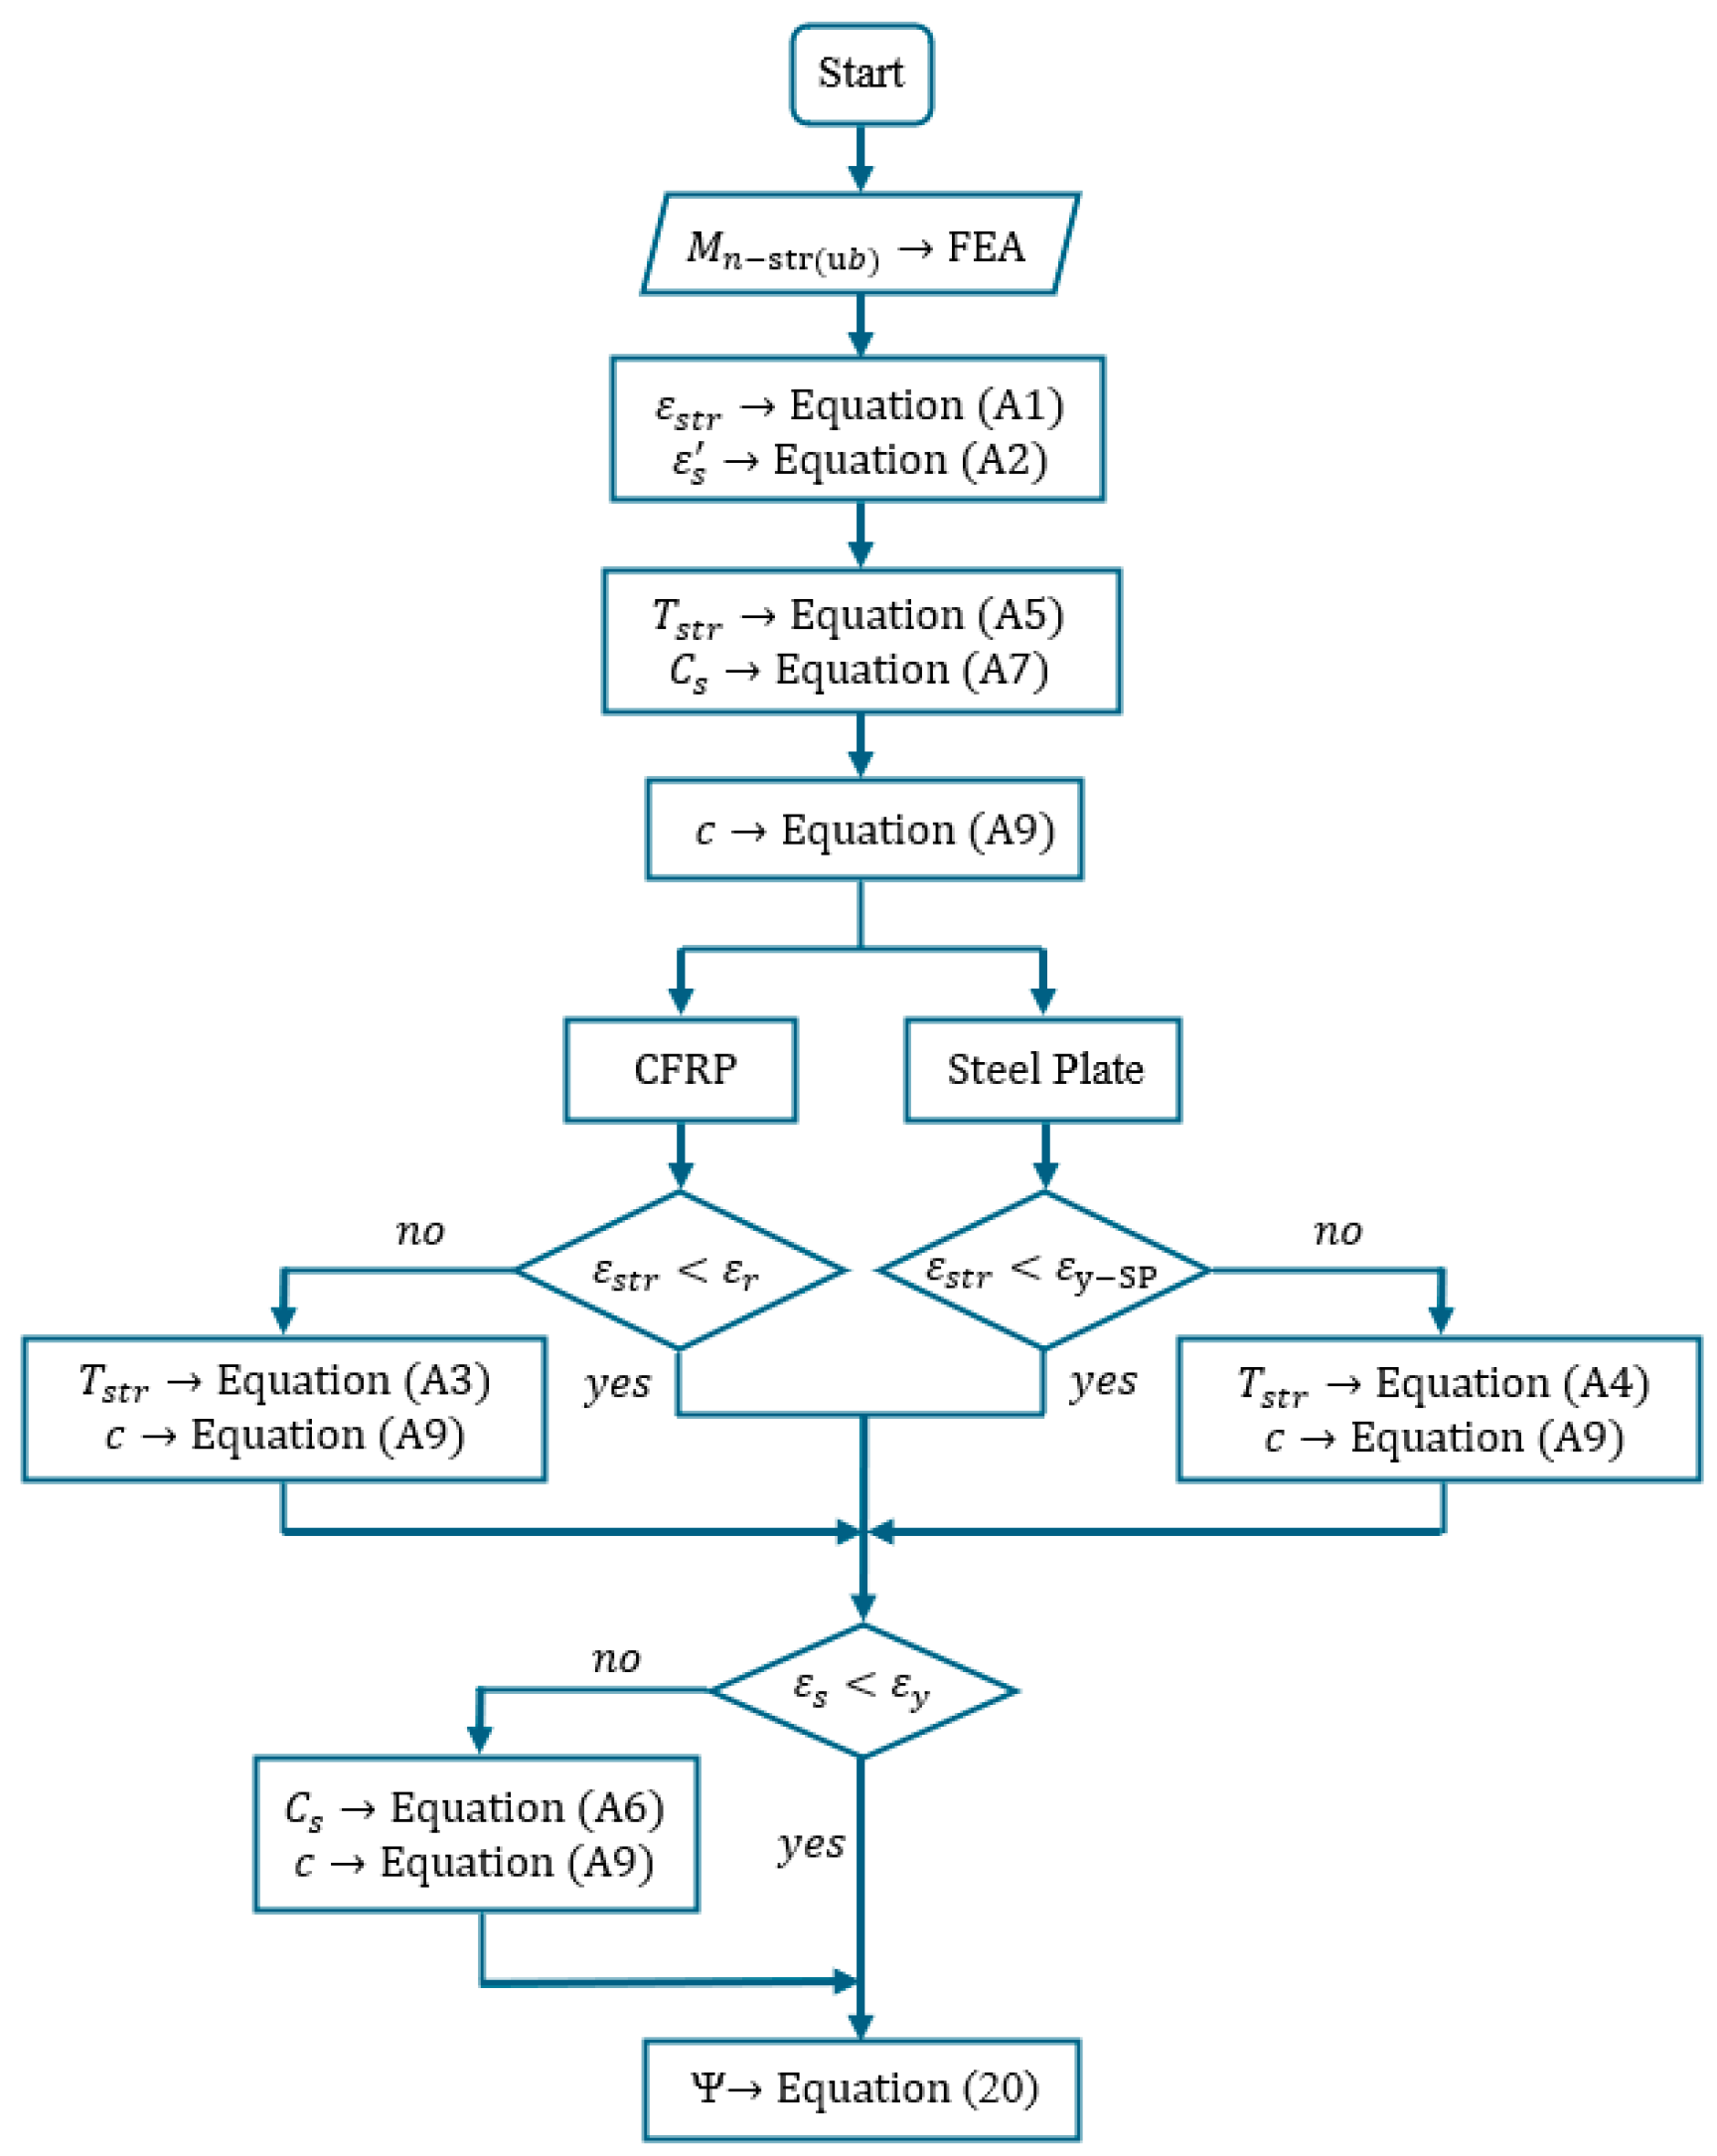
FEA-derived flexural capacities Mn-str(ub) were used to calculate the plastic zone ratio Ψ, as shown in Figure 24. The detailed formulas are provided in Appendix A. To identify key influencing factors, nonlinear regression models were developed for RC beams with CFRP or SP strengthening. Multiple regression analysis using IBM SPSS Statistics (Version 30) established statistical relationships between governing parameters and Ψ .
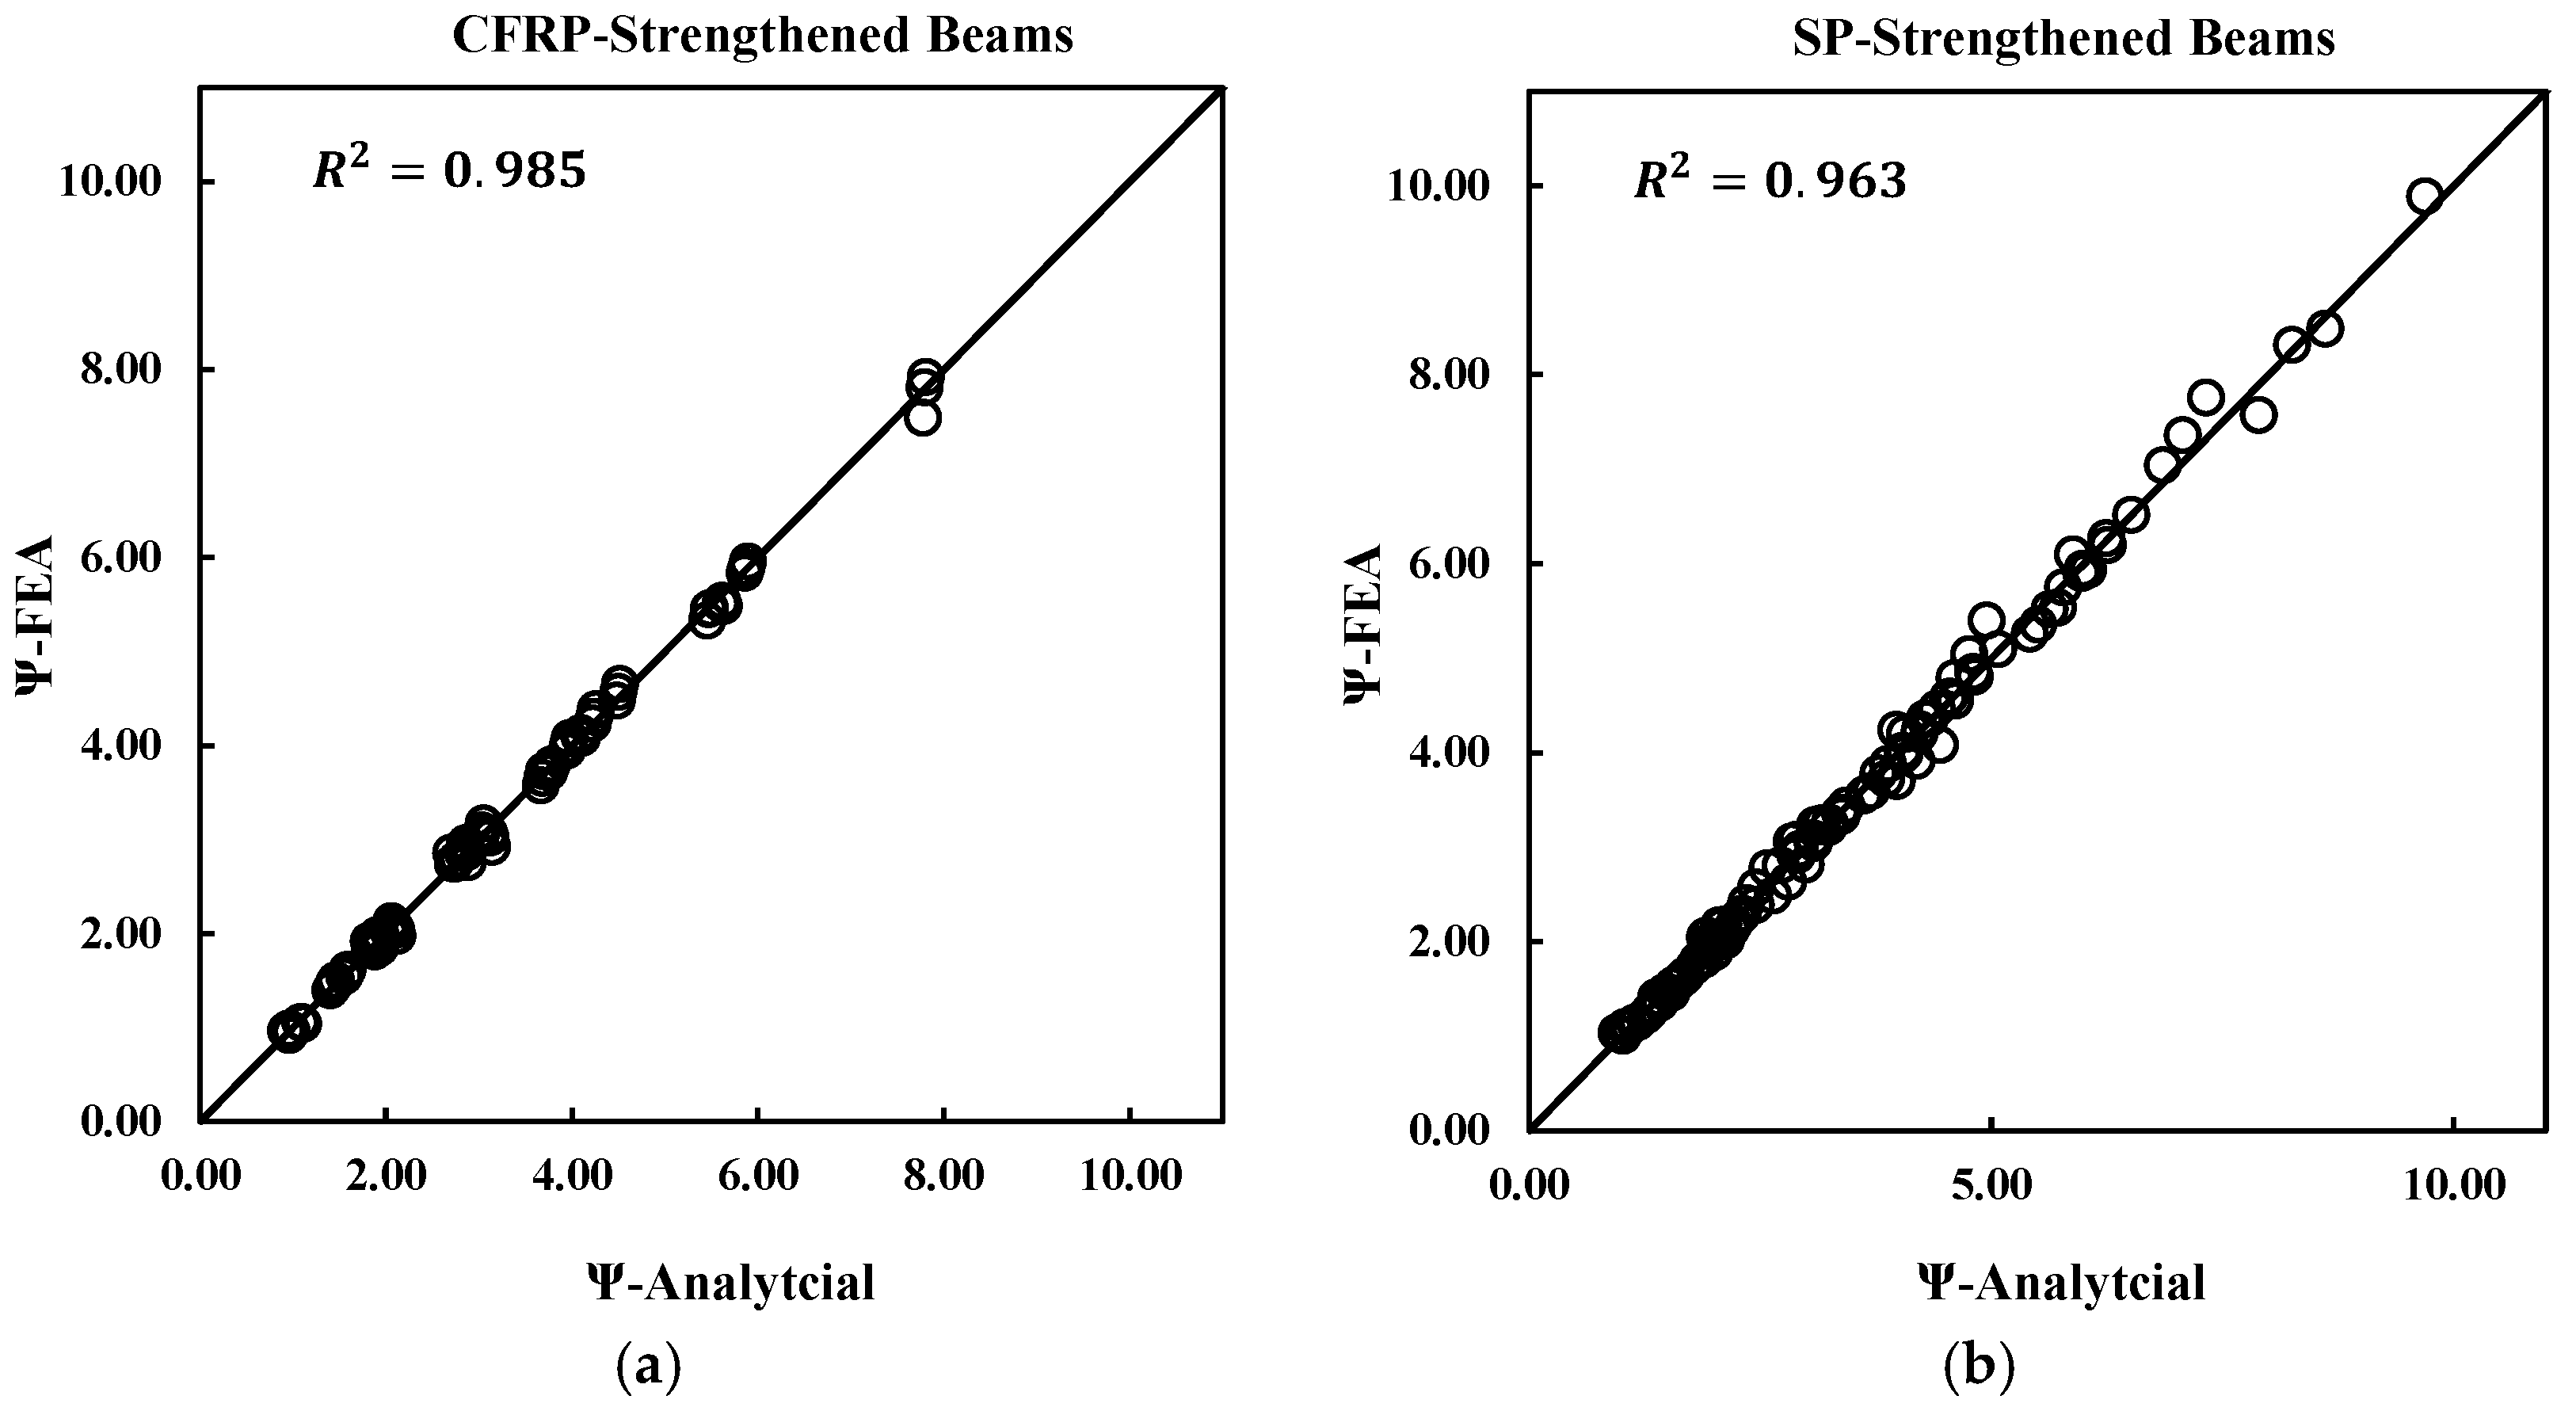
The regression outcomes, presented in Figure 25a,b, yielded predictive Equations (21) and (22) for CFRP- and SP-strengthened beams, respectively. Using these equations to calculate Ψ provides values that agree closely with FEA results, as illustrated in Figure 25, where R 2 values of 0.985 and 0.963 demonstrate excellent correlation. This strong consistency confirms the reliability of the regression models, which effectively capture the influence of governing parameters
For CFRP-strengthened RC beams, the regression model is given by:
Ψ = 2.3156 ρ % + 1.4988 a v d 0.7956 λ + 1.1964 ρ % 2 1.1277 ρ % +   0.0133 a v d + 0.00079 A f + 0.208
For SP-strengthened RC beams, the regression model is given by:
Ψ = 2.1092 ρ % + 1.533 a v d + 0.003 A S P 1.4888 λ + 0.3118 ρ % +   0.0302 a v d 0.2433
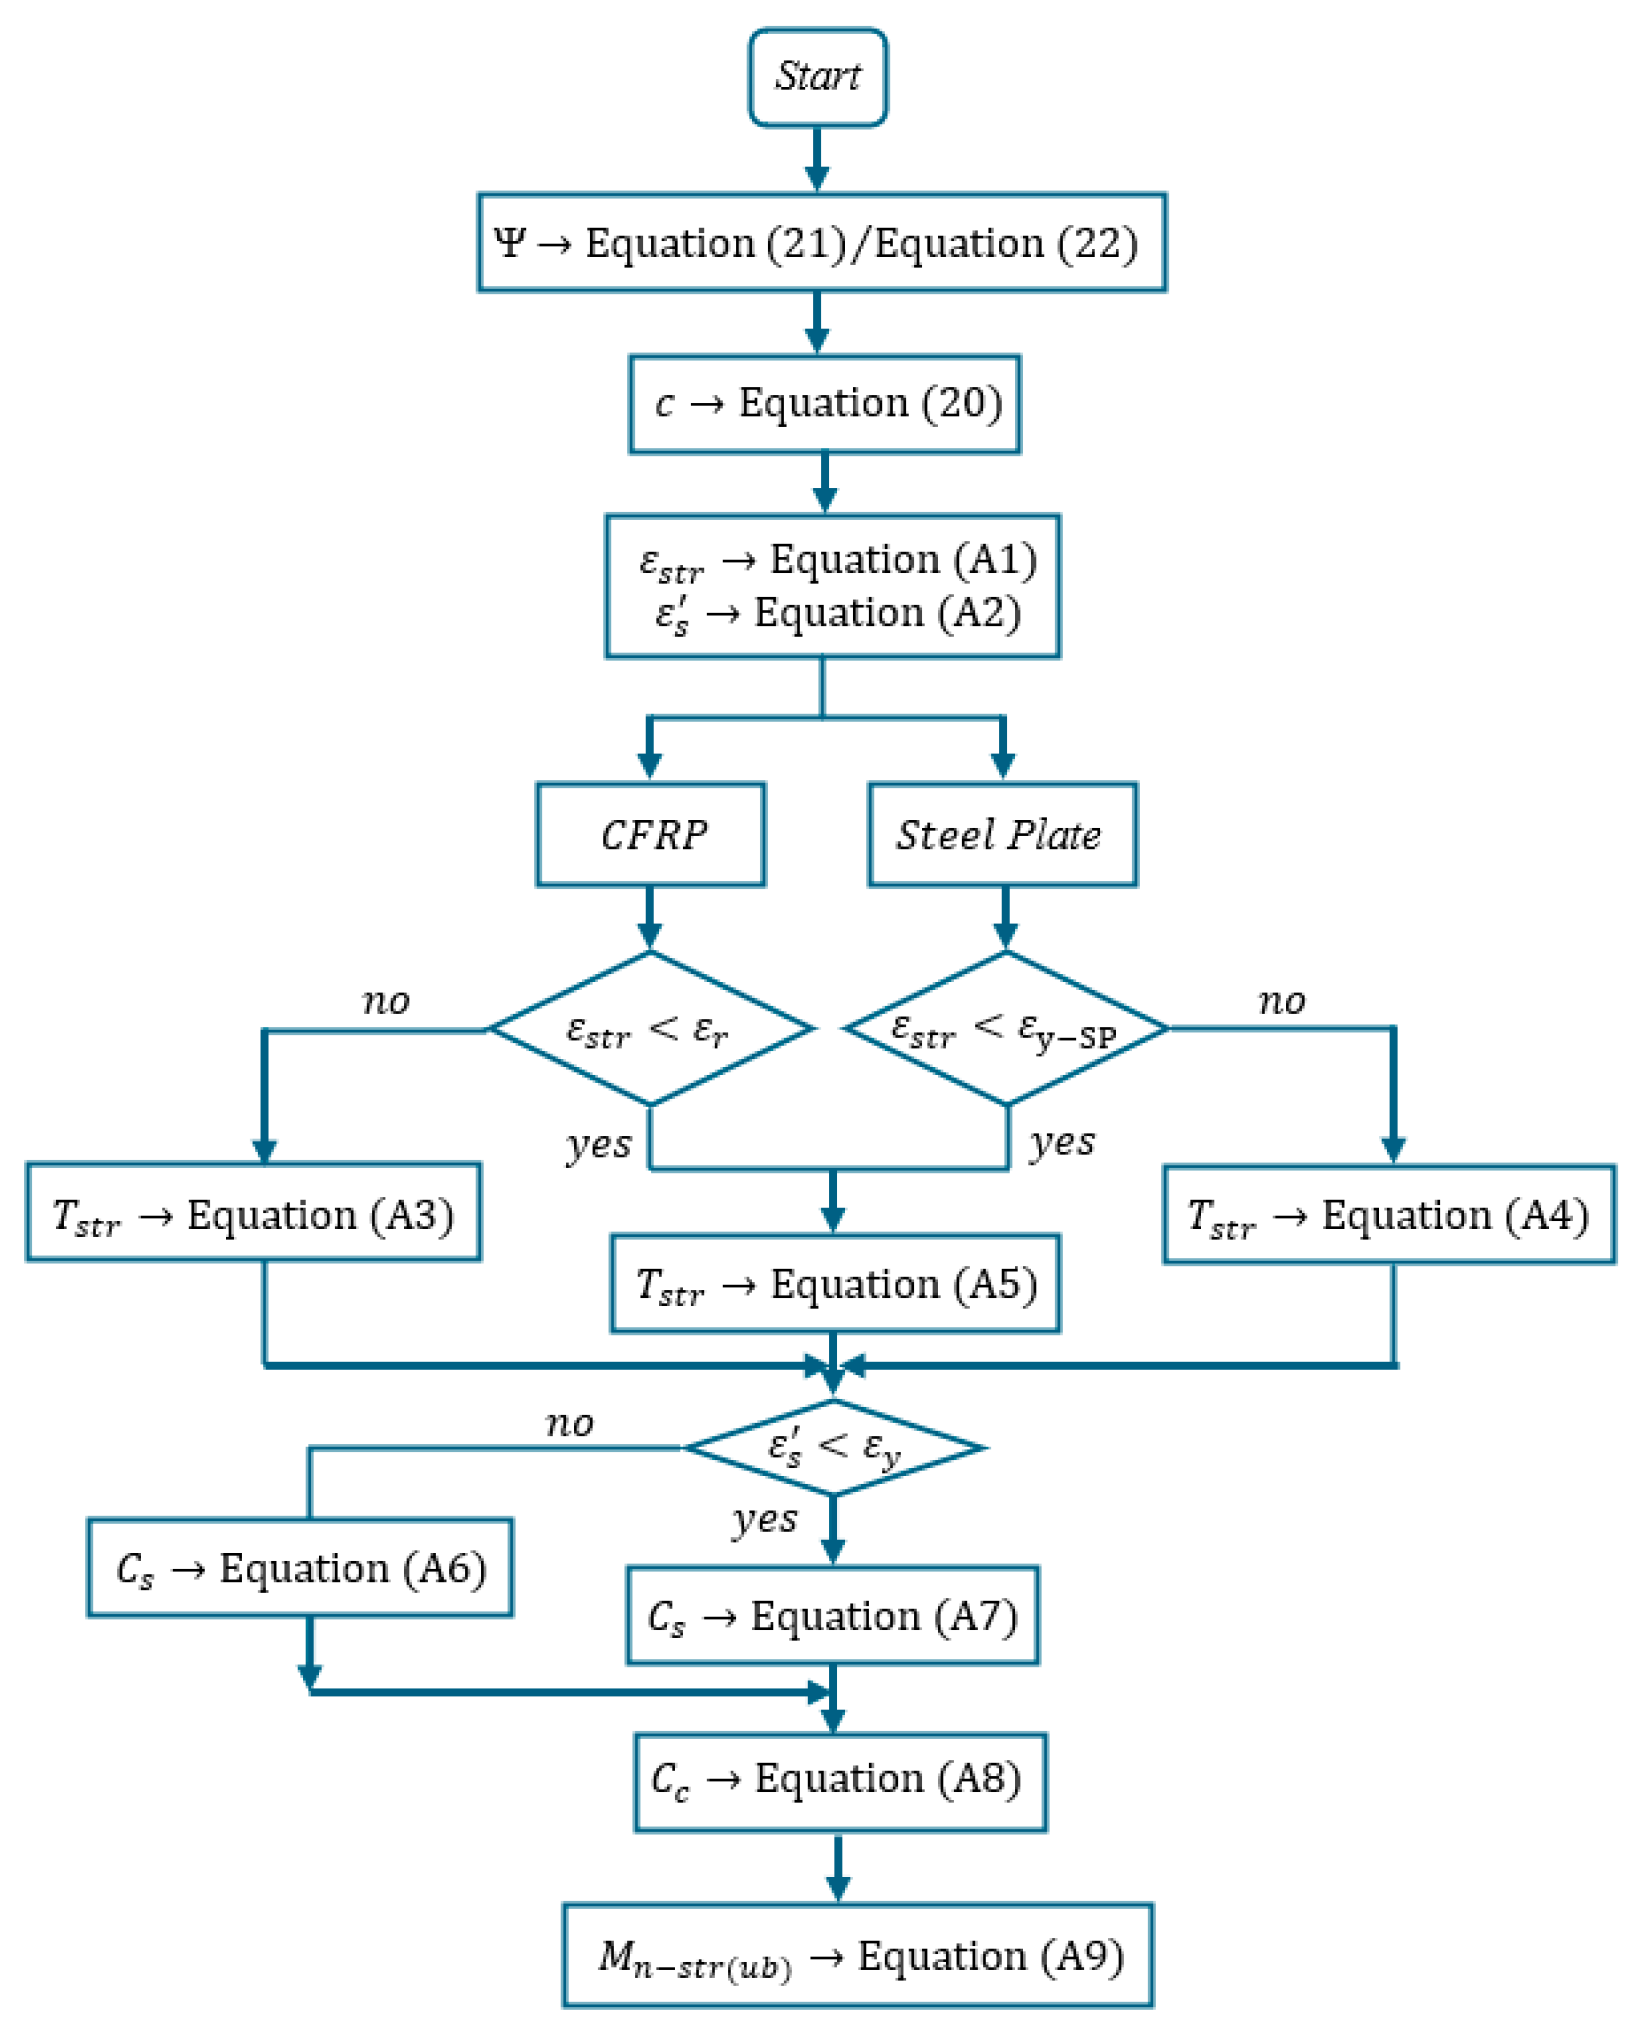
By employing the regression models expressed in Equations (21) and (22), the values of Ψ for CFRP- and SP-strengthened RC beams with partially unbonded reinforcement can be estimated. Once Ψ is determined, it is subsequently used in the analytical procedure (Figure 26) to evaluate the ultimate flexural capacity Mn-str(ub). The calculation formulas can be found in Appendix B. This approach links the regression-based prediction of Ψ with the step-by-step analytical calculation of beam strength, thereby enabling reliable assessment of the flexural behavior under unbonded reinforcement.
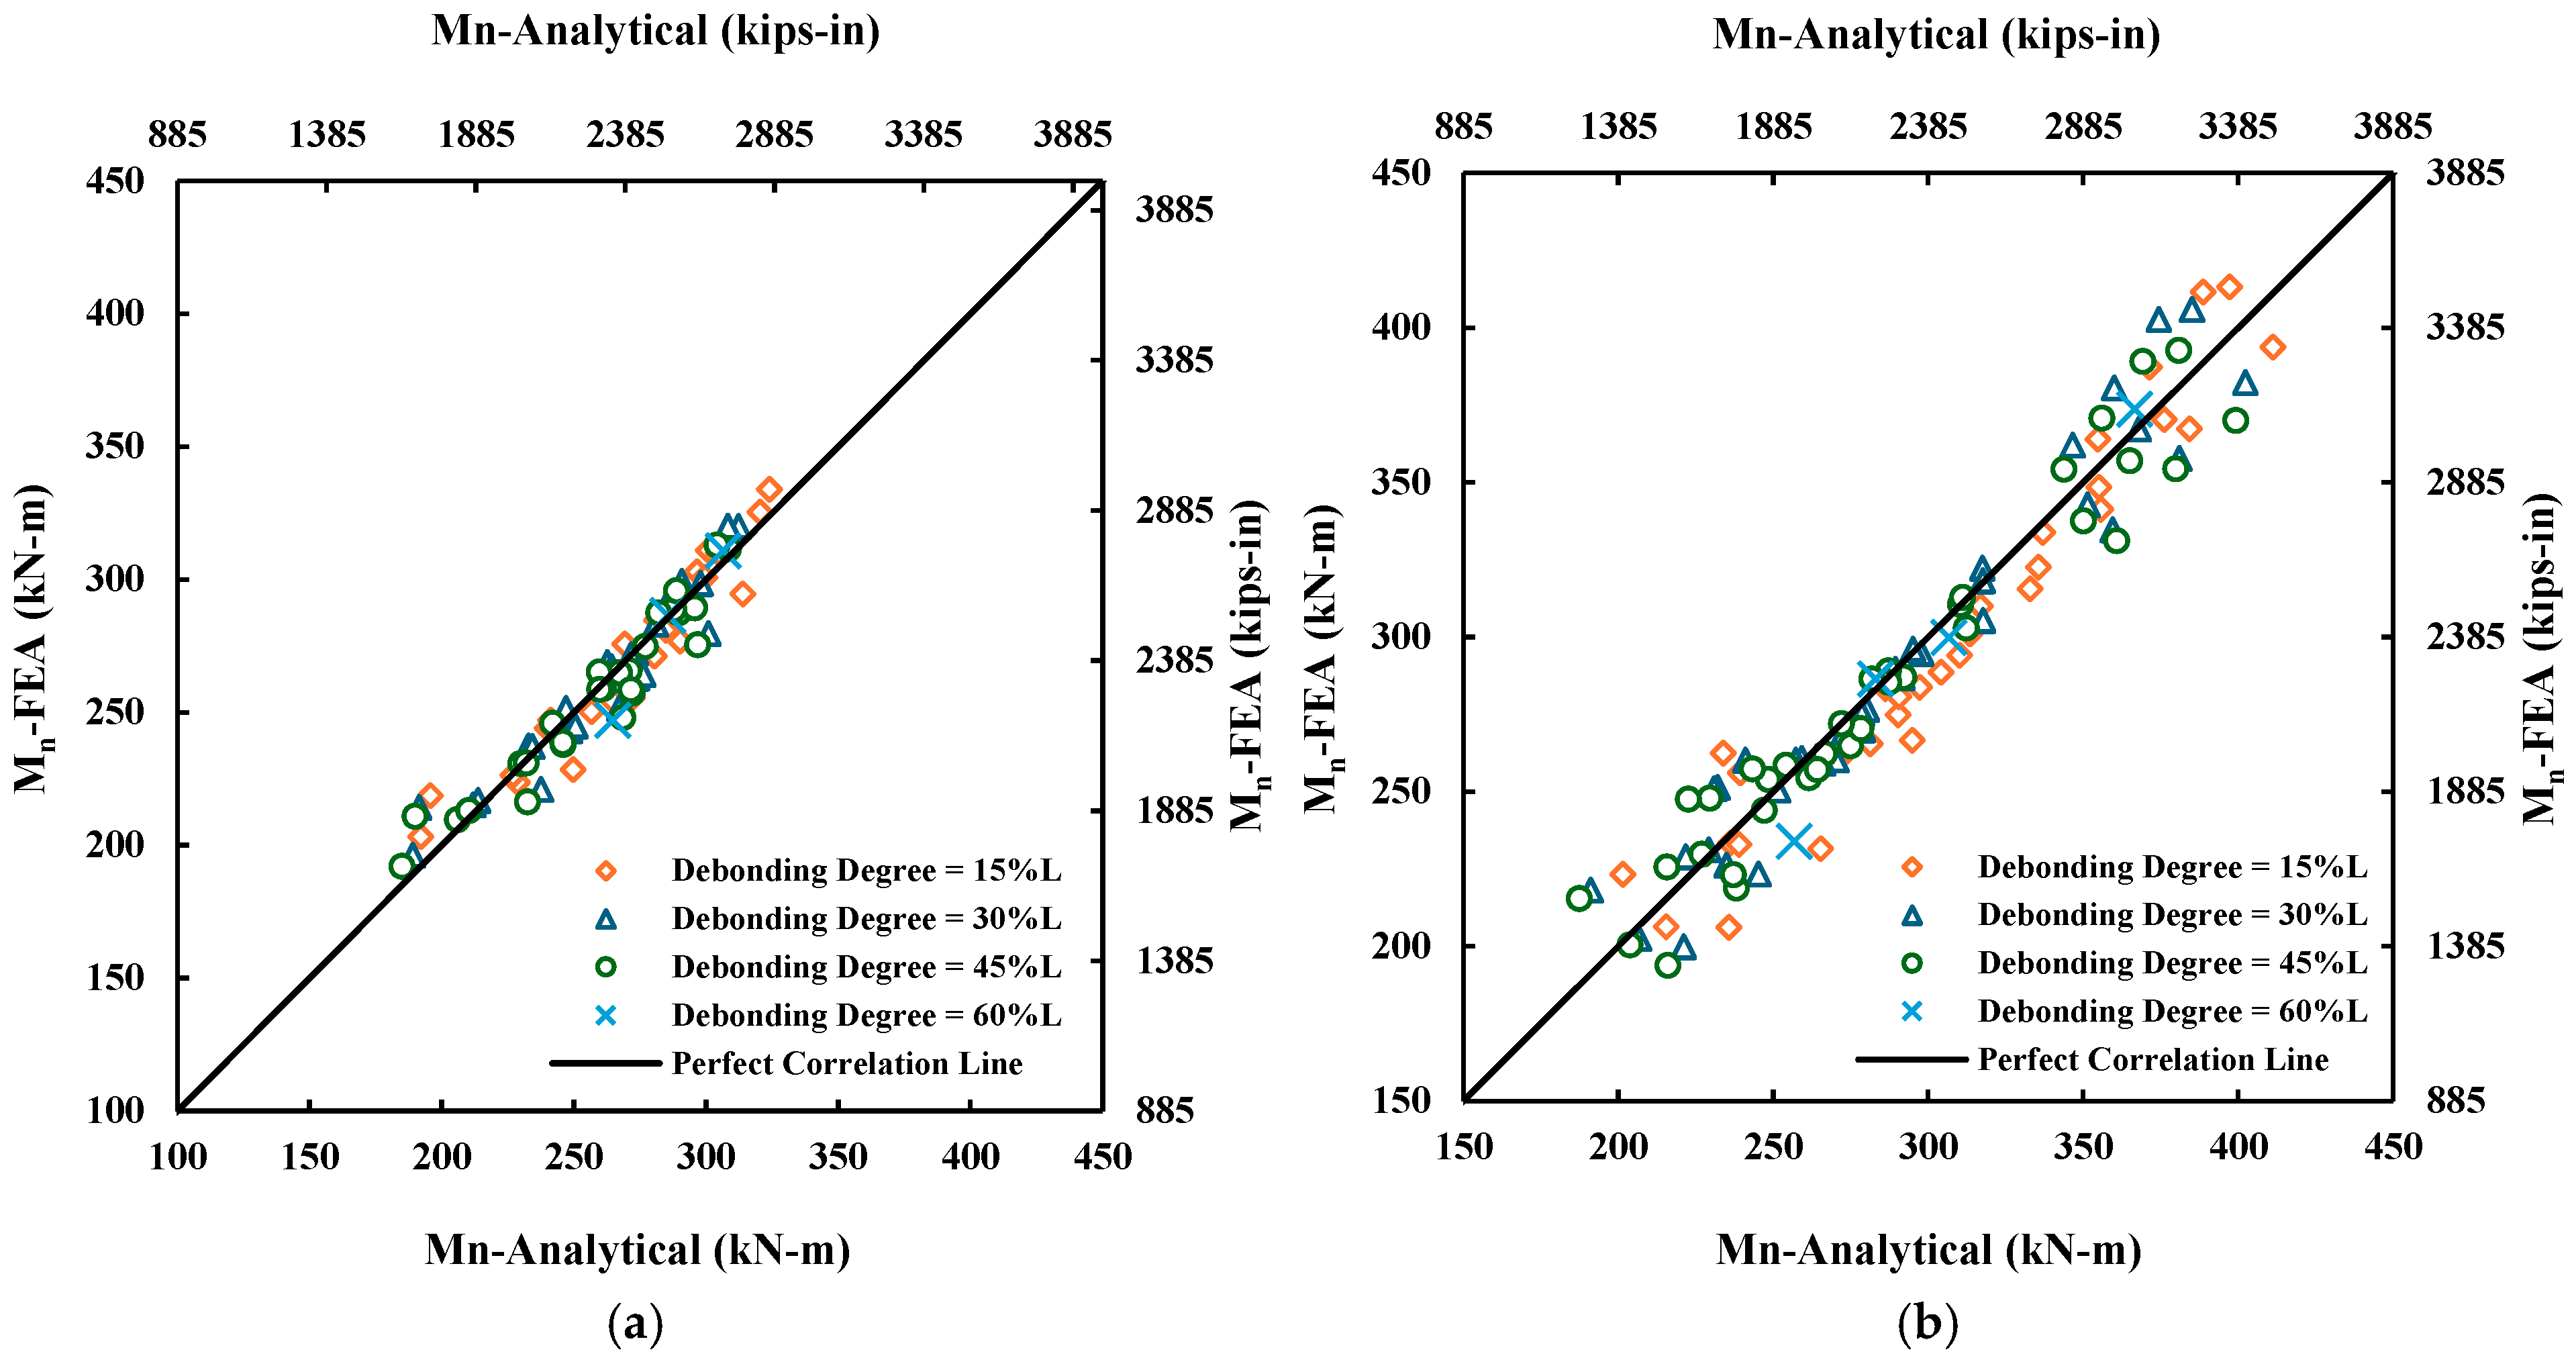
Figure 27 compares the ultimate moments predicted by the analytical model with FEA results for RC beams strengthened with CFRP and SP, respectively. For both methods, the data closely align with the ideal 1:1 correlation line across varying debonding levels (15–60%), confirming strong model accuracy. Minor deviations appear at higher debonding lengths, with slightly greater variability observed in SP-strengthened beams, indicating a marginally stronger sensitivity to debonding compared to CFRP.

6. Summary and Conclusions

This study evaluates how partial bond loss between steel reinforcement and concrete alters the flexural response of RC beams externally strengthened with CFRP or SP. A finite element model built in ABAQUS was calibrated against experimental test data by others and then used to simulate 296 beams covering wide ranges of shear span-to-depth ratio ( a v / d ), reinforcement ratio ( ρ ), debonding degree ( λ ), strengthening material type (CFRP/SP), and material thickness ( t ). Parametric study results quantified the influence of each variable on stiffness, ductility, ultimate load, and failure mode. Two closed-form analytical models—one for CFRP and one for SP strengthening—were derived with the dimensionless parameter Ψ (equivalent plastic-zone length/neutral-axis depth) and matched the FEA database closely. The combined numerical and analytical findings clarify the mechanics of strengthened RC beams with unbonded reinforcement and supply design-oriented tools for residual strength assessment.
Based on the results of this study, the following conclusions could be drawn, which mainly apply to the response up to the ultimate strength:
  • RC beams without strengthening
    • Beams with larger shear span-to-depth ratios exhibited greater sensitivity to reinforcement–concrete bond loss; for example, when the ratio increased from 4.0 to 8.0, the debonding-induced moment reduction nearly doubled under comparable conditions, indicating that slender, flexure-dominated beams were more vulnerable to bond deterioration. In addition, increasing the shear span-to-depth ratio reduced global stiffness (larger deflections) and decreased the ultimate load capacity, while the apparent ductility increased, consistent with a longer flexural response region.
    • Higher reinforcement ratios enhanced the overall flexural strength and stiffness but decreased ductility and offered only limited mitigation against debonding-induced moment loss. Within the studied range (0.31–0.69%), the increase in reinforcement ratio resulted in only minor changes in moment reduction, suggesting that debonding degree exerts a more dominant influence than reinforcement ratio.
    • From 0% to about 45% debonding, the reductions in flexural capacity, stiffness, and apparent ductility were mild (generally ≤10%); however, once the debonding degree exceeded this 45% threshold, these performance measures deteriorated significantly. In representative cases, further increasing the debonding length to 60% resulted in moment losses approaching 19%, highlighting that excessive bond deterioration could severely compromise structural performance.
  • CFRP/SP Strengthened RC beams
    • Larger shear span-to-depth ratios led to lower stiffness and peak load but higher ductility and greater sensitivity to debonding. For strengthened beams, moment reduction increased only slightly (≤2%) when a v / d grew from 4.0 to 8.0, compared to nearly double losses in unstrengthened beams. This indicates that external strengthening effectively suppresses the detrimental influence of shear span-to-depth variation.
    • Increasing the reinforcement ratio enhanced stiffness and peak load but slightly reduced apparent ductility within the response range up to the ultimate load. Although a higher reinforcement ratio tended to amplify debonding-induced capacity loss, the variation in moment reduction across the relatively low reinforcement range considered (0.31–0.69%) was less than 1%, indicating that for low reinforcement ratio beams (including ρ up to 0.69%), reinforcement–concrete debonding had only a minor effect on flexural capacity.
    • Flexural capacity deteriorated progressively with increasing debonding, and a ratio of about 45% marked a critical threshold: below this level, capacity loss was moderate (≤10%), while beyond it, reductions became pronounced (>15%). In representative cases, 60% debonding caused moment losses up to 19%, highlighting the severe impact of excessive bond deterioration. In addition to strength reduction, debonding also decreased overall stiffness and ductility, indicating a comprehensive degradation of structural performance.
    • CFRP provided higher strength and more sustained stiffness, while SP demonstrated superior ductility and slightly lower sensitivity to reinforcement–concrete debonding. From a practical standpoint, CFRP was preferable where strength and stiffness are prioritized, whereas SP was more suitable when ductility, energy absorption, and bond resilience are critical.
    • Increasing CFRP thickness from 1 mm to 3 mm and SP thickness up to 6 mm markedly enhanced ultimate capacity (by approximately 76% and 117%, respectively) and reduced debonding-related losses. However, excessive thickness decreased ductility and could induce a brittle mode of failure, highlighting the importance of optimal thickness selection.
  • Analytical models
    • The proposed Ψ-based analytical models accurately reproduced the flexural strengths obtained from FEA. The mean analytical-to-FEA ratios were close to 1.00 with standard deviations below 0.06 for both CFRP- and SP-strengthened beams.
    • Model accuracy was only marginally affected by partial bond deterioration. Even with debonding ratios up to 60%, predictions remained consistent with FEA results, confirming the robustness of the models under partially bonded reinforcement conditions.
    • These models provided simple yet reliable closed-form tools for evaluating residual flexural strength, offering practical value for the design and assessment of RC beams where internal bond deterioration coexists with external strengthening.

Author Contributions

Conceptualization, R.S.A.; methodology, R.L.; software, R.L.; validation, R.L.; formal analysis, R.L.; investigation, R.L.; resources, R.S.A.; data curation, R.L.; writing—original draft preparation, R.L.; writing—review and editing, R.S.A.; visualization, R.L.; supervision, R.S.A.; project administration, R.S.A.; funding acquisition, R.S.A. All authors have read and agreed to the published version of the manuscript.

Funding

This research received no external funding.

Data Availability Statement

The original contributions presented in this study are included in the article. Further inquiries can be directed to the corresponding author.

Conflicts of Interest

The authors declare no conflict of interest.

Appendix A

ε s t r = ε c u d s t r c c
ε s = ε c u d c L d b Ψ
T s t r = A s t r f r
T s t r = A s t r f y S P
T s t r = A s t r E s t r ε s t r
C s = A s f y  
C s = A s E s ε s
C c = 0.85 b β 1 c f c
M n s t r ( u b ) = 0.85 b β 1 c f c d β 1 c 2 + C s d d + T s t r   ( d s t r d )

Appendix B

a v = shear span, mm
A s = area of tensile steel reinforcement, m m 2
A s t r = area of external strengthening layer, m m 2
A s = area of compressive steel reinforcement, m m 2
b = width of beam cross-section, m m
c = depth of neutral axis, m m
C c = resultant compressive force in concrete, N
C s = compressive force in steel reinforcement, N
d = distance from extreme compression fiber to tensile reinforcement centroid, m m
d = distance from extreme compression fiber to compressive reinforcement centroid, mm
d s t r = distance from extreme compression fiber to external strengthening layer, m m
E 0 = initial modulus of elasticity of concrete, M P a
E c = modulus of elasticity of concrete, M P a
E s = modulus of elasticity of steel, M P a
f 0 = reference compressive strength, M P a
f c = concrete stress, M P a
f c = ultimate concrete compressive stress, M P a
f r = rupture strength of CFRP, M P a
f s = stress in tensile steel reinforcement, M P a
f t = ultimate concrete tensile stress, M P a
f y = yield strength of steel reinforcement, M P a
f y S P = yield strength of external steel plate, M P a
G = shear modulus, M P a
G n c = critical fracture energy required to induce failure in normal direction, N / m m
G s c = critical fracture energy required to induce failure in shear direction, N / m m
K i n i = initial stiffness, calculated as yield load P y divided by yield displacement Δ y , k N / m m
J S L S = energy absorption index, calculated as the area under the load–deflection curve up to the SLS deflection limit, k N · m m
J   = total energy absorption index, calculated as the area under the load–deflection curve up to ultimate displacement Δ u , k N · m m
L = total span of beam, m m
L u b = unbonded length of beams, m m
M n A n a l y t i c a l = ultimate moment capacity from analytical models, N · m m
M n F E A = ultimate moment capacity from FEA models, N · m m
M n s t r = flexural capacity of the strengthened beams, N · m m
M n s t r ( u b ) = flexural capacity of strengthened beams with unbonded reinforcement, N · m m
M u b = flexural capacity of beams with unbonded reinforcement, N · m m
P m a x = maximum applied load (ultimate capacity of the beam), k N
P S L S = load corresponding to the serviceability limit state (SLS), k N
t s = thickness of steel plate, m m
t f = thickness of carbon fiber reinforced polymer, m m
t s t r = thickness of strengthening material, m m
t t 0 = peak value of the shear stress, M P a
T s = tensile force in steel reinforcement, N
T s t r = tensile force in the external strengthening material, N
X C = compressive failure strength in fiber direction, M P a
X T = tensile failure strength in fiber direction, M P a
Y C = compressive failure strength in direction Y (transverse to fiber direction), M P a
Y T = tensile failure strength in direction Y (transverse to fiber direction), M P a
ε 0 = concrete strain corresponding to concrete compressive strength, u n i t l e s s
ε c = compressive strain of concrete, u n i t l e s s
ε c u = ultimate compressive strain of concrete, u n i t l e s s
ε c r = concrete cracking strain, u n i t l e s s
ε s = strain in tensile steel reinforcement, u n i t l e s s
ε s = strain in compressive steel reinforcement, u n i t l e s s
ε s t r = strain in external strengthening material, u n i t l e s s
ε y = yield strain of steel reinforcement, u n i t l e s s
ε y S P = yield strain of steel plate, u n i t l e s s
Ψ = ratio of equivalent plastic region length to depth of neutral axis, u n i t l e s s
β 1 = equivalent stress block coefficient for concrete (per code), u n i t l e s s
Δ u = maximum displacement at ultimate limit state (concrete crushing or CFRP/steel plate failure), m m
Δ y = displacement at steel yielding (yield displacement), m m
μ Δ = displacement ductility ratio, a measure of structural ductility, u n i t l e s s

References

  1. Minkarah, I.; Ringo, B.C. Behavior and repair of deteriorated reinforced concrete beams. Transp. Res. Rec. 1981, 821, 73–79. [Google Scholar]
  2. Cairns, J.; Zhao, Z. Behavior of concrete beams with exposed reinforcement. Proc. Inst. Civ. Eng. Struct. Build. 1993, 99, 141–154. [Google Scholar] [CrossRef]
  3. Raoof, M.; Lin, Z. Structural characteristics of RC beams with exposed main steel. Proc. Inst. Civ. Eng. Struct. Build. 1997, 122, 35–51. [Google Scholar] [CrossRef]
  4. Jeppsson, J.; Thelandersson, S. Behavior of reinforced concrete beams with loss of bond at longitudinal reinforcement. J. Struct. Eng. 2003, 129, 1376–1383. [Google Scholar] [CrossRef]
  5. Jnaid, F.; Aboutaha, R.S. Residual flexural strength of reinforced concrete beams with unbonded reinforcement. ACI Struct. J. 2014, 111, 1419–1430. [Google Scholar] [CrossRef]
  6. Mousa, M.I. Effect of bond loss of tension reinforcement on the flexural behavior of reinforced concrete beams. HBRC J. 2016, 12, 235–241. [Google Scholar] [CrossRef]
  7. Yang, J.; Wang, L.; Yang, D.; Wang, Q. Influence of concrete and unbonded ratio on RC beams. Constr. Build. Mater. 2023, 403, 133086. [Google Scholar] [CrossRef]
  8. Shahawy, M.A.; Arockiasamy, M.; Beitelman, T.; Sowrirajan, R. Reinforced concrete rectangular beams strengthened with CFRP laminates. Compos. B Eng. 1996, 27, 225–233. [Google Scholar] [CrossRef]
  9. Fanning, P.J.; Kelly, O. Ultimate response of RC beams strengthened with CFRP plates. J. Compos. Constr. 2001, 5, 122–127. [Google Scholar] [CrossRef]
  10. Esfahani, M.R.; Kianoush, M.R.; Tajari, A.R. Flexural behavior of reinforced concrete beams strengthened by CFRP sheets. Eng. Struct. 2007, 29, 2428–2444. [Google Scholar] [CrossRef]
  11. Dong, J.; Wang, Q.; Guan, Z. Structural behavior of RC beams with external flexural and flexural–shear strengthening by FRP sheets. Compos. B Eng. 2013, 44, 604–612. [Google Scholar] [CrossRef]
  12. Abdulhady, M.Y.; Ojaimi, M.F.; Chkheiwer, A.H. The efficiency of CFRP strengthening and repair system on the flexural behavior of RC beams constructed with different concrete compressive strength. Results Eng. 2022, 16, 100763. [Google Scholar] [CrossRef]
  13. Tankut, T.; Arslan, M. Behavior of reinforced concrete beams strengthened by epoxy bonded steel plates. Tek. Derg. 1992, 3, 176–185. [Google Scholar]
  14. Oh, B.H.; Kim, E.S.; Yang, Y.S. Static and fatigue behavior of reinforced concrete beams strengthened with steel plates for flexure. KSCE J. Civ. Eng. 2003, 7, 657–666. [Google Scholar] [CrossRef]
  15. Saleh, M.A.A.; Galbat, M.A.K.; Nasr, M.A.K. Strengthened reinforced concrete beams in flexural using steel plate. Int. J. Eng. Adv. Technol. 2021, 10, 62–70. [Google Scholar]
  16. Sallam, H.E.M.; Khalil, H.S.; Saba, A.M.; Shehab El-Din, H. Flexural behavior of externally strengthened RC beams by bonded steel plate or by suspended steel bars. In Proceedings of the Eighth International Conference, Cairo, Egypt, 24–27 December 2004. [Google Scholar]
  17. Ozbek, E.; Bocek, M.; Aykac, S. Strengthening of RC beams with solid steel plates. Athens J. Technol. Eng. 2016, 3, 291–298. [Google Scholar] [CrossRef]
  18. Lei, D.; Chen, G.Y.; Chen, Y.Q.; Ren, Q.W. Experimental research and numerical simulation of RC beams strengthened with bonded steel plates. Sci. China Technol. Sci. 2012, 55, 3270–3277. [Google Scholar] [CrossRef]
  19. Kotynia, R.; Debaiky, A.S.; El-Salakawy, E.; Benmokrane, B. Flexural strengthening of RC beams with externally bonded CFRP systems: Test results and 3D nonlinear FE analysis. J. Compos. Constr. 2008, 12, 469–478. [Google Scholar] [CrossRef]
  20. Ibrahim, A.M.; Salman, W.D. Finite element analysis of reinforced concrete beams strengthened with CFRP in flexural. Diyala J. Eng. Sci. 2009, 2, 88–104. [Google Scholar] [CrossRef]
  21. Jankowiak, I. Analysis of RC beams strengthened by CFRP strips—Experimental and FEA study. Arch. Civ. Mech. Eng. 2012, 12, 376–388. [Google Scholar] [CrossRef]
  22. Hawileh, R.A.; Abdalla, J.A.; Fardmanesh, A.A.; Darwish, M.K.; Tamimi, A.K. Finite element simulation of reinforced concrete beams externally strengthened with short-length CFRP plates. Compos. B Eng. 2013, 45, 1365–1377. [Google Scholar] [CrossRef]
  23. Zhang, Y.; Li, J.; Wang, X. Simulation study on CFRP-strengthened reinforced concrete beam under four-point bending. Eng. Struct. 2016, 127, 355–368. [Google Scholar] [CrossRef]
  24. Barour, S.; Taleb, A.; Boulekbache, B. Finite element modelling of RC beams strengthened with CFRP sheets. World J. Eng. 2020, 17, 675–682. [Google Scholar]
  25. Hong, X. Finite element analysis on reinforced concrete beams strengthened with CFRP. J. Struct. Eng. 2022, 148, 04022012. [Google Scholar] [CrossRef]
  26. Hamoush, S.A.; Ahmad, S.H. Debonding of steel plate-strengthened concrete beams. J. Struct. Eng. 1990, 116, 3569–3583. [Google Scholar] [CrossRef]
  27. American Concrete Institute (ACI). Building Code Requirements for Structural Concrete (ACI 318-22) and Commentary; ACI Committee 318, American Concrete Institute: Farmington Hills, MI, USA, 2022. [Google Scholar]
  28. Yang, K.H.; Mun, J.H.; Cho, M.S.; Kang, T.H.K. Stress-strain model for various unconfined concretes in compression. ACI Struct. J. 2014, 111, 819–826. [Google Scholar] [CrossRef]
  29. Nayal, R.; Rasheed, H.A. Tension stiffening model for concrete beams reinforced with steel and FRP bars. J. Mater. Civ. Eng. 2006, 18, 831–841. [Google Scholar] [CrossRef]
  30. American Association of State Highway and Transportation Officials (AASHTO). AASHTO LRFD Bridge Design Specifications, 10th ed.; AASHTO: Washington, DC, USA, 2024. [Google Scholar]
  31. Fédération Internationale du Béton (fib). Fib Model Code for Concrete Structures 2020, Version 1.2; fib: Lausanne, Switzerland, 2024. [Google Scholar]
  32. Dassault Systèmes Simulia Corp. Abaqus 2025 User’s Manual; Dassault Systèmes Simulia Corp.: Providence, RI, USA, 2024. [Google Scholar]
  33. Suleymanova, L.; Rimshin, V.; Ibrahim, A.; Hameed, A.A.; Obernikhin, D. The role of shear span to effective depth ratio (a/d) on the deflection in deep and normal reinforced concrete beams when this ratio is (1, 2, 3, and 4). IOP Conf. Ser. Mater. Sci. Eng. 2020, 890, 012044. [Google Scholar] [CrossRef]
  34. Kazemi, F.; Asgarkhani, N.; Shafighfard, T.; Jankowski, R.; Yoo, D.-Y. Machine-learning methods for estimating performance of structural concrete members reinforced with fiber-reinforced polymers. Arch. Comput. Methods Eng. 2025, 32, 571–603. [Google Scholar] [CrossRef]
  35. Au, F.T.K.; Du, J.S. Prediction of ultimate stress in unbonded prestressed tendons. Mag. Concr. Res. 2004, 56, 1–11. [Google Scholar] [CrossRef]
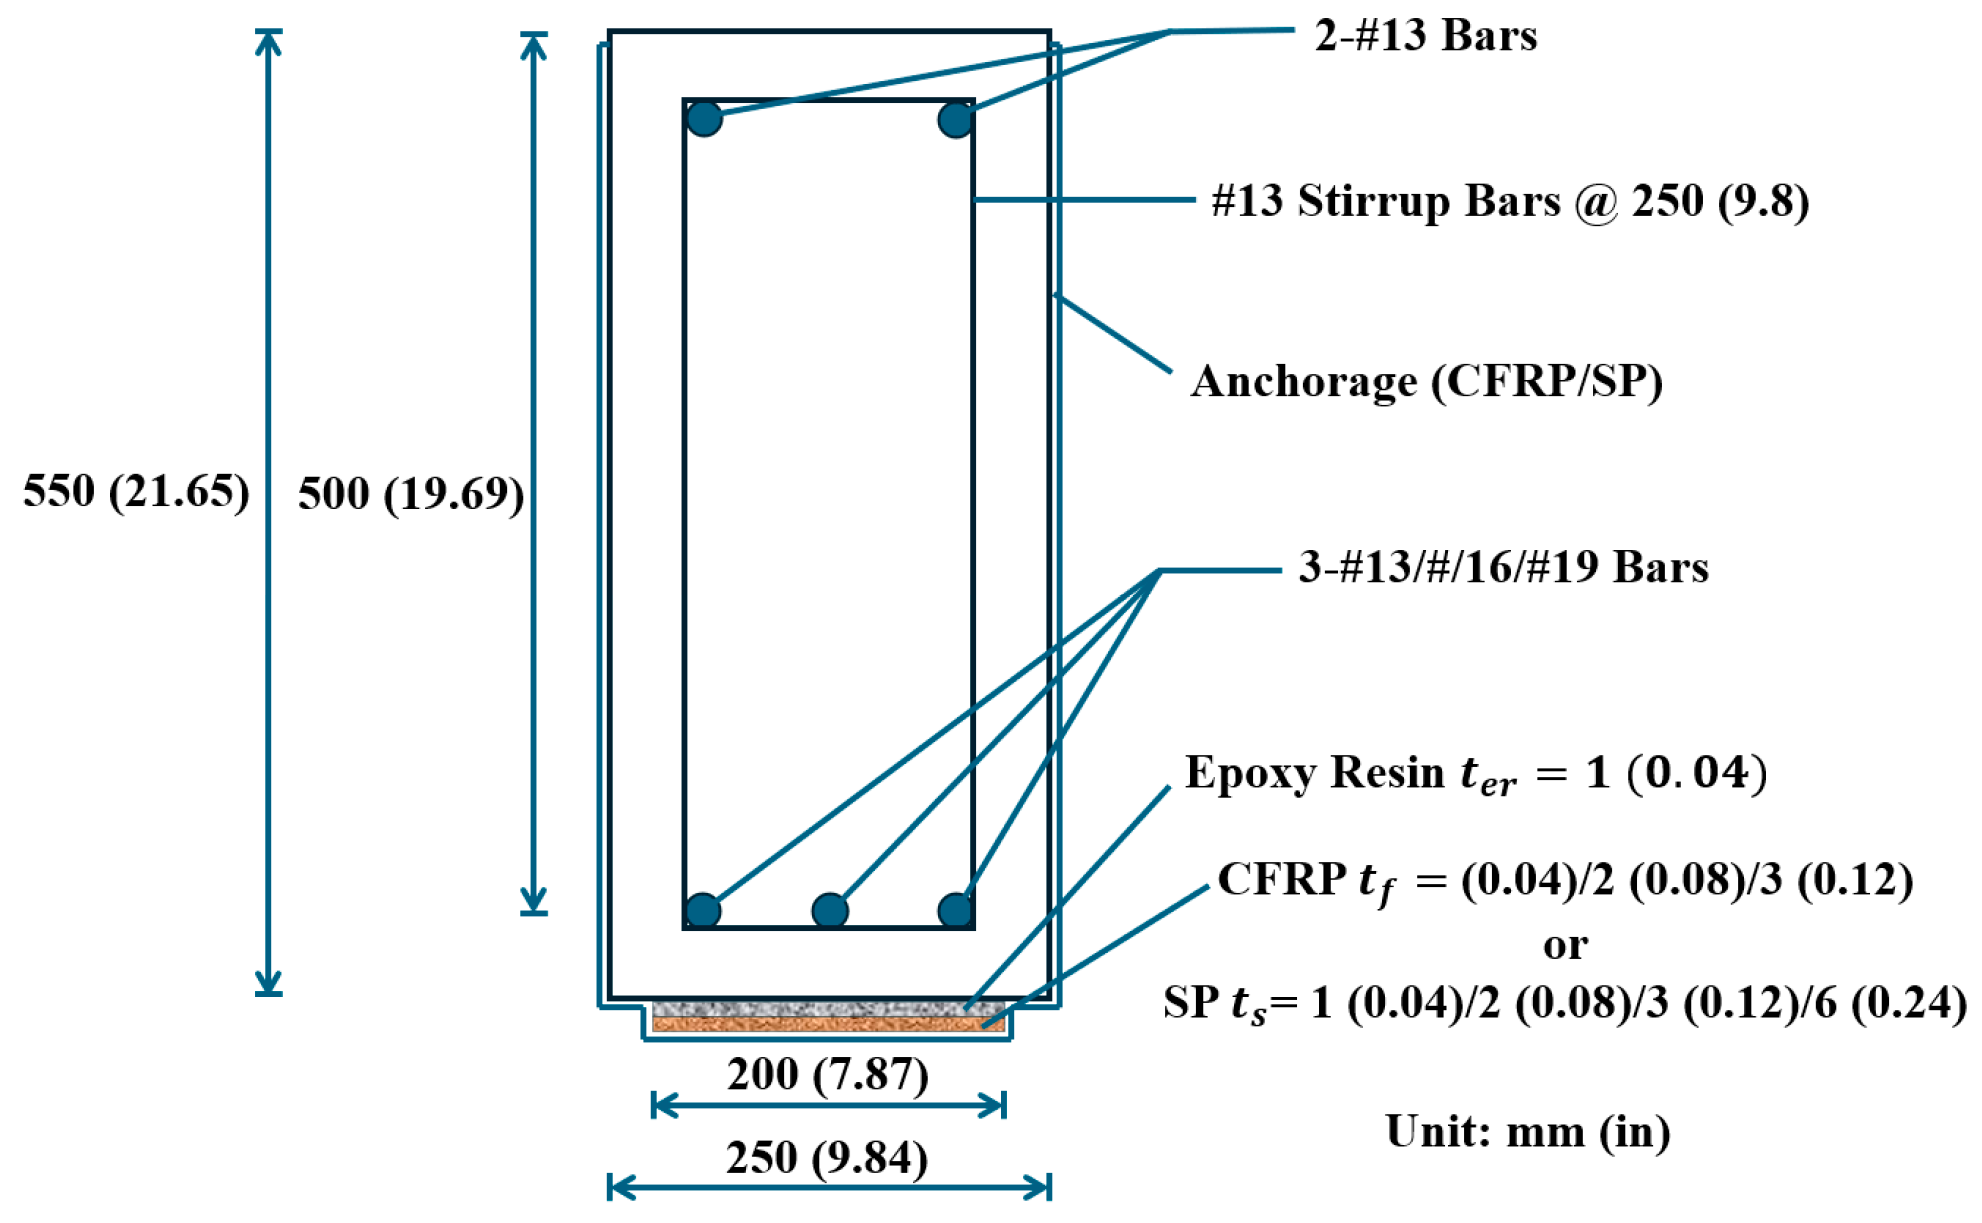
Figure 1. Cross-sectional details of the specimens.
Buildings 15 03665 g001
Figure 2. Parametric framework of modeling cases.
Buildings 15 03665 g002
Figure 3. CFRP sheets/SP layouts.
Buildings 15 03665 g003
Figure 4. Compressive behavior of concrete [28].
Buildings 15 03665 g004
Figure 5. Tensile behavior of concrete [29].
Buildings 15 03665 g005
Figure 6. Ideal stress–strain relationship of steel [31].
Buildings 15 03665 g006
Figure 7. Representative Traction-Separation Behavior [32].
Buildings 15 03665 g007
Figure 8. Boundary Conditions and Loading.
Buildings 15 03665 g008
Figure 9. Verification results of FEA model: (a) Conventional RC beam [33]; (b) RC beam with unbonded reinforcement [6]; (c) RC beam strengthened with CFRP [12]; (d) RC beam strengthened with SP [15].
Buildings 15 03665 g009aBuildings 15 03665 g009b
Figure 10. Sensitivity results: (a) Mesh size; (b) Element type.
Buildings 15 03665 g010
Figure 11. (a) Load-deflection curves obtained from the specimens with different shear span-to-depth ratios; (b) Effect of shear span-to-depth ratio on the Mub/Mn of RC beams with partial debonding.
Buildings 15 03665 g011
Figure 12. (a) Load-deflection curves obtained from the specimens with different reinforcement ratios; (b) Effect of reinforcement ratio on the Mub/Mn of RC beams with partial debonding.
Buildings 15 03665 g012
Figure 13. (a) Load-deflection curves obtained from the specimens with different debonding degrees; (b) Effect of debonding degrees on the Mub/Mn of RC beams.
Buildings 15 03665 g013
Figure 14. Load-deflection curves with different shear span-to-depth ratios of: (a) CFRP-strengthened specimens; (b) SP-strengthened specimens.
Buildings 15 03665 g014
Figure 15. Effect of shear span-to-depth ratio on the Mn-str(ub)/Mn-str of RC beams strengthened with: (a) CFRP under debonding reinforcement; (b) SP under debonding reinforcement.
Buildings 15 03665 g015
Figure 16. Load-deflection curves with different reinforcement ratios of: (a) CFRP-strengthened specimens; (b) SP-strengthened specimens.
Buildings 15 03665 g016
Figure 17. Effect of shear reinforcement ratio on the Mn-str(ub)/Mn-str of RC beams strengthened with: (a) CFRP under debonding reinforcement; (b) SP under debonding reinforcement.
Buildings 15 03665 g017
Figure 18. Load-deflection curves with different debonding degrees obtained from: (a) CFRP-strengthened specimens; (b) SP-strengthened specimens.
Buildings 15 03665 g018
Figure 19. Effect of debonding degree on the Mn-str(ub)/Mn-str of RC beams strengthened with: (a) CFRP; (b) SP.
Buildings 15 03665 g019
Figure 20. (a) Comparison of strengthened specimens with different strengthening materials; (b) Comparison effect of partial debonding on the Mn-str(ub)/Mn-str of RC beams strengthened with CFRP and SP.
Buildings 15 03665 g020
Figure 21. Load-deflection curves with different thicknesses of strengthening materials of: (a) CFRP-strengthened specimens; (b) SP-strengthened specimens.
Buildings 15 03665 g021
Figure 22. Effect of strengthening materials thickness on the Mn-str(ub)/Mn-str of RC beams strengthened with: (a) CFRP under debonding reinforcement; (b) SP under debonding reinforcement.
Buildings 15 03665 g022
Figure 23. Strain distribution at the critical section and details of sectional reinforcement.
Buildings 15 03665 g023
Figure 24. Flowchart describing the method used to obtain Ψ .
Buildings 15 03665 g024
Figure 25. Comparison of moment reduction factors Ψ for: (a) CFRP-strengthened beams; (b) SP-strengthened beams.
Buildings 15 03665 g025
Figure 26. Procedure for calculating the ultimate moment of strengthened RC beams with unbonded reinforcement using analytical models.
Buildings 15 03665 g026
Figure 27. Comparison of moment reduction factors Ψ for: (a) CFRP-strengthened beams; (b) SP-strengthened beams.
Buildings 15 03665 g027
Table 1. Elastic properties of undamaged CFRP sheet.
E 1 E 2 ( E 3 ) G 12 ( G 13 ) G 23 υ 12 ( υ 13 ) υ 23
165 Gpa
(23,900 ksi)
11 GPa
(1595 ksi)
5.3 GPa
(769 ksi)
3.9 GPa
(566 ksi)
0.260.5
Table 2. Elastic properties of damaged CFRP sheet.
X T X c Y T Y C S 12 S 23
2800 MPa
(406 ksi)
1654 MPa
(240 ksi)
110 MPa
(16 ksi)
240 MPa
(35 ksi)
115 MPa
(16.6 ksi)
40 MPa
(5.8 ksi)
Table 3. Properties of cohesive material.
Elastic PropertiesDamage InitiationDamage Evolution
E n
(GPa)
E s
(GPa)
E t
(GPa)
T c
(m)
ρ c
(kg/m3)
t n o
(MPa)
t s o
(MPa)
t t o
(MPa)
G n C
(J/m2)
G s C
(J/m2)
G t C
(J/m2)
4.511.711.710−3165024.81616355280280
Table 4. Experimental coverage of validation cases and extrapolation status in the parametric space.
VariablesExperimental Coverage
(From Validation)
Parametric Space
(From This Study)
Status
Shear span-to-depth ratio ( a v / d )4.0, 4.5, 2.6, 3.04.0, 6.0, 8.0Covered: 4.0
Extrapolated: 6.0, 8.0
Reinforcement Ratio ( ρ )1.80%, 2.02%, 0.55%, 0.85%0.31%, 0.48%, 0.69%Extrapolated
Debonding degree ( λ )85%0%, 15%, 30%, 45%, 60%Extrapolated
Strengthening materialCFRP, SPCFRP, SPCovered
Strengthening thickness ( t )CFRP: 0.167 mm (0.01 in)
SP: 2.76 mm (0.11 in)
CFRP: 1 mm (0.04 in), 2 mm (0.08 in), 3 mm (0.12 in)
SP: 1 mm (0.04 in), 2 mm (0.08 in), 3 mm (0.12 in), 6 mm (0.24 in)
Extrapolated
Reinforcement strength ( f y )492 MPa (71.3 ksi), 498 MPa (72.2 ksi), 551 MPa (79.9 ksi)414.69 MPa (60 ksi)Extrapolated
Concrete strength ( f c )25 MPa (3.63 ksi), 67.32 MPa (9.77 ksi), 33 MPa (4.79 ksi), 36.1 MPa (5.24 ksi)21 MPa (3 ksi)Extrapolated
Reinforcement layoutThree/Two-bar tension layout with two compression barsThree-bar tension layout with two compression barsPartially covered
Loading schemeFour-point bendingFour-point bendingCovered
AnchorageCFRP: No anchorage
SP: U-shaped end anchorage
CFRP: U-shaped end anchorage
SP: U-shaped end anchorage
Covered: SP
Extrapolated: CFRP
Adhesive typeCFRP: Sikadur®-330
(Sika AG, Zurich, Switzerland)
SP: Sikadur®-30
(Sika AG, Zurich, Switzerland)
CFRP: Sikadur®-30
(Sika AG, Zurich, Switzerland)
SP: Sikadur®-30
(Sika AG, Zurich, Switzerland)
Covered
Boundary conditionsOne end fixed, one end pinnedOne end fixed, one end pinnedCovered
Table 5. Quantitative error metrics for validation specimens (Exp. vs. FEA).
Specimen IDPeak Load
Exp. (kN)
Peak Load
FEA (kN)
Error
(%)
Initial Stiffness
Exp. (kN/mm)
Initial Stiffness
FEA. (kN/mm)
Error
(%)
RMSE
(kN)
Bias
(kN)
Suleymanova et al.
(TB 1) [33]
110120.719.749.3910.117.673.842.38
Mousa
(B5) [6]
53.552.65−1.594.184.7914.62.871.07
Saleh et al.
(B2) [12]
125134.17.2816.3518.9215.766.901.59
Alabdulhady et al.
(B2) [15]
166.7163.51−1.9121.1323.7612.437.173.63
Table 6. Sensitivity of the 45% unbonded length threshold to key parameters [34].
ParameterTrend of Threshold ShiftExplanation
Concrete strengthDecrease with higher strengthHigher-strength concrete reduces ductility and bond reserve, so severe bond loss becomes critical earlier.
Reinforcement ratio/bar spacingDecrease with higher ratio/closer spacingHigher steel ratios increase bond demand in critical zones, lowering the tolerance to unbonded length.
Strengthening thickness/anchorageIncrease with thicker FRP/SP or stronger anchorageEnhanced external reinforcement or end anchorage compensates for bond loss and delays severe capacity reduction.
Table 7. Strength, ductility, and energy absorption metrics of CFRP- and SP-strengthened beams.
a v / d Case P m a x (kN) K i n i = P y / Δ y P S L S @ L / 240 (kN) Δ y (mm) Δ u (mm) μ Δ = Δ u / Δ y J S L S (kN·mm) J (kN·mm)
4.0SP99.886.1777.1313.1543.363.30623.553381.28
CFRP101.654.9962.3812.5240.713.25582.753037.85
6.0SP68.792.0342.2924.6680.953.28641.254292.64
CFRP74.591.7135.6323.6675.223.18630.913997.67
8.0SP50.511.0630.9239.42110.942.81663.524256.13
CFRP57.120.9527.7138.92106.862.75659.464249.21
Disclaimer/Publisher’s Note: The statements, opinions and data contained in all publications are solely those of the individual author(s) and contributor(s) and not of MDPI and/or the editor(s). MDPI and/or the editor(s) disclaim responsibility for any injury to people or property resulting from any ideas, methods, instructions or products referred to in the content.