Article

Optimisation and Mechanical Behaviour Analysis of Splice Joints in Prefabricated H-Shaped Steel Beams

1
School of Civil Engineering, Shandong Jianzhu University, Jinan 250101, China
2
Qihang (Shandong) Investment and Construction Group Co., Ltd., Jinan 250013, China
3
Shandong High-Speed Energy Development Co., Ltd., Jinan 250013, China
*
Author to whom correspondence should be addressed.
Buildings 2025, 15(19), 3610; https://doi.org/10.3390/buildings15193610
Submission received: 11 September 2025 / Revised: 2 October 2025 / Accepted: 5 October 2025 / Published: 8 October 2025
(This article belongs to the Section Building Structures)

Abstract

This study investigated the mechanical behaviour of splice joints in prefabricated H-shaped steel beams assembled using high-strength bolts under four-point bending. Four distinct splice joint configurations were tested through mechanical experiments on prefabricated H-shaped steel beams to examine their failure modes, flexural strength, and stress distribution in the sections. Numerical simulations were performed using ANSYS finite element software to validate the experimental results. Findings reveal that specimens with double splice joints exhibit a significant reduction in both flexural bearing capacity and stiffness compared to those with single splice joints. Moreover, the distance between splice joints is a critical factor affecting the bearing capacity of the specimen. The splice joints in both the H-shaped steel and connecting plates are classified as semi-rigid connections. Additionally, the stress distribution at the splice joints deviates from the plane section assumption. A formula for calculating the deflection of spliced specimens in the elastic stage under pure bending was developed and validated with experimental data.

1. Introduction

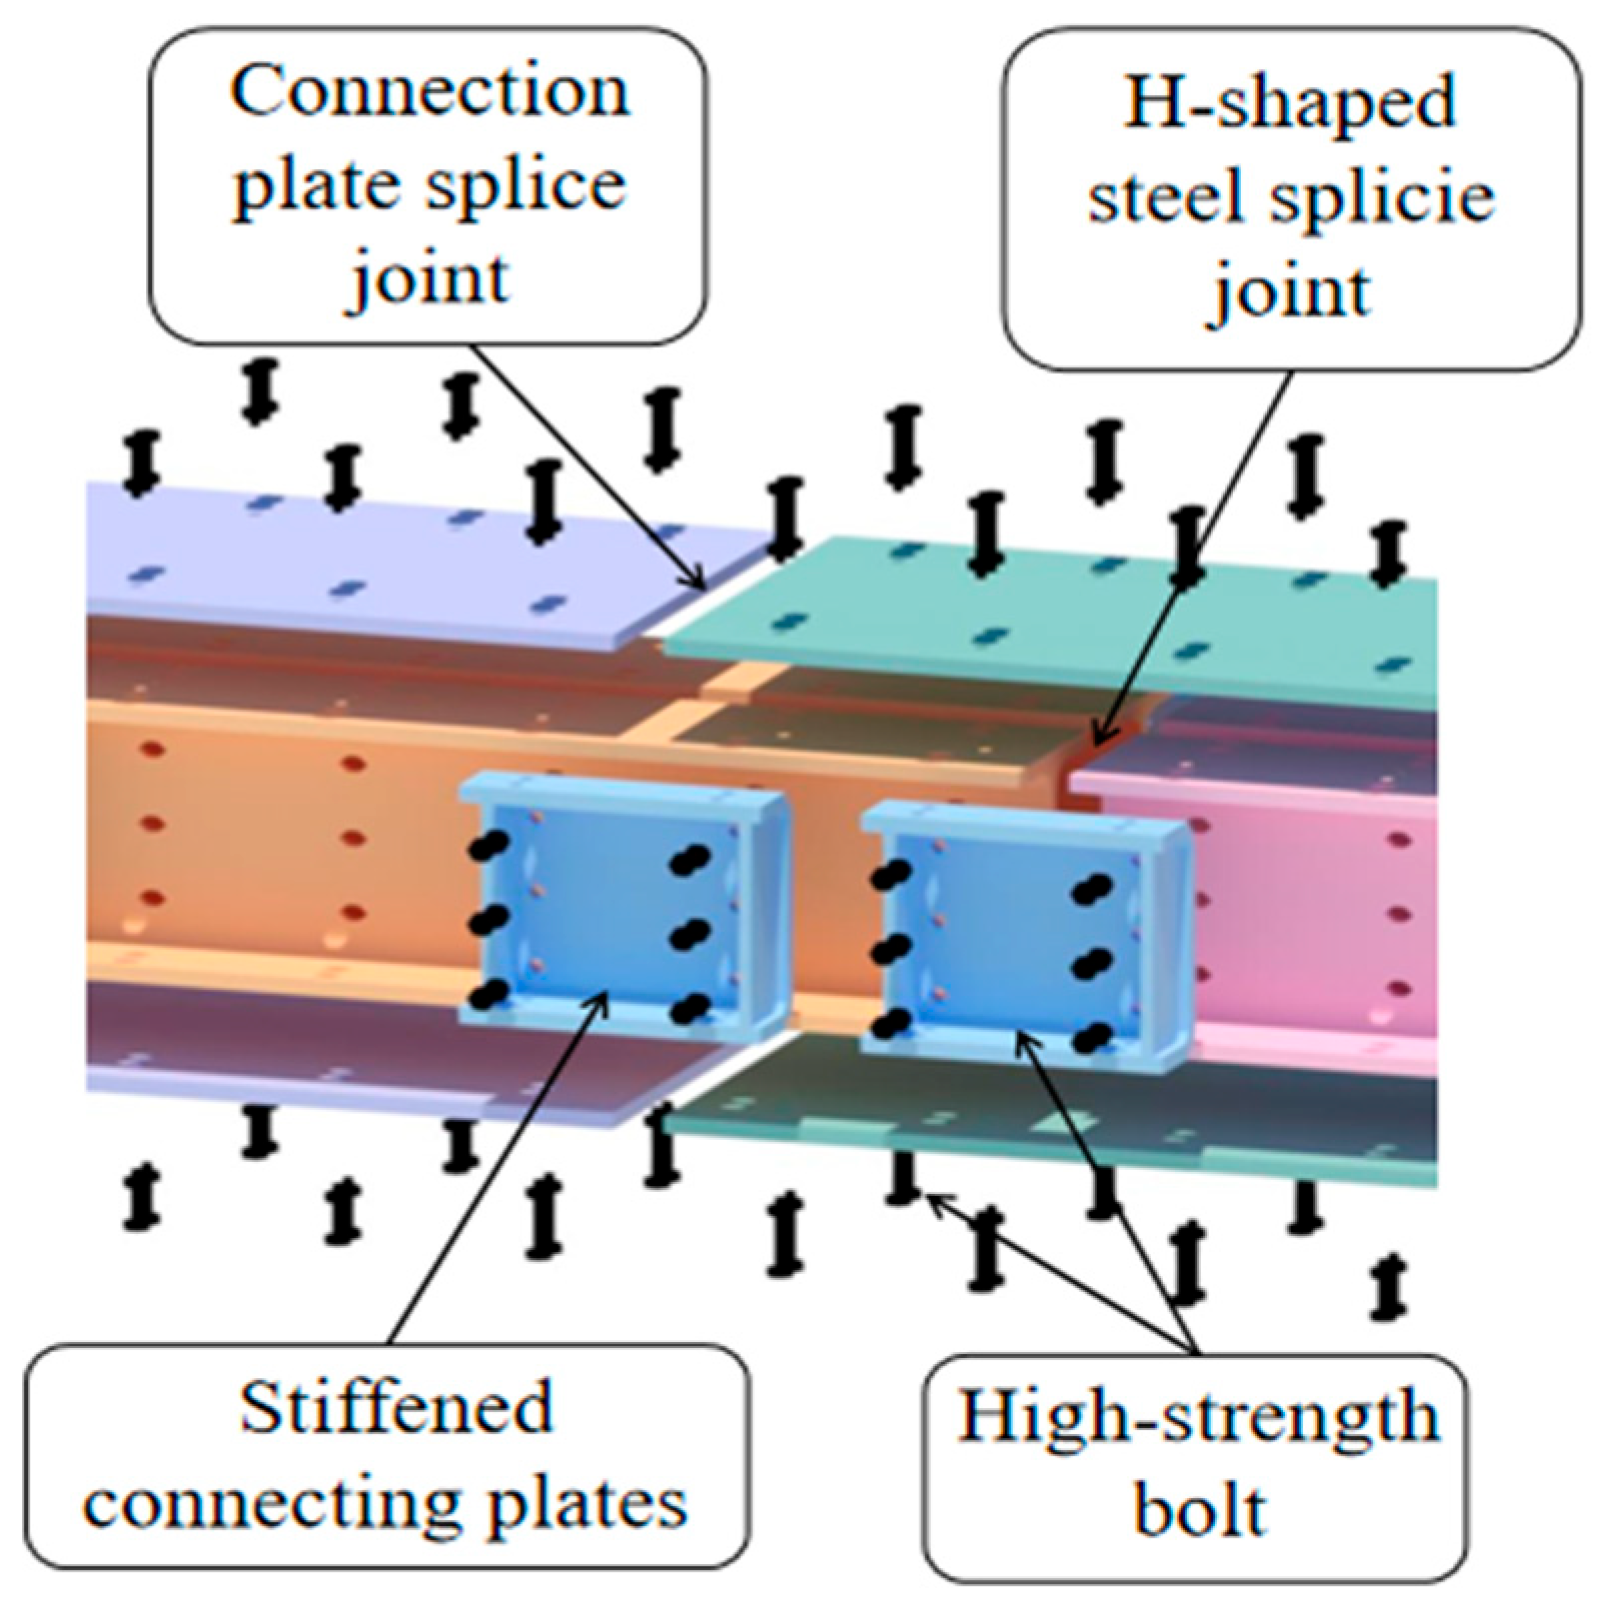
The emergence and widespread adoption of prefabricated steel structures align with the global trend toward sustainable development. These structures not only showcase advances in modern construction technology but also significantly contribute to the development and promotion of intelligent construction [1,2,3,4,5,6]. Figure 1 illustrates the components of the prefabricated H-shaped steel beam [7,8] and the positional variations in its splice joints. The primary structural unit consists of HM150 section steel and a 9 mm-thick Q235B steel plate serving as the connecting plate. This unit employs M8 high-strength bolts and stiffened connecting plates to create a composite H-shaped steel beam. Figure 2 provides a detailed view of the splice joint, where the main plate has a thickness of 9 mm and the stiffeners are 6 mm thick. Primarily used in foundation pit support projects, this prefabricated composite H-shaped steel beam can be assembled to meet specific on-site project requirements, thereby reducing the loss of structural integrity typically associated with welding traditional steel members. This modification streamlines joint stress conditions, thereby enhancing overall structural safety. Owing to differing composite locations, the beam features two distinct types of splice joints: those at the connecting plates and those within the H-shaped steel beam itself. These splice joint locations serve as potential structural weak points, influencing the overall stability of the structure. Current steel structure design standards, such as the Specification for the Design of Cold-formed Stainless Steel Structural Members [9], do not specifically provide formulas or design calculation procedures for assessing the flexural performance of these splice joints.
Existing research on the mechanical behaviour of splice joints in prefabricated steel beams primarily concentrates on connections between steel structural members, focusing on their flexural and seismic performance. In contrast, studies on the mechanical behaviour of connections that use stiffened connecting plates as reinforcement are relatively scarce. Wu et al. [10] and Chu et al. [11] have explored innovative steel connection joints. The load-transfer performance of new joints was experimentally assessed using finite element software to analyse factors such as initial stiffness, ultimate moment capacity, and stress distribution within the new joints. Their research provides a reference framework for the mechanical analysis of diverse steel connection joints. Furthermore, Xie [12], Zhang [13], and Ling [14] examined the fatigue life of steel brace members with bolted gusset plate connections, summarising the influencing factors. Their work enables the optimised design and application of steel brace members.
Several scholars [15,16,17,18,19] have conducted mechanical tests and numerical studies on the seismic performance of steel member connection joints. Their research encompasses comparisons of the seismic performance of the prefabricated steel structure as a whole and its connection nodes, thereby reinforcing the theoretical foundation for seismic design in steel structures.
Additionally, Feng [20,21] and Zhang et al. [22] investigated the structural performance of prefabricated H-shaped steel beams with web openings. Through mechanical testing, they provided essential references for designing prefabricated H-shaped steel beams with various web openings, thereby offering a practical basis for enhancing the flexural performance of steel beams. Luo [23], Yu [24], and Zhao [25] systematically analysed the overall stability and shear bearing capacity of H-shaped steel sections in corrosive environments. Their work provides theoretical supplements and computational support for H-shaped steel beams used in corrosion-prone settings, such as foundation pits.
Considering that the prefabricated H-shaped steel beam components examined in this study are primarily utilised in foundation pit support projects, their connecting plates and webs are fastened by bolts, resulting in complex contact behaviour and intricate load-transfer pathways at the joints. Therefore, investigating the flexural performance of splice joints in such prefabricated steel members is essential. This study conducted mechanical tests on scaled-down specimens of the primary prefabricated H-shaped steel unit under pure bending, exploring various splice joint configuration schemes. The experimental results were validated through numerical simulations. The maximum failure load for each joint position scheme was analysed, and load-deflection curves were plotted. Additionally, stress and strain at the joints were examined to summarise the mechanical behaviour of the splice joints, aiming to determine the optimal splice joint arrangement. Furthermore, by comparing experimental and numerical simulation results, the impact of different splice joint positions on the mechanical performance of the prefabricated H-shaped steel was evaluated. The study seeks to propose optimised calculation formulas and key mechanical performance parameters for the splice joints. The findings serve as a reference for research on similar prefabricated H-shaped steel beam components.

2. Experimental Investigation

At the Structural Laboratory of Shandong Jianzhu University, static four-point bending tests were conducted on prefabricated H-shaped steel components under four distinct node arrangement schemes [26,27]. The failure modes, ultimate bearing capacity, load-deflection curves, and stress distributions of the specimens were analysed, with the experimental results validated through finite element modelling.

2.1. Experimental Design

2.1.1. Splice Joint Overview and Specimen Design

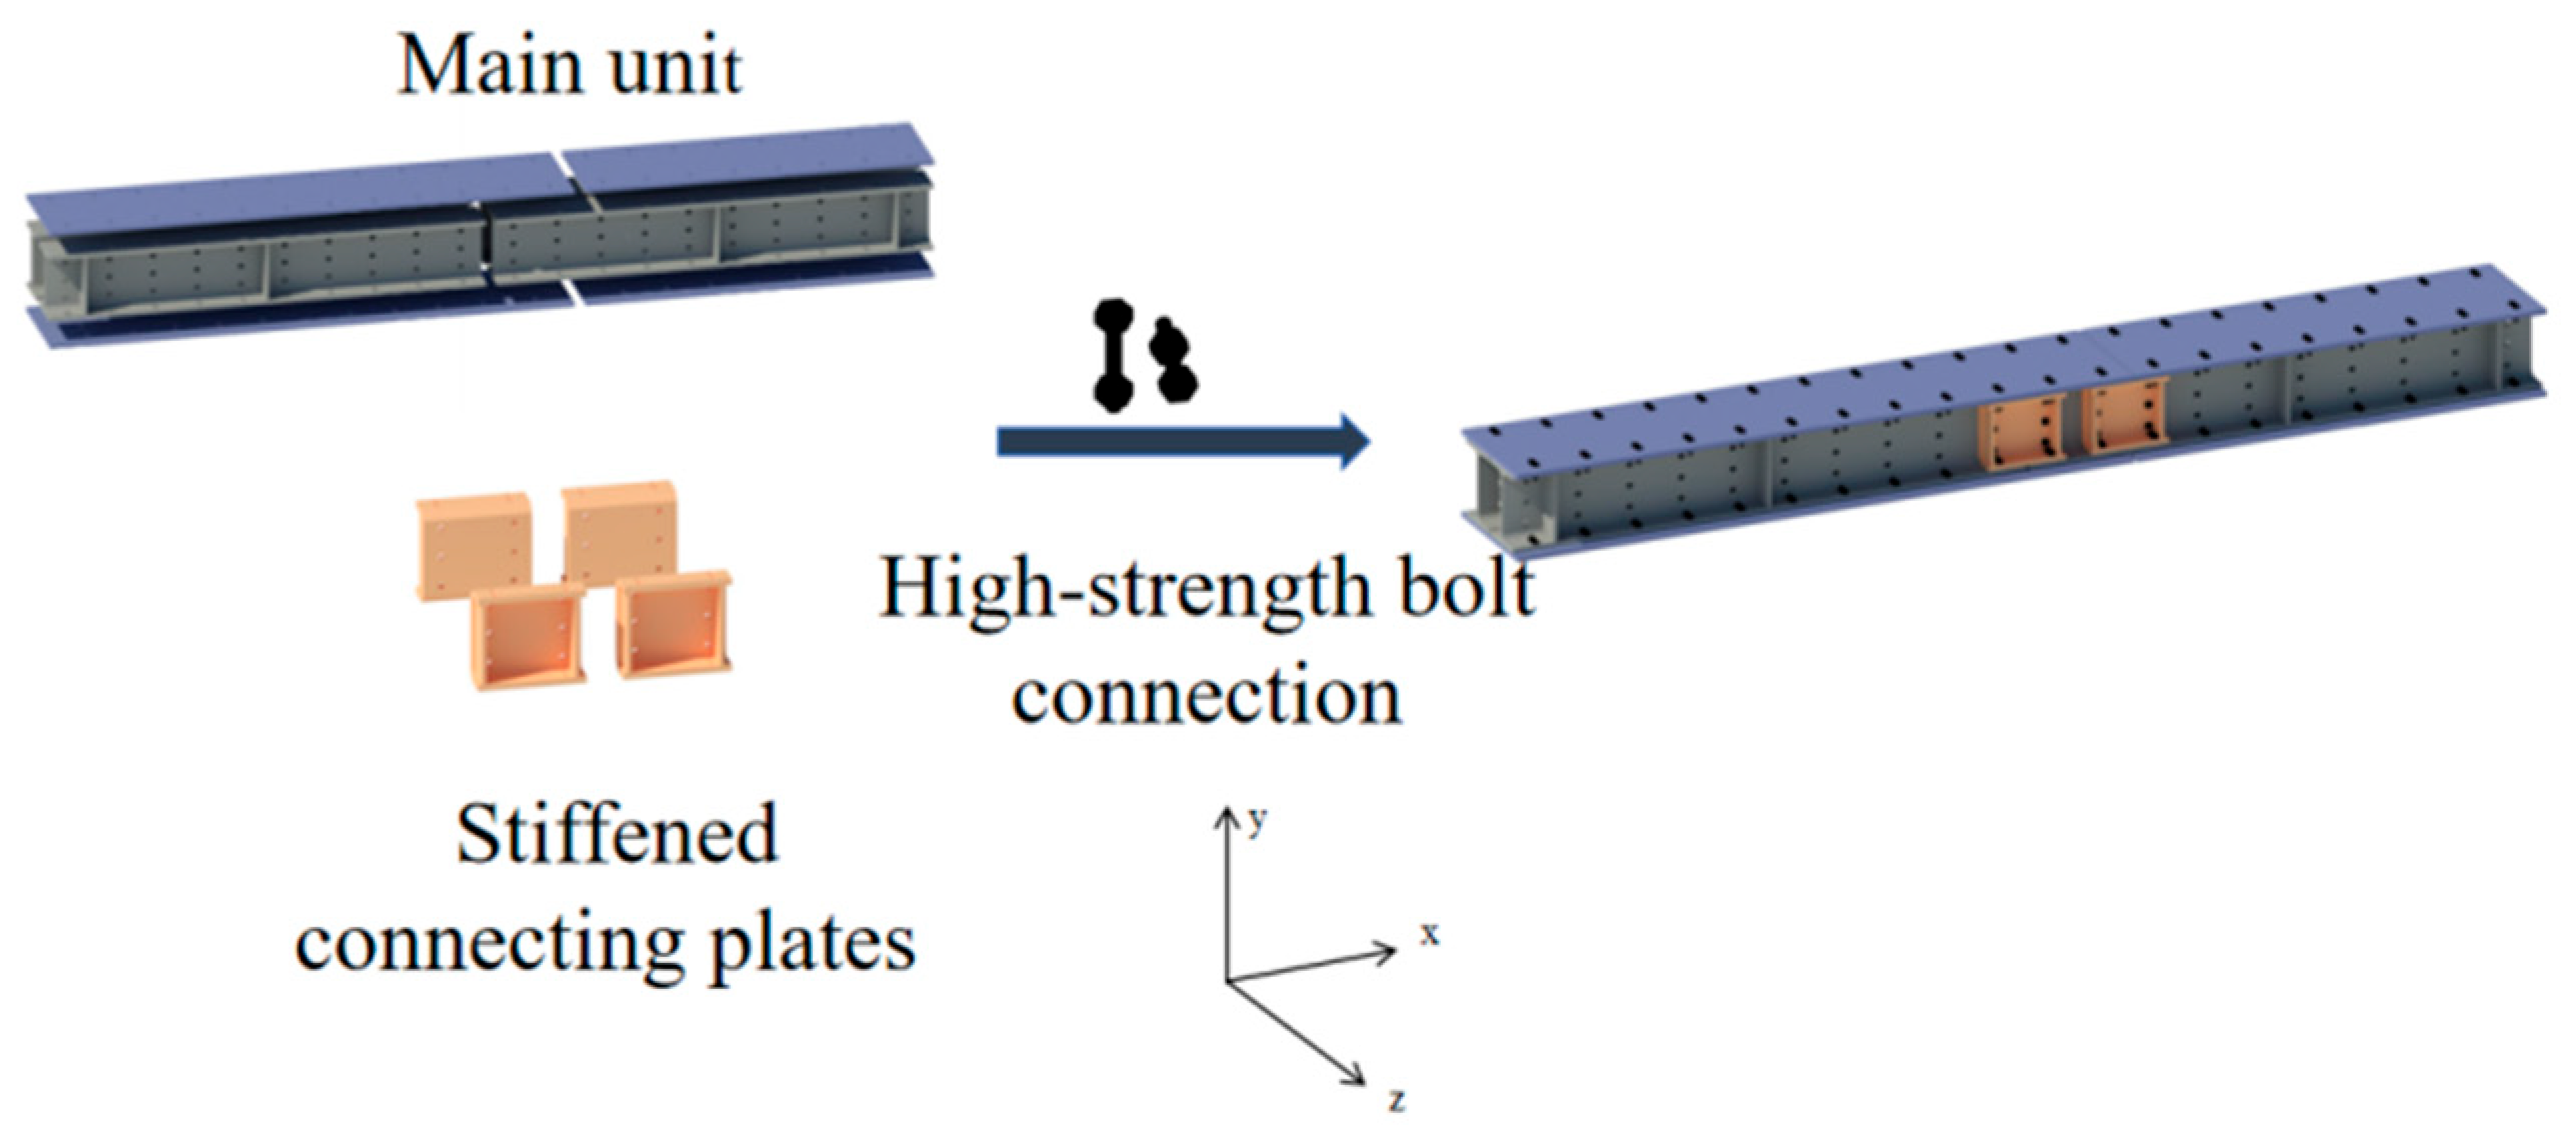
Prefabricated H-shaped steel components are solid-web members. When subjected to combined bending moments and shear forces within the main plane, different connection configurations and splice joint positions markedly affect the cross-sectional strength of the components. As illustrated in Figure 3, each component unit is joined using high-strength bolts, connecting plates, and H-shaped steel sections. Reinforcement plates are incorporated at splice joints, with loads applied along the y-axis. The Cartesian coordinate system used throughout the study aligns with that presented in Figure 3. Splice joints are categorised into two types based on their location: those at connecting plates and those at H-shaped steel sections.
The test specimens utilised prefabricated H-shaped steel beam components, each 1.995 m in length. All components were manufactured from Grade Q235B steel. Connecting plates were fabricated from 9 mm thick steel, while the H-shaped steel sections comprised double-spliced HM150 sections with cross-sectional dimensions of 148 mm × 100 mm × 6 mm × 9 mm. Grade 8.8 M8 high-strength friction grip bolts connected the main structural units. The stiffened connecting plates had a main body thickness of 9 mm and stiffeners with a thickness of 6 mm. These plates were installed at splice joints, and 6 mm thick stiffeners were provided at support locations.
Along the length of the main prefabricated H-shaped steel unit, the distance from bolt holes to the member’s edge was 47.5 mm, and the spacing between bolt holes was 100 mm. Bolt holes in the HM150 section steel were arranged in a T-shaped pattern with a projection height of 130 mm. The prefabricated H-shaped steel featured bolt holes spaced 40 mm apart along its height.
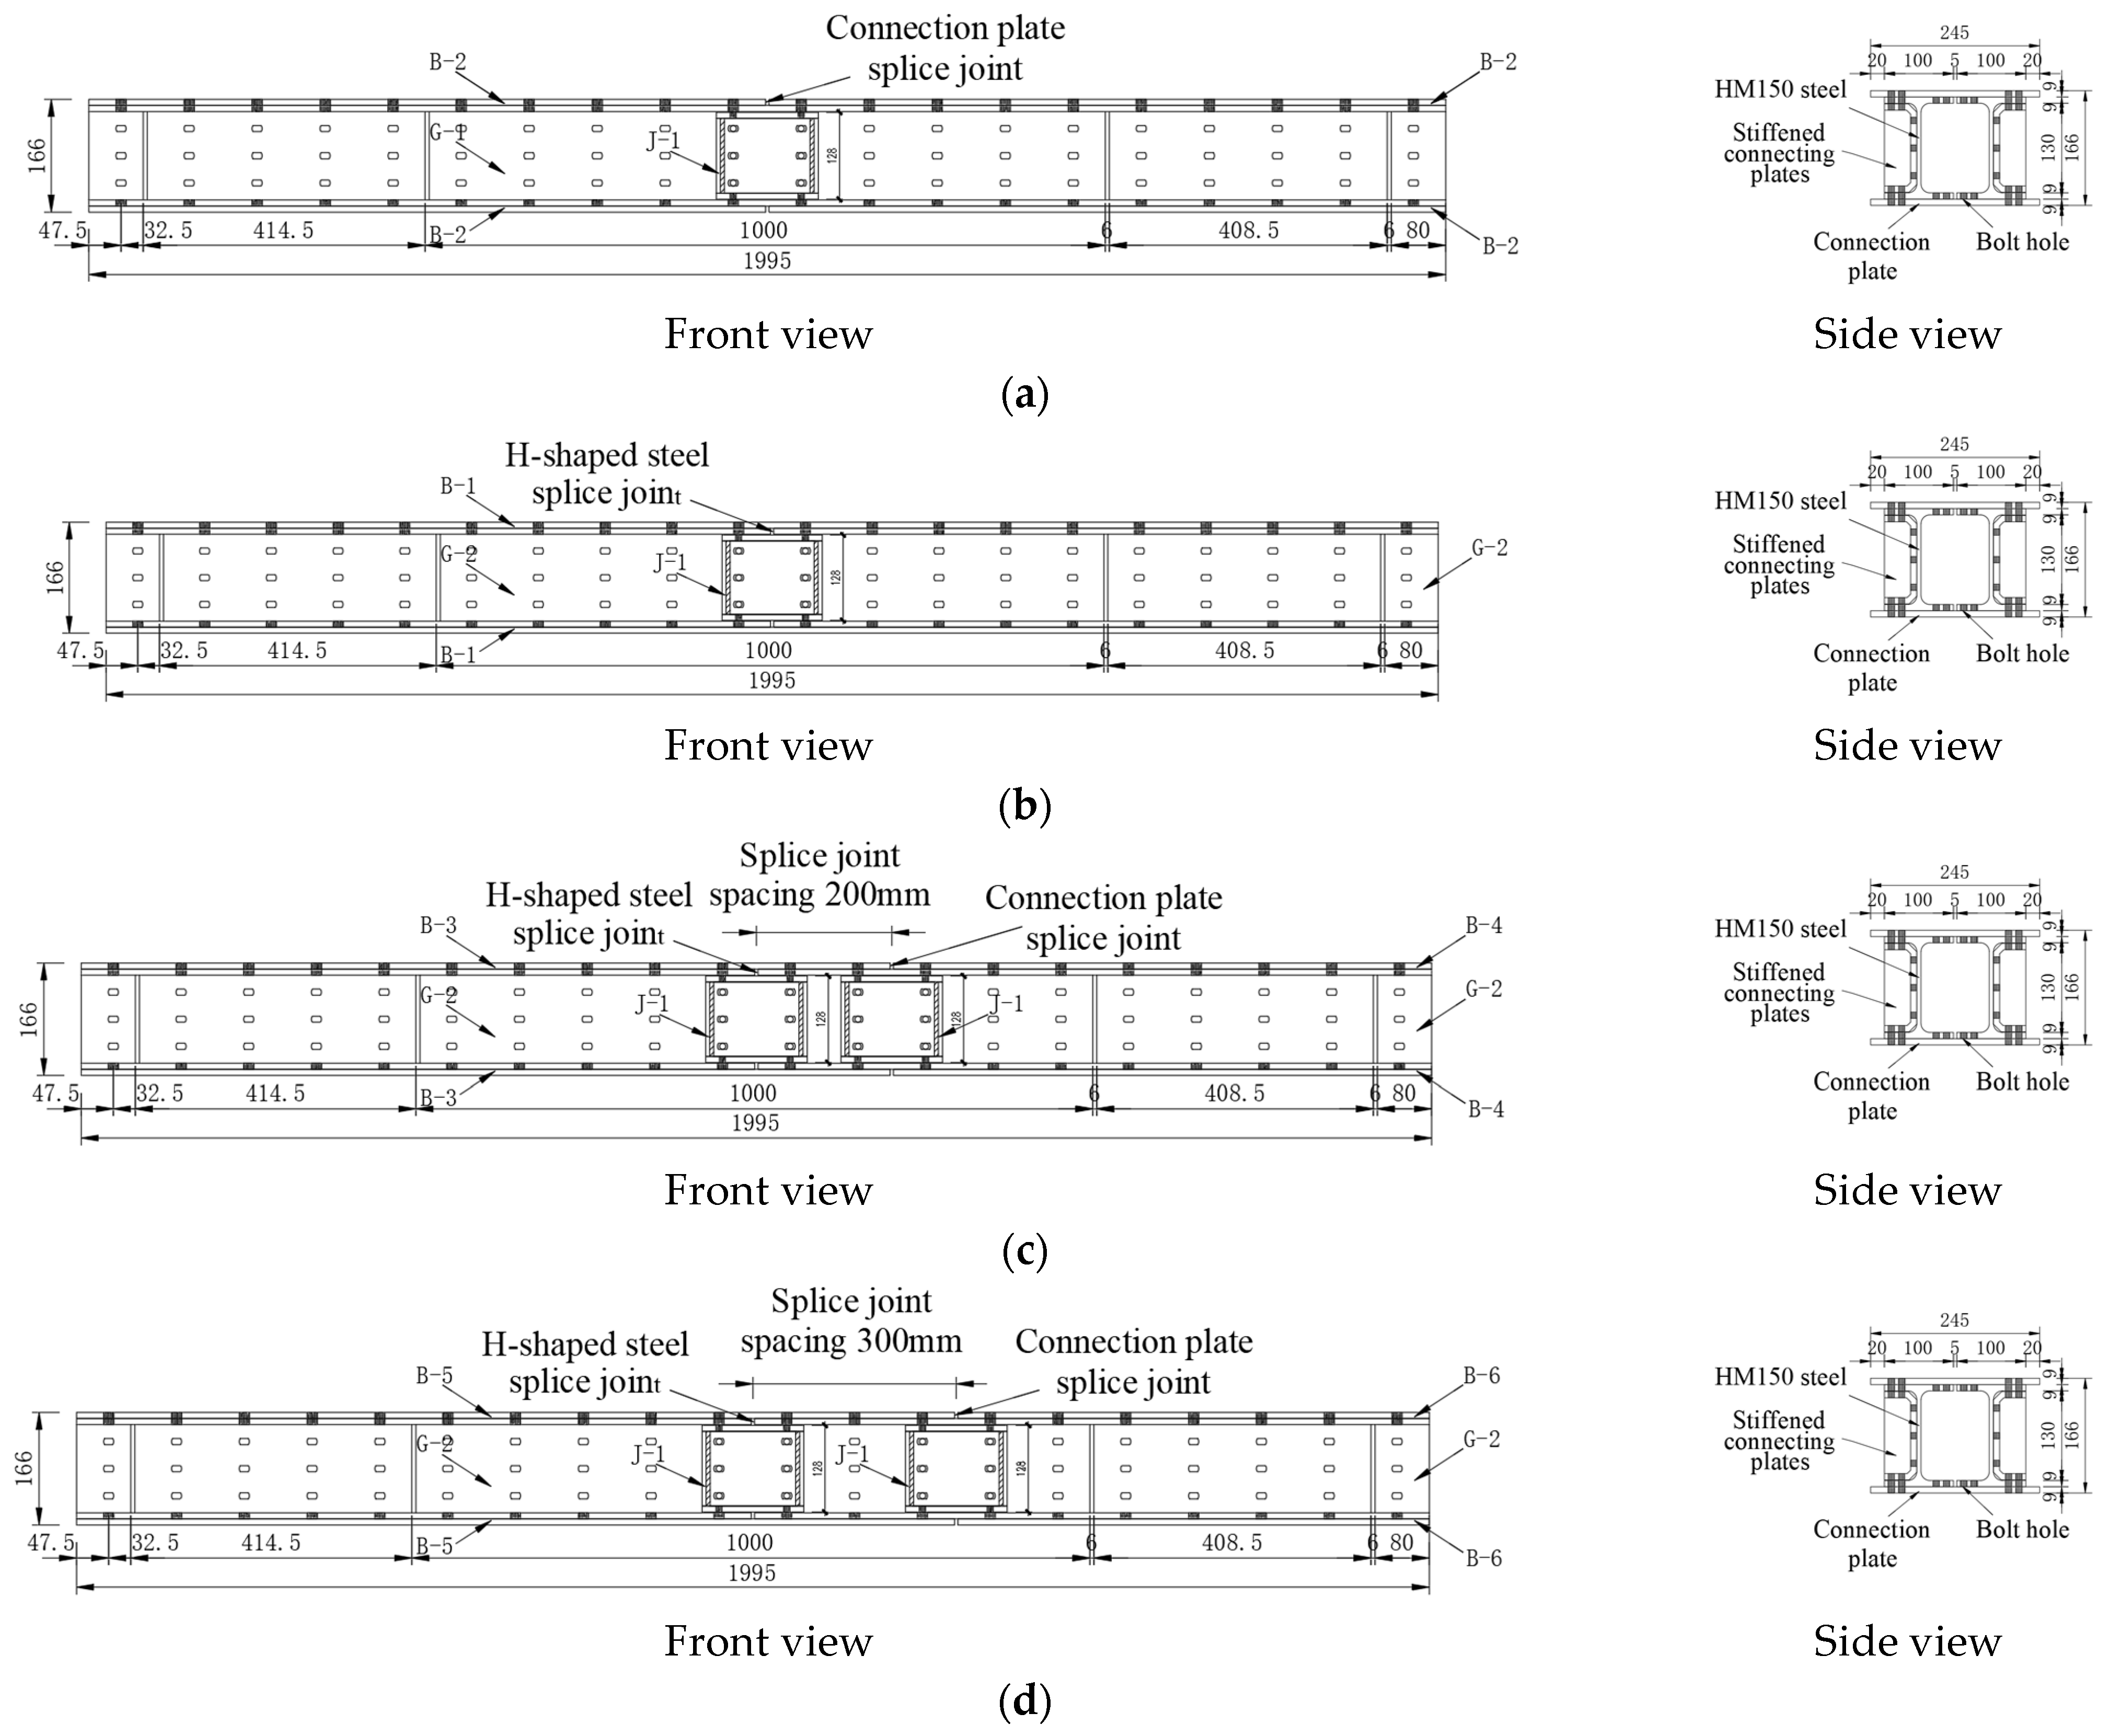
Specimens were classified into two categories based on the location of the splice joint: either at the connecting plates or within the H-shaped steel sections. All splice joints were positioned at the midpoints of the plates, between bolt holes. A total of four specimens were fabricated. Dimensional design parameters are detailed in Table 1, and splice joint parameters are provided in Table 2. Side elevation views of each test specimen are shown in Figure 4.
The test specimens were fabricated using a laser cutting machine to cut and drill steel plates of various thicknesses, resulting in H-shaped steels with bolt holes and connecting plates. After cutting, surface rust was removed, and acetone was applied for cleaning. To ensure uniform bolt preload and prevent any adverse effects on load-bearing capacity during testing, the assembly was performed using a torque wrench set to 16 N·m.

2.1.2. Material Properties of Specimens

Except for the bolts, all test specimen components were fabricated from Q235 cold-rolled steel plates with thicknesses of 6 mm and 9 mm. In accordance with GB/T 228.1 [28], tensile test specimens were machined from connecting plates, H-shaped steel sections, stiffeners, and stiffener connection plates to verify the materials met performance standards. Three plates were used in the experimental programme, with three tensile specimens fabricated from each, thus giving a total of nine specimens. All experimental data are provided in Table 3.

2.1.3. Loading Equipment and Measurement System

A high-precision hydraulic jack was employed as the loading apparatus, applying loads to the specimens through a four-point bending setup, as portrayed in Figure 5. All experimental procedures and data processing strictly followed the GB/T1041 [29] standard. The specimen was supported by a hinge-type base on the right and a fixed base on the left. Load magnitude was controlled using displacement sensors placed at mid-span locations. Strain gauges were strategically installed at splice joints, and displacement metres were positioned at the mid-span, splice joint locations, and non-assembly node areas to facilitate comparative deformation analysis. The loading process maintained a uniform rate, with displacement and strain data recorded at every 20 kN increment during the initial testing phase. When significant acceleration in mid-span displacement was detected, data collection frequency was increased to every 10 kN increment. The loading trial concluded upon one of three conditions: failure of high-strength bolts, compressive damage to connection plates or H-shaped steel flanges, or progression into a critical deformation phase.
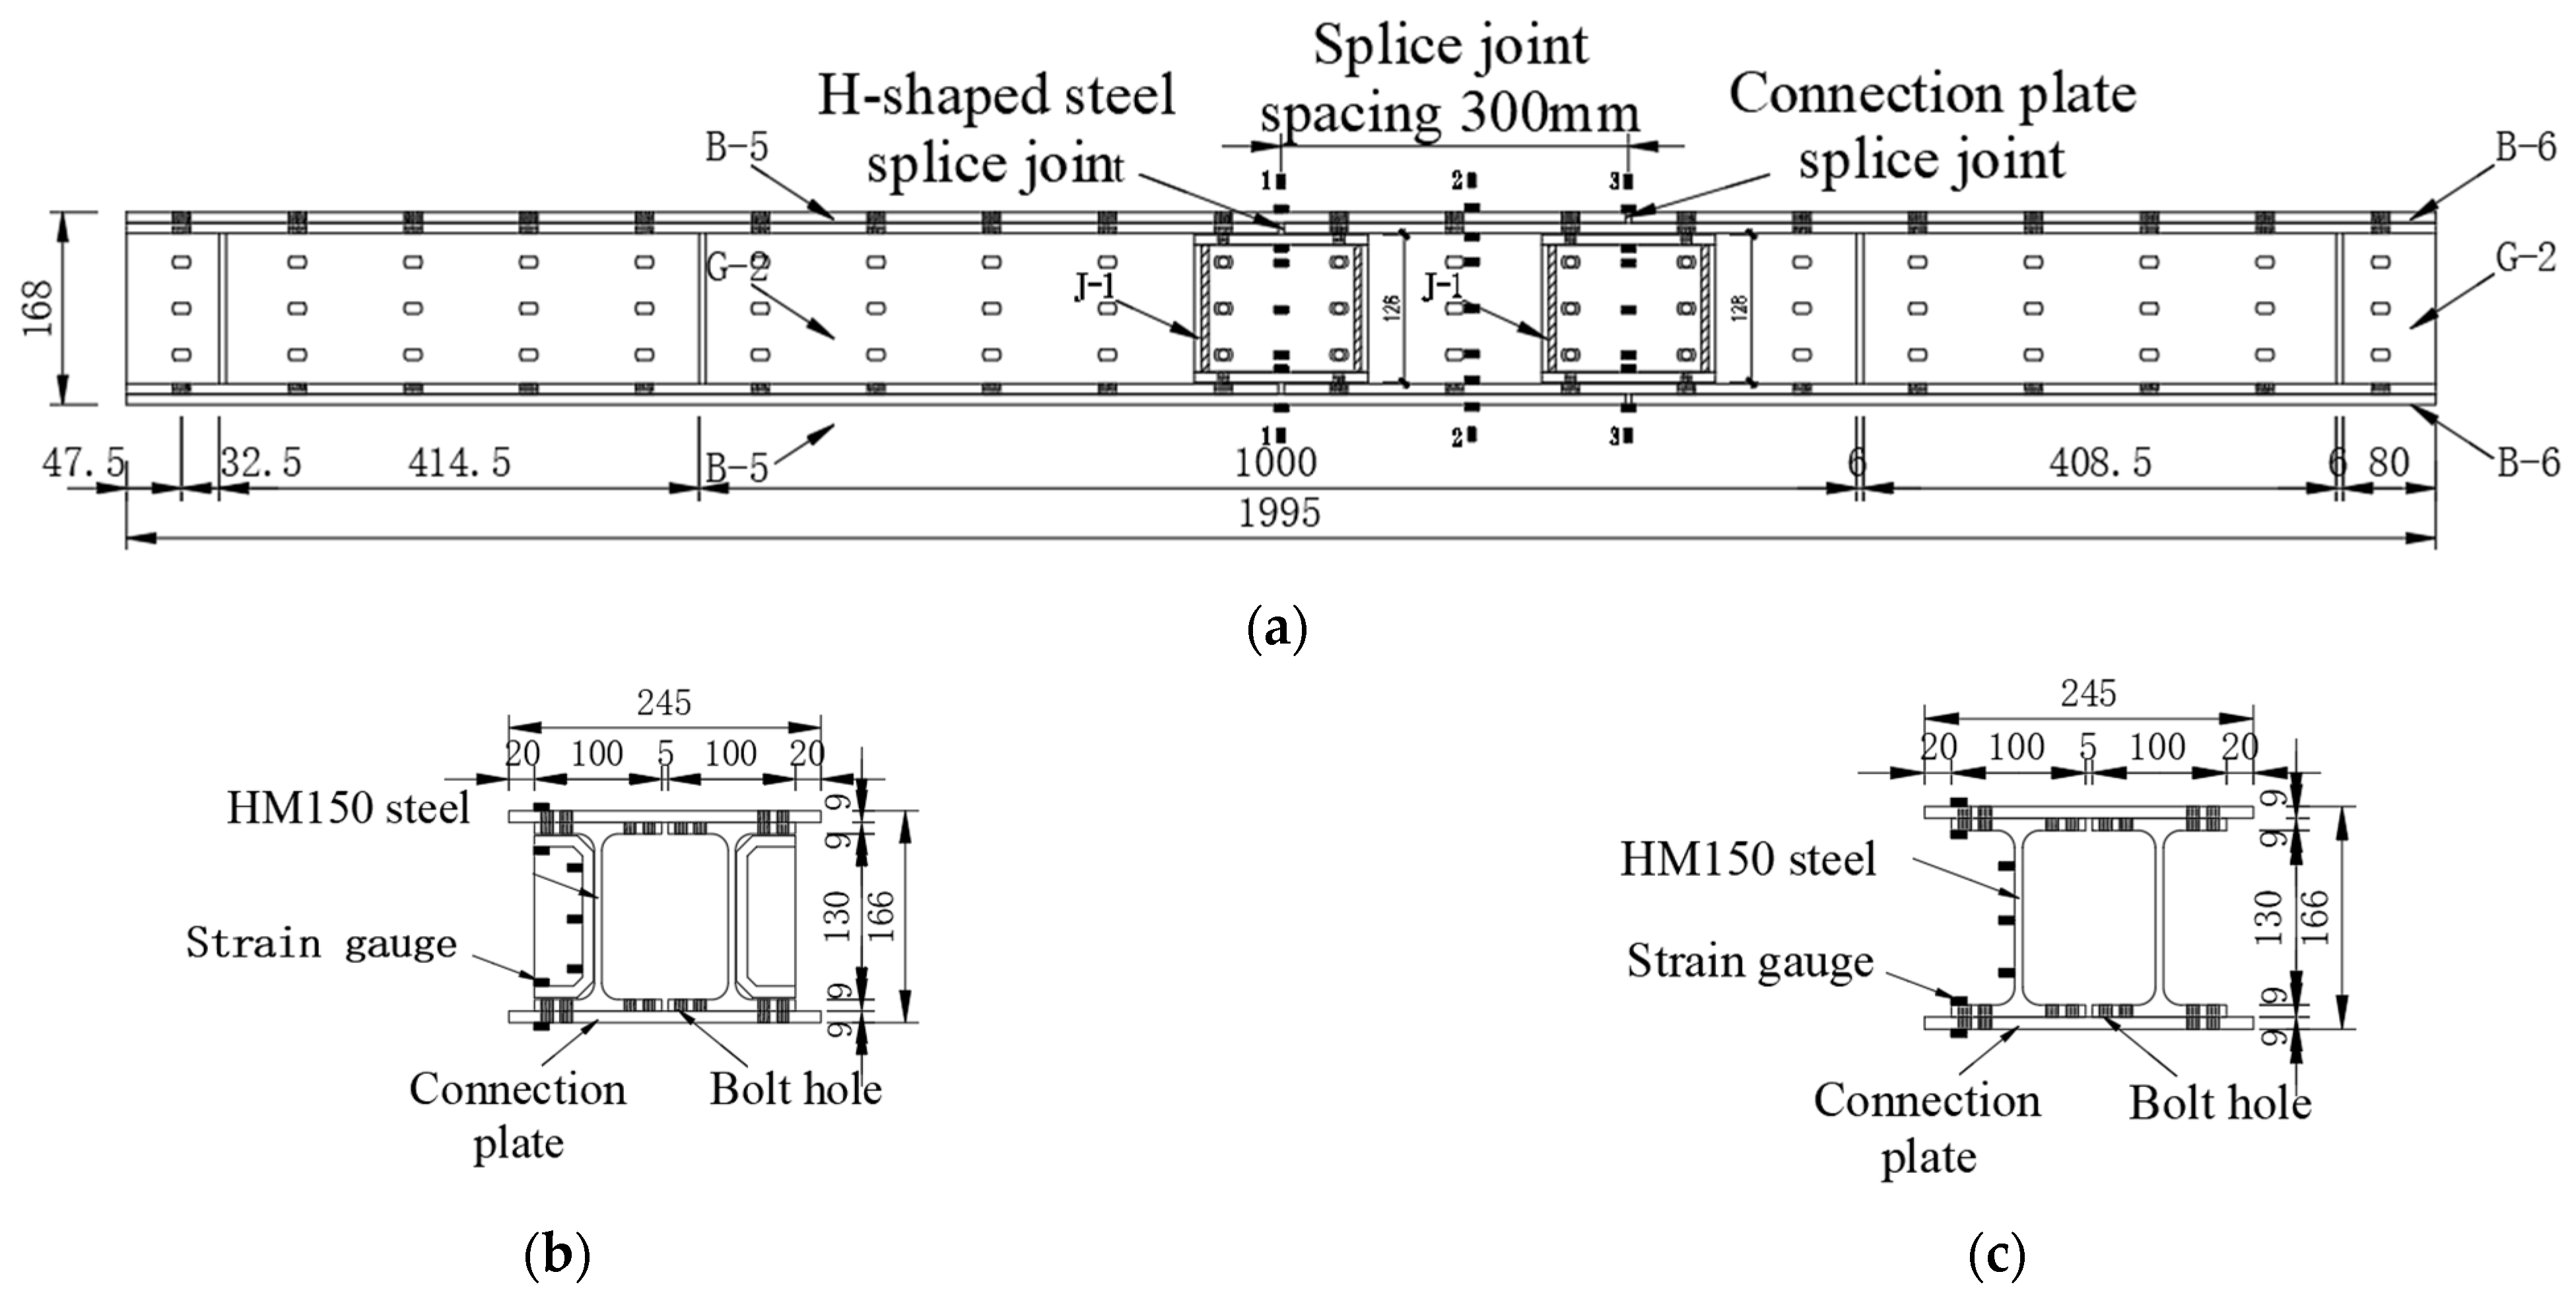
Strain gauges were vertically installed along the stiffened connection plate to monitor strain variations during loading. Strain measurements were recorded by a dedicated data acquisition system at every load increment. Stress Node Configuration Principles: Install one row at the H-shaped steel splice joint along the left side of the x-direction mid-span, another row at the midpoint of each splice joint, and a third row at the connection plate splice joint. Arrange seven groups along the y-direction, comprising two groups at the upper and lower flanges and three groups between web bolt holes. Each specimen comprises three rows of nodes, amounting to 21 groups and 42 stress nodes. Using specimen SJ-B300-H0-J2 as an example, the schematic of the stress node configuration is presented in Figure 6.

2.1.4. Experimental Observations

For example, specimen SJ-B0-Hnone-J1 showed no relative slip until a load of 135 kN was applied. The relationship between the applied load and member displacement remained largely linear, indicating the specimen stayed within the elastic range. At a load of 160 kN, bolt loosening occurred, and components began to slip. The slip was initially observed between the upper connecting plate and the H-shaped steel, causing the relationship between mid-span displacement and load to become nonlinear.
At 170 kN, displacement increased rapidly. Upon reaching 180 kN, the upper connecting plate B-2 tightened. By 200 kN, component slip had maximised, with no further significant slip. When the load reached 215 kN, bolt shearing was observed, indicating that specimen SJ-B0-Hnone-J1 had failed.

2.1.5. Failure Modes Analysis

In the four-point bending experiments, all four specimen groups failed due to the fracture of high-strength friction grip bolts at the stiffened connecting plates, as shown in Figure 7, the location of the damage is in the area indicated by the red dotted line. Upon analysing the failure modes of the four specimen groups, maximum stress was consistently localised at the bolt holes within the splice joint regions. This localised stress exceeded the components’ ultimate bearing capacity, triggering stress redistribution. Consequently, the entire cross-section reached its ultimate flexural strength, leading to specimen failure.

2.2. Experimental Results Analysis

2.2.1. Load Versus Mid-Span Deflection Curves

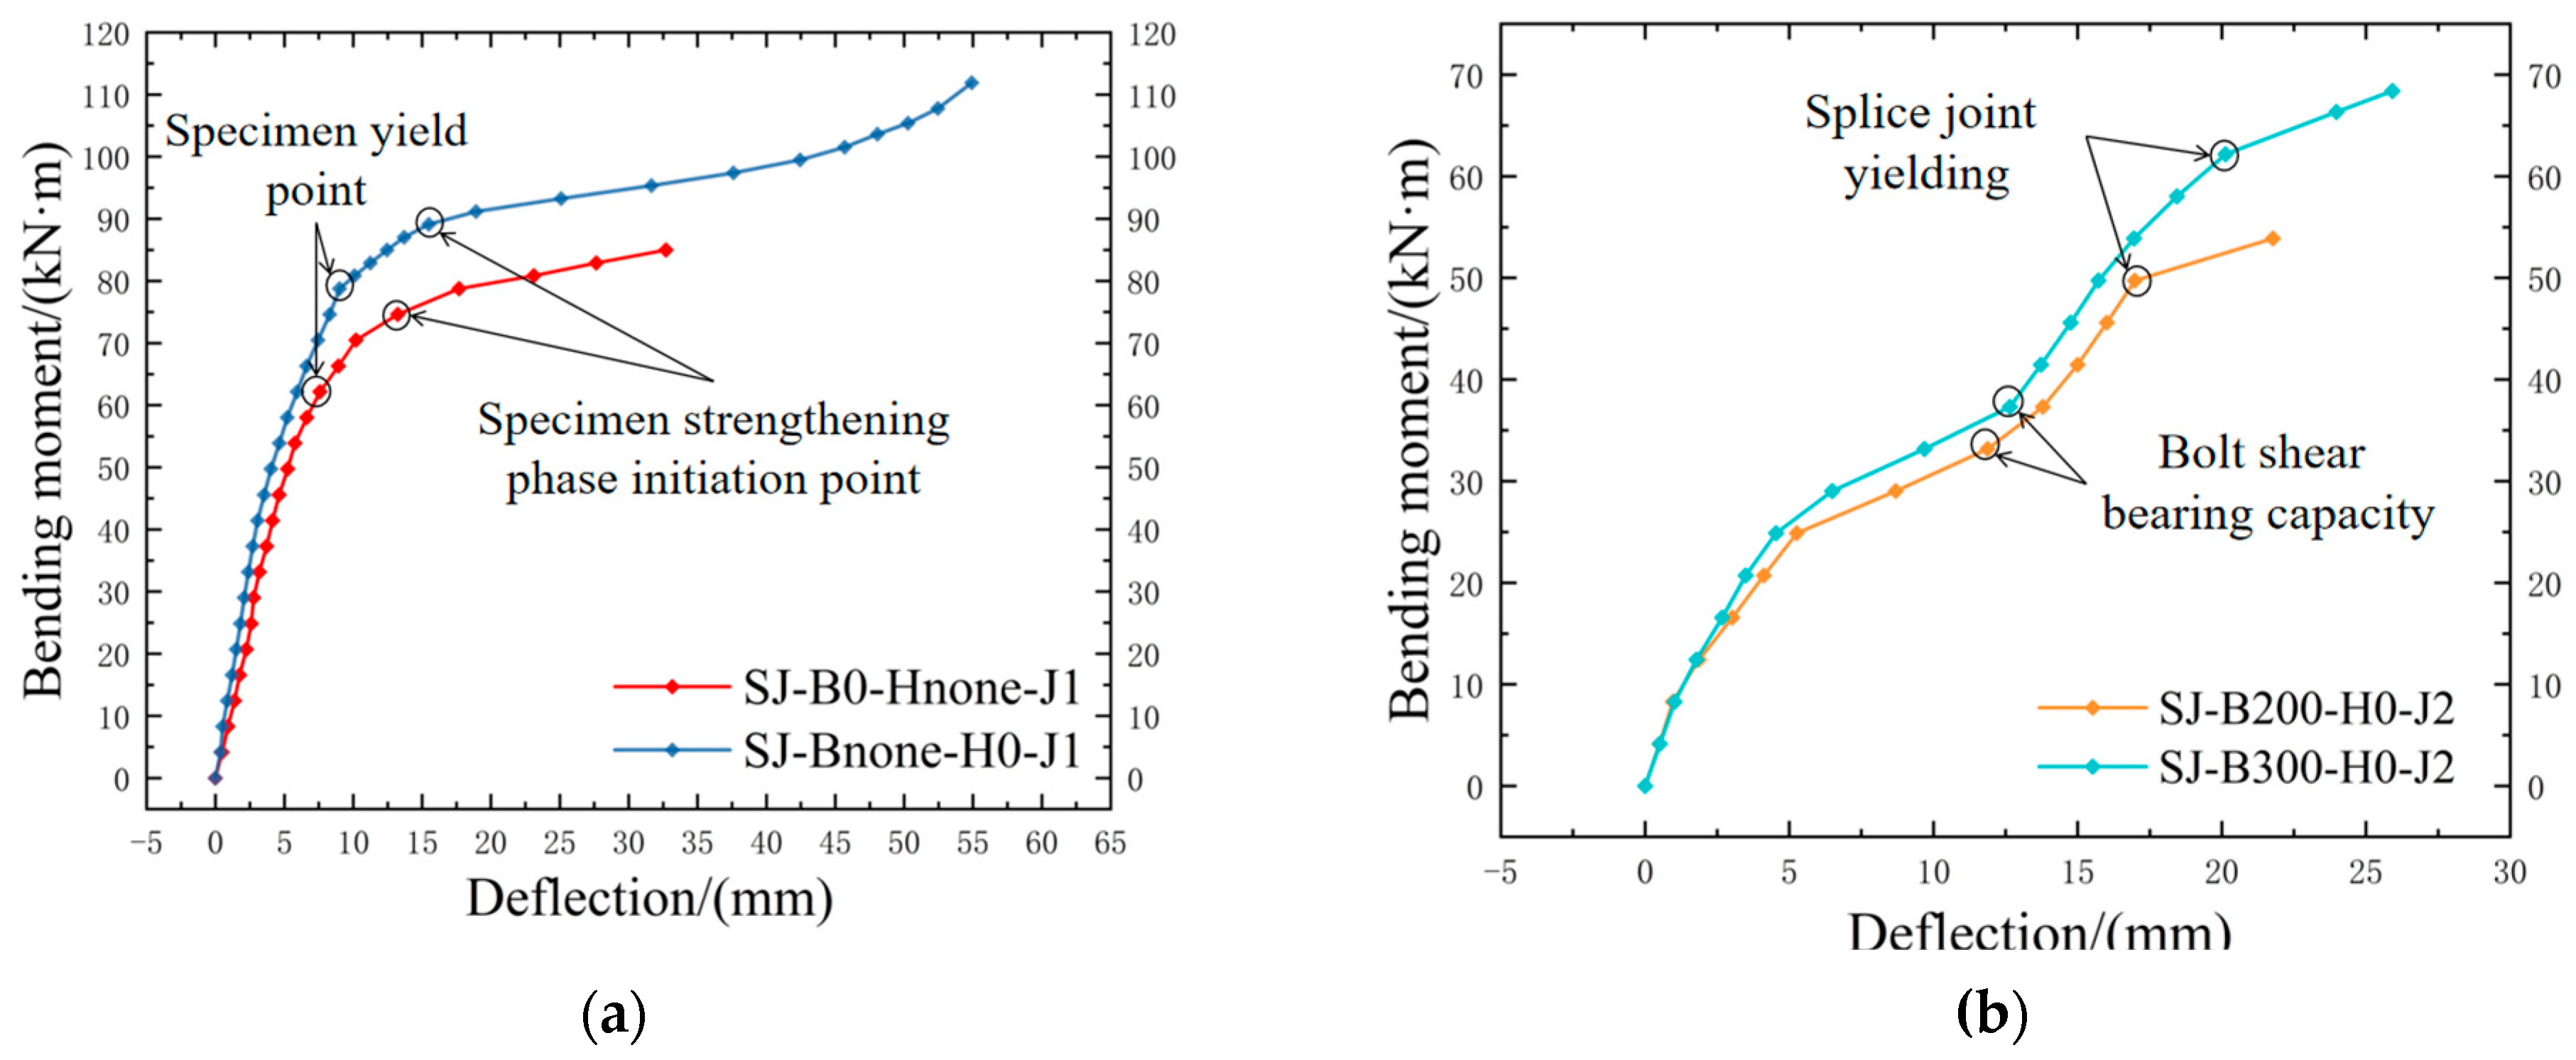
Figure 8 presents the load versus mid-span deflection curves for the specimens. As illustrated in Figure 8a, specimens with a single splice joint exhibit essentially linear load–deflection patterns. All specimens underwent three distinct phases: elastic deformation, yielding, and ultimate failure. During the elastic deformation phase, a linear relationship between load and mid-span deflection indicated substantial elastic behaviour. As the load was incrementally increased, the specimens entered the yielding phase, where the rate of load increase decelerated while mid-span deflection accelerated, signifying the onset of plastic deformation. Finally, the specimens entered their ultimate phase, reaching a peak load after which mid-span deflection increased markedly until failure.
In contrast, as depicted in Figure 8b, specimens with double splice joints demonstrate a distinct deformation phase during elastic deformation, characterised by minimal load increase accompanied by a significant rise in mid-span deflection. Analysis indicates that, at this stage, the force applied to the bolts at the midpoint between the two joints exceeds their capacity for bearing and frictional load transfer, resulting in relative slip between components. However, since the bolt holes in the connecting and stiffened connecting plates are standard round holes, whereas those in the HM150 sections are elongated slots, the transition from the bearing/friction phase to the bolt shank shear-bearing phase occurs gradually following slip initiation. This transition involves a relatively slow process coordinated with deformation among the various components.
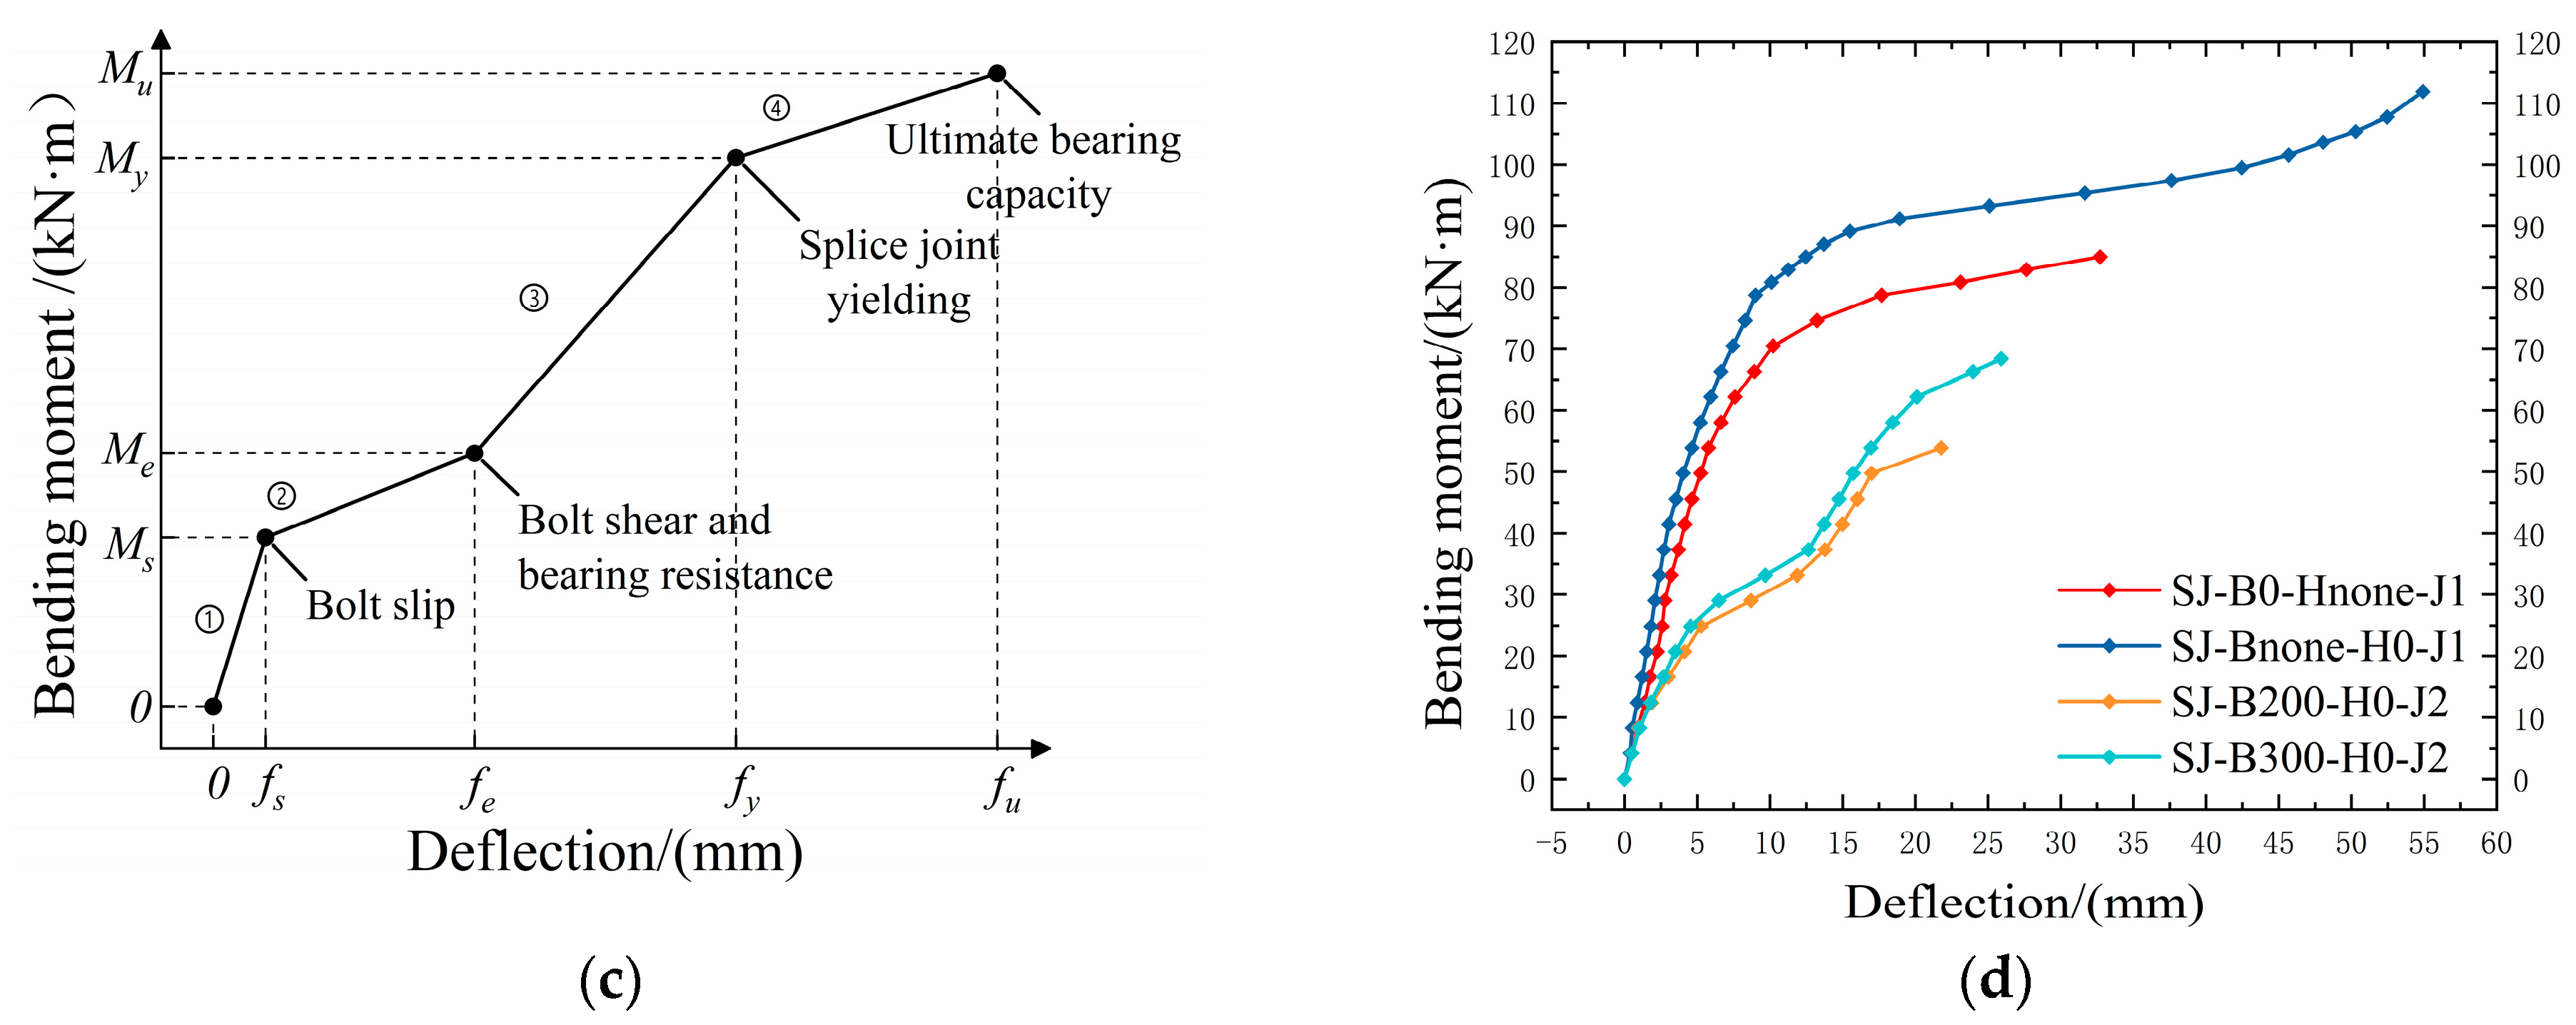
Comparing the load–deflection curves of specimens SJ-B200-H0-J2 and SJ-B300-H0-J2 demonstrates that increasing the spacing between the double splice points significantly enhances the ultimate bearing capacity of the specimen. This confirms that splice joint spacing is a critical factor influencing the bearing capacity of this type of prefabricated H-shaped steel beam.
Figure 8c summarises the load–deflection curve patterns for double-splice joint specimens, which can be categorised into four stages:
① Bolt Friction-Bearing Stage: During this phase, load transfer at the splice joint relies on the combined action of bolt bearing and friction between components, effectively acting as a rigid connection. The load-mid-span deflection curve exhibits a positive correlation, and the specimen remains in the elastic deformation stage.
② Bolt Slip Stage: When the load on the specimen reaches the bolt slip bending moment (denoted as Ms), the moment-induced force surpasses the friction between components, causing relative slip. Due to the presence of both slotted holes (in HM150) and standard round holes (in the plates), the transition from the bearing/friction stage to the bolt shank shear-bearing stage occurs gradually rather than abruptly following slip initiation. Throughout this transition, the specimen remains in the elastic deformation phase.
③ Component Cooperative Load-Bearing Stage: When the load on the specimen reaches the bolt shear-bearing bending moment (Me), the relative sliding between components that significantly contributes to the overall deflection is completed. Consequently, load transfer at the splice joint is primarily resisted by the bearing shear of the bolts. The load–mid-span deflection curve reestablishes a positive correlation, and the specimen continues to exhibit elastic deformation.
④ Yielding Stage: When the specimen load reaches the yield bending moment (My), the stress at the splice joint reaches the yield stress. A plastic hinge forms at the joint, initiating stress redistribution. The mid-span deflection increased at a significantly higher rate than the applied load. The load–mid-span deflection curve displays distinct nonlinear characteristics, indicating the transition into the elasto-plastic deformation stage. Significant deformation occurs at the joint or bolt connection until the failure bending moment (Mu) is achieved, resulting in the failure of the joint components.
Figure 8d compares the load–mid-span deflection curves for all specimens, clearly demonstrating that increasing the number of splice joints significantly reduces the bearing capacity of this type of prefabricated H-shaped steel beam.

2.2.2. Flexural Bearing Capacity Analysis

Table 4 summarises the failure modes and ultimate bending moments for the four compared specimen groups.
The test results reveal that all single-splice-joint specimens failed due to fractures of the HSFG (High-Strength Friction Grip) bolts on the splice joint side. In contrast, double-splice-joint specimens failed between the connecting plate splice joint and the HM150 section steel splice joint, marked by HSFG bolt fractures adjacent to the connecting plate splice joint. Components on the connecting plate splice joint side failed prior to those on the HM150 section steel splice joint side, attributable to the relatively lower flexural rigidity of the connecting plates. Under bending moments, greater deformations occur at the connecting plate splice joint, resulting in higher shear forces and bearing pressures on the bolts in this region. Consequently, in double-splice-joint specimens, components on the connecting plate joint side fail preferentially.
As listed in Table 4, the connecting plate splice joint exerts a more significant negative impact on load-bearing capacity than the HM150 steel section splice joint in single-assembly specimens. Data analysis indicates that, for single-splice-joint specimens, the connecting plate splice joint adversely affects bearing capacity more than the HM150 section steel splice joint. Conversely, specimens with the splice joint at the H-shaped steel section demonstrate superior ultimate bearing capacity—approximately 31.72% higher than those with the connecting plate splice joint—approaching the performance of joint-free specimens.
The failure bending moments of double-splice-joint specimens are reduced by 39.89% to 51.88% compared to specimen SJ-Bnone-H0-J1, illustrating that the concurrent presence of two splice joints substantially undermines the specimen’s bearing capacity. As detailed in Table 4, the specimen shows its lowest flexural bearing capacity when the spacing between the connecting plate splice joint and the HM150 section steel splice joint is merely one bolt-hole pitch along the x-axis (i.e., specimen SJ-B200-H0-J2). Increasing the separation between the two splice joints (i.e., specimen SJ-B300-H0-J2) leads to a significant enhancement in the failure bending moment, with SJ-B300-H0-J2 exhibiting approximately a 26.98% increase over SJ-B200-H0-J2. Therefore, this result demonstrates that positioning the connecting plate in close proximity to the HM150 section steel splice joint significantly compromises the bearing capacity. Conversely, expanding the spacing between the splice joints progressively improves the specimen’s flexural bearing capacity.
In summary, splice joint configurations greatly influence the flexural bearing capacity of prefabricated H-shaped steel beams:
(1)
In single-splice-joint specimens, both the connecting plate splice joint and the H-shaped steel splice joint decrease bearing capacity relative to joint-free specimens. Nonetheless, specimens with joints at the H-shaped steel section displayed superior performance.
(2)
Double-splice-joint specimens exhibit more intricate failure mechanisms. Reducing the proximity between the connecting plate and H-shaped steel splice joints significantly compromises the flexural bearing capacity. This phenomenon arises from increased stress concentration at adjacent joints, resulting in elevated shear forces and bearing pressures on the bolts.
(3)
Enhancing inter-joint spacing significantly improves the failure bending moment, demonstrating that optimal splice joint separation effectively boosts flexural performance.
Therefore, rational joint design (e.g., increased spacing), high-performance materials, and optimised loading protocols can markedly improve structural bearing capacity and extend service life.

2.2.3. Stress Analysis

In practical engineering applications, connection plates and H-shaped steel components in prefabricated H-shaped steel beam main units are assembled from sections of varying sizes. In unsupported regions, the likelihood of two splice joints occurring is high. Table 4 illustrates that closely situated double splice joints excessively reduce the specimen’s load-bearing capacity and stiffness. Thus, it is recommended to avoid positioning connection plates and H-shaped steel splice joints in identical or neighbouring locations.
A sign convention was adopted, with negative stresses above the neutral axis and positive stresses below it, to determine the neutral axis position and analyse the stress distribution in the specimens. Both specimens exhibited consistent stress distribution patterns. For instance, the stress distribution of SJ-B300-H0-J2 under various bending moments is illustrated in Figure 9.
As displayed in Figure 9a, the neutral axis of section 1-1 is elevated above the centroid due to the presence of bolt holes. The lower flange connection plate developed appreciably higher stresses than the stiffener connection plate during the friction compression stage. The H-shaped steel splice joint causes the bending moment of the lower flange to be solely supported by the connection plates, resulting in relatively high stress in this region. Consequently, the observed stress distribution contradicts the plane-section assumption. Upon reaching the bolt slip stage (MMs = 24.87 kN·m), relative sliding occurs within the assembly, leading to an upward shift in the neutral axis. Under the combined effects of preload forces on the bolts at the stiffener connection plates and bending moments, shear stress intensifies at the web of the stiffener connection plates. Therefore, the impact of bending moment changes during both the bolt slip and coordinated loading stages on the web’s stress remains limited, causing the stress distribution to be inconsistent with the flat-section assumption. Upon reaching the coordinated loading stage of the assembly (MMe = 37.31 kN·m), complete sliding occurs, resulting in a downward shift in the neutral axis position. The stress variation curves for both the lower flange connection plate and stiffener connection plates become more gradual, with the stress distribution largely conforming to the plane-section assumption.
As illustrated in Figure 9b, before the specimen reaches the yield stage (MMy = 58.3 kN·m), the neutral axis of section 2-2 remains consistently above the centroid. However, once the bending moment reaches My, the lower flange bolt position at the section yields, forming a plastic hinge. With further increases in bending moment, plastic stress rapidly propagates into the compression zone, leading to a significant upward displacement of the neutral axis. Section 2-2 is located between the connection plate and the H-shaped steel splice joints. The relative deformation between these two nodes under bending moments induces substantial shear stress in the web of section 2-2. Consequently, variations in bending moment during the bolt slip stage and component coordination stage have minimal impact on web stress. Therefore, the stress distribution pattern does not adhere to the flat cross-section assumption.
As depicted in Figure 9c, before the specimen reaches the yield stage, the neutral axis of section 3-3 remains stable above the centroid. However, when the bending moment attains My, the lower flange bolt position at the section experiences yield stress. As bending moments increase, plastic stress rapidly extends into the compression zone, causing a significant upward displacement of the neutral axis. The splice joint of the connection plate restricts coordinated deformation between the connecting plate and the H-shaped steel in the flange region. Consequently, the bending moment at the flange is solely supported by the upper and lower flange plates and the stiffener connection plates of the H-shaped steel. This results in higher stress concentrations at the stiffener connection plates compared to the flange connection plates, thereby violating the assumption of a flat cross-section for stress distribution.

3. Finite Element Model Validation and Parametric Analysis

3.1. Finite Element Model Development

To investigate the impact of splice joints on the mechanical properties of prefabricated H-shaped steel components, four test specimens, each 1.995 m in length with varying assembly configurations, were simulated using ANSYS 2022 finite element analysis software. The specimens were pre-tested according to the von Mises yield criterion, with subsequent stress analyses adhering to this standard. The dimensions and mechanical properties of the double-assembly HM150 steel section comply with the ‘Steel Structure Design Code’ [30]. Grade 8.8 M8 high-strength bolts, including both shank and head, are modelled as equivalent-diameter cylinders, with diameters determined in accordance with the ‘High-Strength Large Hex Head Bolts for Steel Structures’ [31]. The constitutive equations of steel and bolts are Equations (1) and (2) in sequence. The constitutive behaviour of the Q235B steel was characterised by a tri-linear plasticity hardening model (Figure 10a), and the bolt behaviour was represented by a bi-linear plasticity hardening model (Figure 10b). As known from the ‘Steel Structure Design Code’ [30], the elastic modulus (E) for both steel and bolts is set at 2.06 × 10⁵ N/m2, with a Poisson’s ratio of 0.3.
σ = E ε σ y ε σ y + E t ( ε 0.025 ) 0 ε < ε y ε y ε 0.025 0.025 < ε 0.06 ,
σ = E ε σ y + E t ( ε ε y ) 0 ε < ε y ε y ε 0.06 ,
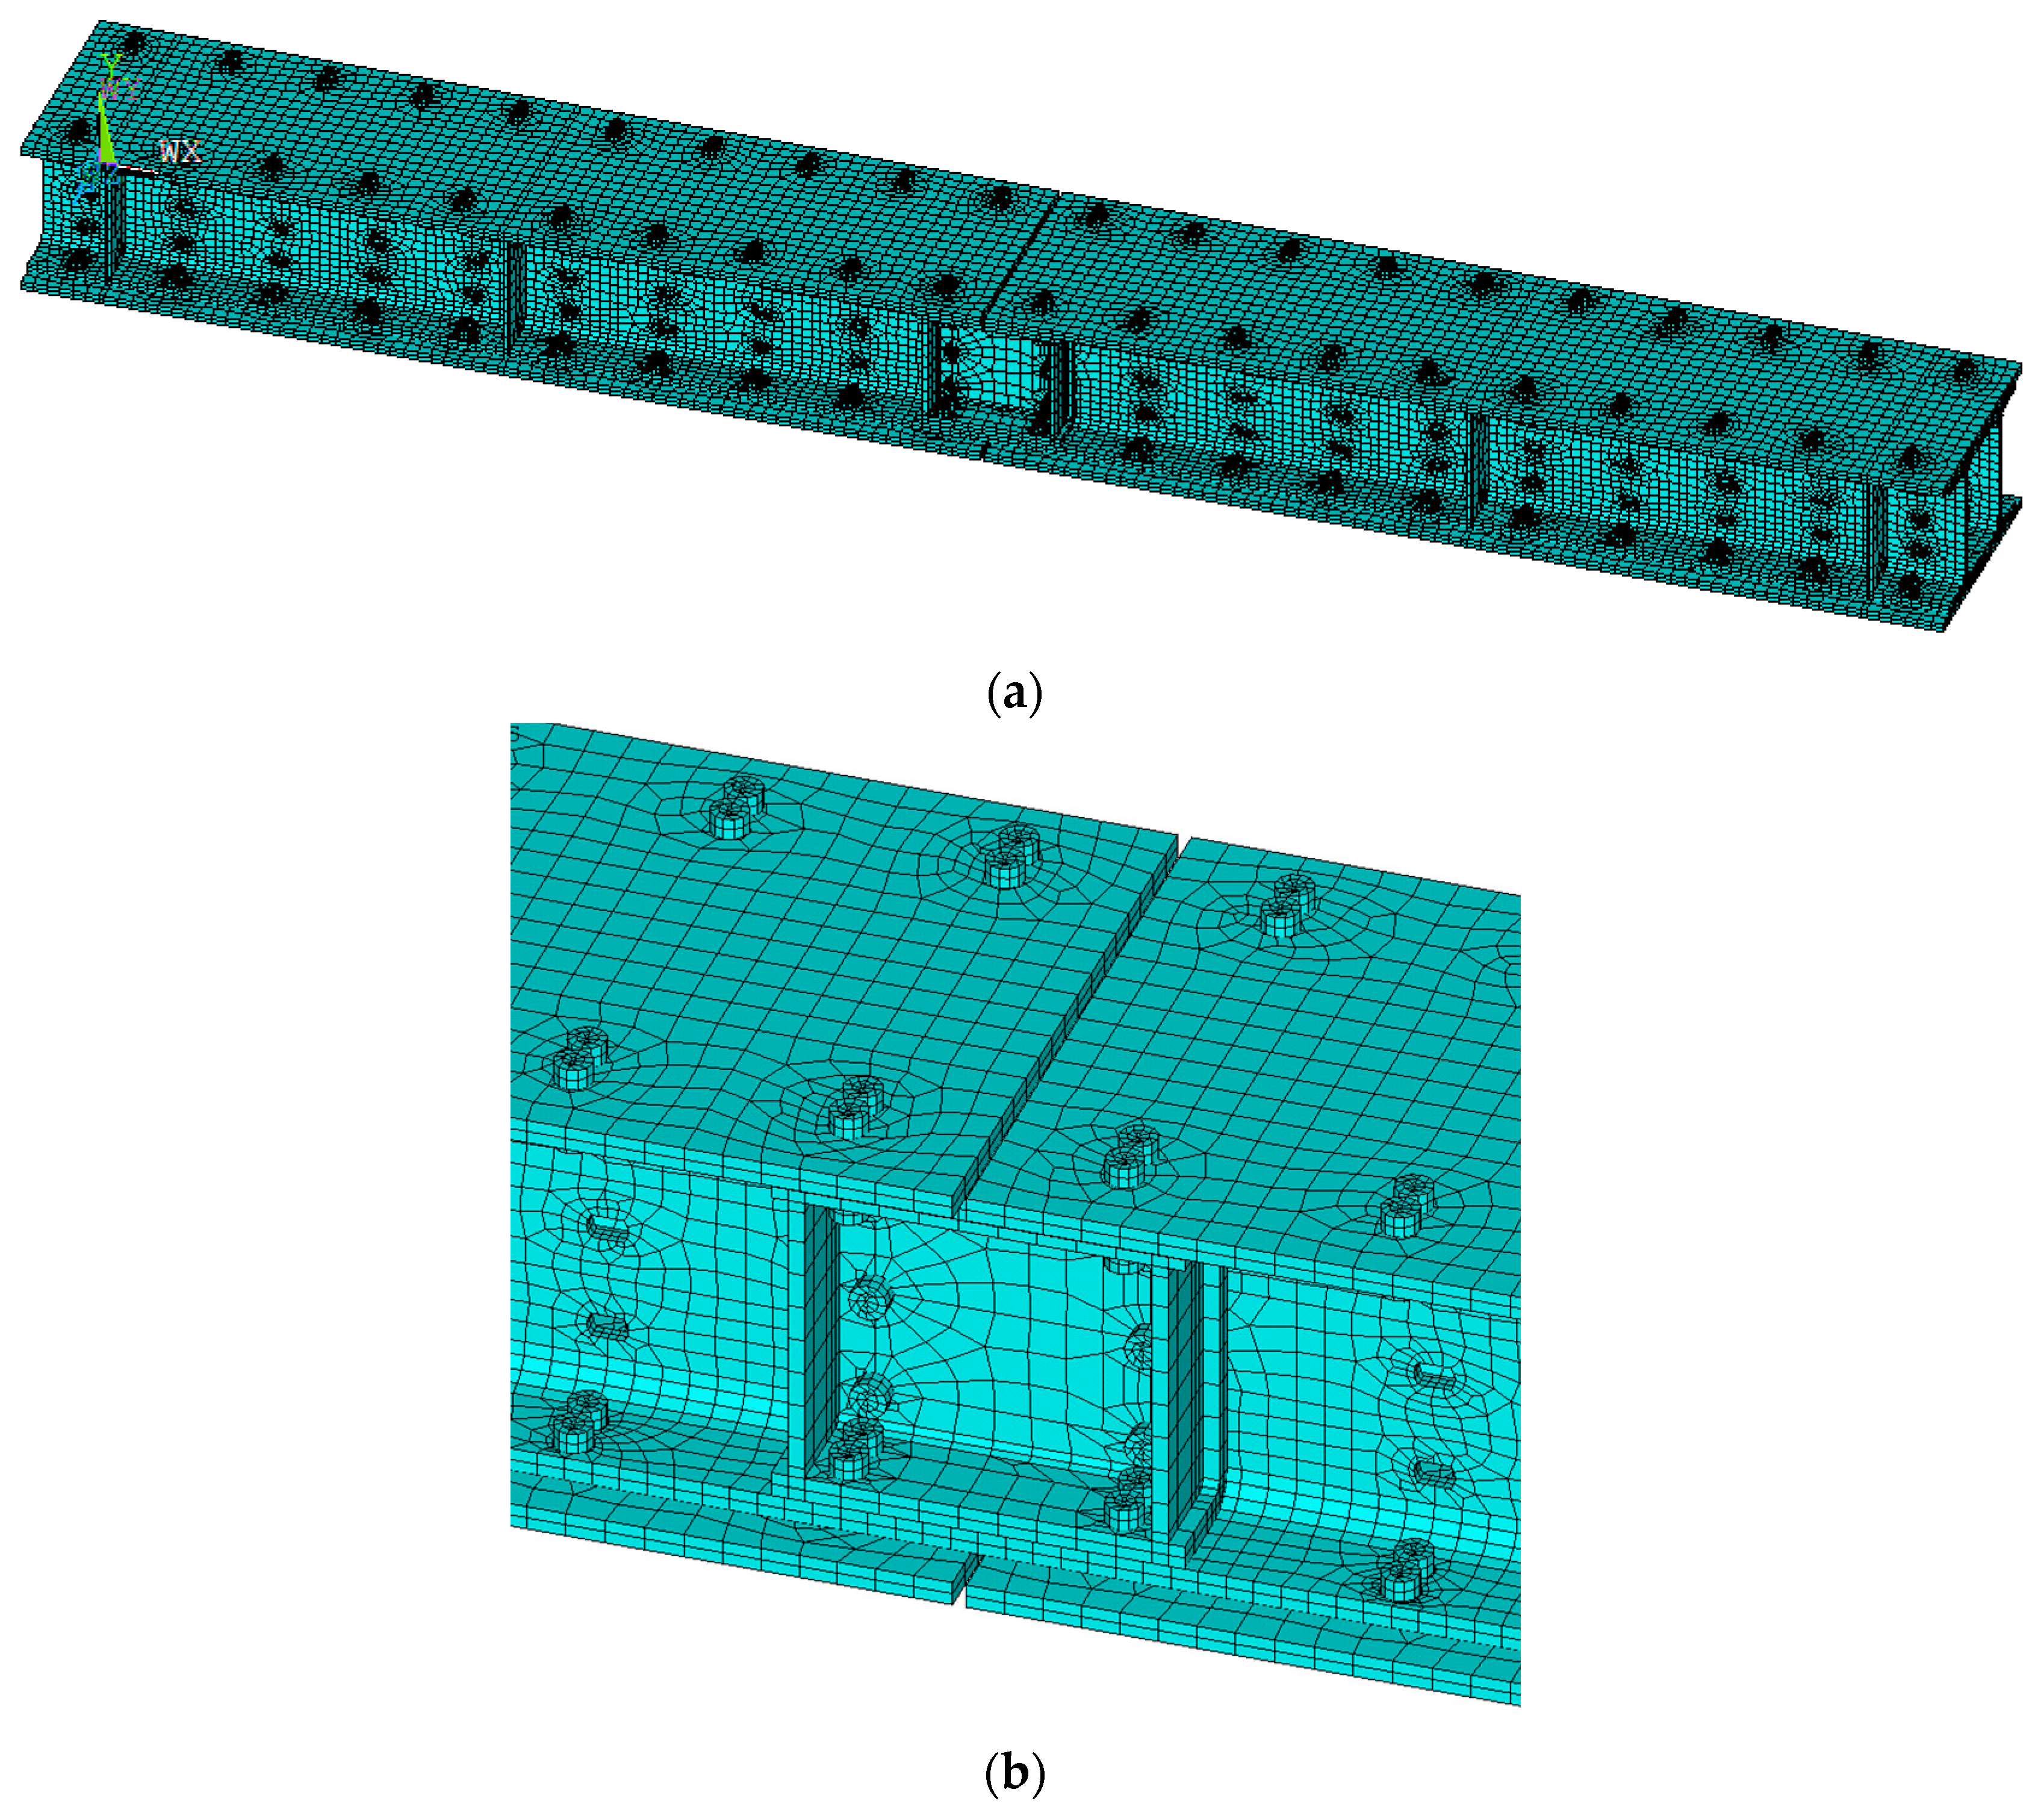
The double-slab HM150 steel sections, connection plates, stiffening plates, and bolts are modelled using solid elements (The type is Solid-Brick-10-node-185). According to the boundary conditions of the simply supported beam model, the bottom nodes of one end of the model are constrained in the x, y and z directions of the translational displacement, and the bottom nodes of the other end of the model are constrained in the y, and z directions of the translational displacement. Grid size selection during modelling was based on a thorough evaluation of computational accuracy and efficiency. Compared with free partitioning, mapping partitioning has higher computational accuracy and better convergence. Therefore, all specimens were processed with mapping partitioning methods following consistent meshing principles. The element dimensions for double-slab HM150 steel sections, connection plates, and stiffening plates are set to 10 mm. To ensure computational precision, mesh refinement was applied to bolt holes, chamfered edges, and web flanges. M8 bolt elements are sized at 5 mm. Taking SJ-B0-Hnone-J1 as an example, the finite element mesh is divided as shown in Figure 11.
The contact surfaces between HM150 steel sections and connection plates, stiffened connection plates, bolts with HM150 steel sections, connection plates, stiffened connection plates, and bolt shanks with the inner walls of bolt holes in HM150 steel sections, connection plates, and stiffened connection plates are configured as Standard Contact (Standard Contact is usually referred to as the use of contact pairs to simulate interactions between surfaces. A contact pair consists of a contact unit and a target unit.). Contact surfaces utilise conta174 contact units, while target surfaces employ targe170 contact units. The definition principle of the contact surface and the target surface is: the large area and high stiffness are the target surface, and the small area and low stiffness are the contact surface. Contact stiffness is set to 0.1, and penetration coefficients are uniformly set to 0.01. All contact surfaces maintain a slip resistance coefficient of 0.35.
For different working conditions, the corresponding simulation data are extracted from the respective stress states for analysis, with automatic time increment settings selected for the substeps. The first analysis step applies the boundary conditions and the initial bolt pre-tension force. The second analysis step applies the full bolt pre-tension force. The third analysis step locks the bolt pre-tension force and applies the external load. All substeps in the analysis employ automatic time increment settings, with displacement serving as the convergence criterion. The analysis continues until significant element deformation occurs and numerical convergence is lost, at which point the corresponding load is identified as the ultimate bending moment capacity of the specimen.

3.2. Quantitative Comparison of Numerical Simulation and Experimental Results

According to JGJ82-2011 ‘Technical Code for High-Strength Bolt Connections in Steel Structures’ [32], a 16 kN preload is applied to Grade 8.8 M8 high-strength bolts. During numerical analysis, a stepwise loading method was used to simulate specimen deformation and stress changes. Simulation data for various loading conditions were extracted for analysis, with automatic time increment settings selected for sub-load steps. Initially, boundary constraints and preliminary bolt preload were applied. In the subsequent phase, full bolt preload was implemented, followed by preload locking and loading in the third step. Adhering to the boundary constraint methodology of the simply supported beam model, Mass21 elements were coupled to exert bending moments in the xy-plane at both end face nodes of the specimen until significant deformation occurred. If convergence was not achieved, the load step was deemed the specimen’s ultimate bending moment capacity.
The test results for the four simulated specimens were obtained using ANSYS finite element software and are detailed in Table 5. Additionally, Table 6 compares the ultimate bending moment and maximum displacement in the y-direction from the test results.
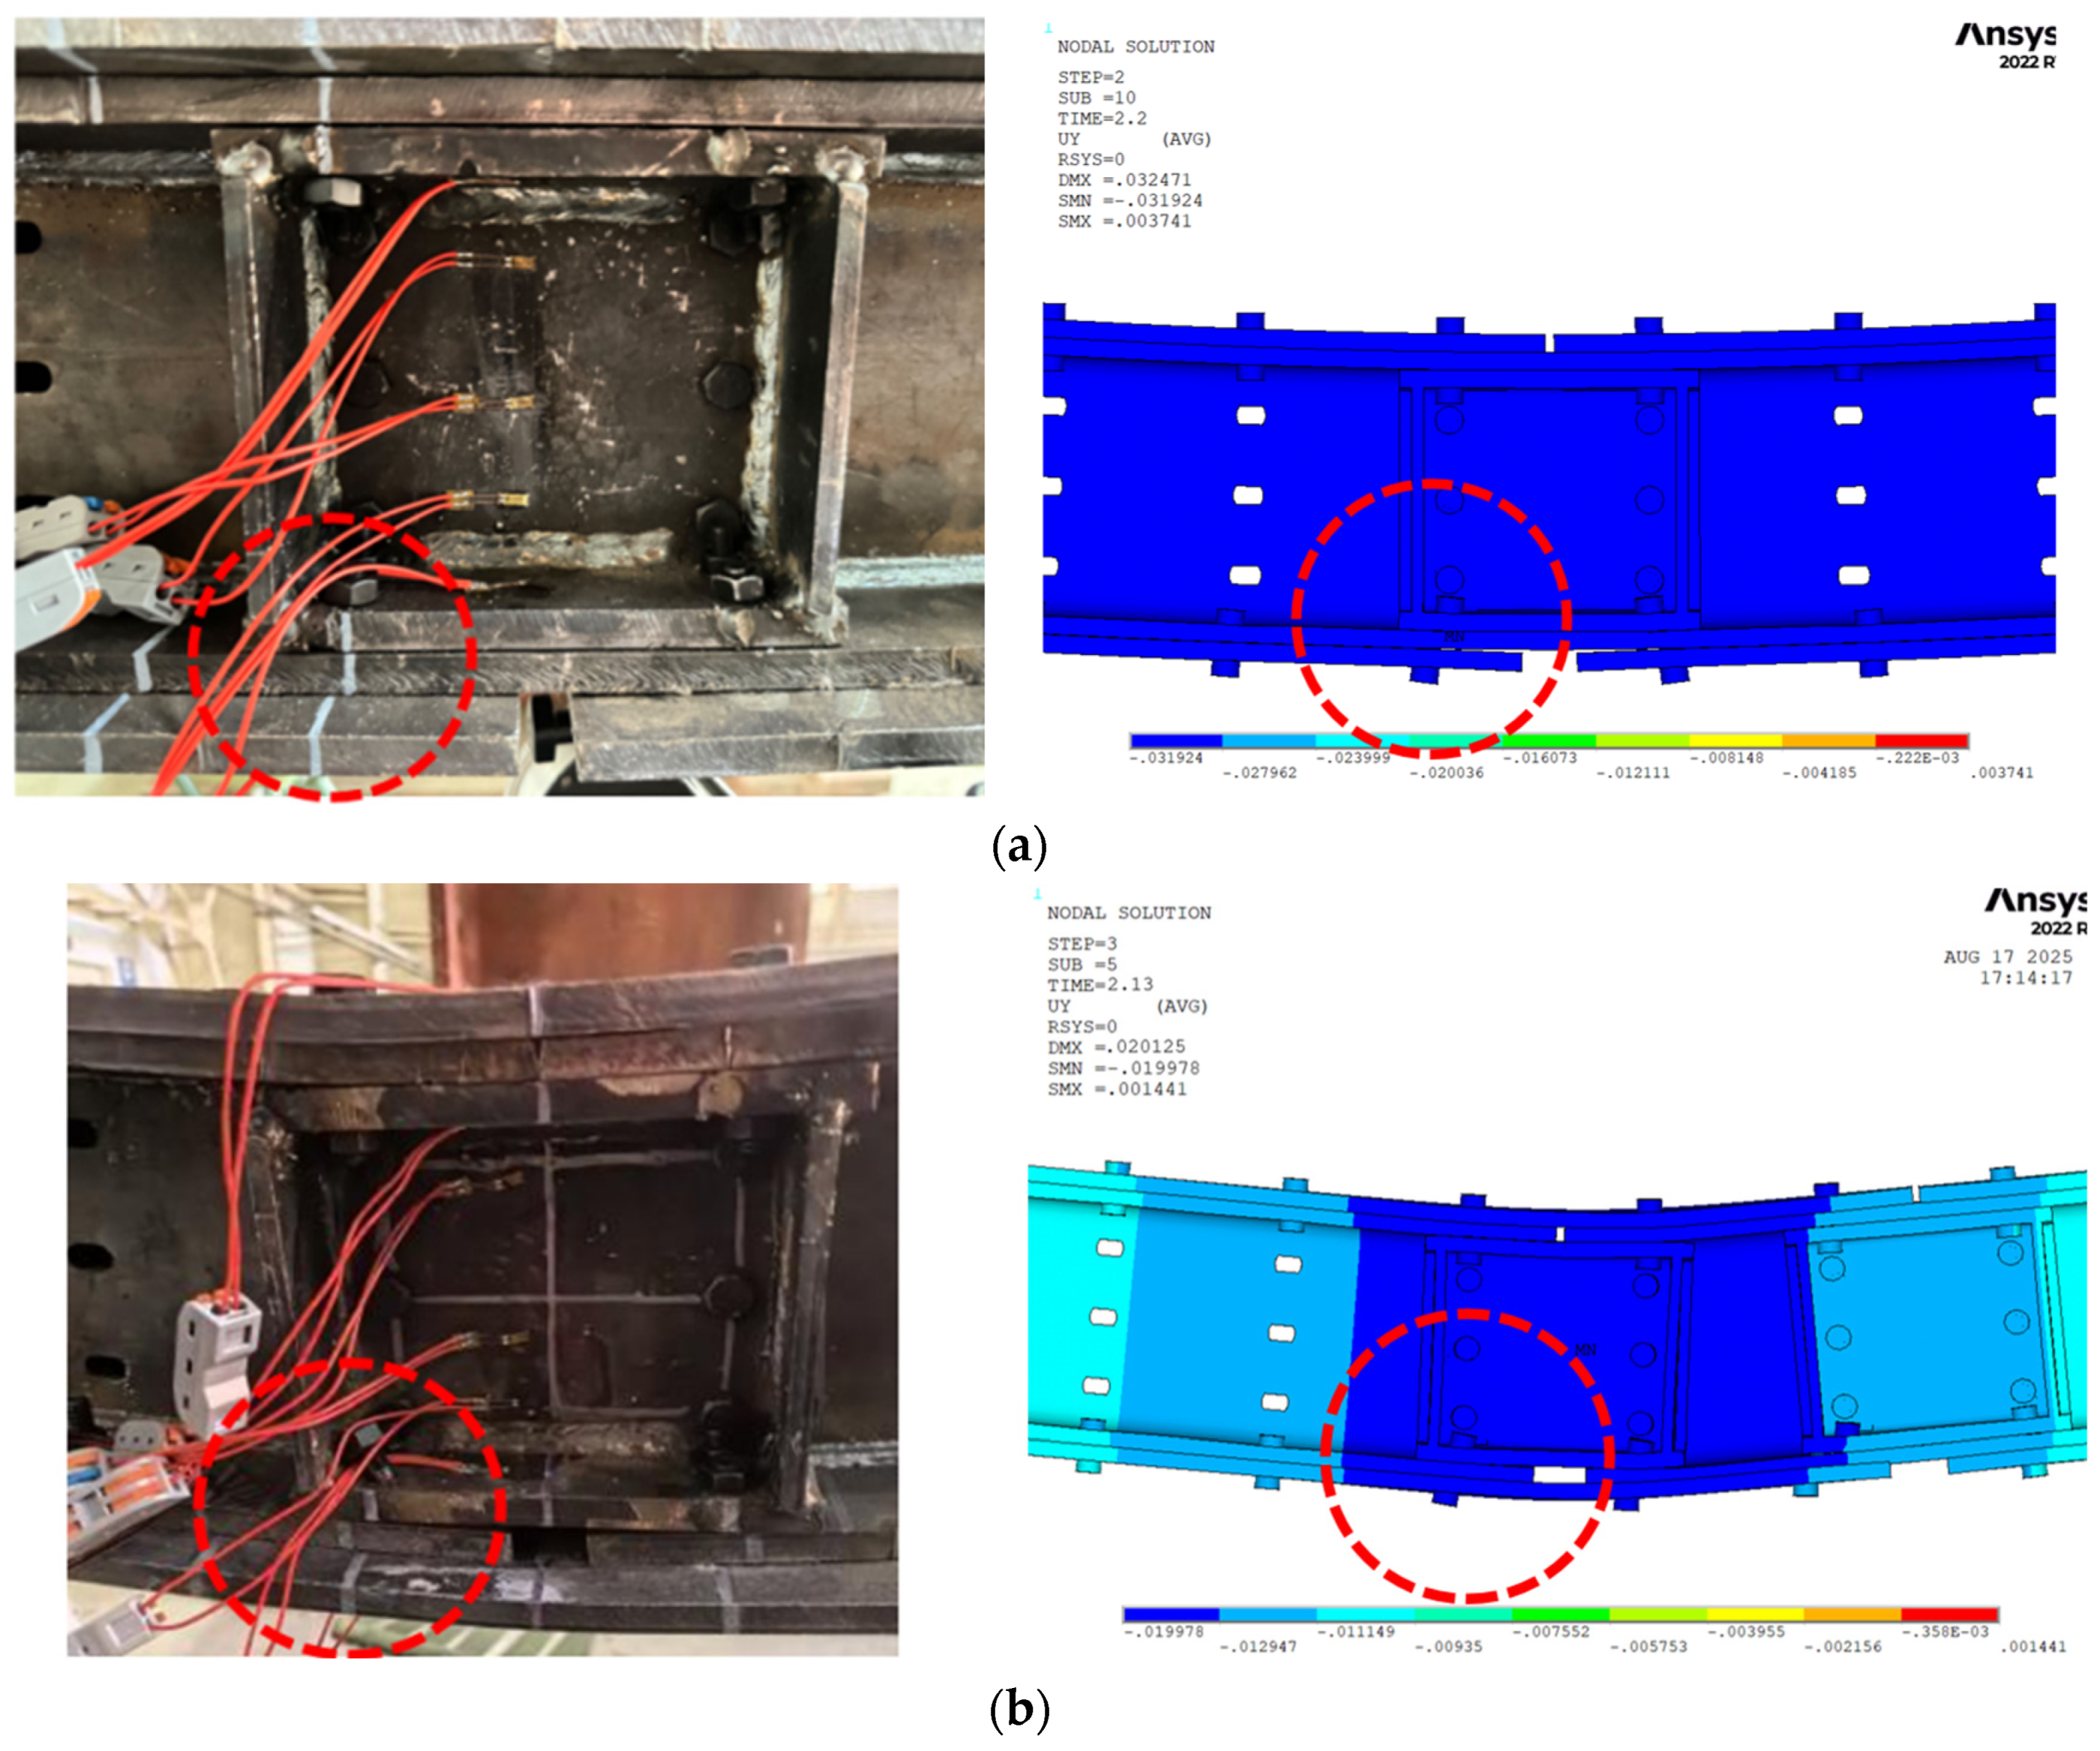
A comparison between Table 4 and Table 5 reveals that both FEA (Finite Element Analysis) and experimental results exhibited the same failure mode: fracture of the HSFG bolts. Figure 12 presents a comparative analysis of this failure mode. Furthermore, analysis of Table 6 and Figure 13 indicates that the load–midspan deflection curves from the ANSYS numerical simulations for the prefabricated H-shaped steel beams closely align with the experimental results. The average reduction in ultimate bending moment was 2.293%, and the average reduction in maximum y-direction displacement was 4.593%. The simulated ultimate bending moment exhibited a maximum deviation of 3.71% from the experimental value, whereas the y-direction displacement showed a maximum discrepancy of 8.26%. Bolt slippage within the slotted holes of the H-shaped steel components was identified as a potential factor contributing to the variation in ultimate midspan deflection. The ANSYS finite element simulation was unable to precisely replicate the x-direction displacement along the length of the slotted holes. Consequently, the physical tests recorded slightly higher ultimate midspan deflections compared to the numerical analysis.
Overall, the experimental and numerical simulation results were in good agreement, indicating that the ANSYS model developed in this study closely aligns with the mechanical tests and accurately reflects the mechanical behaviour of splice joints in prefabricated steel waling beams. Although minor discrepancies were observed, they remained within acceptable limits when considering inherent factors in physical testing, such as material inhomogeneity, manufacturing tolerances, and measurement errors. Therefore, this finite element model is validated as a reliable representation of the mechanical performance of splice joints in prefabricated H-shaped steel beams and is suitable for further parametric studies.

4. Deflection Calculation at Splice Joints

4.1. Single Splice Joint Deflection

4.1.1. Stiffness Characterisation and Classification

To investigate the connection characteristics of single-splice-joint specimens, this study extends the methodology for determining the initial rotational stiffness at beam-to-beam splice joints. This extension builds upon the initial rotational stiffness calculation theory from the European EC3 (European Council on Computing in Construction) code [33], incorporating the rotation angles of joint components along their axes. For specimens featuring mid-span beam splice joints, the relative joint rotation angle is primarily governed by flexural, shear, and axial deformations. However, the effects of shear and axial deformations on the joint rotation angle are comparatively minor relative to flexural deformation [34]. Consequently, this study focuses exclusively on rotation induced by flexural deformation. Figure 14 illustrates the deformation pattern at the mid-span joint under pure bending.
In the finite element analysis of pure bending effects, nodal deformation comprises both bending deformation components and bolt-induced relative slip components. Accordingly, we extract the x-direction displacements at critical nodes (where connecting plates meet HM150 steel flange centrelines) and integrate this data with Figure 13 to derive the corner calculation formula for single-splice joints under pure bending conditions, as presented in Equation (3).
θ j = Δ L , X Δ L , S h Z + Δ R , X Δ R , S h Z ,
In Equation (3), θj represents the relative axial rotation angle at the splice joint (measured in mm). ΔL,X and ΔR,X denote the x-direction displacements of the lower flange centrelines of the left and right H-shaped steel connection plates (in mm), respectively, while ΔL,S and ΔR,S correspond to the x-direction displacements of the upper flange centrelines (in mm). The variable hz signifies the vertical distance between the upper and lower flange centrelines at the splice joint (in mm). Specifically, for connection plate nodes, this vertical distance is defined as hzz, and for H-shaped steel splice joints, it is similarly measured as hz.
Table 3 in Ref. [22] reports the failure bending moment (Mu) of specimen BC9-HL15 × 9 as 175.12 kN·m, designated as the plastic ultimate bending moment (Mp). The flexural rigidity (EIb) for the same specimen, from Table 4 of Ref. [22], is 7835 kN·m2. With a span (lb) of 1.995 m, the plastic ultimate rotation (θp) is calculated using Equation (4), resulting in θp = 0.0446 rad for specimen BC9-HL15 × 9.
θ u = M p E I b / l b ,
M ¯ = M / M p ,   θ ¯ = θ / θ p ,
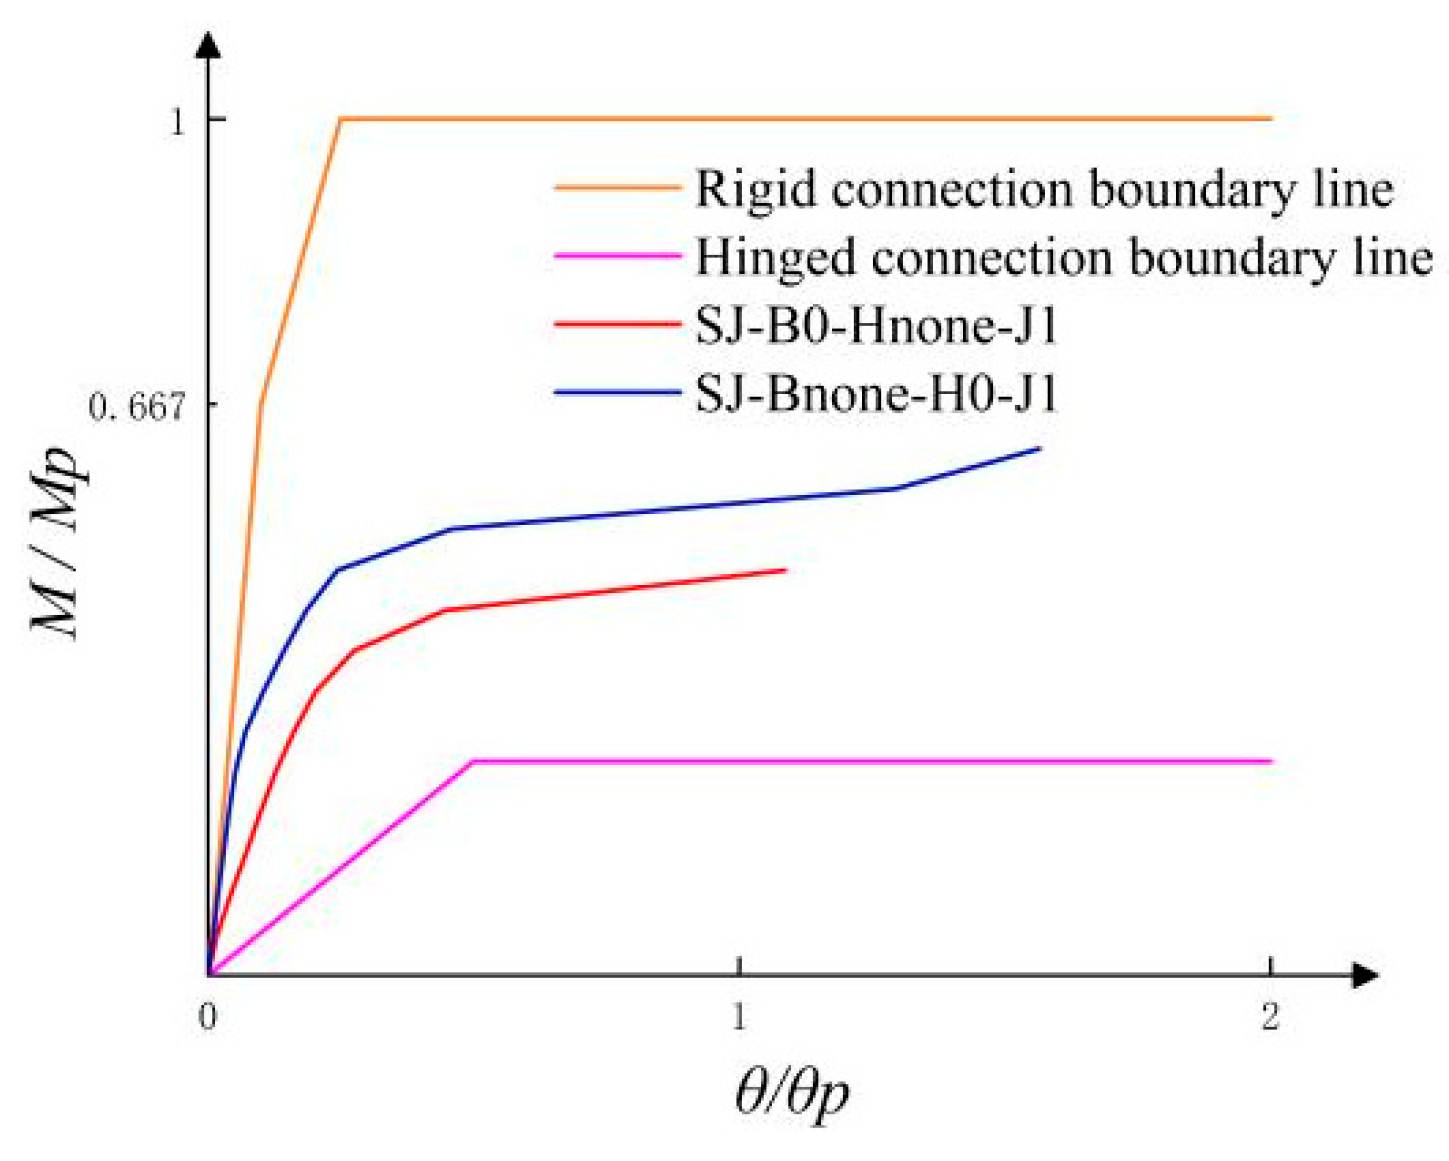
By applying Equations (3)–(5), we derived the bending moment-to-rotation ratio curve for the single-shear joint specimen. Following EC3 code specifications for stiffness boundaries between non-slip rigid frames and pinned joints, we categorised the stiffness characteristics of the two joint specimen types as rigid or pinned, as displayed in Figure 15.
Figure 15 indicates that the bending moment-to-angle ratio curves of both single-shear joint specimens lie between the joint boundary line and the rigid joint boundary line, confirming that both types of joints are semi-rigid. Since all specimens fail joints under pure bending loading, the ultimate bending moment (Mu) is designated as the plastic limit bending moment (Mp) for joint load-bearing capacity. θp denotes the joint angle corresponding to the plastic bending moment Mp, whereas (2/3)Mu represents the elastic bending moment Mk [35], corresponding to the joint angle θk at this moment. The initial rotational stiffness Sj of the joint subjected to pure bending loading is detailed in Table 7.

4.1.2. Deflection Calculation Formulas

It is posited that the deflection of the specimen comprises two additive components: (1) deflection induced by the bending moment, assuming no rotation at the splice joint; and (2) deflection arising from the rotation of the splice joint, as depicted in Figure 16.
Within the range 0 ≤ MMy, the specimen remains in the elastic deformation phase. During bending, each bolted and assembled joint is treated as rigid. The deflection of a simply supported beam under pure bending is evaluated via the graphical method, with the bending stiffness inversely calculated using Equation (6).
ω = M z l 4 E I E I = M z l 4 ω ,
In Equation (6), Mz denotes the bending moment during the specimen’s elastic phase (N·mm); I signifies the moment of inertia relative to the applied force direction (mm4); l represents the span of the specimen (mm); and ω denotes the displacement in the y-direction at the mid-span node of the specimen (mm).
Utilising Equation (6), the bending stiffness of the BC9-HL15 × 9 specimen is determined to be 7835 kN·m2. Subsequently, by presuming that the splice joints remain non-rotational, the deflection induced by the bending moment is described by Equation (7).
ω 1 ( x , P a ) = P x 3 a ( L a ) x 2 6 E I 0 x < a   P a ( L x ) 2 L x x 2 a 2 3 E I L a x L a   P ( L x ) 3 a ( L a ) ( L x ) 2 6 E I L a < x L   ,
In Equation (7), P denotes the symmetrically applied load (kN); a denotes the distance from the load to the left support (mm); x represents the distance from the calculated deflection node to the left support of the specimen (mm); and L indicates the span of the specimen (mm).
The transverse mid-bend calculation formula is presented below:
ω 1 ( L 2 , M ) = M ( 3 L 2 4 a 2 ) 24 E I ,
By employing the initial rotational stiffness (Sj,ini) of the node under pure bending, the beam deflection due to node rotation is described by Equation (9).
ω 2 ( x , M ) = M x 2 S j , i n i 0 x L 2 M ( L x ) 2 S j , i n i x > L 2 ,
Consequently, the final y-direction bending deformation of the pure bending test specimen with a single splice joint is defined by Equation (10).
ω y = ω 1 x , M + ω 2 x , M ,
Initial rotational stiffness values from Table 3 were incorporated with the geometric and material parameters of each single-splice-joint specimen. The resulting maximum mid-span deflection under the elastic-stage bending moment (My) for these specimens is shown in Table 8.
As illustrated in Table 8, for specimens with a single splice joint, the calculated maximum y-direction deflection at mid-span under the elastic-stage bending moment (My) using Equation (10) deviates by less than 10% from the finite element model data. This close agreement between the calculated values and finite element simulation results confirms the validity of Equation (10).
However, the deflection calculations exhibit a relatively larger discrepancy for the H-shaped steel splice joint. This difference is due to component slip in the numerical simulation, not accurately reflecting actual conditions. Such deviation introduces minor errors in calculating the joint rotation angle based on slip magnitude, thereby impacting the accuracy of the initial rotational stiffness for the H-shaped steel splice joint.

4.2. Deflection Calculation in Double-Splice-Joint Specimens

Double-splice-joint specimens experience bending moments and shear forces caused by component slippage between their two joints, leading to complex stress conditions that are not easily calculated using the initial rotational stiffness of the assembly joint. To formulate a deflection calculation for the elastic deformation stage in dual-node specimens, rotational spring joints are introduced to simulate the adjusted rotational stiffness of assembly joints. Here, KS,G denotes the rotational stiffness of HM150 steel bar assembly joints during the bolt friction-bearing stage; KE,G represents the rotational stiffness during the bolt slip stage; and KY,G indicates the rotational stiffness in the coordinated component loading stage. Similarly, KS,B refers to the rotational stiffness of connection plate assembly joints in the bolt friction-bearing stage; KE,B signifies the rotational stiffness during the bolt slip stage; and KY,B represents the rotational stiffness in the coordinated component loading stage. The mechanical model is illustrated in Figure 17.
Under bending moments, the specimen’s deflection consists of two components: (1) deflection attributable to the bending moment without splice joint rotation, and (2) deflection resulting from splice joint rotation.
For bending moments in the range (0 ≤ MMy), the specimen remains in the elastic deformation stage. Under the action of bending moments, all bolted connection nodes and assembly joints are considered rigid. Using the virtual work method to determine the deflection of a simply supported beam under pure bending, the deflection formula for bending moments without rotational movement at assembly joints remains the same as Equation (7). When 0 ≤ MMs, the specimen enters the bolt friction compression stage. The deflection deformation caused by assembly joints is described by Equation (11),
ω 3 x , M = M x 2 K S , G 0 < x L 2 M L 4 K S , G + M K S , B c L × L 2 + c 2 M L 4 K S , G c × x L 2 L 2 < x < L 2 + c 0 M M s M K S , B × L x L × c + L 2 L 2 + c x L ,
where c denotes the distance between the double splicing points.
For Ms < MMe, the specimen transitions to the bolt slip phase, and the deflection deformation ω4(x, M) from the splice joint replaces the equivalent rotational stiffness values KS,G, and KS,B in Equation (10) for the bolt friction-bearing phase with KE,G and KE,B corresponding to the bolt slip phase.
When Me < MMy, the specimen enters the component collaborative force-bearing stage. Here, the deflection deformation ω5(x, M) from the splice joint substitutes the equivalent rotational stiffness of the joints in the bolt friction-bearing stage (KE,G and KE,B) in Equation (11) with the equivalent rotational stiffness of the joints in the component collaborative force-bearing stage (KY,G and KY,B).
In summary, the deflection under bending moment in the bolt friction compression stage, bolt slip stage, and component collaborative force-bearing stage is considered a superposition, and the integrated beam deflection deformation is expressed by Equation (12).
ω y = ω 1 x , M + ω 3 x , M ω 1 x , M + ω 3 x , M s + ω 4 x , M M s ω 1 x , M + ω 3 x , M s + ω 4 x , M e M s + ω 5 x , M M e   0 < M M s M s < M M e M e < M M y
Based on finite element calculations and analysis results, the deflection deformation of the double splice joints specimen under a bending moment of 0 ≤ MMy is used to reverse-calculate the rotational stiffness of the specimen’s HM150 steel splice joints and the connection plate splice joints using Equation (12), as shown in Table 9.
As presented in Table 9, the specimen exhibited relative rotation at the splice joints during the elastic deformation stage. As the system transitions from the bolt compression friction phase to the bolt slip phase, the converted rotational stiffness of the nodes experiences a substantial reduction. Upon completion of the bolt slip and the initiation of the component-coordinated loading phase, stiffness rises, yet only reaches roughly 46–63% of the initial level observed during the bolt compression friction stage. Comparative analysis of KS,B, KE,B, and KY,B data between SJ-B200-H0-J2 and SJ-B300-H0-J2 specimens reveals that decreasing the spacing between connection plate splice joints and HM150 steel bar splice joints from 200 mm to 30 mm significantly improves the specimens’ rotational stiffness.
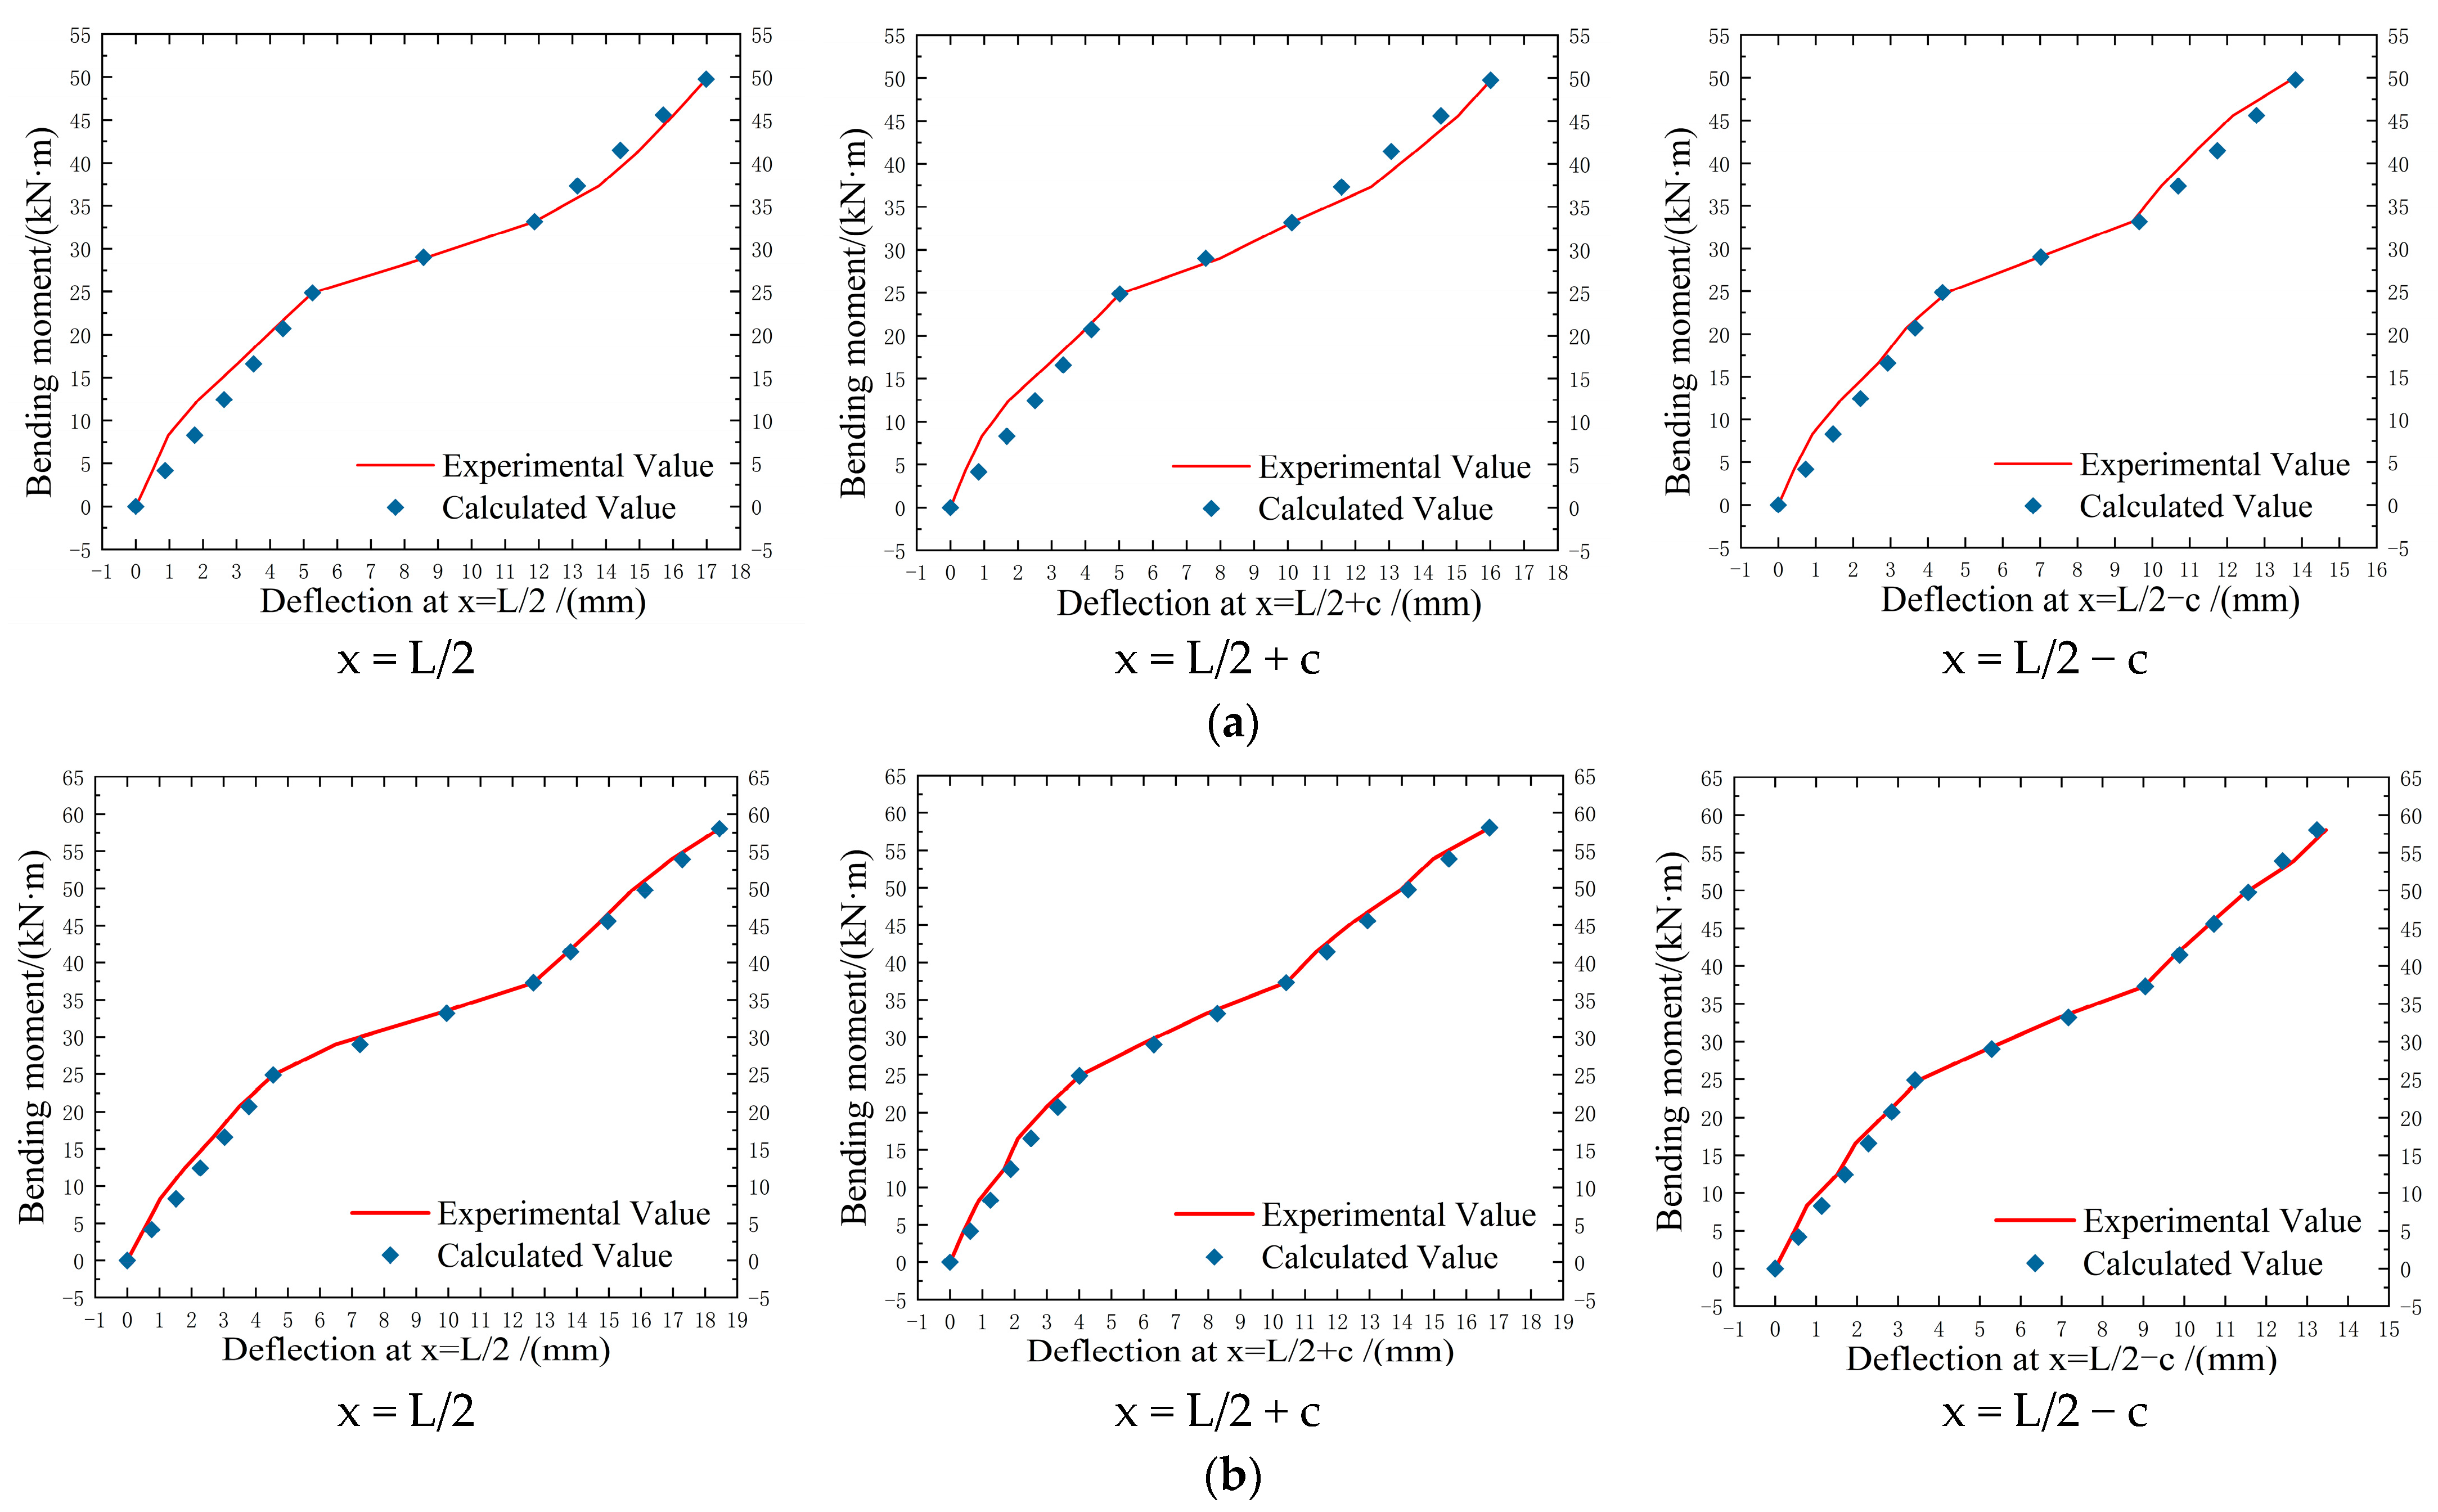
Using the converted rotational stiffness data from Table 9, deflection deformation values at each deformation stage under various specimen loads were computed via Equation (10) and compared to experimental data presented in Figure 18. The values computed using Equation (10) closely matched the experimental data, validating its reliability.

5. Conclusions

Through four-point bending tests and numerical simulations on four different configurations of prefabricated H-shaped steel beam specimens with various splice joint arrangements, the following conclusions are drawn:
(1)
Mechanical testing of prefabricated H-shaped steel beams was performed alongside finite element modelling to validate the results. The close correspondence between experimental outcomes and simulation data across all specimens confirms the reliability of the testing methodology. This demonstrates the capability of the tests to accurately characterise the mechanical behaviour of prefabricated H-shaped steel beams under actual loading conditions, providing a robust analytical tool for subsequent design optimisation.
(2)
Specimens featuring double splice joints demonstrate a substantial reduction in bending load-bearing capacity and stiffness compared to those with single splice joints. Using the single H-shaped steel assembly as a reference, the ultimate bending load-bearing capacity decreases by approximately 24.07% when employing single connection plates. When both splice joints are present simultaneously, the specimen’s ultimate bending load-bearing capacity declines by 39.89% to 51.88%. Notably, specimens with two splice joints spaced 200 mm apart (SJ-B200-H0-J2) exhibit the lowest bending load-bearing capacity. Consequently, engineering practices should avoid positioning two splice joints in adjacent or overlapping locations. As the distance between the two splice joints increases, the specimen’s bending load-bearing capacity markedly improves.
(3)
During testing, the double-shear joint specimen undergoes four deformation phases under load: 1. Bolt friction compression stage; 2. Bolt slip stage; 3. Component coordinated stress stage; and 4. Yield stage. Under pure bending loads, components at the joint assembly site fail first, preventing the observation of a significant plastic deformation phase in the specimen.
(4)
Both connection plate splice joints and HM150 steel section splice joints are classified as semi-rigid joints. Based on experimental data and numerical simulation results, corner calculation formulas for single splice joints under pure bending loads that account for angular deformation effects were developed, along with deflection calculation formulas. Additionally, rotational spring nodes were introduced to simulate the converted rotational stiffness of splice joints. Furthermore, a deflection calculation formula for double splice joint specimens during elastic deformation stages was proposed. All calculated values aligned with the experimental results.
Although this study has revealed the optimisation and mechanical behaviour analysis of splice joints in prefabricated H-shaped steel beams, certain limitations persist, which also indicate directions for future improvements. Due to constraints in time and experimental equipment, the tests employed a four-point bending loading method. However, under real-world conditions, structural members are subjected to complex stresses. Investigating the mechanical behaviour analysis of splice joints in prefabricated H-shaped steel beams under uniformly distributed loads or more complicated scenarios will be a focus of future research. Furthermore, regarding the design of reinforcement components at the splice joints, subsequent studies will move beyond the limitations of stiffening connection plates and explore innovative designs to achieve enhanced performance. This issue will also be continuously examined in future work.
Currently, the composite steel beams investigated in this study are applied in China as prefabricated steel walling systems for foundation pit support. For future work, it is intended to systematically summarise key aspects of the steel beams, including the dimensional specifications of components such as bolts, calculation formulas for performance verification of the composite beams, and construction procedures. This effort aims to establish specialised technical specifications and construction standards, thereby enabling engineers to efficiently and accurately conduct design, verification, and preparation of specialised project plans.

Author Contributions

Conceptualization, X.Z. and D.F.; methodology, X.Z., J.L. and S.F.; software, J.L.,D.F. and S.Y.; data curation, J.L.; data recording, D.F. and S.Y.; preparation of the experiments, J.L. and S.Y.; writing—original draft preparation, J.L.; writing—review and editing, X.Z. and S.F.; experiment, J.L., D.F. and S.Y.; funding acquisition, X.Z. and S.F. All authors have read and agreed to the published version of the manuscript.

Funding

This research is supported by the Shandong Provincial Natural Science Foundation (ZR2024QE360). The supports are gratefully acknowledged.

Data Availability Statement

Data are not publicly available. The data may be made available upon request from the corresponding author.

Conflicts of Interest

Author Dawei Fan was employed by the company Qihang (Shandong) Investment and Construction Group Co., Ltd. Author Shenlu Yu was employed by the company Shandong High-Speed Energy Development Co., Ltd. The remaining authors declare that the research was conducted in the absence of any commercial or financial relationships that could be construed as a potential conflict of interest.

Abbreviations

The following abbreviations are used in this manuscript:
HSFGHigh-Strength Friction Grip
FEAFinite Element Analysis
EC3European Council on Computing in Construction

References

  1. Khan, K.; Chen, Z.; Liu, J.; Javed, K. State-of-the-Art on Technological Developments and Adaptability of Prefabricated Industrial Steel Buildings. Appl. Sci. 2023, 13, 685. [Google Scholar] [CrossRef]
  2. Huang, Z.; Zhou, H.; Tang, H.; Zhang, D.; Zhao, Y.; Yu, J.; Luo, M.; Wang, Y.; Lin, B. Process-based evaluation of carbon emissions from the on-site construction of prefabricated steel structures: A case study of a multistory data center in China. J. Clean. Prod. 2024, 439, 140579. [Google Scholar] [CrossRef]
  3. Liu, J.; Liu, H.; Liu, Y. A Sustainability-Oriented Framework for Life Cycle Environmental Cost Accounting and Carbon Financial Optimization in Prefabricated Steel Structures. Sustainability 2025, 17, 4296. [Google Scholar] [CrossRef]
  4. Habib, A.; Al Houri, A.; Alibrahim, B.; Habib, M. Behavior and sustainability benefits of modular steel buildings. Int. J. Sustain. Eng. 2025, 18, 2459715. [Google Scholar] [CrossRef]
  5. Zhang, X.; Nie, Y.; Qian, K.; Xie, X.; Zhao, M.; Zhao, Z.; Zheng, X.Y. Experimental Investigation of the Seismic Behavior of a Multi-Story Steel Modular Building Using Shaking Table Tests. Buildings 2025, 15, 2661. [Google Scholar] [CrossRef]
  6. Wang, H.; Zhu, W.; Du, Y.; Zhang, W.; Zhou, H.; Wang, R.; Li, W.; Zhang, P.; Huang, X.; Cao, Z.; et al. Application of BIM Collaborative Design Technology in Intelligent Buildings for Prefabricated Steel Structures. Procedia Comput. Sci. 2024, 247, 310–319. [Google Scholar] [CrossRef]
  7. Lu, Y.; Liang, S.; Zhu, X.; Wu, D.; Yang, J.; Wang, W.; Sun, B. Eccentric compression behaviour of precast H-shaped steel support in foundation pit engineering. J. Constr. Steel Res. 2025, 234, 109740. [Google Scholar] [CrossRef]
  8. Lu, Y.; Liang, S.; Zhu, X.; Sun, B.; Wang, W.; Chen, Y.; Ji, X. Axial compressive stability of precast H-shaped steel support in foundation pit engineering. J. Constr. Steel Res. 2025, 230, 109540. [Google Scholar] [CrossRef]
  9. SEI/ASCE 8-02; Specification for the Design of Cold-Formed Stainless Steel Structural Members. American Society of Civil Engineers (ASCE): Reston, VA, USA, 2002. Available online: https://ascelibrary.org/doi/pdf/10.1061/9780784405567.fm (accessed on 12 June 2024).
  10. Wu, X.; Wang, Y.; Ji, S.; Liu, M.; Wang, D. Numerical study on the mechanical behaviors of a new type of steel shear-connection horizontal joint in prefabricated shear wall structure. Buildings 2023, 13, 3000. [Google Scholar] [CrossRef]
  11. Chu, Y.; Zhang, H.; Gong, Y. Experimental study on shear performance of the new steel-bolt vertical joint. Structures 2024, 64, 106554. [Google Scholar] [CrossRef]
  12. Xie, J.; Zhang, W. Numerical analysis on steel bracing members with bolted gusset plate connections. J. Constr. Steel Res. 2024, 222, 108960. [Google Scholar] [CrossRef]
  13. Li, J.; Mou, B.; Wang, Z. Cyclic behavior of column-to-column connections in novel prefabricated H-shaped steel beam to CFST column joint. J. Constr. Steel Res. 2023, 200, 107657. [Google Scholar] [CrossRef]
  14. Zhang, W.; Xie, J.; Liu, Y.; Ding, Y. Experimental investigation on steel bracing members with bolted gusset plate connections. J. Build. Eng. 2023, 76, 107133. [Google Scholar] [CrossRef]
  15. Yin, L.; Niu, Y.; Quan, G.; Gao, H.; Ye, J. A numerical investigation of new types of bolted joints for cold-formed steel moment-resisting frame buildings. J. Build. Eng. 2023, 65, 105738. [Google Scholar] [CrossRef]
  16. Wang, Y.; Huang, Z.; An, Q. Analysis of Seismic Performance and Applicable Height of a Cooperative Modular Steel Building. Buildings 2024, 14, 678. [Google Scholar] [CrossRef]
  17. Bao, Y.; Yang, F.; Li, X.; Ma, T.; Ma, J. Numerical study on seismic performance of concrete-filled steel tube column-steel beam joints with replaceable T-type connectors. Structures 2025, 79, 109606. [Google Scholar] [CrossRef]
  18. Liu, X.; Meng, Q.; Xu, L.; Liu, Y.; Tian, X. Modular Steel Buildings Based on Self-Locking-Unlockable Connections Seismic Performance Analysis. Buildings 2025, 15, 678. [Google Scholar] [CrossRef]
  19. Xu, H.; Zhang, Y.; Yan, P.; Zhang, L.; Liu, Y.; Chen, Y.; Fu, B.; Zhou, Y. Numerical investigation on seismic performance of drilled flange connection for steel frames. Soil Dyn. Earthq. Eng. 2025, 190, 109122. [Google Scholar] [CrossRef]
  20. Feng, R.; Zhan, H.; Meng, S.; Zhu, J. Experiments on H-shaped high-strength steel beams with perforated web. Eng. Struct. 2018, 177, 374–394. [Google Scholar] [CrossRef]
  21. Feng, R.; Liu, J.; Chen, Z.; Roy, K.; Chen, B.; Lim, J.B. Numerical investigation and design rules for flexural capacities of H-section high-strength steel beams with and without web openings. Eng. Struct. 2020, 225, 111278. [Google Scholar] [CrossRef]
  22. Zhang, X.; Yu, S.; Feng, S.; Fan, D.; Zhang, F.; Cao, H. Study on the Bending Performance of Prefabricated H-Shaped Steel Beams with Different Bolt Hole Types. Buildings 2024, 14, 2988. [Google Scholar] [CrossRef]
  23. Luo, L.; Fu, H.; Zhang, Y.; Xie, X. Experimental study on the overall stability of corroded H-Shaped steel beams. Buildings 2022, 12, 1923. [Google Scholar] [CrossRef]
  24. Yu, Z.W.; Li, H.; Ho, J.C.M.; Ma, T.Y.; Bao, W.; Zhang, J.Z. Axial compressive behavior of corroded H-shaped steel columns. J. Constr. Steel Res. 2024, 218, 108726. [Google Scholar] [CrossRef]
  25. Zhao, Z.; Liu, J.; Wang, B.; Gao, Y. Post-buckling shear capacity of the corroded end panels of H-shaped steel beams. Thin-Walled Struct. 2023, 184, 110499. [Google Scholar] [CrossRef]
  26. Yuan, J.; Wang, S.; Fan, Y.; Wu, G. Data analysis of mechanical properties of steel specimens under four-point bending load. In Proceedings of the 2024 IEEE 4th International Conference on Information Technology, Big Data and Artificial Intelligence (ICIBA), Chongqing, China, 6–8 December 2024; IEEE: Piscataway, NJ, USA, 2024; Volume 4, pp. 1481–1486. [Google Scholar]
  27. Zhang, B.; Zhou, C.; Zhang, S.; Peng, Y.; Li, Y. Effects of FRP fiber orientations on four-point bending behaviour of FRP-concrete-steel tubular beams: Experimental study and modeling. Eng. Struct. 2025, 322, 119191. [Google Scholar] [CrossRef]
  28. GB/T 228. 1-2010; Metallic Materials: Tensile Testing: Part 1: Method of Test at Room Temperature. General Administration of Quality Supervision, Inspection and Quarantine of the People’s Republic of China: Beijing, China, 2012.
  29. GB/T 1041-2008; Metallic Materials—Bend Test Method. China Standards Press: Beijing, China, 2008.
  30. GB 50017-2017; Code for Design of Steel Structures. China Architecture & Building Press: Beijing, China, 2018; pp. 22–27.
  31. GB/T 1228-2006; National Technical Committee of Standardization for Fasteners, High-Strength Large Hexagon Head Bolts for Steel Structures. Standards Press of China: Beijing, China, 2006; pp. 2–4.
  32. JGJ82-2011; Technical Specification for High-Strength Bolted Connections in Steel Structures. China Architecture & Building Press: Beijing, China, 2021; pp. 8–9.
  33. BS EN 1993-1-8; 2005 Eurocode 3: Design of Steel Structures-Part 1.8: Design of Joints. European Committee for Standardization: London, UK, 2005.
  34. Shi, G.; Chen, X.; Wang, D.Y. Experimental study of a ultra-large capacityend-plate joints. J. Constr. Steel Res. 2017, 128, 354–361. [Google Scholar] [CrossRef]
  35. Guo, B.; Sun, N.; Yang, D. Research progress on calculation methods of elastic critical moment for simply supported beams. J. Shandong Jianzhu Univ. 2017, 32, 69–77. [Google Scholar]
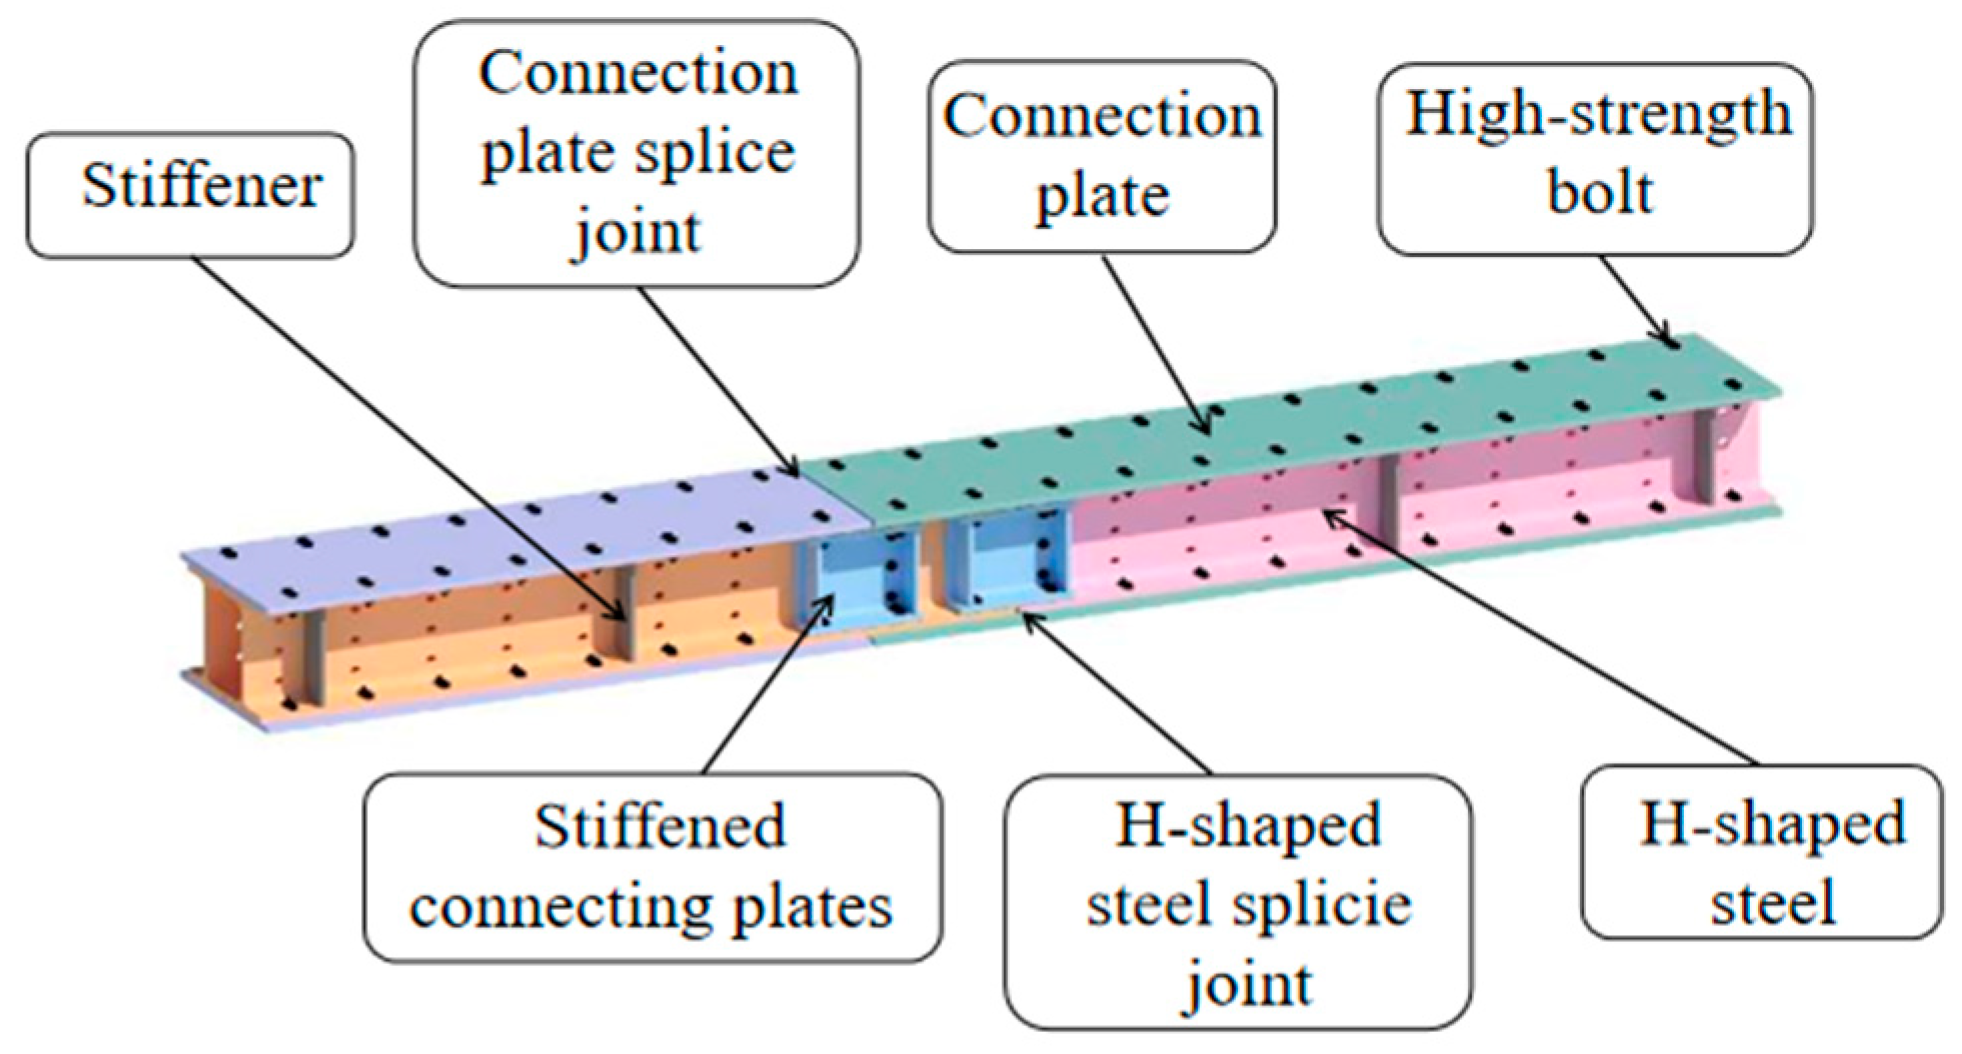
Figure 1. Schematic diagram of each component of prefabricated H-shaped steel beams.
Buildings 15 03610 g001
Figure 2. Schematic diagram of two types of splice joints of prefabricated H-shaped steel beams.
Buildings 15 03610 g002
Figure 3. Schematic diagram of each component unit and the Cartesian coordinate system.
Buildings 15 03610 g003
Figure 4. Front view and side view of each specimen of prefabricated H-shaped steel beam. (a) SJ-B0-Hnone-J1 specimen; (b) SJ-Bnone-H0-J1 specimen; (c) SJ-B200-H0-J2 specimen; (d) SJ-B300-H0-J2 specimen.
Buildings 15 03610 g004
Figure 5. Schematic of four-point bending loading test. (a) Schematic of the loading test; (b) Layout diagram of the displacement metre and overall loading test.
Buildings 15 03610 g005
Figure 6. SJ-B300-H0-J2 stress node setting diagram. (a) Side elevation; (b) section 1-1 and 3-3; (c) section 2-2.
Buildings 15 03610 g006
Figure 7. Failure of various specimens. (a) SJ-B0-Hnone-J1 specimen failure; (b) SJ-Bnone-H0-J1 specimen failure; (c) SJ-B200-H0-J2 specimen failure; (d) SJ-B300-H0-J2 specimen failure.
Buildings 15 03610 g007
Figure 8. Load–Displacement curve of the splice joint specimen. (a) Single splice joint specimen; (b) Double splice joints specimen; (c) Load-deflection curve variation law of double splice joints specimen; (d) All test specimens at the splice joints.
Buildings 15 03610 g008aBuildings 15 03610 g008b
Figure 9. SJ-B300-H0-J2 stress distribution diagram. (a) Section 1-1; (b) Section 2-2; (c) Section 3-3.
Buildings 15 03610 g009
Figure 10. Calculated model constitutive relationship diagram. (a) Steel products; (b) Bolt.
Buildings 15 03610 g010
Figure 11. Finite element model meshing. (a) SJ-B0-Hnone-J1 specimen; (b) Splice joint detail of meshing.
Buildings 15 03610 g011
Figure 12. Comparison of failure modes between ANSYS numerical simulation results and experimental results. (a) Comparison of failure modes of SJ-B0-Hnone-J1 specimens; (b) Comparison of failure modes of SJ-Bnone-H0-J1 specimens; (c) Comparison of failure modes of SJ-B200-H0-J2 specimens; (d) Comparison of failure modes of SJ-B300-H0-J2 specimens.
Buildings 15 03610 g012aBuildings 15 03610 g012b
Figure 13. Comparison of deflection curves of ANSYS numerical simulation of mid-span load. (a) SJ-B0-Hnone-J1 specimen; (b) SJ-Bnone-H0-J1 specimen; (c) SJ-B200-H0-J2 specimen; (d) SJ-B300-H0-J2 specimen.
Buildings 15 03610 g013
Figure 14. Schematic diagram of deformation mode at mid-span node of single assembly specimen. (a) Connection plate splice joint; (b) H-shaped steel splice joint.
Buildings 15 03610 g014
Figure 15. Curve of bending moment ratio and Angle ratio of single splice joints specimen.
Buildings 15 03610 g015
Figure 16. Schematic of the bending deformation of a single splice joint specimen. (a) Overall deformation; (b) Deformation under bending moment; (c) Node corner deformation.
Buildings 15 03610 g016
Figure 17. Mechanical model of a double-splice-joint specimen. (a) Rotating spring; (b) Deformation caused by rotation of splice joints.
Buildings 15 03610 g017
Figure 18. Comparison between the calculation value of Equation (9) and the simulation data. (a) SJ-B200-H0-J2 specimen; (b) SJ-B300-H0-J2 specimen.
Buildings 15 03610 g018
Table 1. Design parameters of prefabricated H-shaped steel beams.
Name of SpecimenComponent Composition
Connecting Plate/mmHM150 Steel/mm
SJ-B0-Hnone-J1B-2 × 4995 mmG-1 × 21995 mm
SJ-Bnone-H0-J1B-1 × 21995 mmG-2 × 4995 mm
SJ-B200-H0-J2B-3 × 21195 mmG-2 × 4995 mm
B-4 × 2795 mm
SJ-B300-H0-J2B-5 × 21295 mmG-2 × 4995 mm
B-6 × 2695 mm
Table 2. Design parameters of splice joints for prefabricated H-shaped steel beams.
Name of SpecimenConnecting Plate HM150 SteelFasten the Connecting Plate
Splice Joint
Settings
Distance Between Joint and Mid-Span of Specimen in mmSplice Joint
Settings
Distance Between Joint and Mid-Span of Specimen in mm
SJ-B0-Hnone-J1Set0Not Set--Set
SJ-Bnone-H0-J1Not Set--Set0Set
SJ-B200-H0-J2Set200Set0Set × 2
SJ-B300-H0-J2Set300Set0Set × 2
Note: In “SJ-B200-H0-J2”, “B200”signifies that the splice position of the connection plate is 200 mm from the specimen’s mid-span (“Bnone” indicates no splice joints on the connection plate;“B300”signifies that the splice position of the connection plate is 300 mm from the specimen’s mid-span ); “H0” signifies that the splice position of the HM150 steel section is at the specimen’s mid-span (“Hnone” indicates no splice joints on the HM150 steel section); “J2” signifies that both specimen nodes are equipped with stiffeners (“J1” indicates stiffeners are installed at the mid-span of the specimen).
Table 3. Processing dimensions of material specimens and test results of material properties.
Sample NumberSample LocationThickness/mmLength (l0)/mmYield Strength/MPaUltimate Strength/MPaModulus of Elasticity/MPaElongation
/%
HH-shaped steel910026039025520.2
BConnection plate910025539024823.7
LStiffener68024543025619.6
Table 4. Limit the bending moment and failure mode of specimens.
Name of SpecimenMaximum Bearing Capacity Bending Moment
Mp
/kN·m
SJ-Bnone-H0-J1 Ultimate Bearing Capacity Reduction Coefficient/%Maximum Bearing Capacity Bending Moment Maximum y Displacement Value/mmDestructive Patterns
SJ-B0-Hnone-J184.9724.0732.72High strength bolt fracture
SJ-Bnone-H0-J1111.92054.92High strength bolt fracture
SJ-B200-H0-J253.8651.8821.78High strength bolt breaks at the joint of the connecting plate
SJ-B300-H0-J268.3938.8925.97High strength bolt breaks at the joint of the connecting plate
Table 5. ANSYS numerical simulation results.
Name of SpecimenMaximum Bearing Capacity Bending Moment
Mp
/kN·m
SJ-Bnone-H0-J1 Ultimate Bearing Capacity Reduction Coefficient
/%
Maximum Bearing Capacity Bending Moment Maximum y Displacement Value
/mm
Destructive Patterns
SJ-B0-Hnone-J182.9023.0831.92Consistent with the experiment
SJ-Bnone-H0-J1107.77053.16Consistent with the experiment
SJ-B200-H0-J253.8650.0219.98Consistent with the experiment
SJ-B300-H0-J266.3238.4624.82Consistent with the experiment
Table 6. Comparison between ANSYS results and test results.
Name of SpecimenEnd of TestANSYS Bear Fruit Ultimate Bending Moment Reduction CoefficientMaximum Displacement Reduction Coefficient
Experimentalmaximum Bearing Capacity Bending Moment
Mp
/kN·m
The Maximum y Displacement Value of the Bearing Capacity Limit Bending Moment
y/mm
ANSYS
Maximum Bearing Capacity Bending Moment
Ma/kN·m
The Maximum y Displacement Value of the Bearing Capacity Limit Bending Moment
y/mm
M p   M a M p /% y y   y /%
SJ-B0-Hnone-J184.9732.7382.9031.922.432.47
SJ-Bnone-H0-J1111.9254.92107.7753.163.713.21
SJ-B200-H0-J253.8621.7853.8619.9808.26
SJ-B300-H0-J268.3925.9766.3224.823.034.43
Average value 2.2934.593
Table 7. Table of rotational stiffness of single assembled joint specimens under pure bending action.
Name of SpecimenThe Plastic Ultimate Bending Moment Borne by the Node
Mp
/kN·m
The Angle of the Node at the Plastic Bending Moment Mp of the Node
θp
/rad
Elastic Bending Moment of the Node
Mk
/kN·m
The Node Rotation Angle at the Elastic Bending Moment Mk of the Node
θk
/rad
Initial Rotational Stiffness
Sj,ini
/kN·m·rad−1
SJ-B0-Hnone-J182.900.0484355.270.0083946585
SJ-Bnone-H0-J1107.770.0697971.840.0080268951
Table 8. Calculation table of mid-span deflection of a single assembled joint specimen under pure bending action.
Name of SpecimenThe Elastic-Stage Bending Moment
My
/kN·m
ω1max
/mm
ω2max
/mm
ωymax
/mm
End of Test/mmThe Difference Between the Formula and the Model
/%
SJ-B0-Hnone-J162.1753.14.327.427.592.3
SJ-Bnone-H0-J178.7553.924.48.329.017.65
Table 9. Conversion of rotational stiffness of double assembled joint specimens.
Name of SpecimenSJ-B200-H0-J2SJ-B300-H0-J2
KS,G/kN·m·rad−128243437
KE,G/kN·m·rad−1611759
KY,G/kN·m·rad−117681989
KS,B/kN·m·rad−127633362
KE,B/kN·m·rad−1763858
KY,B/kN·m·rad−113991545
Disclaimer/Publisher’s Note: The statements, opinions and data contained in all publications are solely those of the individual author(s) and contributor(s) and not of MDPI and/or the editor(s). MDPI and/or the editor(s) disclaim responsibility for any injury to people or property resulting from any ideas, methods, instructions or products referred to in the content.