Article

A Data-Driven Battery Energy Storage Regulation Approach Integrating Machine Learning Forecasting Models for Enhancing Building Energy Flexibility—A Case Study of a Net-Zero Carbon Building in China

1
Department of Architecture and Built Environment, University of Nottingham Ningbo China, Ningbo 315100, China
2
School of Arts & Sciences, University of Rochester, Rochester, NY 14627, USA
*
Authors to whom correspondence should be addressed.
Buildings 2025, 15(19), 3611; https://doi.org/10.3390/buildings15193611
Submission received: 30 July 2025 / Revised: 22 September 2025 / Accepted: 5 October 2025 / Published: 8 October 2025
(This article belongs to the Special Issue Big Data and Machine/Deep Learning in Construction)

Abstract

Building energy flexibility is essential for integrating renewables, optimizing energy use, and ensuring grid stability. While renewable and storage systems are increasingly used in buildings, poorly designed storage strategies often cause supply-demand mismatches, and a comprehensive, indicator-based assessment approach for quantifying flexibility remains lacking. Therefore, this study designs customized energy storage regulation strategies and constructs a comprehensive energy flexibility assessment scheme to address key issues in supply-demand coordination and energy flexibility evaluation. LSTM and Rolling-XGB methods are used to predict building energy consumption and PV generation, respectively. Based on battery safety constraints, a data-driven battery energy storage system (BESS) model simulates battery behavior to evaluate and compare building energy flexibility under two scenarios: (1) uncoordinated PV-BESS, and (2) coordinated PV-BESS with load forecasting. A practical validation was conducted using a net-zero-carbon building as the case study. Simulation results show that the data-driven BESS model improves building energy flexibility and reduces electricity costs through optimized battery sizing, tailored storage strategies, and consideration of local time-of-use tariffs. In the case study, local energy coverage reached 62.75%, surplus time increased to 34.77%, and costs were cut by nearly 40% compared to the PV-only scenario, demonstrating the significant benefits brought by the proposed BESS model that integrates load forecasting and PV generation prediction features.

1. Introduction

With the booming global economic development and population growth, total energy consumption has exhibited an upward trend each year, reaching 445 EJ by the end of 2023 [1]. Faced with significant environmental problems imposed by a sharp rise in energy demand and driven by the goal of achieving a sustainable society and global decarbonization by 2025 [2], the penetration of renewable energy within the traditional fossil fuel-dominated power structure has been steadily increasing [3]. Notably, the global installed photovoltaic (PV) capacity reached 1581 GW by the end of 2023, with China accounting for 662 GW, ranking first worldwide [4].
Despite this progress, renewable energy sources such as solar PV remain inherently intermittent due to their dependence on weather and diurnal patterns [5]. The resulting fluctuation in generation often leads to mismatches between supply and demand [6], especially in regions with cold winters and hot summers, where local grids face stability challenges. A well-known example of this mismatch is the “duck curve,” which illustrates the non-coincidence between midday solar generation peaks and evening demand peaks [7]. This highlights the need for demand-side flexibility, especially in developing countries, where building energy systems must adapt to fluctuating supply while progressing toward decarbonization goals. Battery Energy Storage Systems (BESSs), in this context, play a vital role not only in storing excess renewable energy but also in mitigating electricity generation volatility and providing reliable grid support [8].
The integration of renewable energy and storage systems in large-scale buildings is widely recognized as a promising pathway toward energy-efficient and resilient building operation [9,10]. For a zero-carbon building, on-site renewable energy penetration can be effectively improved by a battery storage system. Jia et al. [11] introduced the principle of the control strategy based on energy efficiency and claimed that the addition of batteries reduces the interaction between the building and the grid. However, this issue can be greatly reduced by adopting the optimization method for the energy system based on the concept of “grid-friendly interaction” [11]. However, several critical barriers limit the widespread implementation of such integrated systems [12]. First, the absence of a standardized and quantitative framework for assessing building energy flexibility—particularly in systems with PV and BESS—hampers consistent evaluation and comparison across projects [13]. Existing assessment methods often rely on single performance indicators, which fail to fully capture the multi-dimensional nature of energy flexibility under dynamic climate and load conditions. Second, the full potential of energy storage is frequently underutilized due to the lack of strategic, flexibility-oriented scheduling. For example, the typical temporal gap between solar generation (peaking midday) and building demand (peaking in the early morning or evening) remains unresolved in many applications [14].
To address these challenges, recent studies have explored day-ahead flexibility planning and intra-day rolling optimization for multi-energy systems in buildings. For instance, such an approach employed in a net-zero building integrating heat pumps, PV, and thermal storage increased the annual self-absorption rate of PV power generation by over 7% after two years of operation [15]. Beyond these case-specific implementations, recent studies have increasingly adopted advanced modeling and control methods, ranging from physics-based models and model predictive control to data-driven and deep reinforcement learning frameworks. Among these, machine learning (ML)-based forecasting has shown strong potential in predicting both building energy consumption and PV generation, enabling more accurate day-ahead scheduling of BESS. By coupling high-accuracy forecasts with adaptive scheduling strategies, ML provides a promising avenue to enhance building energy flexibility under uncertainty. Some literature reviews highlighting modeling and optimization strategies are presented in Table 1 below.
Table 1 summarizes typical studies on building energy flexibility, revealing a wide range of modeling techniques (e.g., physics-based, data-driven) and control strategies (e.g., MPC, DRL). However, the diversity in objectives, system scopes, and evaluation indicators hinders direct comparison and limits generalizability. This highlights the need for a unified, application-oriented framework to guide both assessment and control design.
Defining flexibility sets the stage for its evaluation and application in different contexts. Existing building energy performance assessment criteria, such as energy efficiency [19] and energy use intensity [20], basically focuses only on the energy utilization of buildings with little awareness of the flexibility assessment [21]. Building energy flexibility, as an emerging concept in the field of smart building, was first formally introduced in the ongoing IEA EBC Annex 67 project and was given a relatively comprehensive explanation as “ the ability to manage its demand and generation according to local climate conditions, user needs and grid requirements [22]”. However, in recent years, different definitions of building energy flexibility have varied in their emphasis and application scenarios. For instance, building energy flexibility can be simply concluded as “the capability to reduce, shed, shift, modulate, or generate electricity which is provided by onsite distributed energy resources” [23]. In addition, from the demand-side management perspective, the capability to deviate buildings from the reference load curve based on demand response under different tariff scenarios can still be considered as a type of building energy flexibility [24]. These explanations establish a theoretical foundation for further analysis and provide essential insights for subsequent quantitative assessment.
In addition, the flexibility of a building is influenced by a combination of factors. For instance, weather conditions significantly affect the energy supply from renewable energy systems, and user-side demand also sets up boundary conditions for building energy flexibility. This indicates that purely qualitative analysis has limited applicability, which always fails to meet the demands of flexibility research. Under these circumstances, further quantitative analysis of energy flexibility proves to be more effective. Currently, KPI, as a tool to provide data support for the assessment, has become one of the most popular and well-recognized quantitative methods in the literature related to building energy flexibility [22]. Most of the quantification of building flexibility in the literature is based on the three main attributes of flexibility: time, energy, and cost [25]. A representative KPI review is presented in Table 2.
Although various existing energy flexibility indicators can analyze the different abilities of buildings to manage energy supply and demand from multiple perspectives, a particular indicator lacks an effective evaluation of the whole building energy system. Therefore, a set of assessment system covering multiple indicators is necessary to help buildings of the same type to conduct a comprehensive assessment and comparison of building energy flexibility from multiple dimensions. In this context, several studies have proposed composite indicator frameworks, such as the combination of available structural storage capacity (CADR), peak-period energy reduction (CRP), load factor (LF), system ramping (SR), and cost saving (CS), to enable users to balance and evaluate specific flexibility strategies [30].
For buildings equipped with renewable energy systems, an effective way to increase the energy flexibility of the building is to utilize battery storage systems. The main purpose of PV at the building level is to meet the local electricity demand and thus limiting the amount of energy based on non-renewable energy sources obtained from the distribution grid [31]. The volatility problem of PV power generation can be alleviated to a considerable extent by the storage of excess power generation and the release of the energy when the energy demand of the building is high, thus maximizing the use of renewable energy sources and also reducing the stress on the grid [32].
Furthermore, while battery scheduling models such as those based on mixed-integer linear programming (MILP) have demonstrated effectiveness in optimizing energy cost and peak shaving [33,34], they often prioritize economic objectives rather than flexibility enhancement. Previous work has also demonstrated that rule-based real-time control, driven by on-site generation and hourly electricity prices, can provide flexibility by prioritizing local energy matching and cost reduction, but this control method requires fixed system configurations, and it also lacks a real-building validation [35]. Moreover, few studies achieve a close integration between forecasting models (for load and PV output) and BESS control, especially under uncertainty, which limits the responsiveness and robustness of existing solutions.
To address the research gap and further enhance building energy flexibility, this study proposes a data-driven battery energy storage regulation approach, which integrates machine learning forecasting models for building energy demand and PV generation to enhance the building energy flexibility of net-zero carbon office buildings. This study also validates the approach through a case study on the Center for Sustainable Energy Technologies (CSET) building at the University of Nottingham Ningbo China, which is evaluated using multiple flexibility KPIs for a comprehensive assessment. In more detail, two machine learning methods—Long Short-Term Memory (LSTM) networks and Rolling XGBoost (XGB)—are adopted for forecasting building energy demand and PV generation, respectively. The predicted results are fed into a custom battery control logic that responds to real-time electricity prices and enhances energy flexibility. The proposed approach is evaluated using representative flexibility KPIs—including self-consumption (SC), local energy coverage (LEC), and energy surplus time percentage (ESTP)—along with economic metrics, demonstrating its effectiveness in real-world building energy management systems.

2. Methodology

2.1. Case Study Building

This research investigates the potential for enhancing building energy flexibility in an office building integrating PV systems and battery energy storage systems (BESS). As shown in Figure 1, the Center of Sustainable Energy Technology (CSET) was selected as the case study building to ensure practical relevance. This five-storey building has a total floor area of 1556 m2 and covers a large land area that accommodates an on-site PV energy system and BESS on the lawn surrounding the building.
Specifically, the main purpose of this building is for teaching and office work, and the base energy consumption is mainly from the equipment and HVAC system. Figure 2 shows the real-time energy consumption and PV power generation in October, and Table 3 shows the accumulated energy consumption and PV power generation in October 2024. It is worth mentioning that the total PV power generation reaches an energy consumption of 29.44%. In addition, Table 4 presents the configuration of the local PV system and battery storage system.
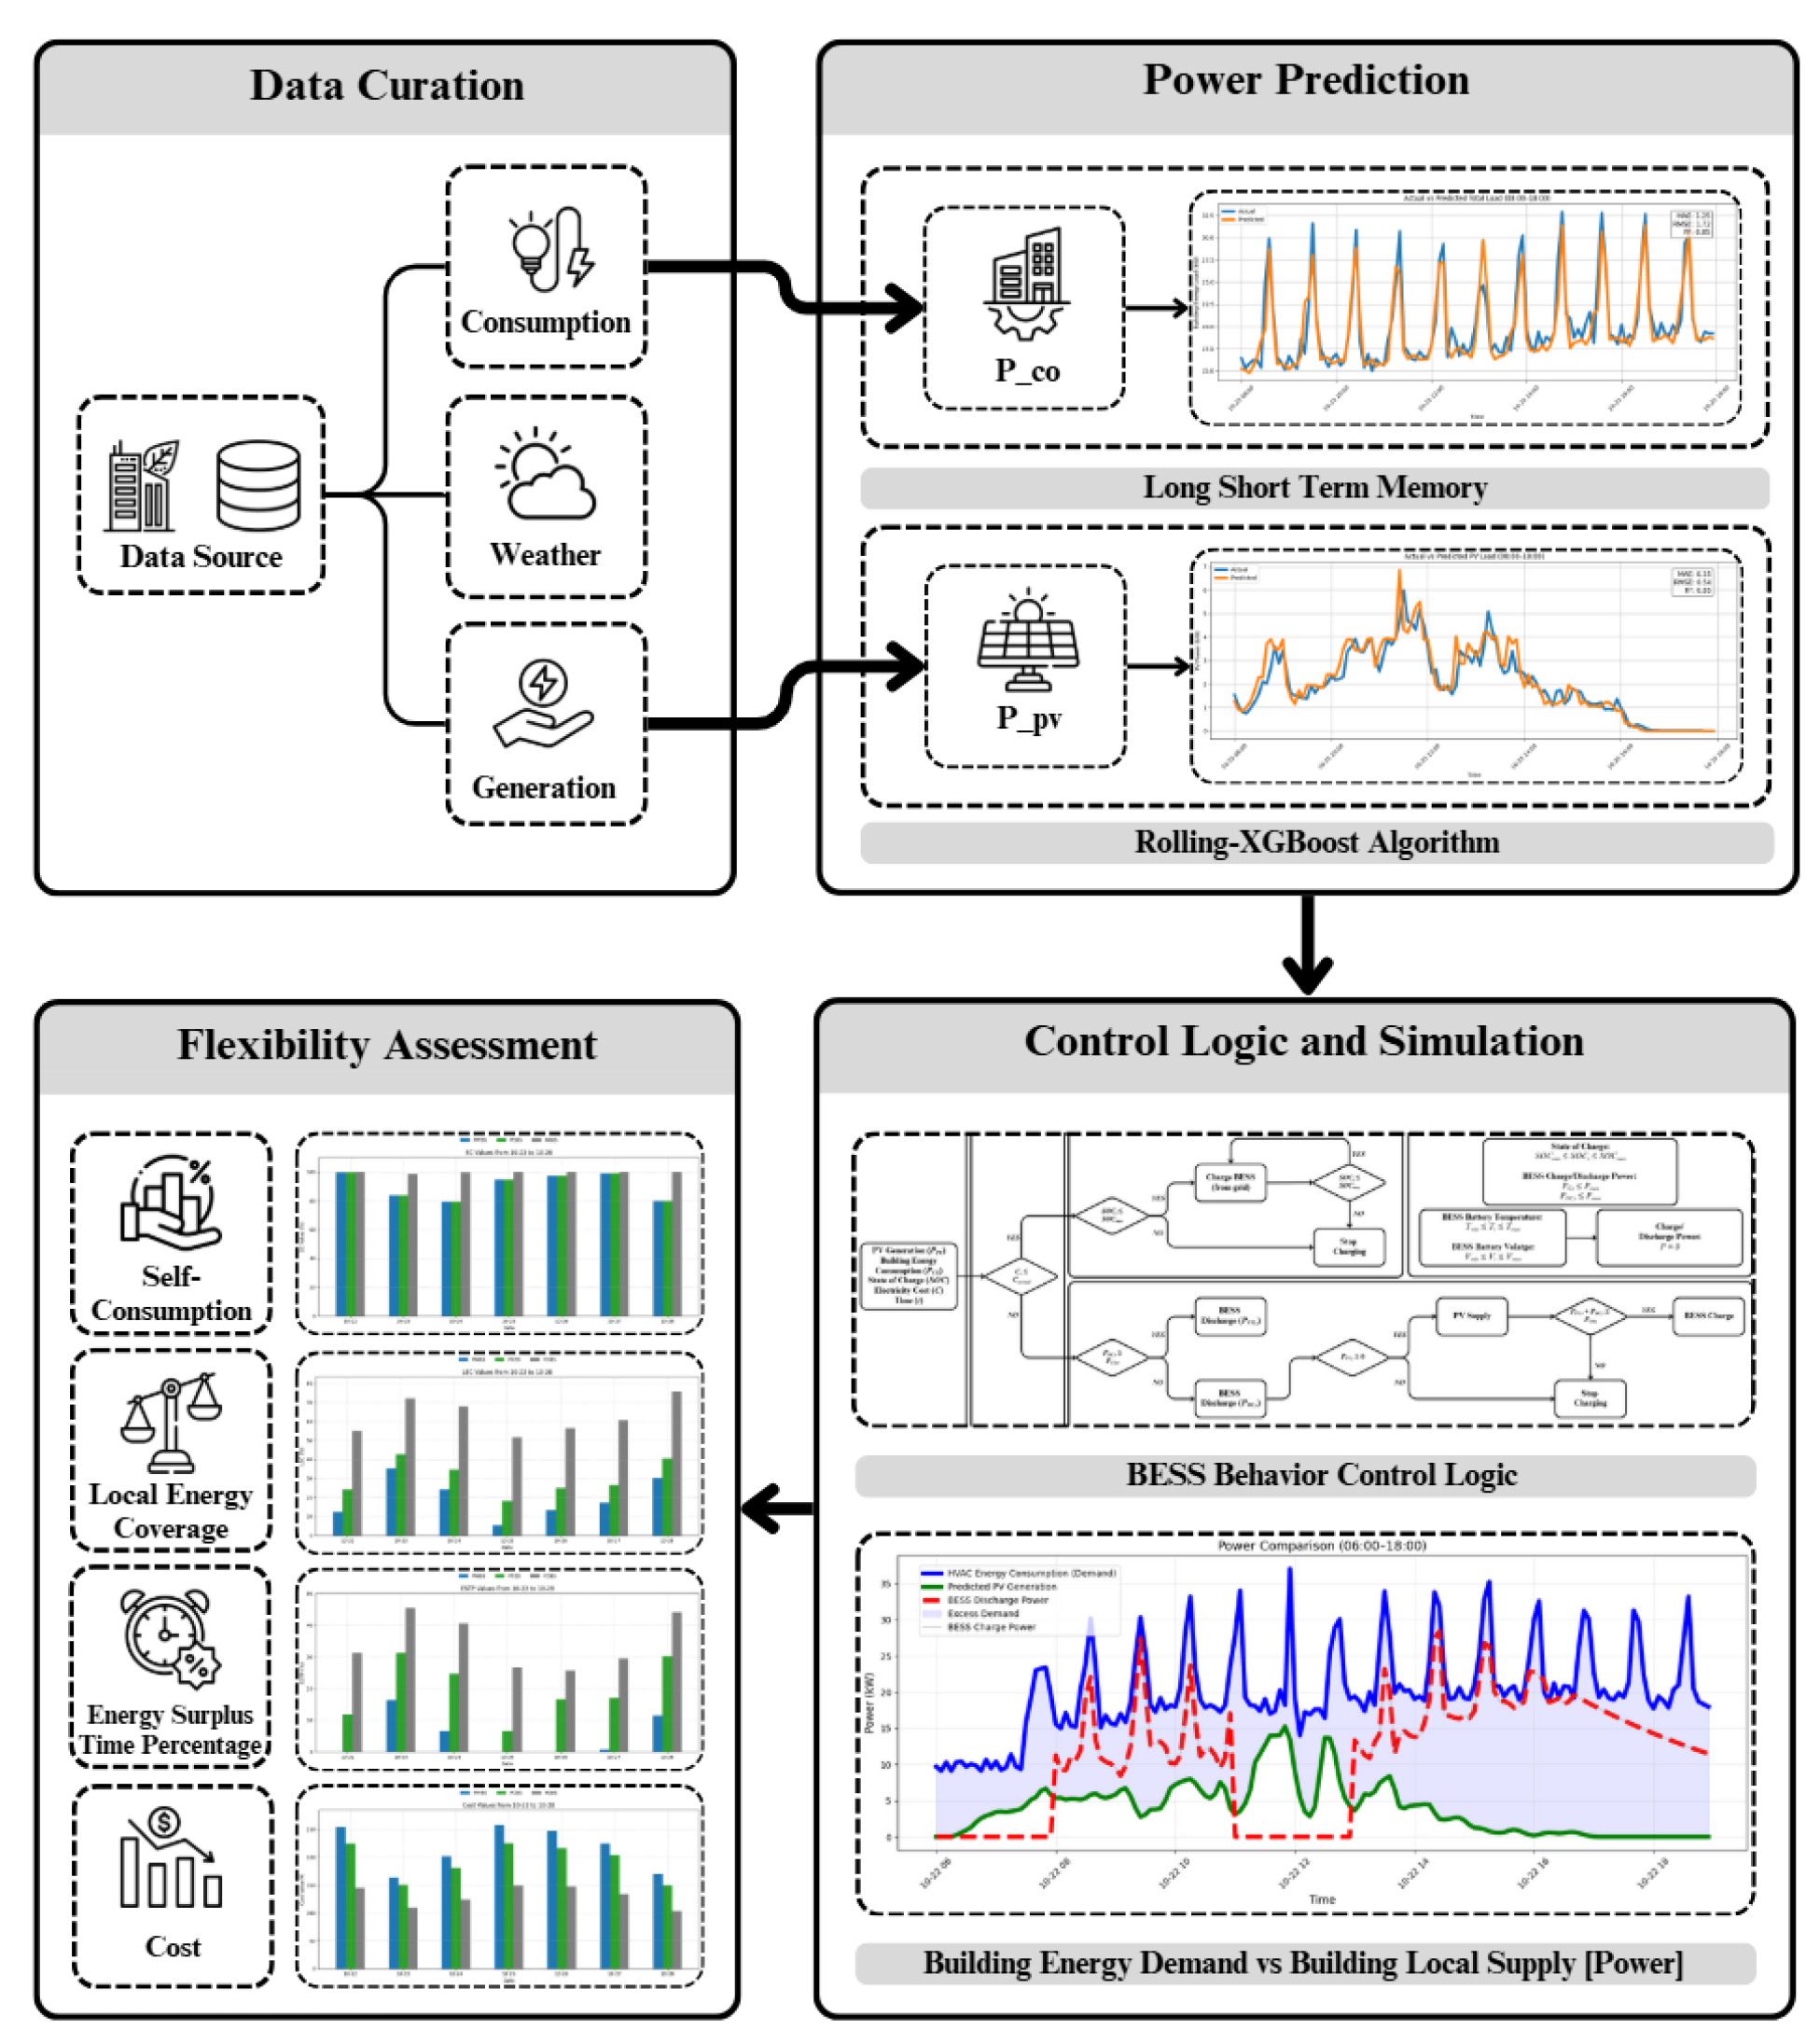
This research designed three energy regulation strategies based on experimental conditions, considering local time-of-use (TOU) tariff policies and specific BESS product configurations. Additionally, this case study also employs the data-driven battery control model and undergoes the assessment of building energy flexibility. In more detail, based on the on-site data curation, the future energy generation and consumption can be predicted by different machine learning methods, which provides the foundation for carrying out the control logic in BESS. The effectiveness of the energy regulation strategy can be validated by employing it in the BESS data-driven model with different indicators to show the results of flexibility numerically and graphically. The overall workflow follows a data-driven flexibility quantification process, similar to other recent studies on net-zero buildings [2], but with a focus on forecast-based regulation strategies rather than physics-informed predictive control. Figure 3 below shows the workflow of this research.

2.2. Data Curation and Energy Prediction Model

When curating the dataset for this study, particular attention was given to selecting an appropriate period for analysis. The focus on October in mid-autumn was intentional, supported by both climatic and operational considerations. Climatologically, October represents a transitional season, thereby minimizing the influence of extreme cold, hot, or typhoon events that could otherwise distort subsequent forecasting. Meteorological records for the study site indicate that October features moderate average temperatures (around 21 °C) and daily global solar radiation of approximately 23,581.78 J/m2, all of which are more representative and stable compared with the extremes of summer and winter. Furthermore, October provides intermediate daylight hours, avoiding the very long days of summer and the short days of winter.
From an operational perspective, following the commencement of the academic term in September, the CSET building operates under regular occupancy patterns, with normal teaching and student activities taking place, which enhances the practical research relevance. Taken together, October was considered the most appropriate period for analysis, and the dataset was complete without missing values or significant anomalies.
Thus, the weather data in October was collected using a small-scale meteorological station on the roof of the CSET building in combination with HOBOware software. This station was equipped with sensors for measuring various meteorological data, including but not limited to ambient temperature, relative humidity, and solar irradiance. Data acquisition and management were carried out using the HOBOware software (version 3.7.1), which enabled real-time logging and storage. Building-related energy data was collected through an online energy management system of CSET.
Data-driven simulation methods are usually formulated in accordance with black-box models, which basically rely on massive historical data to explore hidden relationships between input and output parameters, even without the guidance of physical laws. The data curation step is initiated by the development of energy demand and generation forecasting models, since the regulation of the energy storage system is constructed on the predicted data of both building energy consumption and PV generation. The machine learning methods were employed in both the prediction of building energy demand and PV generation.

2.2.1. LSTM Method for Building Energy Demand Prediction

Accurate prediction of building energy consumption significantly contributes to dynamic adjustment of battery discharge power, thereby enhancing the efficiency of local energy utilization. Given that the available data are primarily limited to the local energy consumption records, which typically present strong temporal dependencies, it is imperative to employ methods that can effectively model such time-dependent characteristics. Long Short-Term Memory (LSTM), as a representative type of recurrent neural network, has been widely adopted in the field of building energy consumption forecasting due to its demonstrated superior performance in handling nonlinear time series tasks, which is proven to achieve high accuracy and robustness in numerous related studies [36,37]. Therefore, in this study, a univariate LSTM model was trained to be capable of single-step forecasting, using a 24-step look-back window (past 2 h) to predict the building energy consumption at the following step (5 min). The dataset was split chronologically into one training group and one testing group, accounting for 80% and 20% of the whole data period, respectively, to preserve temporal dependence. The predicted results were utilized for the proactive regulation of battery discharge power.

2.2.2. Rolling-XGB Method for PV Generation Prediction

With the constantly rising proportion of PV power generation in the power system, accurate forecasting of PV generation plays a crucial role in ensuring grid security and enhancing system economy. Owing to the significant influence of meteorological factors, PV power presents strong volatility and nonlinear characteristics. To address these challenges, several short-term power prediction methods based on XGBoost were proposed, and these approaches demonstrated substantial improvements in forecasting accuracy and reliability [38,39]. For instance, a hybrid model combining a backpropagation (BP) neural network and XGBoost [40] was employed to predict PV generation, which leverages the advantages of XGBoost in handling small datasets and achieving strong generalization capability. In addition, Nastić et al. (2024) [41] developed an hourly forecasting approach for newly commissioned PV plants that relies solely on open data (PVGIS and Open-Meteo), achieving R2 values of 0.83–0.90 with CatBoost, demonstrating that accurate short-term PV power prediction can be realized even under data-scarce conditions. Overall, these studies indicate that XGBoost-based approaches provide high accuracy, robustness against nonlinear volatility, and adaptability to limited datasets, making them highly suitable for short-term PV generation forecasting.
Building on these insights, this study proposed a relatively simple prediction method to predict PV power, which employs rolling learning on the basis of an XGBoost model. By introducing the rolling learning mechanism, the training dataset is dynamically updated to enhance the model’s adaptability to time-varying characteristics. The size of the training window in rolling training is set to 1,208,600 s (14 days), while the testing window is the next 172,800 s (2 days), thus gradually updating the predicted values on the time series. In addition, a multi-feature input strategy is adopted, incorporating meteorological variables such as solar irradiance, ambient temperature, and humidity alongside historical power data to comprehensively improve prediction performance, providing more reliable support for the optimal operation of BESS and the scheduling of power grids.

2.3. Design of Energy Storage Regulation Strategy

As one of the key technological means to enhance the energy flexibility of buildings, the efficiency of energy storage systems is directly affected by the regulation strategy. A rational regulation logic requires comprehensive consideration of a variety of factors, from the technical parameters of the energy storage device to the price signals of the energy market.

2.3.1. Building Energy Flow Framework

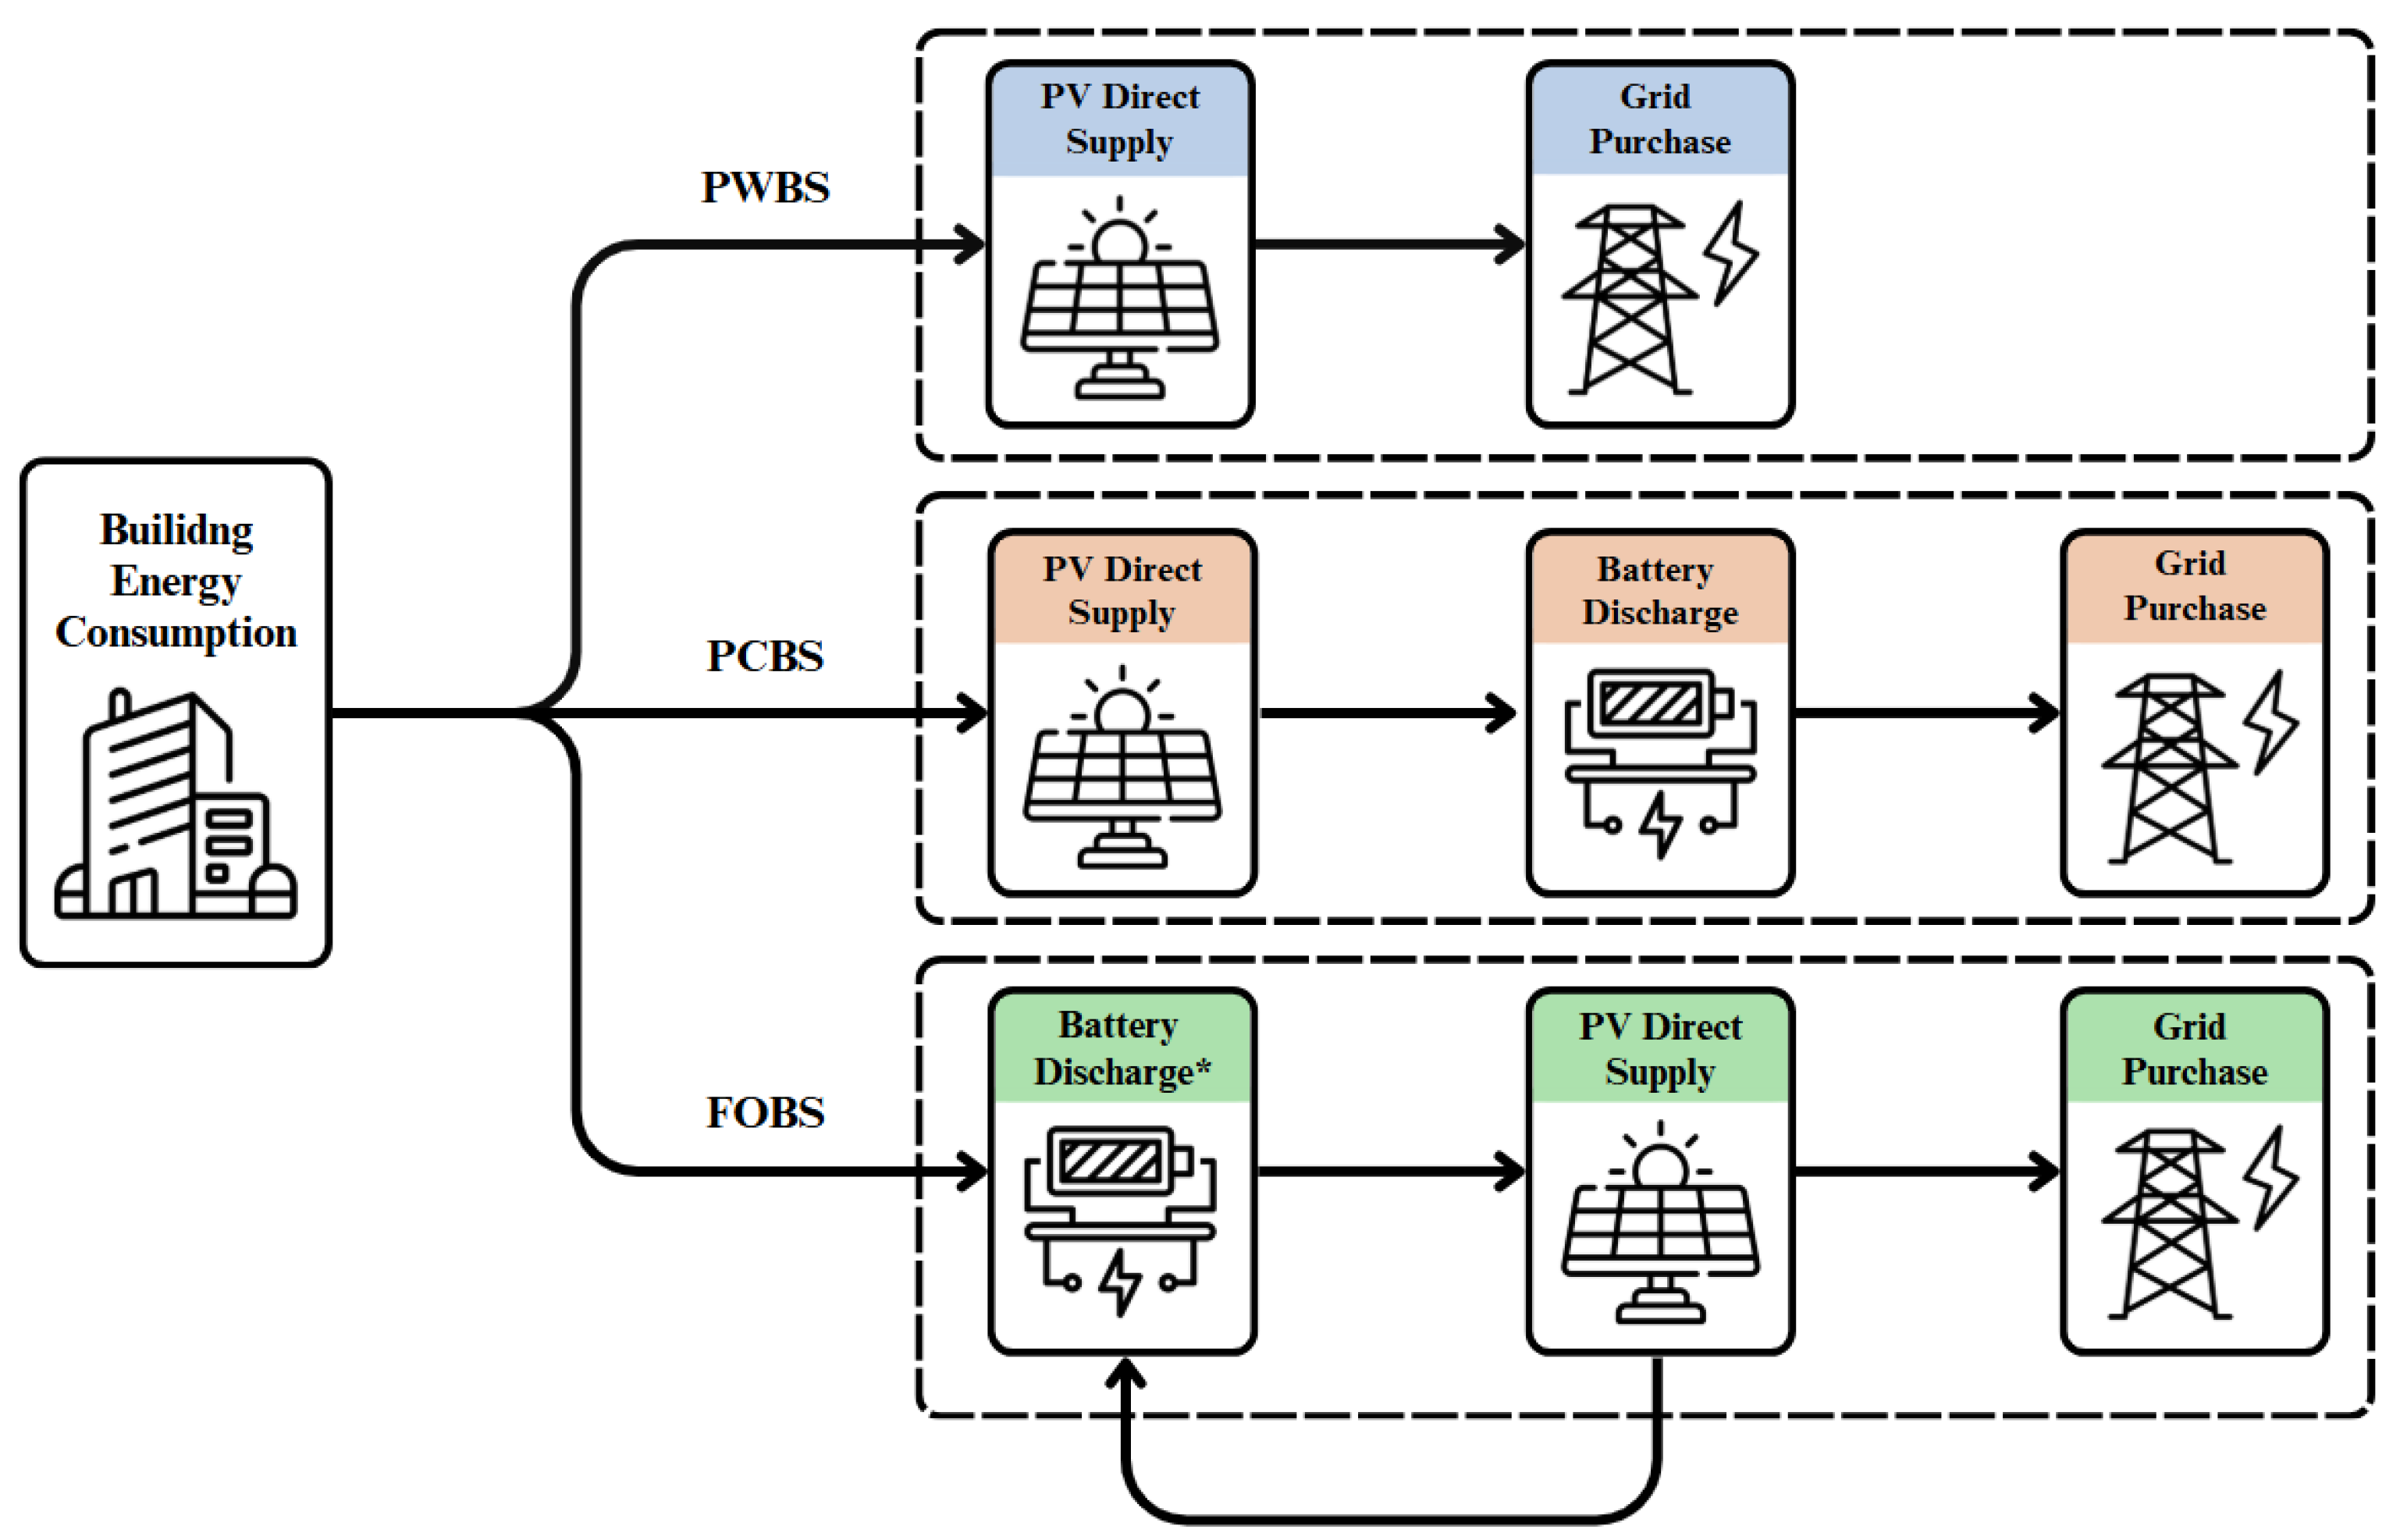
The analysis of energy flow is the starting step in building energy system optimization [38]. Figure 4 illustrates the energy sources and demands of the case study building.
There are two sources of local energy supply to the building, i.e., battery discharge (energy stored in advance from the grid and PV output surplus) and real-time direct supply from the PV system. Energy purchase from the grid is required to meet all building demands when the local energy supply cannot suffice.

2.3.2. Overview of Strategy Groups

In order to illustrate the impact of battery energy storage systems under different regulation strategies on building energy efficiency, three scenarios are set up. Table 5 presents the specifics of each strategy.
Figure 5 illustrates the preference for energy supply sources in different supply strategies. In the first scenario (PWBS), there is no battery storage system. Energy is supplied directly to the building through PV generation, and any unmet energy demand is purchased from the grid. The second (PCBS) is based on the simulation of existing working conditions. Priority is given to the direct supply of PV power, and then the supply from the battery storage system, in order to relieve the grid pressure and reduce the cost of electricity before purchasing power from the grid. In this scenario, the battery charging and discharging, and power settings are fixed. The third one (FOBS) aims to enhance the building energy flexibility and reduce electricity costs. In this strategy, the charging and discharging time periods of the batteries strictly follow the local time-of-use tariff policy. In addition, the battery system will supply the building power according to the predicted building energy consumption. PV power will recharge the batteries so that the locally stored energy can be fully utilized to avoid or minimize the power purchase from the grid during peak tariff hours. This strategy is forward-looking, considering the grid-levelized energy cost outlined in the implemented time-of-use tariff policy.

2.3.3. Time-Sharing Tariff Policy in Ningbo

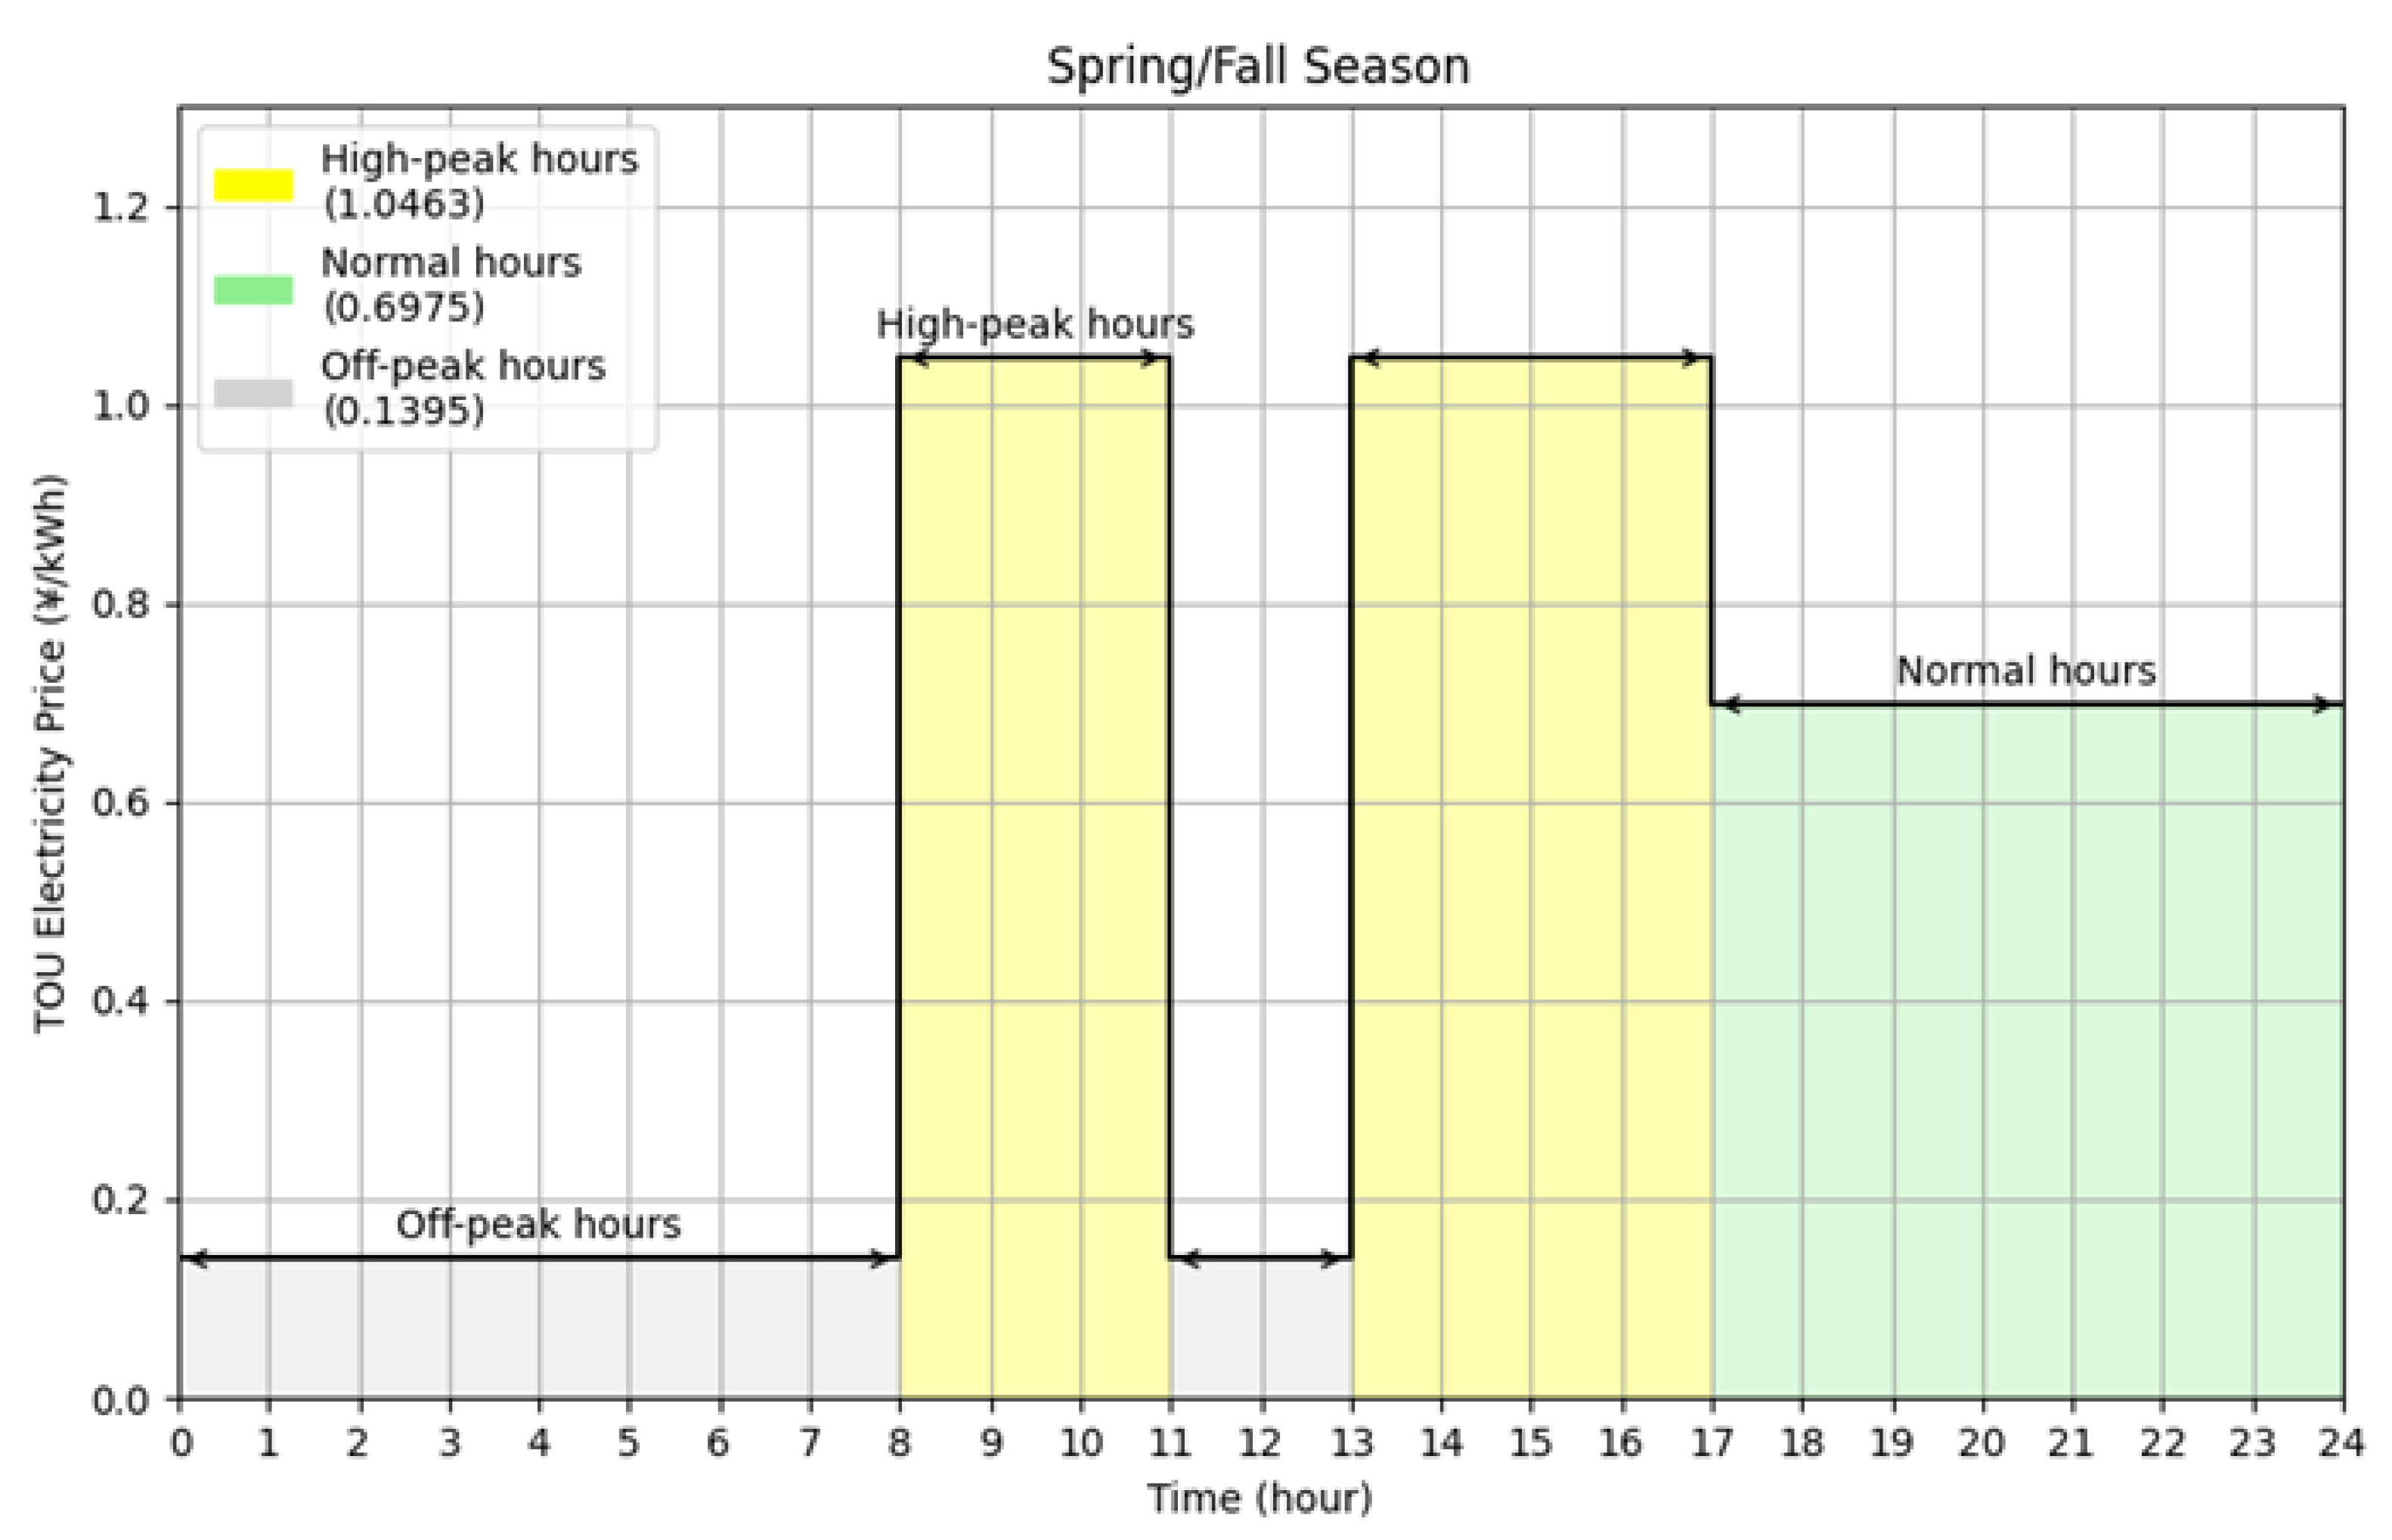
Time-of-use (TOU) tariff policies were published by the Zhejiang Development and Reform Commission (ZDRC) in January 2024, which have been in effect in Ningbo since June 2024. The structure of time-of-use tariffs divides a day into four time periods: critical peak, high peak, normal, and low peak. The corresponding prices fluctuate based on a base price of 0.6975 CNY/kWh. For instance, during October, which is in the transition season, the electricity pricing structure is typically divided into three tiers. During high-peak periods, the electricity price reaches 1.0463 CNY/kWh, whereas in off-peak hours, the rate drops to approximately half of the normal price, only at 0.1395 CNY/kWh. Figure 6 shows electricity tariffs in spring and fall.

2.3.4. Modeling Battery Energy Storage Constraints for Simulation and Control

With the rapid development of grid-connected new energy technologies, the State of Charge (SOC) has become a critical parameter for representing the energy status of energy storage units. The state of charge (SOC) is widely accepted to be defined as the ratio of remaining capacity over the nominal capacity of a battery [42], which could be written as follows:
S O C = R e m a i n i n g   C a p a c i t y N o m i n a l   C a p a c i t y
Accurate SOC estimation is essential for both modeling and simulation of BESS. In recent years, various SOC estimation methods have been proposed, differing in algorithmic complexity and estimation accuracy [43,44]. This study adopts a simplified estimation approach to offer a practical solution for the preliminary simulation and performance evaluation of BESS. The SOC of the BESS is computed per time step t as a function of the current charging/discharging power P B E S S , c h t / P B E S S , d i s t , with the SOC at each step updated variously from the previous value according to the charging or discharging behavior; in this study, charging was supplied solely from the grid during designated periods, without contribution from PV, which can be presented as follows:
S O C B E S S t = S O C B E S S t 1 + η C · P B E S S , c h t · t C B E S S   ( c h a r g e )
S O C B E S S t = S O C B E S S t 1 P B E S S , d i s t · t C B E S S   ( d i s c h a r g e )
S O C B E S S , m i n S O C B E S S t S O C B E S S , m a x
P B E S S , m i n P B E S S , c h t P B E S S , m a x
P B E S S , m i n P B E S S , d i s t P B E S S , m a x
where S O C B E S S t 1 is the SOC at the previous time instant t 1 ; η C is the efficiency of charging; P B E S S , c h t   a n d   P B E S S , d i s t are the real-time charging and discharging power of BESS at the current time instant t ; t is the five-minute time interval; and C B E S S is the nominal battery capacity.
During this period, the charge of SOC follows Equation (2). In contrast, the BESS was discharged according to Equation (3) to compensate for the building’s required energy consumption. In both processes, the SOC is continuously monitored, with its value checked at every 5 min interval to ensure compliance with the allowable range and to safeguard battery performance.
The technical characteristics of the BESS employed in this study are derived from the datasheet of an air-cooled commercial energy storage device provided by TIMELANP Corporation (Wenzhou, China), which is mentioned in Table 4.
The sensitivity of BESS to voltage and temperature makes it all the more important to protect these parameters to ensure the safety and longevity of the system. On the one hand, both over- and under-voltage can cause damage to the battery itself, such as electrolyte breakdown and permanent degradation of the battery, and on the other hand, both high and low temperatures can seriously shorten battery life. Therefore, real-time monitoring and control of voltage and temperature is crucial for the safe and efficient operation of a BESS.
The voltage simulation method applied in this paper will be linearly interpolated based on the SOC, while the temperature simulation method is a function of the ambient temperature and the implemented power, which is expressed as follows:
V o l t a g e = V m i n   + V m a x V m i n   · S O C B E S S t 100
T e m p e r a t u r e = T e n v ( t ) + 0.05 · | P B E S S t |
where T e n v is the average environment temperature at each time instant t , which is obtained from the weather datasheet, and P B E S S t is the power of charging or discharging at each time instant t .
Constant power charging can lead to large spikes in power demand, which can stress the grid. Dynamic power avoids continuous high-power operation, which reduces the wear and tear of the battery and slows down the aging of the battery. The charging and discharging power of the battery considered in this battery model will be based on the real-time variation in the SOC.
P c h a r g e = P c h a r g e _ m a x × m i n { 1.0 , S O C _ r a t i o _ c h a r g e × α }
P d i s c h a r g e = P d i s c h a r g e _ m a x × m i n { 1.0 , S O C _ r a t i o _ d i s c h a r g e × α }
s o c _ r a t i o _ c h a r g e =   S O C m a x S O C S O C m a x S O C m i n
s o c _ r a t i o _ d i s c h a r g e =   S O C S O C m i n S O C m a x S O C m i n
where α is the buffer coefficient to ensure that power is not exhausted even at non-extreme edges, and the battery would not be overcharged or over-discharged, improving the lifespan.

2.3.5. Control Logic and Strategy Implementation

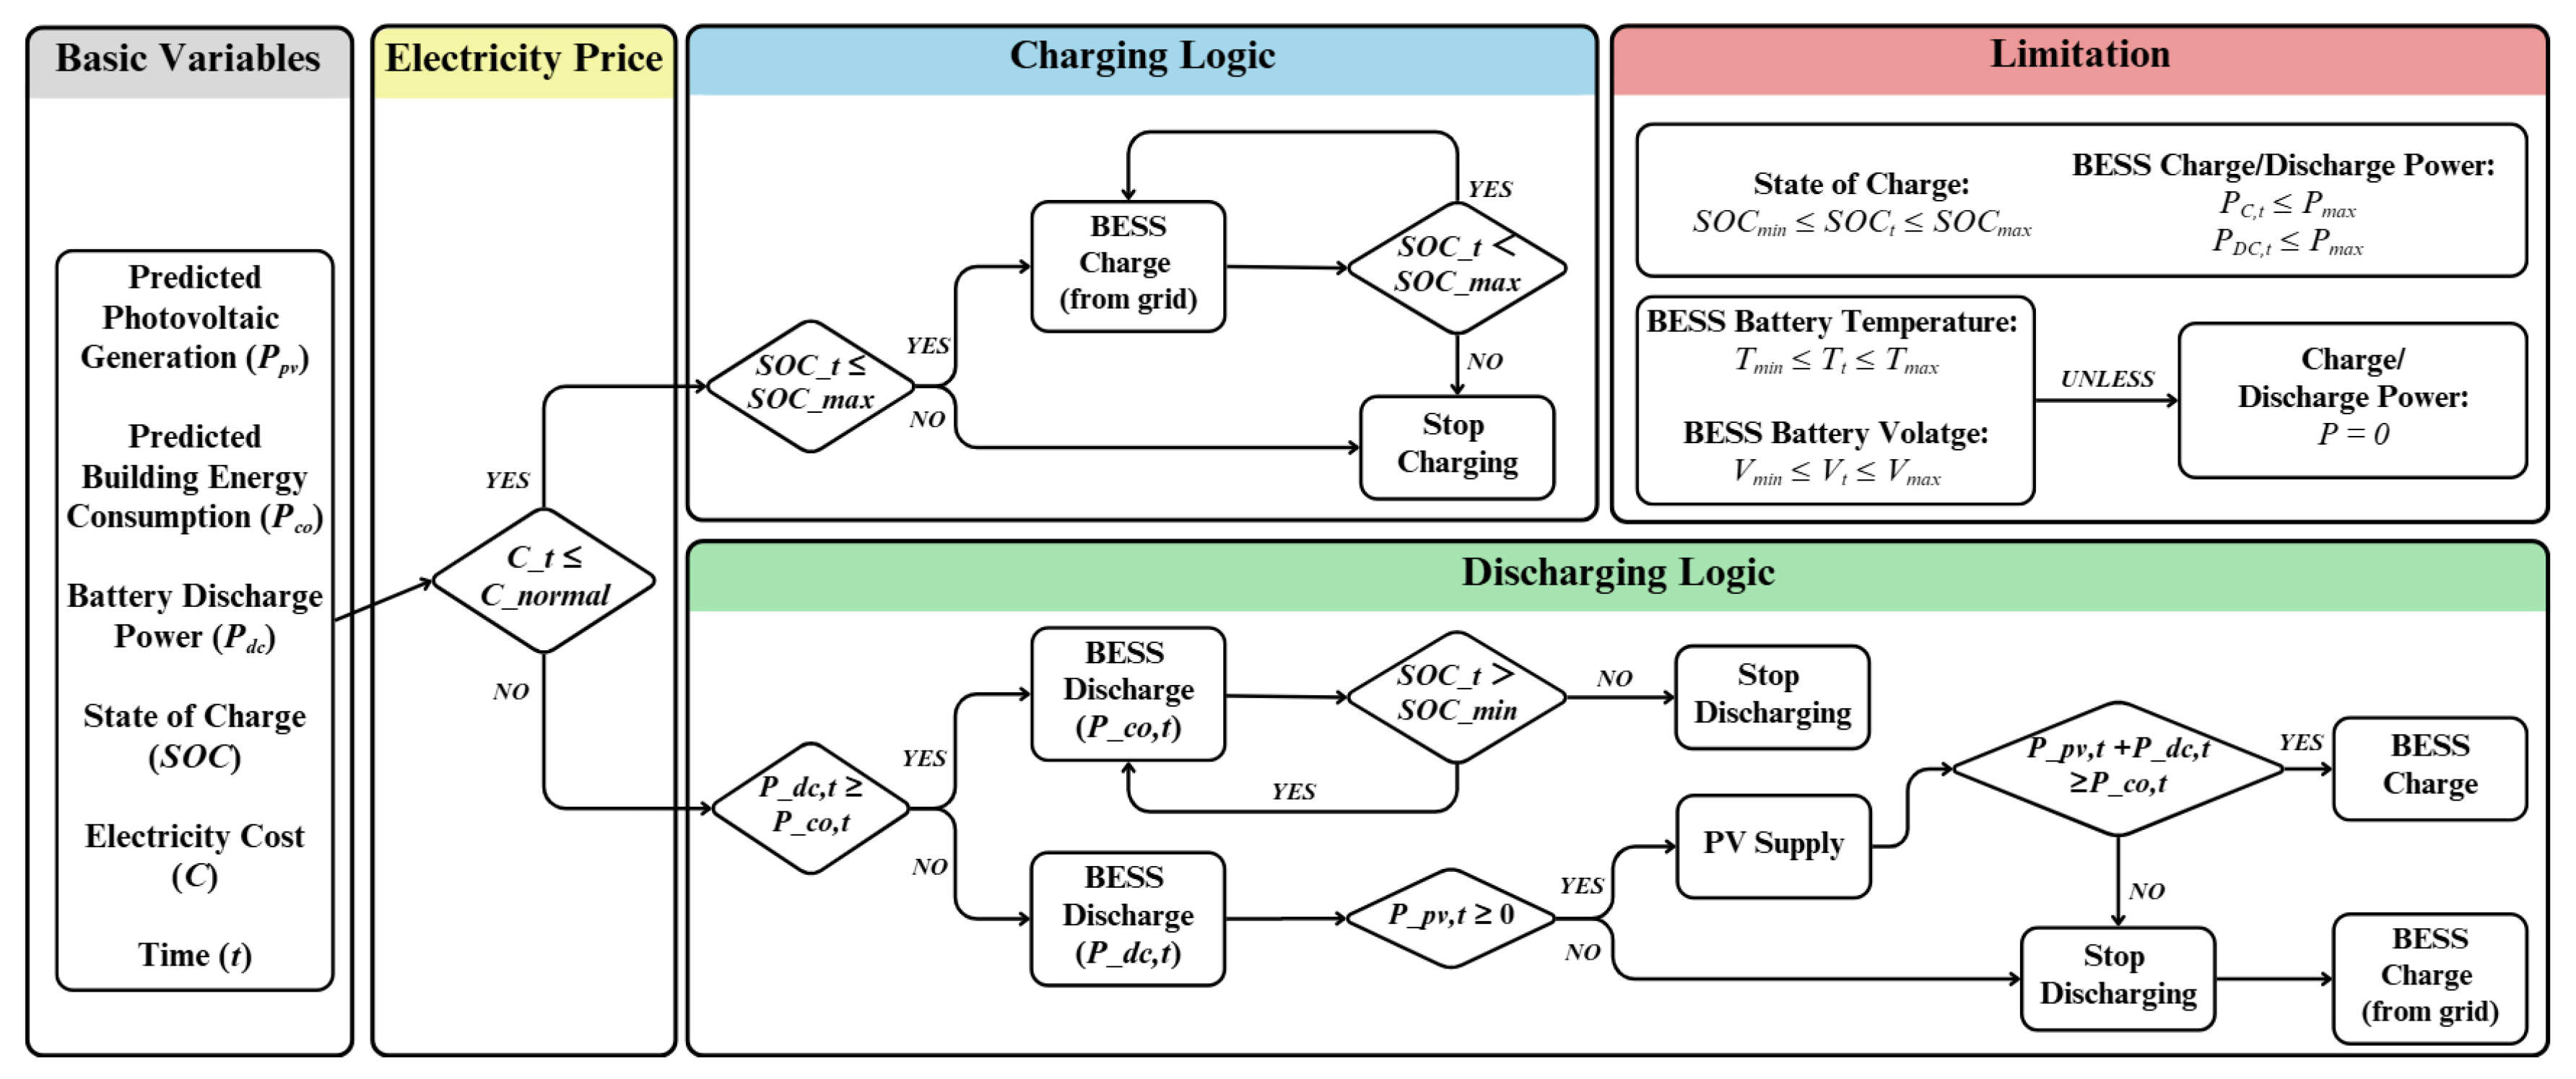
The control logic for the building-integrated BESS, as shown in Figure 7, is developed based on the premise of battery-safe operation, ensuring that the state of charge (SOC), power, temperature, and voltage remain within the allowable limits.
The core objective to be achieved by this control strategy is to minimize the energy cost while enhancing the building energy flexibility. Because of the electricity cost considerations, the battery charging and discharging time periods need to be combined with the peaks and valleys of time-sharing tariffs, i.e., priority is given to purchasing power from the grid to replenish the batteries with energy during low tariff time periods, and priority is given to the use of local energy provision during high tariff time periods. There are two main forms of local energy provision. The first, which is also prioritized, is the discharge of the battery based on the predicted building energy power consumption. When the discharge cannot meet the energy demand at a certain point in time, the second means of energy supply is taken by supplying PV power to the building. The key to this stage lies in PV forecasting, enabling forward-looking scheduling and realistically simulating the operation of a PV-battery integrated system. If the demand still cannot be met, power can only be bought through the grid during non-low tariff periods. During execution, all control actions are constrained by real-time checks to maintain safe and stable battery operation. Overall, this strategy represents a feedforward coordinated dispatch approach, which better aligns with the practical logic of day-ahead scheduling.

2.4. Building Energy Flexibility Assessment Approach

The flexibility assessment approach employed in this study is designed to improve the energy flexibility of buildings. The rationality and effectiveness of the energy storage and regulation logic are verified by comparing the energy supply and demand regulation capability of CSET before and after the implementation of energy storage and regulation strategies.
This evaluation is conducted in terms of energy utilization, energy self-sufficiency, and energy supply reliability. For a building equipped with PV power generation and BESS, the utilization of renewable energy supply is particularly important, i.e., self-consumption (SC) is used to initially assess the actual renewable energy utilization rate. Secondly, from a load matching perspective, the local energy coverage (LEC) is chosen to compare the local energy supply with the total energy consumption. In addition, the temporal matching level between existing energy supply and consumption further validates the applicability of the energy storage regulation strategy, and the selected indicator is defined as Energy Surplus Time Percentage (ESTP), indicating the period in which the energy supply can meet the energy demand. Finally, the electricity cost from the grid is also taken into account to evaluate the economic benefits. The formulas of the three metrics are listed in Table 6 below.

3. Results and Discussion

3.1. Building Energy Consumption Prediction Results

The energy flexibility analysis was conducted during the transitional period from September to November. A set of widely recognized metrics was employed to assess the modeling performance of LSTM, especially for prediction accuracy, namely mean absolute error (MAE), root mean squared error (RMSE), and coefficient of determination (R2).
Table 7 demonstrates the prediction results for a week that are reported with three indicators. It can be observed that the MAE is around 1.16, the R2 fluctuates around 0.92, and the combination of the mean values further confirms that the LSTM has a high degree of stability and excellent prediction performance in short-term building energy consumption prediction.
To further demonstrate the daily prediction results calculated by LSTM, Figure 8 shows the 5 min level results for a single day on 23 October. Generally, the predicted load aligned well with the actual values, and the MAE of 1.10 and R2 of 0.93 are sufficient to demonstrate the feasibility of the LTSM model in predicting the energy consumption of CSET.

3.2. PV Generation Power Prediction Results

For the same period, a rolling time window training mechanism combined with the prediction framework of the XGBoost regression model is used to predict PV power.
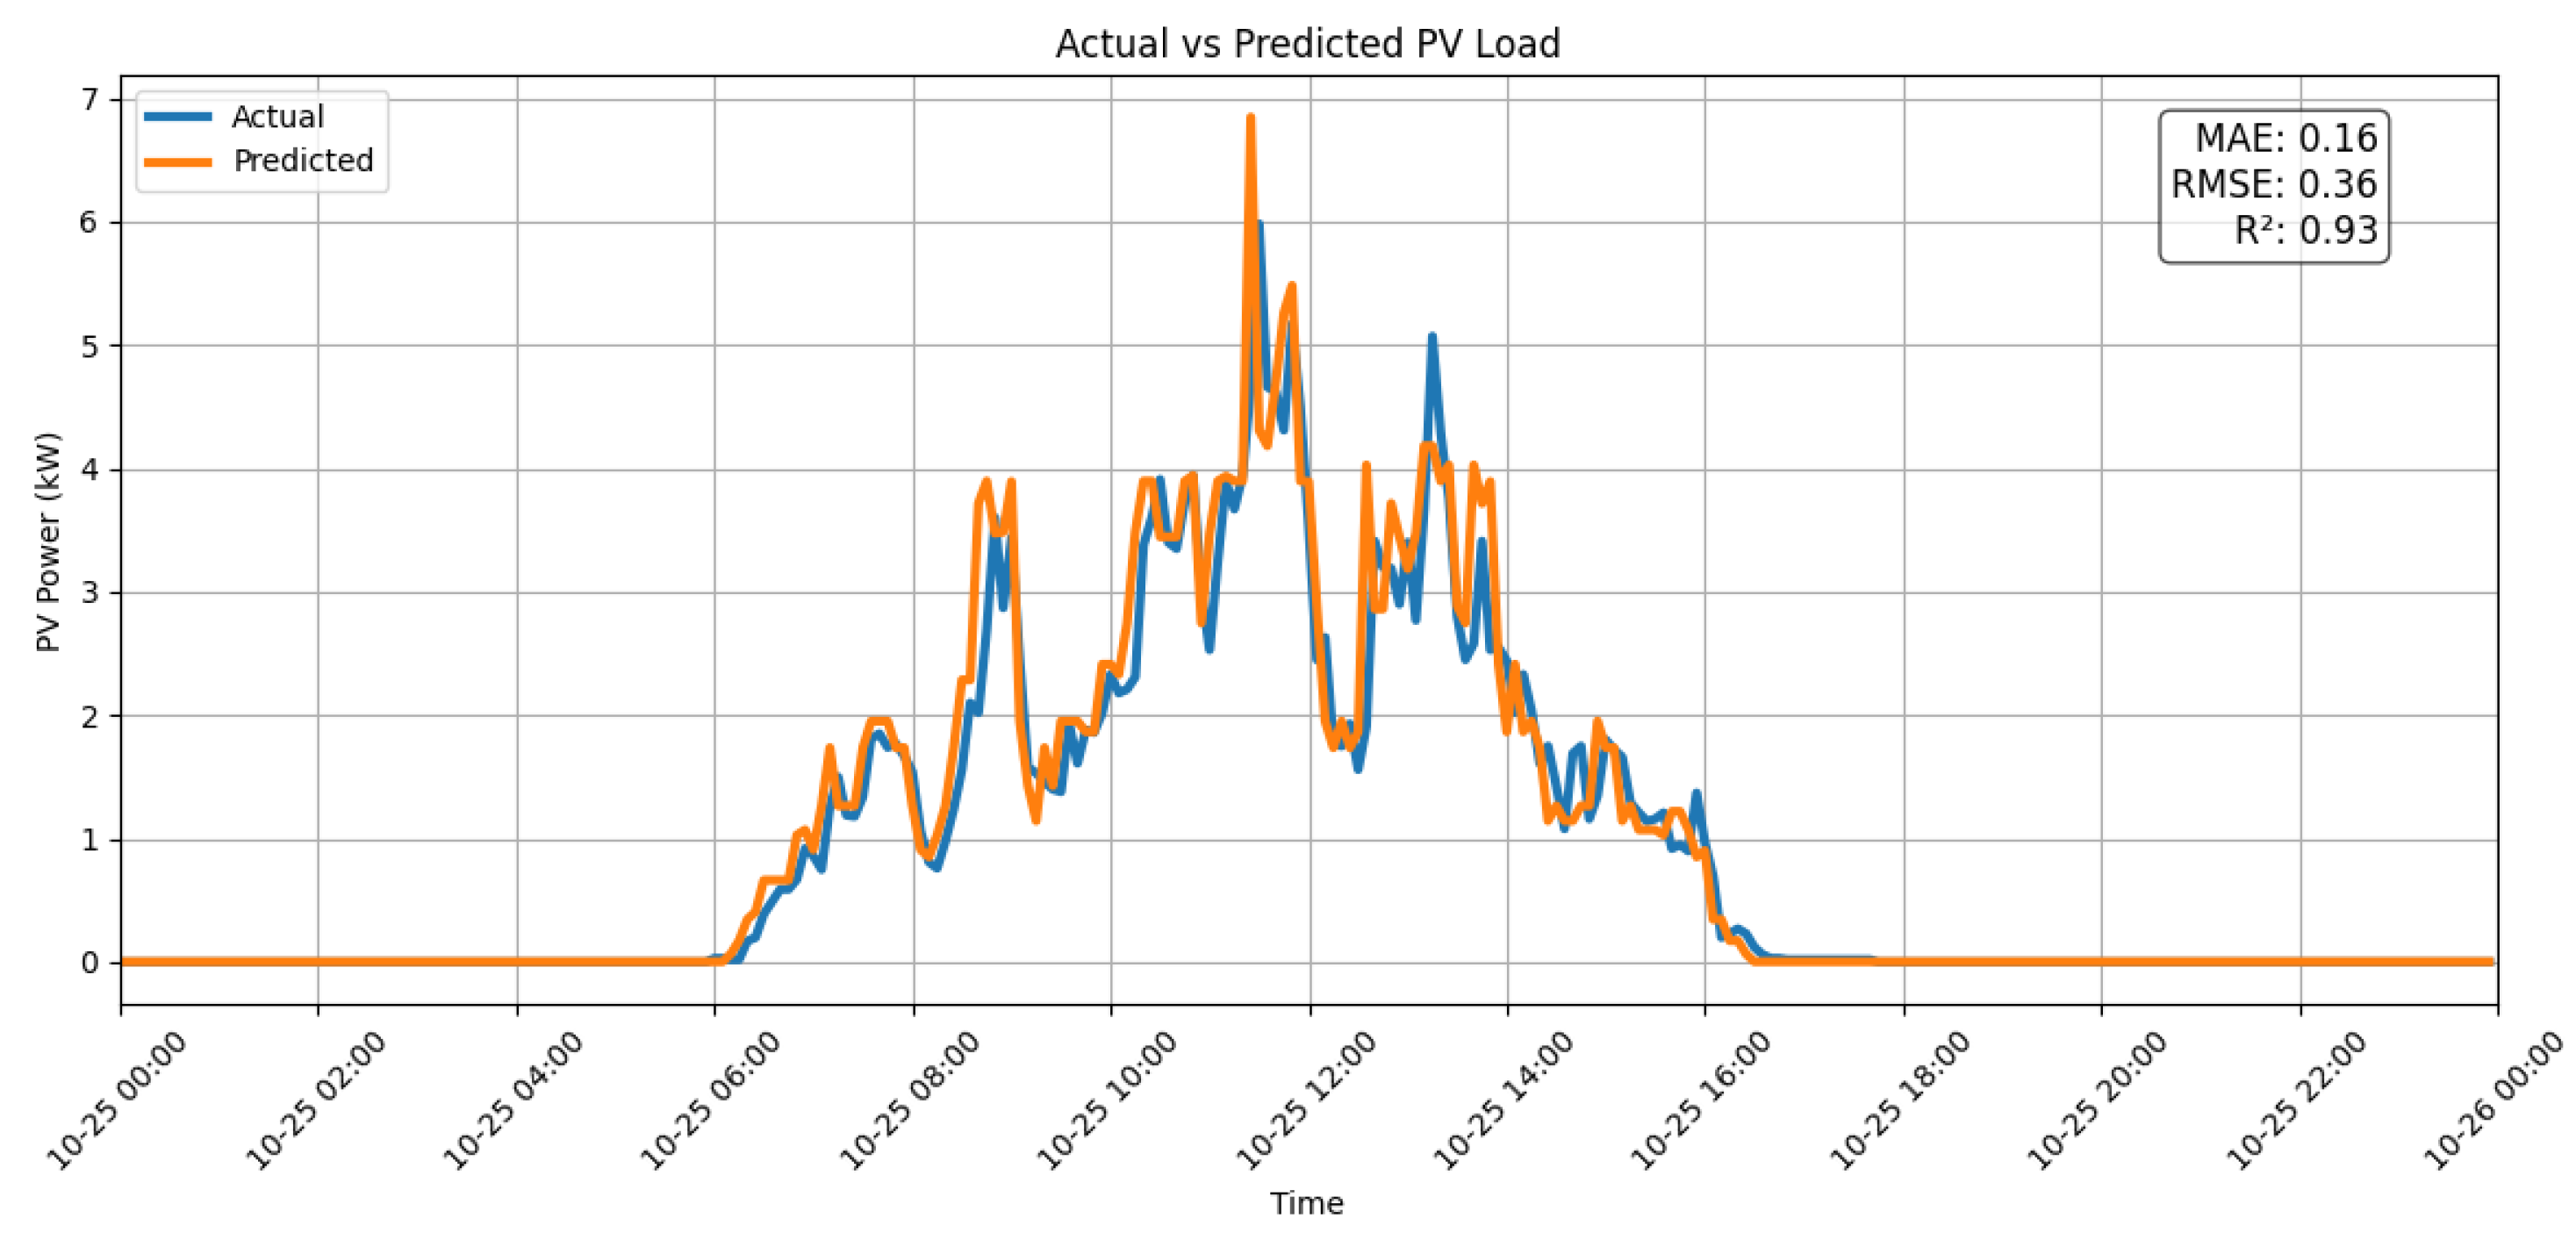
Table 8 summarizes the PV power forecasts for one week in the second half of October. The overall trend of the real data and prediction results is almost the same. For instance, the sample graphical results of 25 October are shown in Figure 9. The values of MAE and R2 are 0.16 and 0.93, respectively, which are sufficient to demonstrate that the existing model, with the characteristic inputs of solar radiation, is capable of achieving a reliable prediction effect on PV power.

3.3. Comparison of Different Capacities of BESS

Recognizing that the effectiveness of energy supply from battery storage is constrained by its capacity, this study prioritizes the comparison of different battery sizes. By increasing storage capacity, the system can better buffer fluctuations in building energy demand and improve overall energy reliability.
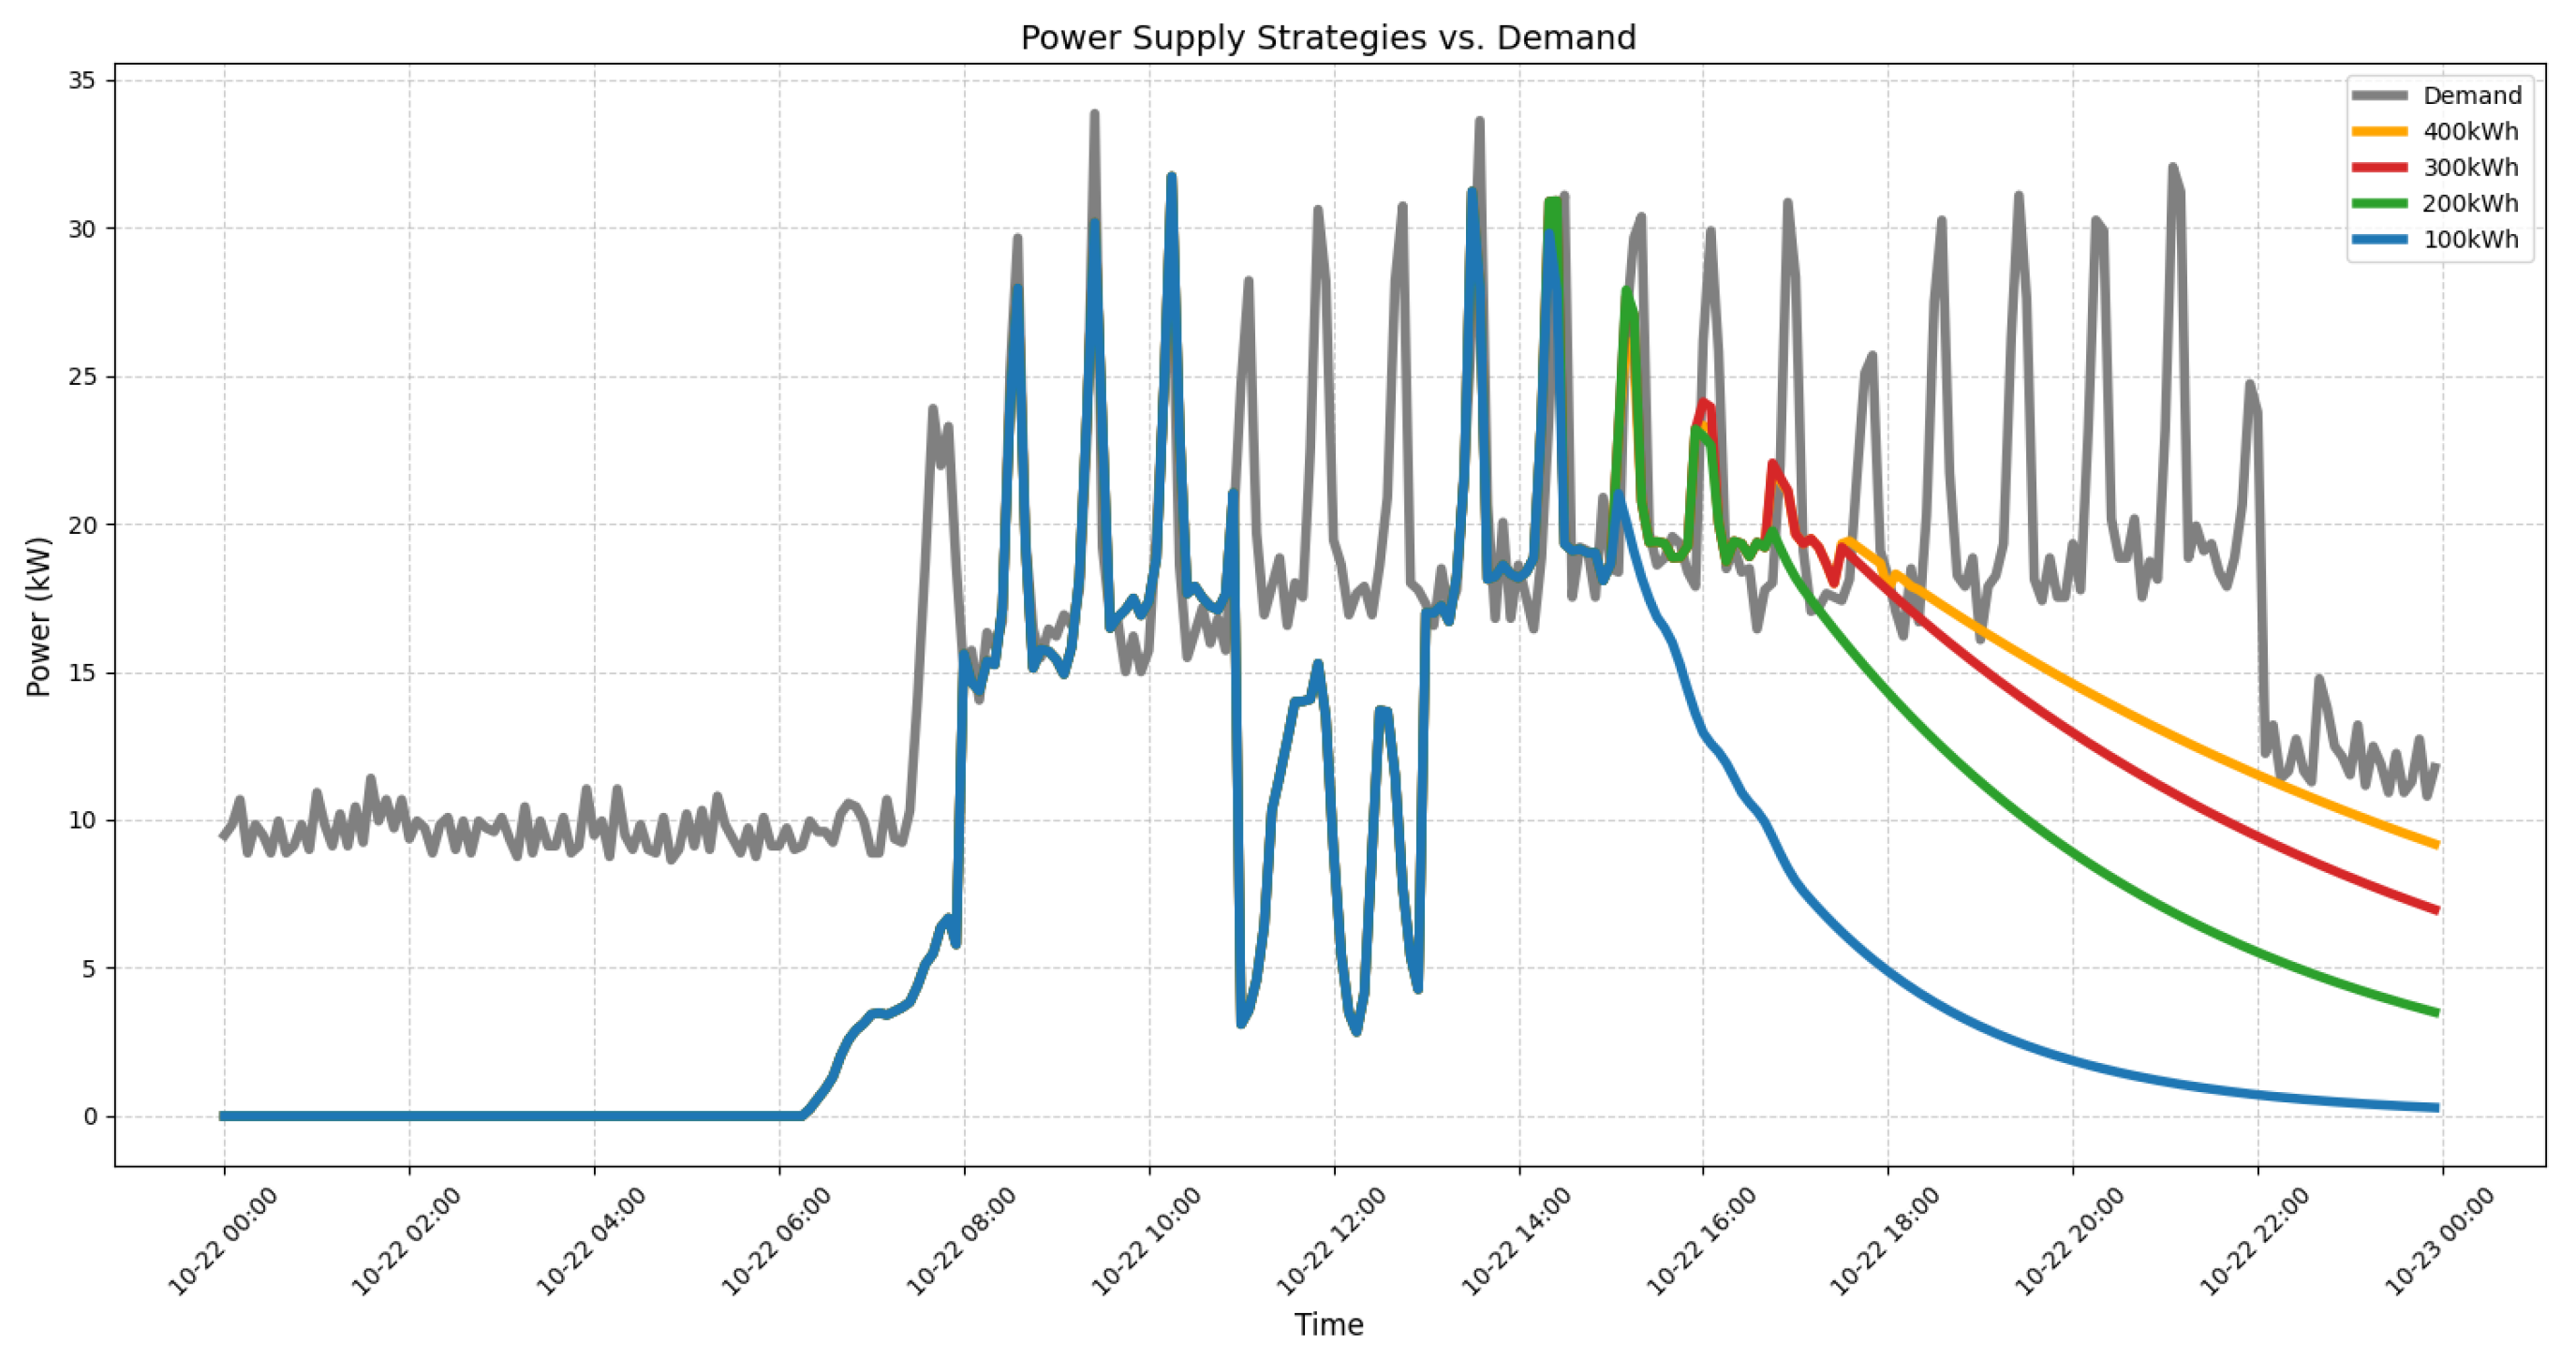
Figure 10 shows the simulated battery discharge curve of different battery capacities. It can be observed that increasing the capacity from 100 kWh to 200 kWh significantly elongates the time that the battery can supply power to the building. However, when the capacity continues to increase to 300 kWh and beyond, the improvement becomes less pronounced, and the benefit gained per unit of additional capacity declines noticeably. Therefore, a battery with a capacity of 200 kWh can ensure a longer duration of battery power supply while avoiding overinvestment in the battery system.

3.4. BESS Behavior Analysis

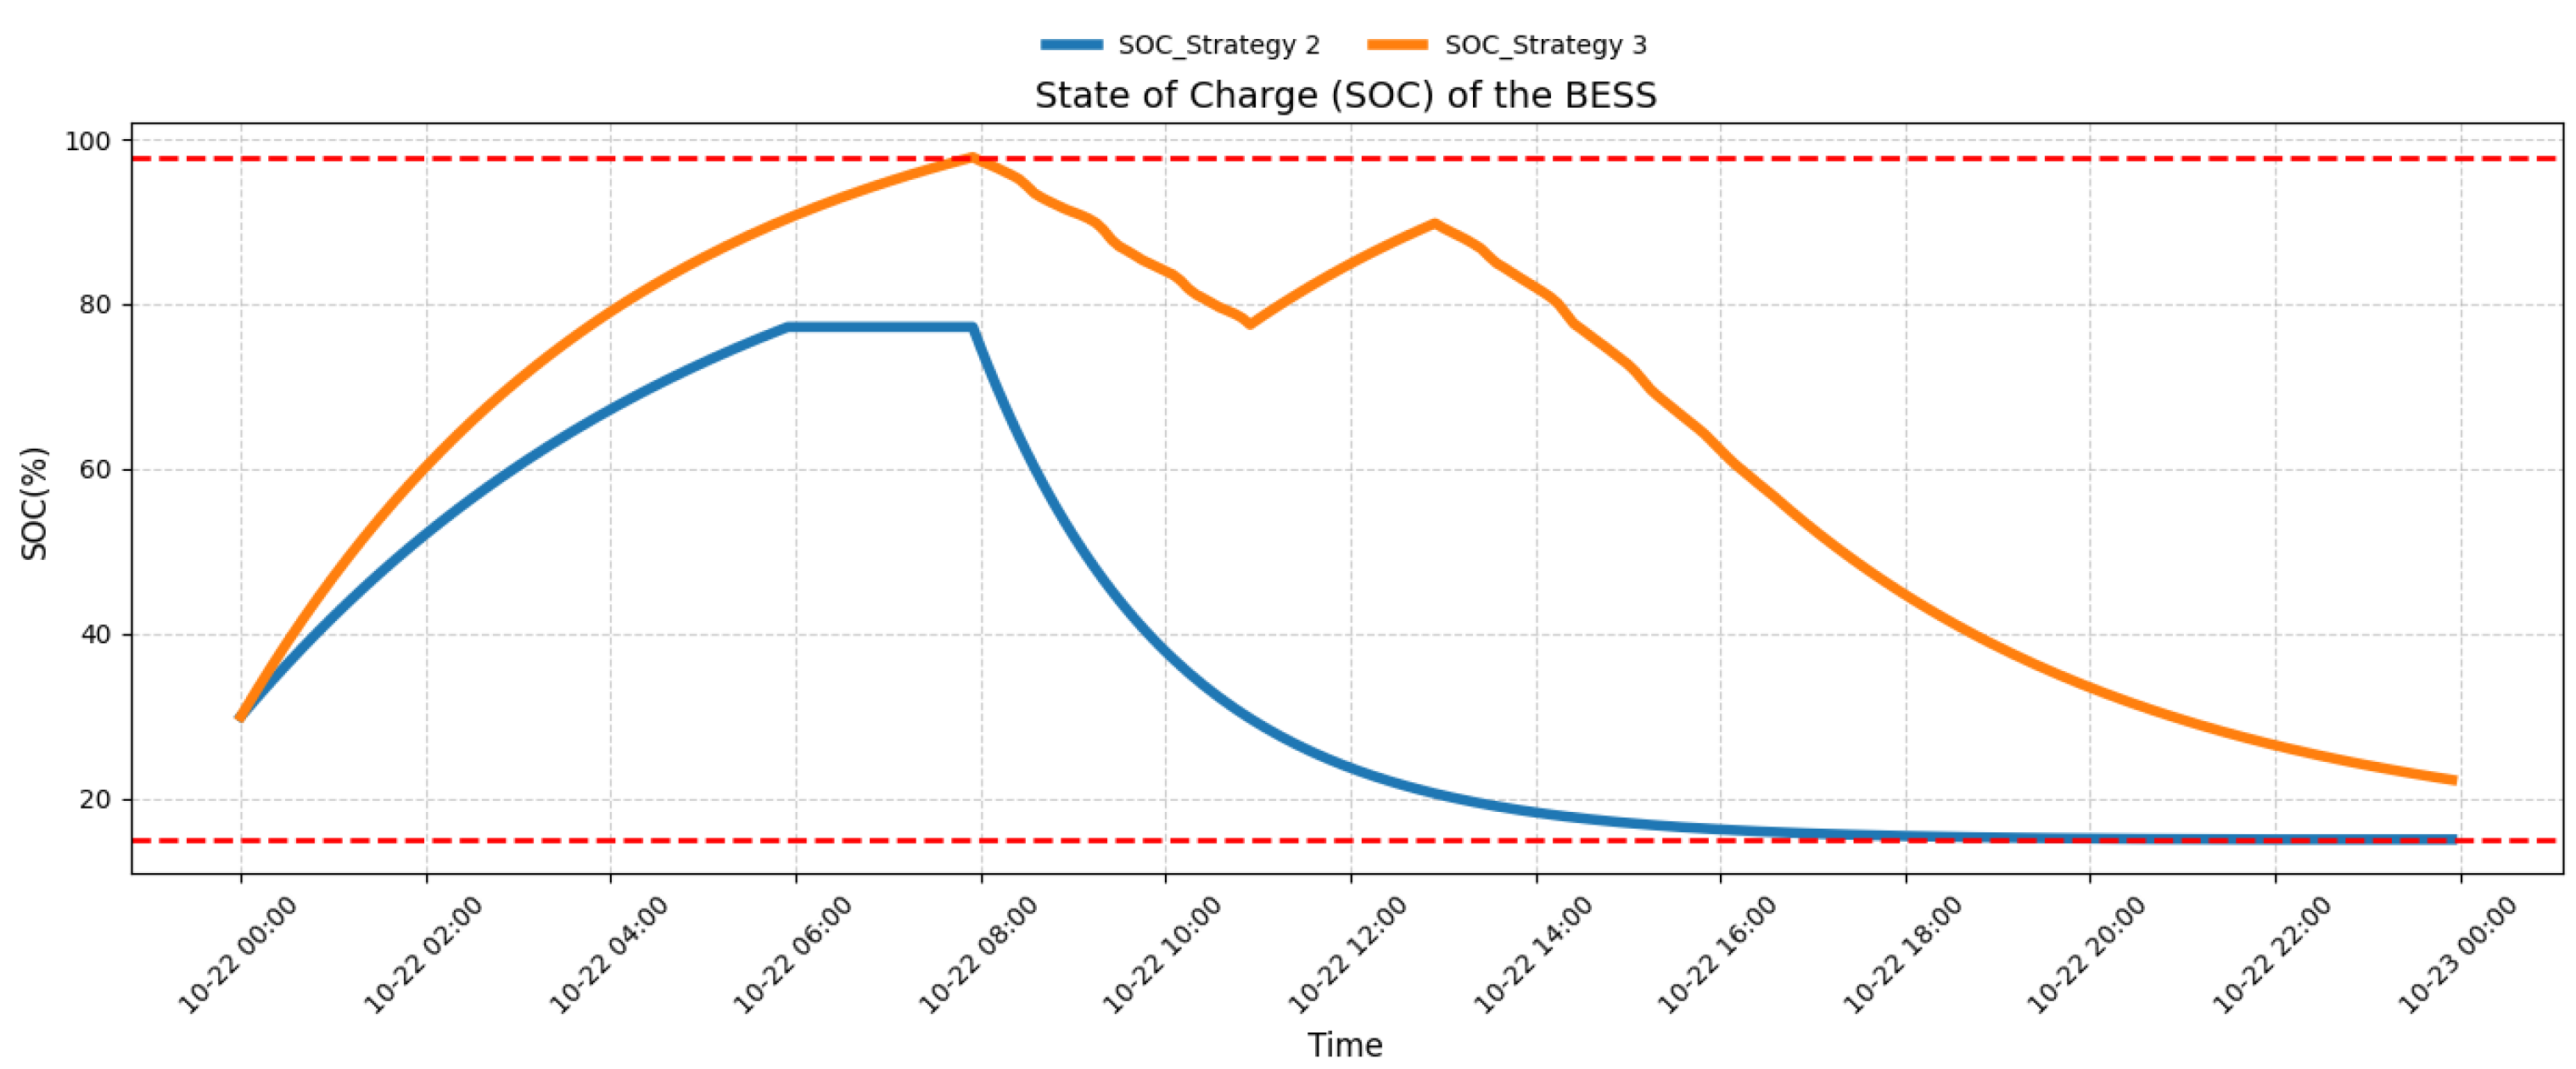
The modeling of the entire battery energy storage system is based on realistic product specifications. The nominal capacity of the battery is 100 kWh, and the maximum charging and discharging power is 50 kW. At the same time, compared with the traditional physical model, this model will be a purely data-driven implementation of the dynamic simulation of the battery charging and discharging behavior. (Strategies 2 and 3, illustrated in Figure 11 and Figure 12, correspond to PCBS and FOBS, respectively, and the red dashed line below refers to the upper and lower constraints)

3.4.1. SOC and Charging/Discharging Power

The SOC, charge, and discharge power of the battery system can intuitively show the basic performance of the battery energy storage system. Additionally, monitoring these two parameters is crucial for ensuring battery safety and prolonging its life.
Figure 11 and Figure 12 above show the sample state of charge fluctuations and real-time power changes in battery charging and discharging during the 24 h simulation. The battery discharge power changes according to the actual energy consumption demand, that is, from the original 100 kWh to 200 kWh. The intuitive response in the SOC diagram is to achieve a longer duration of power supply. The dynamic power simulation slows down the power rate when the SOC is close to full or discharged, which helps to extend the battery life. In the early morning, the energy storage system will charge at the maximum power rate within the permitted range of conditions. The gradual reduction in rate is to adapt to the changes in battery capacity to ensure battery life. After 8 a.m., the batteries start to discharge uniformly. The difference is that the existing strategy still starts from maximum power, and the energy storage control method driven by load forecasting can avoid peak waste and idle resources and provide more targeted energy support during the peak load period of the building, thereby effectively improving the response flexibility and operation efficiency of the building energy system. In addition, during the low electricity price period of 11:00–13:00 under the time-of-use electricity price policy, the battery in the optimization strategy will stop discharging and purchase low-priced electricity from the power grid first, thereby meeting the subsequent energy consumption at the lowest cost.

3.4.2. Temperature and Voltage

To maintain battery life and ensure safety, real-time monitoring of battery voltage and temperature is also required.
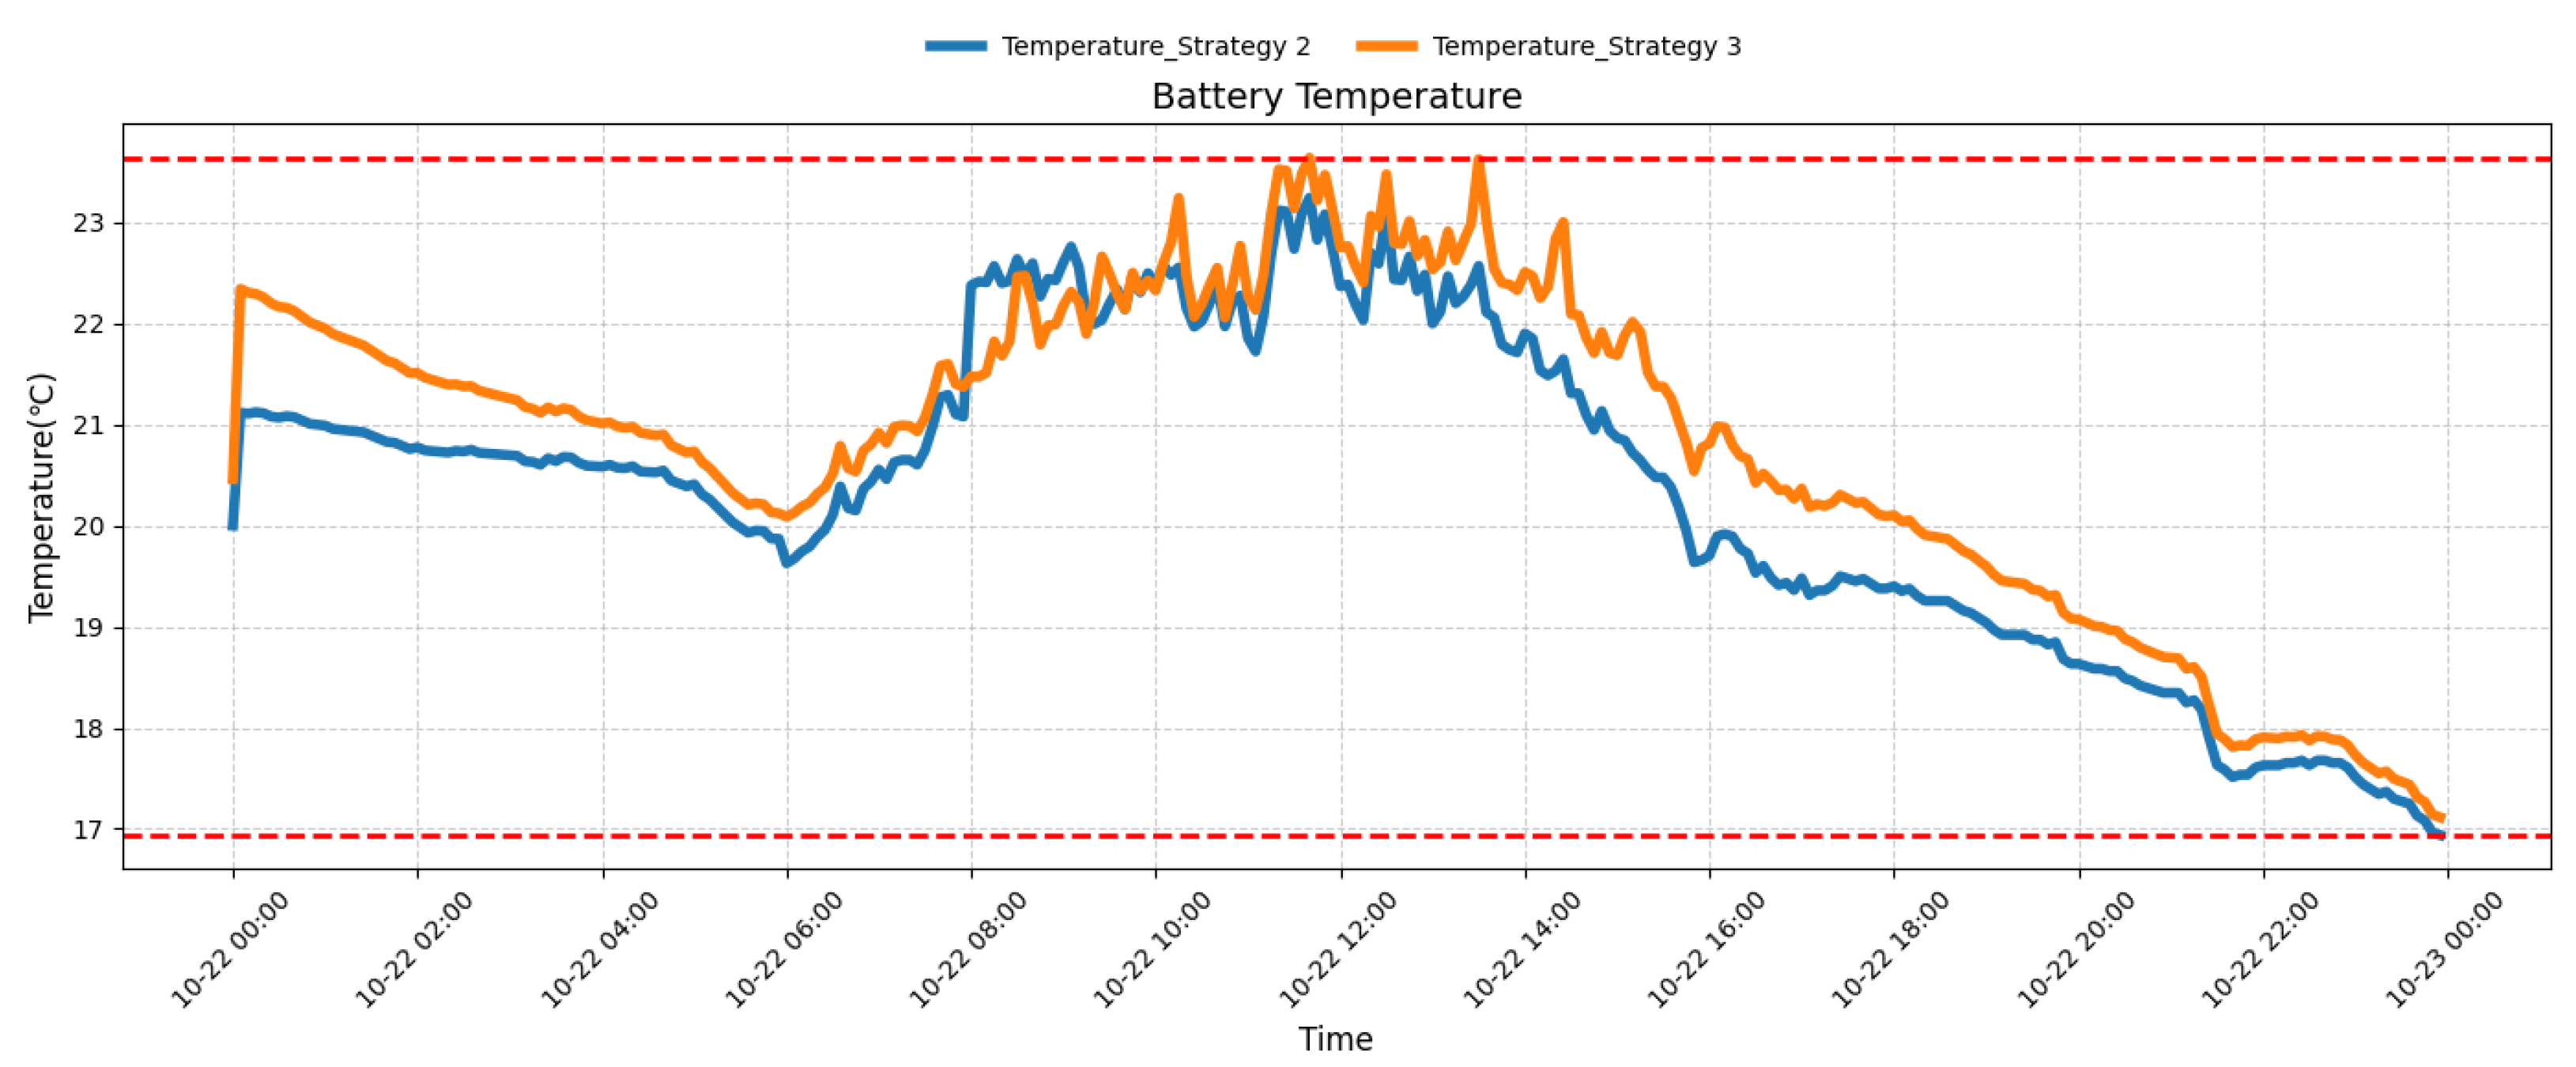
As shown in Figure 13 and Figure 14, the battery voltage and temperature are basically within the safe range, and the fluctuations of both are related to the battery power and SOC, respectively, mainly due to the simplified linear simulation of the battery voltage used in this study. (Red dashed lines below demonstrate the upper and lower constraints.)

3.5. Comparison of Key Indicators

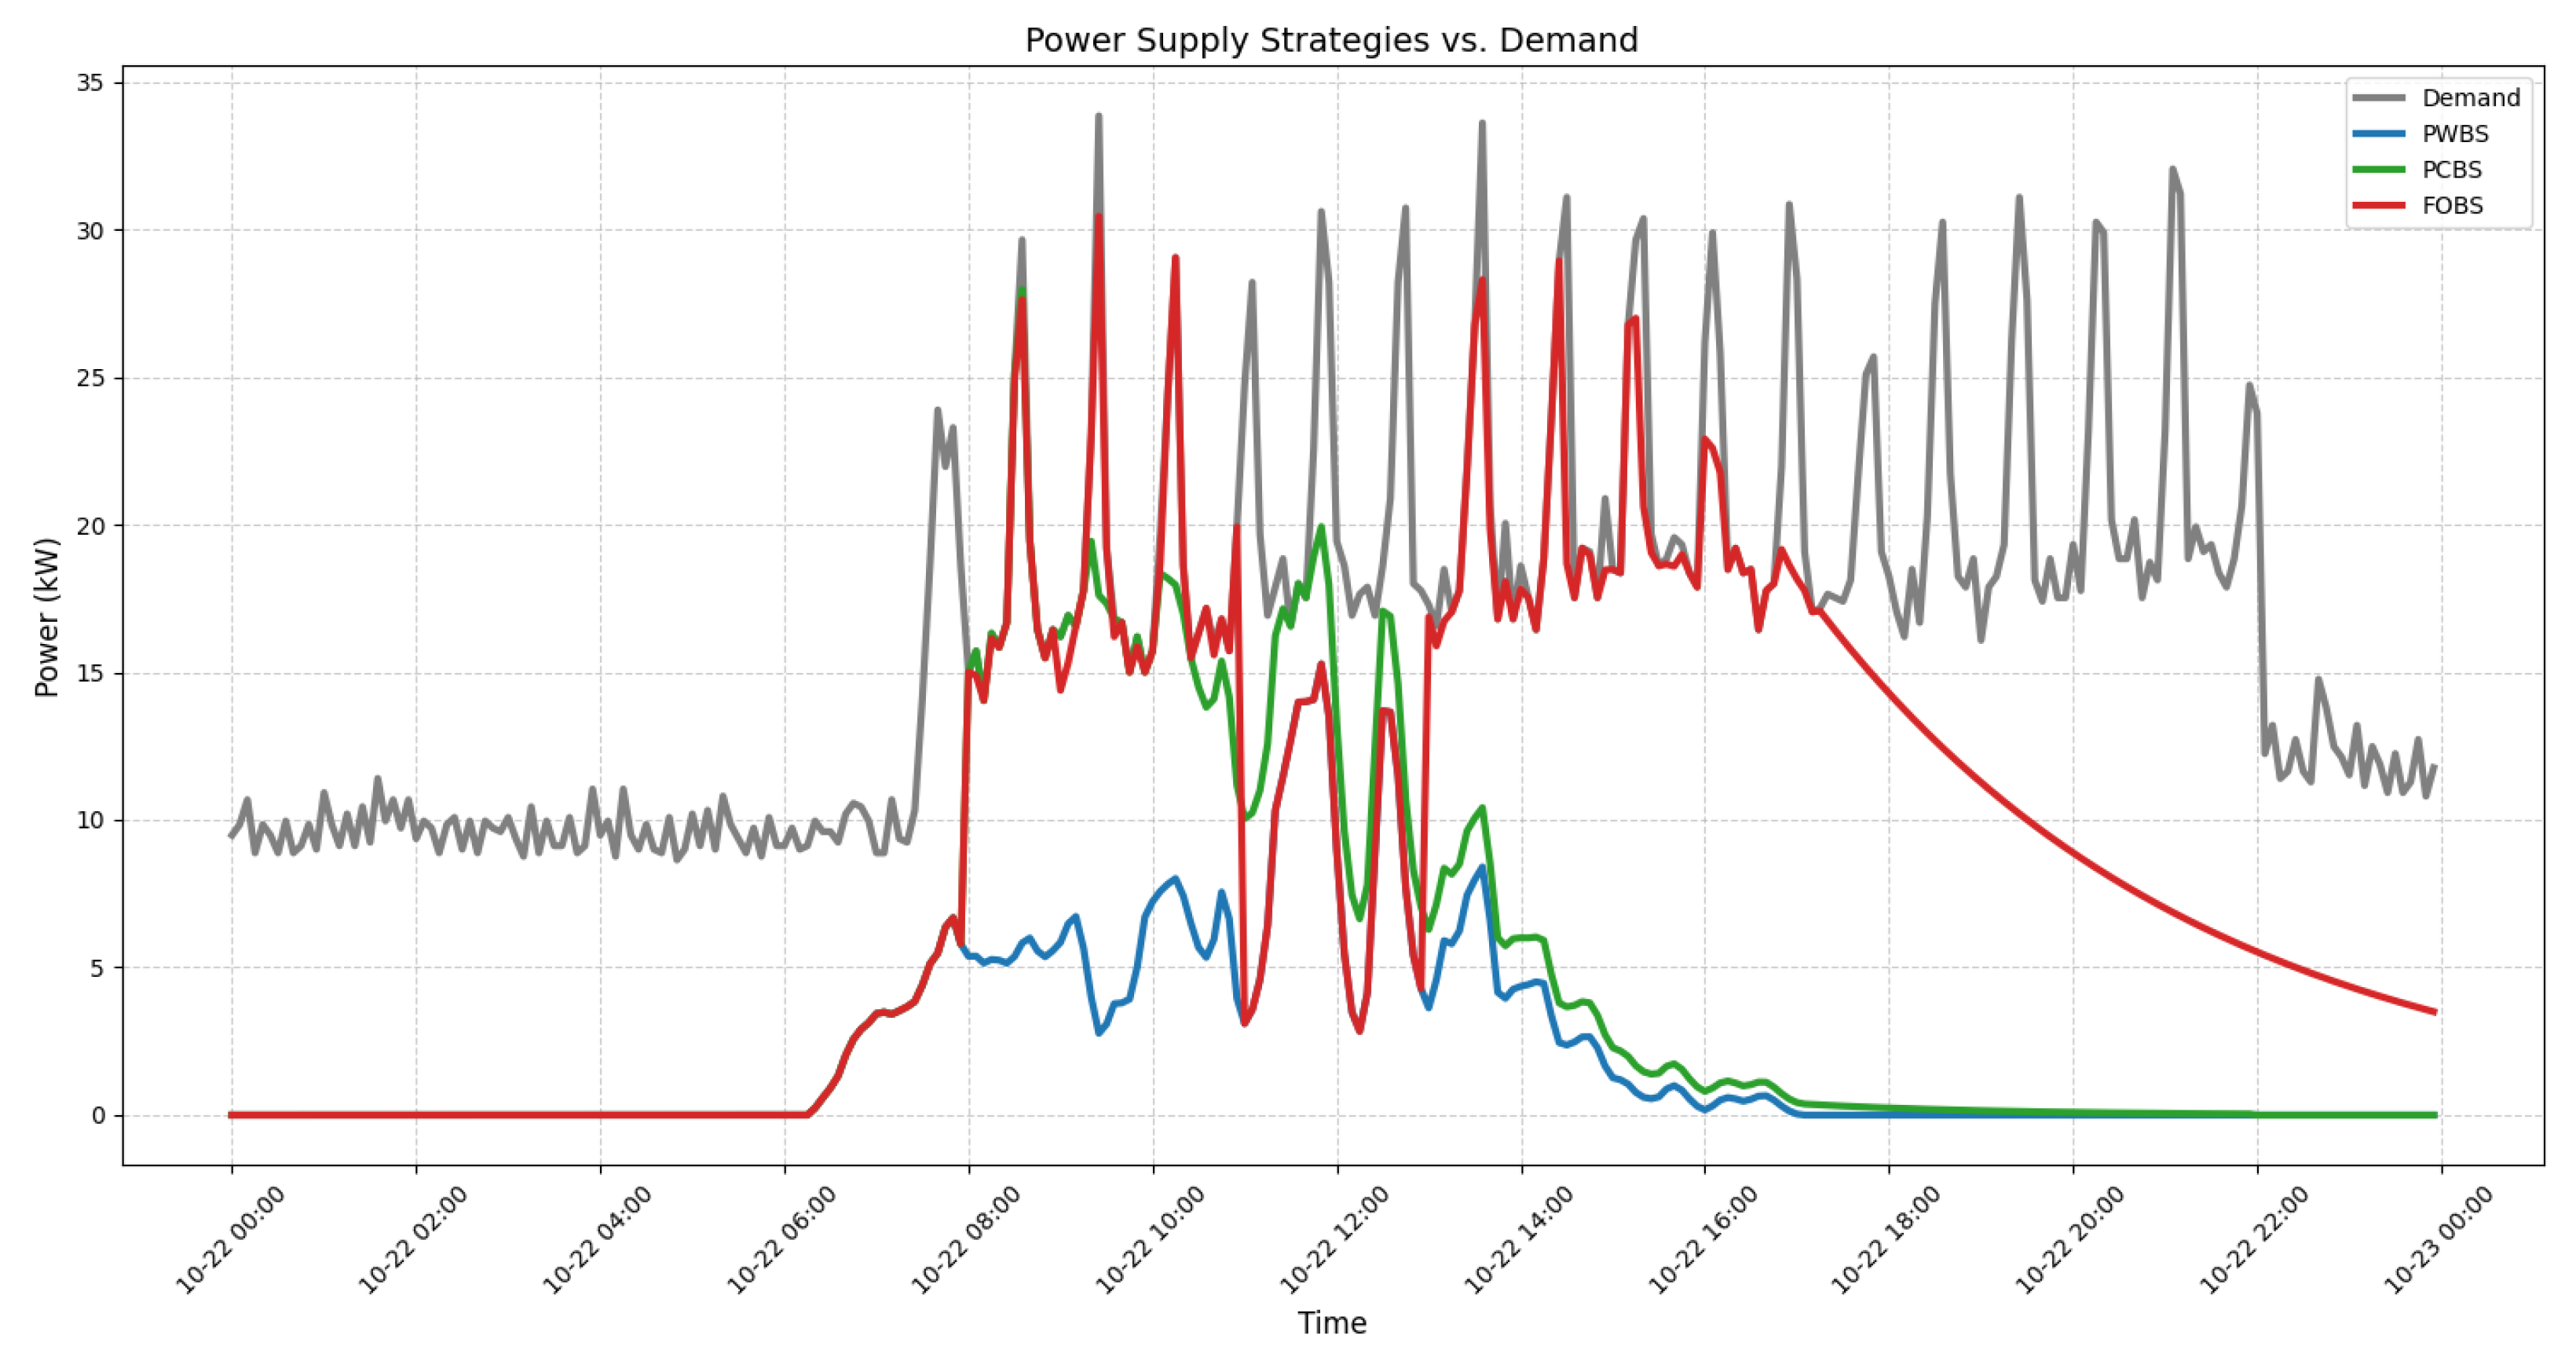
Figure 15 visualizes the building supply and demand relationship under the three strategies, with the battery storage system and the customized storage regulation strategy resulting in a significant improvement in energy supply in both quantity and time dimensions.
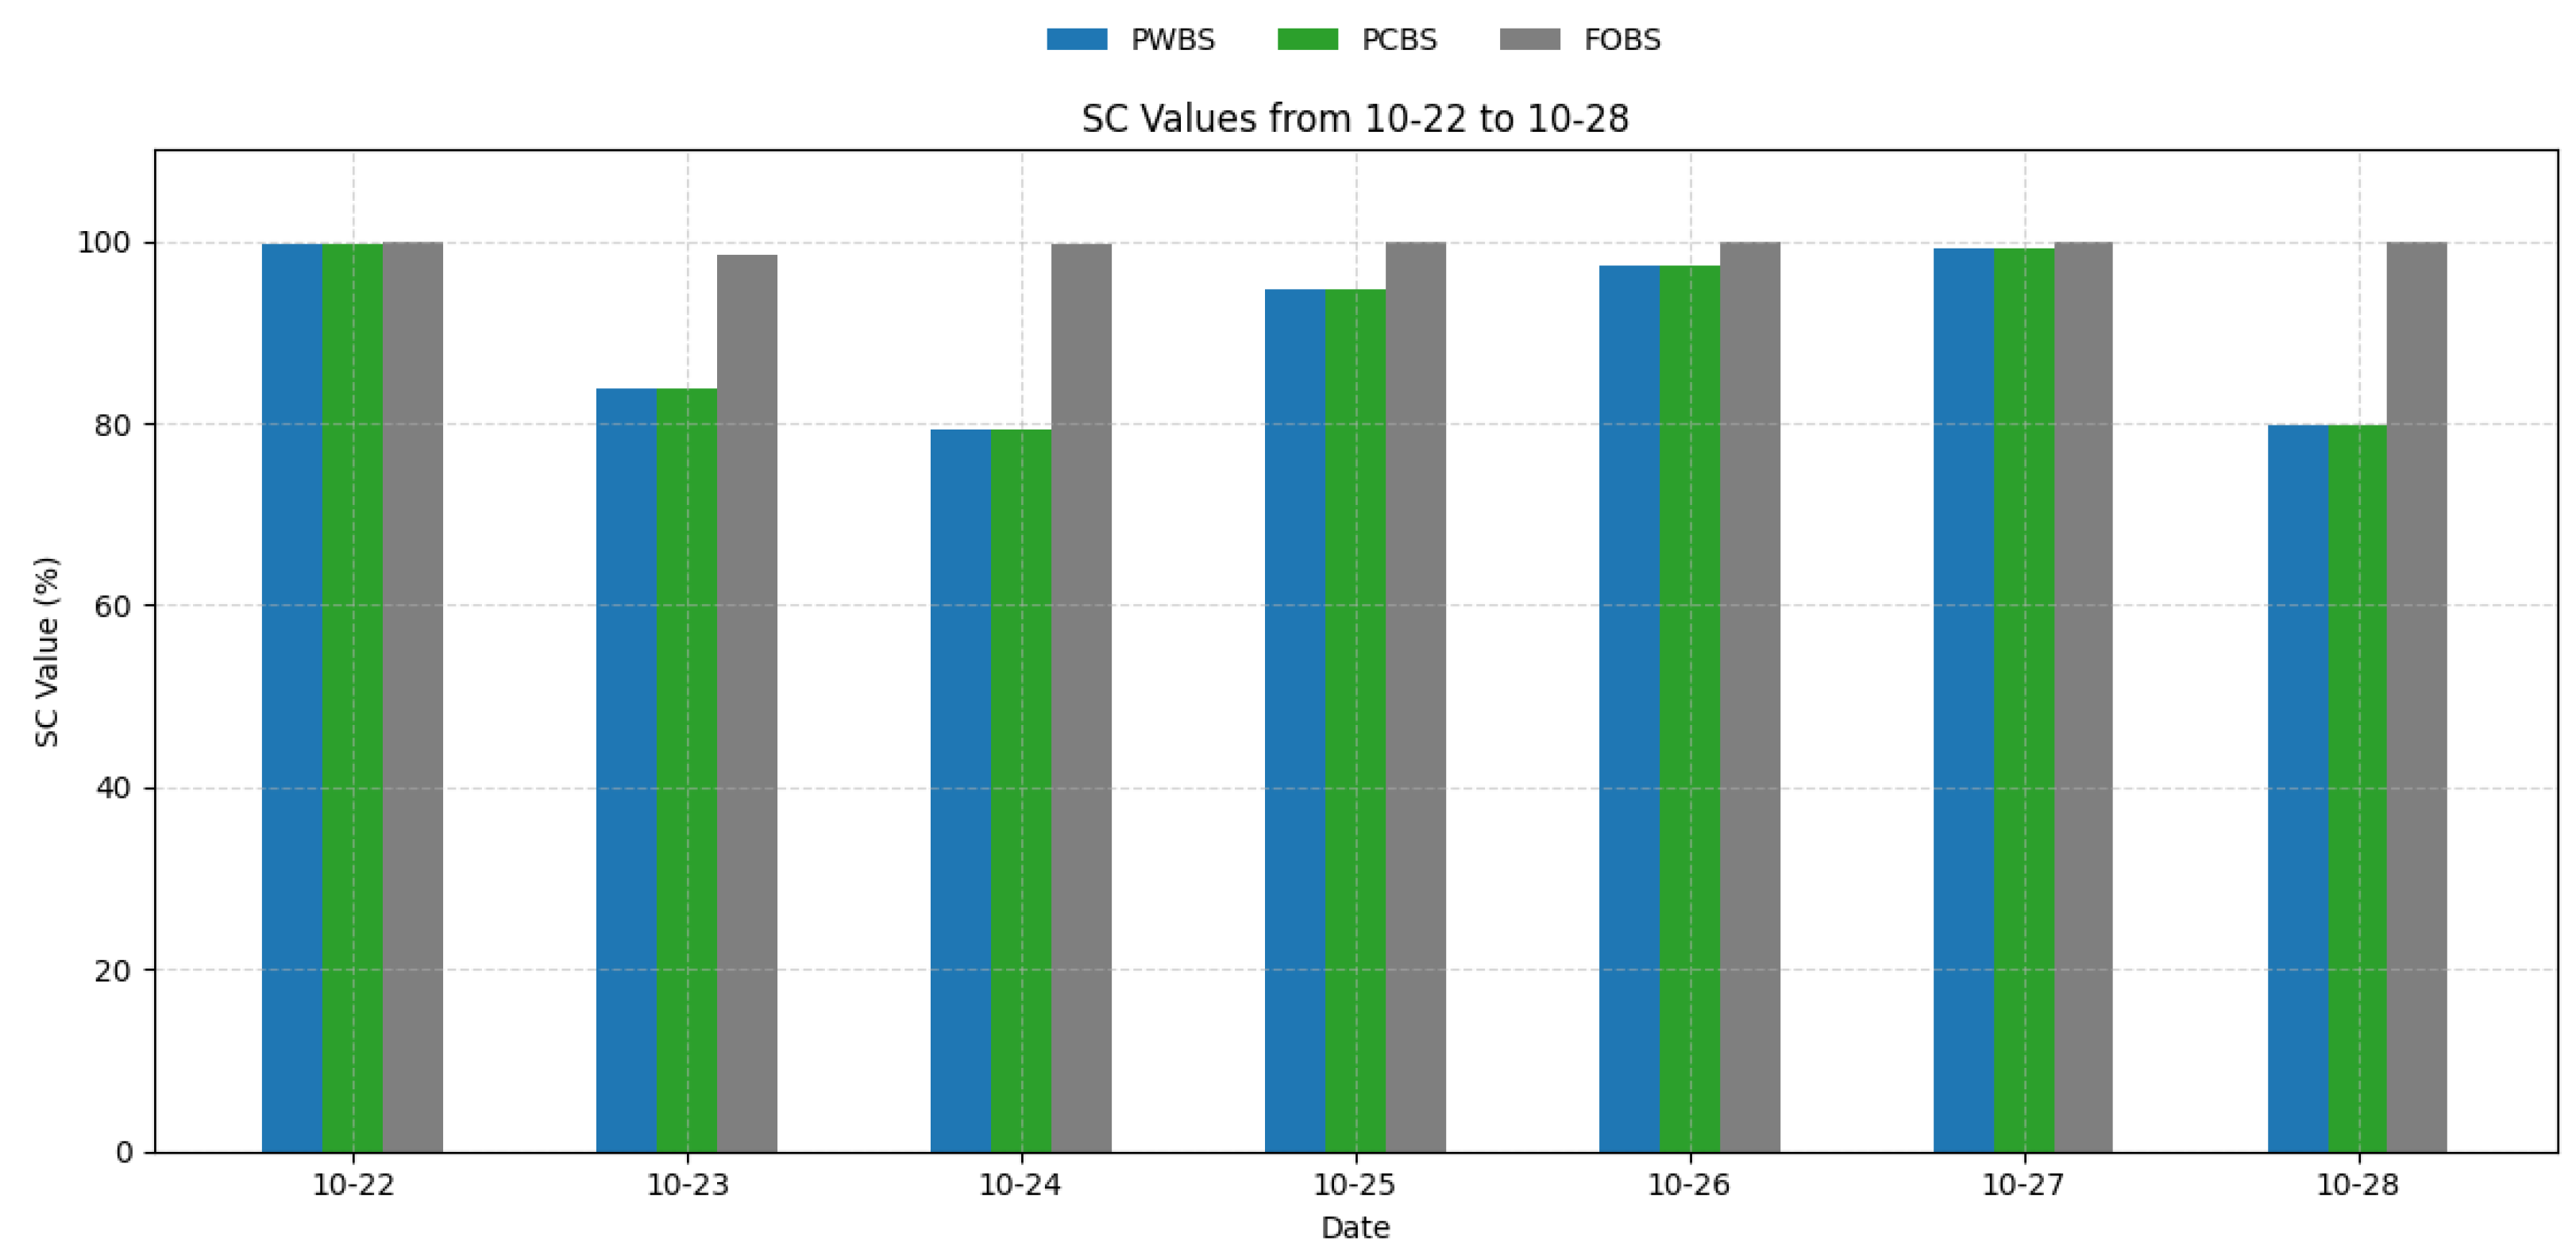
Self-consumption (SC) directly quantifies the utilization rate of on-site power generation, that is, the ratio of the part directly consumed by the building and charged into the battery to the total capacity, as demonstrated in Figure 16 and Table 9. It is worth noticing that the reason why PWBS and PCBS have the same value on SC is that although both battery storage and PV systems are applied in PCBS, there is no linkage between the two in the existing strategy, which means that the battery is not charged when PV is in surplus, resulting in limited PV utilization. The nearly 100% self-consumption directly reflects the high utilization rate of PV power after the optimization strategy. The BESS has effectively recovered daily excess PV power generation, alleviating the pressure on building energy demand. When PV power generation is much less than building energy consumption (such as on 22 October, lower PV generation may be caused by the block of clouds), PV power generation is directly used to offset building energy consumption, resulting in little difference in the SC indicator. However, when it is sunny, PV power generation far exceeds building energy consumption most of the time during the day. At this time, if there is no battery energy storage system to link with the PV system (that is, to store electricity), the excess PV power generation will be wasted, which is specifically manifested in a significant reduction in the PV self-consumption rate.
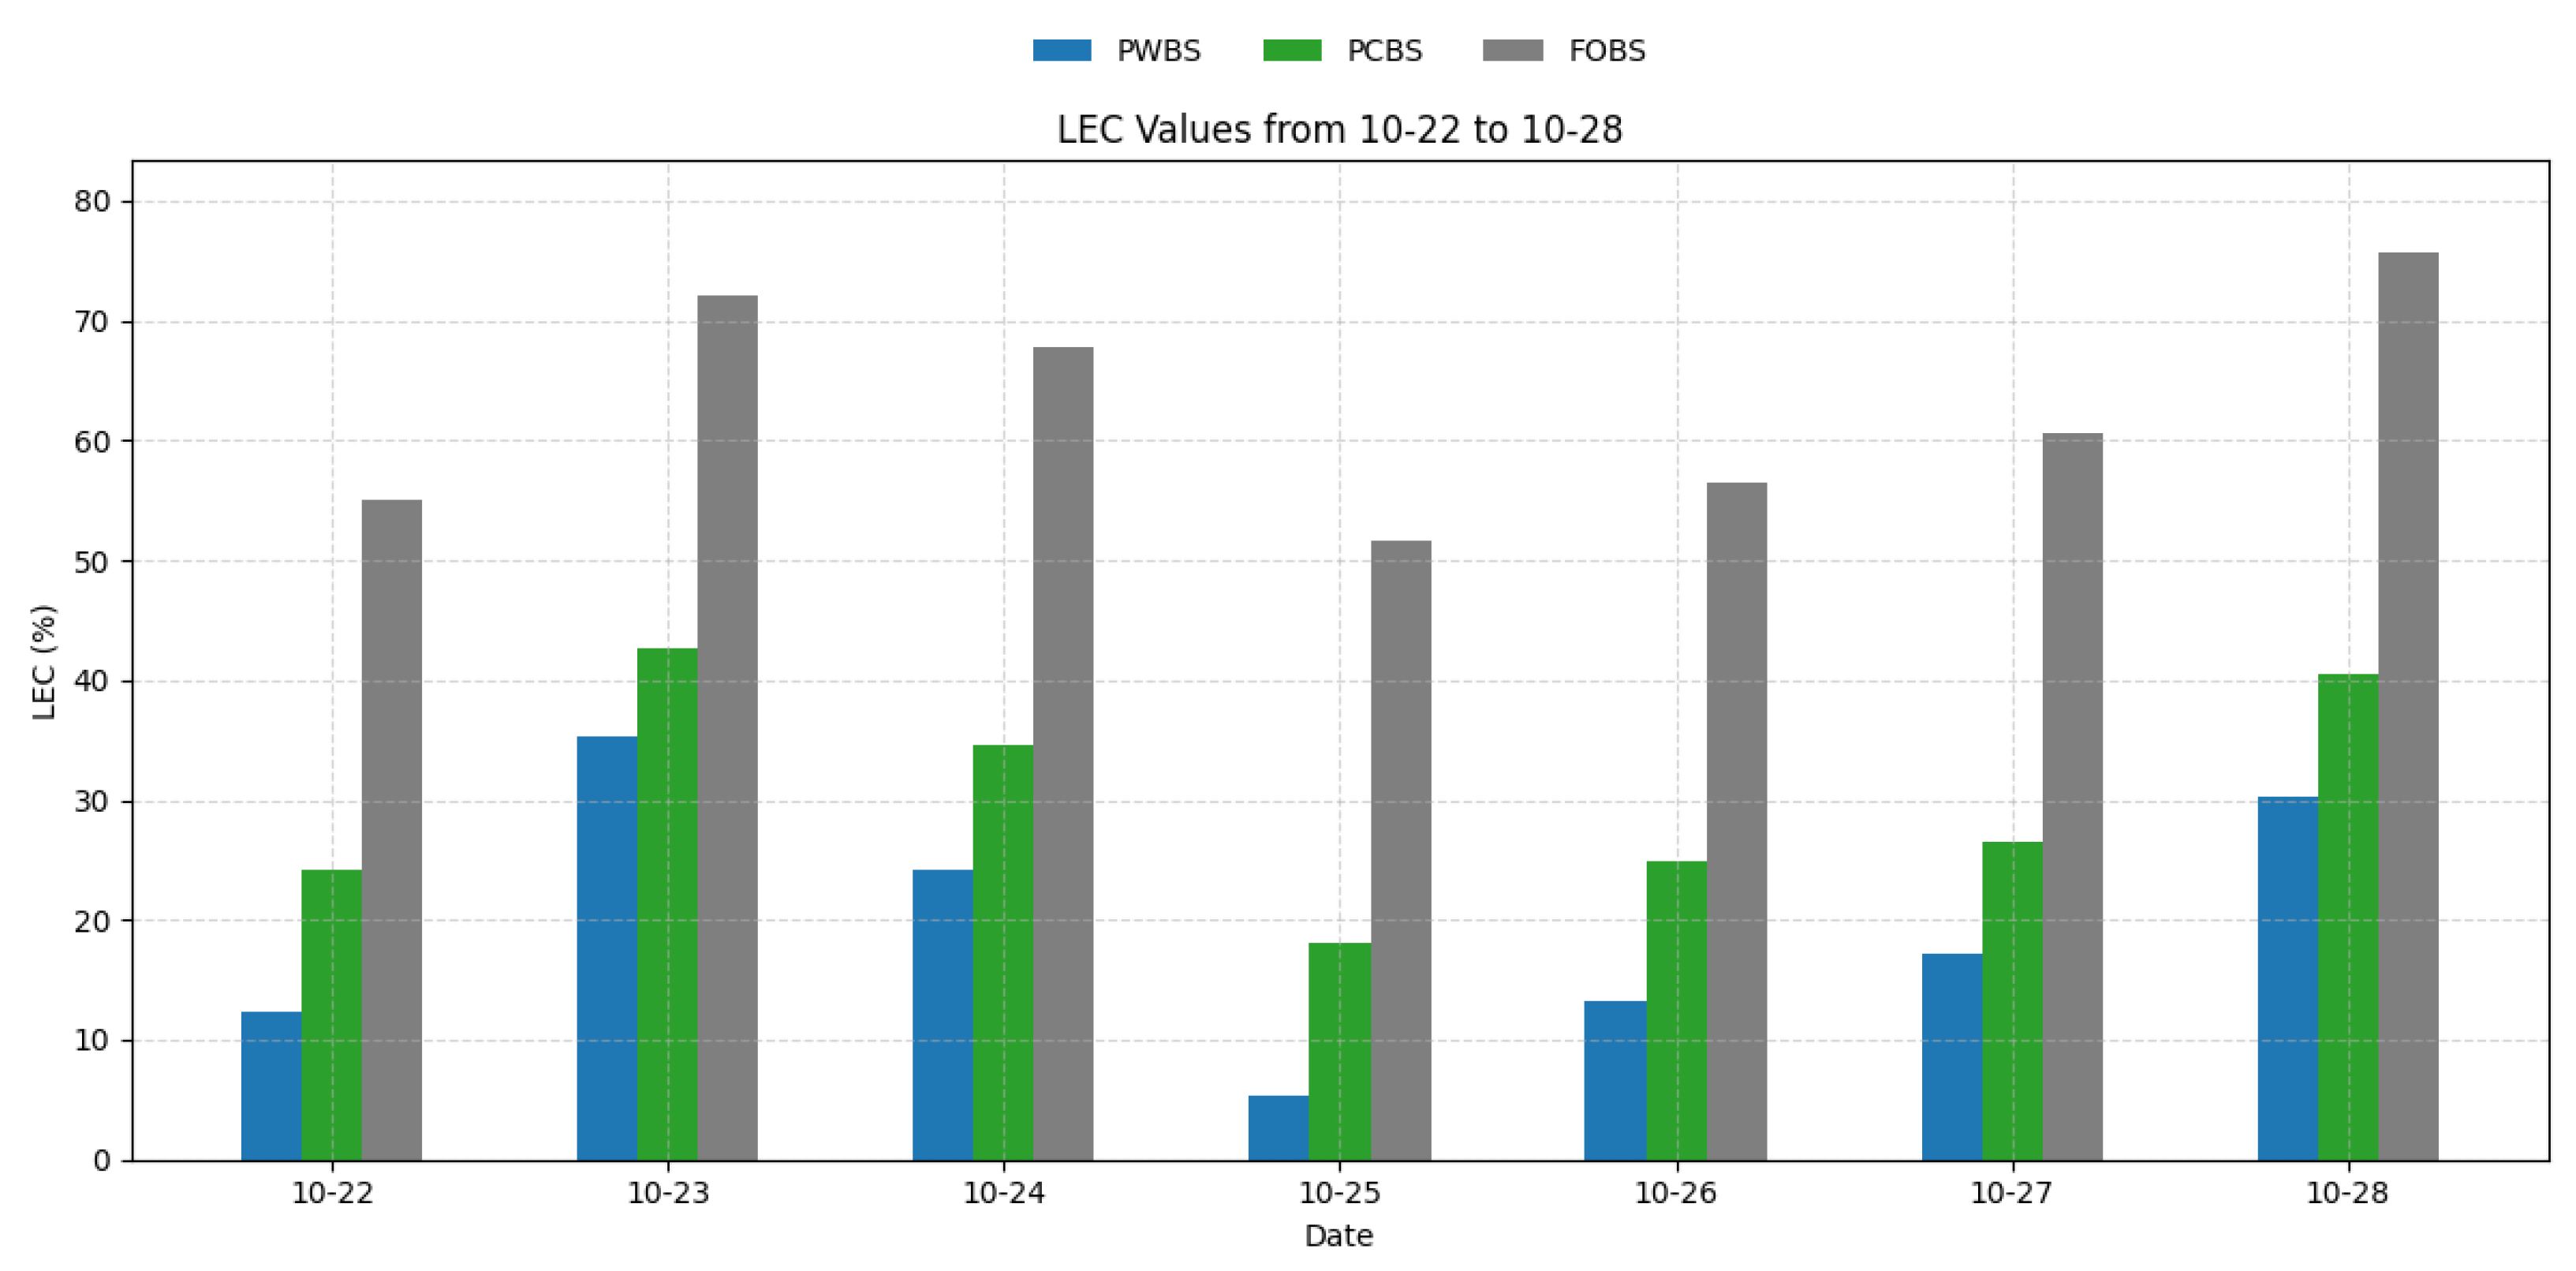
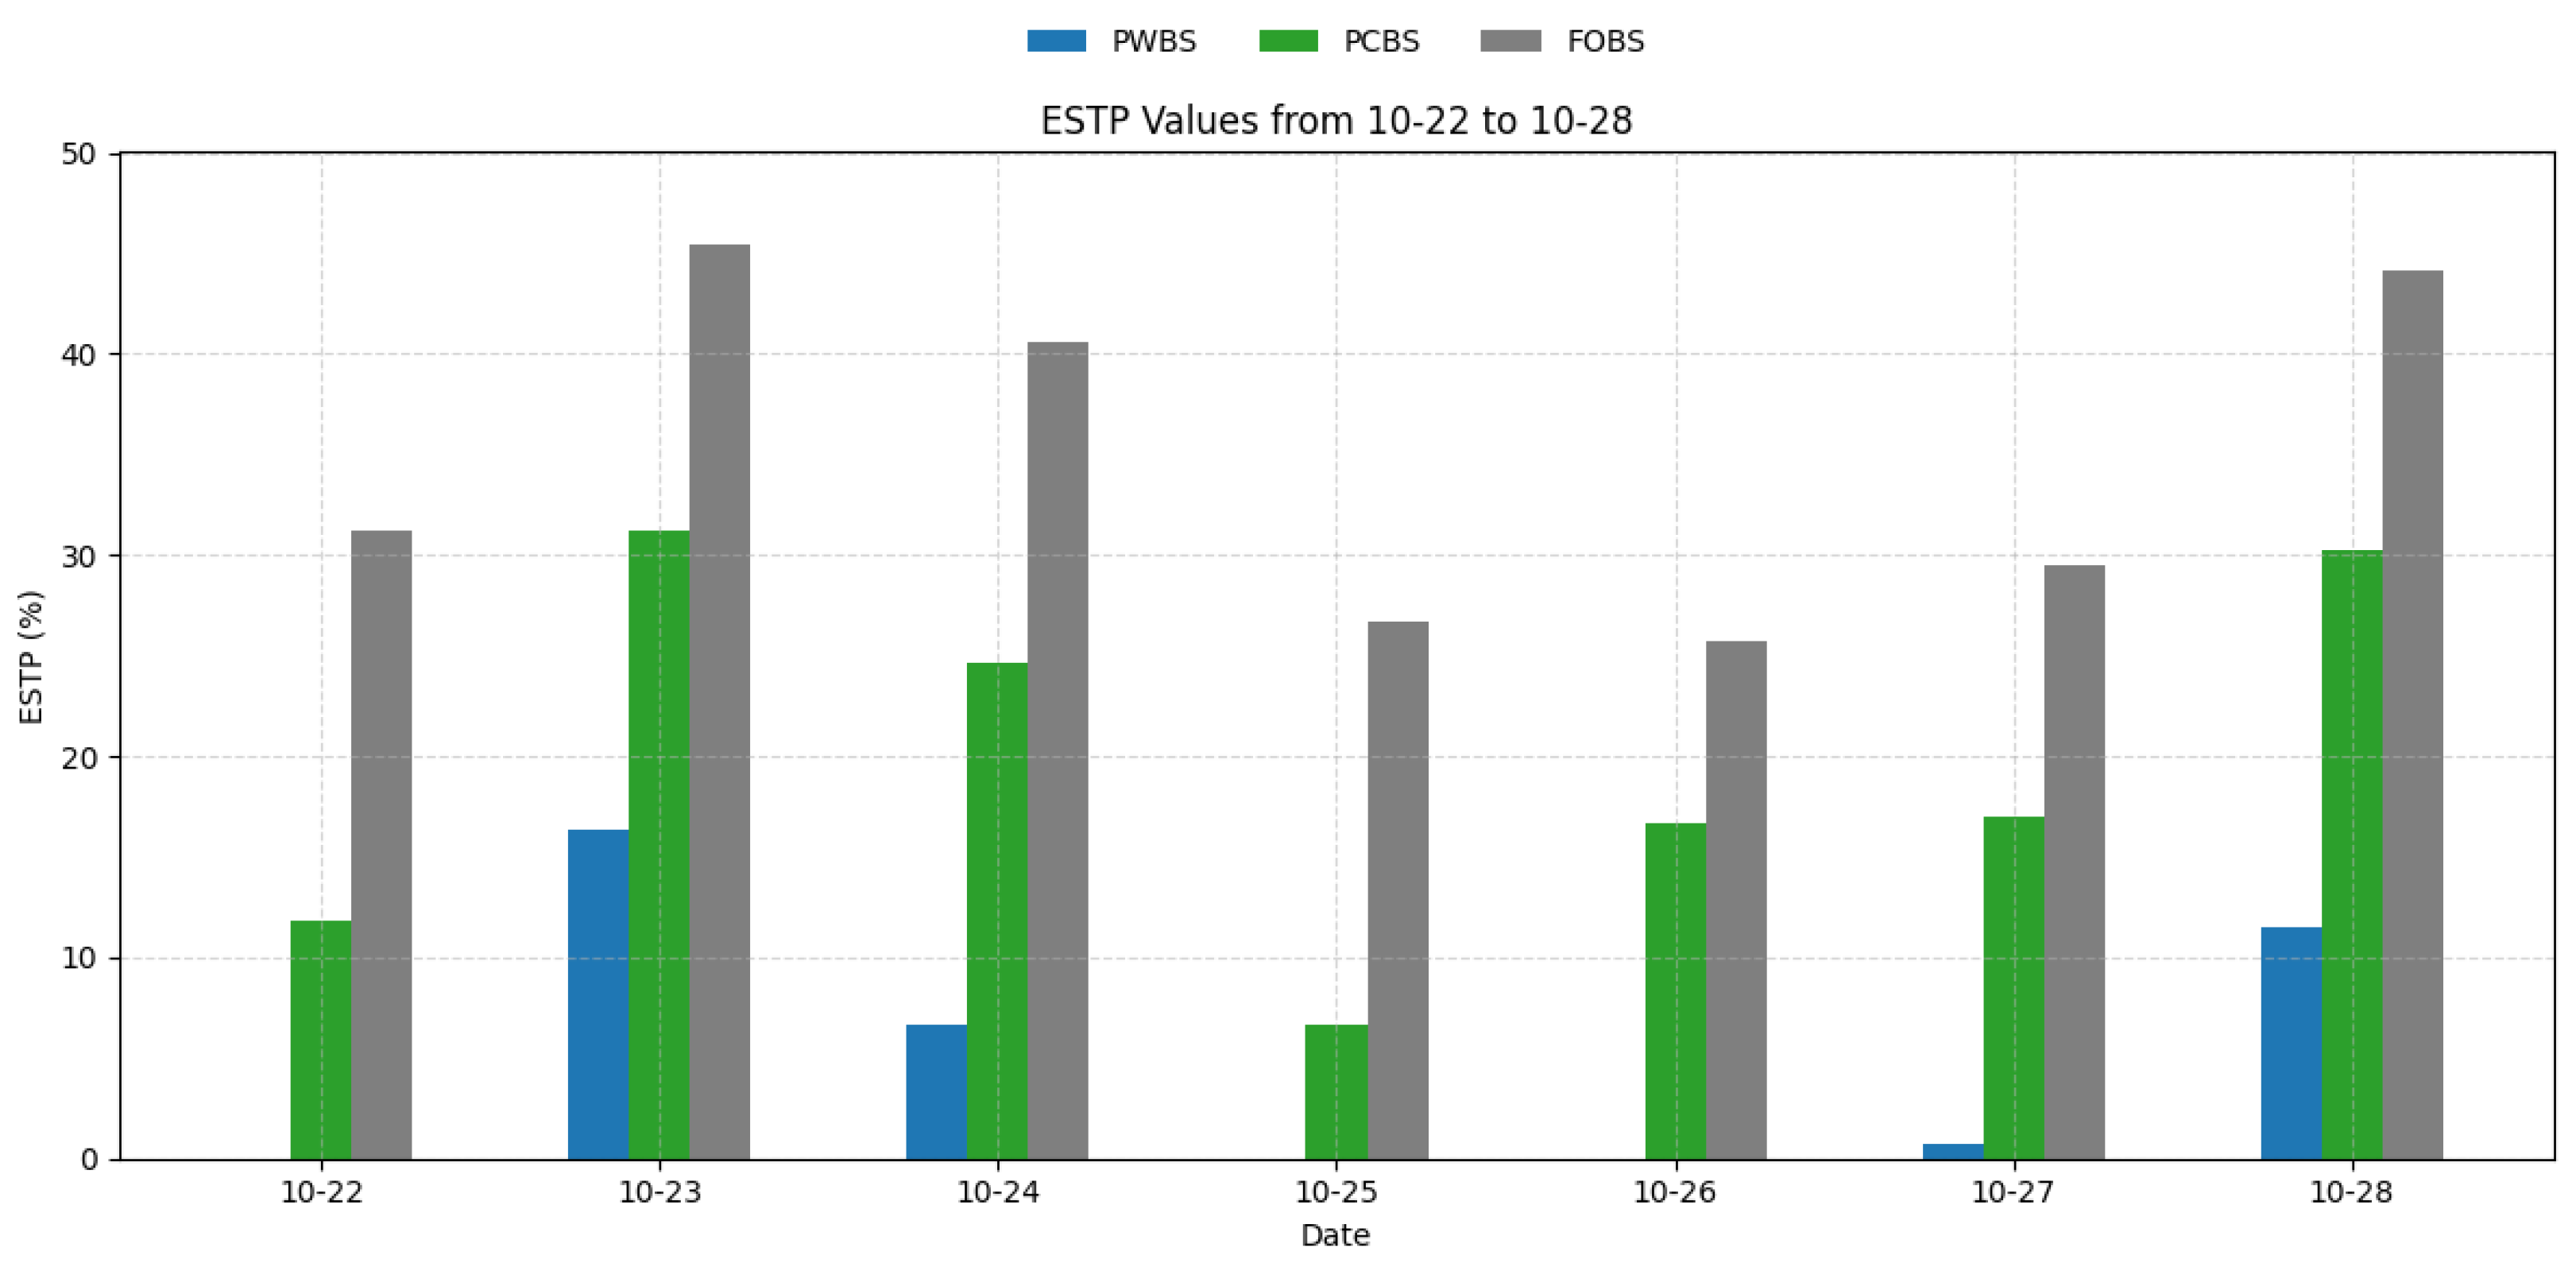
According to the results in Figure 17 and Figure 18 and Table 10, it can be found that the optimized control strategy group (FOBS) performs best in both local energy supply coverage (LEC) and energy surplus ratio (ESTP), followed by PCBS (existing strategy) and finally PWBS (without energy storage). This significant difference in values preliminarily illustrates the effectiveness of the optimized control strategy. The local energy supply coverage (LEC) describes the ratio of total energy supply (PV and energy storage) to local building energy demand, reflecting the building’s dependence on external energy systems at a macro level and indicating the building’s localized management potential. The group without a battery energy storage system obviously has very limited performance in local energy supply, but the addition of a battery energy storage system (PCBS) has significantly improved this situation, as shown by the increase in LEC values.
On this basis, the LEC of the FOBS, with the addition of the optimized energy storage regulation strategy, due to its improvements in battery capacity and storage of PV surplus generation, generally exceeds 50%. Based on LEC, the energy surplus ratio (ESTP) verifies the dynamic coupling degree of supply and demand in the time dimension under different strategies, revealing the instant response capability and load adaptability of the local energy system. The relatively high value of FOBS confirms that the optimization control strategy enables the building energy system to effectively achieve supply and demand balance in real-time operation, reducing the possibility of external energy dependence or load abandonment.
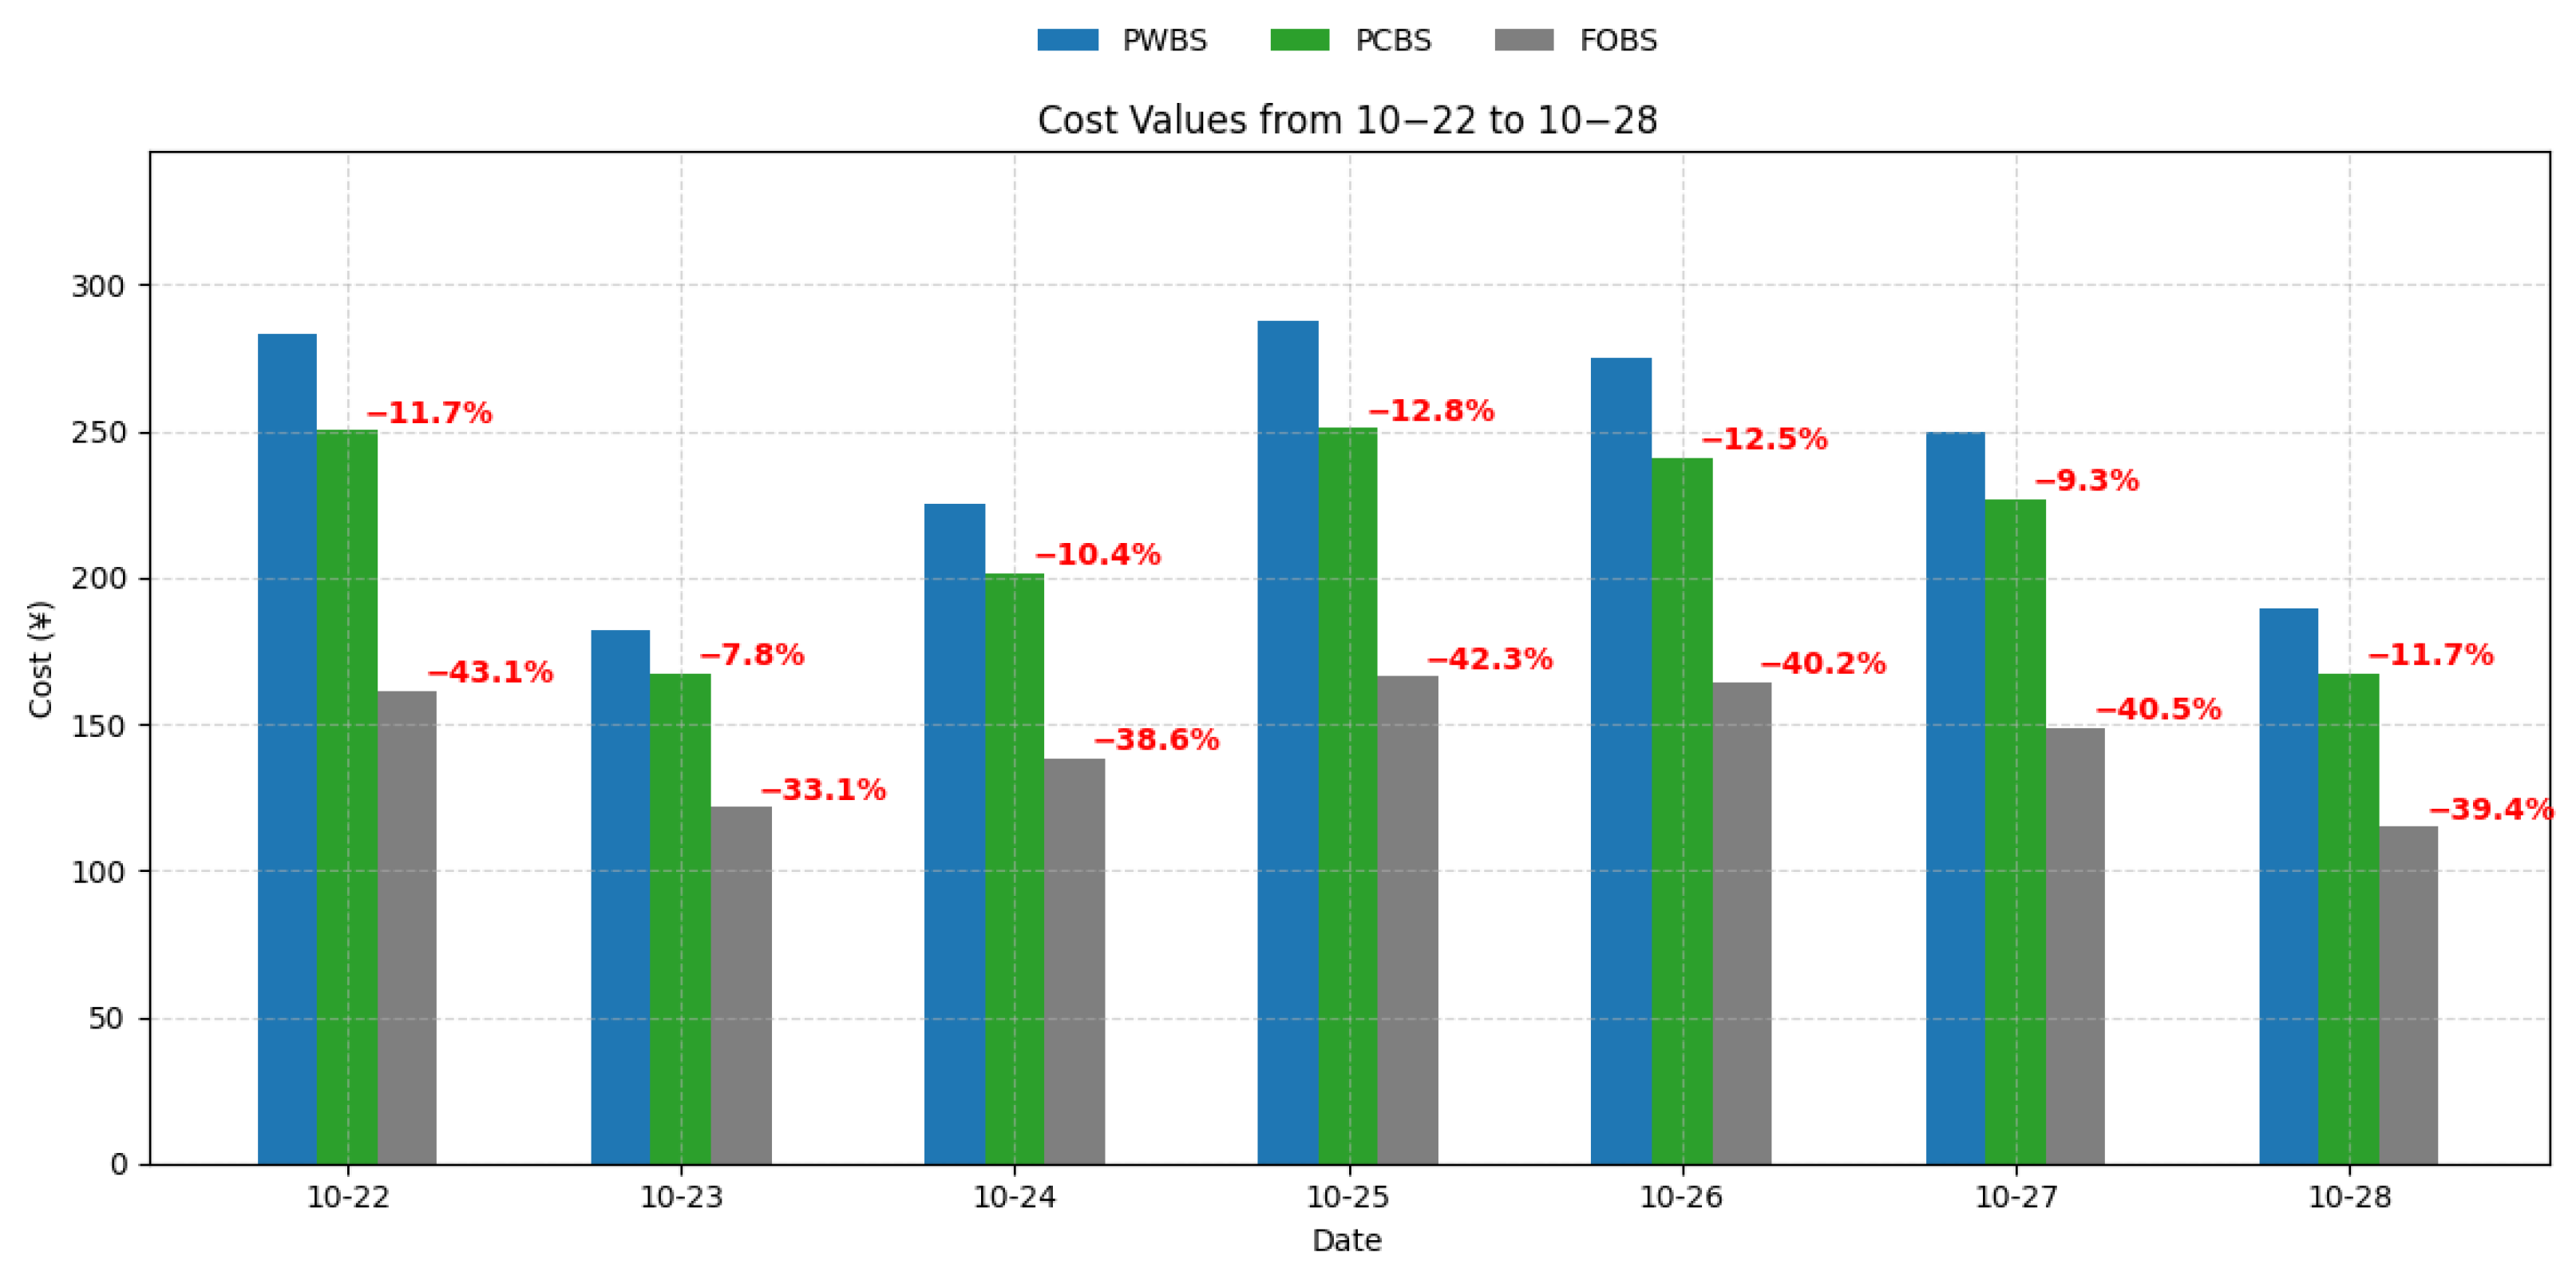
Energy expense saving is a significant indicator of the economics of building operation, and Figure 19 and Table 11 show that the baseline strategy (PWBS) is generally the highest, while the existing strategy (PCBS), joining the BESS, achieves energy cost reductions on most dates, with an average reduction of about 11%. The FOBS group, based on flexible optimization and combined with the tariff policy, achieves the largest cost savings in the selected week, with reductions ranging from 33.1% to 43.1%. This demonstrates that the strategy has superior energy cost-saving capabilities in multi-day operations, providing a basis for its practicality.

3.6. Comparative Discussion of Methods and Results

While a number of studies have been reported in the same field, there are substantial differences in building and energy system configurations, operational scenarios, and evaluation metrics for energy flexibility, etc. Consequently, the study presented in [2] has been chosen as a proper target for an attempted comparative discussion. Compared with the PCNN-MPC framework applied to a tropical zero-carbon office building in Singapore [2], the proposed method offers distinct advantages and trade-offs. The PCNN-MPC approach achieved around 20% and 17% improvements in PV self-consumption and self-sufficiency, respectively, in its own case but relies on detailed building physical parameters and intensive computation at each control step, which may constrain its scalability in real-world applications. For instance, the training and inference of PCNN also involve physical consistency constraints, further increasing the computational load. In contrast, the forecasting-based strategy developed in this study achieved nearly 100% PV self-consumption and a local energy coverage of 62.75% in the autumn case study, while requiring only historical demand and meteorological data, and incurring much lower computational costs. Furthermore, while PCNN-MPC focuses on peak shaving through demand decrease indicators (DDP, EDP), our multi-indicator framework (SC, LEC, ESTP) provides a broader temporal and economic perspective on energy flexibility. It should be recognized that it may not be a fair comparison, as the two models’ training mechanisms, data availabilities, and system operation scenarios are not well aligned. Nevertheless, these comparisons highlight that both methods enhance renewable utilization through BESS scheduling and propose reasonable energy flexibility quantification, but the proposed framework in this study is more applicable for data-scarce contexts and scalable deployment.

4. Conclusions and Future Work

This study proposed and validated a battery-based approach for enhancing building energy flexibility, using a net-zero carbon building located in a region with cold winters and hot summers in Ningbo, China, as a case study. Two operational PV-BESS strategies were analyzed—an uncoordinated baseline and a coordinated strategy with load forecasting—both compared against a PV-only scenario. During the strategy simulation, LSTM and rolling-XGBoost models were employed to forecast building energy demand and PV generation, achieving R2 values exceeding 0.90 across all test cases. Accurate forecasting proved essential for implementing the optimized dispatch strategy, enabling better alignment between energy supply, demand, and control actions. The moderate expansion of the battery capacity further enhanced the system’s support capability, contributing to reduced reliance on the external grid. To systematically quantify these improvements, a flexibility assessment framework integrating three indicators (self-consumption, local energy coverage, and energy surplus time) was applied. Results showed that the optimized strategy achieved nearly 100% PV self-consumption, a local energy coverage of 62.75%, and an energy surplus time of 34.77%, with energy cost reduced by about 40% compared to the PV-only scheme. Overall, the coordinated strategy significantly improved both flexibility and cost-effectiveness by aligning energy use with supply and tariff signals.
Beyond these case-specific findings, this study contributes to addressing key research gaps in the literature. By introducing a multi-indicator assessment framework (SC, LEC, and ESTP), it moves beyond single-indicator evaluations and provides a comprehensive quantification of building energy flexibility. The integration of forecasting models with BESS regulation demonstrates the value of predictive control, system-level coordination, and appropriate battery sizing under uncertainty, while the data-driven and computationally efficient framework ensures practical feasibility and scalability. Together, these contributions offer a replicable assessment approach and deliver actionable insights for advancing the real-world implementation of energy flexibility strategies in net-zero buildings. Future research can build on this work in the following areas:
  • Enhance forecasting: Develop more accurate load prediction methods using hybrid or deep learning models to improve control decisions.
  • Broaden system scope: Incorporate flexible loads such as HVAC or EV charging to expand demand-side flexibility potential.
  • Evaluate long-term impacts: Analyze battery degradation and life-cycle costs to assess sustained economic and environmental benefits.
  • Validate in practice: Implement pilot studies in varied building types and climates to test the real-world applicability of both strategies and flexibility assessment frameworks.
Future research should focus on strengthening these areas to better enable scalable, intelligent, and cost-effective building flexibility management, thereby supporting the broader transition toward low-carbon and resilient energy systems.

Author Contributions

Z.Y.: conceptualization, writing, review, and editing. D.K.: writing—review and editing. Z.C.: investigation and resources. Z.Z. (Zhiang Zhang): funding acquisition, supervision, and validation. D.D.: funding acquisition, supervision, and validation. Z.Z. (Ziyue Zhu): visualization. All authors have read and agreed to the published version of the manuscript.

Funding

This research was funded by the Ningbo Natural Science Foundation (2024J090) and was supported by the Natural Science Foundation of China (project code 52400238).

Data Availability Statement

The data presented in this study are available on request from the corresponding author.

Conflicts of Interest

The authors declare no conflicts of interest.

References

  1. Motherway, B.; Bilodeau, J.; Cohen, J.; Mooney, E.; Rozite, V.; Slade, M. Energy Efficiency 2024; International Energy Agency: Paris, France, 2024. [Google Scholar]
  2. Liang, W.; Li, H.; Zhan, S.; Chong, A.; Hong, T. Energy flexibility quantification of a tropical net-zero office building using physically consistent neural network-based model predictive control. Adv. Appl. Energy 2024, 14, 100167. [Google Scholar] [CrossRef]
  3. Infield, D.G. Accommodation of high renewable energy penetration in power systems. In Proceedings of the 11th IET International Conference on Advances in Power System Control, Operation and Management (APSCOM 2018), Hong Kong, China, 11–15 November 2018; pp. 1–6. [Google Scholar] [CrossRef]
  4. Masson, G.; Jäger-Waldau, A.; Kaizuka, I.; Lindahl, J.; Donoso, J.; de l’Epine, M. Snapshot of Global PV Markets—2023. In Proceedings of the 2024 IEEE 52nd Photovoltaic Specialist Conference (PVSC), Seattle, WA, USA, 9–14 June 2024. [Google Scholar]
  5. Aktaş, A. Chapter 10—The importance of energy storage in solar and wind energy, hybrid renewable energy systems. In Advances in Clean Energy Technologies; Azad, A.K., Ed.; Academic Press: Cambridge, MA, USA, 2021; pp. 377–403. [Google Scholar] [CrossRef]
  6. Kong, D.; Jing, J.; Gu, T.; Wei, X.; Sa, X.; Yang, Y.; Zhang, Z. Theoretical Analysis of Integrated Community Energy Systems (ICES) Considering Integrated Demand Response (IDR): A Review of the System Modelling and Optimization. Energies 2023, 16, 4129. [Google Scholar] [CrossRef]
  7. Sheha, M.; Mohammadi, K.; Powell, K. Solving the duck curve in a smart grid environment using a non-cooperative game theory and dynamic pricing profiles. Energy Convers. Manag. 2020, 220, 113102. [Google Scholar] [CrossRef]
  8. Zahedi, A. Sustainable power supply using solar energy and wind power combined with energy storage. Energy Procedia 2014, 52, 642–650. [Google Scholar] [CrossRef]
  9. Liu, J.; Chen, X.; Yang, H.; Shan, K. Hybrid renewable energy applications in zero-energy buildings and communities integrating battery and hydrogen vehicle storage. Appl. Energy 2021, 290, 116733. [Google Scholar] [CrossRef]
  10. Kong, D.; Cheshmehzangi, A.; Zhang, Z.; Ardakani, S.P.; Gu, T. Urban building energy modeling (UBEM): A systematic review of challenges and opportunities. Energy Effic. 2023, 16, 69. [Google Scholar] [CrossRef]
  11. Jia, S.; Sheng, K.; Huang, D.; Hu, K.; Xu, Y.; Yan, C. Design optimization of energy systems for zero energy buildings based on grid-friendly interaction with smart grid. Energy 2023, 284, 129298. [Google Scholar] [CrossRef]
  12. Prasad, M.B.; Ganesh, P.; Kumar, K.V.; Mohanarao, P.A.; Swathi, A.; Manoj, V. Renewable Energy Integration in Modern Power Systems: Challenges and Opportunities. E3S Web Conf. 2024, 591, 03002. [Google Scholar] [CrossRef]
  13. Bampoulas, A.; Saffari, M.; Pallonetto, F.; Mangina, E.; Finn, D.P. A fundamental unified framework to quantify and characterise energy flexibility of residential buildings with multiple electrical and thermal energy systems. Appl. Energy 2021, 282, 116096. [Google Scholar] [CrossRef]
  14. Bucking, S.; Dermardiros, V. Distributed evolutionary algorithm for co-optimization of building and district systems for early community energy masterplanning. Appl. Soft Comput. 2018, 63, 14–22. [Google Scholar] [CrossRef]
  15. Qiao, B.; Dong, J.; Xu, W.; Li, J.; Lu, F. Research and Demonstration of Operation Optimization Method of Zero-Carbon Building’s Compound Energy System Based on Day-Ahead Planning and Intraday Rolling Optimization Algorithm. Buildings 2025, 15, 836. [Google Scholar] [CrossRef]
  16. Ma, Z.; Arici, M.; Shahsavar, A. Building Energy Flexibility and Demand Management; Academic Press: San Diego, CA, USA, 2023. [Google Scholar]
  17. Coraci, D.; Brandi, S.; Hong, T.; Capozzoli, A. An innovative heterogeneous transfer learning framework to enhance the scalability of deep reinforcement learning controllers in buildings with integrated energy systems. Build. Simul. 2024, 17, 739–770. [Google Scholar] [CrossRef]
  18. Li, H.; Hong, T. On data-driven energy flexibility quantification: A framework and case study. Energy Build. 2023, 296, 113381. [Google Scholar] [CrossRef]
  19. Chung, W. Review of building energy-use performance benchmarking methodologies. Appl. Energy 2011, 88, 1470–1479. [Google Scholar] [CrossRef]
  20. Chung, W.; Hui, Y.V.; Lam, Y.M. Benchmarking the energy efficiency of commercial buildings. Appl. Energy 2006, 83, 1–14. [Google Scholar] [CrossRef]
  21. Tang, H.; Wang, S. Energy flexibility quantification of grid-responsive buildings: Energy flexibility index and assessment of their effectiveness for applications. Energy 2021, 221, 119756. [Google Scholar] [CrossRef]
  22. Jensen, S.Ø.; Marszal-Pomianowska, A.; Lollini, R.; Pasut, W.; Knotzer, A.; Engelmann, P.; Stafford, A.; Reynders, G. IEA EBC Annex 67 Energy Flexible Buildings. Energy Build. 2017, 155, 25–34. [Google Scholar] [CrossRef]
  23. Neukomm, M.; Nubbe, V.; Fares, R. Grid-Interactive Efficient Buildings; U.S. Dept. of Energy (USDOE): Washington, DC, USA; Navigant Consulting, Inc.: Chicago, IL, USA, 2019.
  24. Lopes, R.A.; Chambel, A.; Neves, J.; Aelenei, D.; Martins, J. A Literature Review of Methodologies Used to Assess the Energy Flexibility of Buildings. Energy Procedia 2016, 91, 1053–1058. [Google Scholar] [CrossRef]
  25. Lund, P.D.; Lindgren, J.; Mikkola, J.; Salpakari, J. Review of energy system flexibility measures to enable high levels of variable renewable electricity. Renew. Sustain. Energy Rev. 2015, 45, 785–807. [Google Scholar] [CrossRef]
  26. Stinner, S.; Huchtemann, K.; Müller, D. Quantifying the operational flexibility of building energy systems with thermal energy storages. Appl. Energy 2016, 181, 140–154. [Google Scholar] [CrossRef]
  27. De Coninck, R.; Helsen, L. Quantification of flexibility in buildings by cost curves—Methodology and application. Appl. Energy 2016, 162, 653–665. [Google Scholar] [CrossRef]
  28. Le Dréau, J.; Heiselberg, P. Energy flexibility of residential buildings using short term heat storage in the thermal mass. Energy 2016, 111, 991–1002. [Google Scholar] [CrossRef]
  29. Reynders, G.; Diriken, J.; Saelens, D. Generic characterization method for energy flexibility: Applied to structural thermal storage in residential buildings. Appl. Energy 2017, 198, 192–202. [Google Scholar] [CrossRef]
  30. Saberi-Derakhtenjani, A.; Barbosa, J.D.; Rodriguez-Ubinas, E. Energy Flexibility Strategies for Buildings in Hot Climates: A Case Study for Dubai. Buildings 2024, 14, 3008. [Google Scholar] [CrossRef]
  31. Barchi, G.; Miori, G.; Moser, D.; Papantoniou, S. A Small-Scale Prototype for the Optimization of PV Generation and Battery Storage through the Use of a Building Energy Management System. In Proceedings of the 2018 IEEE International Conference on Environment and Electrical Engineering and 2018 IEEE Industrial and Commercial Power Systems Europe (EEEIC/I&CPS Europe), Palermo, Italy, 12–15 June 2018; pp. 1–5. [Google Scholar] [CrossRef]
  32. Chen, Y.; Trifkovic, M. Optimal scheduling of a microgrid in a volatile electricity market environment: Portfolio optimization approach. Appl. Energy 2018, 226, 703–712. [Google Scholar] [CrossRef]
  33. Tziovani, L.; Kolios, P.; Hadjidemetriou, L.; Kyriakides, E. Energy scheduling in non-residential buildings integrating battery storage and renewable solutions. In Proceedings of the 2018 IEEE International Energy Conference (ENERGYCON), Limassol, Cyprus, 3–7 June 2018; pp. 1–6. [Google Scholar] [CrossRef]
  34. Darbandsari, A.; Askarzadeh, A.R. Optimal Energy Management of a Smart Building Considering Rooftop Photovoltaic, Electric Vehicles and Schedulable Loads. In Proceedings of the 2022 9th Iranian Conference on Renewable Energy & Distributed Generation (ICREDG), Mashhad, Iran, 23–24 February 2022; pp. 1–8. [Google Scholar] [CrossRef]
  35. Manrique Delgado, B.; Ruusu, R.; Hasan, A.; Kilpeläinen, S.; Cao, S.; Sirén, K. Energetic, Cost, and Comfort Performance of a Nearly-Zero Energy Building Including Rule-Based Control of Four Sources of Energy Flexibility. Buildings 2018, 8, 172. [Google Scholar] [CrossRef]
  36. Zhao, Y. Using Machine Learning to Optimize Building Energy Consumption Prediction and Generate Energy-saving Strategies. In Proceedings of the 2024 International Conference on Intelligent Algorithms for Computational Intelligence Systems (IACIS), Hassan, India, 23–24 August 2024; pp. 1–5. [Google Scholar] [CrossRef]
  37. Zhou, X.; Lin, W.; Kumar, R.; Cui, P.; Ma, Z. A data-driven strategy using long short term memory models and reinforcement learning to predict building electricity consumption. Appl. Energy 2022, 306, 118078. [Google Scholar] [CrossRef]
  38. Zhou, M.; Li, X.; Zhong, Z. Research on Photovoltaic Power Generation Power Prediction Based on RF-XGBoost Model. In Proceedings of the 2023 IEEE 6th International Conference on Information Systems and Computer Aided Education (ICISCAE), Dalian, China, 23–25 September 2023; pp. 544–549. [Google Scholar] [CrossRef]
  39. Zhu, J.; Li, M.; Luo, L.; Zhang, B.; Cui, M.; Yu, L. Short-term PV power forecast methodology based on multi-scale fluctuation characteristics extraction. Renew. Energy 2023, 208, 141–151. [Google Scholar] [CrossRef]
  40. Li, T.; Zhang, Y.; Zhu, Z.; Bai, L.; Meng, F.; Yang, G. A Comparative Study of Photovoltaic Power Prediction Models Based on BP and XGBoost. In Proceedings of the 2024 6th International Conference on Robotics, Intelligent Control and Artificial Intelligence (RICAI), Nanjing, China, 6–8 December 2024; pp. 567–570. [Google Scholar] [CrossRef]
  41. Nastić, F.; Jurišević, N.; Nikolić, D.; Končalović, D. Harnessing open data for hourly power generation forecasting in newly commissioned photovoltaic power plants. Energy Sustain. Dev. 2024, 81, 101512. [Google Scholar] [CrossRef]
  42. Zou, Z.; Xu, J.; Mi, C.; Cao, B.; Chen, Z. Evaluation of Model Based State of Charge Estimation Methods for Lithium-Ion Batteries. Energies 2014, 7, 5065–5082. [Google Scholar] [CrossRef]
  43. Meng, J.; Ricco, M.; Luo, G.; Swierczynski, M.; Stroe, D.-I.; Stroe, A.-I.; Teodorescu, R. An Overview and Comparison of Online Implementable SOC Estimation Methods for Lithium-Ion Battery. IEEE Trans. Ind. Appl. 2018, 54, 1583–1591. [Google Scholar] [CrossRef]
  44. Zhou, Y.; Li, X. Overview of lithium-ion battery SOC estimation. In Proceedings of the 2015 IEEE International Conference on Information and Automation, Lijiang, China, 8–10 August 2015; pp. 2454–2459. [Google Scholar] [CrossRef]
Figure 1. The case study building of this research.
Buildings 15 03611 g001
Figure 2. The energy consumption and PV generation curve in October 2024.
Buildings 15 03611 g002
Figure 3. The data-driven model-based workflow of this research.
Buildings 15 03611 g003
Figure 4. Energy flow of the whole system.
Buildings 15 03611 g004
Figure 5. Energy supply order in 3 strategy groups (* to discharge with predicted building energy consumption).
Buildings 15 03611 g005
Figure 6. Electricity price in spring and fall.
Buildings 15 03611 g006
Figure 7. The control logic of the overall operation.
Buildings 15 03611 g007
Figure 8. The sample comparison between the actual total energy demand and predicted results (23 October, with an interval of 5 min).
Buildings 15 03611 g008
Figure 9. The comparison between the actual PV generation power and predicted results (25 October, with an interval of 5 min).
Buildings 15 03611 g009
Figure 10. The effect of battery capacity on the energy released from the battery.
Buildings 15 03611 g010
Figure 11. The state of charge of the BESS.
Buildings 15 03611 g011
Figure 12. The charge/discharge power of the BESS.
Buildings 15 03611 g012
Figure 13. The variation in battery voltage.
Buildings 15 03611 g013
Figure 14. The variation in battery temperature.
Buildings 15 03611 g014
Figure 15. Three power supply strategies vs. actual power demand (PWBS = PV with No Battery Strategy, PCBS = PV with Current Battery Strategy, FOBS = Forecast-based Optimized Battery Strategy).
Buildings 15 03611 g015
Figure 16. SC values during 22–28 October.
Buildings 15 03611 g016
Figure 17. LEC values from 22–28 October.
Buildings 15 03611 g017
Figure 18. ESTP values from 22–28 October.
Buildings 15 03611 g018
Figure 19. Building energy cost for adopting different strategies from 22–28 October.
Buildings 15 03611 g019
Table 1. Representative modeling and optimization strategies for enhancing building energy flexibility.
Ref.Modeling MethodControl/Optimization StrategyEvaluation Metrics or Case StudyKey Findings
[2]Physically consistent neural network combined with a prediction modelPV + BESS integration with dynamic pricing controlNet-zero energy office building in SingaporePV and BESS improve energy flexibility; dynamic pricing aids control decisions
[16]Physics-based simulations and data-driven modelsSingle- and multi-objective optimizationNet-zero energy buildings with PV and storageDemonstrates modeling and enhancement of energy flexibility
[17]Transfer learning + DRLRule-based controller, DRL with online TLCo-simulation with PV and BESS modelsProposes scalable TL strategy for DRL; shows action selection logic and model setup
[18]Data-driven framework for flexibility quantificationModel Predictive Control (MPC)Residential DR use cases; KPI-based frameworkDefines a 7-step process for flexibility quantification using KPIs
Table 2. Representative review of the common flexibility indicators.
Indicators [Ref.]Short ReviewEquation Examples
Ramp-up capability, power capacity and energy [26]A framework for quantifying building energy systems for thermal storage in terms of time, power and energy is proposed. ϵ d e l a y e d t = 0 t d e l a t e d t π f l e x , d e l a y e d t , ξ d ξ
Flexibility energy and related energy cost [27]Bottom-up approach to flexible quantification of commercial buildings, including cost curves J c = 0 t h ( c g P g + c e P e ) d t
Flexibility Factor
[28]
Evaluate the potential of a building to regulate its heating power and define a control strategy to test the flexibility potential F F = l p t 2 q h d t h p t 0 q h d t l p t 2 q h d t + h p t 0 q h d t
Available structure storage capacity
[29]
Flexibility analysis of structural thermal energy storage provision under active demand response C A D R = 0 t A D R ( q h , A D R q h , r e f ) d t
Self-consumption, storage capacity and storage efficiency
[13]
Presentation of a quantitative framework for basic energy flexibility for the assessment of multicomponent electrical and thermal systems. S C D R = 0 ( max min P m o d , P R E S P r e f , 0 ) d t 0 ( P m o d P r e f ) + d t
Table 3. Monthly energy consumption and generation data in October 2024.
Energy Consumption
( k W h )
Energy Generation
( k W h )
Ratio of Generation
to Consumption (%)
HVACNon-HVACTotalPVPV/Total
4315.267788.4712,103.733563.1429.44
Table 4. Specifications and operational constraints of the photovoltaic and battery energy storage systems.
Photovoltaic SystemBattery Energy Storage System
ParameterValueParameterValue
Total Area284.24 m2State of Charge15–100%
Voltage292–403 V
Peak Power60 kWNominal Capacity100 kWh
Maximum Power50 kW
Efficiency20.32%Efficiency96%
Temperature0–40 °C
Table 5. The scenario settings and strategies employed.
ScenarioStrategy
PWBS
[PV Without Battery Storage]
PV Direct Supply
+ Grid Purchase
PCBS
[PV with Current Battery Strategy]
PV Direct Supply
+ Battery Discharge[current]
+ Grid Purchase
FOBS
[Forecast-based Optimized Battery Strategy]
Large Battery Capacity
+ Battery Discharge [predicted]
+ PV Direct Replenish + Grid Purchase considering TOU Policy
Table 6. Energy flexibility indicators used in the case study.
KPIDefinitionApplicability
Self-Consumption (SC) S C = E P V , l o a d + E P V , c h a r g e E P V × 100 % For buildings with PV power generation and BESS, it is possible to reflect the efficiency of the building’s use of its renewable energy supply.
Local Energy Coverage (LER) L E R = t 1 t 2 S ( t ) d t + t 1 t 2 D ( t ) d t t 1 t 2 L ( t ) d t The ratio of energy supplied by the local energy system (including on-site renewable energy supply and the energy stored from the grid in advance) to its total energy demand.
Energy Surplus Time Percentage (ESTP) E S T P = 1 t 1 t 2 f ( t ) d t T f t =     1     i f     n e ( t ) < 0     0     i f     n e ( t ) 0 n e t = e s t + e c t e d ( t ) Reflects the effectiveness of energy scheduling in the time dimension.
Table 7. Prediction results of energy consumption from 22–28 October.
DateMAE of
P_consumption (kW)
RMSE of
P_consumption (kW)
R2 of
P_consumption
22 October 20241.272.060.90
23 October 20241.101.580.93
24 October 20241.111.530.92
25 October 20241.161.670.92
26 October 20241.211.940.92
27 October 20241.121.750.91
28 October 20241.191.720.92
Average1.1661.7500.917
Table 8. Prediction results of PV generation from 22–28 October.
DateMAE of
P_PV (kW)
RMSE of
P_PV (kW)
R2 of
P_PV
22 October 20240.611.460.80
23 October 20242.495.440.74
24 October 20242.245.980.69
25 October 20240.160.360.93
26 October 20240.451.140.91
27 October 20240.621.520.89
28 October 20242.034.920.75
Average1.2292.9740.816
Table 9. Comparison of SC results of the three strategies.
DatePWBSPCBSFOBS
22 October 202499.63%99.63%100.00%
23 October 202483.86%83.86%98.39%
24 October 202479.31%79.31%99.56%
25 October 202494.68%94.68%100.00%
26 October 202497.39%97.39%100.00%
27 October 202499.28%99.28%100.00%
28 October 202479.85%79.85%100.00%
Average90.57%90.57%99.71%
Table 10. Comparison of LEC and ESTP results of the three strategies.
DatePWBSPCBSFOBS
LECESTPLECESTPLECESTP
22 October 202412.29%0.00%24.16%11.81%55.02%31.25%
23 October 202435.39%16.32%42.69%31.25%72.01%45.49%
24 October 202424.09%6.60%34.52%24.65%67.71%40.63%
25 October 20245.26%0.00%18.00%6.60%51.61%26.74%
26 October 202413.28%0.00%24.94%16.67%56.49%25.69%
27 October 202417.12%0.69%26.55%17.01%60.67%29.51%
28 October 202430.34%11.46%40.46%30.21%75.75%44.10%
Average19.68%5.01%30.19%19.74%62.75%34.77%
Table 11. Comparison of the cost of the three strategies.
DatePWBS (CNY)PCBS (CNY)FOBS (CNY)
22 October 2024283.51 250.22 161.42
23 October 2024181.70 167.45 121.60
24 October 2024224.96 201.51 138.14
25 October 2024287.85 251.04 166.09
26 October 2024275.22 240.73 164.48
27 October 2024250.00 226.69 148.82
28 October 2024189.37 167.18 114.80
Average283.51 250.22 161.42
Disclaimer/Publisher’s Note: The statements, opinions and data contained in all publications are solely those of the individual author(s) and contributor(s) and not of MDPI and/or the editor(s). MDPI and/or the editor(s) disclaim responsibility for any injury to people or property resulting from any ideas, methods, instructions or products referred to in the content.