Abstract
To investigate the failure characteristics and high-strain-rate mechanical response of polyvinyl alcohol-modified alkali-activated materials (PAAMs) under static and dynamic impact loads, quasi-static and uniaxial impact compression tests were performed on AAMs with varying PVA content. These tests employed a universal testing machine and an 80 mm diameter split Hopkinson pressure bar (SHPB). Digital image correlation (DIC) was then utilized to study the surface strain field of the composite material, and the crack propagation process during sample failure was analyzed. The experimental results demonstrate that the compressive strength of AAMs diminishes with higher PVA content, while the flexural strength initially increases before decreasing. It is suggested that the optimal PVA content should not exceed 5%. When the strain rate varies from 25.22 to 130.08 s−1, the dynamic compressive strength, dissipated energy, and dynamic compressive increase factor (DCIF) of the samples all exhibit significant strain rate effects. Furthermore, the logarithmic function model effectively fits the dynamic strength evolution pattern of AAMs. DIC observations reveal that, under high strain rates, the crack mode of the samples gradually transitions from tensile failure to a combined tensile–shear multi-crack pattern. Furthermore, the crack propagation rate rises as the strain rate increases, which demonstrates the toughening effect of PVA on AAMs.
1. Introduction
In recent years, with the acceleration of urbanization, the consumption of Portland cement has increased rapidly. It is reported that the worldwide cement output amounts to nearly 4.1 billion tons, with the carbon dioxide emissions generated accounting for 7–8% of global carbon emissions [1,2]. Alkali-activated materials (AAMs), as a new type of green cementitious material, have diverse sources and are primarily derived from solid waste materials such as blast furnace GGBS, FA, red mud, and waste glass, without the need for high-temperature calcination for better flow [3,4,5]. Therefore, they possess unique advantages in low-carbon preparation and solid waste utilization. Moreover, compared to cement, AAMs exhibit excellent mechanical properties and durability, making them potential alternatives to ordinary Portland cement (OPC) [6]. However, the inherent brittleness of AAMs results in poor crack resistance and under complex stress conditions, they are susceptible to microcrack formation and propagation, which limits their practical applications in engineering [7]. Current research primarily focuses on modifying AAMs through fibers to achieve toughening effects [8,9,10]. The manufacturing of synthetic fibers requires substantial consumption of fossil fuels, and the by-products generated during the synthesis process can pose significant risks to human health and the environment. Adding polymer modification agents can also enhance the mechanical strength of AAMs [11,12]; however, long-term durability may deteriorate under cyclic wetting and drying conditions, introducing potential risks [13]. Therefore, more environmentally friendly and durable alternatives are urgently needed.
Polyvinyl alcohol (PVA) is a soluble material that is environmentally friendly and non-toxic, and its hydrophilic functional group hydroxyl (-OH) can enhance the adhesion between composite material particles by modifying the surface bonds with the matrix [13,14]. Additionally, PVA can effectively inhibit the formation of cement particle flocculation structures in the cement matrix and form strong hydrogen bond networks with the matrix, significantly improving cement strength [15]. Wang et al. [16] found that adding PVA and calcium sulfoaluminate (CSA) to coral sand concrete can alter coral sand properties and promote better mechanical properties in mortar. Li et al. [17] introduced carbon nanotubes and PVA latex into cement mortar to mitigate the brittleness of cement mortar. Their findings indicated that CNT-OH/PVA latex increased the compressive strength, flexural strength, and fracture toughness values of the cementitious matrix by 14.3%, 39.4%, and 55.4%, respectively. Fan et al. [18] employed differential scanning calorimetry (DSC), Fourier transform infrared spectroscopy (FTIR), and scanning electron microscopy (SEM) to study the role of PVA in modifying the hydration products and microstructure of cement mortar. The study indicated that moderate PVA incorporation produces well-dispersed network films within the matrix, effectively sealing cracks and enhancing the material’s mechanical properties. The aforementioned studies have sufficiently demonstrated that PVA markedly improves the toughness and microstructure of cementitious materials under static loading. However, most engineering structures are subjected not only to slowly varying quasi-static loads but also to dramatically changing dynamic loads. Dynamic action on a structure that induces a high-strain-rate loading effect exceeding 10 s−1 can lead to overall structural collapse. Therefore, the dynamic loading response of materials is just as important. Some researchers have conducted extensive experimental studies and theoretical analyses on the dynamic mechanical properties of alkali-activated engineering materials, and alkali-activated materials are generally recognized as strain rate-sensitive engineering composite materials [19,20]. Meanwhile, the dynamic evolution characteristics of AAMs under impact loading are affected by multiple factors, such as strength grade [21], type of alkali activator [22], admixture dosage [23], and loading rate [24]. Zhe et al. [25] applied finite element modeling to explore the dynamic response of Ultra-High-Performance Concrete–Alkali-Activated Concrete (UHPC-AAC) subjected to SHPB experiments, highlighting the mechanisms of damage development in the interface zone throughout impact loading. Gai et al. [26] argued that introducing adhesives into geopolymer concrete can promote depolymerization–condensation reactions, shifting the bonding mechanism from interface adhesion to matrix-dominated interaction promotes the formation of tighter bulk frameworks, thereby enhancing the dynamic resistance of geopolymer concrete. Ahyan et al. [27] applied plastic damage modeling approaches to explore the high-strain-rate performance of concrete, while also assessing the role of friction, geometric dimensions, and loading pulse profiles in determining dynamic enhancement factors. While the static strengthening mechanism of PVA in cement-based systems has been systematically studied, investigations into the static and dynamic compressive properties of PVA modified AAMs are still limited. Therefore, investigating the contribution of PVA to the static and dynamic mechanical properties of AAMs is crucial not only for determining the optimal PVA content within the matrix but also for broadening the application of PVA in innovative composite materials.
Compared to the visualized morphology under quasi-static loading, PAAMs exhibit more rapid failure modes under dynamic loading. DIC can precisely capture the crack evolution process of composite materials, thereby enabling analysis of their failure modes and damage evolution patterns. This technology is widely applied for measuring material displacement and strain fields, providing support for analyzing strain rate effects and dynamic mechanical properties [28]. Zhao et al. [29] used DIC and acoustic emission techniques, identified that the integration of fibers into cement–tailings composites effectively alleviates strain concentration and diminishes the lateral propagation of critical cracks. Chen et al. [30] applied digital image correlation to examine the three-point bending fracture in UHPFRCC, and based on an unsupervised k-means clustering algorithm, were able to accurately identify matrix cracking and fiber–matrix debonding phenomena. Therefore, employing DIC technology to investigate the dynamic compression failure characteristics of PAAMs is of significant importance. Building upon this foundation, this paper investigates the dynamic mechanical properties and strain rate effects of PAAMs with PVA content ranging from 0% to 10% and strain rates from 30.01 s−1 to 114.57 s−1, using the SHPB test method. Furthermore, DIC technology is employed to analyze the failure modes, crack evolution, and strain field distribution of AAMs, revealing the patterns of crack evolution under varying PVA contents and strain rates. This research not only addresses the existing gap in the understanding of cracking behavior in PVA modified AAMs subjected to impact loads but also offers technical support for a more comprehensive understanding of the mechanical behavior and failure mechanisms of PAAMs under such conditions.
2. Materials and Methods
2.1. Test Materials
Alkali-activated materials were prepared from ground granulated blast-furnace slag (GGBS), fly ash (FA), and alkali activation solution. The GGBS and FA were both provided by Hebei Construction Group Co., Ltd., (Baoding, China) and had specific surface areas of 623.45 m2/kg and 551.50 m2/kg, respectively. Their chemical compositions are shown in Table 1. The alkali activator was prepared using sodium metasilicate nonahydrate (NaSiO3∙9H2O) from Tianjin Huarong Chemical Reagent Co., Ltd., (Tianjin, China) and had a Na2O to SiO2 ratio of 1.03 ± 0.03. Polyvinyl alcohol was provided by Hebei Construction Group Co., Ltd., with its technical parameters as shown in Table 2.

Table 1.
Chemical compositions of GGBS and FA (wt.%).

Table 2.
Technical Specifications for PVA.
2.2. Specimen Preparation
According to the mix ratios presented in Table 3, PAAMs with Na2O content of 3 % and a water-to-binder ratio of 0.4 were produced. PVA dosages were 0%, 2.5%, 5%, 7.5%, and 10%, with corresponding designations of P0, P1, P2, P3 and P4, respectively. The specific preparation steps are shown in Figure 1: First, GGBS and FA were dry mixed for 60 s to obtain a homogeneous powder. Then, the alkaline activator was added and stirred for another 120 s. After uniform mixing, the polyvinyl alcohol solution was added and stirred for 120 s, for a total mixing time of 300 s. After stirring, the slurry was quickly poured into 40 × 40 × 160 mm3 and 100 × 300 × 37 mm3 rectangular rigid molds and vibrated on a vibrating table for 30 s. Afterwards, the molds were placed in a curing box for 28 days at room temperature. After curing, core samples with dimensions of ∅74 × 37 mm (thickness/diameter = 1/2) were drilled from the 100 × 300 × 37 mm3 specimens, and the specimens were then ground and polished before testing.

Table 3.
Mix proportions of PAAMs (wt.%).
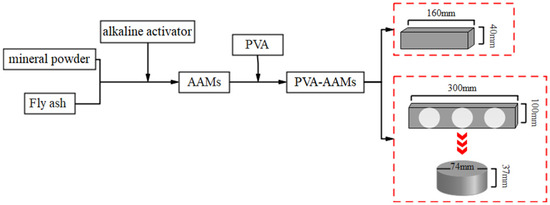
Figure 1.
Flowchart of specimen preparation.
2.3. Test Method
2.3.1. Static Mechanical Property Test
According to the provisions of “Cement Test Methods—Strength Determination” (GB/T 17671-2021), 40 × 40 × 160 mm3 and 40 × 40 mm2 compression specimens shall be used. The loading rate for the flexural test shall be set at 0.8 mm/min. The loading rate for compressive strength testing is 2400 N/s. Three specimens are selected per group, and the average value is taken as the representative compressive strength and flexural strength.
2.3.2. Dynamic Compression Test
Figure 2 depicts the impact testing system, which consists mainly of an impact instrument and a DIC measurement system. This combined system is used to study the mechanical performance and failure features of PAAMs when exposed to impact loading. Using an 80 mm and 40 mm multi-diameter SHPB, the impact device incorporates a steel bar of 80 mm in diameter. According to Safa [31], the diameter ratio should exceed 0.9. In this test, the ratio of the specimen diameter to the SHPB diameter is 74/80 = 0.93, meeting the recommended value from existing research. As shown in Figure 2, the SHPB system mainly comprises a launching system, a pressure bar system, a protective box, a buffer, a control system, a signal conditioning system, and an air source system. Considering that PAAMs are non-homogeneous materials, issues such as uneven stress distribution, waveform dispersion, and friction effects may arise within the specimen. Therefore, a 25 mm diameter, 1 mm thick H62 brass sheet will be used as a pulse shaper, attached to the center of the incident bar’s front end. Furthermore, Vaseline will be evenly applied to both ends of the specimen to effectively mitigate many common problems encountered in SHPB testing. When the striker bar collides with the incident bar, it generates a reflected wave . As the incident wave travels through the interface between the incident bar and the specimen, it is partially reflected, forming the reflected wave , while the remaining part is transmitted through the specimen into the transmission bar, creating the transmitted wave . Building upon our group’s previous research [32], the stress and strain distributions at the extremities of the specimen are assessed and analyzed using the signals from these three waves, resulting in Formulas (1)–(3) for the stress, strain, and strain rate of PAAMs under impact loading.
where represents stress, represents strain, and represents the strain rate. , , and denote the elastic modulus, cross-sectional area, and elastic wave velocity of the bar, respectively, while and represent the cross-sectional area and original length of the specimen, respectively.
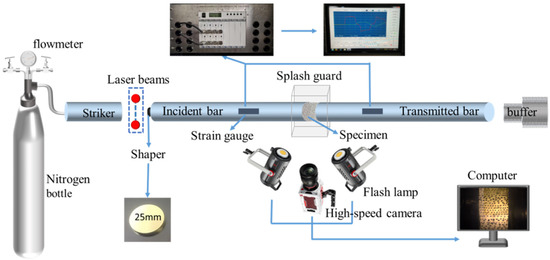
Figure 2.
Schematic diagram of SHPB apparatus.
The DIC experimental system mainly consists of two supplementary lights, a high-speed camera, and an integrated control system. The supplementary lights provide high-intensity illumination to compensate for insufficient light, ensuring the capture of clear and bright images. Image acquisition was performed with a Photron FASTCAM SA3 high-speed camera at a frame rate of 7500 FPS. Before formal recording, researchers adjusted the delayed shooting time and exposure time multiple times to ensure complete capture of the entire compression process of PAAMs.
2.3.3. Microscopic Testing
Prior to experimentation, the specimens were subjected to a 24 h immersion in alcohol, followed by controlled drying in an oven at 40 °C for 2 h. Finally, the fractured specimens were sectioned into smaller pieces for SEM scanning. A TESCAN MIRA LMS scanning electron microscope (SEM) from the Czech Republic was used to analyze the microstructural features of the samples.
3. Experimental Results
3.1. Static Mechanical Properties
Figure 3 illustrates the effect of PVA content on the compressive and flexural strength of PAAMs. As shown in Figure 3a, the incorporation of PVA hinders the rise in compressive strength to some extent, but significantly promotes flexural properties. With increasing PVA content, the quasi-static compressive strength of P4 is the lowest at 39.02 MPa. The formation of tiny air pores during mixing, which are easily eliminated in the unmodified neat slurry, tends to be retained and stabilized after excessive PVA addition due to its surface activity and viscoelasticity, thereby increasing porosity, generating more weak interfaces, and ultimately leading to a looser structure. [14,33]. When the PVA content is less than 5%, the static compressive strengths of P1 and P2 are 4.99% and 9.96% lower than that of P0, respectively. When the PVA content exceeds 5%, the static compressive strengths of P3 and P4 are reduced by 26.72% and 43.12% compared to P0, respectively. The flexural strength of PVA-modified alkali-activated materials (PAMMs) initially increases and then decreases with increasing PVA content, reaching a maximum of 6.6 MPa at a 5% content. This is primarily attributed to the formation of cracks in the matrix under bending loads. At this stage, a thin PVA film forms within the slurry, which interpenetrates with the hardened polymer matrix. Consequently, the connections between hydration products transform into AAM-PVA film and water–PVA film–AAM structures, establishing a stable network that manifests as increased toughness at the macro level, reflected in the enhancement of flexural strength [34]. In conclusion, the optimal PVA content for maintaining static strength should not surpass 5%.
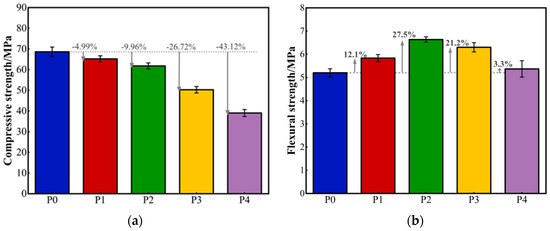
Figure 3.
Static mechanical properties: (a) compressive strength and (b) flexural strength.
As shown in Figure 4, SEM scanning was performed on cross-sections of groups P0 and P1 to analyze the microstructure of AAMs with varying PVA dosages. Compared to P0, the addition of an appropriate amount of PVA caused the active powder to adsorb PVA molecules during polymerization, resulting in the formation of a polymer film covering the matrix. Consequently, the matrix’s compactness significantly increased, complicating differentiation from the amorphous phase in the matrix, consistent with prior observations [35,36]. Furthermore, some micropores are observable in Figure 4b. These are attributed to residual microbubbles that were difficult to remove during stirring and subsequently became trapped within the matrix. Figure 4c indicates that PVA forms layered continuous films within the matrix, exhibiting a relatively smooth surface. In regions where cracks initiate or propagate, these films effectively inhibit crack growth. Under quasi-static loading, excessive PVA dosage leads to the PVA polymer enveloping the dissolved and undissolved particles of the matrix, thus delaying the matrix’s polycondensation process. This phenomenon macroscopically manifests as a reduction in mechanical strength.

Figure 4.
SEM images of PAAMs: (a) without PVA, (b) with 2.5% PVA, (c) PVA film.
3.2. Dynamic Mechanical Properties
3.2.1. Failure Mode
Figure 5 illustrates the final failure modes of dynamic compression specimens with different PVA contents. The failure mode and fragment distribution of the specimens effectively provide a reliable measure of the extent of damage in composites subjected to impact loading. Observations at the macroscopic scale demonstrate that the severity of sample damage escalates with the strain rate, generating a higher count of smaller fragments [37]. At lower strain rates (25.22–34.87 s−1), the samples retain some integrity because the applied impact load is insufficient to cause failure. When the dynamic compressive strength exceeds the static compressive strength, the internal pores and initial defects within the sample expand further [38], and the failure mode exhibits diffusion from the core region outwards. The resulting fragments are predominantly larger, strip-shaped or block-shaped. Damage was observed only in the weak edge regions of some samples. This is attributed to the intactness of the central core area, which is constrained by lateral inertial effects and end-face friction. When the strain rate exceeds 100.54 s−1, the samples are crushed into multiple fragments, with pulverization intensifying and exhibiting a crushing damage mode. Concurrently, under similar strain rates, samples with high PVA content exhibit less damage, presenting larger chunks. This suggests that a high PVA content enhances the interfacial bonding between PVA and AAMs, making them less susceptible to severe damage under impact loading. Consequently, the addition of PVA enhances the impact toughness of the material while also modifying its failure mode, transitioning it from a single brittle fracture to a tensile–shear composite, multi-crack failure mode.
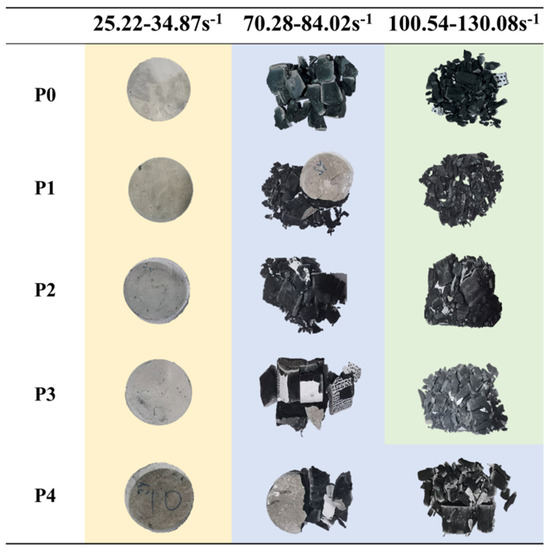
Figure 5.
Failure mode of PAAMs. (diagram size: original size = 1:12).
3.2.2. Stress–Strain Curve
To validate the dynamic compression test, the dynamic stress at both ends of the sample should be approximately equal. As illustrated in Figure 6a, by comparing the stress–strain curves of the incident wave and reflected wave with those of the transmitted wave after baseline correction, it was found that they essentially coincide, with consistent peak values, demonstrating that PAMMs satisfy the stress equilibrium loading requirements for SHPB testing. PAMMs were then tested under varying impact air pressures of 0.02 MPa, 0.03 MPa, and 0.04 MPa, resulting in the stress–strain curves shown in Figure 6b–d.
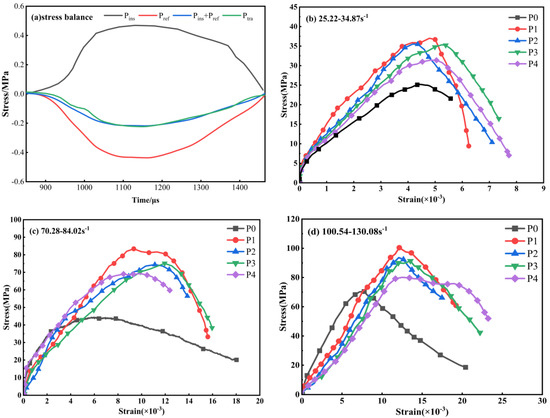
Figure 6.
Stress–strain curve: (a) stress balance analysis; (b) 0.02 MPa; (c) 0.03 MPa; (d) 0.04 MPa.
The results revealed that these curves followed a similar trend: with increasing strain rate, the stress and strain of PAAMs increased, indicating a strong strain rate dependence. Based on this trend, the process can be divided into three stages: a linear escalation phase, a nonlinear amplification phase, and a stress decay stage [39]. During the linear increase stage, the slope of the ascending stage declines with increasing PVA content under similar strain rate conditions. This indicates an overall reduction in the stiffness of AAMs under high-speed loading, primarily because PVA, being a flexible polymer, cannot provide sufficient rigid support under dynamic loads. Consequently, the efficiency of stress transfer is reduced, leading the material to exhibit higher deformability and lower stiffness. In the nonlinear growth stage, with increasing strain, PAAMs show an “upward convex” trend until the stress reaches its maximum value. During the stress decay stage, the stress begins to decrease, while the strain continues to increase slowly.
Table 4 presents the dynamic compression data for varying PVA contents at different strain rates. As can be seen from the table, with a continuous increase in the strain rate, the peak stress (i.e., the corresponding dynamic compressive strength) and peak strain of the samples also increase continuously. This enhanced deformation capacity demonstrates a significant strain-hardening phenomenon and strain rate sensitivity. This phenomenon is primarily attributable to the migration of PVA molecular chains. At low strain rates, chain segments possess sufficient time to undergo slip, disentangle, and orient, thereby exhibiting high ductility. Conversely, at high strain rates, rapid loading far exceeds the relaxation time of chain segments, resulting in a significant increase in stiffness and strength.

Table 4.
Summary of dynamic compressive properties from the SHPB test.
3.2.3. DCIF
The dynamic compressive increase factor (DCIF) refers to the ratio of dynamic compressive strength to quasi-static compressive strength of a sample when tested under identical conditions. It quantifies the strain rate effect of PAAMs under impact loads. The DCIF is calculated as follows:
where represents the dynamic compressive strength of the sample, and represents the static compressive strength.
Figure 7a illustrates the variation in DCIF of PAAMs at different strain rates. It is observed that the DCIF values of all samples show minimal variation at similar strain rates. The DCIF increases with strain rate and reaches its maximum value within the range of 100.54–130.08 s−1. When the mean strain rate is below 30.01 s−1, the DCIF remains under 1, indicating that the dynamic compressive strength is lower than the static compressive strength. This phenomenon primarily arises because, under low-speed impact loads, the loading rate is insufficient to trigger a significant dynamic enhancement effect. Consequently, the internal microcracks and pores within the material expand further, and the sample remains relatively intact. When the mean strain rate surpasses 76.2 s−1 and DCIF exceeds 1, the dynamic compressive strength increases. Notably, P4 exhibits the highest value, suggesting that strain rate sensitivity is enhanced by increasing PVA content.
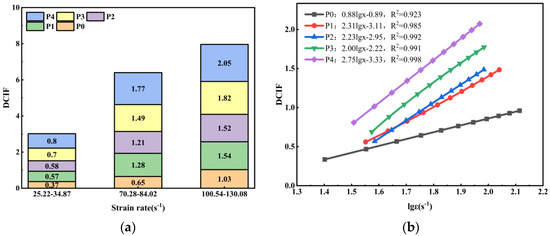
Figure 7.
(a) DCIF; (b) logarithmic fit curve.
In Figure 7b, the DCIF–strain rate relationship of the composite is presented in a linear form. In this study, the fitting formula is defined as follows:
where is the strain rate, is the fitted slope, and is the fitted intercept. The slope represents the strain rate sensitivity. As shown in the Figure, incorporating PVA into AAMs results in a steeper slope, reflecting enhanced strain-rate sensitivity and more rapid growth in dynamic impact toughness. This phenomenon can be largely ascribed to the generation of a continuous PVA polymer film in the AAMs under high-strain-rate conditions, which activates the tensile deformation and crack bridging mechanisms of the PVA chain segments, thereby significantly enhancing the dynamic load-bearing capacity [40].
3.2.4. Energy Dissipation
Impact toughness, representing a material’s ability to absorb energy under impact loading, can be evaluated by calculating the area enclosed under the stress–strain relationship and serves as an evaluation of the sample’s energy dissipation capacity. As illustrated in Figure 8, the impact toughness of PAAMs increases with the strain rate, mirroring the trend observed in dynamic compressive strength. When the average strain rate is elevated to 114.57 s−1, the impact toughness of P0, P1, P2, P3, and P4 increases by 1358.79%, 591.56%, 586.07%, 457.56%, and 434.39%, respectively, compared to the values at 30.01 s−1. This phenomenon primarily arises because, under high-speed impact, energy dissipation cannot be instantaneously completed due to the energy conservation. Consequently, the impact energy escalates with the increasing strain rate, leading to a further elevation of the peak stress within the concrete [41].
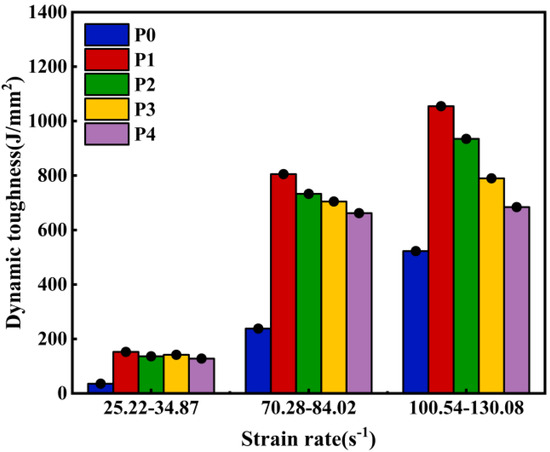
Figure 8.
Energy dissipation of PAAMs.
At similar strain rates, the impact resistance of P1, P2, P3, and P4 increased by 325.85%, 280.40%, 295.56%, and 257.34%, respectively, compared to P0 at an average strain rate of 30.01 s−1, with the increase in PVA content. At a mean strain rate of 76.20 s−1, the impact resistance of P1, P2, P3, and P4 increased by 238.19%, 209.89%, 196.02%, and 178.04%, respectively, compared to P0. When the average strain rate was 114.57 s−1, the impact resistance of P1, P2, P3, and P4 increased by 101.88%, 78.90%, 51.18%, and 30.90%, respectively, compared to P0. It is evident that the energy dissipation capacity gradually weakens with increasing PVA content and strain rate. This phenomenon is primarily attributed to the aggregation, cross-linking, and even degradation of high PVA content in a strongly alkaline environment. This process disrupts the microstructural integrity of the composite material, leading to weak interfaces. Consequently, rapid crack propagation occurs under impact loading, resulting in matrix pulverization and a significant reduction in energy dissipation capacity. The results demonstrate that the energy threshold for crack initiation in the matrix is much higher than that needed for crack extension [42].
3.3. Dynamic Damage Evolution Revealed by High-Speed DIC
3.3.1. Impact Failure Process
The failure modes of PAMMs under impact loading are an important means of characterizing their dynamic failure mechanisms and are significant for understanding their mechanical response under high strain rates. A high-speed camera was used to record and analyze the dynamic compression failure process of the P2 sample under different impact air pressures, and its typical failure behavior is shown in Figure 9. By comparing the failure processes of PAAMs under different impact air pressures, it was found that the time at which cracks became clearly observable in the samples under different loading conditions generally began at approximately 133 μs post-impact. At an air pressure of 0.02 MPa, no identifiable macroscopic cracks were observed on the sample’s side walls, with only minor localized damage evident, indicating that the loading strength was insufficient to initiate significant crack propagation, and the PAAMs as a whole remain within the elastic or micro-damage stage, having not yet entered a distinct crack propagation and instability failure process. When the air pressure exceeds 0.03 MPa, tensile cracks appear on the sidewall of the end face in contact with the reflection rod. Upon continuous loading, these cracks further develop into shear cracks, which signifies a shift in the material’s load-bearing mechanism from being tensile-dominated to shear-dominated. Initially, the number of crack initiations is limited due to the small area of stress concentration. However, once the cracks penetrate the sample, the internally accumulated strain energy is rapidly released, resulting in a higher number of cracks. The crack propagation path gradually bends and branches, and phenomena such as crack deflection and bridging are observed, suggesting an improvement in the material’s internal structural toughness.
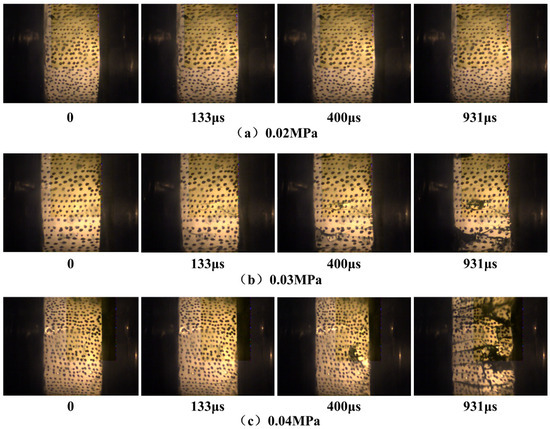
Figure 9.
Impact failure behavior.
3.3.2. Displacement and Strain Field Analysis
Based on speckle images recorded by a high-speed camera during sample compression failure, the displacement and strain fields on the specimen surface were analyzed using VIC-2D software (It is provided by Kunming University of Science and Technology). The subset for DIC data processing was set to 33, with a step size of 1. Figure 10 illustrates real-time observation principal strain cloud diagrams of specimens with varying PVA contents under 0.04 MPa. As shown, under 0.04 MPa air pressure, distinct strain concentration phenomena were observed in samples P1-4, P2-4, P3-4, and P4-4 at 133 μs, 103 μs, 93 μs, and 63 μs, respectively. However, the strain concentration areas exhibited unstable distribution. Subsequently, with increasing loading time, cracks propagated inward from the end face. During the period of 83–153 μs, prominent strain concentration bands emerged, with the maximum principal strain ranging from approximately 0.019 to 0.084, suggesting that the AAMs had already undergone cracking failure. The cracks primarily extended and distributed along the contact surface with the transmission rod, towards the reflection rod. At 103–173 μs, the crack essentially penetrated the sample surface, leading to sample failure. Compared to P3 and P4, the cracking time of samples with PVA content of less than 5% is delayed by approximately 30 μs. When loaded to 133 μs and 103 μs, strain concentration is just beginning to appear in PVA-2.5 and PVA-5, while PVA-7.5 and PVA-10 already exhibit characteristics of instability failure. This could be attributed to the relatively loose network structure formed at low PVA concentrations, which allows the molecular chains greater freedom of movement. This enables slippage, rearrangement, and disentanglement to accommodate deformation, thereby absorbing more energy and resulting in better toughness [43].
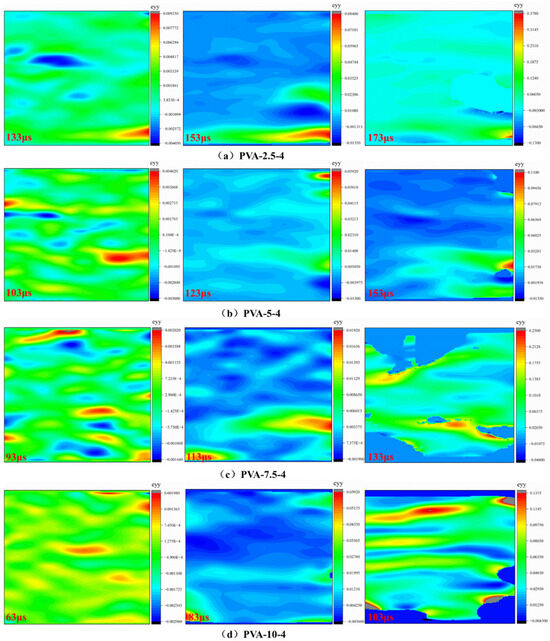
Figure 10.
0.04 MPa surface damage evolution with different PVA content.
A comparison of AAMs with the same PVA content under different impact pressures reveals that, under dynamic compressive load, increasing the impact pressure exacerbates the instability of crack morphology on the sample surface, leading to the formation of secondary cracks. Concurrently, the cracks gradually transition from initially near-horizontal tensile cracks to inclined shear cracks, exhibiting a trend of increasing crack inclination angle. The P2 strain evolution cloud diagrams at 0.02 MPa and 0.03 MPa are shown in Figure 11. Initially, the strain concentration area is mainly concentrated in the middle and lower part of the sample, and this area is defined as the main crack. When the time reaches 143–163 μs, the distribution length of the main crack reaches more than half of the sample thickness, with secondary cracks also appearing on both the upper and lower sides of the main crack distribution area. Between 163 and 183 μs, the main crack and the secondary cracks develop to a similar extent. However, because the impact pressure is not yet sufficient to cause overall damage to the sample, only edge spalling or local fragmentation into chunks occurs.
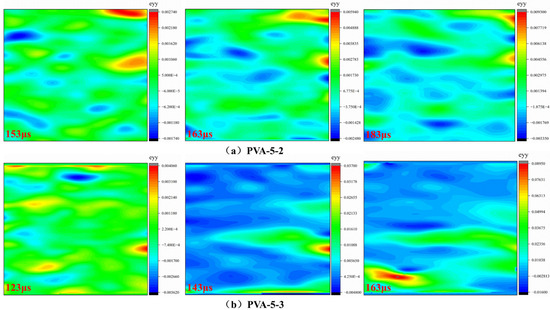
Figure 11.
The evolution of surface damage at different air pressures with the same PVA doping level.
3.3.3. Crack Propagation Rate
Utilizing the straight-line measurement function within Image J2 software, crack widths at the initiation points of primary cracks in PAAMs with varying PVA content were quantified, and their temporal evolution analyzed as depicted in Figure 12. Results indicate that crack widths progressively increased over time, though expansion rates exhibited significant variation. Without PVA addition (P0), crack propagation reached the highest rate of 38,400 mm/s, indicating the poorest toughness. Following PVA incorporation, crack widths decreased, and crack propagation rates markedly slowed with increasing PVA content. Specifically, the crack propagation rates for P1, P2, P3, and P4 were 7800 mm/s, 15,900 mm/s, 17,700 mm/s, and 23,700 mm/s, respectively, yielding the propagation rate sequence: P0 > P4 > P3 > P2 > P1. This indicates that an appropriate amount of PVA can effectively inhibit crack propagation and enhance toughness through flexible films. However, when the addition level is excessively high, PVA may disperse poorly within the matrix, introducing additional voids that weaken the interface and accelerate crack propagation rates.
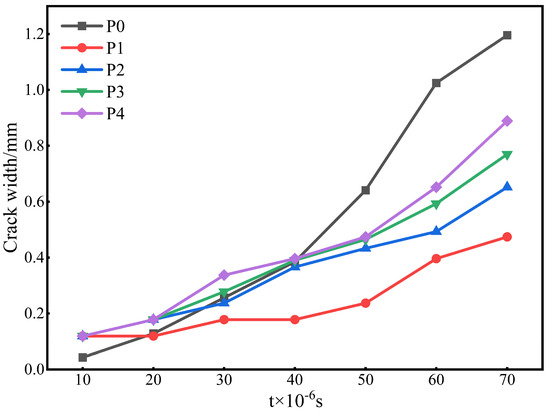
Figure 12.
Crack width expansion process over time.
4. Discussion
In this study, quasi-static and dynamic compression experiments on PAAMs were conducted using a universal testing machine and a split Hopkinson pressure bar, respectively. The failure process of the composite material was monitored using high-speed camera. The conclusions are as follows:
- (1)
- The quasi-static compressive strength of PAAMs decreases with increasing PVA content, where the flexural strength experiences an initial rise and then falls. When the PVA content is less than 5%, the compressive strength decreases by no more than 10%, and the flexural strength reaches a maximum of 6.6 MPa at 5%. Therefore, the optimal PVA content should be limited to a maximum of 5%.
- (2)
- Under high strain rates, the dynamic compressive strength, DCIF, and dissipated energy of the samples all increase with increasing strain rate, demonstrating a significant strain rate effect. Meanwhile, the logarithmic function model effectively characterizes the DCIF evolution pattern. The addition of PVA increases the function’s slope, enhances strain rate sensitivity, and improves impact toughness.
- (3)
- DIC reveals that as the PVA content increases, the crack propagation rate of the samples slows, demonstrating enhanced energy absorption capacity. Furthermore, crack evolution is accompanied by increased crack instability, a larger crack inclination angle, and the generation of secondary cracks.
- (4)
- Under dynamic compression, the failure mode of PAAMs exhibits a diffusion pattern from the core region outwards. With increasing strain rate, the degree of fragmentation intensifies. Macroscopically, the cracking behavior transitions from a single brittle fracture to a tensile–shear combined multi-crack failure mode, suggesting that the material’s internal structural toughness is enhanced to some extent by the addition of PVA.
Author Contributions
Conceptualization, F.C., Y.L. and K.N.; methodology, F.C.; validation, Y.L., Y.Z. (Yimeng Zhao) and B.L.; formal analysis, F.C.; investigation, Y.L.; resources, F.C. and Y.L.; data curation, F.C. and Y.Z. (Yimeng Zhao); writing—original draft preparation, F.C. and Y.L.; writing—review and editing, F.C. and Y.L.; supervision, Y.Z. (Yubo Zhang) and K.N.; project administration, Y.L. and K.N.; funding acquisition, K.N. and Y.W. All authors have read and agreed to the published version of the manuscript.
Funding
This research was funded by Basic Research Funding for Central Universities of China, 06500139 and Beijing Natural Science Foundation, IS23045.
Data Availability Statement
The data used to support the findings of this study are available from the corresponding author upon request.
Conflicts of Interest
The authors declare no conflicts of interest. The funders had no role in the design of the study; in the collection, analyses, or interpretation of data; in the writing of the manuscript; or in the decision to publish the results.
References
- Huang, R.; Xu, L.; Xu, Z.; Zhang, Q.; Wang, J. A Review on Concrete Superplasticizers and Their Potential Applications for Enhancing the Performance of Thermally Activated Recycled Cement. Materials 2024, 17, 4170. [Google Scholar] [CrossRef]
- Jonny, N. Smart materials and technologies for sustainable concrete construction. Dev. Built Environ. 2023, 15, 100177. [Google Scholar] [CrossRef]
- Lu, J.-X.; Poon, C.S. Use of waste glass in alkali activated cement mortar. Constr. Build. Mater. 2018, 160, 399–407. [Google Scholar] [CrossRef]
- He, P.; Zhang, B.; Lu, J.-X.; Poon, C.S. Reaction mechanisms of alkali-activated glass powder-ggbs-CAC composites. Cem. Concr. Compos. 2021, 122, 104143. [Google Scholar] [CrossRef]
- Xia, Y.; Liu, Z.; Song, Z.; Zhao, R.; Wu, J.; Wang, L.; Yan, J. Valorization of municipal solid waste incineration fly ash in low-carbon alkali-activated materials. Chem. Eng. J. 2024, 495, 153577. [Google Scholar] [CrossRef]
- Rosas-Casarez, C.A.; Corral-Higuera, R.; Arredondo-Rea, S.P.; Gomez-Soberon, J.M.; Chinchillas-Chinchillas, M.J.; Rodriguez-Rodriguez, M.; Pellegrini-Cervantes, M.J.; Bernal-Camacho, J.M. Porosity of Geopolymers Using Complementary Techniques of Image Analysis and Physical Adsorption of Gases. Buildings 2025, 15, 2353. [Google Scholar] [CrossRef]
- Srinivasamurthy, L.; Chevali, V.S.; Zhang, Z.; Longhi, M.A.; Loh, T.W.; Wang, H. Mechanical property and microstructure development in alkali activated fly ash slag blends due to efflorescence. Constr. Build. Mater. 2022, 332, 127273. [Google Scholar] [CrossRef]
- Liu, Y.; Shi, C.; Zhang, Z.; Li, N.; Shi, D. Mechanical and fracture properties of ultra-high performance geopolymer concrete: Effects of steel fiber and silica fume. Cem. Concr. Compos. 2020, 112, 103665. [Google Scholar] [CrossRef]
- Si, W.; Cao, M.; Li, L. Establishment of fiber factor for rheological and mechanical performance of polyvinyl alcohol (PVA) fiber reinforced mortar. Constr. Build. Mater. 2020, 265, 120347. [Google Scholar] [CrossRef]
- Emdadi, A.; Mehdipour, I.; Libre, N.A.; Shekarchi, M. Optimized workability and mechanical properties of FRCM by using fiber factor approach: Theoretical and experimental study. Mater. Struct. 2015, 48, 1149–1161. [Google Scholar] [CrossRef]
- Li, W.; Cao, M.; Chang, J. Optimized formulation of waterproof coating based on polymer and sodium silicate-activated GGBS using Box Behnken design- Selection of additives. J. Build. Eng. 2022, 61, 105220. [Google Scholar] [CrossRef]
- Bergamonti, L.; Taurino, R.; Cattani, L.; Ferretti, D.; Bondioli, F. Lightweight hybrid organic-inorganic geopolymers obtained using polyurethane waste. Constr. Build. Mater. 2018, 185, 285–292. [Google Scholar] [CrossRef]
- Niu, W.; Zaoui, A.; Zheng, Y. Mechanical behavior and mechanisms behind PVA modified expansive soil. Comput. Geotech. 2025, 186, 107419. [Google Scholar] [CrossRef]
- Thong, C.C.; Teo, D.C.L.; Ng, C.K. Application of polyvinyl alcohol (PVA) in cement-based composite materials: A review of its engineering properties and microstructure behavior. Constr. Build. Mater. 2016, 107, 172–180. [Google Scholar] [CrossRef]
- Kim, J.H.; Robertson, R.E. Effects of polyvinyl alcohol on aggregate-paste bond strength and the interfacial transition zone. Adv. Cem. Based Mater. 1998, 8, 66–76. [Google Scholar] [CrossRef]
- Wang, Y.; Xie, X.; Yu, K.; Min, C.; Cui, H.; Jin, Y.; Huang, W.; Zhan, B. Cl- dissolution and mechanical properties of PVA, CSA modified coral sand. Constr. Build. Mater. 2024, 411, 134666. [Google Scholar] [CrossRef]
- Li, G.; Wang, L.; Yu, J.; Yi, B.; He, C.; Wang, Z.; Leung, C.K.Y. Mechanical properties and material characterization of cement mortar incorporating CNT-engineered polyvinyl alcohol latex. Constr. Build. Mater. 2022, 345, 128320. [Google Scholar] [CrossRef]
- Fan, J.; Li, G.; Deng, S.; Wang, Z. Mechanical Properties and Microstructure of Polyvinyl Alcohol (PVA) Modified Cement Mortar. Appl. Sci. 2019, 9, 2178. [Google Scholar] [CrossRef]
- Khan, M.Z.N.; Hao, Y.; Hao, H.; Shaikh, F.U.A. Mechanical properties and behaviour of high-strength plain and hybrid-fiber reinforced geopolymer composites under dynamic splitting tension. Cem. Concr. Compos. 2019, 104, 103343. [Google Scholar] [CrossRef]
- He, H.; Zhi, X.; Fan, F.; Song, Y.; Zhang, R. Strain-rate-dependent performance of alkali-activated binder-based ultra-high strength concrete. J. Build. Eng. 2024, 94, 109911. [Google Scholar] [CrossRef]
- Lian, C.; Wang, Y.; Liu, S.; Hao, H.; Hao, Y. Experimental study on dynamic mechanical properties of fly ash and slag based alkali-activated concrete. Constr. Build. Mater. 2023, 364, 129912. [Google Scholar] [CrossRef]
- Luo, X.; Xu, J.-Y.; Li, W.; Bai, E. Effect of alkali-activator types on the dynamic compressive deformation behavior of geopolymer concrete. Mater. Lett. 2014, 124, 310–312. [Google Scholar] [CrossRef]
- Cong, X.; Zhou, W.; Elchalakani, M. Experimental study on the engineering properties of alkali-activated GGBFS/FA concrete and constitutive models for performance prediction. Constr. Build. Mater. 2020, 240, 117977. [Google Scholar] [CrossRef]
- Yao, W.; Xia, K.; Liu, Y.; Shi, Y.; Peterson, K. Dependences of dynamic compressive and tensile strengths of four alkali-activated mortars on the loading rate and curing time. Constr. Build. Mater. 2019, 202, 891–903. [Google Scholar] [CrossRef]
- Zhe, R.; Zhou, W. Study of dynamic mechanical properties of UHPC-AAC composites based on SHPB test. J. Build. Eng. 2023, 78, 107668. [Google Scholar] [CrossRef]
- Gai, W.; Dai, F.; He, B.; Zhou, C.; Wei, M.; Liu, Y. Influence of GGBFS and alkali activators on macro-mechanical performance and micro-fracture mechanisms of geopolymer concrete in split Hopkinson pressure bar tests. Constr. Build. Mater. 2024, 434, 136736. [Google Scholar] [CrossRef]
- Ayhan, B.; Lale, E. Modeling strain rate effect on tensile strength of concrete using damage plasticity model. Int. J. Impact Eng. 2022, 162, 104132. [Google Scholar] [CrossRef]
- Radeef, H.R.; Hassan, N.A.; Mahmud, M.Z.H.; Abidin, A.R.Z.; Jaya, R.P.; Ismail, C.R.; Abbas, H.F. Linear viscoelastic response of semi-circular asphalt sample based on digital image correlation and XFEM. Measurement 2022, 192, 110866. [Google Scholar] [CrossRef]
- Zhao, K.; He, Z.; Yang, J.; Yan, Y.; Yu, X.; Zhou, Y.; Zhang, X.; Wang, J. Investigation of failure mechanism of cement-fiber-tailings matrix composites using digital image correlation and acoustic emission. Constr. Build. Mater. 2022, 335, 127513. [Google Scholar] [CrossRef]
- Chen, C.; Chen, X.; Ning, Y. Identification of fracture damage characteristics in ultra-high performance cement-based composite using digital image correlation and acoustic emission techniques. Compos. Struct. 2022, 291, 115612. [Google Scholar] [CrossRef]
- Safa, K.; Gary, G. Displacement correction for punching at a dynamically loaded bar end. Int. J. Impact Eng. 2010, 37, 371–384. [Google Scholar] [CrossRef]
- Zhang, Y.; Lei, P.; Wang, L.; Yang, J. Effects of Strain Rate and Fiber Content on the Dynamic Mechanical Properties of Sisal Fiber Cement-Based Composites. J. Renew. Mater. 2023, 11, 393–410. [Google Scholar] [CrossRef]
- Kim, J.H.; Robertson, R.E. Prevention of air void formation in polymer-modified cement mortar by pre-wetting. Cem. Concr. Res. 1997, 27, 171–176. [Google Scholar] [CrossRef]
- Gan, X.; Zhu, Y.; Ma, K.; Li, L.; Lu, L. Water resistance, mechanical properties, hydration characteristic and microstructure of magnesium ammonium phosphate cement modified by polyvinyl alcohol powder. Constr. Build. Mater. 2024, 440, 137439. [Google Scholar] [CrossRef]
- Guo, S.-Y.; Zhang, X.; Chen, J.-Z.; Mou, B.; Shang, H.-S.; Wang, P.; Zhang, L.; Ren, J. Mechanical and interface bonding properties of epoxy resin reinforced Portland cement repairing mortar. Constr. Build. Mater. 2020, 264, 120715. [Google Scholar] [CrossRef]
- Zarybnicka, L.; Machotova, J.; Macova, P.; Machova, D.; Viani, A. Design of polymeric binders to improve the properties of magnesium phosphate cement. Constr. Build. Mater. 2021, 290, 123202. [Google Scholar] [CrossRef]
- Chen, M.; Si, H.; Fan, X.; Xuan, Y.; Zhang, M. Dynamic compressive behaviour of recycled tyre steel fibre reinforced concrete. Constr. Build. Mater. 2022, 316, 125896. [Google Scholar] [CrossRef]
- Szelag, M. Evaluation of cracking patterns of cement paste containing polypropylene fibers. Compos. Struct. 2019, 220, 402–411. [Google Scholar] [CrossRef]
- Xie, H.; Yang, L.; Zhang, X.; Li, T.; Huang, C.; Ma, L. Study on impact compression properties and failure characteristics of basalt fiber reinforced reactive powder concrete. J. Clean. Prod. 2025, 486, 144398. [Google Scholar] [CrossRef]
- He, J.; Zhu, M.; Sang, G.; Yu, S.; He, J. Effect of PVA latex powder and PP fiber on property of self-compacting alkali-activated slag repair mortar. Constr. Build. Mater. 2023, 408, 133703. [Google Scholar] [CrossRef]
- Cai, Y.; Ren, H.-Q.; Long, Z.-L.; Guo, R.-Q.; Du, K.-M.; Chen, S.-S.; Zheng, Z.-H. Comparison study on the impact compression mechanical properties of coral aggregate concrete and ordinary Portland concrete. Structures 2022, 44, 1403–1415. [Google Scholar] [CrossRef]
- Chen, M.; Yu, H.; Zhang, T.; Gao, P. Elucidating the role of siliceous iron tailing powder on dynamic compressive properties and fractal characteristics of ultra-high performance concrete. Powder Technol. 2025, 464, 121221. [Google Scholar] [CrossRef]
- Abazari, M.; Badeleh, S.M.; Barkhordari, S.; Mohammed, S.S.; Ahmed, M.M.; Mohammed Ameen, M.S.; Abdollahi, H. Preparation and characterization of polyvinyl alcohol thin films: Rheological, physicochemical and functional properties. Heliyon 2025, 11, e43604. [Google Scholar] [CrossRef]
Disclaimer/Publisher’s Note: The statements, opinions and data contained in all publications are solely those of the individual author(s) and contributor(s) and not of MDPI and/or the editor(s). MDPI and/or the editor(s) disclaim responsibility for any injury to people or property resulting from any ideas, methods, instructions or products referred to in the content. |
© 2025 by the authors. Licensee MDPI, Basel, Switzerland. This article is an open access article distributed under the terms and conditions of the Creative Commons Attribution (CC BY) license (https://creativecommons.org/licenses/by/4.0/).