Article

Numerical Investigations of Snowdrift Characteristics on Roofs with Consideration of Snow Crystal Morphological Features

1
Key Laboratory of Structures Dynamic Behavior and Control of China Ministry of Education, Harbin Institute of Technology, Harbin 150090, China
2
Key Laboratory of Smart Prevention and Mitigation of Civil Engineering Disasters of the Ministry of Industry and Information Technology, Harbin Institute of Technology, Harbin 150090, China
*
Author to whom correspondence should be addressed.
Buildings 2025, 15(19), 3606; https://doi.org/10.3390/buildings15193606
Submission received: 14 July 2025 / Revised: 4 October 2025 / Accepted: 5 October 2025 / Published: 8 October 2025
(This article belongs to the Section Building Structures)

Abstract

Under extreme snowfall conditions, wind-induced snow drifting can lead to the redistribution of snow accumulation on roofs, resulting in localized overloads that pose a serious threat to building structural safety. Notably, morphological differences in snow particles significantly alter their aerodynamic characteristics, causing variations in their motion trajectories and increasing the uncertainty in determining roof snow loads. Therefore, this study develops a numerical simulation method that accounts for snow morphologies based on the drag coefficients of typical snow crystals, and further investigates the accumulation characteristics of differently shaped snow particles on typical roofs. Analysis results demonstrate that the observed variations in snow particle motion characteristics primarily originate from differences in their respective drag coefficients. The drag coefficient exerts a direct influence on particle settling velocity, which subsequently governs spatial distribution patterns of snow concentration and final accumulation patterns. Under identical inflow snow concentration conditions, particles with higher drag coefficients exhibit reduced depositional accumulation on roof surfaces. Notably, this shape-dependent effect diminishes with increasing roof span and slope.

1. Introduction

With the ongoing intensification of global climate change, the increasing frequency of extreme low-temperature snow disasters has posed severe challenges to building structural safety. Unlike traditional wind engineering issues, snow disasters involve more complex multi-phase coupling in wind–snow flow dynamics. As the airflow passes over buildings, flow separation and reattachment phenomena on roof surfaces induce intricate vortex structures. The movement trajectories of snow particles within these vortexes are influenced by aerodynamic drag, gravity, and interparticle interactions, frequently leading to uneven snow accumulation on roofs. This uneven snow load not only disrupts structural force equilibrium, but may also trigger localized overload failure risks. Notably, the morphology of snow particle exhibits remarkable spatiotemporal variability (including diverse forms like hexagonal crystals, graupel, and wet snow clusters), and their differing aerodynamic characteristics (such as drag coefficients and settling velocities) in airflow directly affect the wind–snow coupling process, and eventually increase the uncertainty in determining roof snow loads. Therefore, the incorporation of snow particle morphological characteristics into wind–snow flow analysis has become a critical scientific issue for achieving accurate predictions of roof snow accumulation patterns in structural engineering.
Given the significant influence of snow particle morphology on their motion characteristics, extensive field measurement studies on the morphological features and falling velocity of snow particles have been conducted. In 1962, Magono [1] systematically established the classification system for natural snow crystals, encompassing 60 crystal morphological categories. This framework remains a fundamental reference for characterizing snow particle shapes in cryospheric research. Kikuchi et al. [2] expanded the observational scope to polar regions, employing global-scale statistical analyses to refine the classification system to 121 distinct types. These investigations comprehensively revealed both the complexity of snow particle morphologies and their pronounced geographical variations. As for the motion characteristics, Shiina [3] conducted long-term measurements on the average densities of falling snow particles, employing image processing techniques to characterize the particle diameters and falling velocities. Yagi [4] focused on measuring the falling velocities of ice crystals suspended in supercooled fog. Locatelli et al. [5] systematically investigated the falling speeds and masses of numerous solid precipitation particles. Their research particularly emphasized the influences of riming and aggregation on the kinematic properties and mass parameters, yielding empirical formulations for the relationships between falling speeds/masses and particle maximum dimensions. Heymsfield [6] further proposed two sets of computational equations for terminal settling velocities, integrating ice crystal drag coefficients, aspect ratios, and densities derived from direct velocity measurements to consider different ice crystal forms. These field measurements have provided the most direct and reliable data for understanding snow particle morphology and motion characteristics, significantly advancing research on roof snow loads. However, due to the inherent uncertainties and uncontrollability of meteorological conditions (e.g., wind speed, temperature, humidity and other environmental factors), direct field measurements on roof snow distribution patterns with the consideration of snow morphology remain relatively scarce.
Due to the susceptibility of field measurements to environmental interference, researchers have increasingly adopted substitute particles in wind tunnel experiments to simulate roof snow accumulation phenomena. As early as 1939, Finny [7] employed crushed mica flakes to simulate real snow particles in a traditional wind tunnel, conducting experimental research on wind-induced snowdrift around roadside snow fences. However, this study did not consider the similarity between scaled-test and prototype, nor did it analyze the differences in properties between the substitute mica flakes and real snow particles. In 1961, Gerdel et al. [8] first indicated that the similarity criteria must be established between the scaled test and prototype in terms of dimensions, particle properties, and other aspects, to accurately reproduce the snow movement. Subsequently, scholars such as Kind et al. [9,10] and Iversen [11,12] introduced criteria for geometric, kinematic, and dynamic similarity between simulated particles and real snow particles, laying a solid theoretical foundation for wind–snow experiments. Through continued explorations, nearly 40 similarity numbers have been proposed to simulate the movement of real snow particles. However, it is noteworthy that these similarity criteria often exhibit significant conflicts in most scenarios. To accurately reproduce the accumulation mechanisms of snow crystals, natural snow or artificial ice particles have been adopted to simulate the snowdrifts in specialized low-temperature climatic wind tunnels. Delpech et al. [13] conducted experimental research at the Jules Verne climatic wind tunnel in France, employing artificial snow particles to explore the snow distribution around the Concordia Antarctic Research Station and proposed optimization solutions for building shapes to avoid surrounding snowdrifts. Okaze et al. [14] investigated the developing process of ground snowdrift by dispersing and laying loose snow layers at the CES (Cryospheric Environment Simulator) in Japan. Fan et al. [15] developed a specialized wind tunnel capable of simulating multifactorial environmental conditions including wind, rain, heat, and snow for snow-related experimental studies. Utilizing this facility, Zhang et al. [16,17] conducted a systematic investigation into snowdrift formation patterns on and around various building types. These climatic wind tunnels provide specialized experimental platforms for snow-wind research. However, the complex formation mechanism of natural snow crystals poses significant challenges for existing facilities in achieving batch production of all snow crystal morphotypes. Coupled with the high operational costs, these limitations have significantly hindered the widespread application of such experimental methods in snowdrift research.
With the advancement of computational fluid dynamics (CFD) technology, numerical simulation has become a key approach for addressing snow-related problems. Currently, the CFD technology can be divided into two frameworks: Euler–Lagrange [18,19,20] and Euler–Euler [21,22,23,24]. Euler–Lagrange treats snow particles as a discrete phase, determining snow accumulation characteristics by solving the forces acting on individual particles. This method enables direct definition of particle geometry, precisely modeling snow particle morphology’s impact on drifting. However, its high computational cost limits applicability to building-scale snow distribution simulations. In contrast, Eulerian–Eulerian treats snow particles as a continuous phase, describing their spatial distribution by solving transport equations. Uematsu et al. [21] pioneered this theory by proposing a snow concentration diffusion equation, combined with Pomeroy’s empirical formula for near-wall snow particle transport rates [25], achieving numerical simulation of drifting snow particle motion. Subsequent studies [26,27,28] have continuously refined this approach by incorporating additional physical mechanisms, such as repose angle of snow particles, feedback to turbulence, and gravitational compact, etc. Furthermore, some researchers [29,30,31] have developed multi-phase models, integrating processes like snow-wind mass and momentum exchanges and heat transfer. The Euler–Euler framework offers an efficient approach for assessing snow loads on building roofs. However, the treatment of snow particles as a continuous phase introduces inherent limitations in accounting for particle morphology effects. To address this challenge, the present study developed a refined multiphase model that incorporated a morphology-dependent drag function into the transport equations, enabling the simulation of distinct motion characteristics of snow crystals with diverse morphological features. Following validation against wind tunnel experimental data, the model was applied to simulate snow distribution patterns on simple flat roofs and single-pitched roofs, to systematically analyze the impact of morphological differences in snowfall particles on roof snow loads.

2. Numerical Model Incorporating Snow Morphology Effects

2.1. Drag Coefficient of Typical Snow Crystals

The formation of snow particles is a complex physical process. In high-altitude environments, microscopic particles adsorb water vapor and crystallize into initial ice crystals under low temperatures, with anisotropic growth along different crystallographic axes leading to diverse snow morphologies. In terms of growth patterns, snow particles are primarily categorized into vertical growth (e.g., columns form and needle form) where thickness significantly exceeds width, and lateral growth (e.g., plate form and dendritic form) where width far surpasses thickness. Libbrecht [32] indicated that vertically grown particles like columns predominantly formed at temperatures around −5 °C, whereas laterally grown particles typically developed below −15 °C. Nakaya et al. [33] systematically established correlations between snow crystal morphologies and temperature/humidity conditions through laboratory-grown snowflake experiments, with the proposed Nakaya curve revealing laws governing snow crystal formation. To date, over 120 snow morphologies have been identified through sustained observations [2]. During the winter of 2022–2023, the authors conducted observations and performed statistical analysis on snow particle morphology and corresponding meteorological conditions during six snowfall events in Harbin, as shown in Figure 1. The results indicated that snow crystals in this region were predominantly characterized by laterally grown structures, mainly manifesting in four forms, i.e., plate-like, spherical, rosette-shaped, and aggregated particles. The influence of temperature and humidity on snow particle morphology was found to be complex, with humidity playing a significant role in shaping crystal morphology even under similar temperature conditions.
When fully formed snow crystals start to fall and subsequently drift along the snow surface, the force states of particles will undergo changes. Under the assumption of negligible secondary forces, the falling snow particles are primarily subjected to gravity Fg, drag force Fd, and buoyancy Fl, as expressed from Equations (1)–(3). Here, ρa and ρs represent the densities of air and snow particles, respectively, As denotes projected area of a snow particle, Vs is the particle volume, ur represents the relative velocity between air and snow, CD denotes the drag coefficient, and g is gravitational acceleration. In contrast, the drifting motion of particles near the snow surface is generally considered to be triggered when the aerodynamic shear force exceeds a certain threshold, quantified by the threshold friction velocity u*t. Through force equilibrium analysis of idealized spherical particles, the threshold friction velocity u*t can be theoretically derived for ideal conditions, yielding the relationship expressed in Equation (4) [34]. φ represents the repose angle of snow particles and ds is the maximum diameter of snow particles. A comparative analysis of Equations (2) and (4) reveals that the force differences between falling particles and surface-drifting particles are primarily determined by the drag coefficient CD. In traditional numerical simulations, snow particles are often simplified as spheres, and the drag coefficient is calculated using typical methods for spherical particles, as given in Equation (5) [35]. This equation reveals strong Reynolds number Re dependence in the flow field around idealized spheres. The Reynolds number, which depends on particle shape, is defined by Equation (6), with μa representing the dynamic viscosity of air. Although computationally efficient, such simplification neglects the complex aerodynamic behavior of non-spherical particles.
F g = ρ s g V s ,
F d = 0.5 ρ a u r 2 A s C D ,
F l = ρ a g V s ,
u t = π 6 C D cos φ / 2 + 1 / 3 ρ s ρ a g d s ρ a ,
C D = 0.292 1 + 9.06 R e 2     ,   R e < 10,000 ,
R e = ρ a u r d s μ a
For non-spherical particles, the drag coefficient is influenced not only by the Reynolds number but also by factors including particle morphology, surface roughness, and particle-fluid density ratio, typically exhibiting higher values than those of spherical particles. To quantify the drag characteristics of non-spherical particles, McCorquodale et al. [36,37] employed an image-analysis-driven trajectory reconstruction algorithm to analyze the settling trajectories of 3D-printed snow particles with various morphologies in a stationary viscous fluid (water-glycerol mixture). This approach enabled the acquisition of particle motion data across different Reynolds number regimes (Re < 10,000), ultimately establishing a comprehensive database correlating drag coefficients with Reynolds numbers for diverse particle shapes. Through regression analysis, the empirical relationships for calculating drag coefficients of various snow particle morphologies were derived as presented in Equations (7)–(9), as shown in Table 1.

2.2. Numerical Model Considering Snow Crystal Morphologies

Given that the Euler–Lagrange framework requires huge computational resources for particle tracking, making it less suitable for simulating snow accumulation on building-scale roofs, this study develops an alternative Euler–Euler approach that indirectly accounts for the interactions of particles with different morphologies. The proposed method offers a more practical solution for simulating snowdrifts on building roofs. Although it does not achieve the same level of accuracy as the Euler–Lagrange framework, it provides a novel perspective for investigating snowdrifts at architectural scales. Based on the empirical formulas for the drag coefficients of non-spherical particles, the multiphase model in commercial ANSYS software 15.0 was adopted and revised to achieve the simulation of the aerodynamic transport processes of snow particles with different morphologies. The original multiphase model adopts a Euler–Euler framework, treating snow particles as an equivalent continuous fluid medium. The motion characteristics of air-snow two-phase flow are derived by solving the continuity equations and momentum equations for both the air and snow phases. A key advantage of this model lies in the introduction of a drag function term in the momentum equations, which quantifies the momentum exchange process caused by the relative motion between the air and snow phases.
Specifically, the transport equations for air–snow flow were established through the continuity and momentum conservation equations for each phase, as expressed in Equations (10) and (11). Here, the subscript “q” identifies a particular phase (e.g., “a” for the air phase or “s” for the snow phase). The parameters, αq, ρq, and uq, represent the volume fraction, density, and velocity vector of the qth phase. The pressure, denoted by p, is uniform across all phases. Additionally, the symbol g stands for gravitational acceleration, and τq signifies the stress tensor associated with the qth phase. The term R, which is included in the standard ANSYS multiphase model, represents the momentum exchange term between the air and snow phases. This term is determined by the velocity differential between the two phases, as delineated in Equation (12). Here, Ka,s denotes the interphase momentum exchange coefficient between air and snow, which can be derived using Equation (13). Here, the unit of Ka,s is kg/(m3·s). The symbol τt represents the particulate relaxation time specific to snow, as illustrated in Equation (14). The term f stands for the drag function, which can be determined by the drag coefficient CD and the Reynolds number Re as shown in Equation (15). Therefore, the aerodynamic behavior of snow particles with different morphologies can be quantitatively characterized by appropriately adjusting the drag coefficient in the momentum equation. Boutanios et al. [38] used to apply this momentum exchange term to simulate the two-way coupling between the air and snow phases. ds indicates the maximum diameter of snow particles, while μs denotes the dynamic viscosity of snow phase, taken as 2.2 × 10⁻⁶ N·s/m2 [39]. Asnow signifies the interfacial areas, defined as the interfacial area between the two phases per unit volume of the mixture. Here,
𝜕 𝜕 t ( α q ρ q ) + ( α q ρ q u q ) = 0 ,
𝜕 𝜕 t ( α q ρ q u q ) + ( α q ρ q u q u q ) = α q p + τ q + α q ρ q g + R ,
R = K a , s u a u s ,
K a , s = ρ s f 6 τ t d s A snow ,
τ t = ρ s d s 2 18 μ s ,
f = C D R e 24 ,
When free-motion snow particles fall onto the roof surface and further drift downstream along with the airflow, their motion states can be categorized into three modes based on the trajectory height: creep (≤0.01 m), saltation (0.01 m~0.1 m), and suspension (≥0.1 m) [9]. Among these, particles in saltation and suspension will undergo interlayer mass exchange due to turbulent diffusion. Additionally, near-surface airflow fluctuations will cause localized deposition and erosion of saltating particles, leading to variations in snow concentration. To account for the influences of turbulence and deposition/erosion on snow concentration, a diffusion term reflecting turbulent effects and a source term representing deposition/erosion effects were introduced into the continuity equation of snow phase [30,31], as shown in Equation (16). μt,s represents the turbulent viscosity of snow phase and σ is a constant. The source term Ss can be determined from the snow erosion flux qero and deposition flux qdep, as described by Equations (17)–(19). By incorporating key parameters, including the saltation layer height hsal, empirical constant ca, friction velocity u*, threshold friction velocity u*t, and settling velocity of drifting snow wf, the variation in snow concentration could be reasonably calculated. The final snow depth hs can be calculated as the sum of the deposited snow depth hdep and the eroded snow depth hero, as illustrated in Equation (20) [30,31]. T represents the duration of snowfall.
𝜕 𝜕 t ( α s ρ s ) + ( α s ρ s u s ) = μ t , s σ α s + S s ,
S s = q ero + q dep h sal z h sal 0 z > h sal ,
q ero = c a ρ s u 1 u t 2 u 2 u > u t 0 u u t ,
q dep = α s ρ s w f ,
h s = h s , dep + h s , ero = q dep ρ s T + q ero ρ s T ,

3. Validation of Numerical Model

3.1. Test Prototype

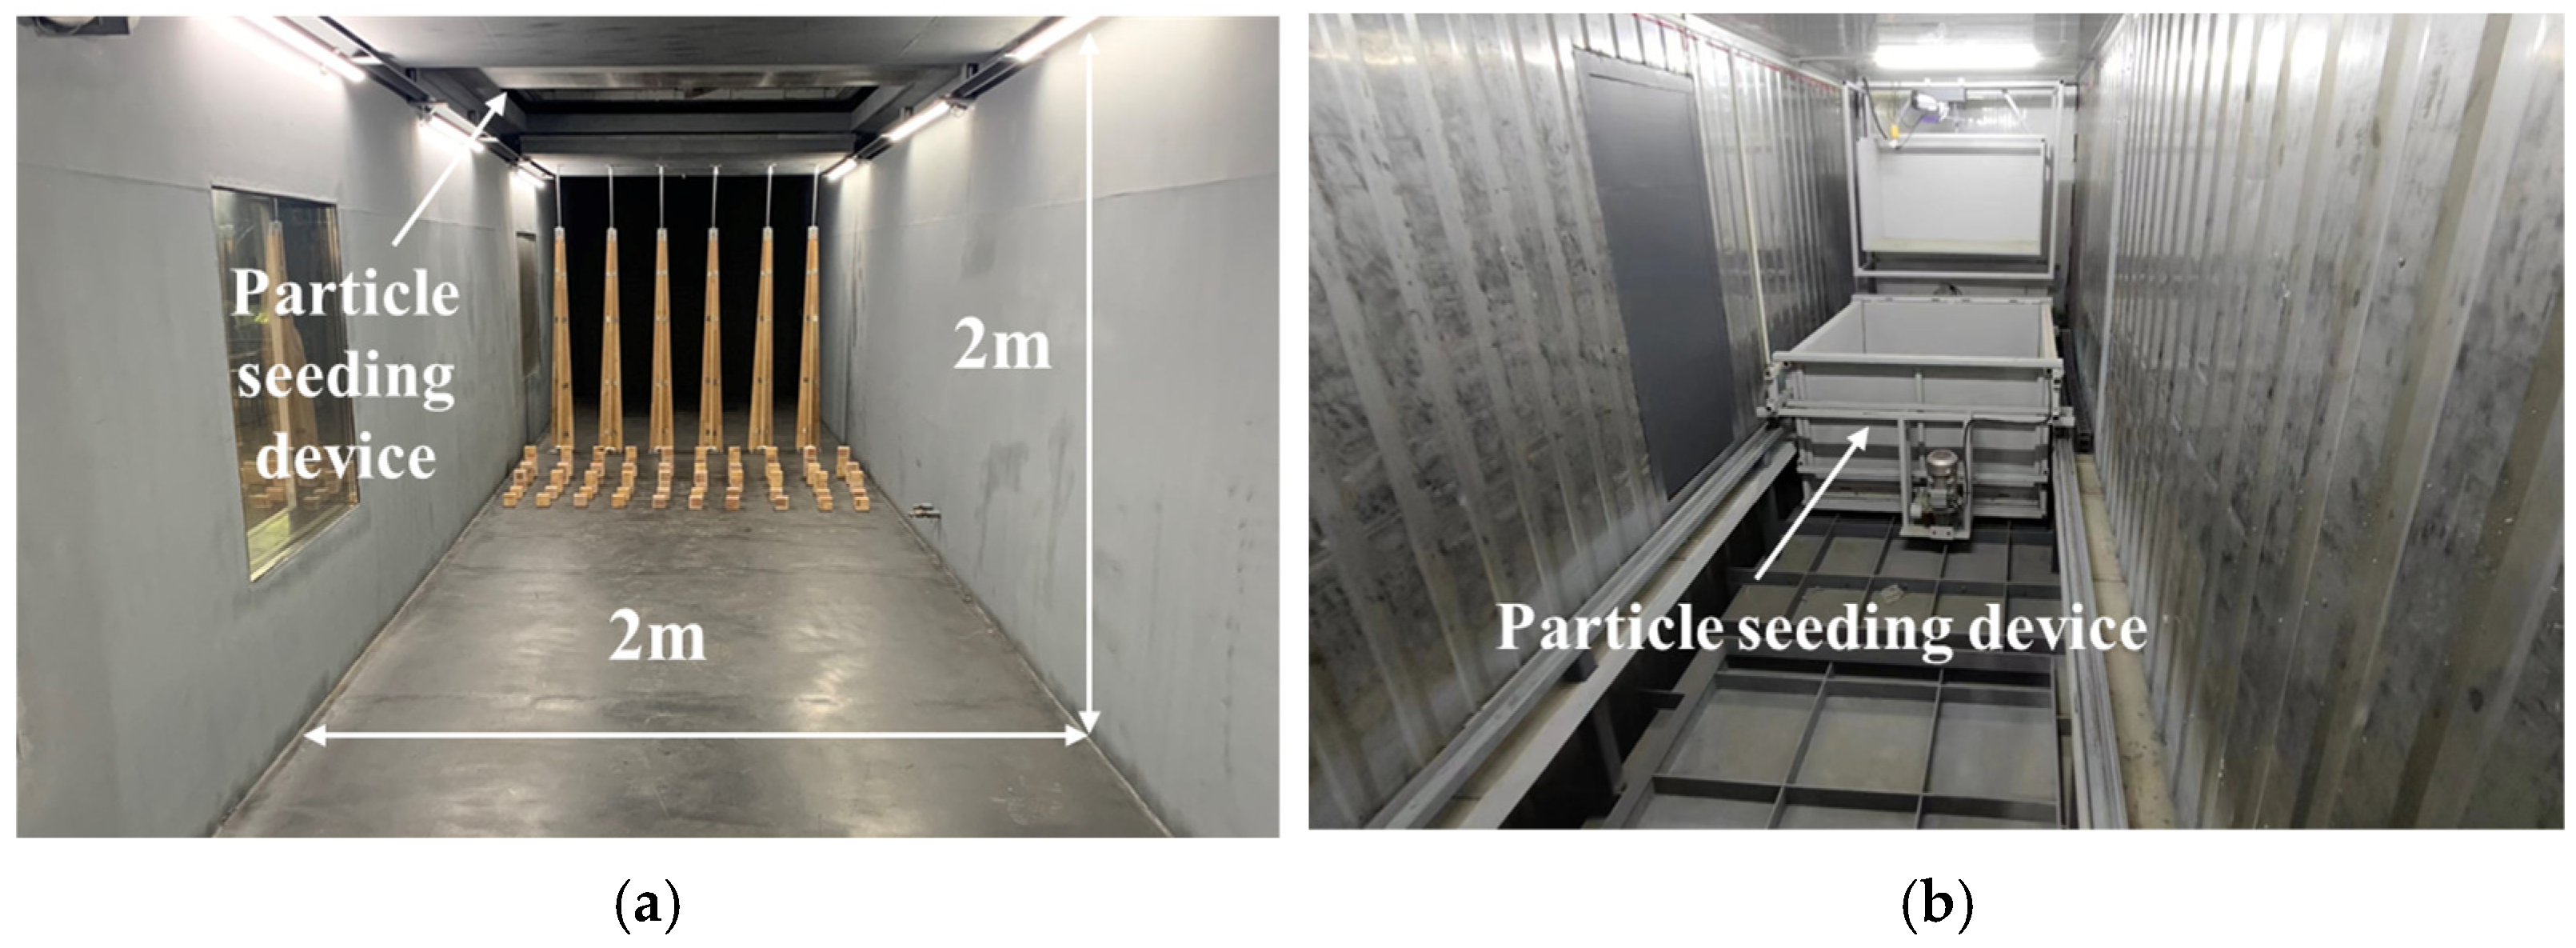
To assess the prediction accuracy of the revised numerical model, a comparative analysis was undertaken using test results of snowdrift on a flat roof. The test was conducted in the “Simulator of Natural Action of Wind-Rain-Heat-Snow for Space Structures” at Harbin Institute of Technology [15]. This simulator combines an atmospheric boundary layer wind tunnel, a refrigeration system, and a particle seeding device, as shown in Figure 2. During the wind–snow test, the refrigeration system cools the airflow inside the wind tunnel to achieve the low-temperature atmospheric boundary layer wind environment required for the experiment. Subsequently, through the vibration of the particle seeding device, experimental particles (e.g., stored natural snow or artificial snow) are seeded into the test section. These particles then fall with the airflow and settle evenly over the model area, creating a quasi-realistic snowfall environment, as illustrated in Figure 3. The simulator enables the precise generation of a controllable low-temperature snowfall environment, with the temperature adjustable from −20 °C to 25 °C. The test section of the simulator has a 2 m × 2 m cross-section and offers wind speeds that can be continuously adjusted between 0.5 m/s and 20 m/s.
Due to the limited cross-sectional dimensions of the wind tunnel, a scaled flat-roofed building model was selected for this snowdrift experiment. The prototype building measured 20 m in length, 20 m in width, and 5 m in height. Based on the study by Mo et al. [40] on the wind speeds during snowfall events, the wind speed UH at eave height was determined to be 9 m/s, following a power-law wind profile with an exponent of 0.15. With reference to the observations of snowfall in the Harbin by authors, the snowfall intensity Sd was set at 9.38 kg/m2·h, and the snowfall duration T was set to 5.5 h. Furthermore, referring to the typical values of natural snow particle characteristic parameters in previous studies [41,42,43], the prototype snow particle density ρs was defined as 250 kg/m3, with a particle diameter ds of 0.5 mm, a threshold friction velocity u*t of 0.18 m/s, and a particle settling velocity UTER of 0.6 m/s. As for the test, a scale ratio of 1/50 was selected. Hence, the flat-roofed building model featured a horizontal projected dimensions of 0.4 m (L) × 0.4 m (W) and an eave height of 0.1 m (H). Artificial snow particles, produced through the rapid condensation of atomized water droplets in a low-temperature environment, were utilized as the test particles. These particles were uniformly sized and nearly spherical in shape. The density of the test particles ρs consistently measured 400 kg/m3, with a particle diameter ds of 0.3 mm. Subsequent tests on their motion characteristics revealed that the particles initiated drifting when the friction velocity reached 0.25 m/s, and their final settling velocity stabilized at 0.8 m/s during free falling through the air.
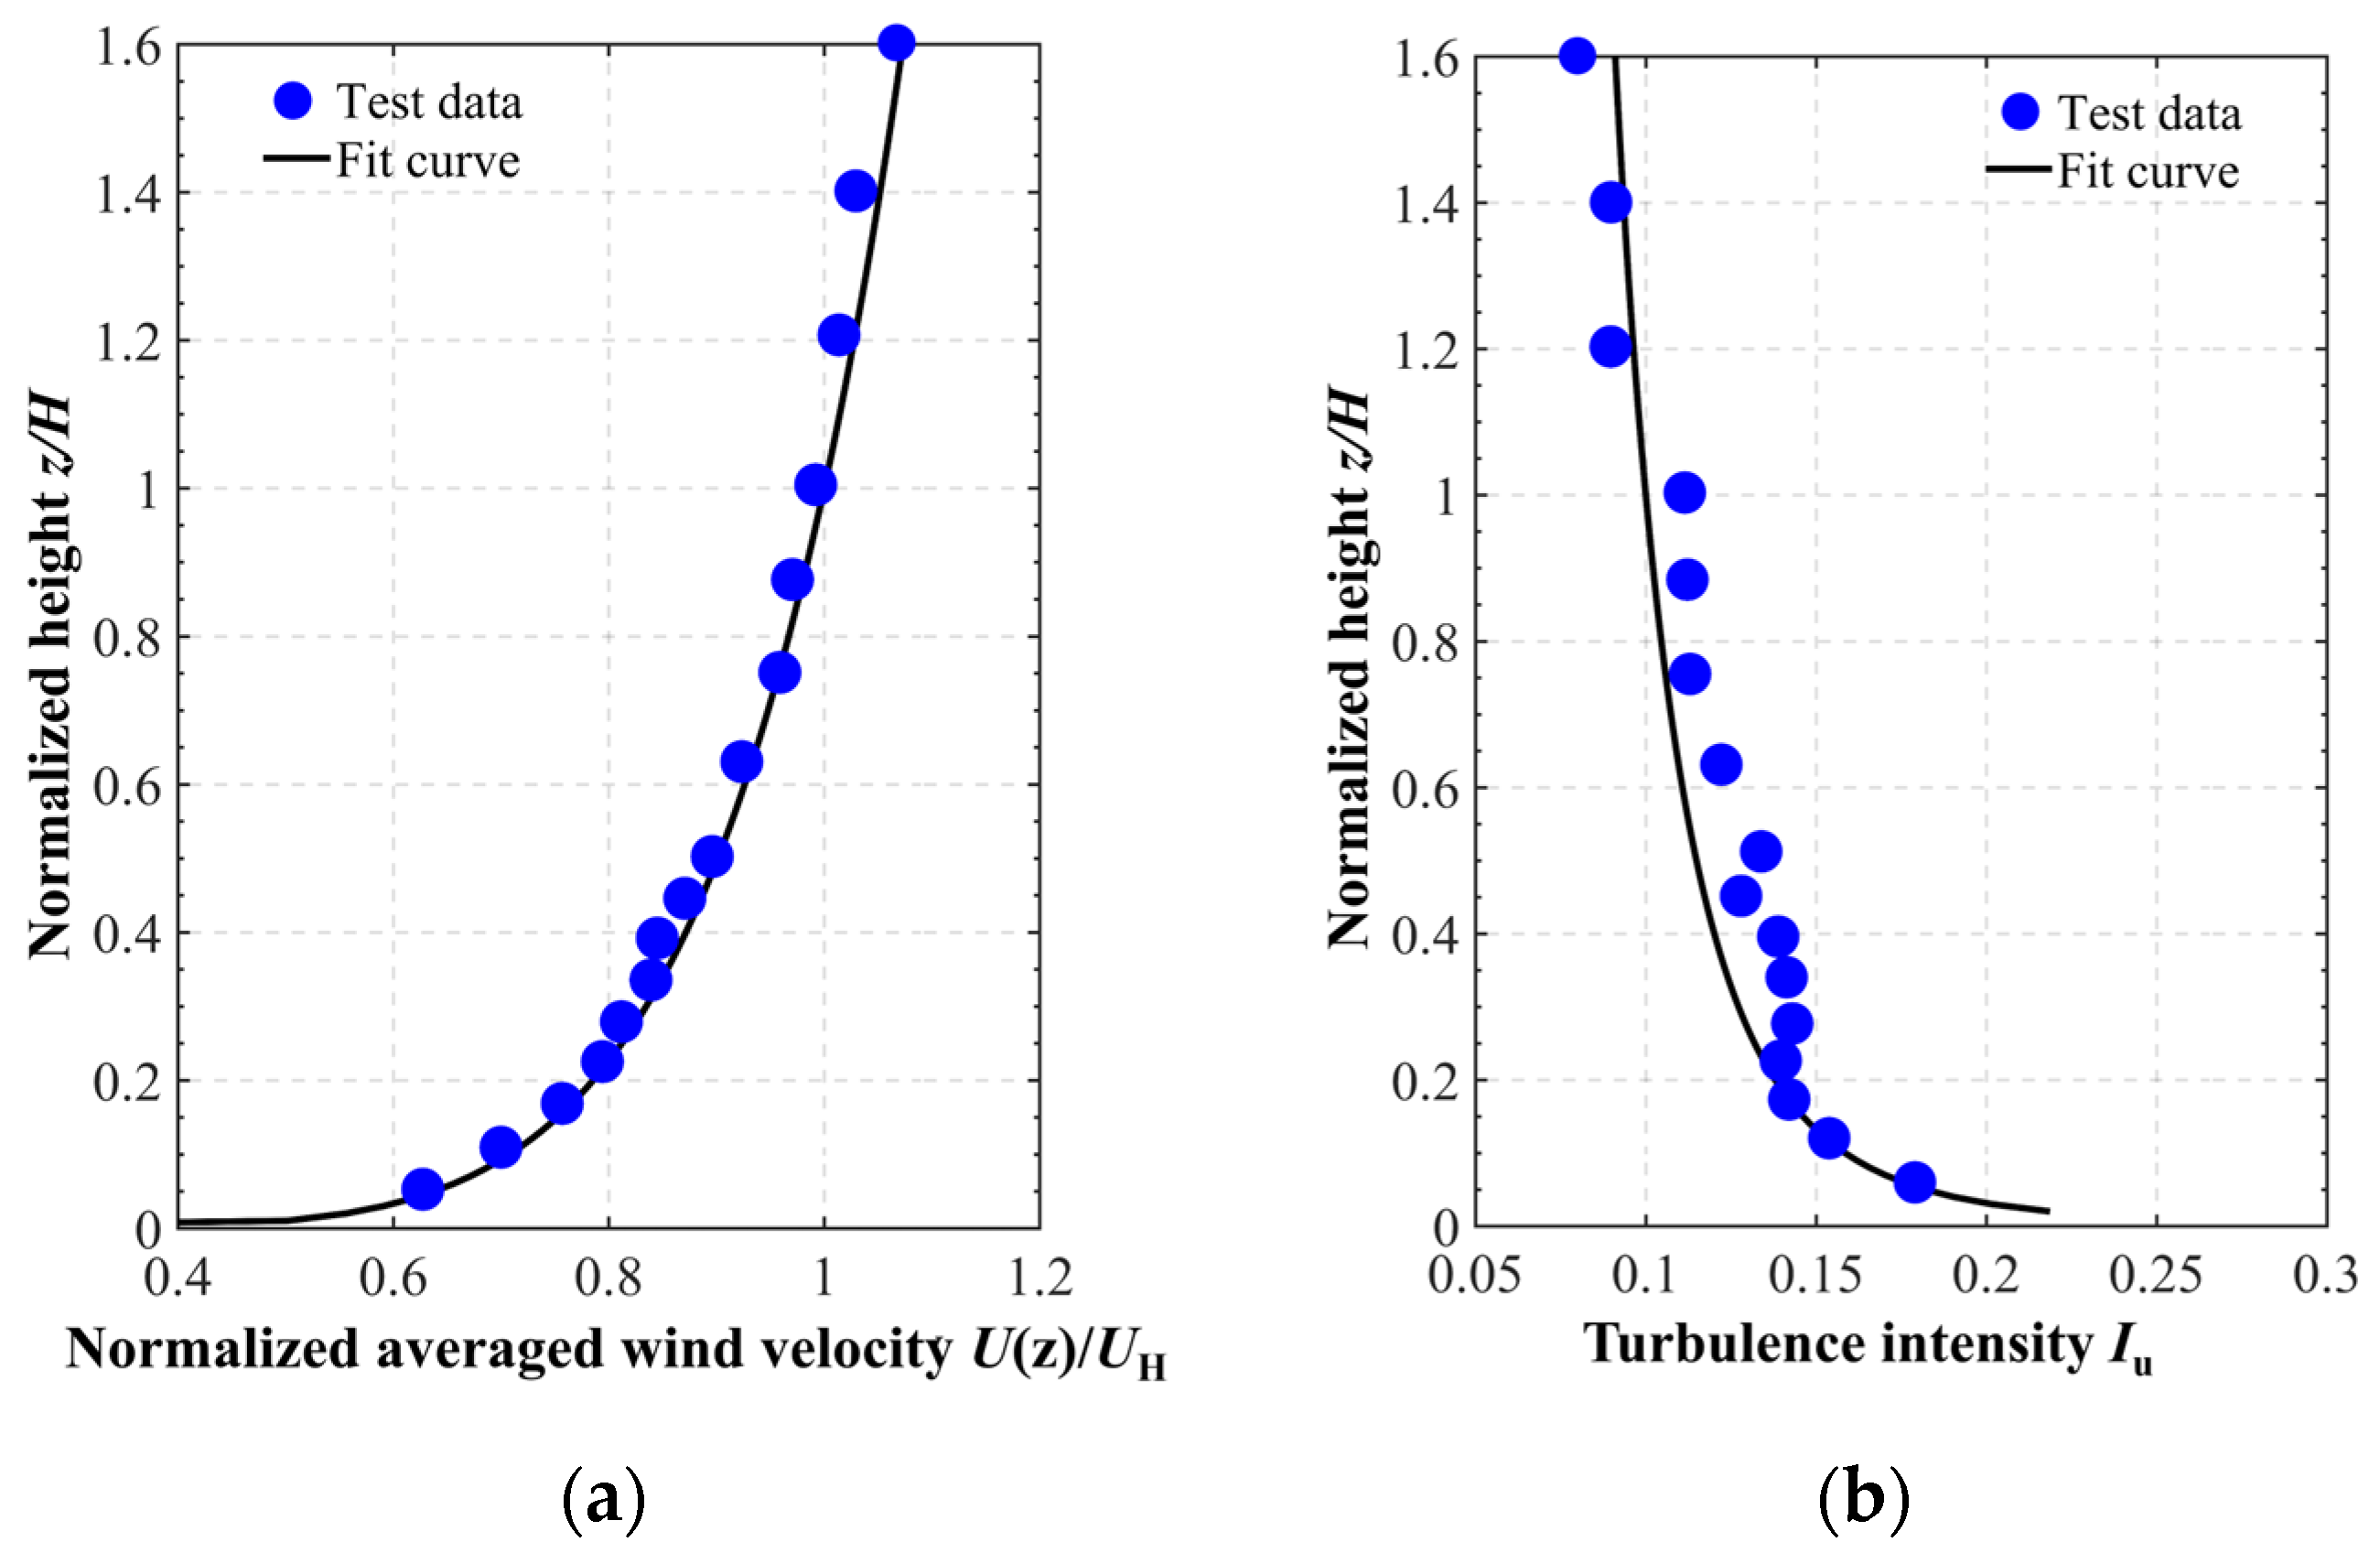
To ensure that the scaled test accurately reproduces the full-scale snowdrift movement process on the roof, the similarity criteria [44], which mainly focused on the snowfall consistency, were selected for experimental design. Table 2 compares the similarity numbers calculated for the prototype and the scaled test. Similarity number 1 was used to characterize the falling trajectory similarity of snow in the air. Similarity number 2 corresponds to the particulate Froude number, which reflects the similarity of near-ground snow transport processes. Similarity numbers 3 and 4 primarily address the similarity in total snowfall amount. Similarity number 5 ensures the similarity in deposition and erosion behavior. A comparison shows that the values between the prototype and the scaled model generally fall within the same ranges, preliminarily indicating that the experimental particles can effectively reproduce snow distribution characteristics. Based on these similarity numbers, the experimental wind speed at eave height was set to 1.6 m/s, the snowfall intensity to 10 kg/m2·h, and the test duration to 6 min. The exponential wind profile with an index of 0.15 was formed by adjusting the positions of rough elements and wedges referring to the Chinese load code [45]. Figure 4 provides the inflow wind velocity and the turbulence intensity ahead of the building model. After the test, a Leica MS60 laser scanner was used to collect the coordinate information of the buildings before and after the tests. Through subsequent data processing, the snow distributions on roofs could be calculated.

3.2. Comparative Analysis

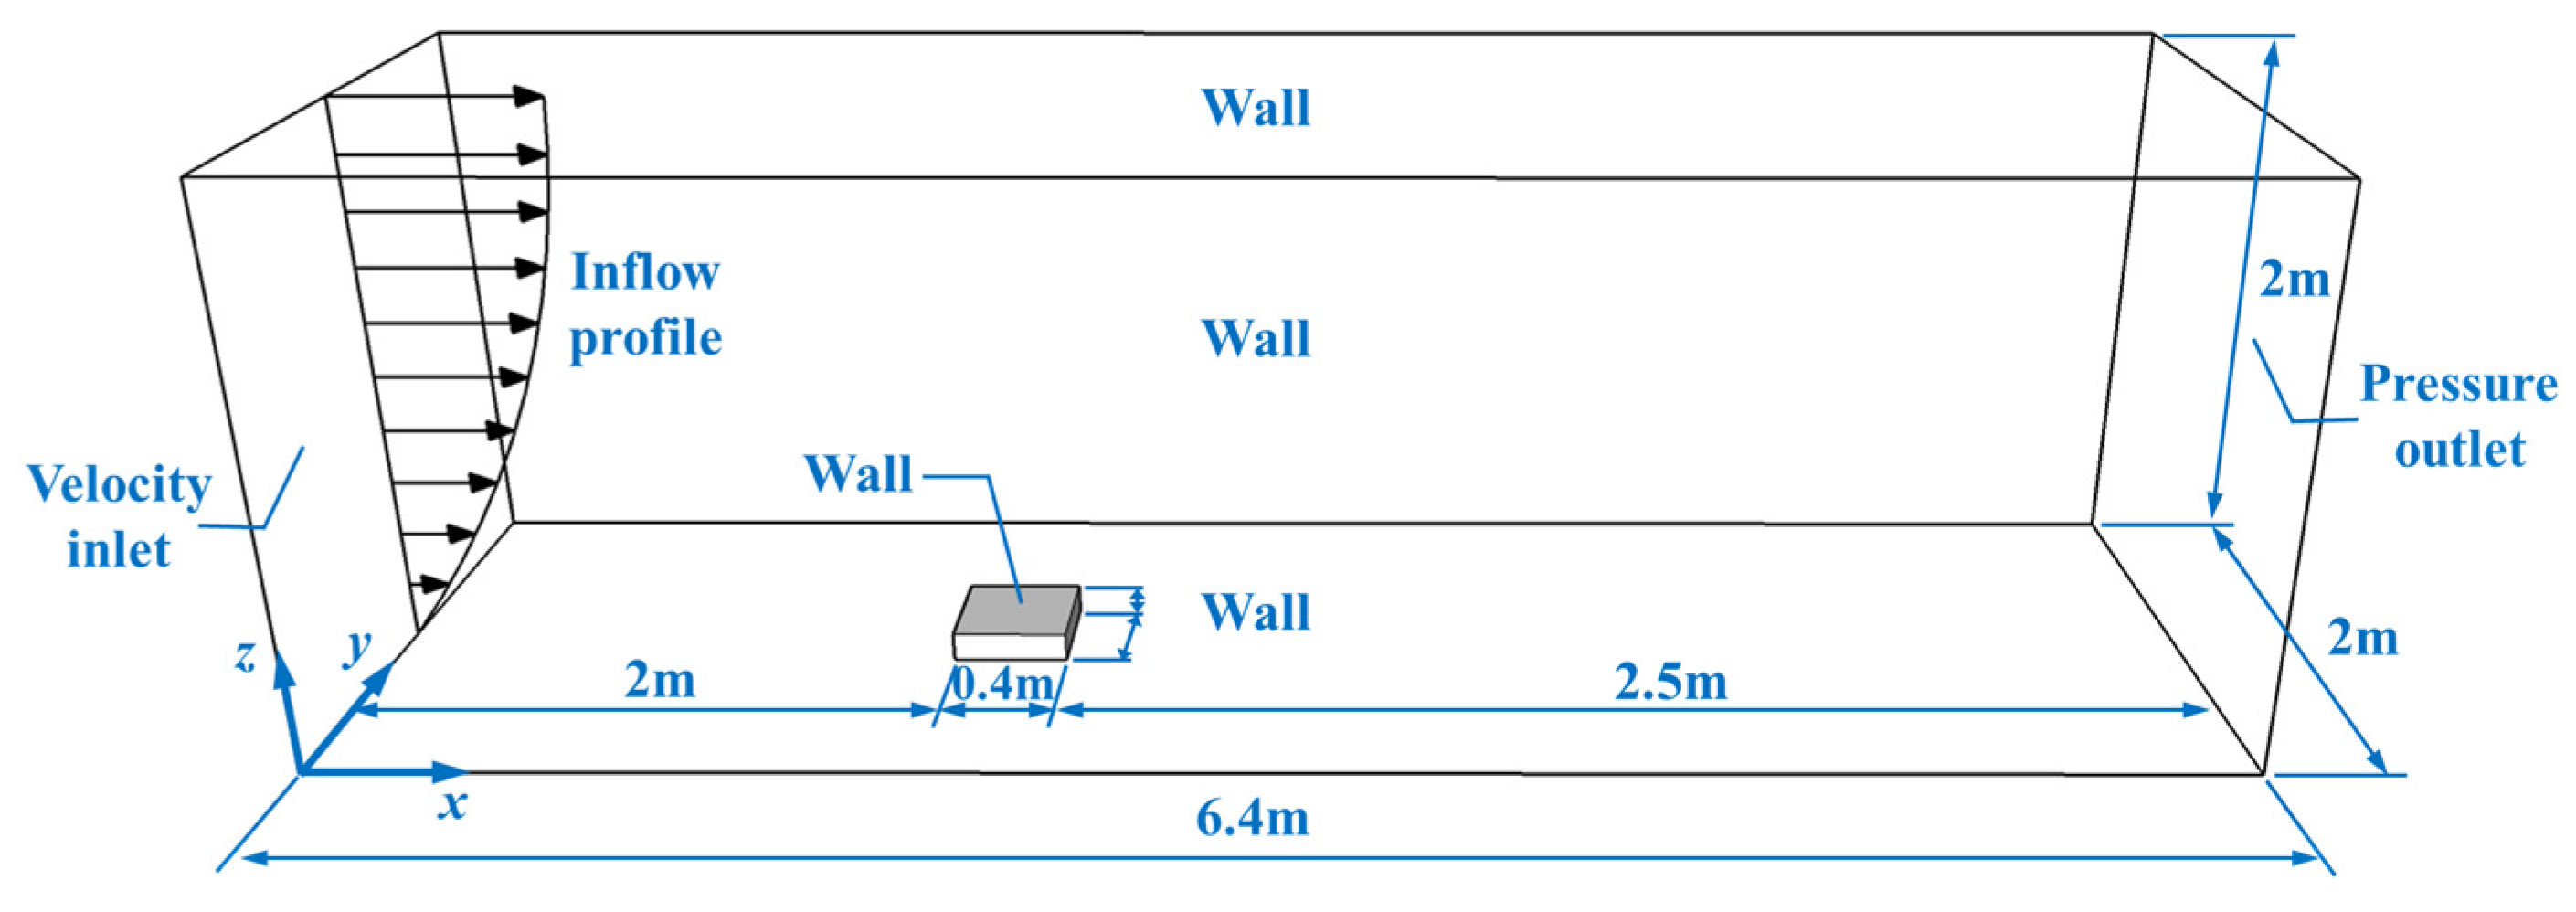
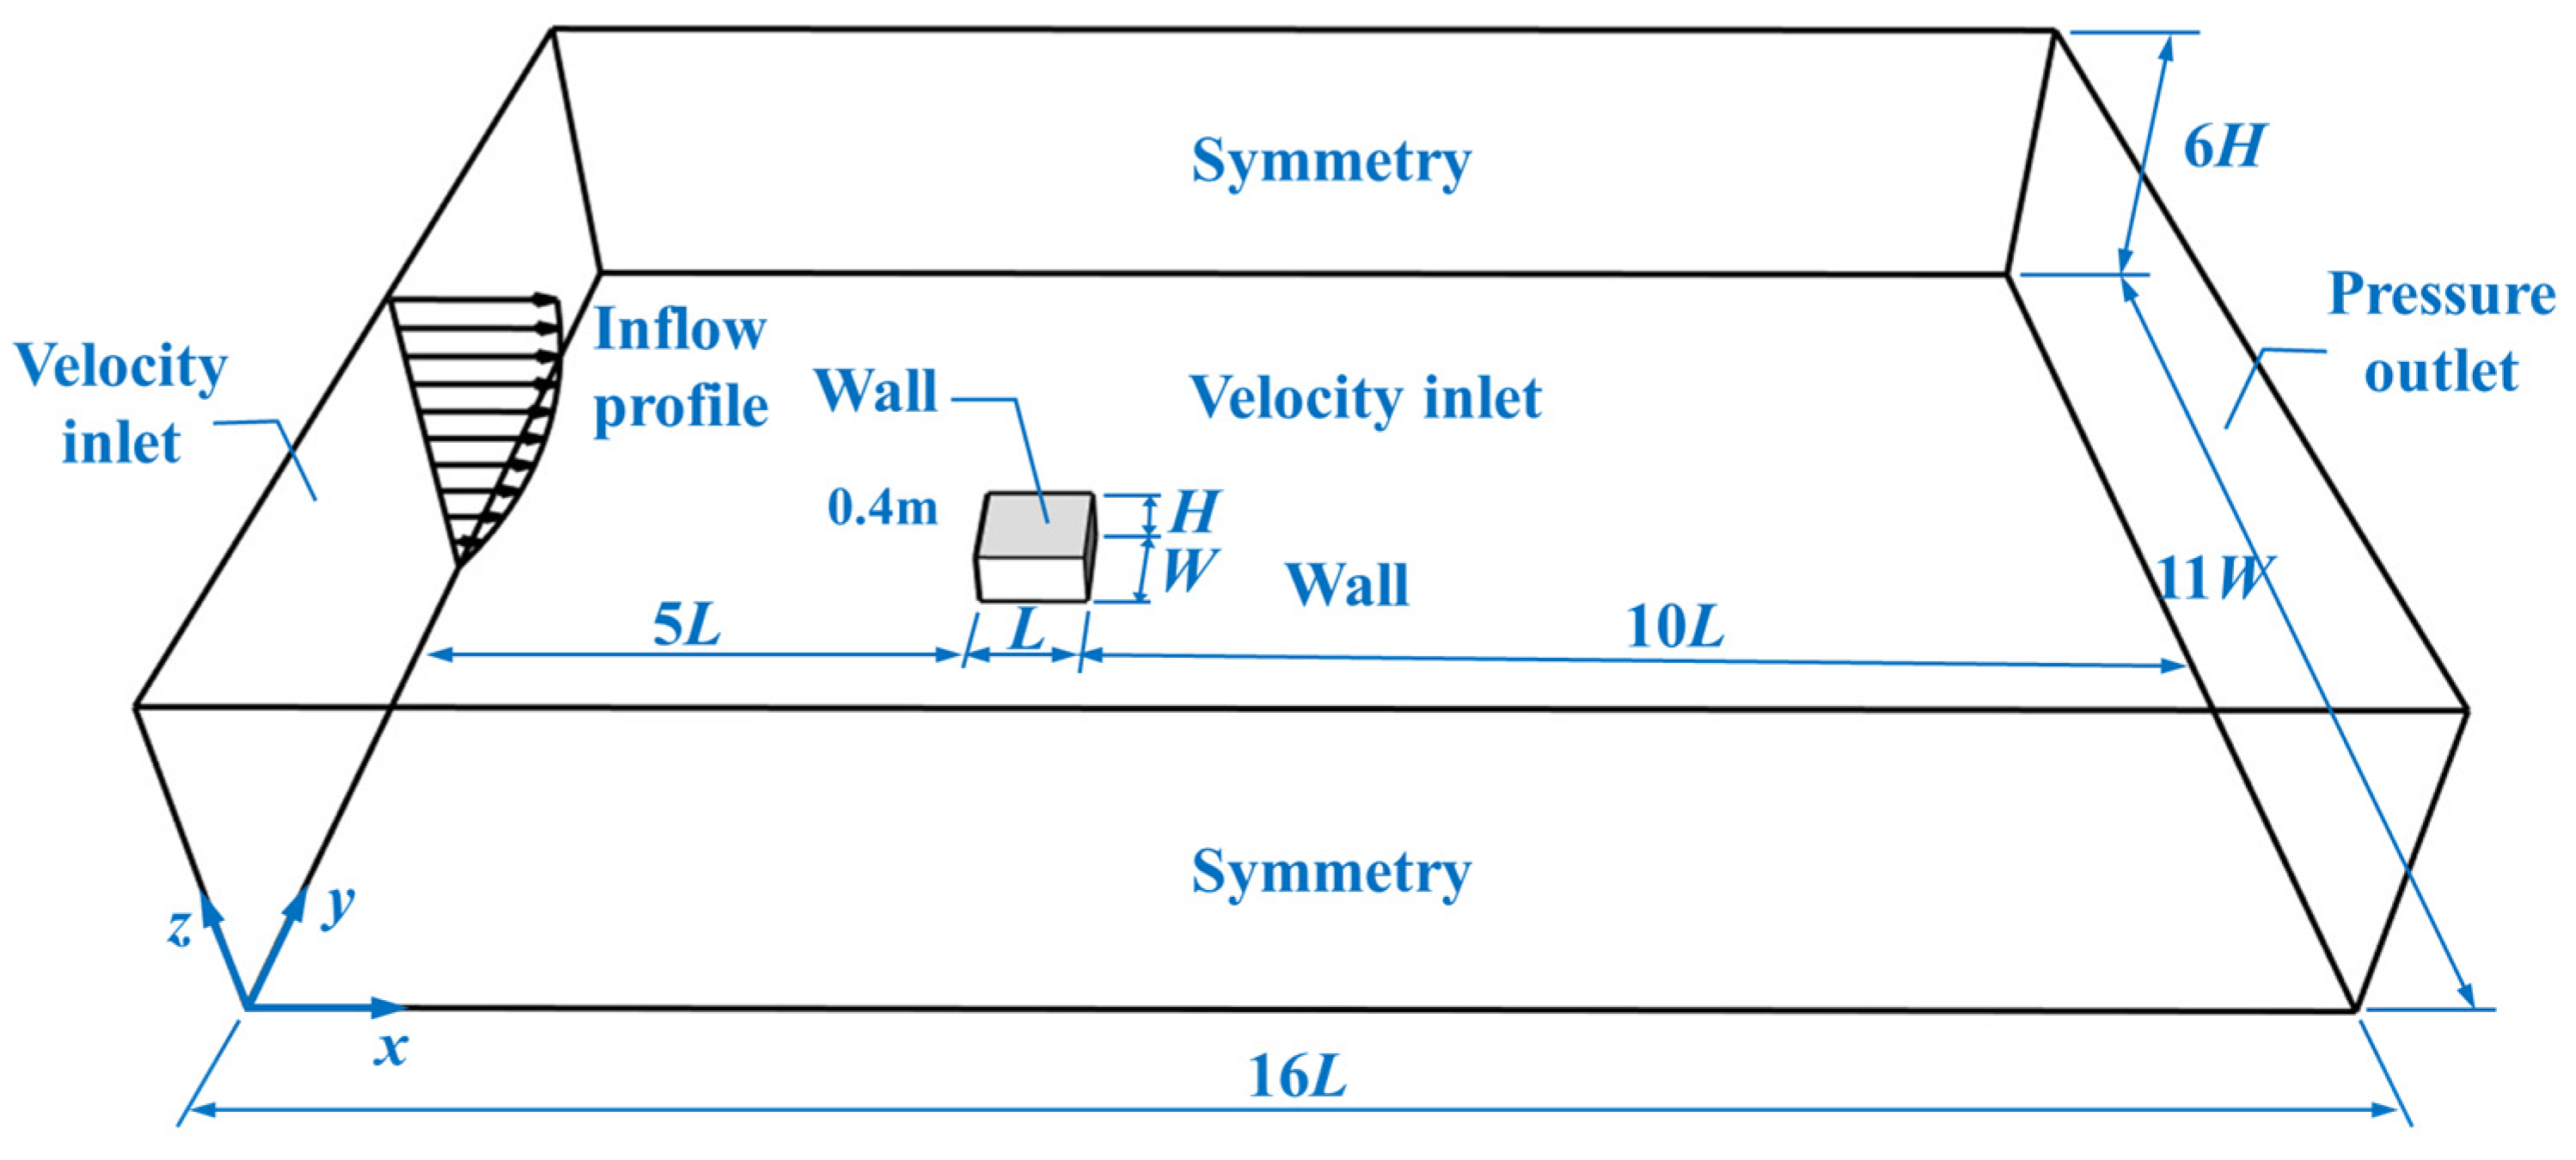
The numerical simulation strictly followed the experimental conditions, with the computational domain’s dimensions and boundary conditions set based on the parameters of the test section (Figure 5). Notably, the inflow boundary was defined as a velocity inlet to simulate the incoming airflow and falling snow, in accordance with the experimental setup (Figure 3). The computational domain was discretized using structured grids. Based on the observed saltating heights of drifting snow, the height of the first grid layer was set to 0.01 m. Before the formal simulation, the grid sensitivity analysis was conducted. Here, three meshing projects with different resolutions were drawn, i.e., the coarse mesh (approximately 630,000 cells), basic mesh (approximately 700,000 cells) and fine mesh (approximately 820,000 cells). Figure 6 illustrates the mesh distribution around the flat-roofed building under different grid refinement levels. The final results show that the snowdrift patterns between the basic and fine mesh cases are basically same. Further grid refinement would not significantly affect the solution accuracy. Therefore, the basic mesh project was finally adopted.
As for the computational settings, the inflow snow concentration corresponded to the experimental snowfall intensity. For the air phase, only the streamwise velocity was retained (1.6 m/s at the eave height). The streamwise velocity of the snow phase was coupled with the air phase, while the vertical settling velocity adopted the experimentally measured value of 0.8 m/s. The inflow profiles of turbulent kinetic energy and turbulent dissipation rate were also configured according to experimental data. The material properties and motion parameters of the particles kept fully consistent with the experiment, as given above. The settling velocity of drifting snow wf was taken as 0.2 m/s [30,41,46]. For turbulence modeling, the Realizable k-ε model was employed, the effectiveness of which in simulating flow around buildings with flat or pitched roofs had been extensively validated in past studies [44,47,48].
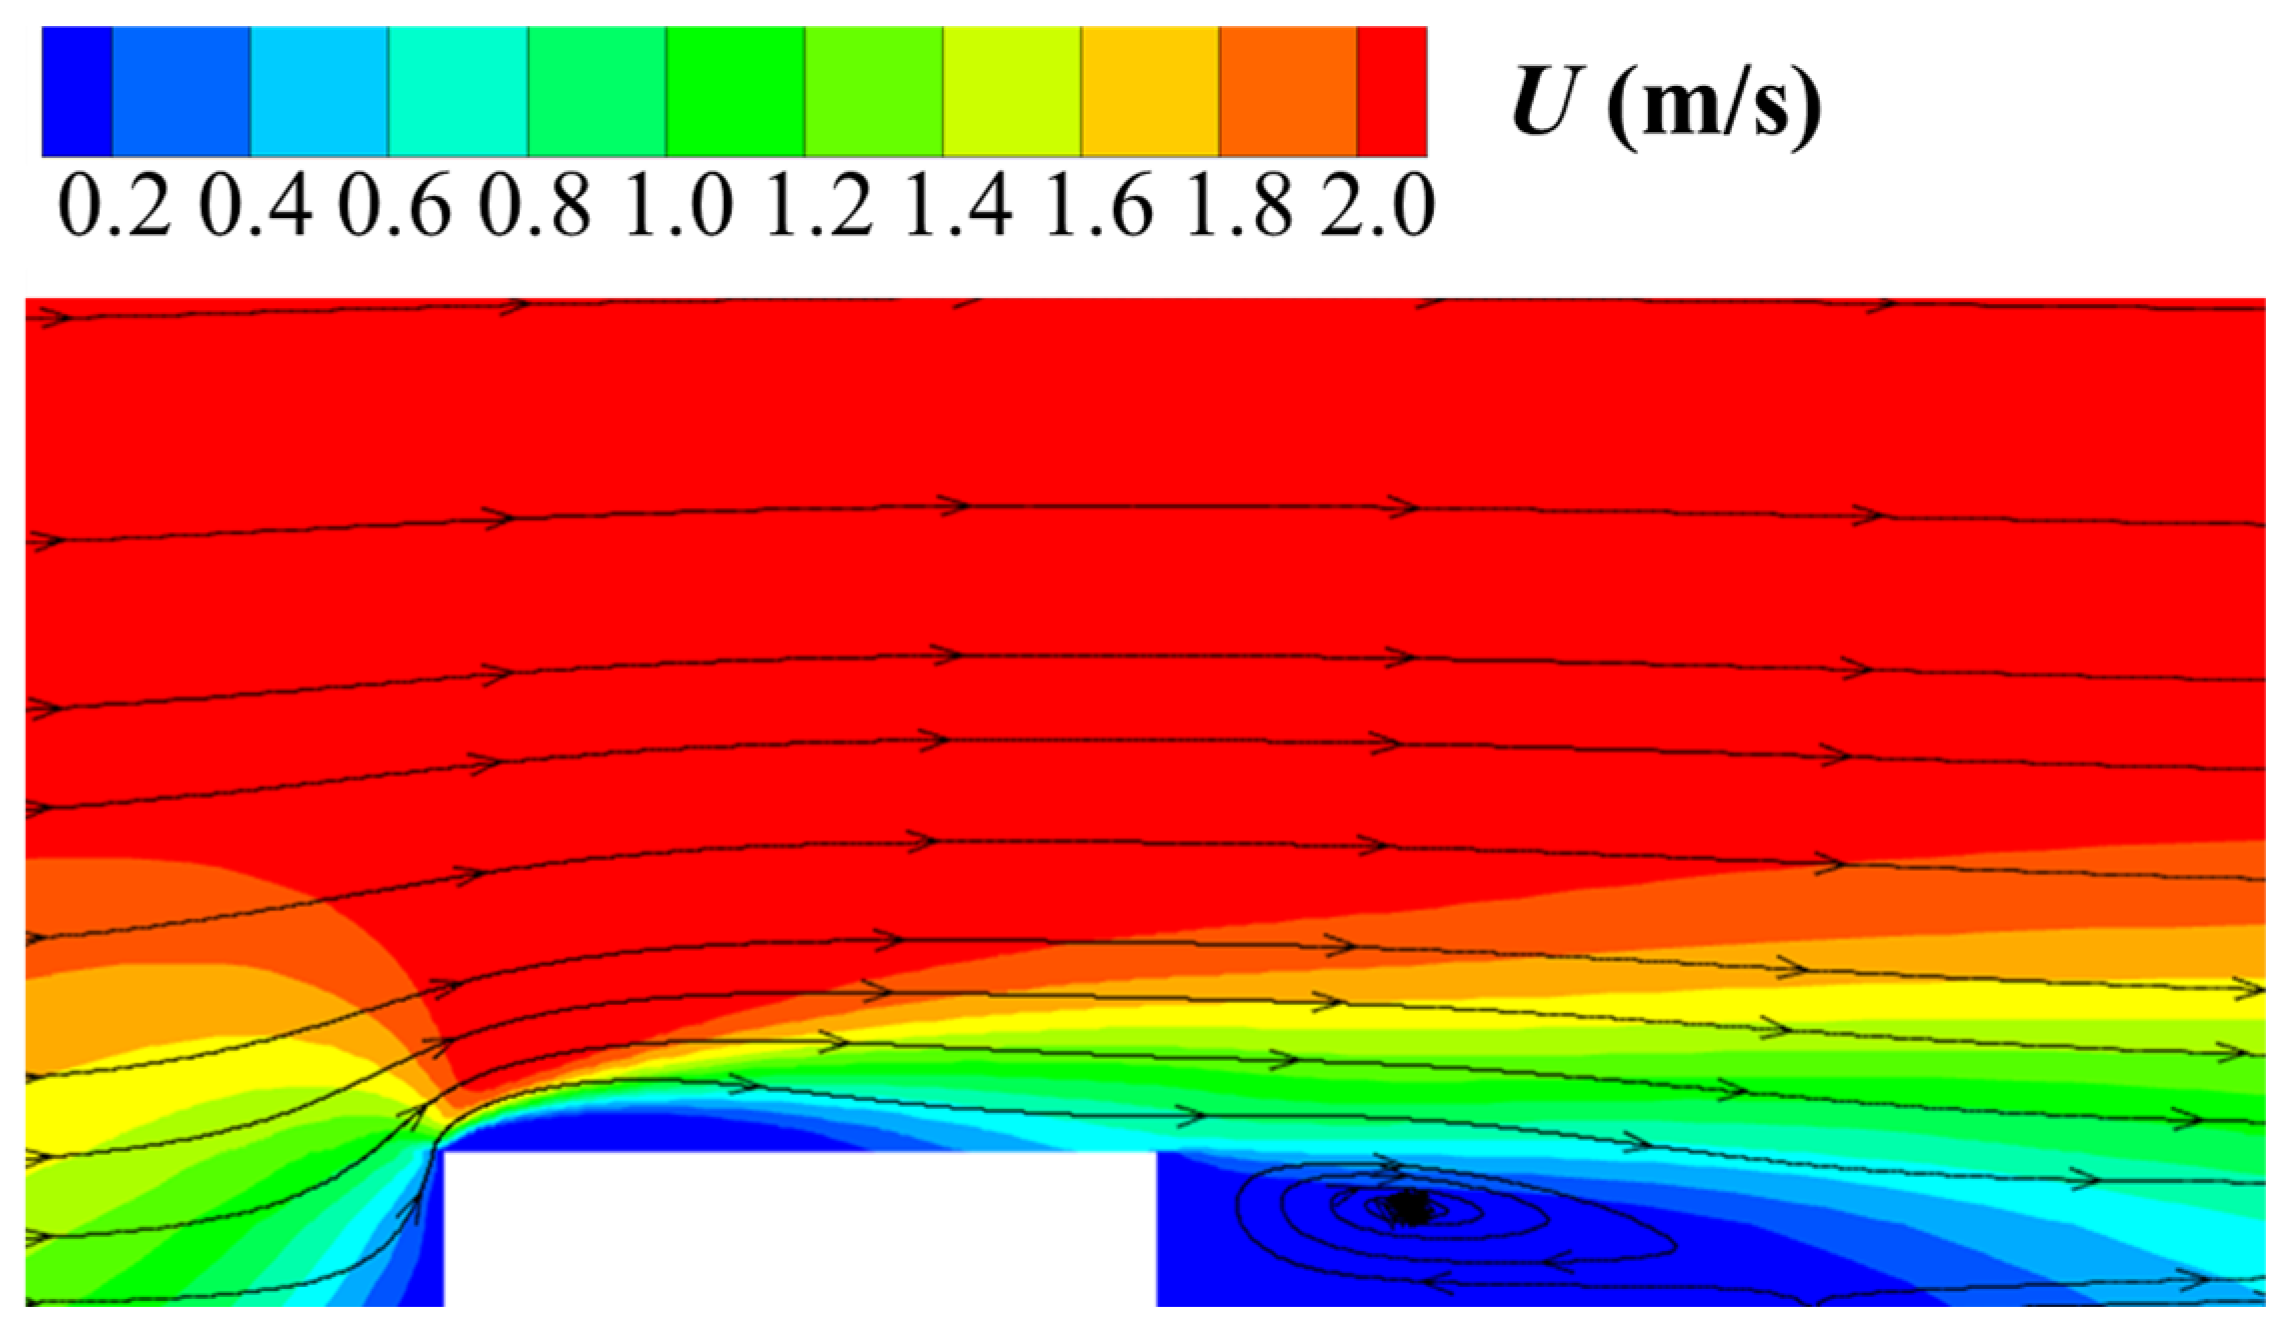
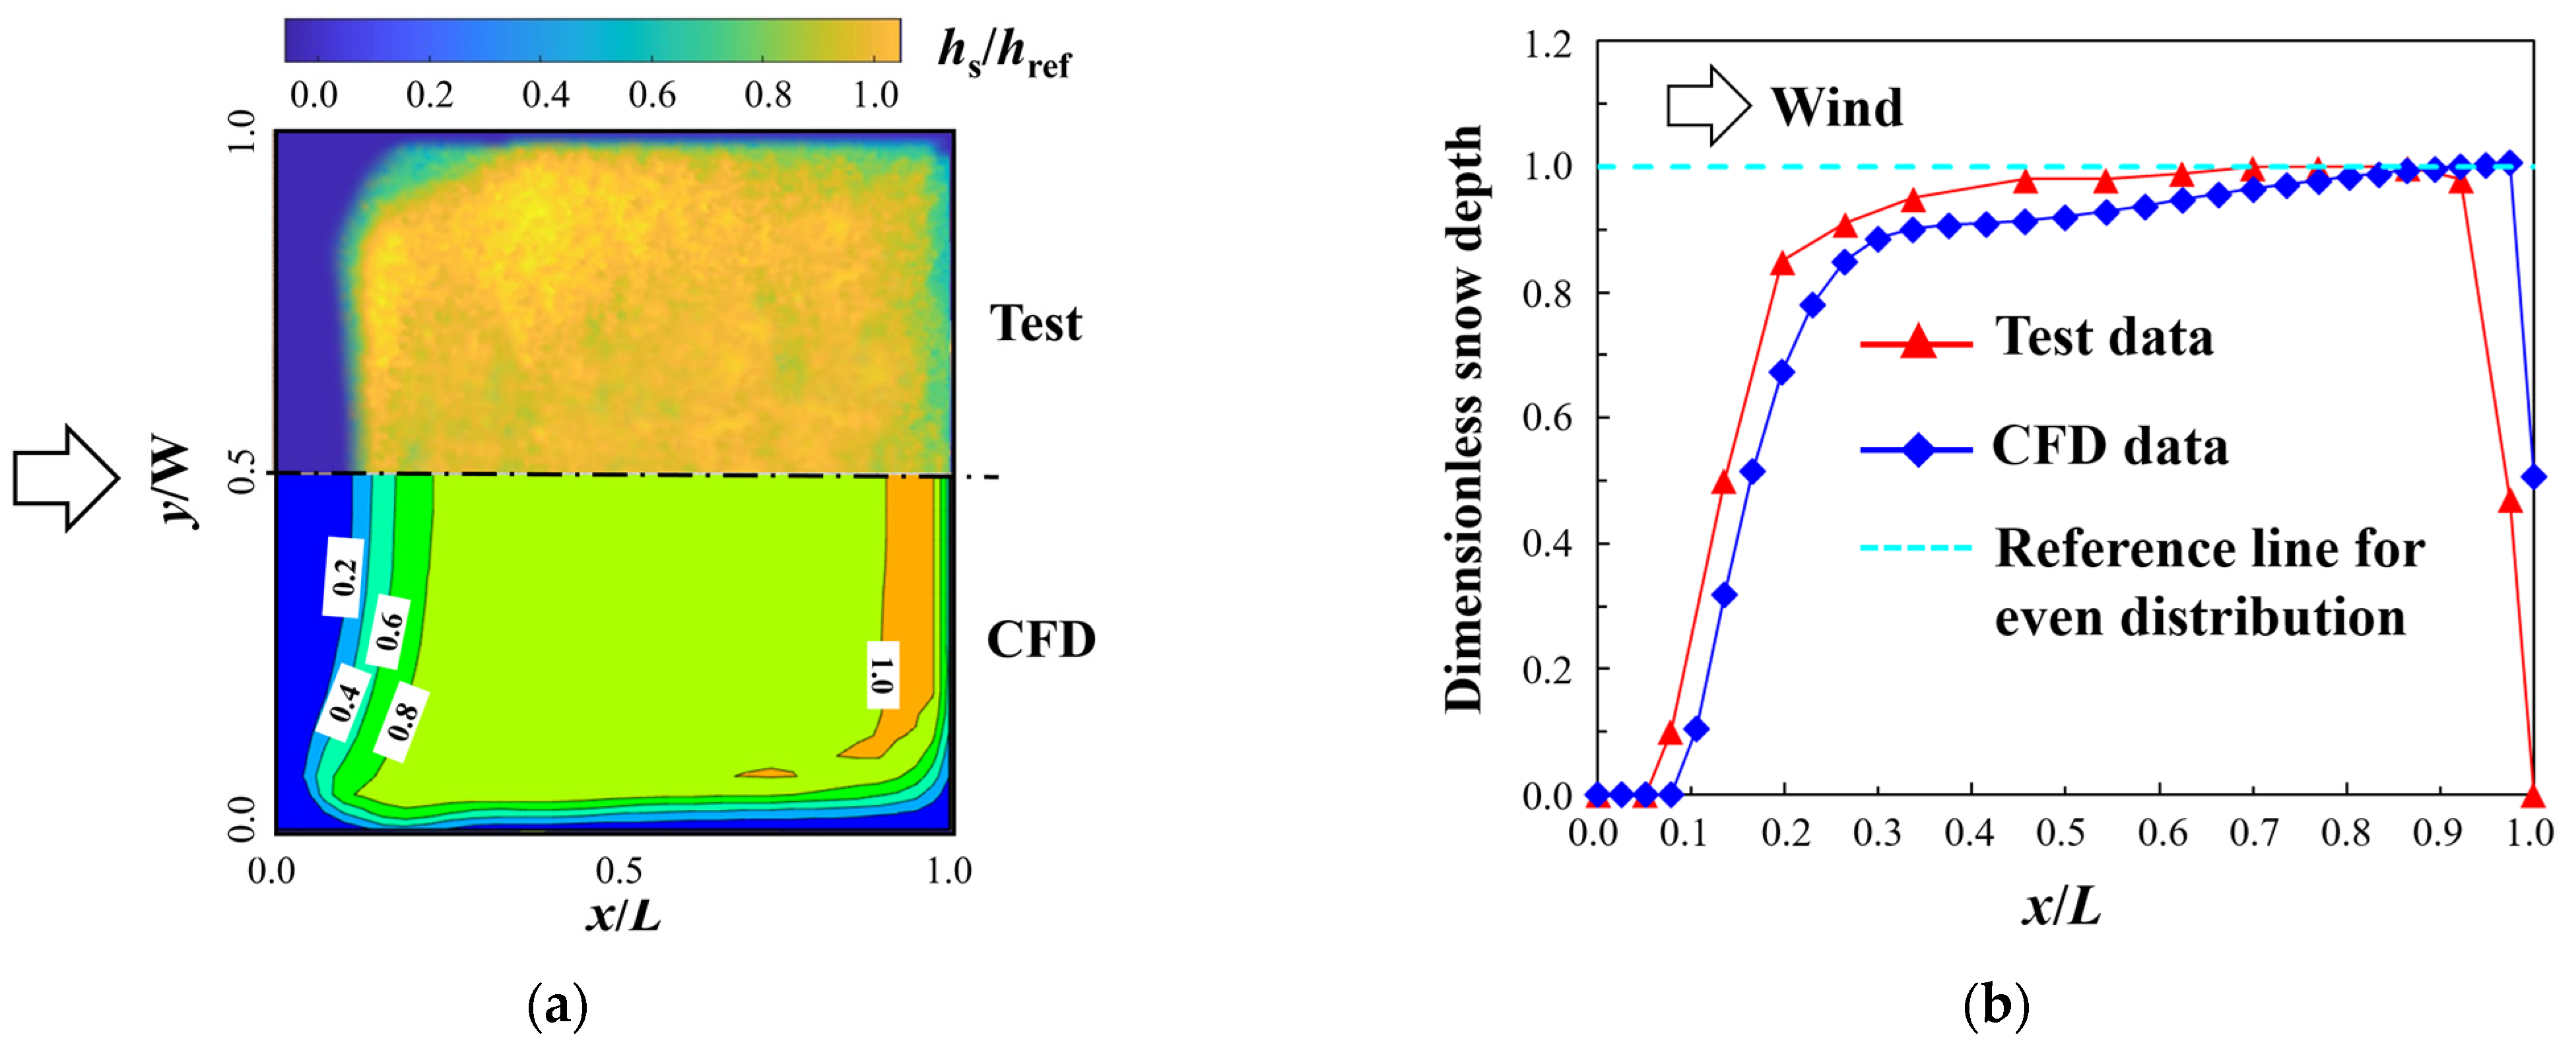
Figure 7 presents the contour of the streamwise wind velocity on the central vertical cross-section of the flat-roofed building. As the airflow passes around the windward surface, part of it moves upward and separates at the windward eave, forming a low-velocity recirculation zone near the eave. As the airflow develops downstream, reattachment occurs on the roof surface, accompanied by a gradual increase in wind speed. The enhanced airflow carries snow particles to drift downstream, leading to gradual accumulation. Figure 8a compares the overall distribution characteristics of dimensionless snow depths derived from test and simulation, where the snow depth hs has been normalized by the reference snow depth on open ground href. Due to the presence of the recirculation zone at the windward eave, drifting snow particles bypass this region and deposit downstream, leading to snow accumulation. In terms of overall distribution characteristics, the snow depth on the roof gradually increases as particles drift downwind, eventually reaching a peak near the downstream eave. The comparison demonstrates good agreement between the simulated snow distribution and experimental results. Figure 8b further provides a detailed comparison of the dimensionless snow depth profiles along the central axis of the roof. The results indicate that the simulated snow depth distribution is in close agreement with the experimental data across most regions, particularly within the stable drift zone (0.25 ≤ x/L ≤ 0.95). The only exception occurs in the transition region between windward erosion and stable accumulation (0.1 ≤ x/L ≤ 0.2), where some discrepancies are observed. In stable zone, the, the maximum relative error in snow depth prediction is only 5.6%, with the average value being 3%. As for the total snowdrift prediction (i.e., the sum of snow accumulation on the entire roof), the relative error between the simulated and experimental values is merely 2%. Overall, the results demonstrate that the simulation method can reliably predict snow accumulation patterns for most regions of the roof.

4. Snowdrifts on Flat Roofs Under Effects of Snow Morphologies

4.1. Analysis Settings of Simulations for Flat Roofs

Based on the confirmed effectiveness of the simulation method for predicting roof snow distribution, the following sections present a systematic investigation into the snowdrift characteristics on typical roofs under snowfall conditions featuring diverse snow crystal morphologies. For this study, two highly representative roof types, i.e., flat roofs and single-pitched roofs, were chosen as the primary subjects. Furthermore, based on field observations carried out in the Harbin region, four typical snow particle morphologies, i.e., spherical, aggregate, rosette, and plate-like, were identified and selected as the focal points of this research, as shown in Figure 1. The corresponding drag coefficients for these crystal forms are provided in Equations (5)–(9), respectively. To prevent interference from other particle parameters (e.g., size, density), all particles of different shapes were assumed to share the identical material properties, except for the drag coefficients.
This section initially examines the accumulation characteristics of various particle morphologies on basic flat roofs. The flat-roofed buildings used in this study had a width (W) of 10 m and an eave height (H) of 5 m, with streamwise spans (L) set at 10 m, 20 m, and 30 m, respectively. The computational domain was constructed with dimensions of 16L (x) × 11W (y) × 6H (z). Specific dimensions and boundary conditions are detailed in Figure 9. To simulate the actual snowfall process, the inflow and upper boundaries were configured as velocity inlets to ensure that the falling snow could uniformly cover the entire computational domain [30]. The outflow boundary was designated as a pressure outlet. The lateral boundaries were set as symmetric, and both the ground and model surfaces were treated as no-slip wall boundaries. The domain employed a structured meshing approach, with the first layer grid height set at 0.01 m (y+ is around 150). The inflow wind profile adhered to an exponential distribution with a roughness index of 0.15 [45], and the wind speed at the eave height UH was fixed at 4 m/s. The roughness length on snow surface z0 was set at 3 × 10⁻⁵ m [46]. The inflow snow volume fraction αin was based on measured data from Harbin, taken as 1.3 × 10⁻⁵ [30]. The physical parameters of all snow particles were referenced from the research by Zhang et al. [30], with a snow particle density ρs of 250 kg/m3, a particle diameter ds of 0.5 mm, a threshold friction velocity u*t of 0.2 m/s, and a saltation particle settling velocity wf of 0.2 m/s.

4.2. Snowdrift Characteristics on Flat Roofs

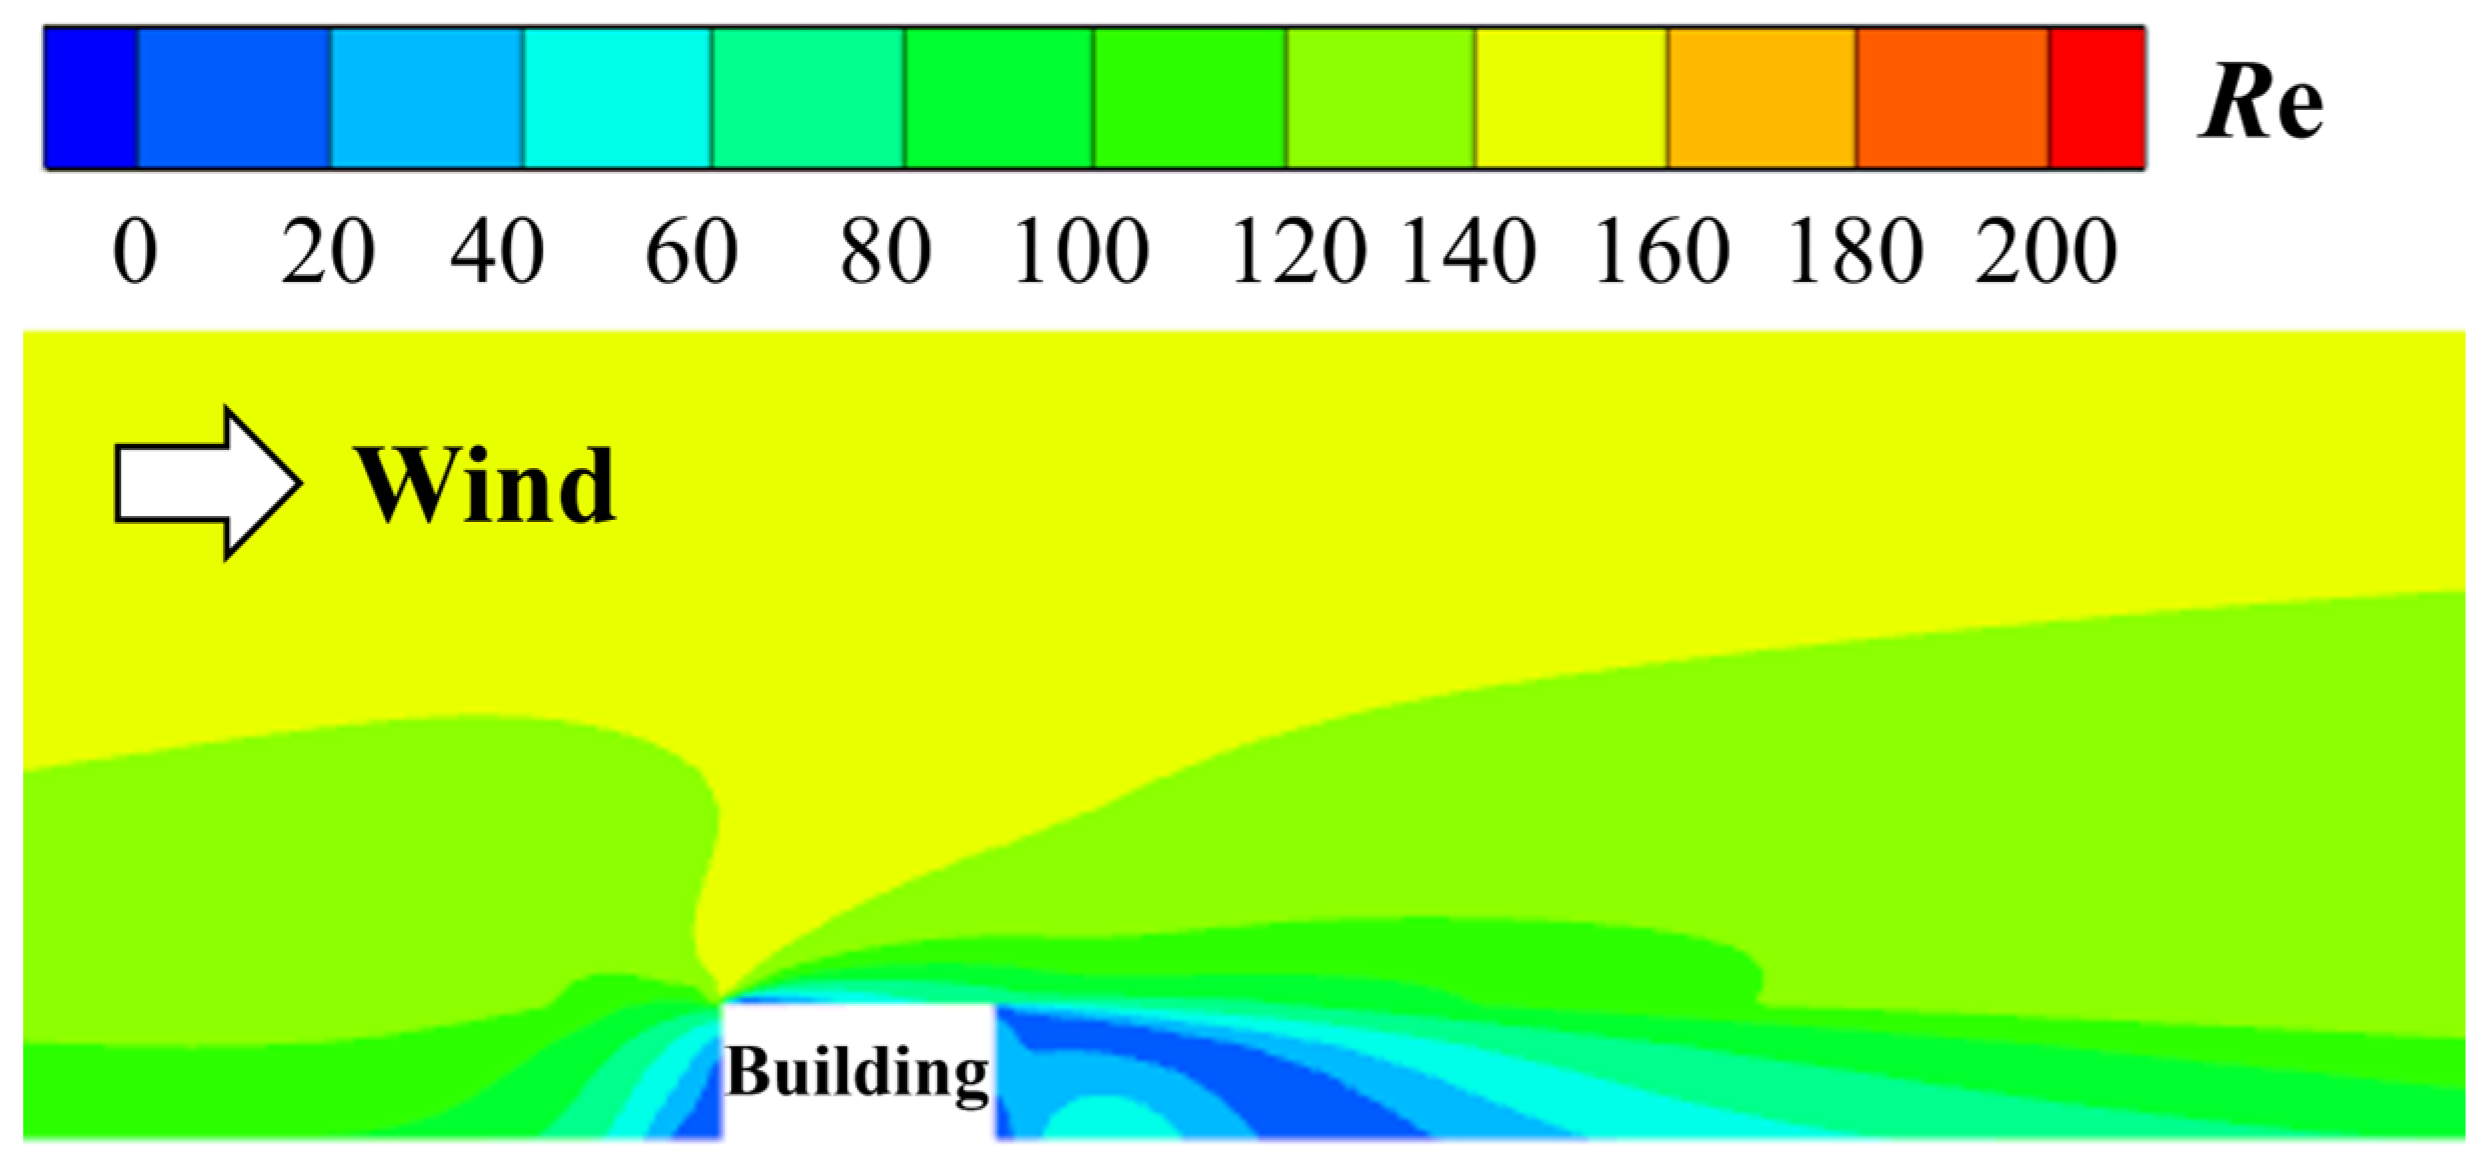
Given the similarity in snow accumulation patterns observed on flat roofs of varying spans, the simulation results for the 10 m-span flat roof were chosen as representative cases for mechanistic analysis. Since the drag coefficients of snow particles with different morphologies are influenced by the Reynolds number, Figure 10 initially illustrates the spatial distribution characteristics of the Reynolds number Re on the central vertical cross-section of the flat-roofed building. The definition of the Reynolds number is shown in Equation (6). Generally, the Reynolds numbers around the building mostly fall within the subcritical range. Specifically, the Reynolds number above open ground shows a clear vertical gradient, decreasing from approximately 160 in the upper regions to about 100 near the ground, due to the gradient inflow wind profile. Near the building, the physical obstruction effect leads to significant flow deceleration, reducing local Reynolds numbers below 60 and creating a notable low-Reynolds-number zone.
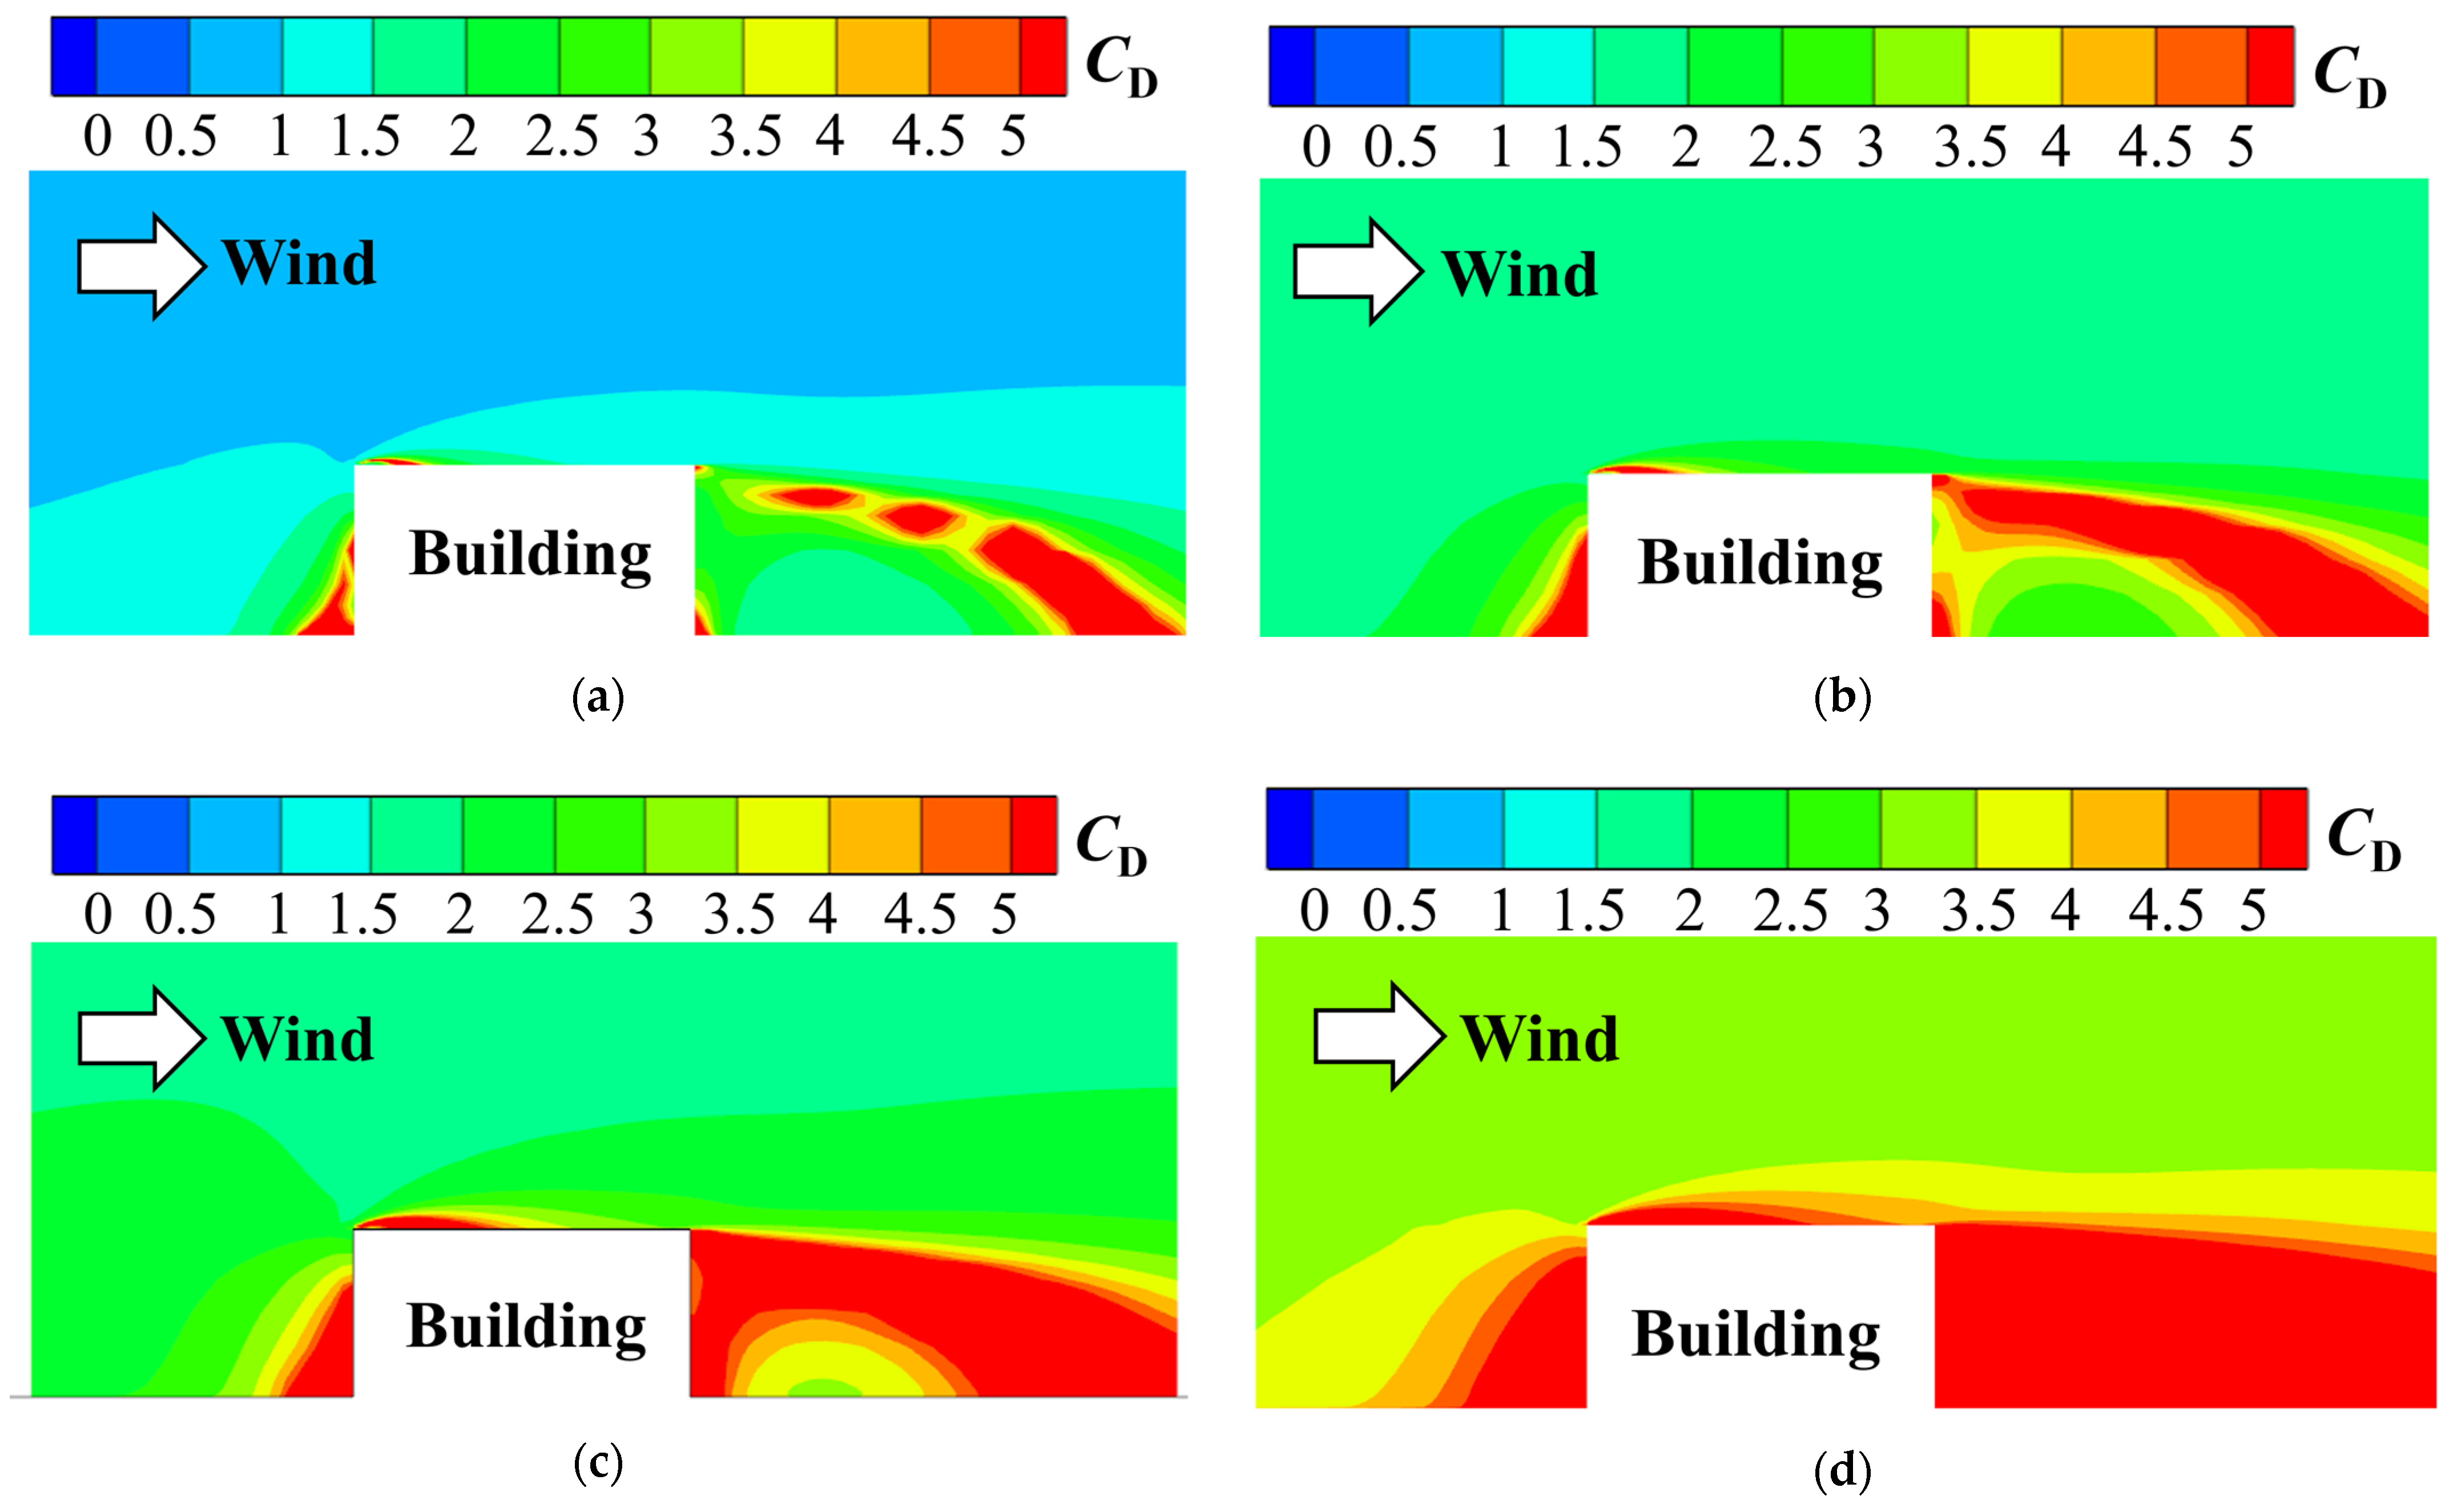
Based on the spatial distribution of Reynolds numbers in Figure 10 and empirical formulas of drag coefficient illustrated in Equations (5)–(9), Figure 11 presents the distributions of drag coefficients CD for various snow particle morphologies on the central vertical cross-section. In contrast to the distribution pattern of Reynolds numbers, the drag coefficients of falling snow particles exhibit a sharp increase in the low-Reynolds-number regions around the building. Within the same region, the drag coefficients of different snow particle types follow an ascending order, i.e., spherical, rosette-shaped, aggregate and plate-like.
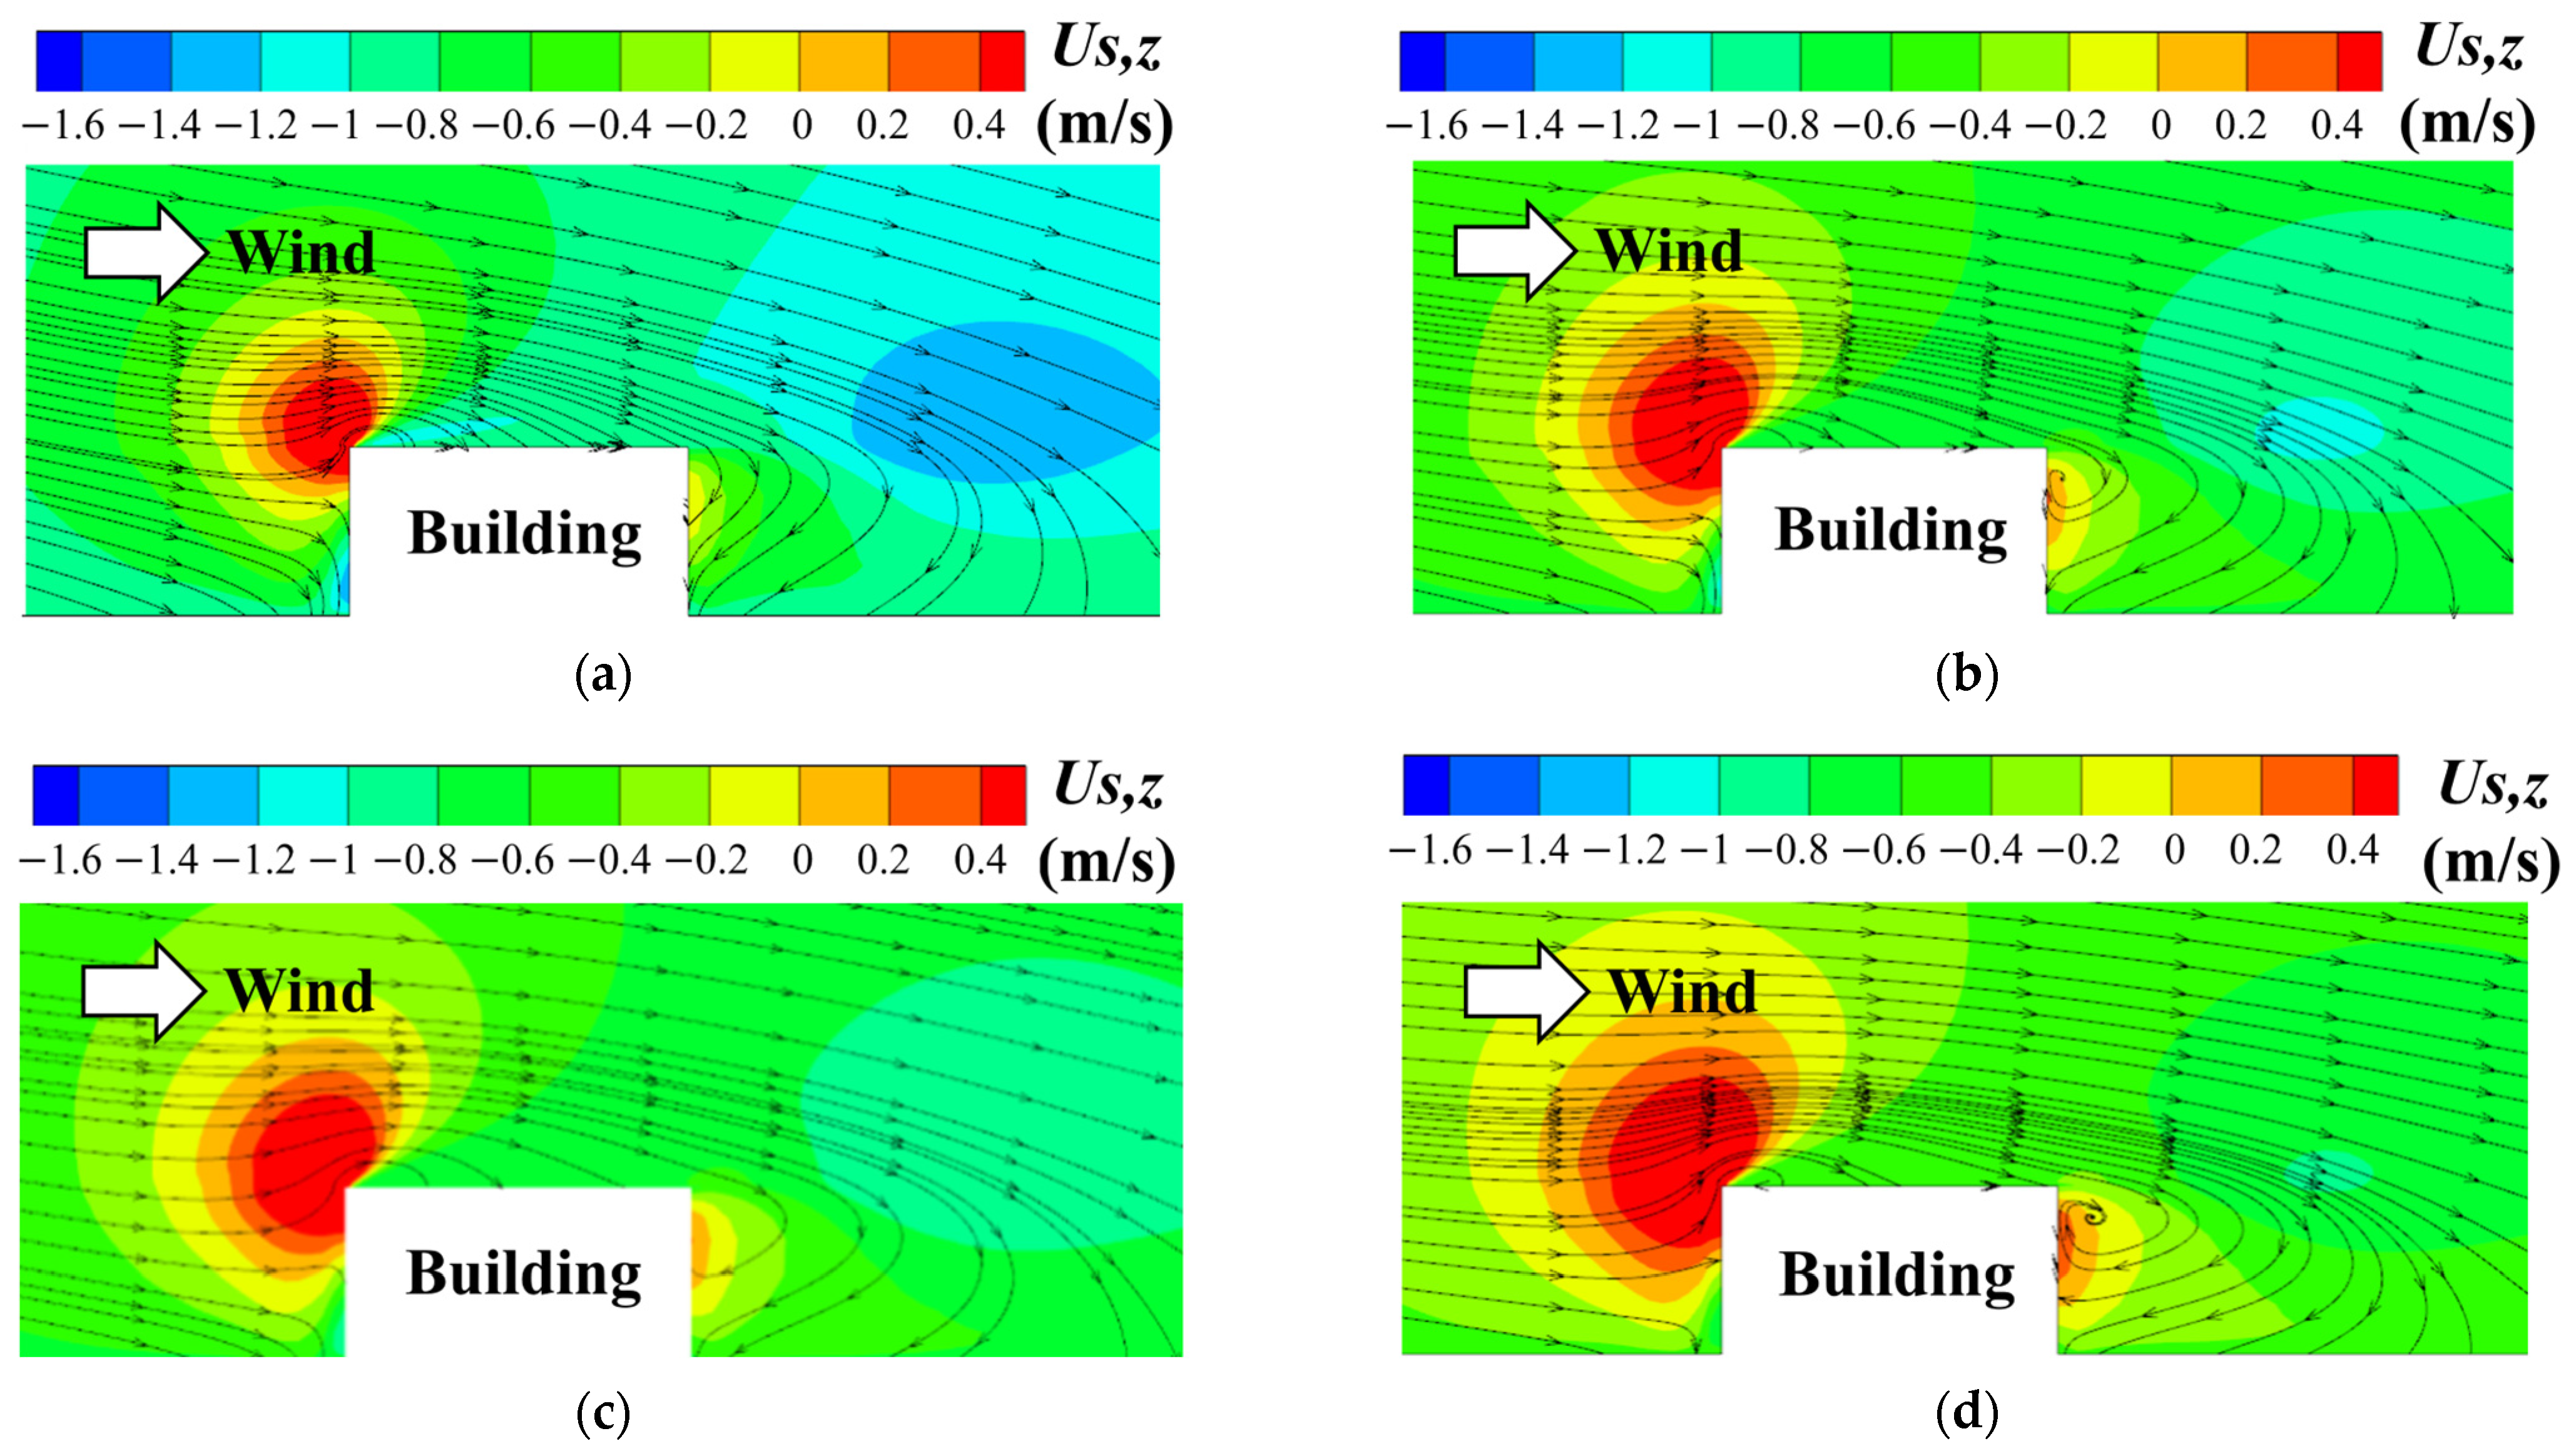
The drag coefficients of snow particles with different morphologies significantly influence their motion velocities. Given the direct impact of drag variation on particle’s settling velocities, Figure 12 presents a comparative analysis of the vertical velocity distributions for differently shaped snow particles Us,z at the central vertical cross-section. Here, the upward velocity was defined as positive and downward as negative. The results demonstrate that snow particles follow an obliquely downward trajectory under the combined effects of aerodynamic drag and gravity. However, in the region around the windward eave, particles experience a brief upward movement due to flow separation before eventually settling onto the mid-roof and downstream roof areas with the reattaching airflow. During free-falling, snow particle motion is governed by the combined effects of gravity, buoyancy, and aerodynamic drag. As gravitational and buoyant forces remain relatively constant, aerodynamic drag emerges as the dominant factor. Higher drag coefficients enable particles to achieve dynamic equilibrium between drag and the resultant of gravity/buoyancy at lower settling velocities. Therefore, plate-shaped particles, possessing the highest drag coefficients, exhibit the slowest settling velocities. In contrast, spherical particles with the lowest drag coefficient achieve significantly higher settling velocities, markedly exceeding those of other morphologies.
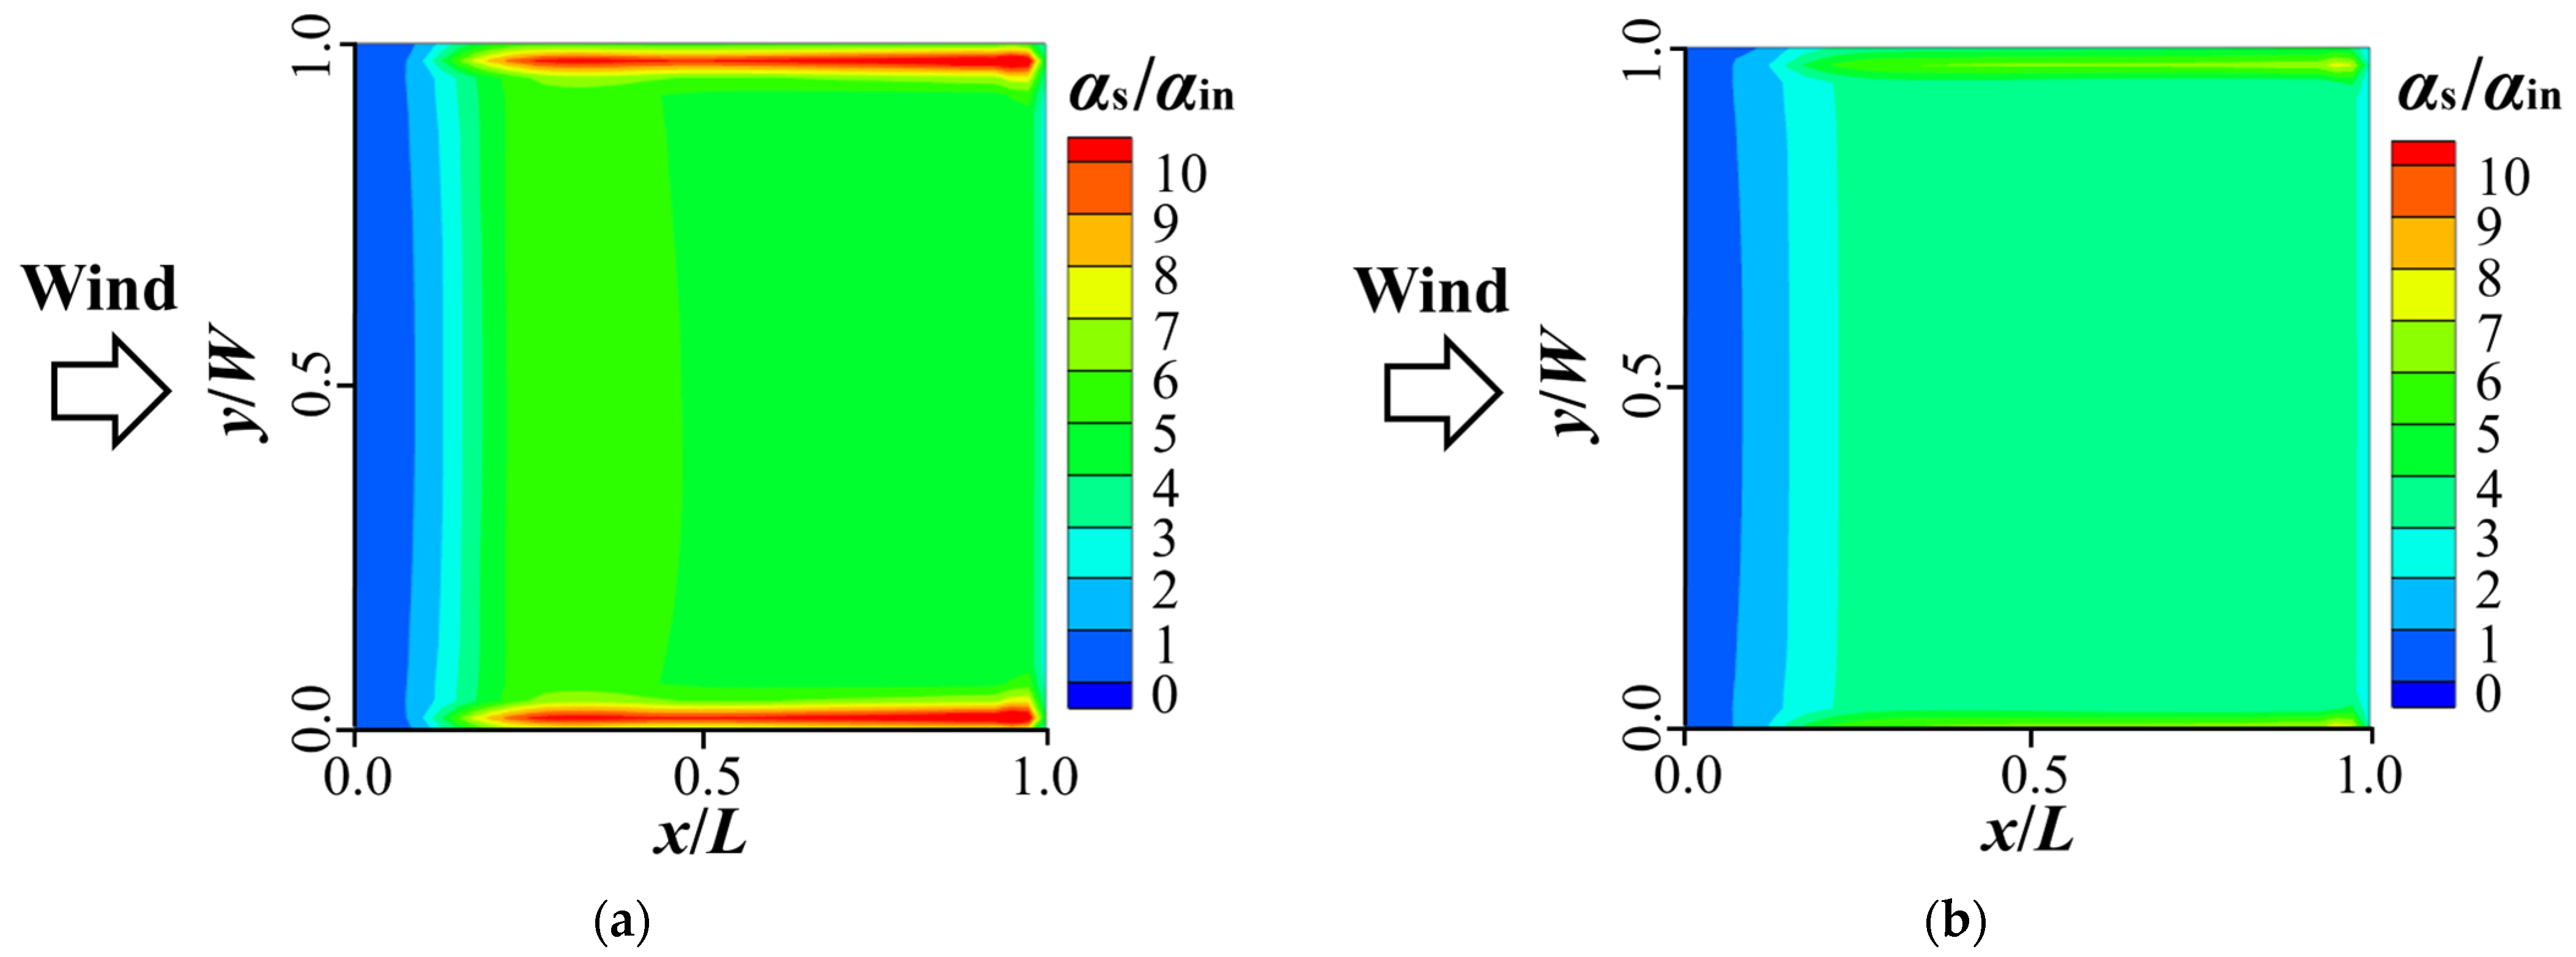
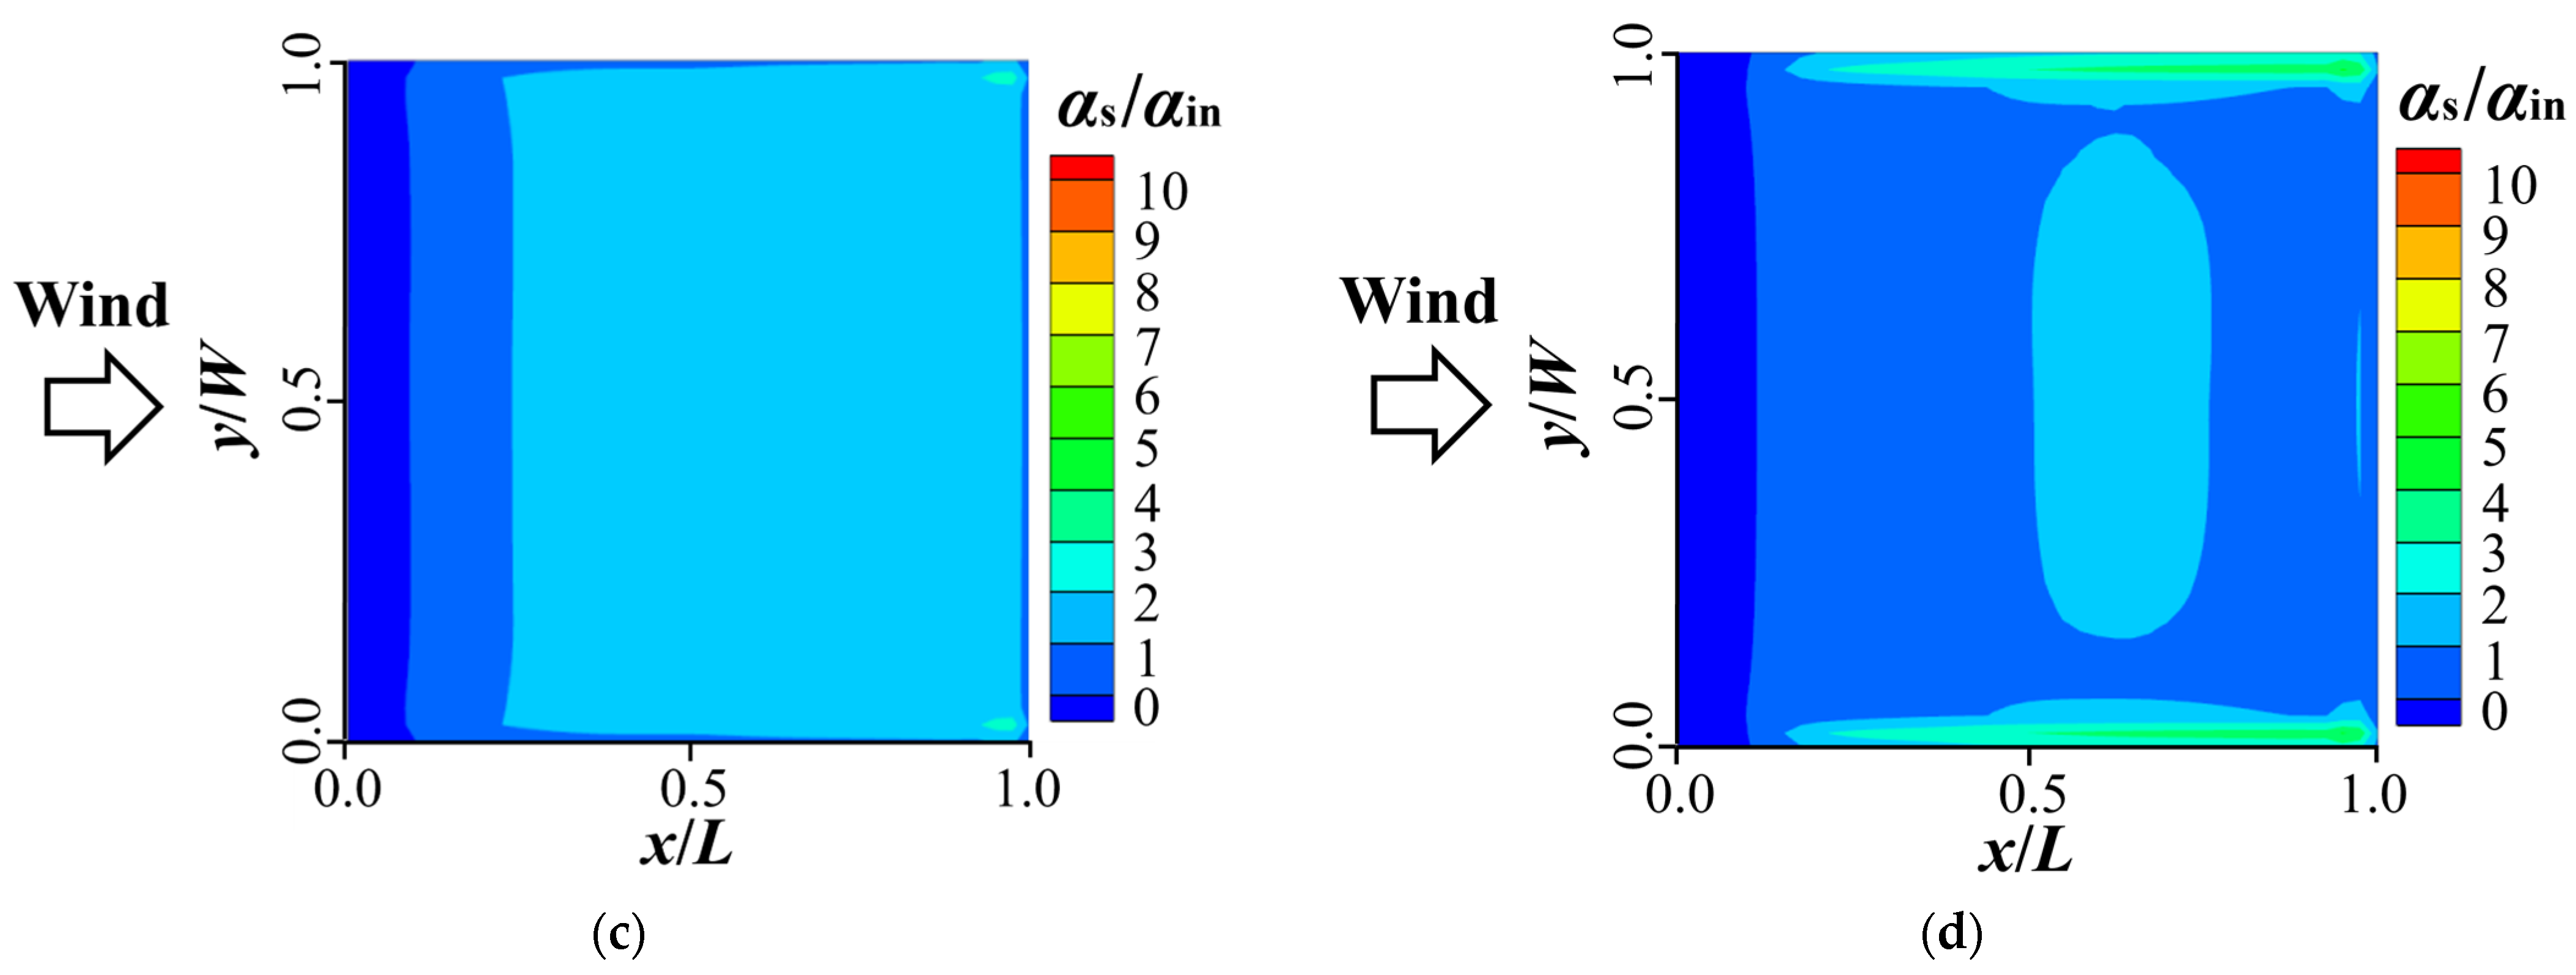
Figure 13 illustrates the distribution characteristics of dimensionless snow volume fraction αs/αin near the flat roof with various snow morphologies. The snow volume fraction αs is normalized by the inflow value at the inlet boundary αin. Affected by the uplift effect caused by airflow separation at the windward eave, a substantial number of snow particles bypass the windward edge of the roof, leading to their accumulation in the middle and downstream regions. Notably, a larger drag coefficient enhances the airflow’s ability to lift snow particles, causing the low-concentration zone near the windward eaves to extend downstream and forming a local concentration peak in the airflow reattachment area. Given that a smaller drag coefficient corresponds to a higher particle settling velocity, the snow deposition flux on the roof surface would be greater under the same inflow snow concentration condition. Consequently, as the drag coefficient of snow particles increases, the overall snow concentration on the roof exhibits a significant declining trend.
Figure 14 presents the contours of dimensionless snow depths hs/href for snow particles of various morphologies on the flat roof. The snow depths hs are normalized against the snow depth measured on open ground href. As the erosive impact exerted by the airflow on the flat roof has not yet attained the critical threshold in most areas, the eroded snow depth hs,ero would be zero (Equation (20)), and the snow distribution across the roof is predominantly governed by the snow deposition process. Notably, the deposition distribution characteristics of snow particles with varying morphologies demonstrate a strong alignment with the snow concentration distribution patterns. Specifically, the snow depth initiates at zero in the windward separation zone, progressively increases along the direction of the airflow, and reaches its maximum in the airflow reattachment area. Generally, as the drag coefficient of snow particles increases, the total snow depth formed by various types of snow particles on the roof shows a noticeable decreasing trend.
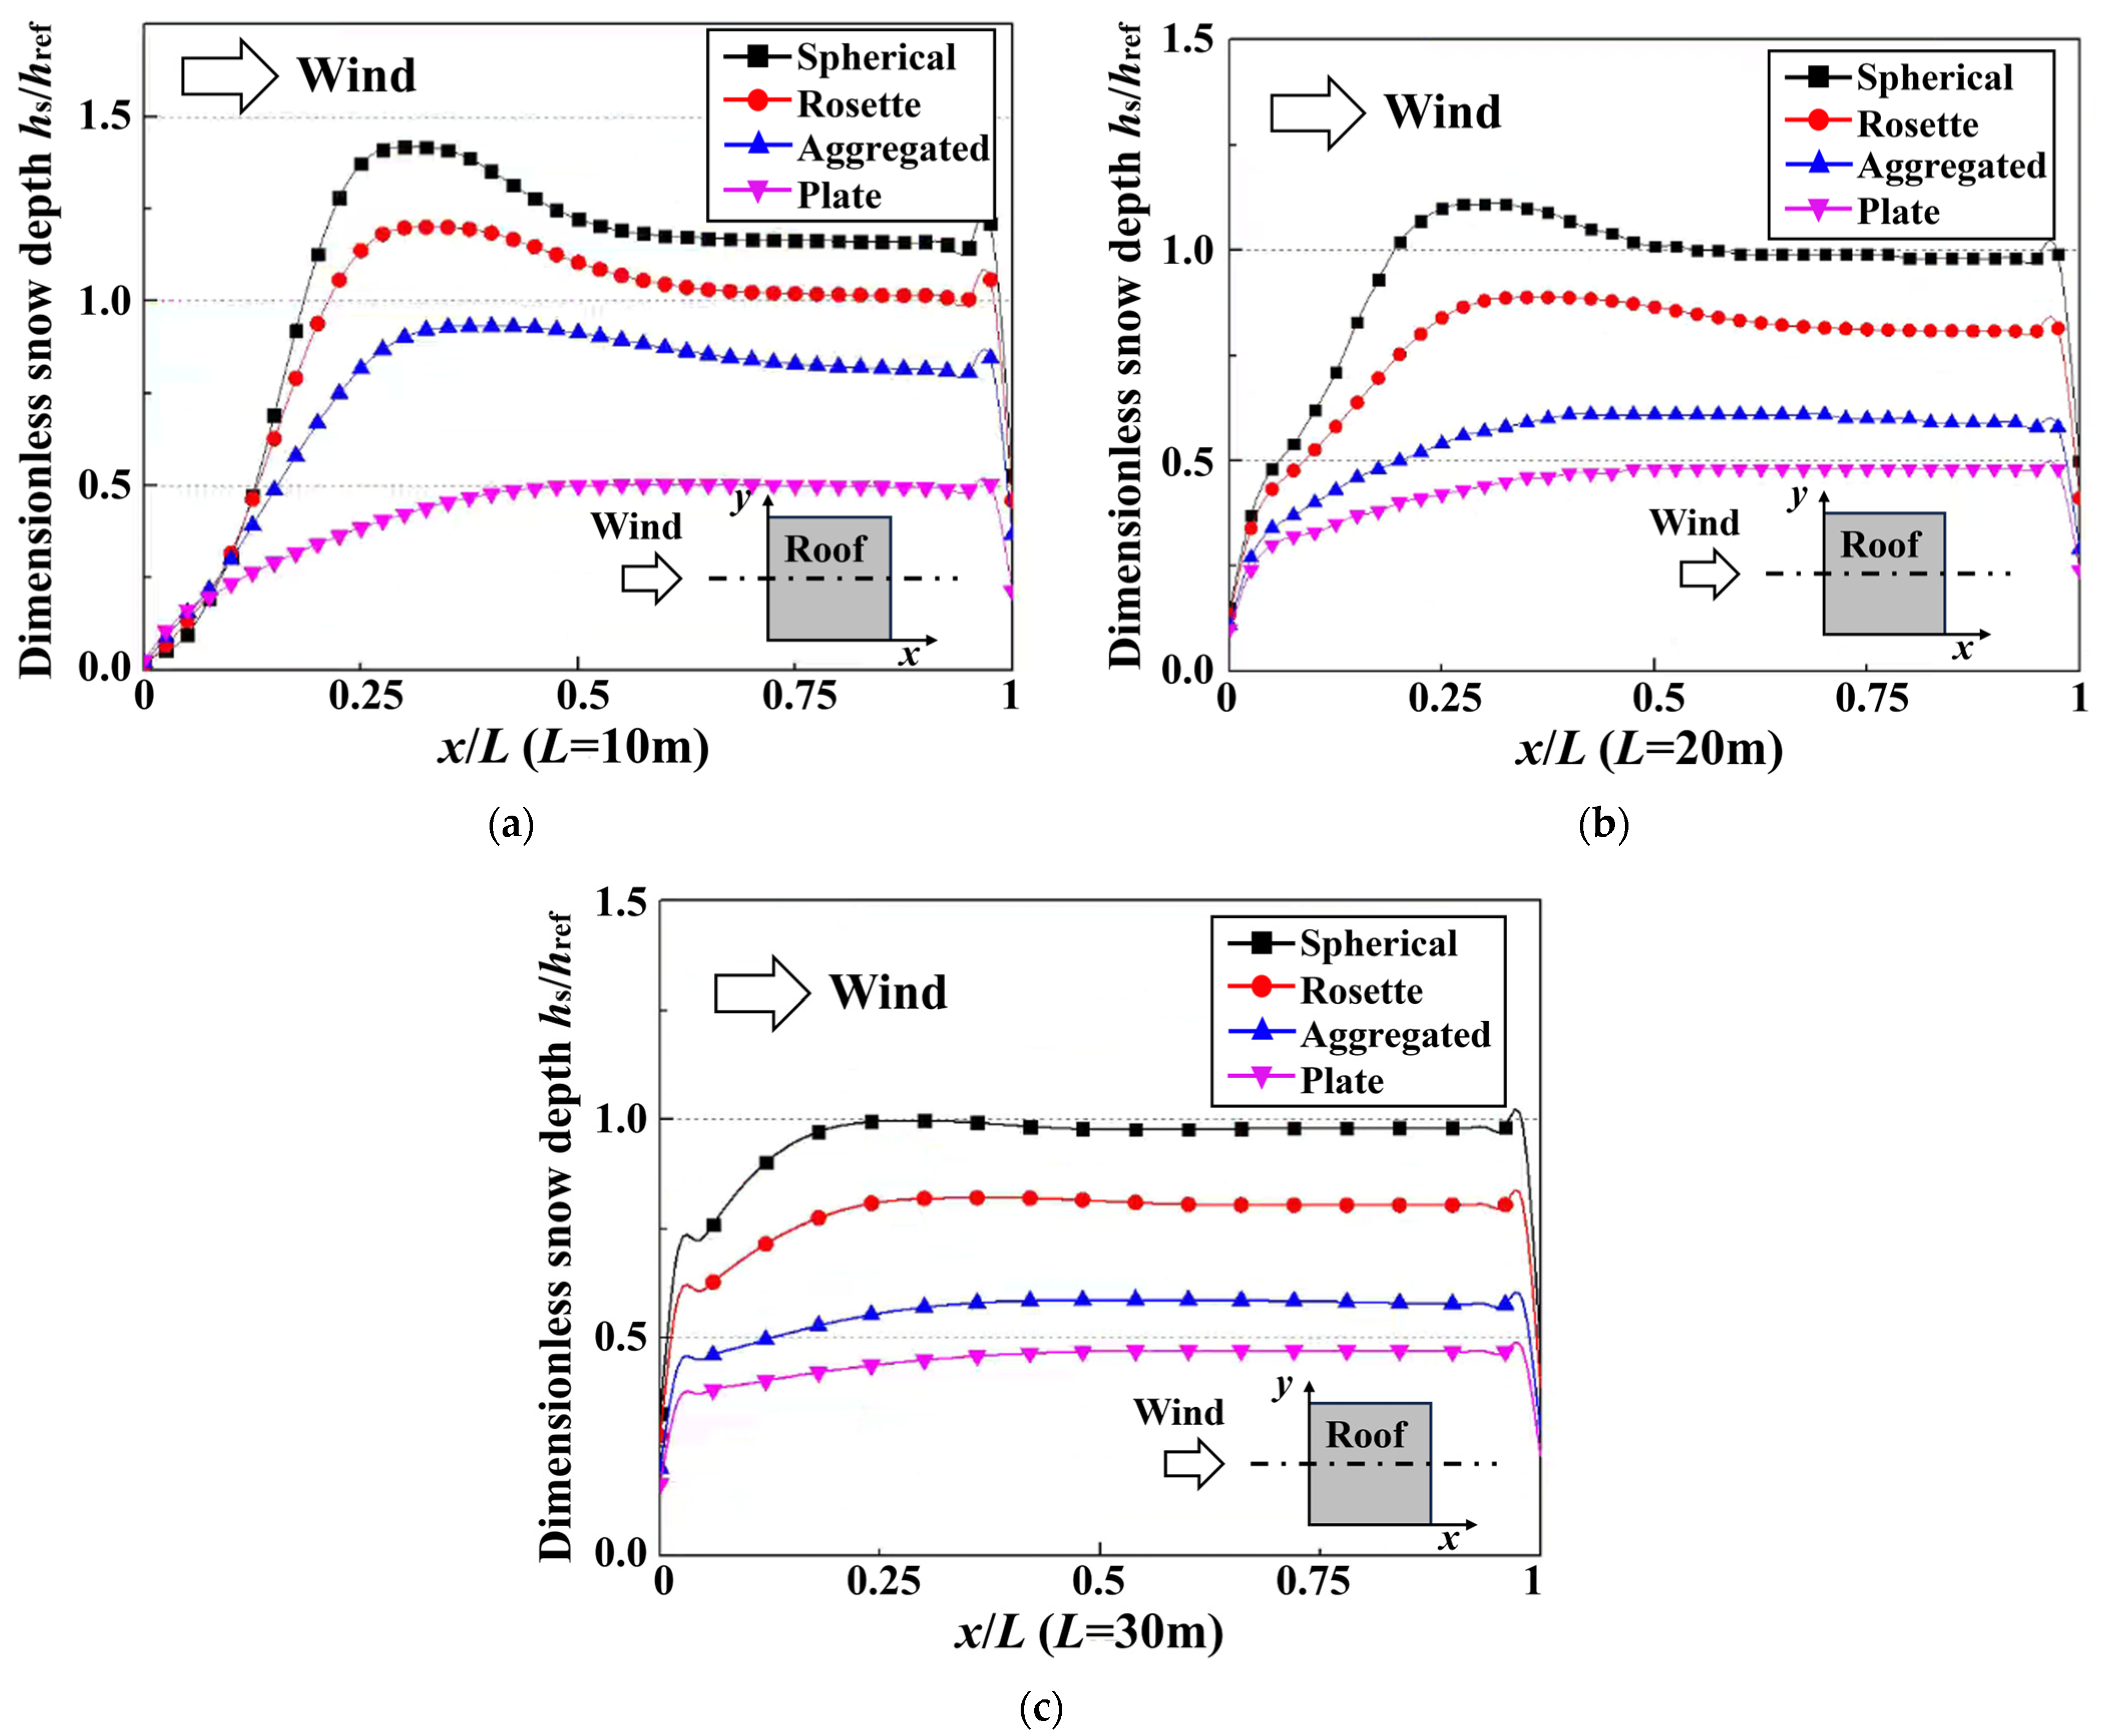
Figure 15 compares the snow depth profiles on flat roofs of different spans after the accumulations of four types of snow particles. Although the snow distribution patterns remain consistent across roofs of various spans, the influence of particle shape on the snow depth exhibits significant differences. Specifically, the spherical snow particles with the smallest drag coefficient exhibit the greatest accumulation depth after deposition, and their distribution shows more pronounced unevenness. In contrast, plate-like particles have an accumulation depth that is merely 1/3 to 1/2 of that of spherical particles. In terms of the impact of span, the snow depth demonstrates a decreasing trend with an increasing roof span, accompanied by a notable improvement in snow accumulation uniformity. Among the four snow particle morphologies, plate-like snow particles with a relatively larger drag coefficient are minimally affected by changes in span. Conversely, spherical particles with the smallest drag coefficient are most sensitive to span variations, with a more pronounced decline in the snow depths as the span increases.

5. Snowdrifts on Single-Pitched Roofs Under Effects of Snow Morphologies

5.1. Analysis Settings of Simulations for Single-Pitched Roofs

In various national load codes [49,50,51], the distribution characteristics of snow loads for roofs with different shapes are predominantly determined based on the distribution coefficients of single-pitched roofs. Therefore, an in-depth study on the snow accumulation patterns of single-pitched roofs is of substantial reference value for the systematic analysis of snow load characteristics across various sloped roof types. In this section, a typical single-pitched roof was selected as the object, with geometric parameters set as follows: a streamwise span L of 10 m, a cross-wind width W of 10 m, and an eave height H of 5 m. To comprehensively examine the influence of roof slope on snow distribution characteristics, three common slopes, i.e., 20°, 25°, and 30°, were specifically chosen for comparative analysis. In the simulations, the wind direction was set to blow from the lower eave side toward the upward slope of the single-pitched roof. The inflow wind velocity at the height of the lower eave UH was also set to 4 m/s, as this speed has been shown to produce more pronounced uneven snow deposition patterns [48,52]. The other simulation parameters remain consistent with those in the aforementioned studies.

5.2. Snowdrift Characteristics on Single-Pitched Roofs

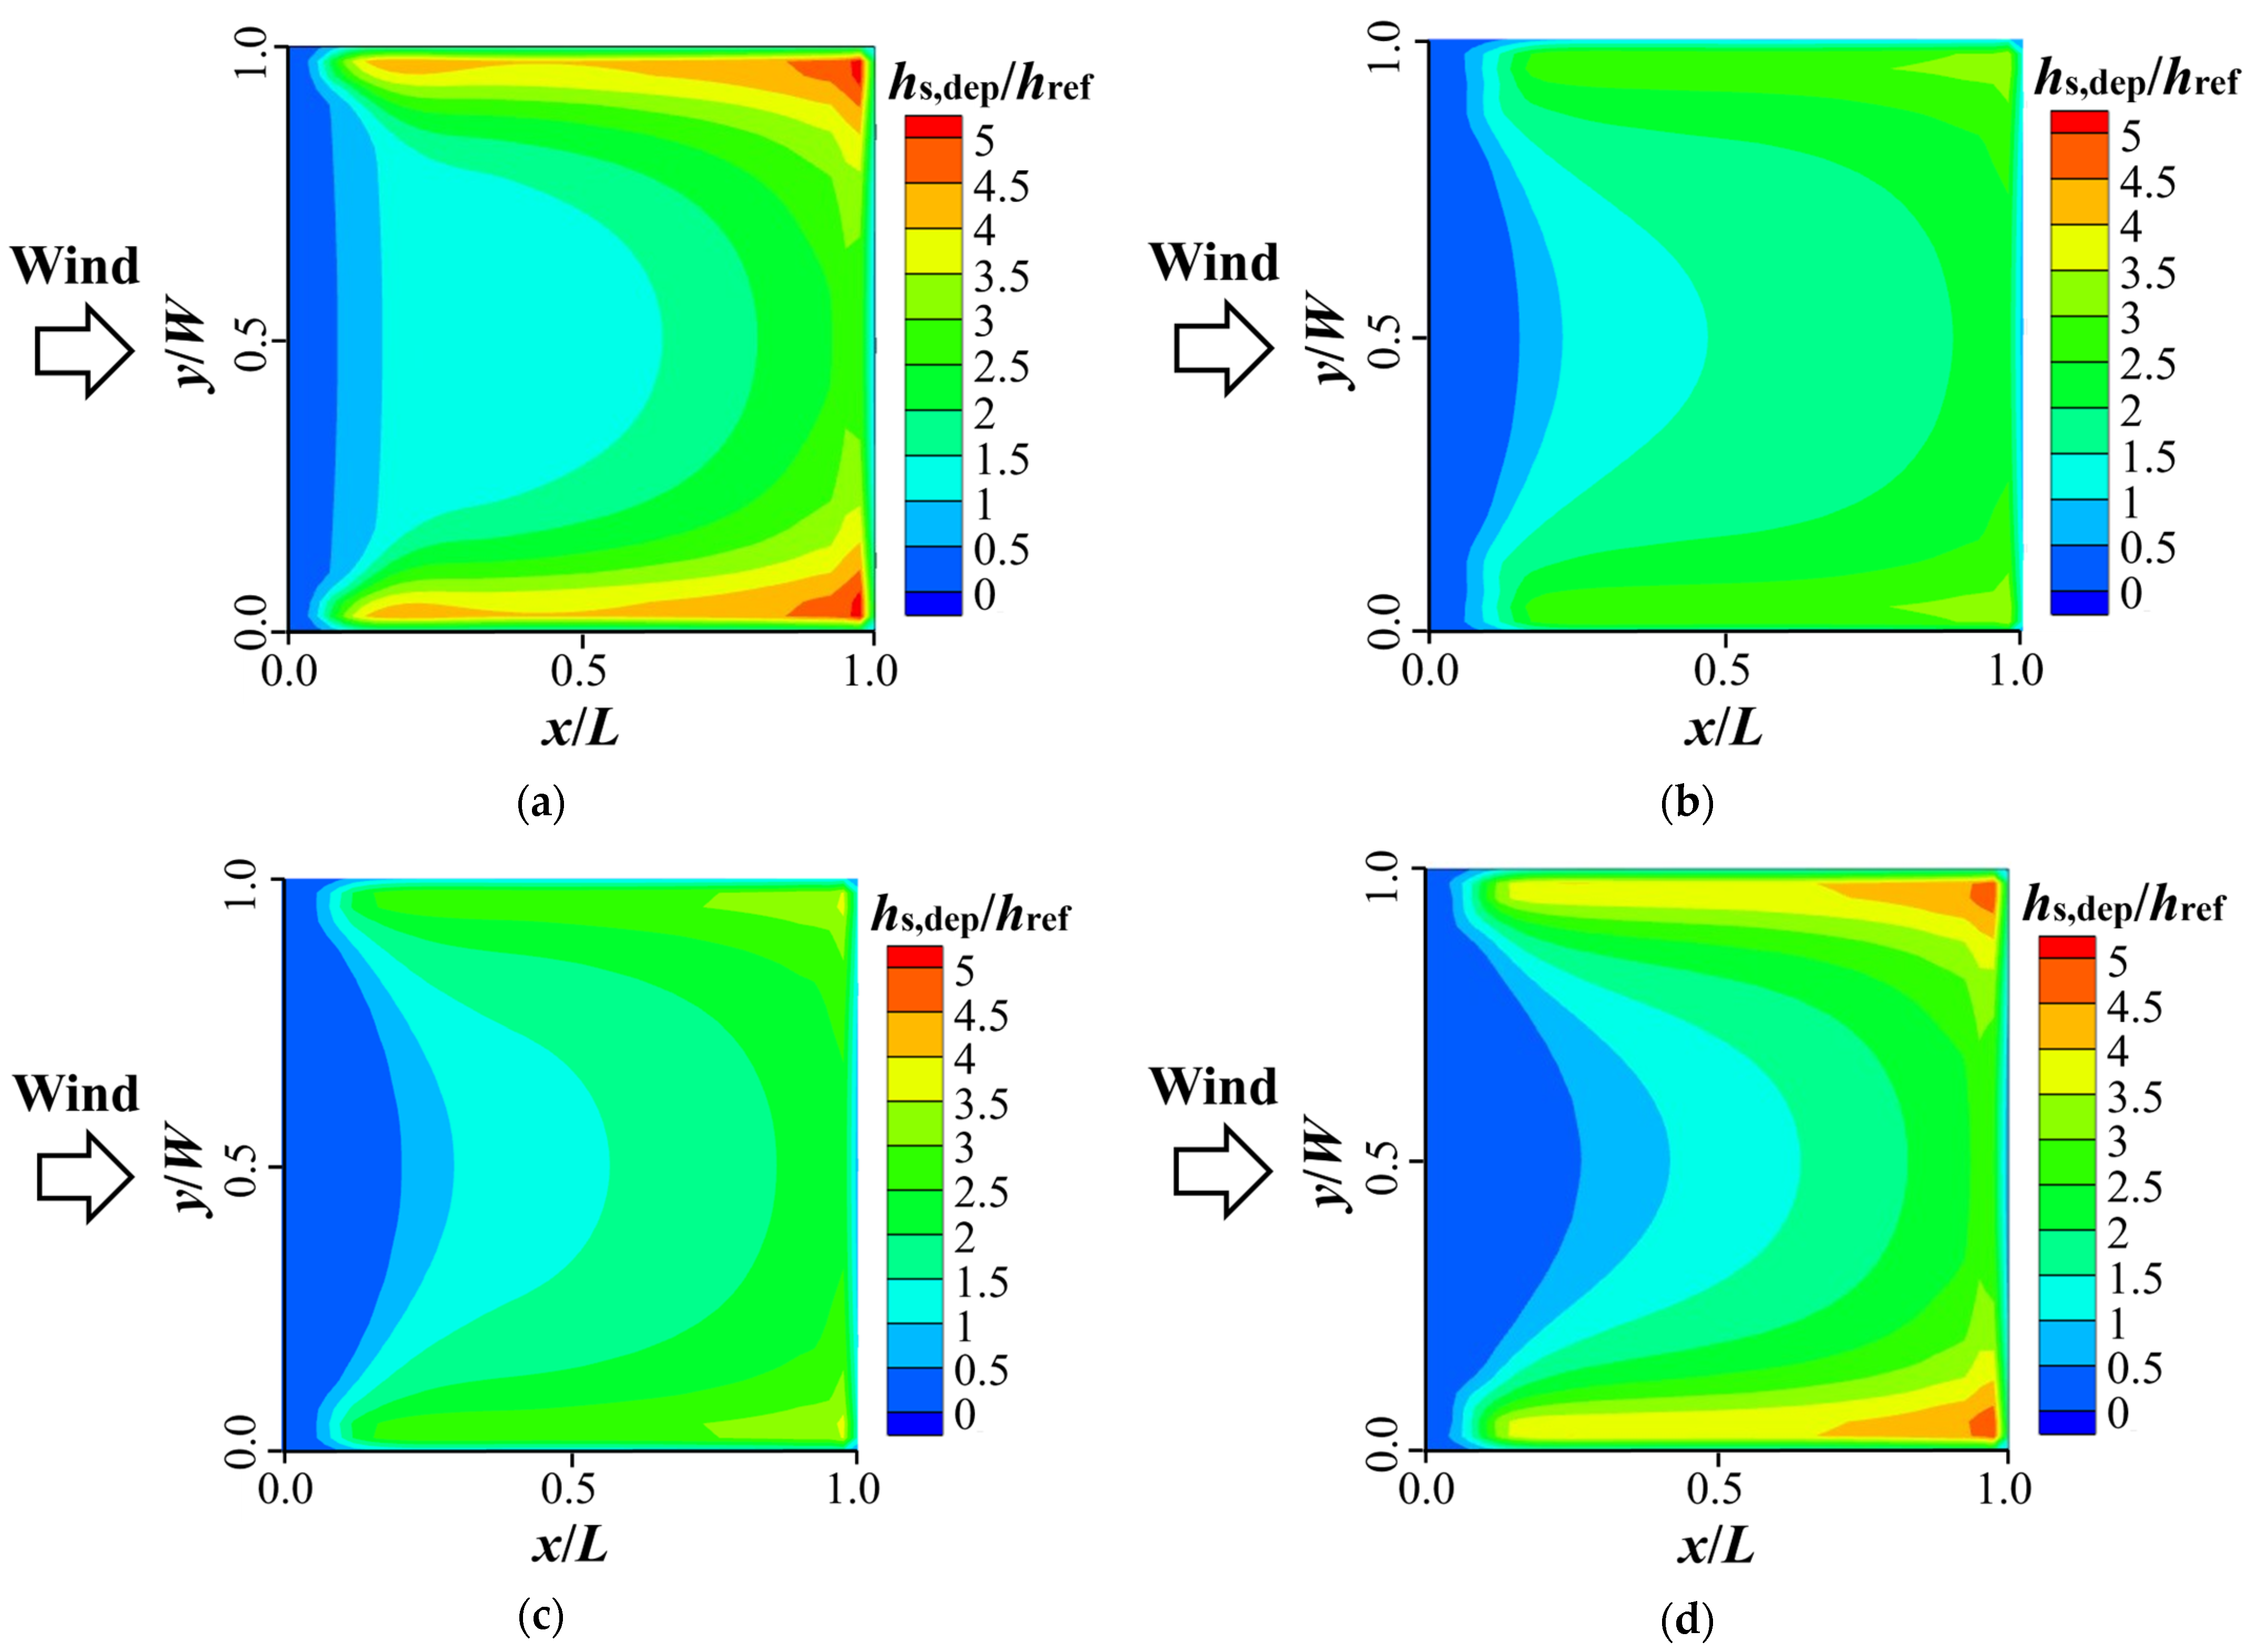
Given that the snow accumulations demonstrate similar distribution characteristics across the pitched roofs with varying slopes, the simulation results for the 20° single-pitched roof were selected as a representative case for an in-depth analysis. Since the flow field above the single-pitched roof exhibits similarities with the results for flat roofs (e.g., the airflow separation at the windward eave and flow reattachment since the central roof), the resulting trajectories and spatial distributions of falling snow particles demonstrate consistent patterns with those observed in flat roof simulations. Therefore, Figure 16 directly illustrates the snow distribution characteristics on the roof merely resulting from snow deposition, where the values represent the ratio of snow depths caused only by snow deposition hs,dep and snow depth on open ground href. Generally, when snow particles descend onto the roof surface, a significant quantity bypasses the windward eave due to the influence of separation flow. These particles are subsequently transported to the central roof area by the reattaching flow, resulting in the formation of a distinctive “bell-shaped” area of low snow depth. Similarly, spherical particles, which possess a lower drag coefficient, generate the smaller zero-depth zone at the windward eave. Moreover, the distribution patterns in some localized regions vary from those observed on flat roofs. Firstly, the inclined roof surface is more susceptible to direct impact from incoming airflow, which will lead to the formation of high-friction velocity zones along lateral edges, consequently triggering erosion phenomena. Under the effects of wind-induced erosion, snow along both lateral edges begins to drift, and significant snow accumulation occurs as a result of deposition of drifting snow carried by the airflow. Secondly, affected by the reversed flow near the downwind eave, some snow particles drifting to this area stop and accumulate there, maintaining relatively high concentrations and snow depth values. Overall, compared to flat roofs, the deposited snow depths on this type of building markedly increase, highlighting the significant impact of complex building geometries on snow distributions.
Compared to inclined roofs, the airflow velocity over flat roofs generally remains below the critical wind speed threshold required for snow drifting. Therefore, the snow distribution characteristics on flat roofs are merely governed by the near-ground snow concentration-dependent deposition effect. In contrast, single-pitched roofs, characterized by their inclined surfaces, are more prone to direct impact from upstream airflow, which leads to significant snow erosion. Consequently, the final snow distribution on single-pitched roofs is influenced not only by the snow concentration near the ground, but also closely tied to the distribution characteristics of high-velocity airflow above the roof. Figure 17 illustrates the dimensionless wind-induced erosive snow depths hs,ero/href on the single-pitched roof, where negative values indicate a reduction in snow depth. Generally, only minor erosion is observed within the “bell-shaped” low-velocity region. However, obvious snow erosion is evident in the airflow impact zones along the lateral edges, as well as the downstream area of the roof, which will significantly reduce the peak snow depth caused by snow deposition. It should be noted that due to the secondary flow separation occurring near the downwind eave, a region of low friction velocity forms, which reduces the wind-induced erosion in this area.
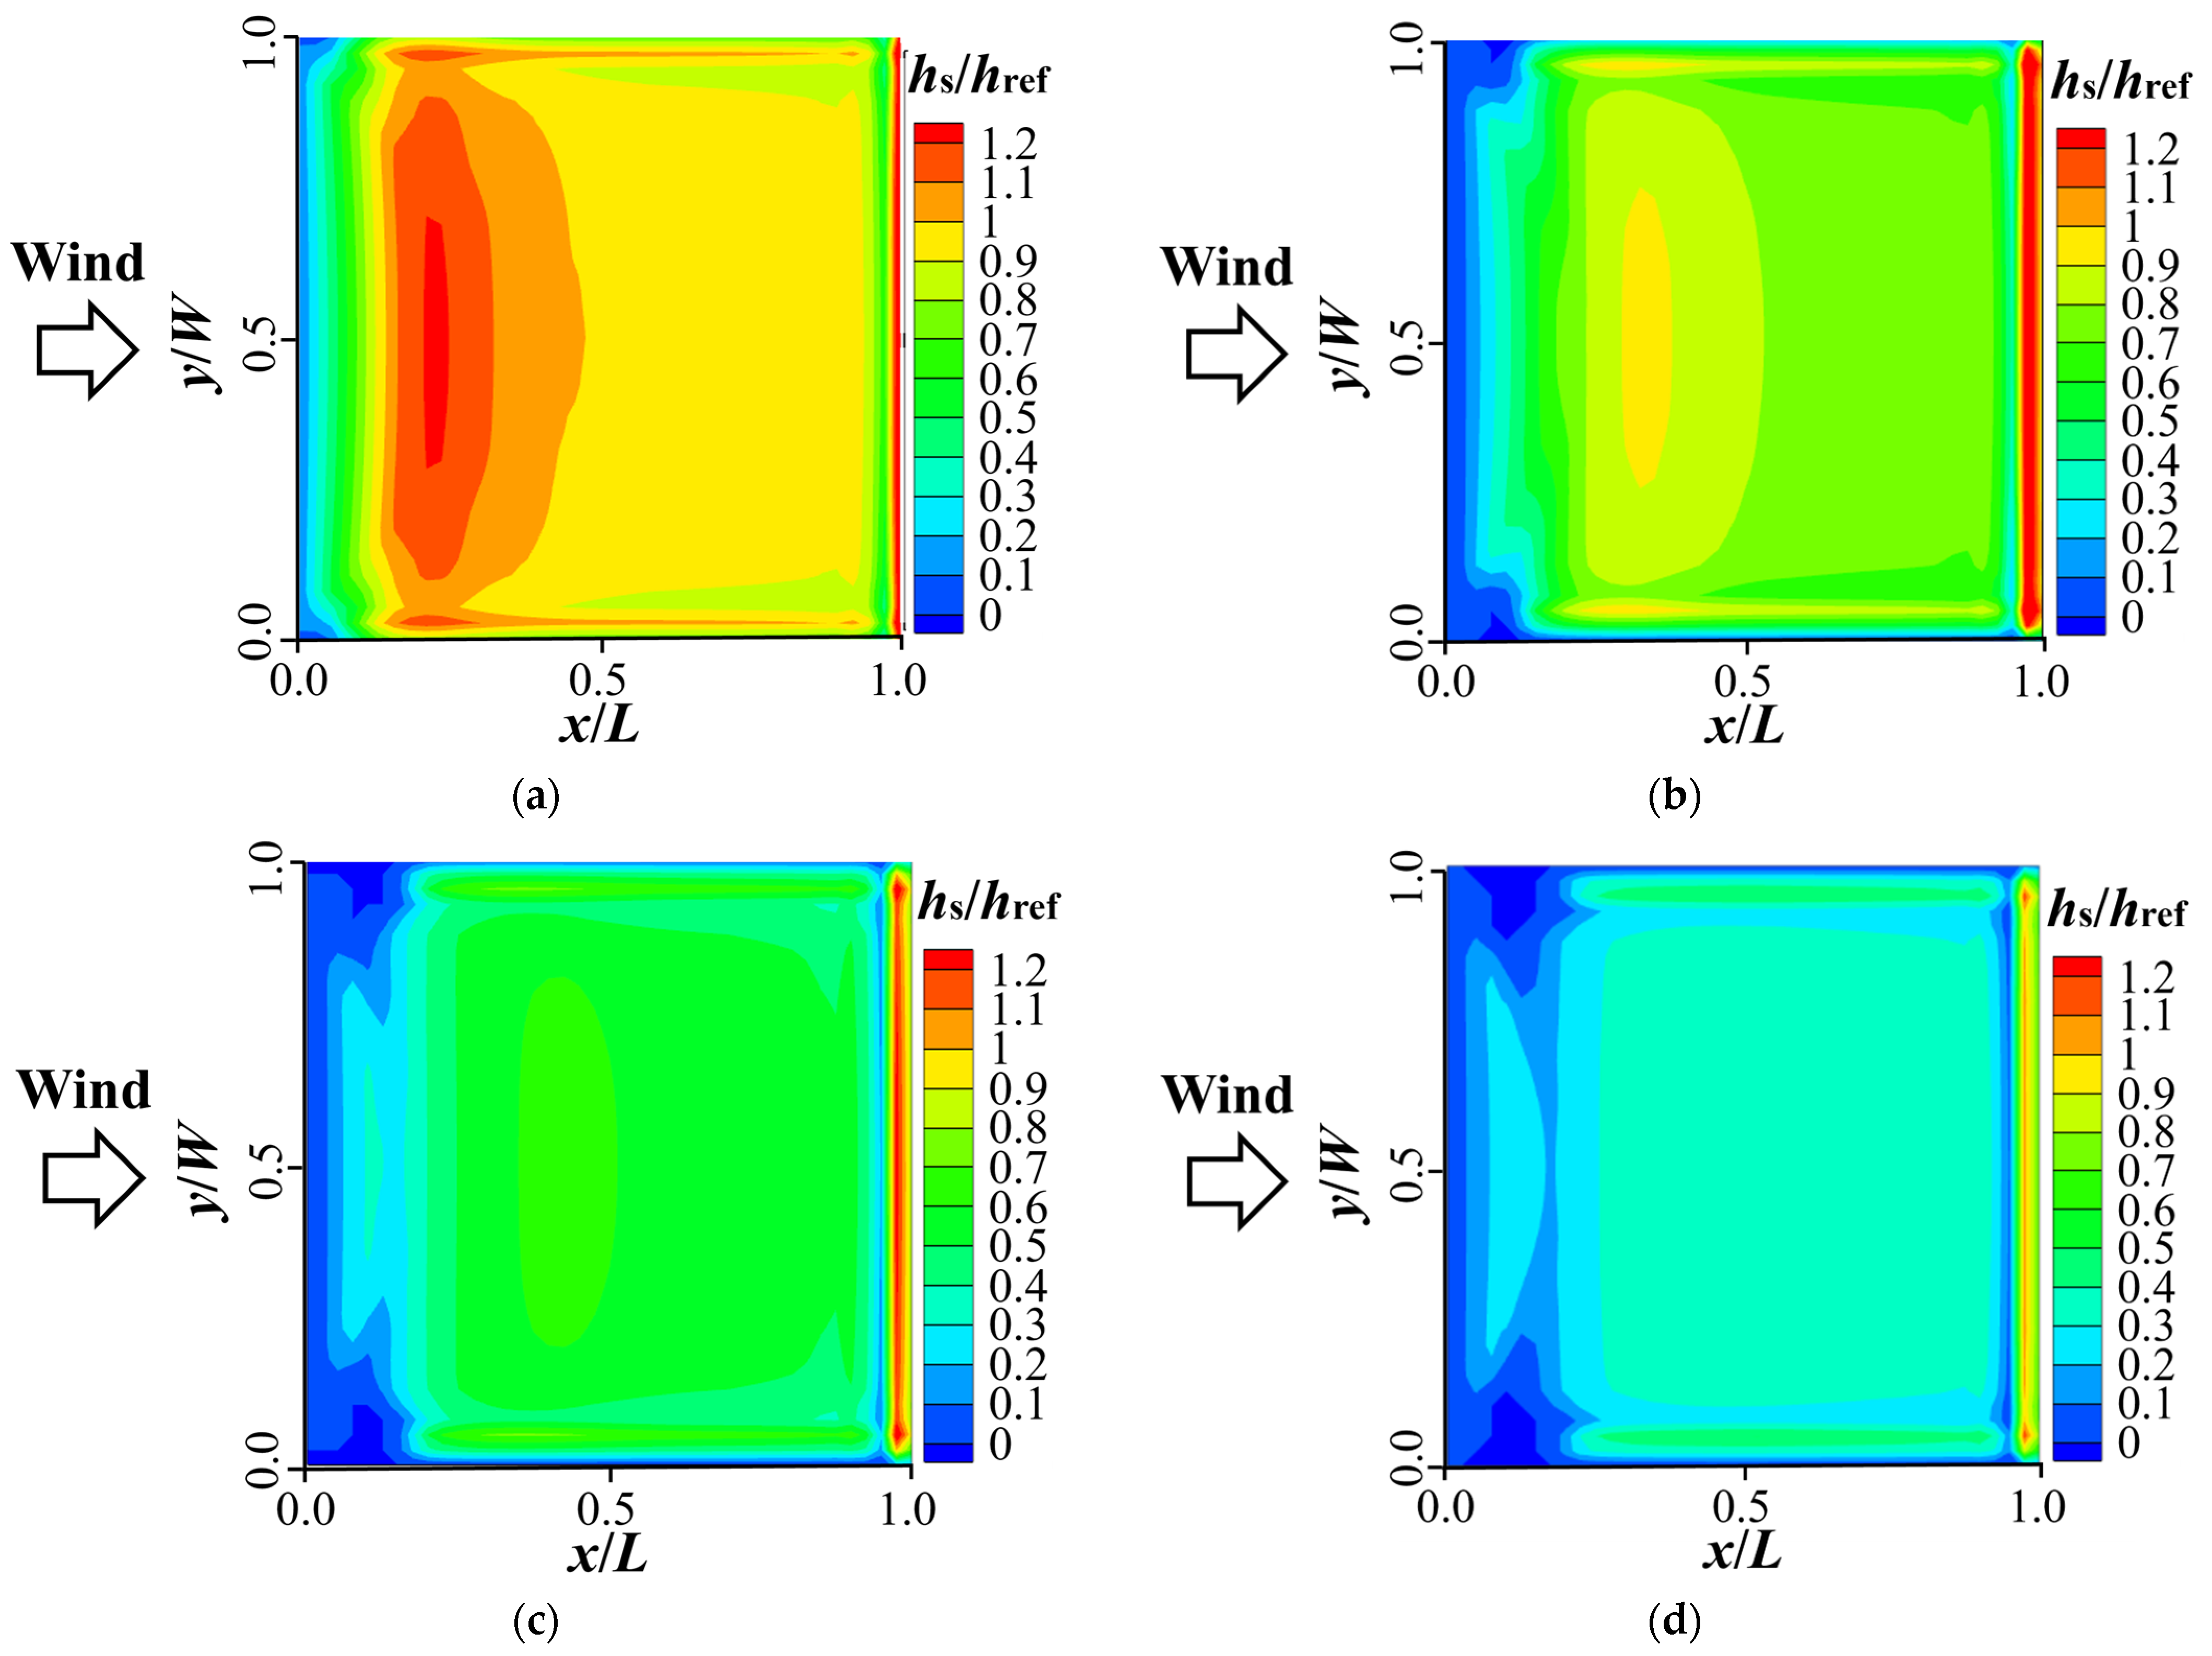
According to Equation (20), the final snow depth hs can be obtained by summing the deposited snow depth hs,dep and eroded snow depth hs,ero. Therefore, Figure 18 presents the final dimensionless snow depth distributions hs/href on the single-pitched roof under the combined effects of deposition and erosion. A comparison with the snow distribution under deposition-only conditions reveals a significant reconstruction of the snow accumulation pattern due to the influence of erosion processes. The overall snow depth is notably reduced, with the high-depth snowdrift zones that originally formed along the lateral edges and at the leeward conners of the roof being significantly diminished, leading to a more uniform snow distribution. Therefore, wind-induced erosion plays a crucial role in modulating snow distribution characteristics on the inclined roof. Despite the spatial redistribution of snow caused by the coupled deposition and erosion processes, the final snow depth on the roof still follows a trend of decreasing with an increase in the drag coefficient of different snow particle shapes.
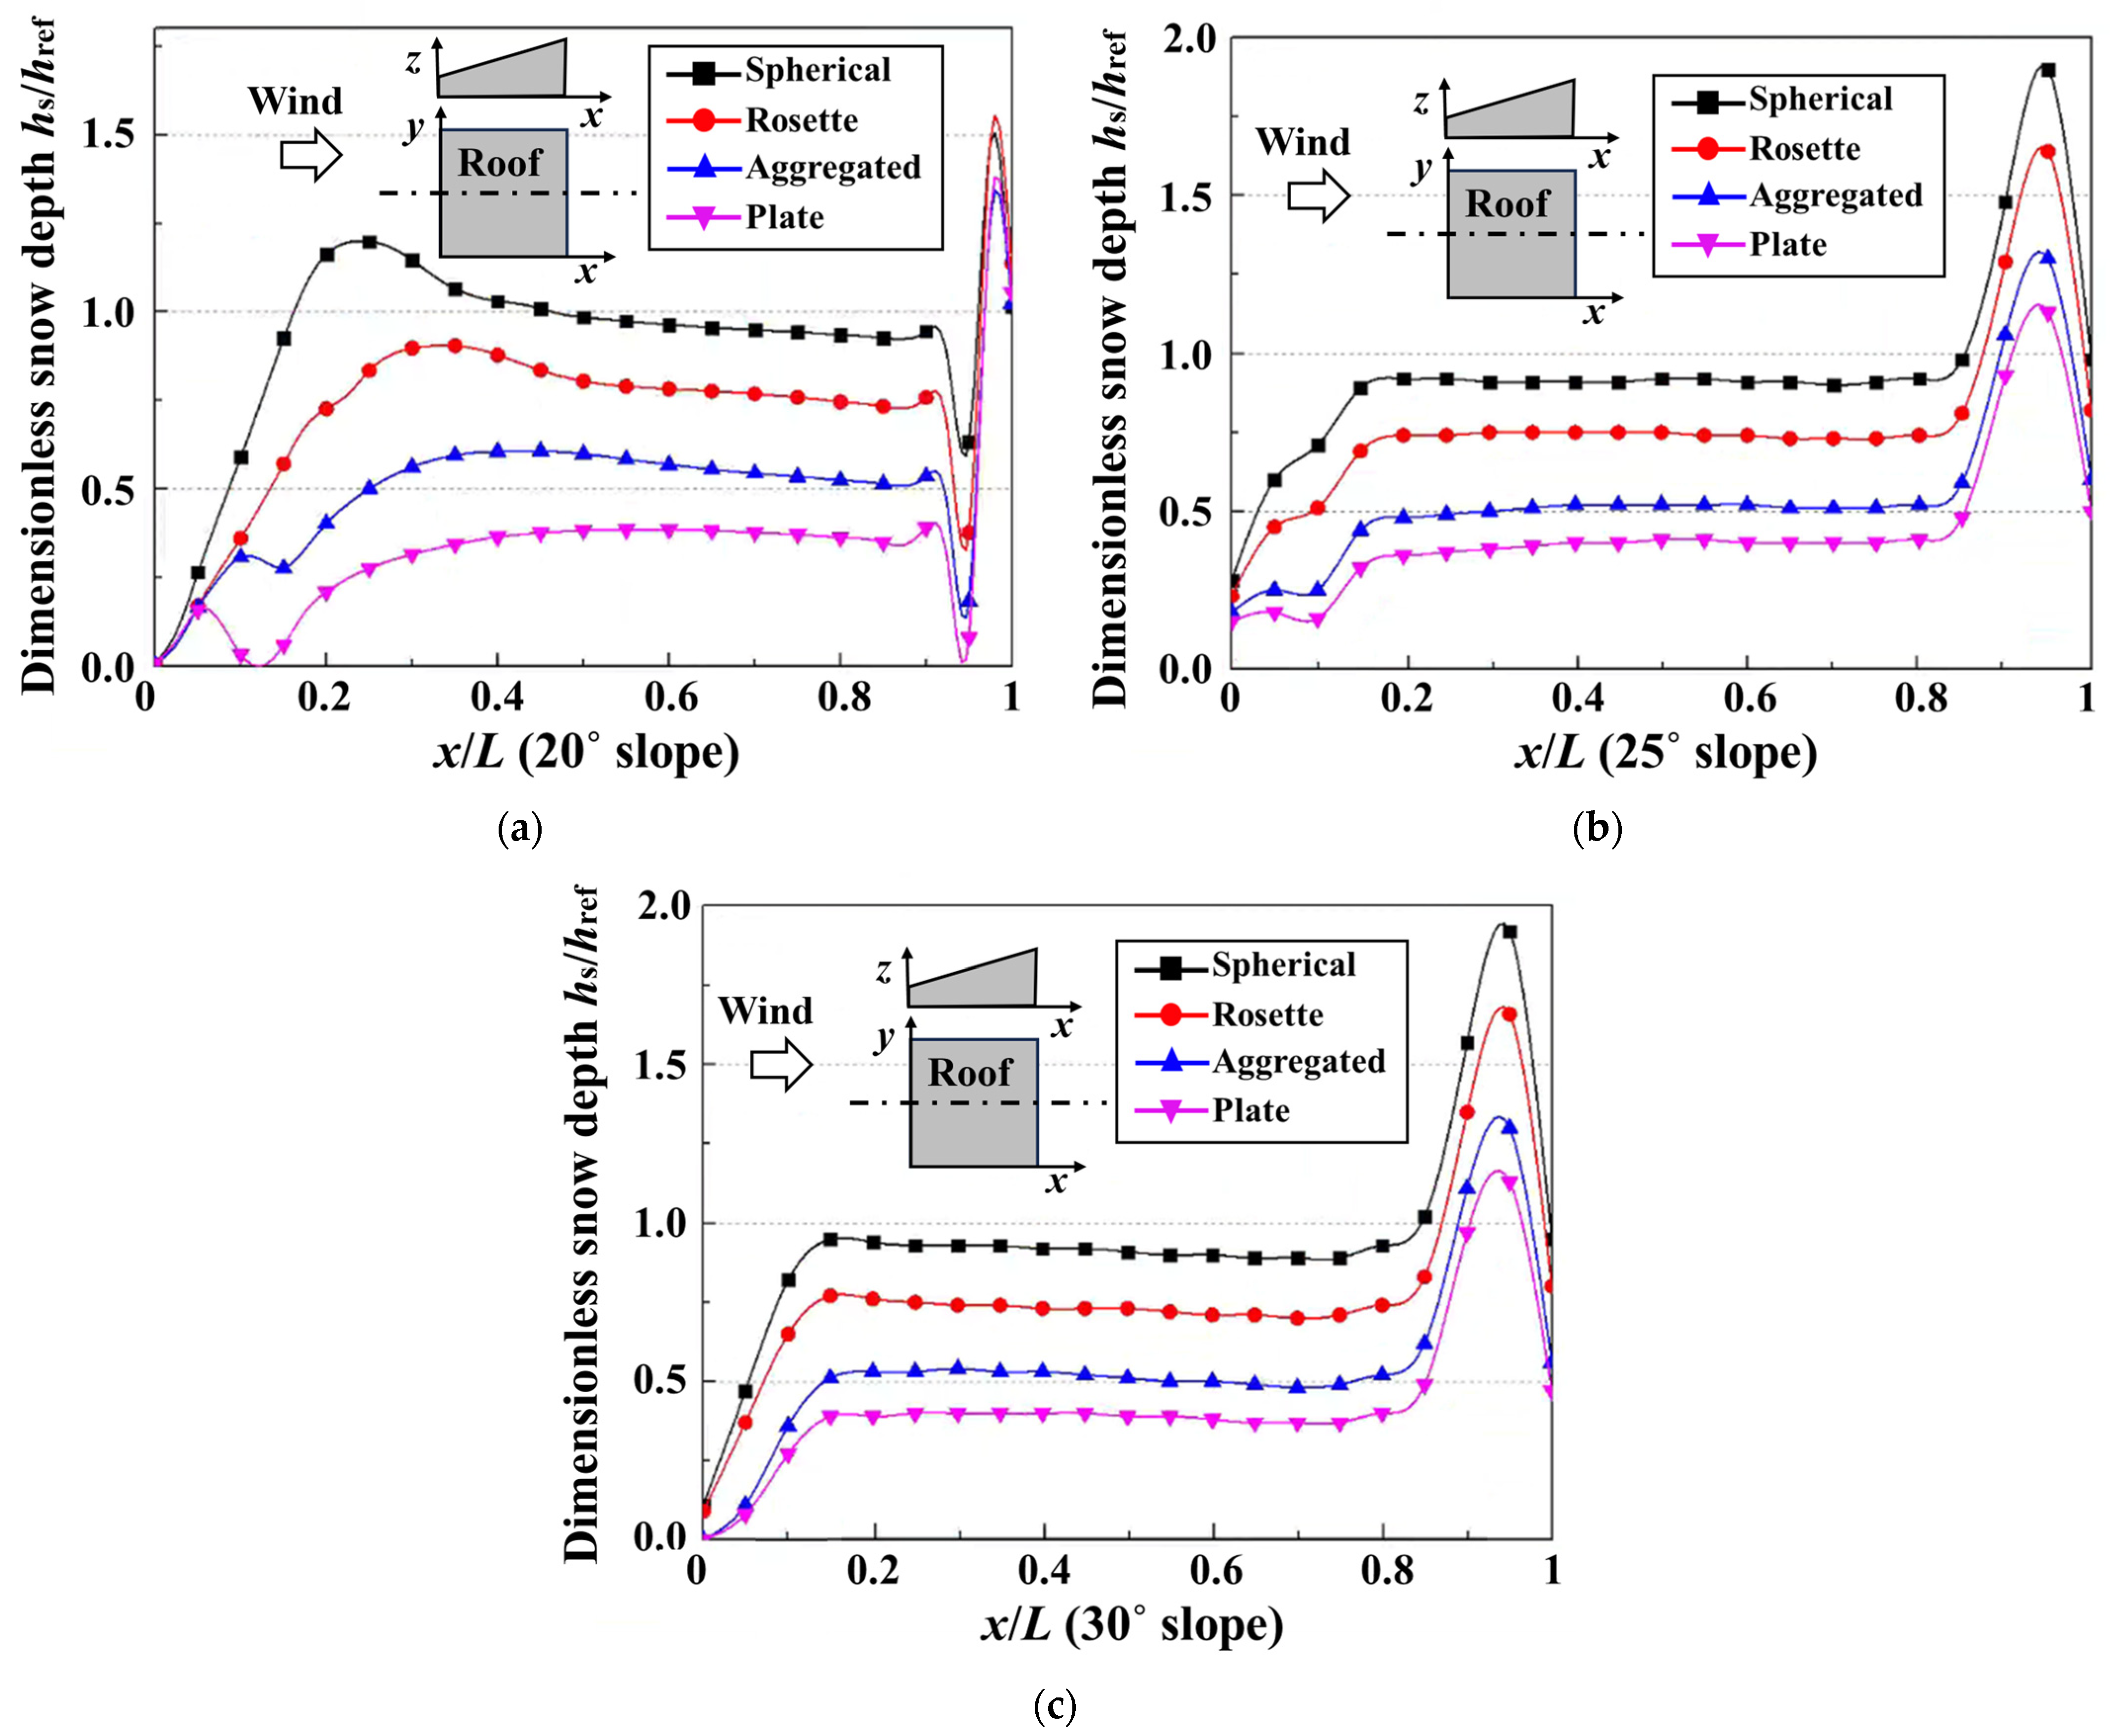
Figure 19 displays a comparative analysis of dimensionless snow depth profiles on single-pitched roofs with varying slopes after the settlement of four types of snow particles. Under the same roof slope condition, the snow distributions for snow particles of different shapes exhibit a similar pattern. Specifically, snow particles with higher drag coefficients demonstrate smaller snow depths. For roofs with different slopes, as the slope increases, the erosion effects of airflow intensify significantly, substantially reducing the upstream snow depths. The erosive snow particles move downstream further and form a larger peak snow depth along the leeward eave. The steeper the slope, the lower the overall snow depth and the more uneven the snow profile become. Furthermore, steeper slopes will weaken the differential impact of particle shape on deposition distribution and promote a more consistent snow depth profile. Finally, the steep increase in snow depth observed at the downwind eave in the single-pitched roof simulation should be explained. This abrupt accumulation is primarily caused by the enhanced snow deposition resulting from reversed flow and reduced erosion effect near the eave, as discussed above. However, due to computational constraints, a steady-state simulation was employed in this study. Here, snow depth was treated only as a scalar for statistically describing the final snow distribution and was not coupled with the airflow simulation. Consequently, the current simulation failed to capture the dynamic erosive effects of wind on locally accumulated snow, leading to a persistent overestimation of snow depth in this region. To address this limitation, future work will refine the simulation methodology to incorporate the mutual interaction between evolving snow depth and airflow.

6. Conclusions

This paper focuses on the snowdrift characteristics on building roofs with the consideration of snow particle morphologies. Initially, a refined simulation of the transport process of snow particles with varying morphologies was attained by integrating a drag function term, which accounted for different snow particle shapes, into the momentum equations of a multiphase model. Following this, the accumulation and distribution characteristics of snow particles of diverse shapes on basic flat and single-pitched roofs were thoroughly examined. Based on the aforementioned works, the following key conclusions are drawn:
  • Based on the multiphase model in ANSYS software, this study develops a method that accounts for the aerodynamic drag variations in snow particles with different geometric morphologies. By integrating a shape-dependent drag function into the momentum equations, the model could characterize the differential momentum exchange between air flow and non-spherical snow particles. Comprehensive validation against experimental data confirms that the refined model could reasonably predict both particle trajectories and resulting accumulation patterns under coupled wind–snow conditions. This model overcomes the limitations of the traditional spherical particle assumption, offering an alternative approach for simulating the motion of snow particles with various morphological features on a building-scale roof.
  • The differences in the motion characteristics of snow particles with various shapes essentially stem from variations in their drag coefficients. The drag coefficient directly influences the falling velocities of snow particles, which in turn leads to significant disparities in snow concentration distribution, snow deposition amount, and snow accumulation patterns. Specifically, a higher drag coefficient results in a slower falling velocity of snow particles, ultimately leading to a reduction in snow deposition on roofs.
  • For flat roofs, the relatively low wind speed near the surface leads to limited erosive effects of airflow. Consequently, snow distribution is predominantly controlled by the snow deposition process, which becomes the dominant factor governing snow accumulation on flat roofs. However, as the roof span increases, the influence of snow particle morphology on accumulation patterns gradually decreases. In contrast, the inclined surface of pitched roofs enhances wind-induced snow erosion, further diminishing the role of particle shape in snow deposition. Nevertheless, regardless of roof type, the drag coefficient of snow particles controls the macroscopic pattern of snow distribution by governing the falling velocity and deposition efficiency.
As a preliminary research effort, this study provides an alternative method to simulate the drifting process of snow particles with different morphologies on a building scale by modifying their drag function within the Euler–Euler framework. However, it must be acknowledged that although this approach circumvents the massive computational demands associated with particle tracking in the Euler–Lagrange framework, it does so at the expense of some simulation accuracy. Furthermore, the current research mainly focuses on the distribution characteristics of snow particles with varying morphologies on roofs, and has not yet investigated the influence of other factors, such as particle gradation, surface characteristics, melting effects, and compaction, on the accumulation process. The inflow conditions in this study (e.g., snowfall rate and wind speed) were fixed based on meteorological data from the Harbin region, selected to represent the most critical scenario wherein uneven snow distribution was most pronounced. Consequently, this research did not examine how regional variations in these inflow conditions would influence snow distribution patterns. In terms of the simulation methodology, a steady-state approach was employed, which did not fully account for the effect of evolving snow cover on the flow field. This limitation resulted in an abnormal increase in snow depth at the downstream edge of the single-pitched roof. To address the aforementioned issues, future work will involve dedicated studies aimed at further refining the existing model. For instance, future studies could incorporate additional snow phases into existing models to investigate how variations in snow particle properties (e.g., particle gradation, surface characteristics) influence accumulation patterns. The introduction of a thermal model would further enable the examination of long-term snowmelt and compaction effects. Adopting quasi-steady or transient simulation methods could also elucidate the feedback mechanisms between evolving snow cover and the flow field. Furthermore, expanding the parameter range of inflow conditions is essential to systematically explore snow distribution evolution, thereby significantly enhancing the generalizability and practical applicability of the findings.

Author Contributions

Conceptualization, F.F. and X.Z.; methodology, G.Z. and Q.Z.; software, G.Z. and Y.Z.; validation, G.Z., Y.Z. and Q.Z.; formal analysis, G.Z.; investigation, G.Z. and H.M.; resources, F.F. and Y.Z.; data curation, Q.Z. and H.M.; writing—original draft preparation, G.Z.; writing—review and editing, G.Z. and Q.Z.; visualization, Q.Z.; supervision, F.F. and Q.Z.; project administration, G.Z., Q.Z. and F.F.; funding acquisition, G.Z. and Q.Z. All authors have read and agreed to the published version of the manuscript.

Funding

This study was funded by the National Natural Science Foundation of China (grant number: 52208157), Postdoctoral Science Foundation of China (grant number: 2022M710976, 2023T160161), Excellent Master’s and Doctoral Dissertations of Heilongjiang in the New Era (grant number: LJYXL2022-058), and China Construction Engineering Corporation Technology R&D Program Funding (grant number: CSCEC-2024-Z-14).

Data Availability Statement

The original contributions presented in this study are included in the article. Further inquiries can be directed to the corresponding author.

Acknowledgments

The authors are grateful to the members of the Space Structures Research Center at the Harbin Institute of Technology, for providing invaluable information and advice in this study.

Conflicts of Interest

The authors declare no conflicts of interest.

Abbreviations

The following abbreviations are used in this manuscript:
CFDComputational Fluid Dynamics
CESCryospheric Environment Simulator

References

  1. Magono, C. Meteorological classification of snow crystals. J. Jpn. Soc. Snow Ice 1962, 24, 33–37. [Google Scholar] [CrossRef]
  2. Kikuchi, K.; Kameda, T.; Higuchi, K. A global classification of snow crystals, ice crystals, and solid precipitation based on observations from middle latitudes to polar regions. Atmos. Res. 2013, 132, 460–472. [Google Scholar] [CrossRef]
  3. Muramoto, K.; Matsuura, K.; Shiina, T. Measuring the density of snow particles and snowfall rate. Electr. Commun. Jpn. 1995, 78, 2353–2360. [Google Scholar] [CrossRef]
  4. Yagi, T. Measurement of the fall velocity of ice crystals drifting in supercooled fog. J. Meteorol. Soc. Jpn. 1970, 48, 287–292. [Google Scholar] [CrossRef]
  5. Locatelli, J.; Hobbs, P.V. Fall speeds and masses of solid precipitation particles. J. Geophys. Res. 1974, 79, 2185–2197. [Google Scholar] [CrossRef]
  6. Heymsfield, A. Ice crystal terminal velocities. J. Atmos. Sci. 1972, 29, 1348–1357. [Google Scholar] [CrossRef]
  7. Finny, E.A. Snowdrift Control by Highway Design: No. 86; Michigan Engineering Experiment Station: East Lansing, MI, USA, 1939. [Google Scholar]
  8. Gerdel, R.W.; Strom, G.H. Wind Tunnel Studies with Scale Model Simulated Snow; International Association of Scientific Hydrology: Wallingford, UK, 1961. [Google Scholar]
  9. Kind, R.J. A critical examination of the requirements for model simulation of wind-induced erosion/deposition phenomena such as snow drifting. Atmos. Environ. 1976, 10, 219–227. [Google Scholar] [CrossRef]
  10. Kind, R.J.; Murray, S.B. Saltation flow measurements relating to modeling of snowdrifting. J. Wind Eng. Ind. Aerodyn. 1982, 10, 89–102. [Google Scholar] [CrossRef]
  11. Iversen, J.D. Drifting snow similitude—Drift rate correlation. In Proceedings of the International Conference on Wind Engineering, Fort Collins, CO, USA, 8–14 July 1979. [Google Scholar]
  12. Iversen, J.D. Aeolian processes in the environmental wind tunnel and in the atmosphere. In Physics of Desertification; Springer: Berlin/Heidelberg, Germany, 1986; pp. 318–321. [Google Scholar]
  13. Delpech, P.; Palier, P.; Gandemer, J. Snowdrifting simulation around Antarctic buildings. J. Wind Eng. Ind. Aerodyn. 1998, 74–76, 567–576. [Google Scholar] [CrossRef]
  14. Okaze, T.; Tominaga, Y.; Mochida, A. Numerical modelling of drifting snow around buildings. In Proceedings of the 6th International Symposium on Turbulence, Heat and Mass Transfer, Rome, Italy, 14–18 September 2009. [Google Scholar]
  15. Fan, F.; Li, R.; Zhang, Q.; Zhang, G.; Mo, H. A complete environmental wind tunnel for studying the evolution of snow accumulations under the effects of wind, rain, and heat. J. Wind Eng. Ind. Aerodyn. 2024, 252, 105817. [Google Scholar] [CrossRef]
  16. Zhang, G.; Zhang, Q.; Mo, H.; Guo, D.; Zhi, X.; Wu, J.; Fan, F. CFD investigations into snow loads on tandem-arranged gabled-roofed buildings under mutual interferences. Cold Reg. Sci. Technol. 2025, 238, 104547. [Google Scholar] [CrossRef]
  17. Zhang, Q.; Zhang, G.; Zheng, R.; Mo, H.; Zhi, X.; Wu, J.; Fan, F. Research on controlling measures of snowdrifts around Arctic ground-based buildings through shape optimization. Cold Reg. Sci. Technol. 2025, 231, 104382. [Google Scholar] [CrossRef]
  18. Lee, B.; Tu, J.; Fletcher, C. On numerical modeling of particle-wall impaction in relation to erosion prediction: Eulerian versus lagrangian method. Wear 2002, 252, 179–188. [Google Scholar] [CrossRef]
  19. Wang, Z.S.; Huang, N. Numerical simulation of the falling snow deposition over complex terrain. J. Geophys. Res. Atmos. 2017, 122, 980–1000. [Google Scholar] [CrossRef]
  20. Huang, N.; Wang, Z.S. The formation of snow streamers in the turbulent atmosphere boundary Layer. Aeolian Res. 2016, 23, 1–10. [Google Scholar] [CrossRef]
  21. Uematsu, T.; Kaneda, Y.; Takeuchi, K.; Nakata, T.; Yukumi, M. Numerical simulation of snowdrift development. Ann. Glaciol. 1989, 13, 265–268. [Google Scholar] [CrossRef]
  22. Liston, G.E.; Brown, R.L.; Dent, J.D. A two-dimensional computational model of turbulent atmospheric surface flows with drifting snow. Ann. Glaciol. 1993, 18, 281–286. [Google Scholar] [CrossRef]
  23. Naaim, M.; Naaim-Bouvet, F.; Martinez, H. Numerical simulation of drifting snow: Erosion and deposition models. Ann. Glaciol. 1998, 26, 191–196. [Google Scholar] [CrossRef]
  24. Tominaga, Y.; Mochida, A. CFD prediction of flowfield and snowdrift around a building complex in a snowy region. J. Wind Eng. Ind. Aerodyn. 1999, 81, 273–282. [Google Scholar] [CrossRef]
  25. Pomeroy, J.W.; Male, D.H. Steady-state suspension of snow. J. Hydrol. 1992, 136, 275–301. [Google Scholar] [CrossRef]
  26. Okaze, T.; Takano, Y.; Mochida, A.; Tominaga, Y. Development of a new k-ε model to reproduce the aerodynamic effects of snow particles on a flow field. J. Wind Eng. Ind. Aerodyn. 2015, 144, 118–124. [Google Scholar] [CrossRef]
  27. Zhou, X.; Zhang, Y.; Kang, L.; Gu, M. CFD simulation of snow redistribution on gable roofs: Impact of roof slope. J. Wind Eng. Ind. Aerodyn. 2019, 185, 16–32. [Google Scholar] [CrossRef]
  28. Zhou, X.; Zhang, Y.; Gu, M. Coupling a snowmelt model with a snowdrift model for the study of snow distribution on roofs. J. Wind Eng. Ind. Aerodyn. 2018, 182, 235–251. [Google Scholar] [CrossRef]
  29. Beyers, J.H.M.; Sundsbo, P.A.; Harms, T.M. Numerical simulation of three-dimensional, transient snow drifting around a cube. J. Wind Eng. Ind. Aerodyn. 2004, 92, 725–747. [Google Scholar] [CrossRef]
  30. Zhang, G.L.; Zhang, Q.W.; Fan, F.; Shen, S.Z. Numerical Simulations of Development of Snowdrifts on Long-Span Spherical Roofs. Cold Reg. Sci. Technol. 2021, 182, 103211. [Google Scholar] [CrossRef]
  31. Zhang, G.L.; Zhang, Q.W.; Fan, F.; Shen, S.Z. Numerical Simulations of Snowdrift Characteristics on Multi-span Arch Roofs. J. Wind Eng. Ind. Aerodyn. 2021, 212, 104593. [Google Scholar] [CrossRef]
  32. Libbrecht, K. The enigmatic snowflake. Phys. World. 2008, 21, 19–23. [Google Scholar] [CrossRef]
  33. Nakaya, U.; Sekido, Y. General Classification of Snow Crystals and their Frequency of Occurrence. J. Fac. Sci. 1936, 1, 243–264. [Google Scholar]
  34. Hobbs, P.V.; Fletcher, N.H. Ice Physics. Phys. Today 1975, 28, 71–72. [Google Scholar] [CrossRef]
  35. Abraham, F.F. Functional dependence of drag coefficient of a sphere on Reynolds number. Phys. Fluids 1970, 13, 2194–2195. [Google Scholar] [CrossRef]
  36. Mccorquodale, M.W.; Westbrook, C.D. TRAIL part 2: A comprehensive assessment of ice particle fall speed parametrisations. Q. J. R. Meteorol. Soc. 2021, 147, 605–626. [Google Scholar] [CrossRef]
  37. Mccorquodale, M.W.; Westbrook, C.D. TRAIL: A novel approach for studying the aerodynamics of ice particles. Q. J. R. Meteorol. Soc. 2021, 147, 589–604. [Google Scholar] [CrossRef]
  38. Boutanios, Z.; Jasak, H. Two-way coupled Eulerian-Eulerian simulations of drifting snow with viscous treatment of the snow phase. J. Wind Eng. Ind. Aerodyn. 2017, 169, 67–76. [Google Scholar] [CrossRef]
  39. Thiis, T.K.; O’rourke, M. Model for snow loading on gable roofs. J. Struct. Eng.-ASCE 2015, 141, 04015051. [Google Scholar] [CrossRef]
  40. Mo, H.M.; Fan, F.; Hong, H.P. Evaluation of input wind speed used in wind tunnel test and numerical simulation to estimate drifting snow profile. J. Build. Struct. 2015, 36, 75–80+90. (In Chinese) [Google Scholar]
  41. Zhou, X.; Kang, L.; Gu, M.; Qiu, L.; Hu, J. Numerical simulation and wind tunnel test for redistribution of snow on a flat roof. J. Wind Eng. Ind. Aerodyn. 2016, 153, 92–105. [Google Scholar] [CrossRef]
  42. Zhu, F.; Yu, Z.X.; Zhao, L.; Xue, M.Q.; Zhao, S.C. Adaptive-mesh method using RBF interpolation: A time-marching analysis of steady snow drifting on stepped flat roofs. J. Wind Eng. Ind. Aerodyn. 2017, 171, 1–11. [Google Scholar] [CrossRef]
  43. Wang, J.S.; Liu, H.B.; Xu, D.; Chen, Z.H.; Ma, K.J. Modeling snowdrift on roofs using Immersed Boundary Method and wind tunnel test. Build. Environ. 2019, 160, 106208. [Google Scholar] [CrossRef]
  44. Zhang, G.L.; Zhang, Q.W.; Mo, H.M.; Li, R.; Liu, M.M.; Fan, F. Experimental Investigation of Snow Accumulations on Two-Span Single-Pitched Roofs Based on a New Similarity Criterion. Front. Earth Sci. 2022, 10, 785010. [Google Scholar] [CrossRef]
  45. GB50009-2012; Load Code for the Design of Building Structures. Ministry of Construction of the People’s Republic of China; China Building Industry Press: Beijing, China, 2012.
  46. Tominaga, Y.; Okaze, T.; Mochida, A. CFD modeling of snowdrift around a building: An overview of models and evaluation of a new approach. Build. Environ. 2011, 46, 899–910. [Google Scholar] [CrossRef]
  47. Tominaga, Y.; Stathopoulos, T. Numerical simulation of dispersion around an isolated cubic building: Comparison of various types of k-ε models. Atmos. Environ. 2009, 43, 3200–3210. [Google Scholar] [CrossRef]
  48. Tominaga, Y.; Okaze, T.; Mochida, A. CFD simulation of drift snow loads for an isolated gable-roof building. In Proceedings of the 8th International Conference on Snow Engineering, Nantes, France, 14–17 June 2016. [Google Scholar]
  49. NRCC. National Building Code of Canada; Institute for Research in Construction, National Research Council of Canada: Ottawa, ON, Canada, 2015. [Google Scholar]
  50. ISO 4355; Bases for Design of Structures—Determination of Snow Loads on Roofs. International Organization for Standardization: Geneva, Switzerland, 2013.
  51. ASCE/SEI 7-16; Minimum Design Loads for Buildings and Other Structures. American Society of Civil Engineering: Reston, VA, USA, 2016.
  52. Zhang, G.L.; Zhang, Y.; Yin, Z.A.; Zhang, Q.W.; Mo, H.M.; Wu, J.Z.; Fan, F. CFD Simulations of Snowdrifts on a Gable Roof: Impacts of Wind Velocity and Snowfall Intensity. Buildings 2022, 12, 1878. [Google Scholar] [CrossRef]
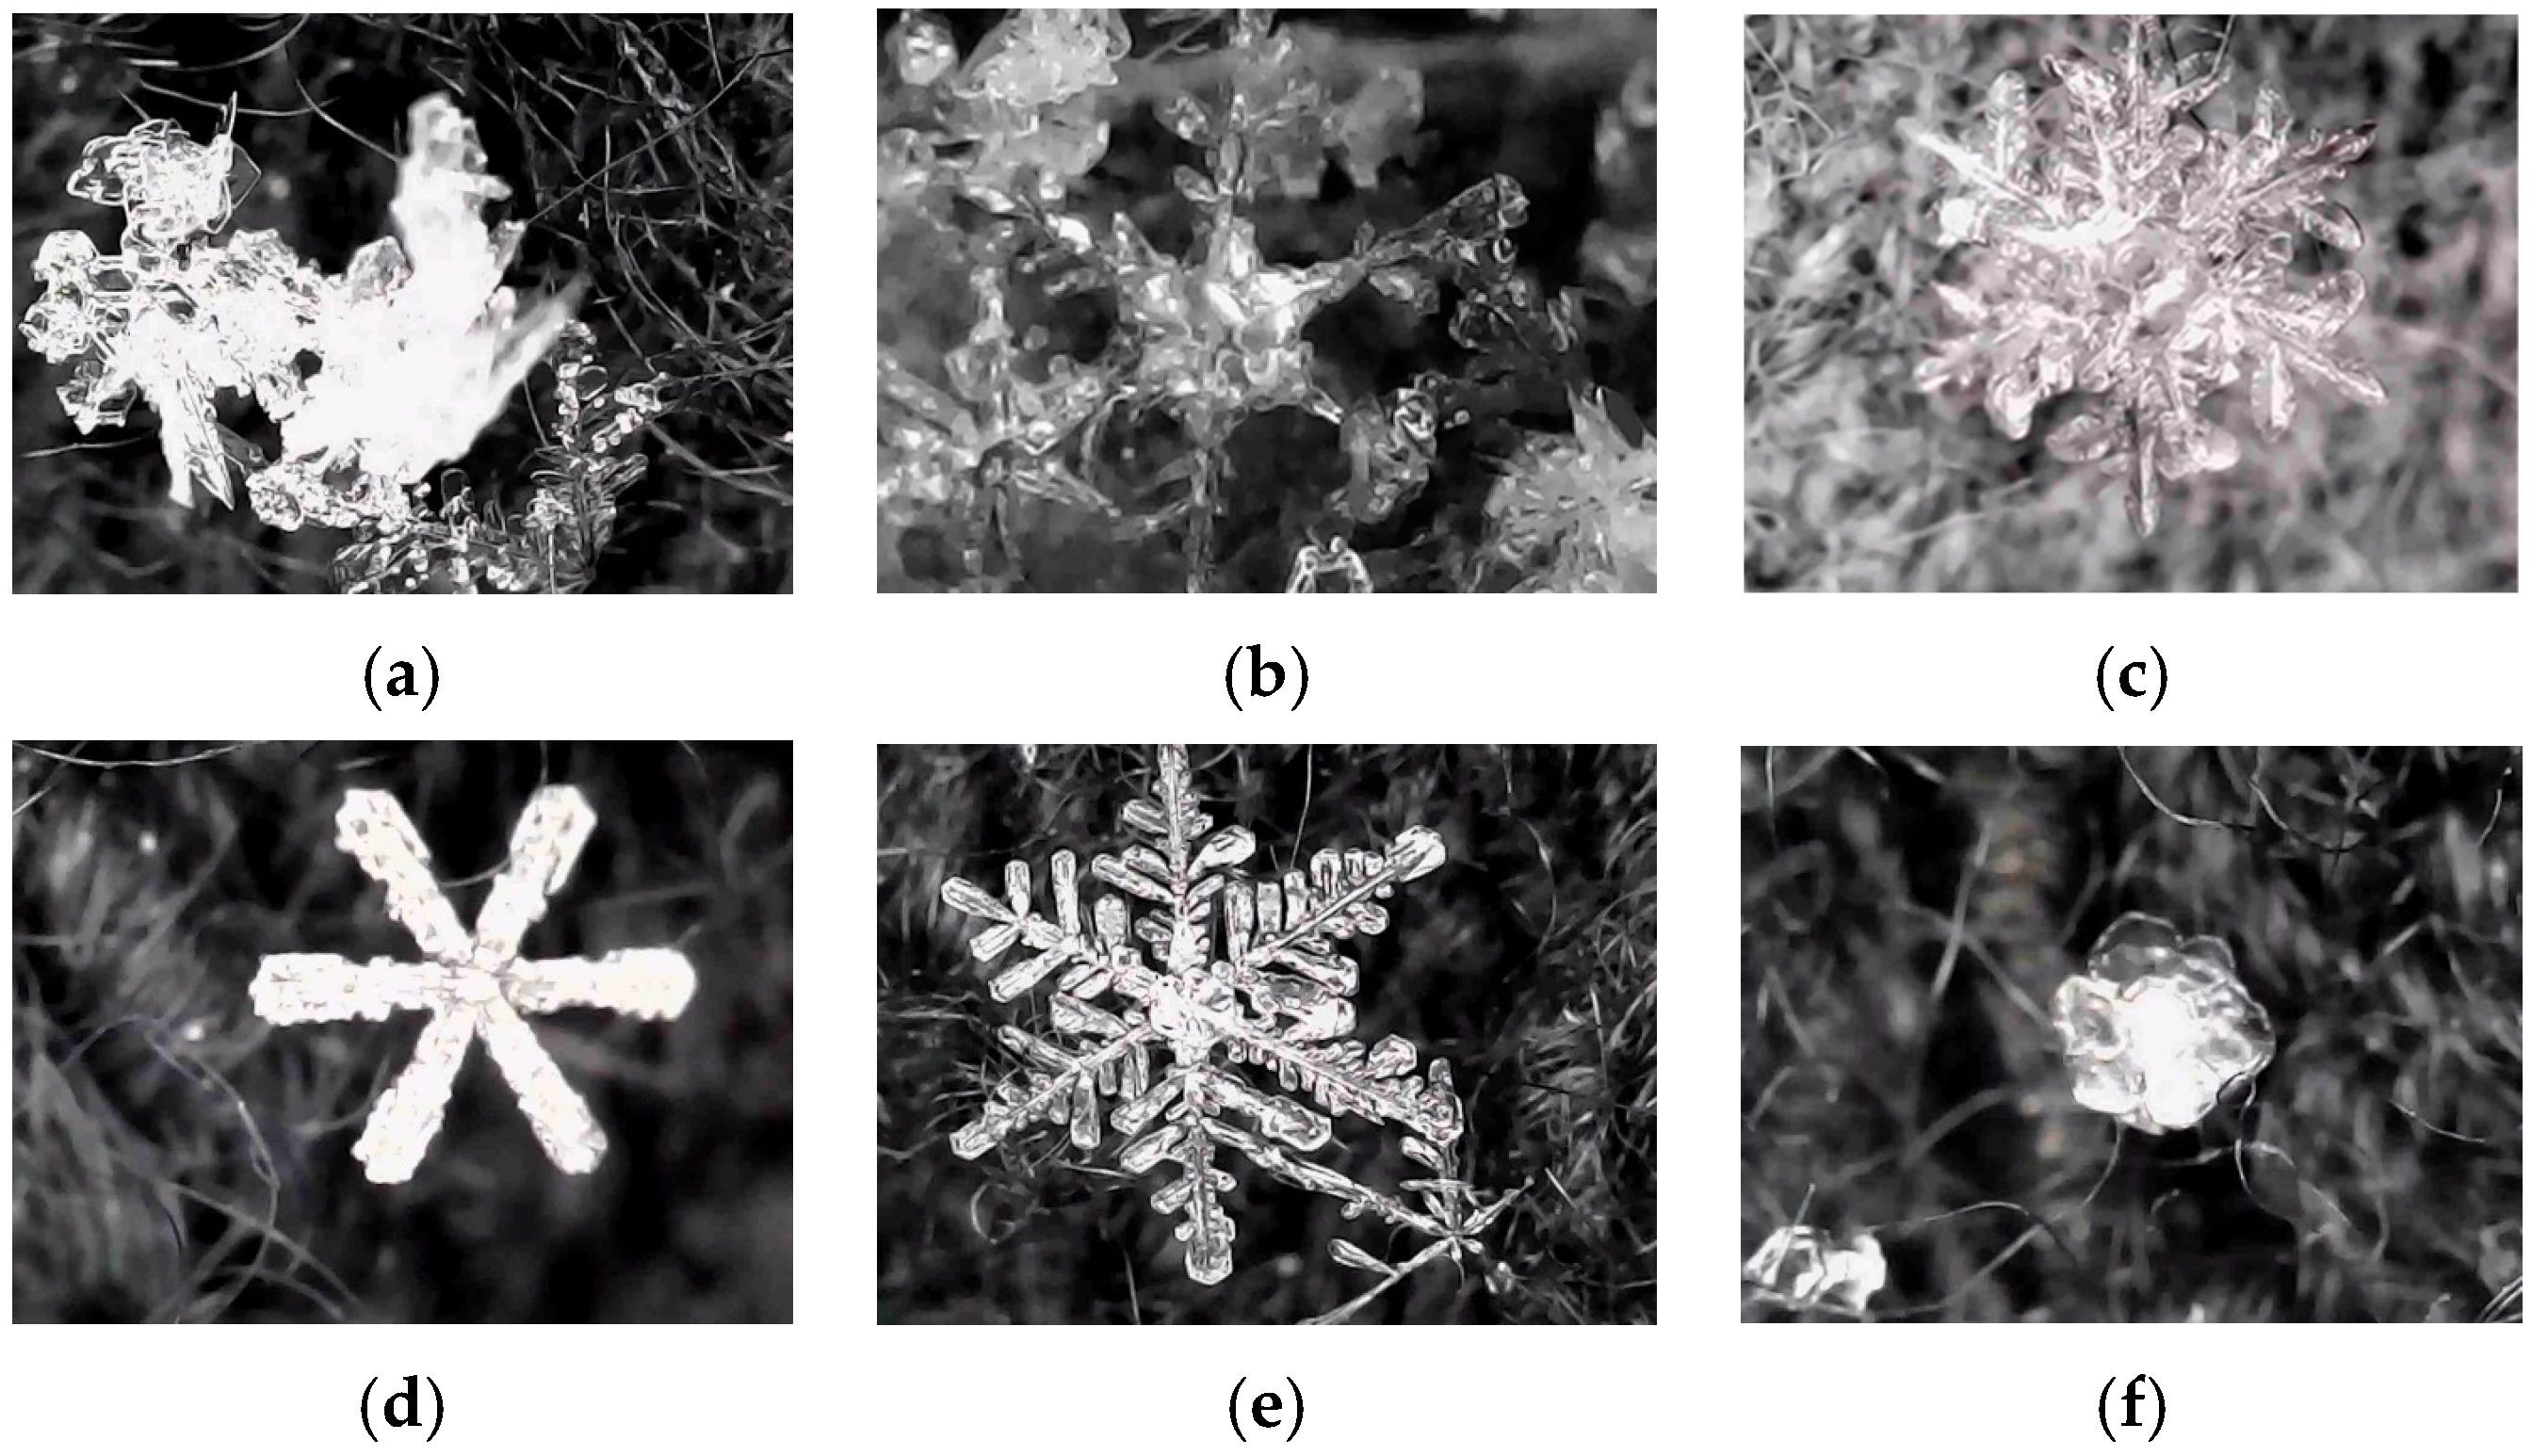
Figure 1. Observations of snow particle morphologies and daily meteorological data in Harbin during the winter of 2022–2023: (a) aggregated form on 12 November (a temperature of −2 °C and a humidity of 73%); (b) rosette form on 24 November (a temperature of −4 °C and a humidity of 66%); (c) plate form on 25 November (a temperature of −9 °C and a humidity of 91%); (d) rosette form on 10 February (a temperature of −3 °C and a humidity of 82%); (e) plate form on 11 February (a temperature of −5 °C and a humidity of 92%); (f) spherical form on 1 March (a temperature of −2 °C and a humidity of 92%).
Buildings 15 03606 g001
Figure 2. Simulator of Natural Action of Wind-Rain-Heat-Snow for Space Structures: (a) test section of the wind tunnel; (b) particle seeding device.
Buildings 15 03606 g002
Figure 3. Schematic diagram of the experimental settings.
Buildings 15 03606 g003
Figure 4. Experimental inflow profiles: (a) normalized averaged wind velocity; (b) turbulence intensity.
Buildings 15 03606 g004
Figure 5. Computational domain settings.
Buildings 15 03606 g005
Figure 6. Computational grids for the flat-roofed building with various resolutions: (a) coarse mesh; (b) basic mesh; (c) fine mesh.
Buildings 15 03606 g006
Figure 7. Contour of the airflow streamwise velocity on the central vertical cross-section of the flat-roofed building.
Buildings 15 03606 g007
Figure 8. Comparisons of snow distributions on the flat roof between the test and simulation: (a) overall dimensionless snow depths hs/href on the flat roof; (b) dimensionless snow depth hs/href profiles along the central axis of the flat roof.
Buildings 15 03606 g008
Figure 9. Specification of computational domain and boundary conditions for numerical modeling of snowdrifts on flat roofs.
Buildings 15 03606 g009
Figure 10. Spatial distribution of the Reynolds number Re on the central vertical cross-section of the flat-roofed building (inflow wind velocity UH = 4 m/s at the eave height).
Buildings 15 03606 g010
Figure 11. Distributions of drag coefficients CD for various snow particle morphologies on the central vertical cross-section of the flat-roofed building: (a) spherical form; (b) rosette form; (c) aggregated form; (d) plate form.
Buildings 15 03606 g011
Figure 12. Distributions of vertical velocities for various snow particle morphologies Us,z on the central vertical cross-section of the flat-roofed building: (a) spherical form; (b) rosette form; (c) aggregated form; (d) plate form.
Buildings 15 03606 g012
Figure 13. Distributions of dimensionless snow volume fraction αs/αin near the flat roof with various snow morphologies: (a) spherical form; (b) rosette form; (c) aggregated form; (d) plate form.
Buildings 15 03606 g013aBuildings 15 03606 g013b
Figure 14. Distributions of dimensionless snow depths hs/href on the flat roof with various morphologies: (a) spherical form; (b) rosette form; (c) aggregated form; (d) plate form.
Buildings 15 03606 g014aBuildings 15 03606 g014b
Figure 15. Dimensionless snow depth profiles across flat roofs of different spans after the accumulations of four types of snow particles: (a) a span of 10 m; (b) a span of 20 m; (c) a span of 30 m.
Buildings 15 03606 g015
Figure 16. Snow distribution characteristics on the single-pitched roof resulting from deposition of snow hs,dep/href with various morphologies: (a) spherical form; (b) rosette form; (c) aggregated form; (d) plate form.
Buildings 15 03606 g016
Figure 17. Wind-induced dimensionless erosive snow depths hs,ero/href on the single-pitched roof with the consideration of various morphologies: (a) spherical form; (b) rosette form; (c) aggregated form; (d) plate form.
Buildings 15 03606 g017
Figure 18. Distributions of final dimensionless snow depths hs/href on the single-pitched roof with various morphologies: (a) spherical form; (b) rosette form; (c) aggregated form; (d) plate form.
Buildings 15 03606 g018
Figure 19. Dimensionless snow depth profiles across single-pitched roofs of different slopes after the accumulations of four types of snow particles: (a) a slope of 20°; (b) a slope of 25°; (c) a slope of 30°.
Buildings 15 03606 g019
Table 1. Empirical drag coefficient formulas for non-spherical snow particles with different morphologies [36,37].
Non-Spherical Snow CrystalsDrag CoefficientNo.
Plate C D = 1.048 1 + 8.3603 R e 2  Re < 10,000(7)
Rosette C D = 0.545 1 + 8.11 R e 2  Re < 10,000(8)
Aggregate C D = 0.55 1 + 10.66 R e 2  Re < 10,000(9)
Table 2. Typical calculated similarity numbers for prototype and scaled test.
No.Similarity NumberPrototypeScaled Test
1 ρ a ρ s U 2 g L ( 1 3.5 v d s u t U 0 U ) 0.0020.002
2 ρ a ρ s ρ a u t 2 g d s 3.26 × 10−56.53 × 10−5
3 U TER T L 0.170.20
4 S d U TER 15.612.5
5 u u t 1.111.04
Disclaimer/Publisher’s Note: The statements, opinions and data contained in all publications are solely those of the individual author(s) and contributor(s) and not of MDPI and/or the editor(s). MDPI and/or the editor(s) disclaim responsibility for any injury to people or property resulting from any ideas, methods, instructions or products referred to in the content.