1. Introduction
In recent years, climate change has received massive attention [
1]. Among the sectors that should be managed for climate change effects, the building industry is one of the most vital sectors because it directly impacts the health and well-being of humans. This industry is also regarded as a major contributor to climate change, primarily because it consumes a large amount of energy and natural resources and generates a significant carbon footprint [
2,
3]. In 2020, buildings and the construction industry were responsible for more than 36% of global final energy consumption and 37% of global process-based carbon emissions [
4]. Energy consumption and greenhouse gases (GHGs) emanate from various building phases, including the construction, operation, and maintenance phases of the built environment. Owing to the high energy consumption and associated emissions, there is a critical obligation to reduce energy consumption in buildings and mitigate carbon dioxide emissions. Therefore, the adoption of renewable energy is increasing through the assessment of available domestic technologies and the integration of these systems into both current and future buildings. The aim is to reduce dependency on fossil fuels and lower carbon emissions [
5].
There are buildings, such as libraries of higher educational institutes, that have fixed schedules of operation, which can be attributed to a significant amount of energy [
6]. The operational schedule of buildings varies based on several factors, including the type, location, and operating hours of buildings. Consequently, the number of occupants in a building significantly impacts energy consumption, primarily through heating, cooling, ventilation, and lighting systems during workdays and weekends. The lack of knowledge of occupancy numbers, patterns, and schedules in buildings during different periods can lead to energy loss [
7,
8]. Notably, these factors vary across different academic terms and vacations. This makes occupancy data of educational buildings more challenging to collect and generalize over the entire year when compared with occupancy data of office buildings, which tend to have a stable rate of occupancy numbers [
9]. Educational buildings in the United Kingdom (UK) account for more than 10% of the nation’s total service energy consumption, with 2% attributed to primary and secondary schools and the remaining 8% to tertiary institutions [
10]. Overall, buildings used for higher education studies are significant GHG emission contributors, mainly because some buildings, such as those used as libraries, are active throughout the day and night (24/7) [
11,
12,
13]. In such buildings, the heating, ventilation, and air conditioning (HVAC) systems tend to operate across all zones from early morning until the end of the day based on the assumption that the building is occupied at maximum capacity, which could lead to significant energy wastage if the building is unoccupied [
14,
15]. The common belief is that occupants consume more energy during working hours. However, several studies have indicated that, in commercial buildings, more than 50% of energy wastage occurs during unoccupied or out-of-working hours [
16,
17,
18].
Occupancy data are often overlooked during the building design process, particularly when estimating energy consumption, regardless of their direct impact on building energy consumption [
19]. Educational buildings with high occupancy rates have not been studied sufficiently. They can be attributed to a significant energy performance gap, mainly based on projections made during their design phases compared with actual data observed during the operation phase [
20,
21]. Various tools for building energy simulations have been used in previous studies for several types of buildings. The simulation models were developed for various reasons, including analyzing the simulated energy consumption, predicting future energy consumption, reducing the gap between actual and simulated energy consumption, and measuring the impact of building occupants on building energy consumption.
A study conducted by Englund et al. [
22] developed a simulation model to investigate the impact of occupant presence on the energy consumption of a school building. Field measurements were conducted to collect occupancy data, energy consumption, and temperature for five months to be used as input for the IDA ICE simulation tool. The results of the developed simulation model were evaluated during a non-occupied period of six days, showing a variation of 9.6%, equal to 139 kWh, which was higher than the actual consumption data. Another evaluation was performed during working hours for a period of 46 days, which showed a variation of up to 10.6%. Mokhtari and Jahangir [
23] examined the effect of occupant distribution on the energy consumption of HVAC systems at a university building. Random sets of occupancy patterns were distributed in the building to measure the energy consumption differences of each pattern. EnergyPlus was used to evaluate energy consumption based on occupancy patterns over ten days in one-hour intervals. The results of the study illustrate occupants’ energy consumption for five workdays during the hot and cold seasons. The proposed model was able to reduce energy consumption by 28% when limiting student time in the classroom, which is obviously not practicable. Litardo et al. [
24] developed a simulation model using EnergyPlus and OpenStudio to estimate the energy consumption of a building on a university campus. Several datasets, including occupancy data, HVAC system, lighting, and equipment consumption, were collected over one year in monthly intervals. The collected and estimated data focused on office hours during working days, ignoring the weekends and holidays. The simulation results in estimated energy consumption for one year on a monthly basis, with a 6% reduction in energy consumption. Bernardo et al. [
25] developed building energy simulation models to measure the effect of improving ventilation systems on energy consumption in a school building. Energy consumption data was collected for 12 months. A simulation model was developed using DesignBuilder software package V3. Several inputs were used, including the building envelope, HVAC system, thermal zones, internal loads, and weather data. Due to the lack of data on occupancy numbers and energy consumption, the study used a thermal zone equivalent for different spaces. A total of 83 thermal zones in the building were considered. These inputs were used in developing the simulation model to estimate one year of energy consumption at a resolution of one month. The estimated energy consumption was lower than the actual energy consumption in the building, which indicates the importance of occupancy data.
Lee et al. [
26] developed a building energy simulation model to examine the effect of occupant presence in residential buildings on energy consumption. A survey was conducted in over 5000 single-person households to generate a profile of occupant activity schedules. The data collected were clustered based on occupancy characteristics, including age, gender, occupation, and income. A 3D geometry model of the buildings was modelled using the Google SketchUp plugin version 2017, and the collected occupancy data was used as the input to develop a building energy simulation model using EnergyPlus. The results of the simulation show a variation of over 20 times from 446 kWh to 926 kWh based on occupant characteristics. In another study, Mora et al. [
27] investigated the importance of incorporating occupancy profiles into estimating energy consumption using a building energy simulation model. The preferences of occupant energy usage were collected from 110 residential buildings through surveys, interviews, and energy bills. DesignBuilder software was employed to use the collected data as input for developing a building energy simulation model. The model results show energy consumption for one day at hourly intervals based on the input of occupancy profiles of the different zones in buildings. The influence of occupants on energy consumption varies based on several factors, including building type, occupant activity, and thermal gain. Martinaitis et al. [
28] used EnergyPlus and DesignBuilder software to simulate the energy consumption of a one-story apartment building. The default occupancy schedule was based on the simulation tools provided for four building occupants. The model estimated energy consumption at one-hour intervals for one year. The results showed a considerable difference in energy consumption in relation to the different inputs of the occupancy profiles. Electrical and heat energy consumption increased by 6% and 12%, respectively, with the assumption of two occupants in the building. Another assumption was that increasing the operating building system for occupants led to a 30% increase in energy consumption for heating. These results show that changing the schedule of operation based on occupant profiles increases energy consumption.
A study conducted by Asadi et al. [
29] developed a building energy simulation model using EnergyPlus to measure the differences between the actual impact of occupants on energy consumption and the simulation results. The case study took place in an office building. The energy consumption data was collected over six months using sensors linked to the primary circuits in the building. Several inputs were used to develop the model, including occupancy schedule, building envelope, thermal properties, weather data, and the schedules of the HVAC systems. The effects of occupant behavior on building energy consumption were collected through surveys. The results of the study in simulating energy consumption showed high accuracy compared with the occupant behavior information collected from the surveys. Pang et al. [
30] aimed to generate occupancy schedules for office buildings based on the occupancy location data. The occupant positions were detected for six months using smartphone signals. Several types of data were collected to be used in estimating building energy consumption, including the occupancy schedule, building envelope, building scheme, internal loads, and HVAC and lighting systems. The simulation results of using EnergyPlus showed that occupancy smartphone positioning could help increase simulation accuracy. Zhao et al. [
31] developed a simulation model using EnergyPlus to optimize the energy consumption of an HVAC system. The occupancy data was collected from an office building for three months, in addition to a web-based survey that was conducted to collect data on thermal comfort. The EnergyPlus program uses occupancy schedules, equipment and lighting usage, and weather data as inputs. The energy consumption of the HVAC system was simulated for seven days. The results indicate that energy consumption could be reduced while maintaining occupant thermal comfort. Chenari et al. [
32] developed an energy simulation model using EnergyPlus and OpenStudio to examine ventilation systems in office space. Occupancy schedules and carbon dioxide data collected to be used as inputs. Four scenarios were simulated for one day at one-hour intervals based on the occupancy schedule and the level of carbon dioxide concentration in the office room. The results showed the potential for energy savings of 15% when increasing the ventilation system’s minimum setpoint.
The comprehensive review of the available studies revealed several gaps in examining case study buildings and the methods used for data collection. One notable gap is the lack of occupancy data for specific building types, such as higher education buildings, which have not been studied as extensively as residential and office buildings. This gap is attributed to the stochastic behavior of occupants, high density, and the challenges in accurately collecting occupancy data in these buildings. Another limitation involves the method of data collection, such as using ambient sensors. There are uncertainties associated with these technologies, as sensors can be affected by rapid changes in air temperature or carbon dioxide levels caused by opening windows or doors. Furthermore, studies conducted on higher education buildings have often limited their data collection to small areas and short time frames.
This study aims to measure the impact of occupancy numbers on energy consumption in a high-density higher education building by addressing the following objectives:
To preprocess and organize a full year of raw energy consumption data to enable comprehensive and accurate analysis.
To develop a building energy simulation model that incorporates real occupancy patterns and building characteristics as input variables.
To estimate the energy consumption of the case study building under varying occupancy rates and across different periods of the day, capturing temporal usage dynamics.
To analyze the statistical relationships between actual energy consumption and occupant presence.
To evaluate the impact of varying occupancy levels on total building energy consumption.
3. Results and Discussion
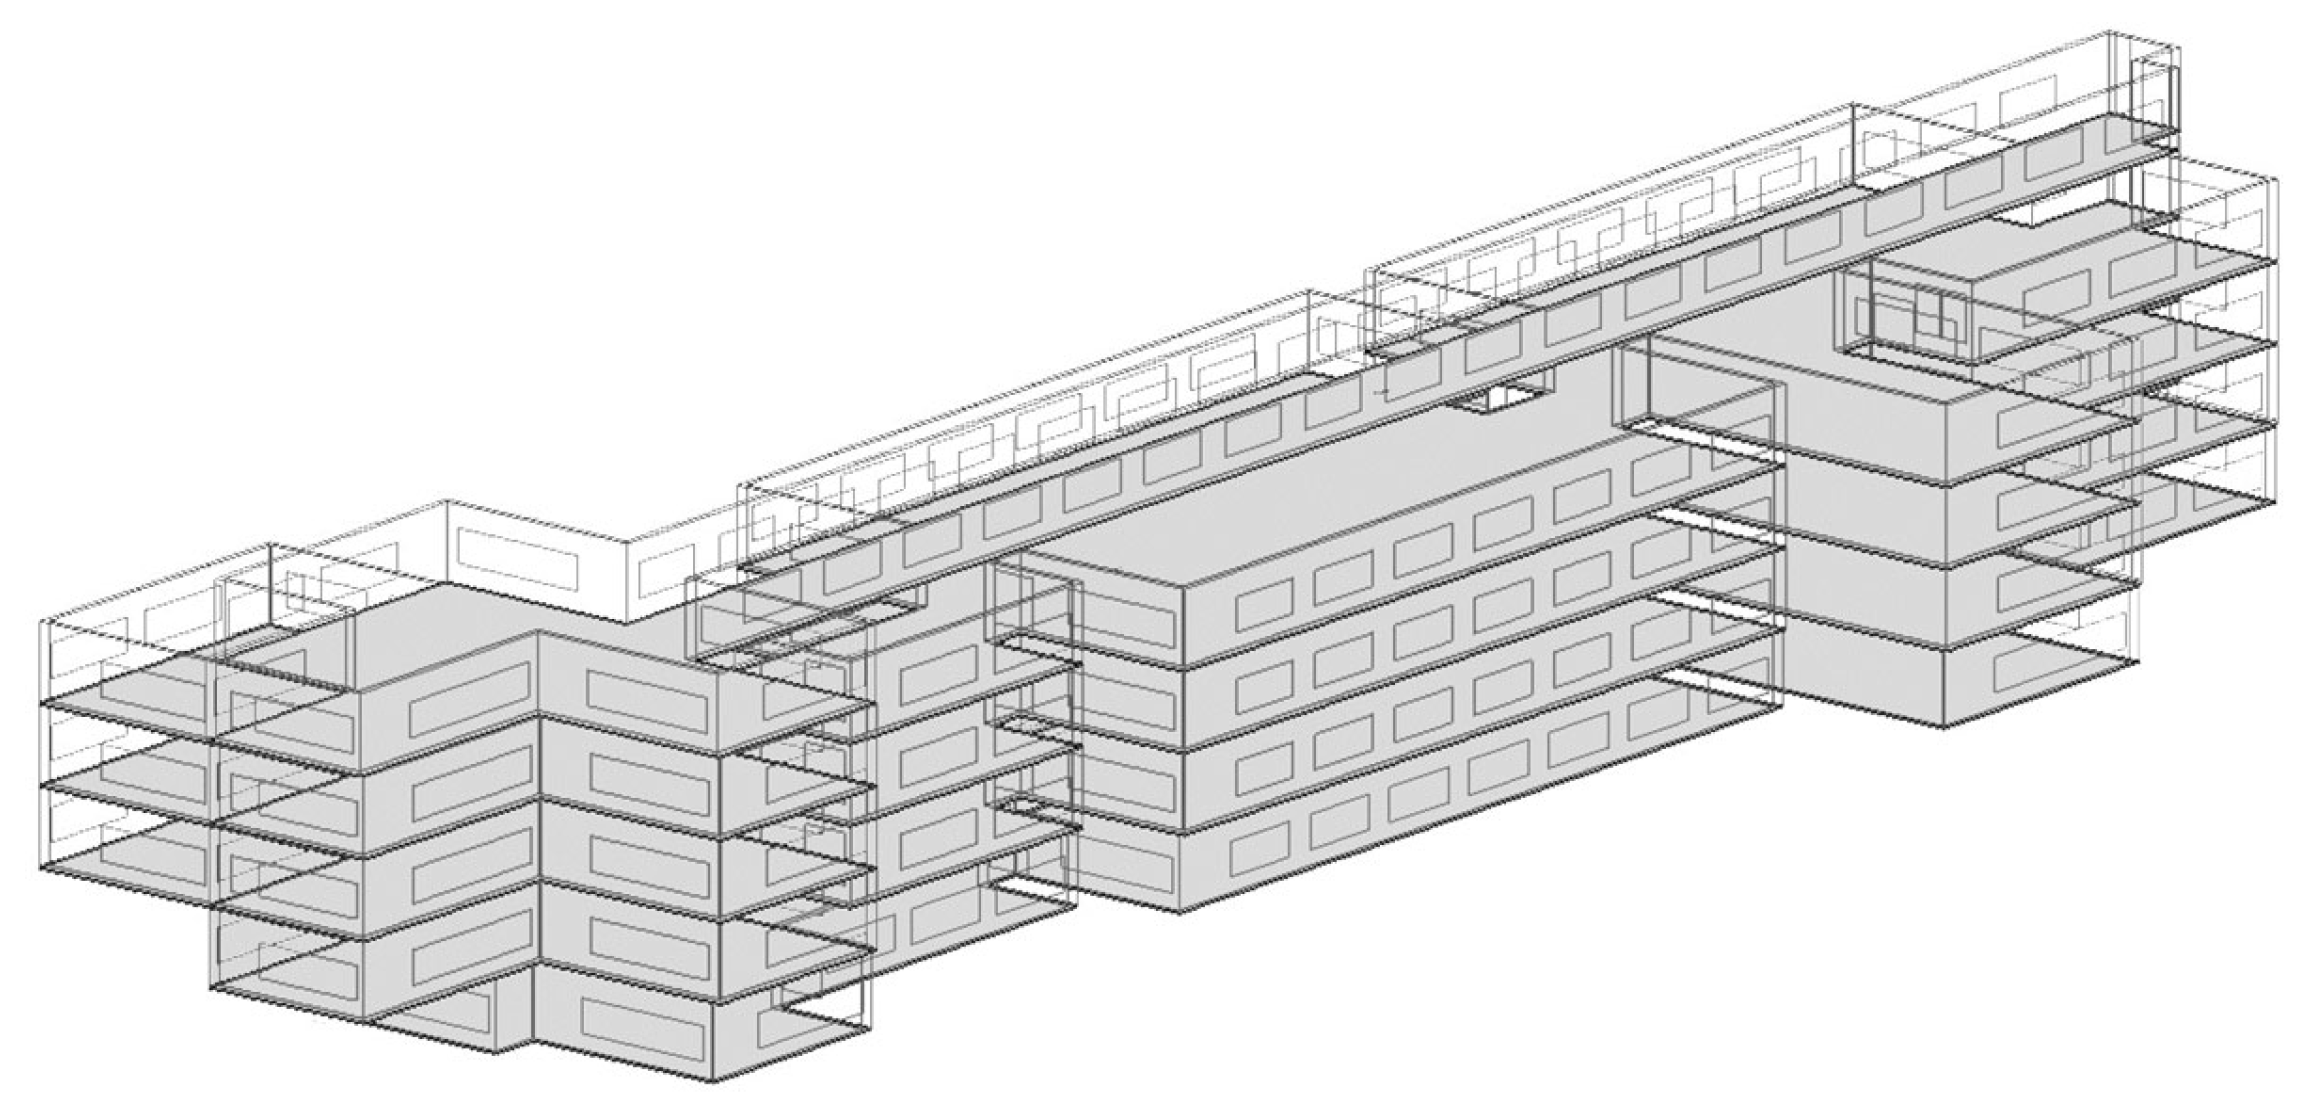
This section presents the study results, starting with the identified occupancy patterns from the collected data in the case study of the URS building. It is followed by a process to analyze the one-year actual energy consumption data that was derived from building facility management. The developed 3D energy model is utilized to estimate energy consumption based on actual occupancy data. Then it is used to measure the impact on building energy consumption under various occupancy rates.
3.1. Occupancy Patterns
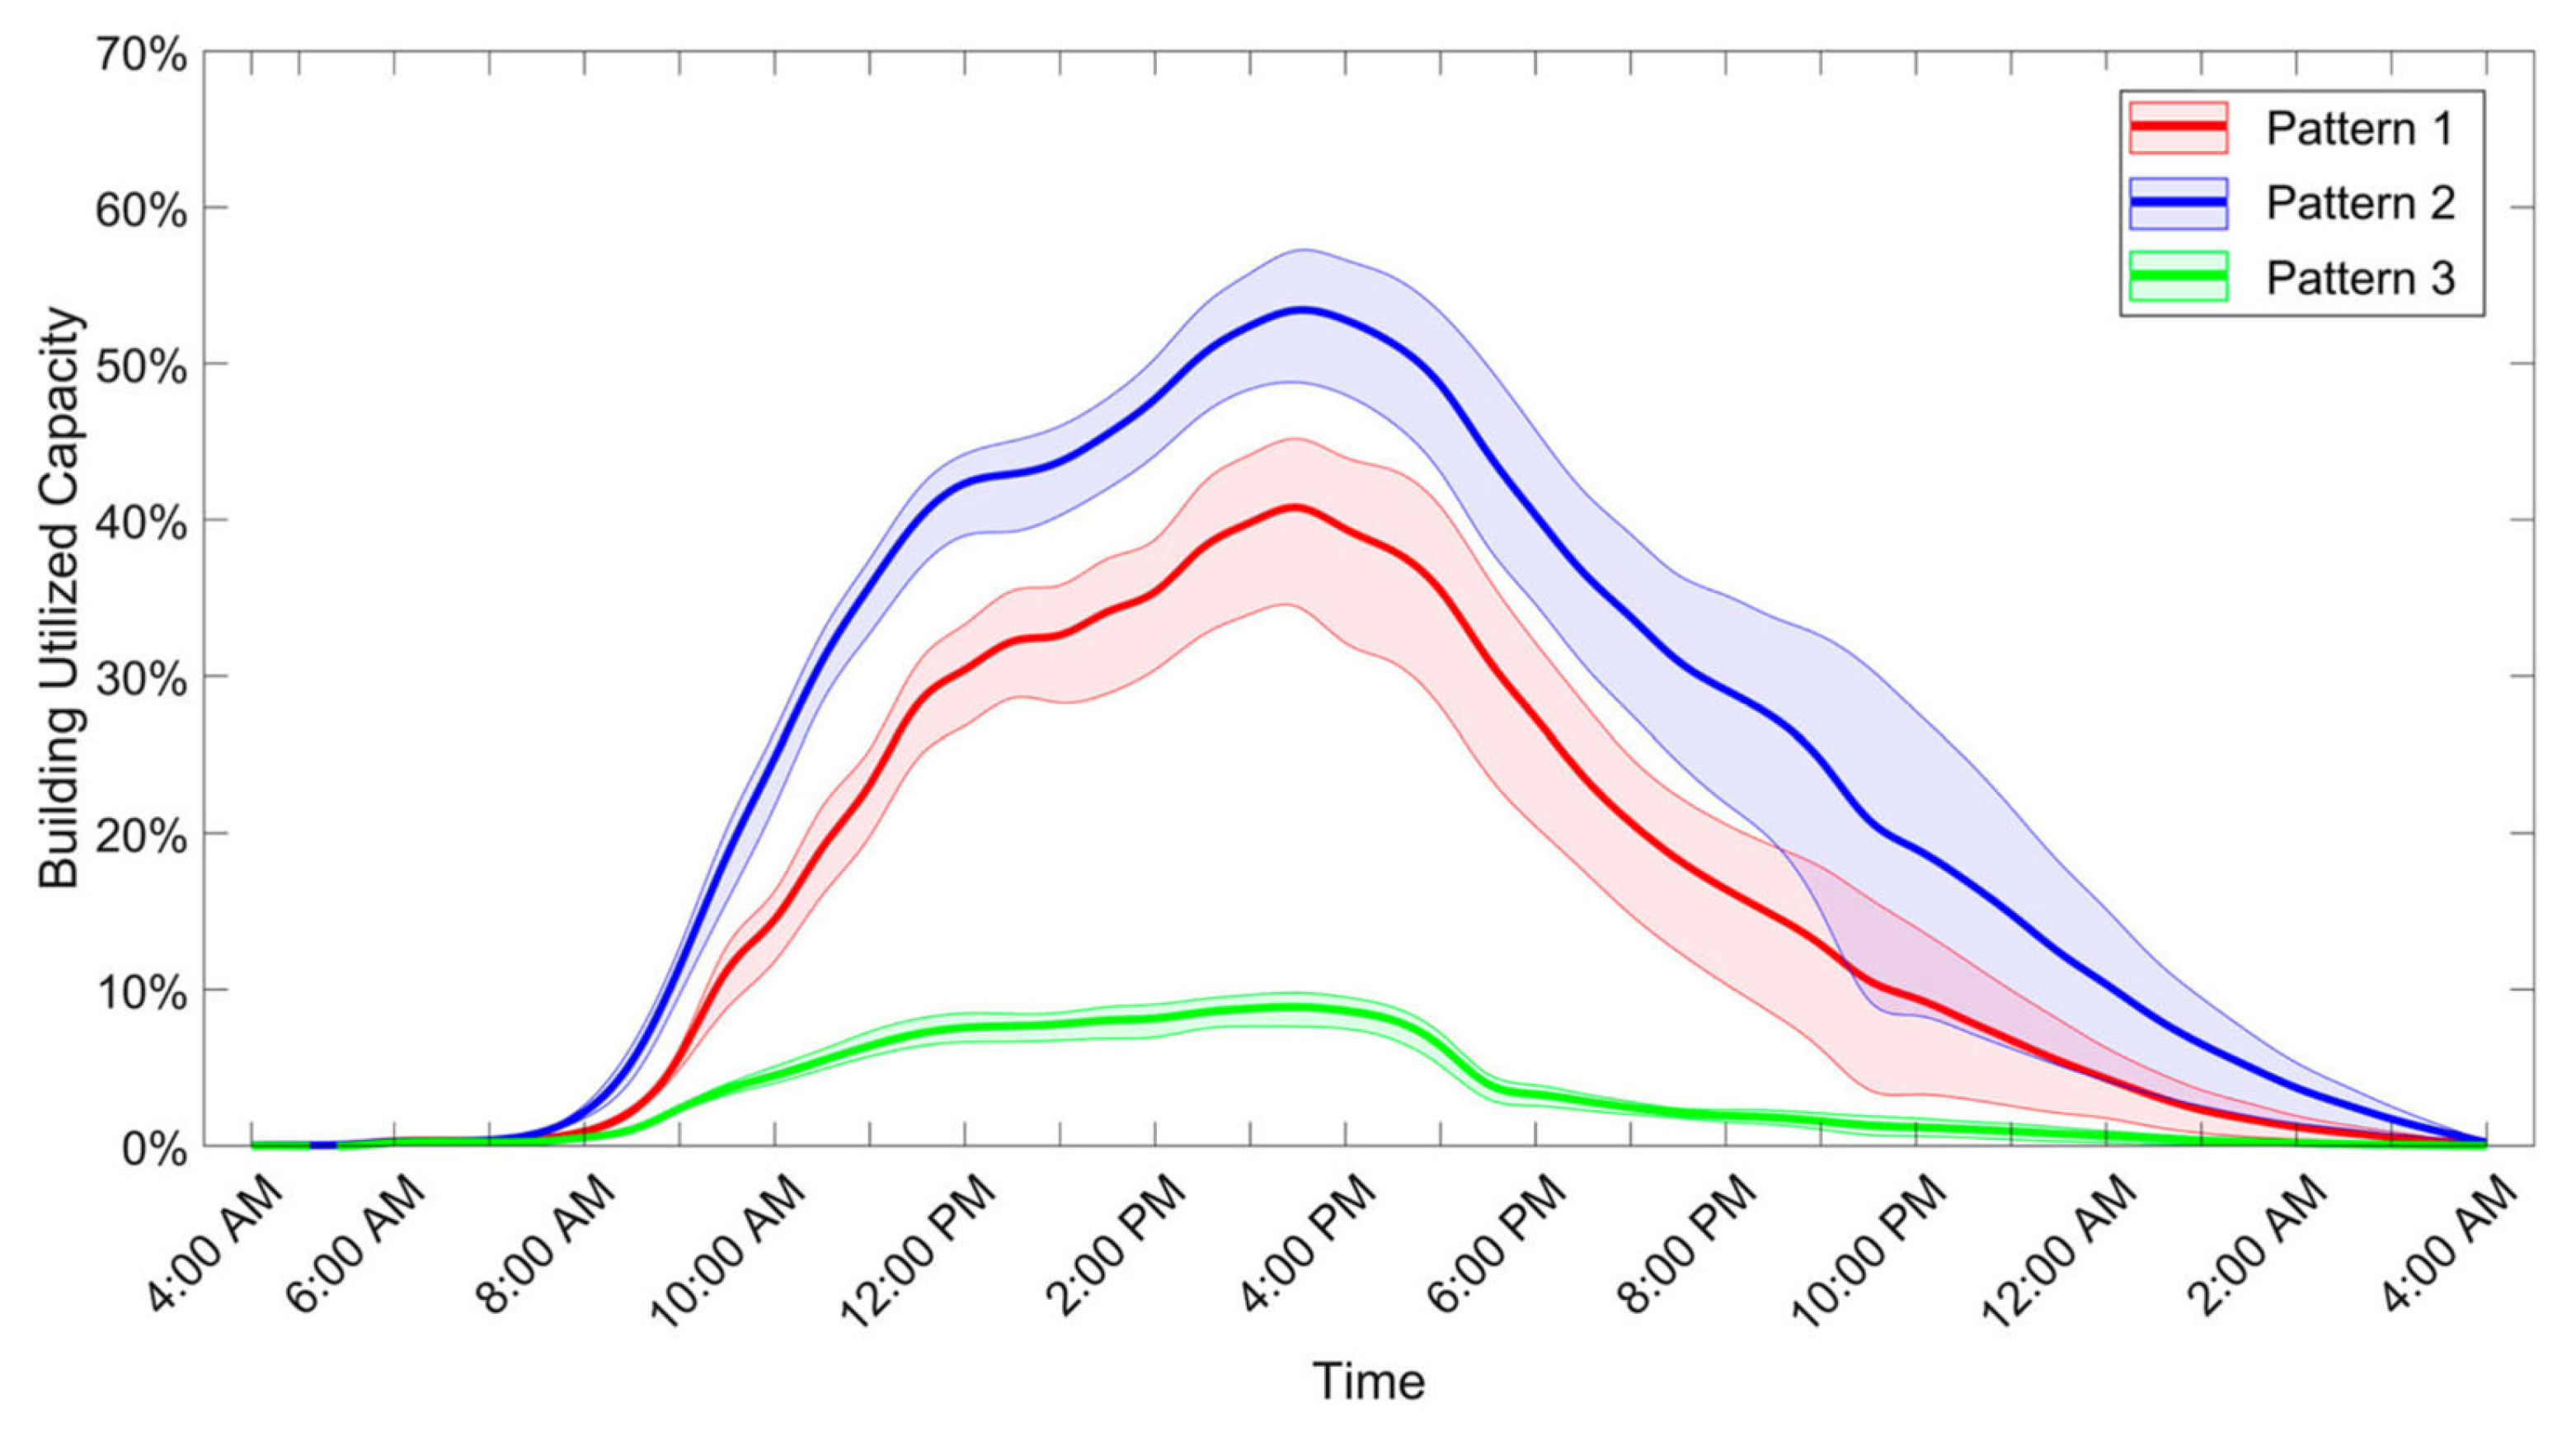
The occupancy data of the case study building were analyzed using several data analysis methods as presented in Alfalah et al. [
36]. Three occupancy patterns were identified based on the presence of the occupants in the building. Pattern 1 represents a medium occupancy rate, Pattern 2 represents the highest occupancy rate, and Pattern 3 represents the lowest occupancy rate. The patterns were distributed over a one-day cycle as shown in
Figure 4 [
36]. There was a variation in the building’s occupied capacity between the identified patterns: 11% between Pattern 1 and Pattern 2, and 45% between Pattern 2 and Pattern 3. The variation in patterns related to the associated period, as the highest occupancy rate (Pattern 2) occurred during the examination period, the medium rate (Pattern 1) is seen at the start of the academic year, and the lowest occupancy rate (Pattern 3) appears during Summer Vacation and term.
3.2. Energy Consumption Data
The 12 months of raw electrical and heat energy consumption data from the case study building were analyzed to understand occupants’ behavior using correlation analysis. Additionally, this data served as input for the building energy simulation model.
The electrical energy consumption in the building is mainly used for lighting and library equipment, including desk lighting features, charging and socket plugs, computers, and printers.
Figure 5 illustrates the monthly energy consumption and the percentage changes from month to month over a 12-month period [
36]. Energy consumption has experienced a slight fluctuation over the months, being high at the beginning of the year. Followed by frequent fluctuations, and then lower energy consumption at the end of the year. There was a noticeable 17% decrease in energy consumption starting in May, representing the change in electrical energy consumption between April and May. Due to fewer occupants in the building during Summer Vacation from June to September, energy consumption decreased. Electrical energy consumption sharply increased by 62% in October compared to that in September, which was the most significant positive percentage change that occurred during the entire 12 months of the academic year. Quantitatively, the sharp increase in usage trend can be associated with the start of the academic term, when a high volume of occupants returns to the building after Summer Vacation. Notably, the most considerable percentage change in the descending trend occurred in December, during which there was a 52% reduction in energy consumption compared to November. This shows the difference in electrical energy consumption during different periods of the academic term and the vacation months.
Table 7 presents the results of performing descriptive analysis, including the monthly mean, median, standard deviation, minimum, and maximum energy consumption over 12 months [
36]. The highest average daily value of electrical energy consumption in the building (1169.52 kWh) was recorded in February, which is a month after the beginning of the academic term. In contrast, the lowest average daily energy consumption over the months was observed in July, during the Summer Vacation, at 584.45 kWh.
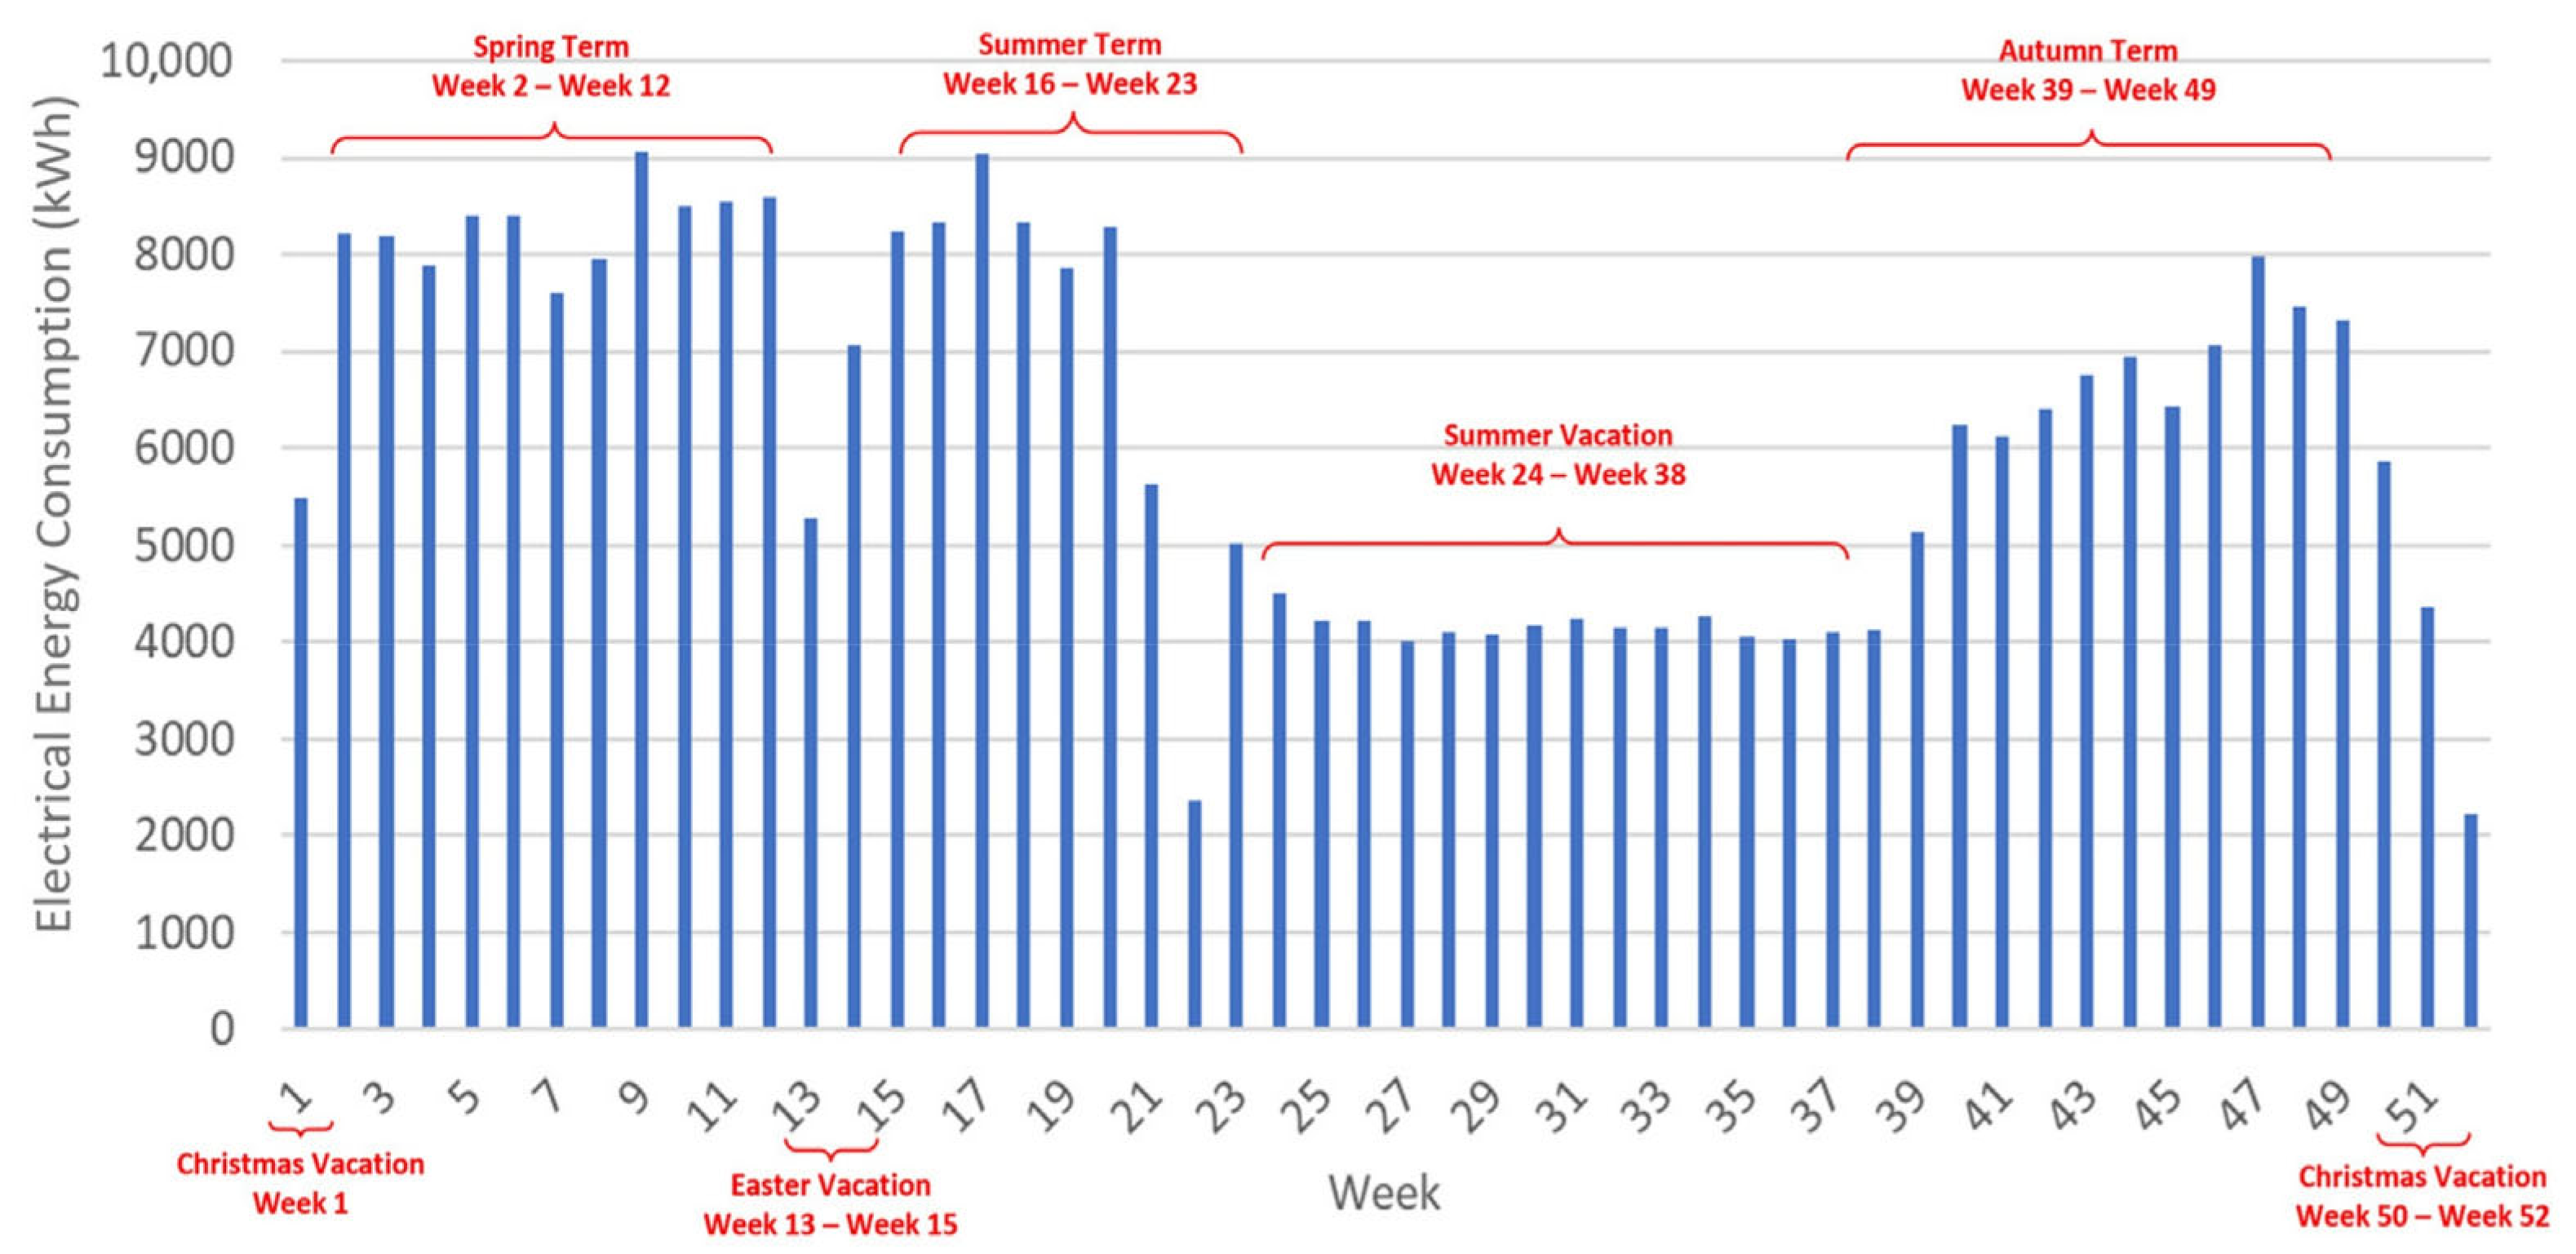
Figure 6 shows the total weekly electrical energy consumption of the building over a 52-week period. The duration of academic terms and vacations was identified, as well as showing the gradual changes in electrical energy consumption across consecutive weeks. During the academic terms (Spring, Summer, and Autumn terms), electrical energy consumption was high, which may be related to student workloads. However, during Summer Vacation (weeks 24–38), electrical energy consumption decreased sharply because the building was only open on workdays and closed at 5:00 p.m., which limited access hours. After Summer Vacation, energy consumption increased again in October (week 39) as students returned to the university and opening hours went back to 24 h during workdays. This indicates that electrical energy consumption was higher during the academic term than during the vacation period.
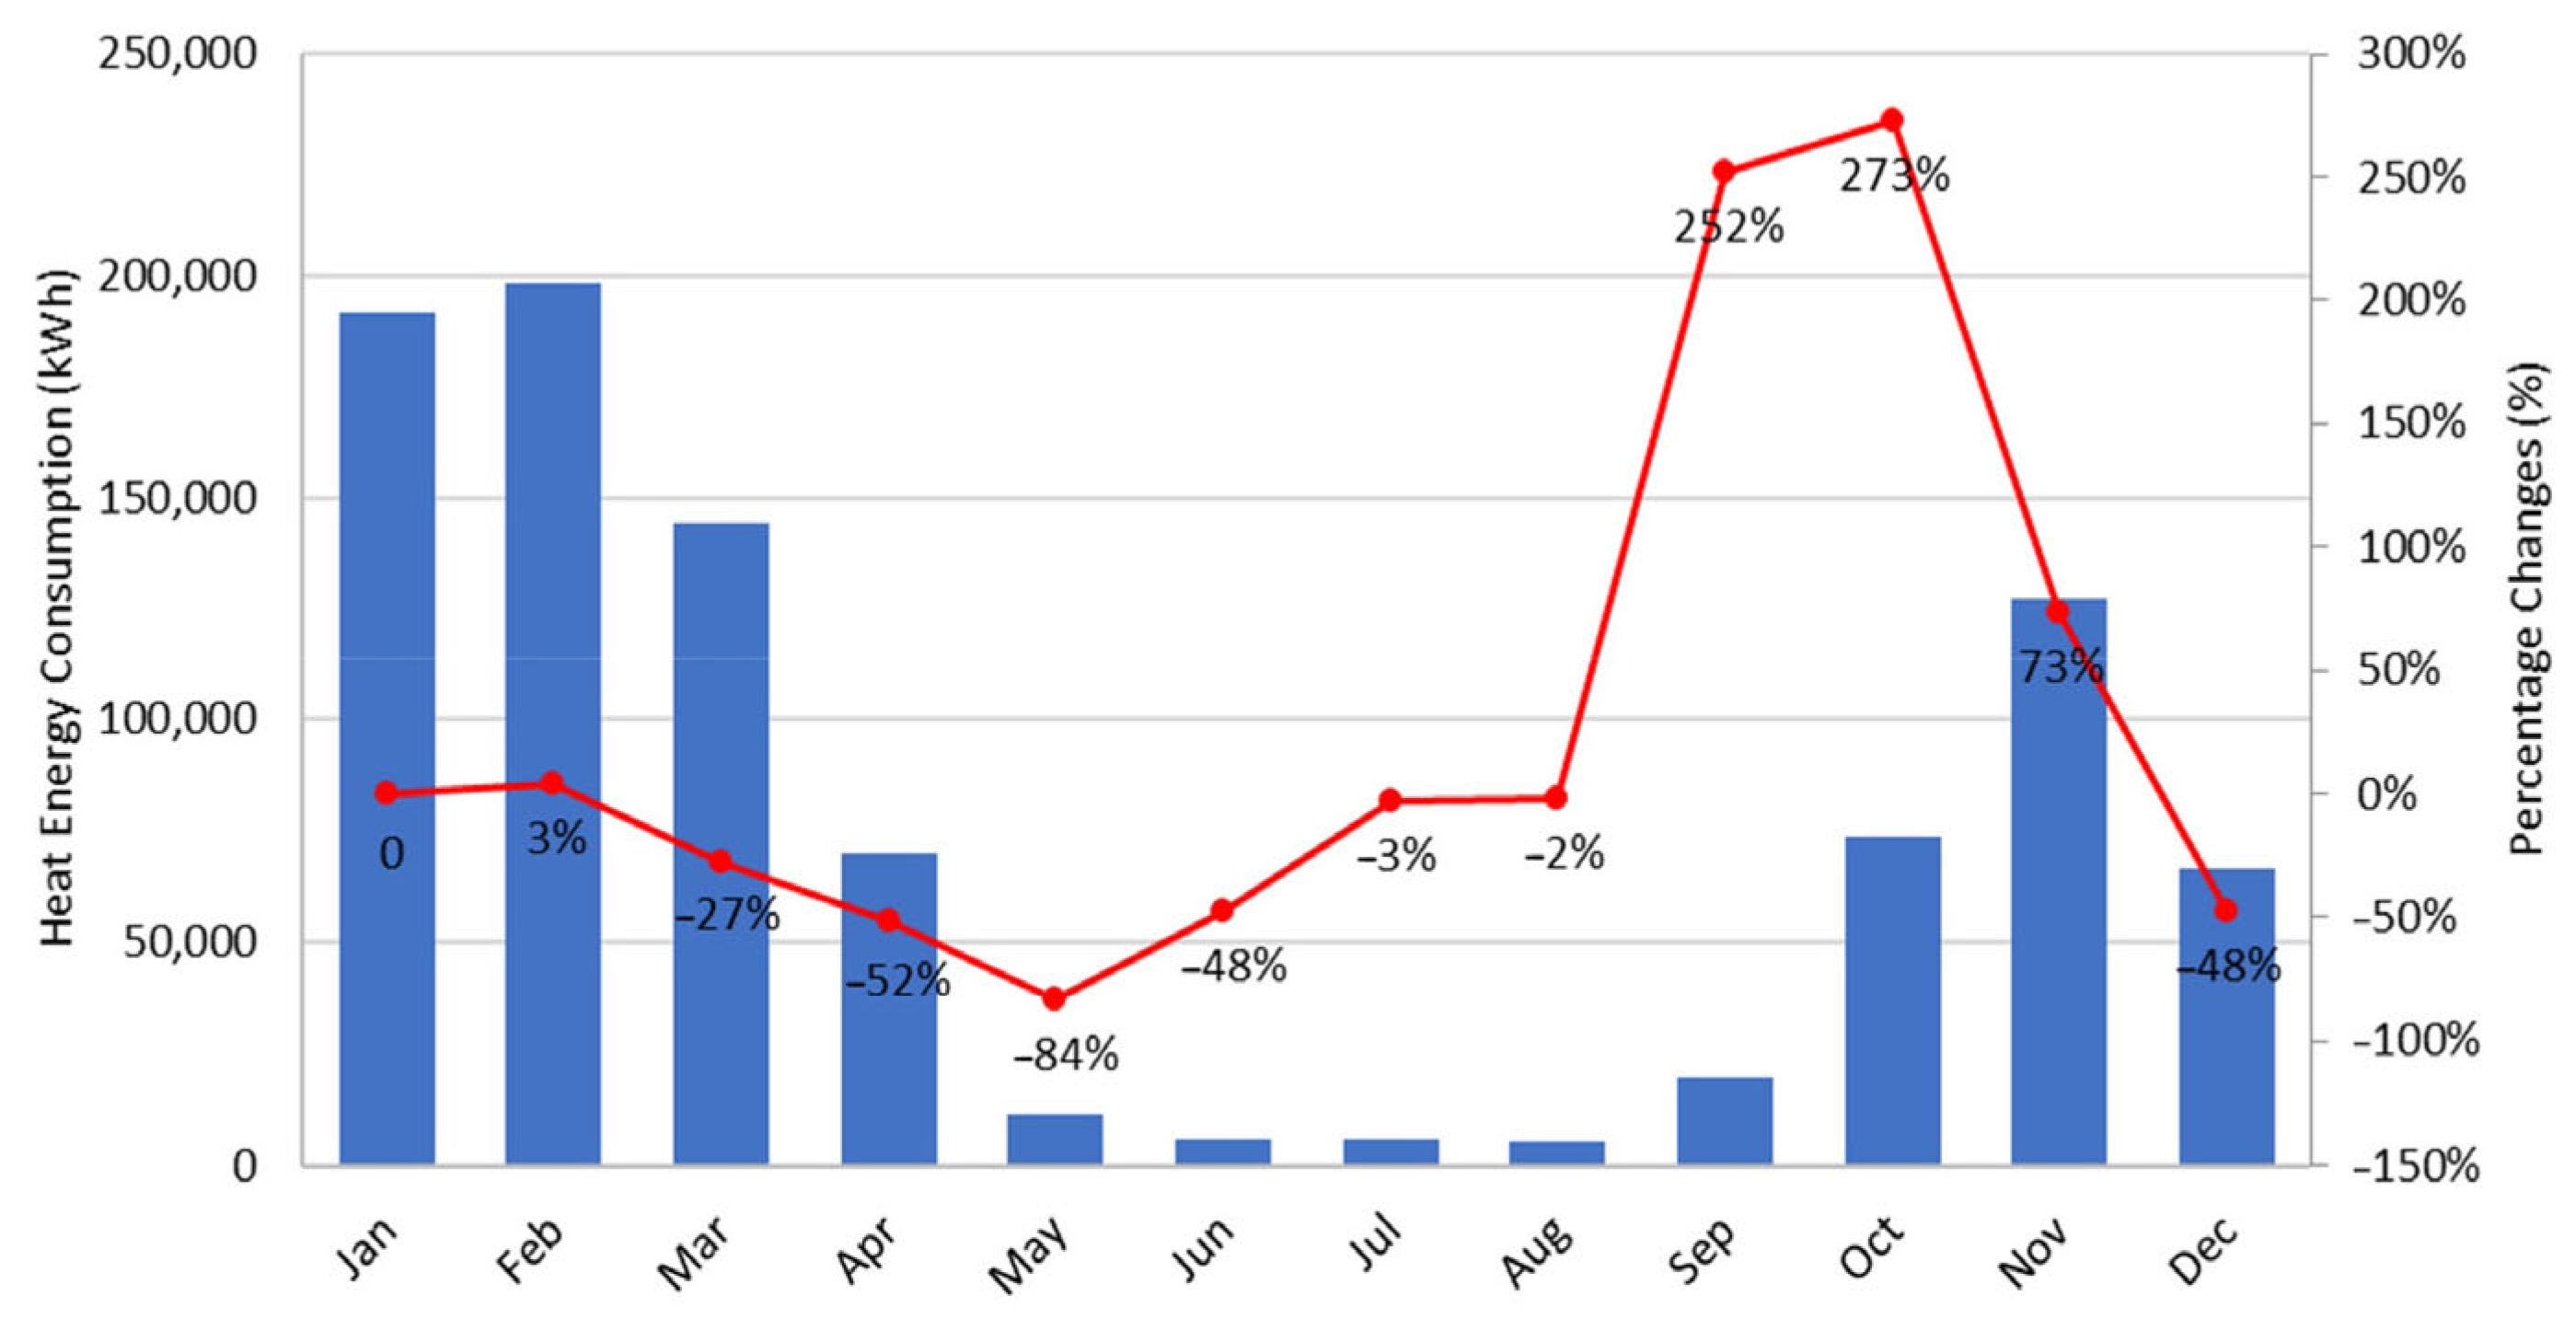
Figure 7 illustrates the monthly total heat energy consumption and the percentage changes from one month to another. Energy consumption started to decrease after an increase of 3% in February. A very low energy consumption was observed from May to September (during the Summer Vacation) compared to other months. The building’s heat energy consumption began to increase in October and then dropped in December.
Table 8 presents the results of performing descriptive analysis, including the daily mean, median, standard deviation, minimum, and maximum energy consumption over 12 months. It is observed that the highest energy consumption occurred during an academic term, which was in February, at 198,501 kWh. In contrast, the lowest energy consumption was during Summer Vacation (June to September), with an average of 5700 kWh. However, the URS building was still open with some hours restrictions during the workdays and closed during the weekends. The heat energy consumption in the building is primarily determined by its thermal performance rather than the number of occupants, since the occupants have no control over the building’s thermostat.
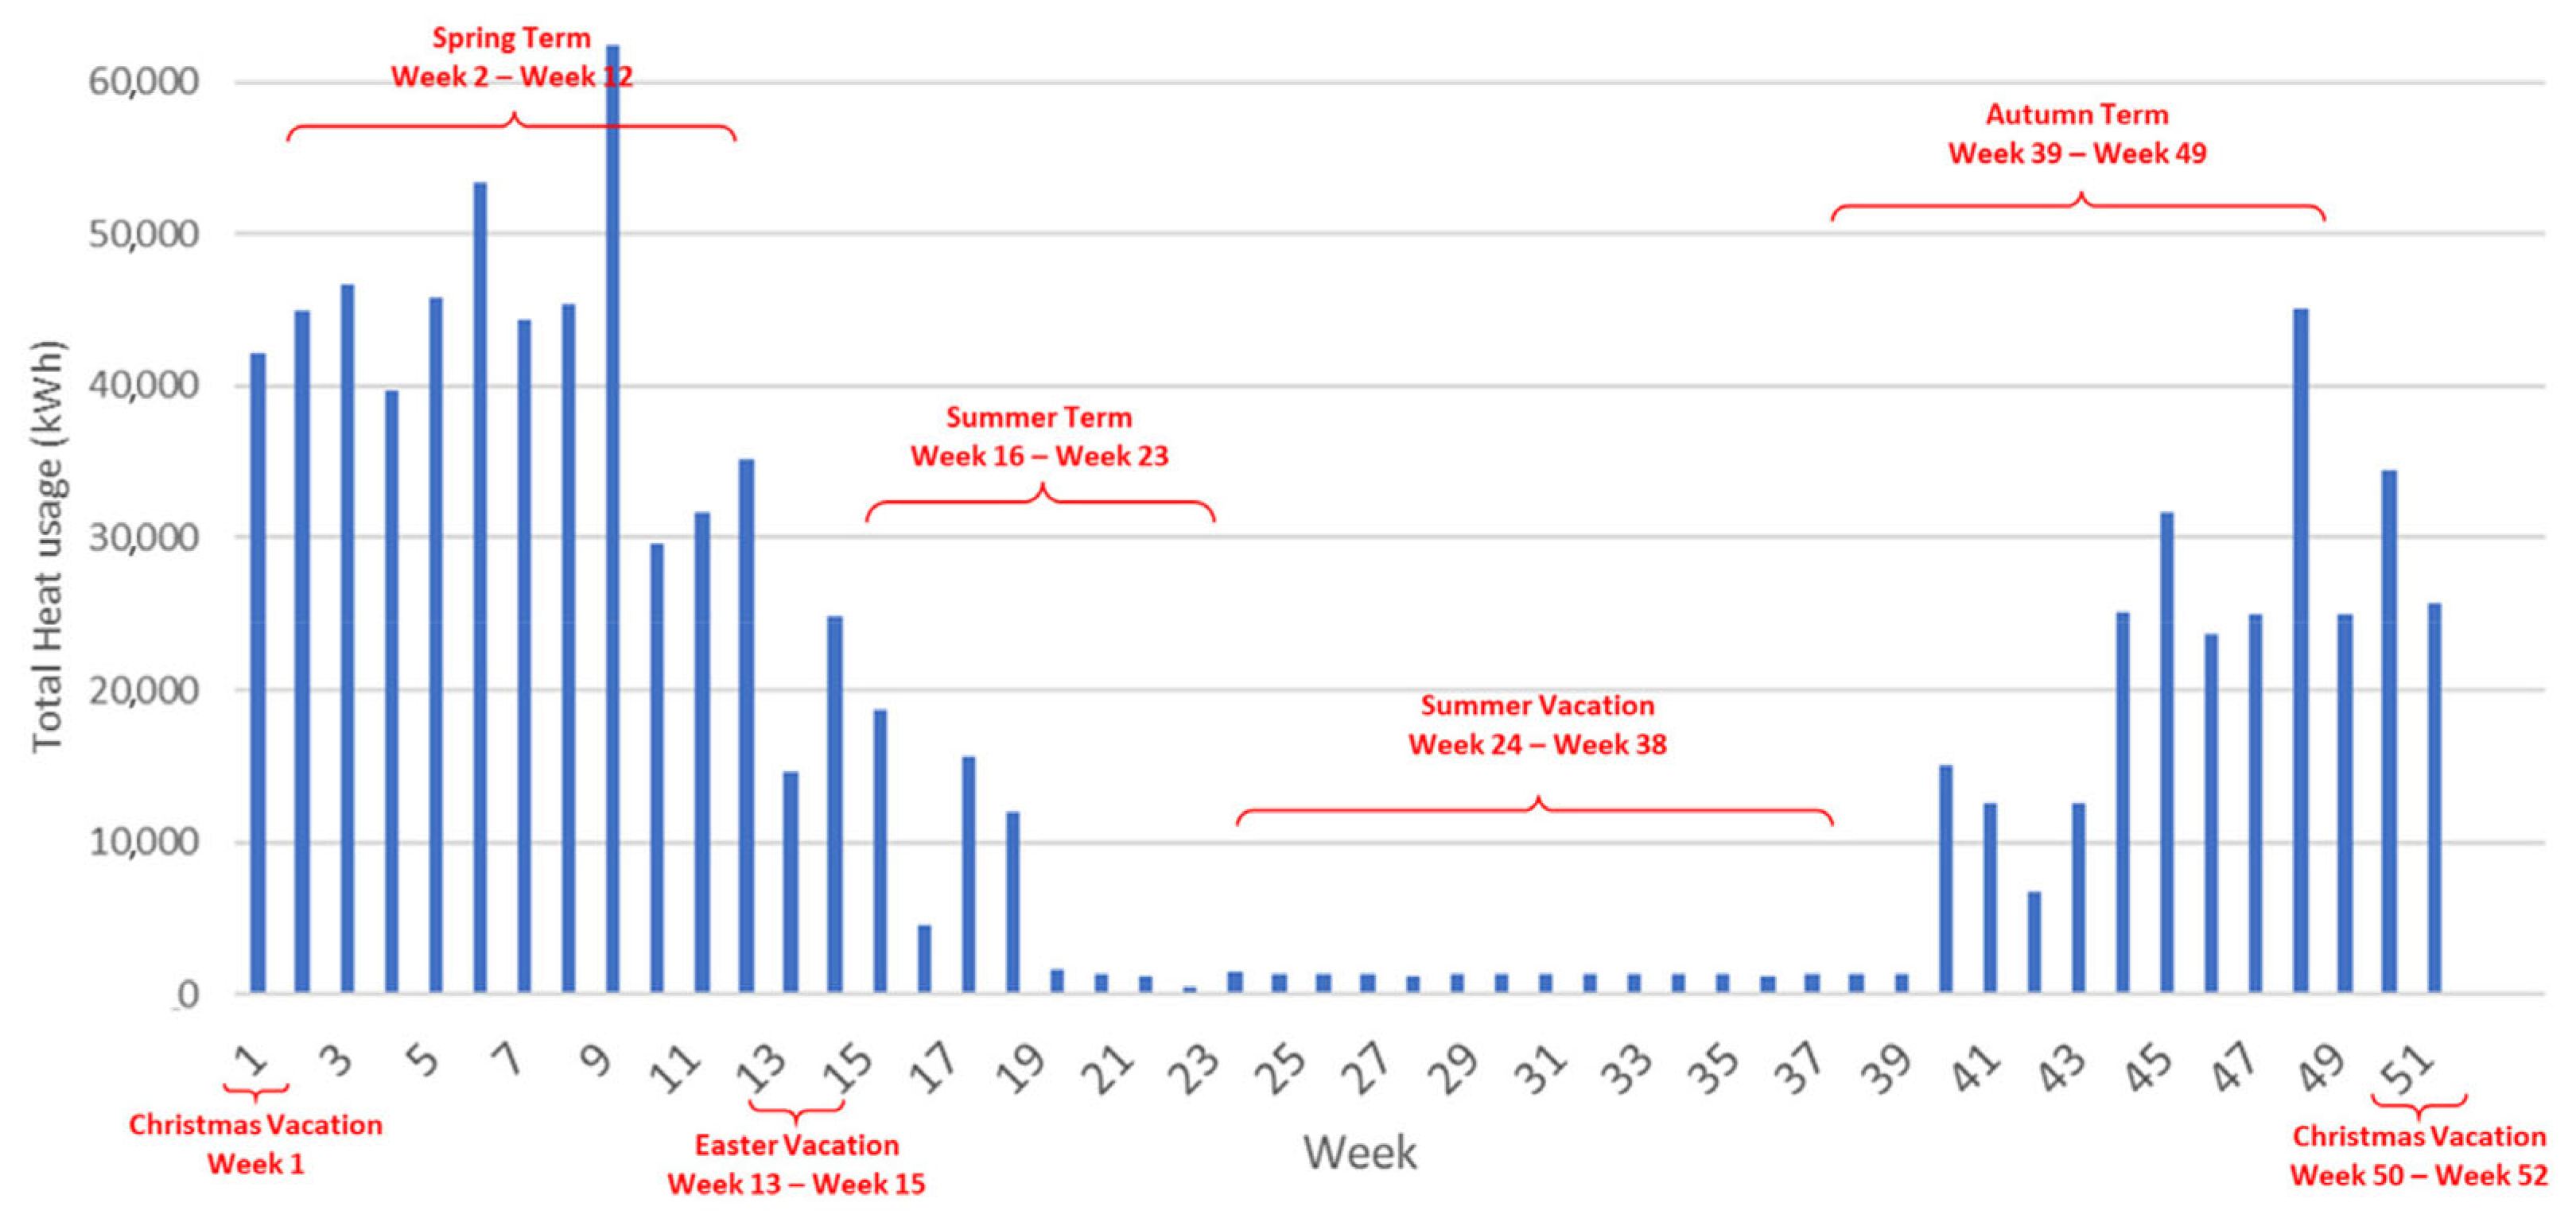
Figure 8 presents the total heat energy consumption data and the duration of the academic terms and vacations over 52 weeks. During the academic terms (Spring, Summer, and Autumn terms), the heat energy consumption gradually increased, then dropped at the end of the Summer Term. On the other hand, during the Summer Vacation, the heat energy consumption was low compared to other academic terms, as the library was only open on workdays and closed at 5:00 p.m. After Summer Vacation, the heat energy consumption increased again in October (week 39) as students returned to the university and the building opening hours went back to 24 h during workdays. The heat energy consumption was higher during the academic terms compared to the vacation periods.
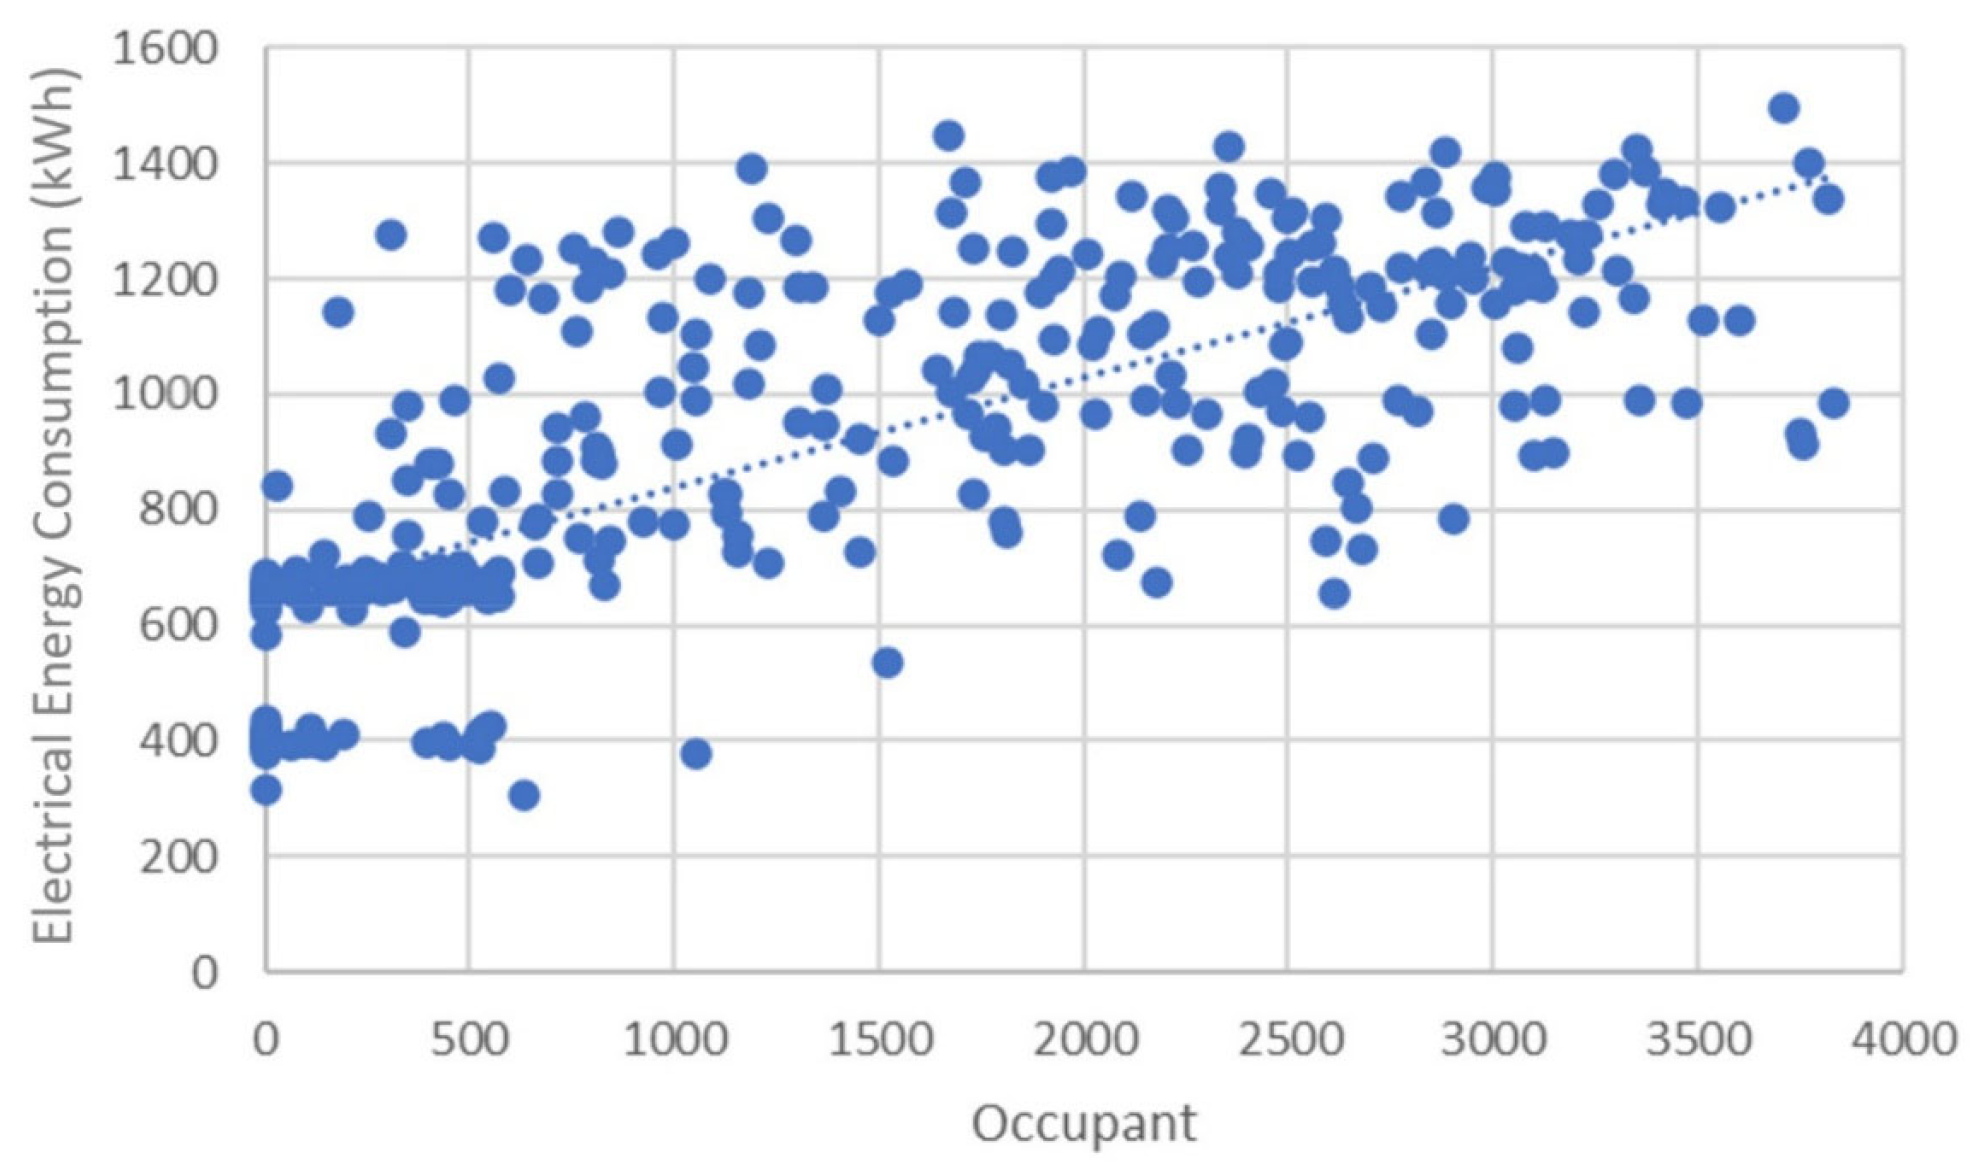
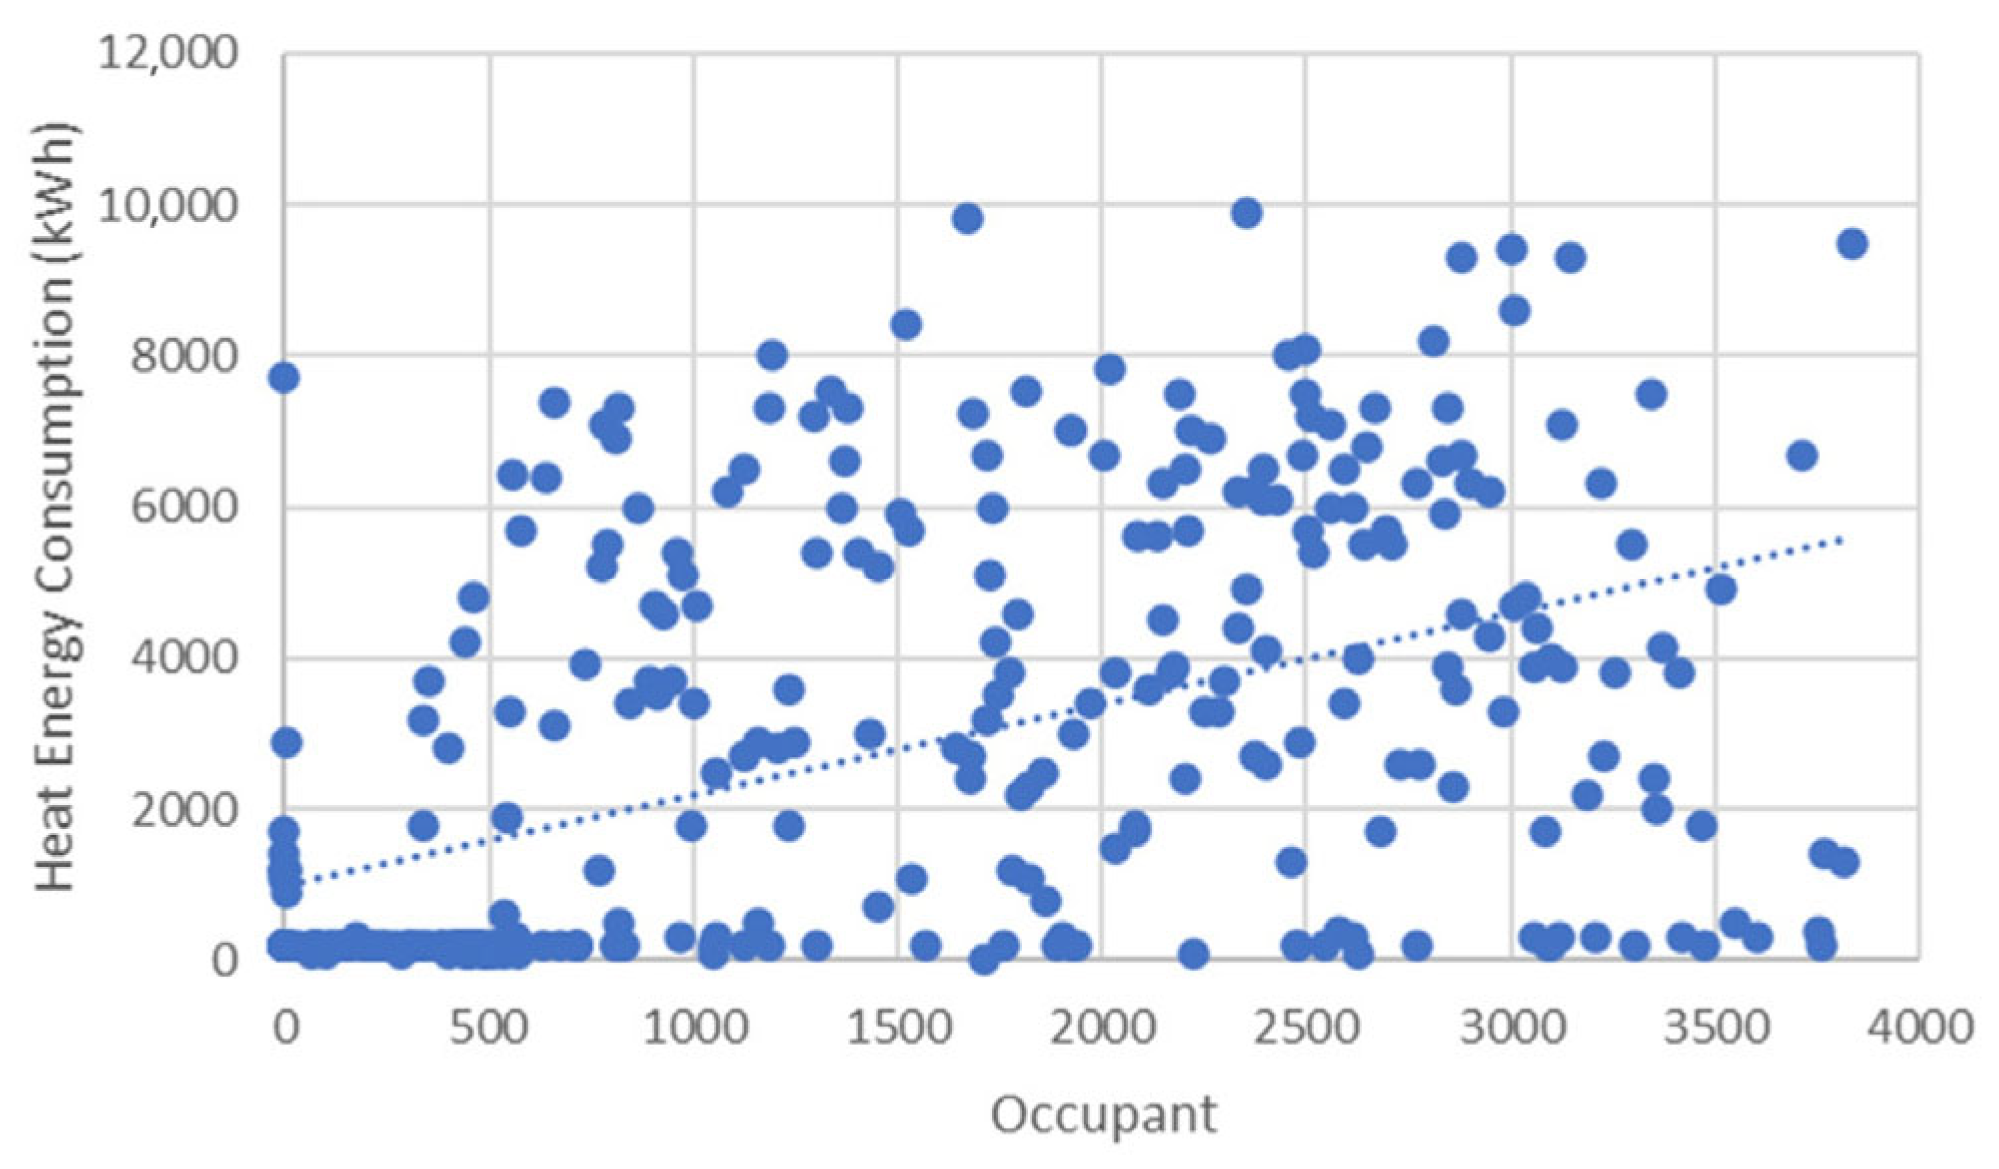
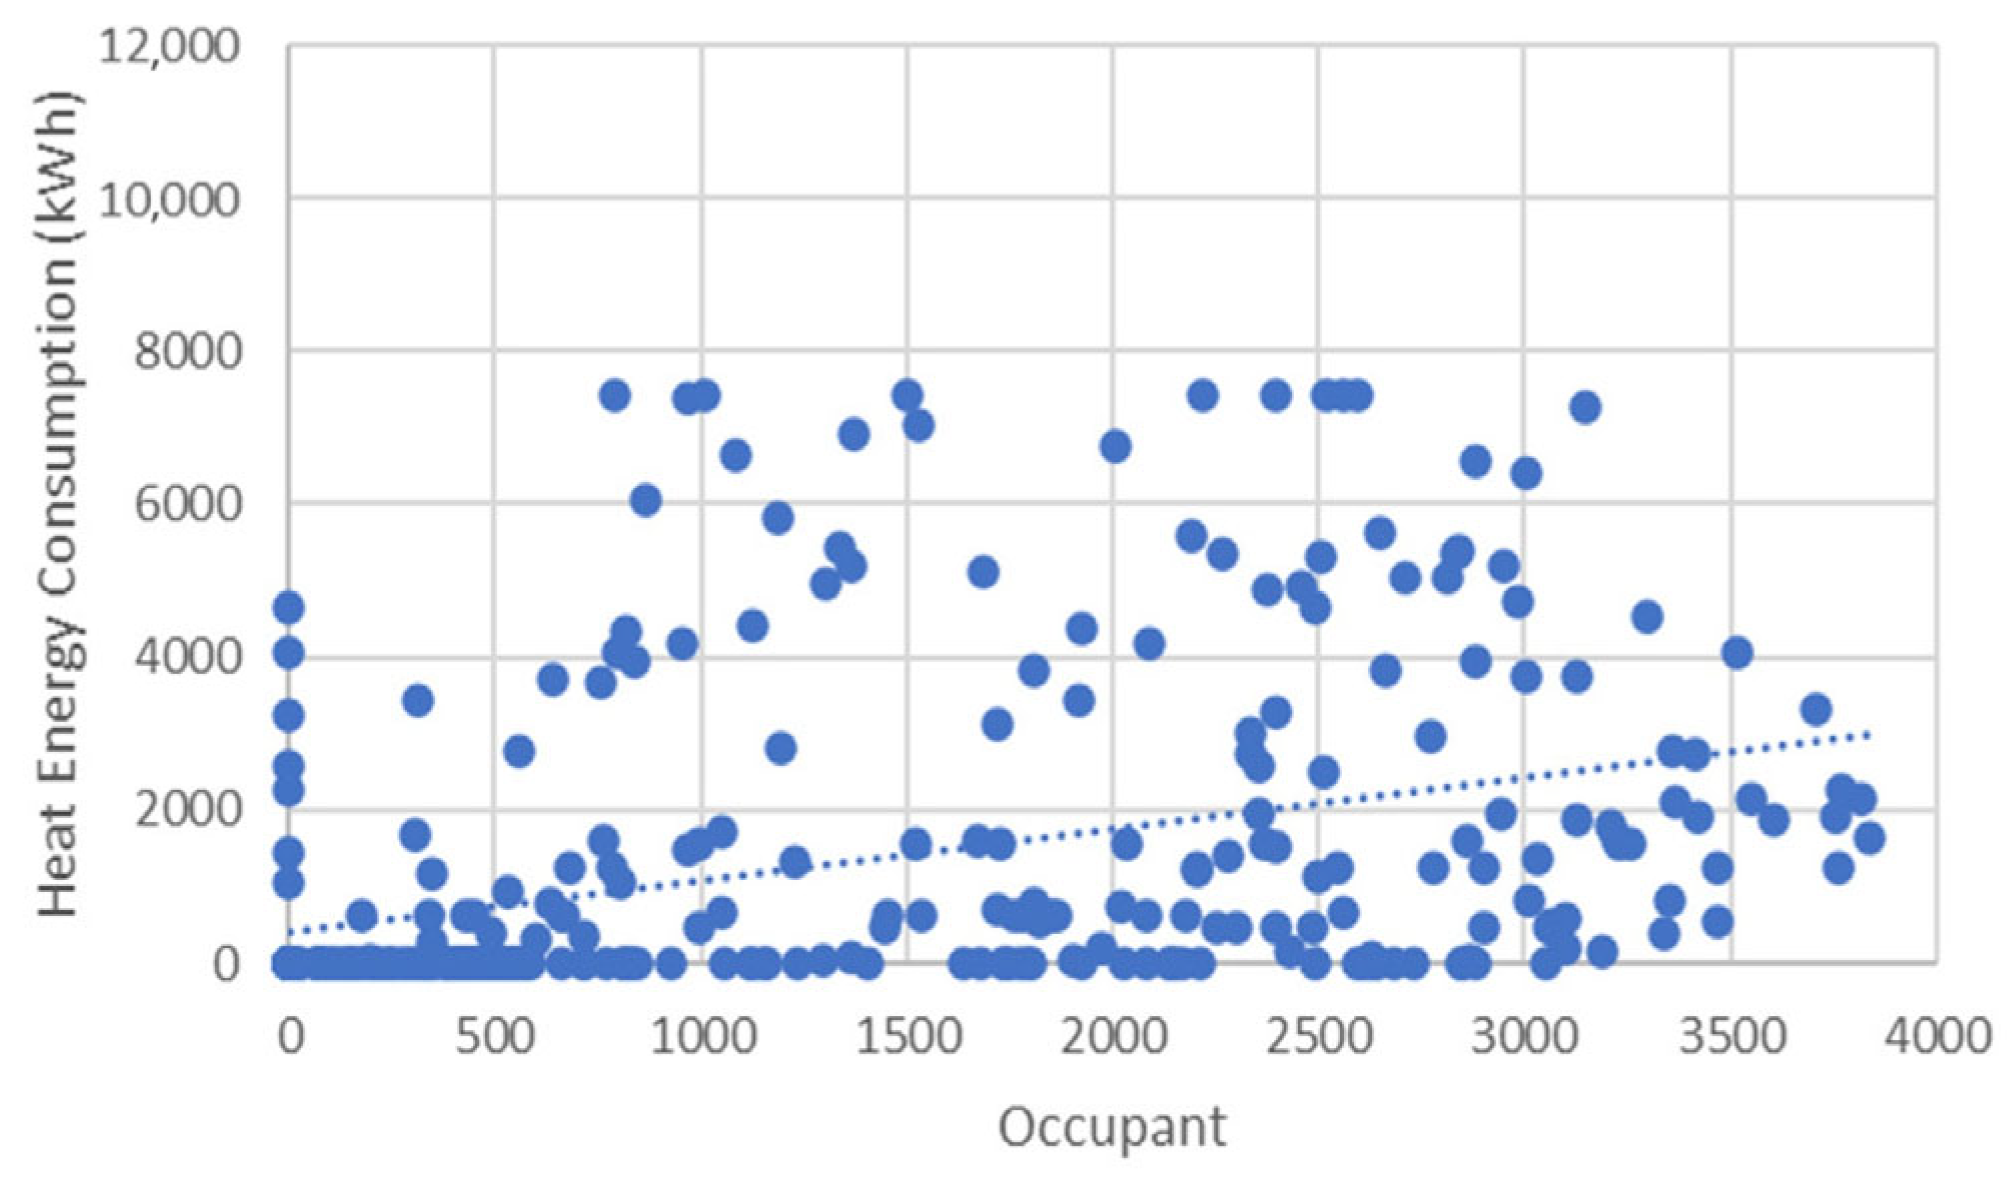
The results of performing a correlation analysis between the number of occupants during workdays in the building and energy consumption are presented in
Figure 9 and
Figure 10.
Figure 9 shows a weak correlation between the number of occupants and electrical energy consumption during workdays, with an R
2 of 0.53. In contrast,
Figure 10 shows no correlation between the number of occupants and heat energy consumption (R
2 0.18). The low correlation in heat energy consumption can be attributed to the building’s operation and the variability of external climate conditions rather than occupancy levels, as occupants have no control over the heating system. In addition, the random presence of occupants at varying rates during different periods reduces the correlation between their numbers and heat energy consumption, as estimating the number of occupants in a high-density library building is challenging [
38,
39]. The building’s heating system is fully controlled by building management, and occupants cannot adjust it. Therefore, heating is provided according to predefined schedules and setpoints rather than reacting to real-time occupancy. As a result, changes in the number of people in the building do not significantly impact energy use. However, such an arrangement can result in higher heating energy consumption even when most of the space is empty.
3.3. Impact Measurements
This section presents the results of measuring the impact of occupancy numbers on building energy consumption, including electricity and heat in the URS building, through various data analyses, including correlation, regression, and sensitivity analyses.
The results of conducting a correlation analysis were to illustrate the performance of the simulation model in estimating the electrical and heat energy consumption concerning the building’s occupants in the URS building.
Figure 11 and
Figure 12 show the strength of the correlation between the daily number of occupants and energy consumption (electricity and heat) over one year.
Figure 11 shows the correlation results of the estimated electrical energy consumption using the simulation tool. The coefficient correlation results were at 71.15%. The level of correlation could be linked to the use of the actual occupancy schedule as the input for simulating the building’s electrical energy consumption. However, the remaining correlation with electricity consumption is influenced by factors unrelated to occupancy, such as lighting. This illustrates the importance of occupancy rates in increasing the accuracy of the simulation models.
Figure 12 presents the correlation between heat energy consumption and occupancy levels in the building. The results show a low correlation of 19%, indicating no significant link between the number of occupants in the building and heat energy consumption. The low correlation values support the claim that heat energy consumption can be attributed to the building operation without considering the number of occupants. This is further evidenced in the results, which indicate similar energy consumption for different occupancy rates, such as 1000 and 3000 occupants in the building. Heat energy consumption was approximately 2000 kWh when there were fewer than 500 occupants and when there were more than 3000 occupants in the building. Furthermore, the simulation results showed that including occupancy numbers in the simulation model did not significantly impact the total heat energy consumption.
The use of regression analysis was performed to determine the energy consumption of the identified occupancy patterns in the building. According to the daily number of occupants in the building, the energy consumption was calculated for every 100 occupants across different temporal resolutions (early, peak, and late hours) and weekdays (workdays and weekends). The early hours are from 5:00 to 8:00 a.m., the peak hours are from 10:00 a.m. to 2:00 p.m., and the late hours are from 6:00 to 8:00 p.m. For clarity regarding the regression results, the lower value of energy consumption indicates a large number of occupants in the building for a given amount of electrical or heat energy consumption, which is a favorable situation, unlike when a few occupants consume large amounts of energy.
Figure 13 presents the analysis results for the three patterns of the actual electrical and heat energy consumption in the URS building.
The energy consumption of electricity per 100 occupants during workdays was significantly high during the early and late hours and decreased during peak hours. During the early hours of workdays, the most significant electrical energy consumption was observed in Pattern 1, at 59.1 kWh/100 occupants, followed by Pattern 2 and Pattern 3, at 17.42 and 18.01 kWh/100 occupants, respectively. During workdays, peak hours exhibited the lowest energy consumption, which is understandable given the high number of occupants in the building during this period, which is associated with the amount of electrical energy consumption. However, the building continued to consume electrical energy during vacation periods. During weekends, energy consumption related to the number of occupants was nearly zero, as the analysis was based on the actual occupancy schedule where the building opened at 9:00 a.m. on Saturdays (Pattern 1 and Pattern 2). In contrast, in Pattern 3, the building was closed. During peak and later hours, Pattern 3 showed the highest actual energy consumption, with 2.11 kWh per 100 occupants.
On the other hand, the heat energy consumption by occupants was high during all hours compared to the electrical energy consumption. The results in Pattern 1 showed high energy consumption during the early hours on workdays and weekends, at 2059.55 and 7145.84 kWh/100 occupants, respectively. Followed by Pattern 3, the energy consumption was 133.37 and 117.54 kWh/100 occupants. In Pattern 2, the consumption was the lowest compared to other patterns at 10.08 and 19.09 kWh/100 occupants during workdays and weekends, respectively. During peak hours, the building usually hosts a large number of occupants. Pattern 1 showed the most significant energy consumption at 264 and 4112.26 kWh/100 occupants. The lowest was Pattern 2, with 4.23 kWh during workdays and 1.55 kWh/100 occupants during weekends. This energy consumption is related to the large number of occupants during the period of exams. During weekends, high energy consumption of heat is observed, which is associated with maintaining the building’s indoor environment requirements. The result presented indicated the importance of the occupancy data. The availability and sufficiency of the occupancy data (schedules and rates) can serve as inputs in the building energy simulation model, which can positively influence the results obtained for energy savings. Therefore, during the design, operation, and construction phases, the building can benefit more from highly accurate energy simulations, considering many aspects, such as energy savings.
The sensitivity analysis was conducted to assess the impact of occupancy numbers on simulation results of electrical and heat energy consumption covering the three identified patterns during different times of the day (early, peak, and later hours). The one-at-a-time (OAT) sensitivity analysis method tests the impact of changing one factor of the model inputs on the model results. The occupancy number was used as input in the simulation model, which was the factor chosen to be adjusted by increasing and decreasing its value from −30% to +30%.
Figure 14 and
Figure 15 show the results of the sensitivity analysis of electrical and heat energy consumption, respectively, across different times of the day.
Figure 14 shows the impact of changing occupancy numbers on electrical energy consumption. The results of the sensitivity analysis show that electrical energy consumption in all three patterns was positively correlated with fluctuations in occupancy numbers, which aligned with the findings of the correlation analysis, as shown in
Figure 11. Therefore, it can be concluded that a high correlation exists between the occupancy numbers in the building and electrical energy consumption, which can be associated with the manual operation of electricity in the building. Conversely,
Figure 15 shows the sensitivity analysis results of the impact of occupancy numbers on heat energy consumption. There was a converse correlation with inconsistent rates of change in the occupancy numbers of energy consumption, which aligned with the findings of the correlation analysis, as shown in
Figure 10. Changes in heat energy consumption were observed as occupancy percentages varied; however, the percentages differed across different periods in the three patterns. Such changes can be associated with operating the building and providing thermal comfort, rather than the number of occupants in the building.
Comparing the results presented in
Figure 9,
Figure 10,
Figure 11 and
Figure 12, the changes in electrical energy consumption were aligned with the occupancy numbers and were similar across all three patterns. In contrast, the changes in heat energy consumption can be associated with maintaining the building’s temperature, thermal mass, and dynamics rather than the number of occupants.
4. Conclusions
In this paper, the building electricity and heat energy consumption of the URS building were analyzed at various temporal resolutions, including hourly, daily, weekly, and monthly. In addition, a building energy simulation model was developed to estimate electricity and heat energy consumption, thereby measuring the impact of occupancy numbers on building energy consumption. The process began with determining the occupancy patterns in the case study of the URS building. The results revealed three patterns associated with different occupancy densities across various periods, including academic terms and vacation. This was followed by processing and analyzing the actual one-year energy consumption data at 30 min intervals. The patterns were subsequently used to match the building’s energy consumption. The results revealed that the behavior of energy consumption varies across different academic terms and vacations. In addition, correlation analysis was conducted to measure the strength of the relationship between the variables, which included occupancy numbers and energy consumption. The results of the correlation analysis revealed a strong correlation between the occupancy numbers and electrical energy consumption. In contrast, there was no correlation between occupancy numbers and heat energy consumption. The results also aligned with those in the literature, showing a high energy consumption of 61% for electrical and heat energy consumption out of working hours.
The results from developing a building energy simulation model (DesignBuilder) estimate energy consumption and measure the impact of occupancy numbers on the URS building’s energy consumption. The use of actual inputs, including occupancy schedules and rates, addressed a gap found in most previous studies. Analyzing the energy simulation outcomes with correlation analysis determined the strength of the relationship between energy consumption (electrical and heat) and occupancy numbers. The results aligned with the actual energy consumption analysis: a strong correlation of 71.5% between occupancy levels and electrical energy use, and no correlation with heat energy at 18%. Heat energy consumption was affected by factors such as maintaining building temperature and weather-related seasonal changes, regardless of occupancy. Regression analysis was used to assess the cause-and-effect relationship between occupancy and energy consumption.
Finally, sensitivity analysis was performed to assess the impact of occupancy numbers on electrical and heat energy consumption during various periods (early, peak, and late hours) of a day cycle. The results of the sensitivity analysis were aligned with the correlation and regression analysis results. Electrical energy consumption correlated with the increase and decrease of the occupancy numbers, while heat energy consumption did not. Therefore, the availability of occupancy data during the operational phase can be helpful in developing an energy simulation model for building operation and in testing the impact of occupant numbers on the building system at different periods to ensure optimal energy-saving practices.
Based on this study’s findings, several limitations and significant new research areas have been identified. The following research directions are recommended; expanding the scope of this study to explore them in the future is worthwhile. The occupancy data used in this study covered the entire building. Future work could address this limitation by enhancing the temporal and spatial resolution of data collection to better track the duration of occupancy and the specific locations within the building. Additionally, examining how an occupancy-based control system can help reduce energy consumption. Such improvements can reveal various occupancy characteristics, such as where occupants are and how they interact with building systems, which can help develop more accurate and detailed occupancy prediction models. Additionally, the energy simulation model developed was based on occupancy data inputs, including schedules and occupancy rates, as well as attributes of building environmental systems, such as their operational schedules. However, these schedules, used to operate building services in the model, were predefined and aligned with information from the Estates and Facilities management department. The uncertainties related to these predefined schedules could be evaluated in future studies by monitoring the actual operation status of building services.

