Article

Multi-Scale Investigation on Bearing Capacity and Load-Transfer Mechanism of Screw Pile Group via Model Tests and DEM Simulation

Department of Civil Engineering, Shanghai University, 99 Shangda Road, Shanghai 200444, China
*
Author to whom correspondence should be addressed.
Buildings 2025, 15(19), 3581; https://doi.org/10.3390/buildings15193581
Submission received: 28 August 2025 / Revised: 28 September 2025 / Accepted: 1 October 2025 / Published: 4 October 2025
(This article belongs to the Special Issue Structural Engineering in Building)

Abstract

Screw piles are widely used in infrastructure, such as railways, highways, and ports, etc., owing to their large pile resistance compared to unthreaded piles. While most screw pile research focuses on single pile behavior under rotational installation using torque-capacity correlations. Limited studies investigate group effects under alternative installation methods. In this study, the load-transfer mechanism of screw piles and soil displacement under vertical installation was explored using laboratory model tests combined with digital image correlation techniques. In addition, numerical simulations using the discrete element method were performed. Based on both lab tests and numerical simulation results, it is discovered that the ultimate bearing capacity of a single screw pile was approximately 50% higher than that of a cylindrical pile with the same outer diameter and length. For pile groups, the group effect coefficient of a triple-pile group composed of screw piles was 0.64, while that of cylindrical piles was 0.55. This phenomenon was caused by the unique thread-soil interaction of screw piles. The threads generated greater side resistance and reduced stress concentration at the pile tip compared with cylindrical piles. Moreover, the effects of pile type, pile number, embedment length, pile spacing, and thread pitch on pile resistance and soil displacement were also investigated. The findings in this study revealed the micro–macro correspondence of screw pile performance and can serve as references for pile construction in practice.

1. Introduction

To cope with rapid urbanization over the past few decades, piles have been widely used in infrastructure such as railways, highways, and ports. Traditional methods of improving pile capacity rely on increasing pile length and diameter. However, this approach is often cost-ineffective. It also introduces construction challenges, including higher material costs, deeper excavations, and more complex installation procedures [1,2]. Innovative pile geometries, such as screw piles, provide improved performance through altered load-transfer mechanisms rather than relying solely on increases in dimensions. Many researchers are beginning to focus on special-shaped piles that offer a larger bearing capacity compared to conventional piles [3,4,5]. Screw piles, a type of special-shaped pile, are designed with specific geometries to enhance load capacity, reduce ground settlement, and improve the material efficiency of the pile [6,7]. Recent advances in sustainable construction have highlighted the environmental benefits of optimized foundation systems, including reduced material consumption and lower carbon footprints [8,9]. The installation process of screw piles eliminates the need for vibration hammers and soil extraction, thereby reducing installation noise and environmental contamination [10]. These advantages have enabled the wide use of screw piles in railway, highway, and port infrastructure [11,12].
The main difference between screw piles and cylindrical piles is their load-transfer and pile resistance mechanics. For cylindrical piles, their pile resistance is primarily composed of shaft friction and tip resistance [13]. The pile resistance of screw piles is mainly composed of mechanical interlock between soil and threads. This interlock is caused by the shear resistance and soil compaction of surrounding soil [14,15]. The threads on screw piles completely alter the load transfer mechanics and change the stress distribution of surrounding soil [16]. Therefore, traditional analytical methods cannot be used to analyze pile resistance, shaft resistance, and tip resistance of a single screw pile [17].
Owing to the limitations of analytical methods, current research on single screw piles is carried out primarily through model tests [18,19] and numerical simulations [20,21]. In tests, researchers have used scale model testing and field tests to investigate single screw pile behavior. These studies focus on soil displacement, pile resistance, and load-transfer mechanics [22,23]. The micromechanics and stress distribution of soil during single screw pile installation have been investigated by discrete element method (DEM) and finite element method (FEM) [24,25].
In practical applications, piles are usually used in the form of pile groups. With the adoption of pile groups, there are notable pile group effects, leading to different load-transfer mechanics and soil failure modes compared to single piles [26]. Currently, research on group piles has predominantly focused on traditional cylindrical or square piles [27,28]. These studies reveal the influence of the group effect on soil displacement, soil stress, and pile resistance. However, investigation into group effects in screw piles remains limited. The threads on a grouped screw pile not only modify single-pile load-transfer mechanics but also induce unique pile-soil interaction patterns and inter-pile interaction mechanisms.
Based on previous research, this study intends to investigate the soil displacement, load-transfer mechanics, and soil mesoscopic mechanics during pile installation. The influence of pile types, pile numbers, embedment length, and pile spacing has been discussed in this study. Because of difficulties and high costs to field tests, model tests and numerical simulation were used in this study. Characterizing the micromechanical behaviors of granular materials presents a challenge for numerical methods based on continuum mechanics, such as the FEM. Compared to FEM, DEM can reveal mesoscopic behaviors of soil granular [29,30]. Based on the aforementioned considerations, visual experiments using the DIC technique [31] recorded soil displacement around piles. Experimental findings were validated through 2D DEM modeling. This approach concurrently elucidated mesoscopic behaviors of soil granular.

2. Model Test

2.1. Test Apparatus

Although screw piles are typically installed using rotational methods with applied torque, this study employed vertical installation due to laboratory equipment limitations. Similar simplified installation methods have been employed in small-scale research [5,32]. The pile installation tests were performed in a tempered acrylic chamber with dimensions of 600 mm × 290 mm × 350 mm. Loading on test piles was applied by a universal material testing machine. The universal testing machine has a loading capacity of 500 kN, a loading range of 0–700 mm, and a loading speed of 0.01–500 mm/min. The values of load and settlement were continuously recorded by sensors during model testing. A camera was positioned outside the chamber to record the soil displacement process, and two flat lights were used for illumination. Subsequently, experimental images were processed using digital image correlation (DIC). Figure 1a,b show the setup of the test devices.
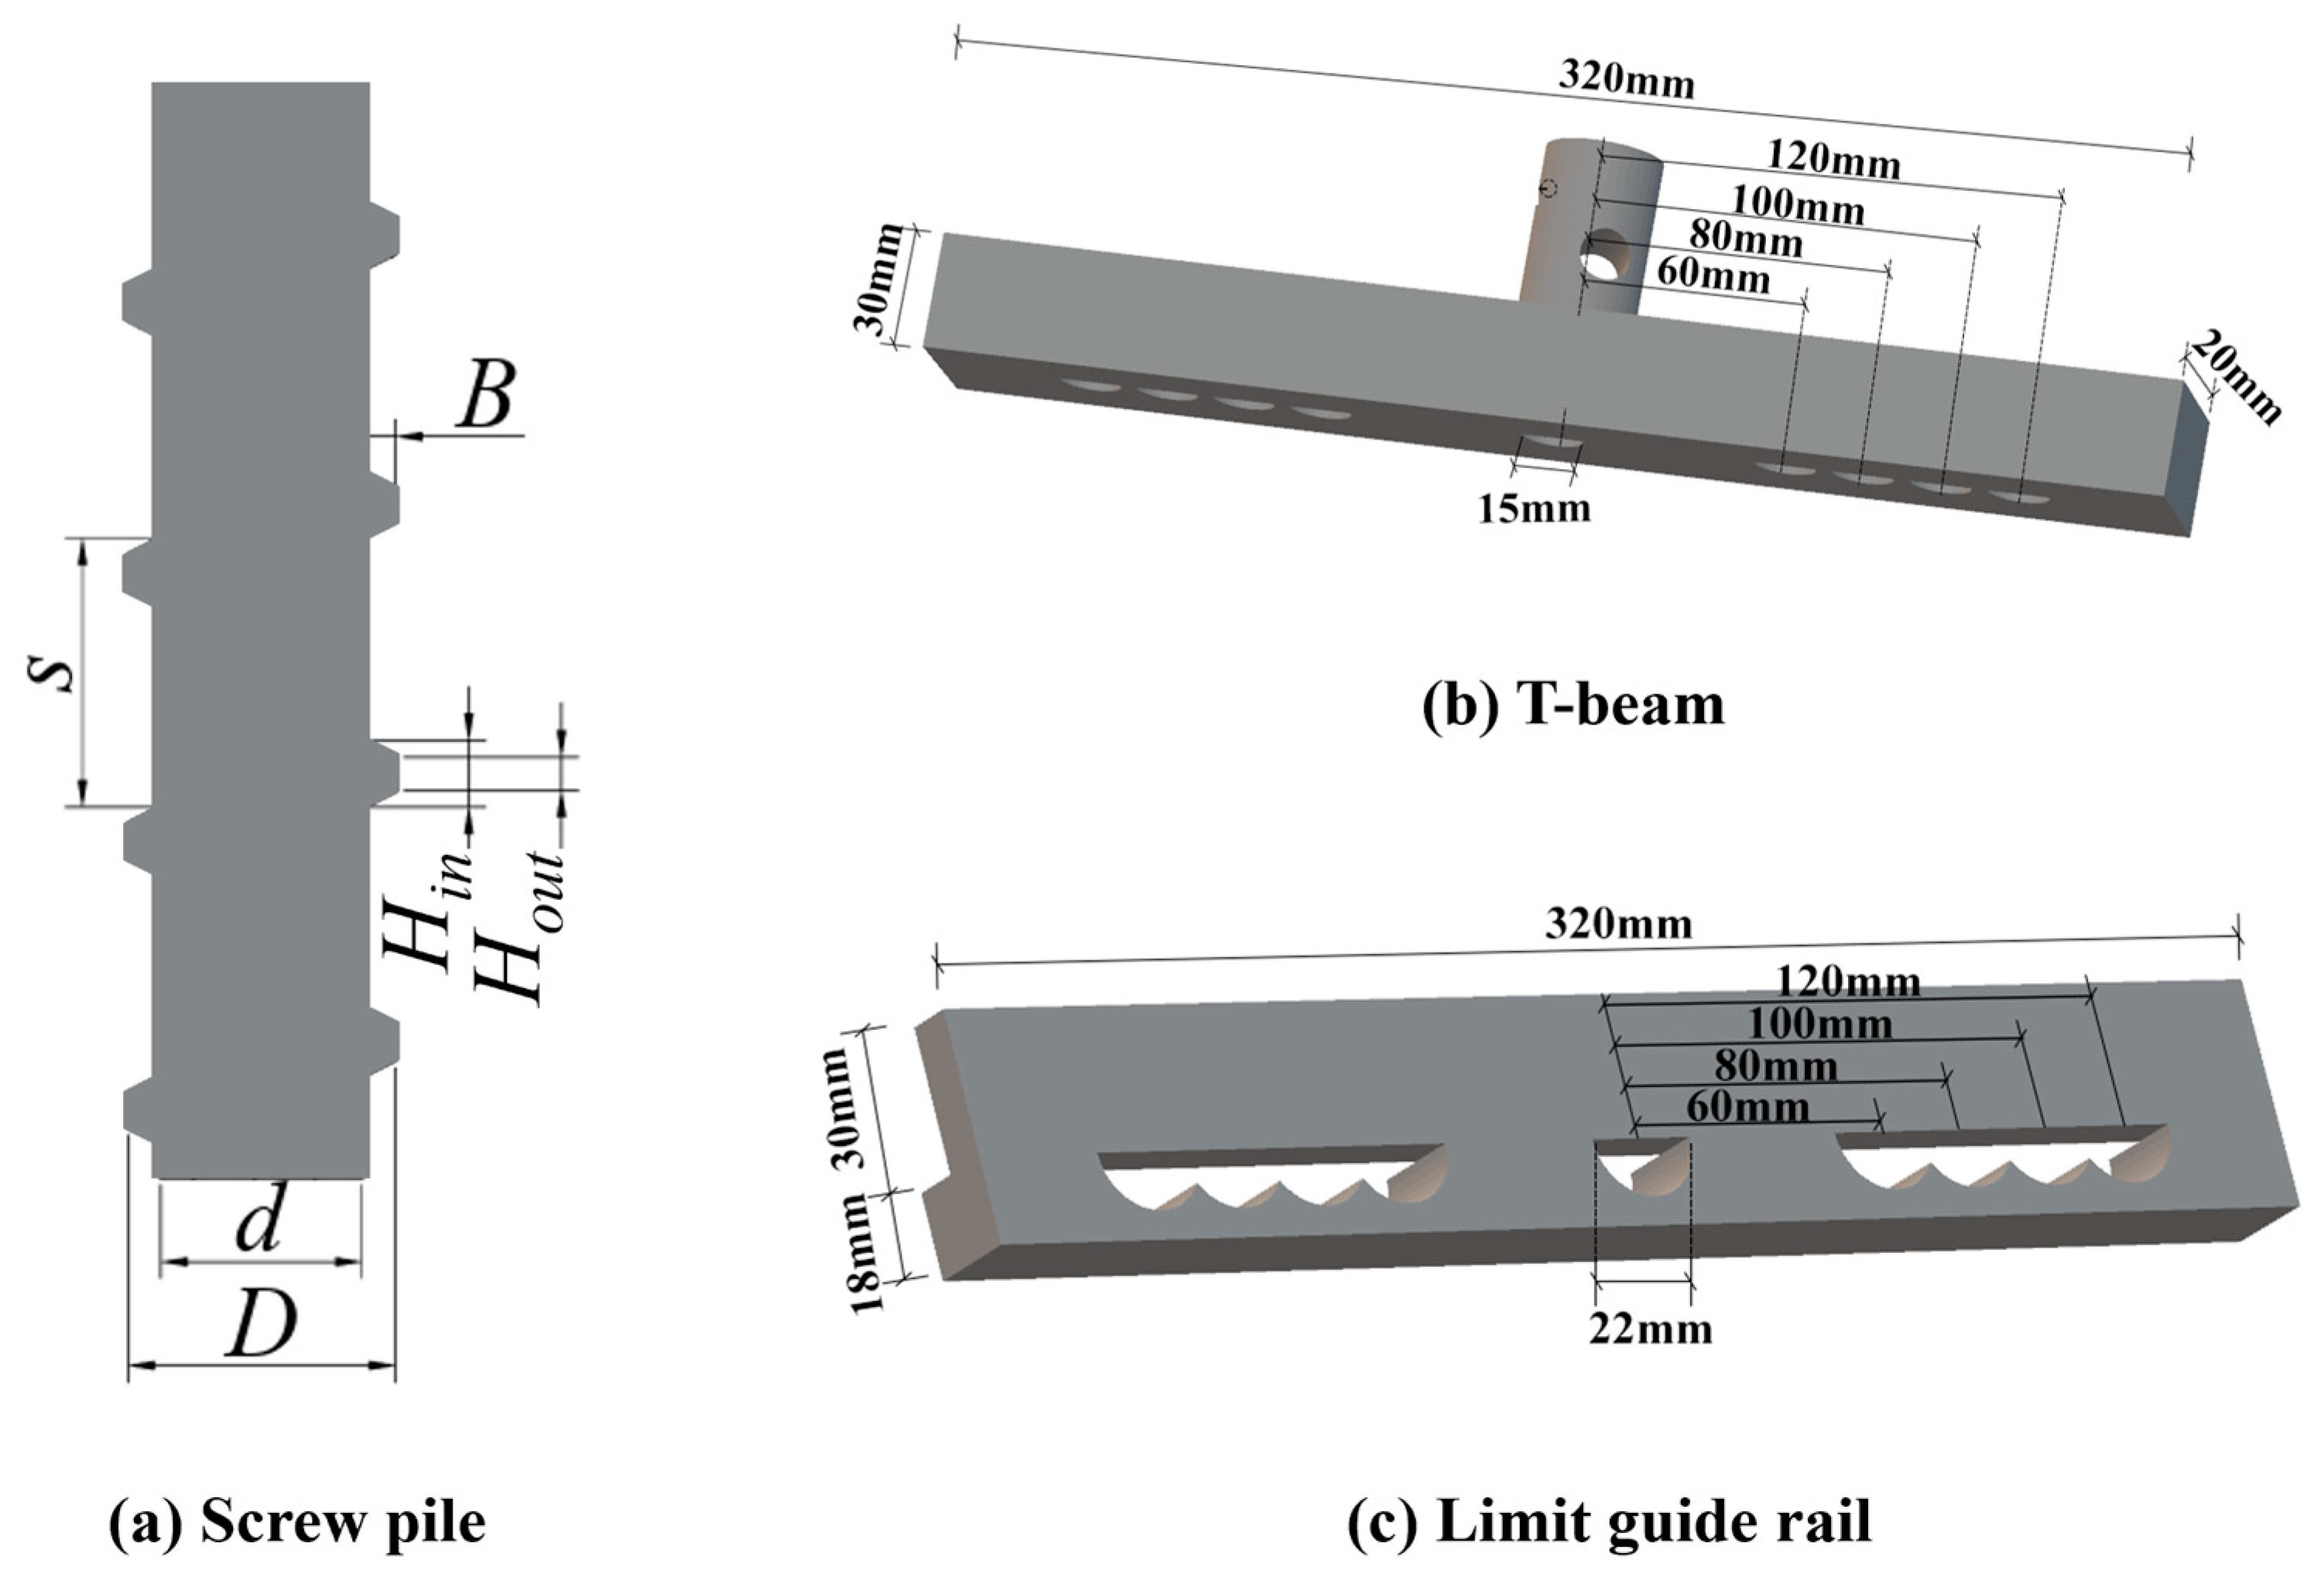
The test screw piles (SP) were designed based on a prototype that followed the Chinese Technical Specification for Screw Pile Foundations [33]. The geometry of the prototype included a 300 mm inner diameter, 400 mm outer diameter, 400 mm thread pitch, 50 mm thread height, 100 mm root thickness, and 50 mm thread thickness.
For this study, the piles were constructed at a 1:20 scale to a total length of 350 mm (Figure 1c). A cylindrical pile (CP) with an identical outer diameter and length was also created for comparison (Table 1). Both pile types were modeled in SOLIDWORKS and 3D printed from solid aluminum alloy as flat-ended half-piles (Figure 2).
To ensure proper alignment, the piles were spaced using a T-beam with semicircular recesses (15 mm diameter and 20 mm deep). This T-beam was connected to the universal testing machine, and a resin-printed guide rail was fitted to guarantee vertical installation.

2.2. Test Materials and Parameters

The testing materials were Inner Mongolian desert sands, classified as poorly graded fine sands ( ρ = 1.56   g / c m 3 , φ = 31 ° , D r = 0.65 , D 50 = 0.15   m m , C u = 1.54 , C c = 0.84 ) (see Figure 3) [34]. The sands were pluviated into the testing chamber in seven layers with a pluviation height of 50 cm. Each layer was compacted and leveled (25 blows per layer, 2.5 kg hammer, and a drop distance of 300 mm). After being loaded, the soils sat for 24 h before testing.
The model pile diameter to sand grain size ratio (D/D50) reached 167, with 10.5D clearance from pile groups to lateral boundaries [35]. The model tests satisfied criteria requiring D/D50 > 20 and side clearance > 10D [32]. Twelve test configurations were evaluated (see Table 2).

3. Analyses on Test Results

3.1. Influence of Different Pile Types

3.1.1. Load-Settlement (Q-s) Curve

Figure 4 presents Q-s curves for piles with different embedment lengths. For s < 2 mm, the Q-s curves for all pile types exhibited linearly increasing load with settlement. Between 2 mm and 8 mm settlement, the curves transitioned to nonlinearity, with slower growth in load. For s > 8 m, curves for different embedment lengths became parallel to each other.
Screw piles demonstrated larger bearing capacity with increased embedment length than cylindrical piles due to their load-transfer mechanism. This resulted from the increased pile-soil contact area and side friction along the shaft. The vertical ultimate bearing capacities for screw piles of 120 mm, 160 mm, 200 mm, and 240 mm reached 20 N, 26 N, 33 N, and 41 N, respectively. These values were 1.5 to 2 times those of cylindrical piles.

3.1.2. Displacement of Soil Around Piles

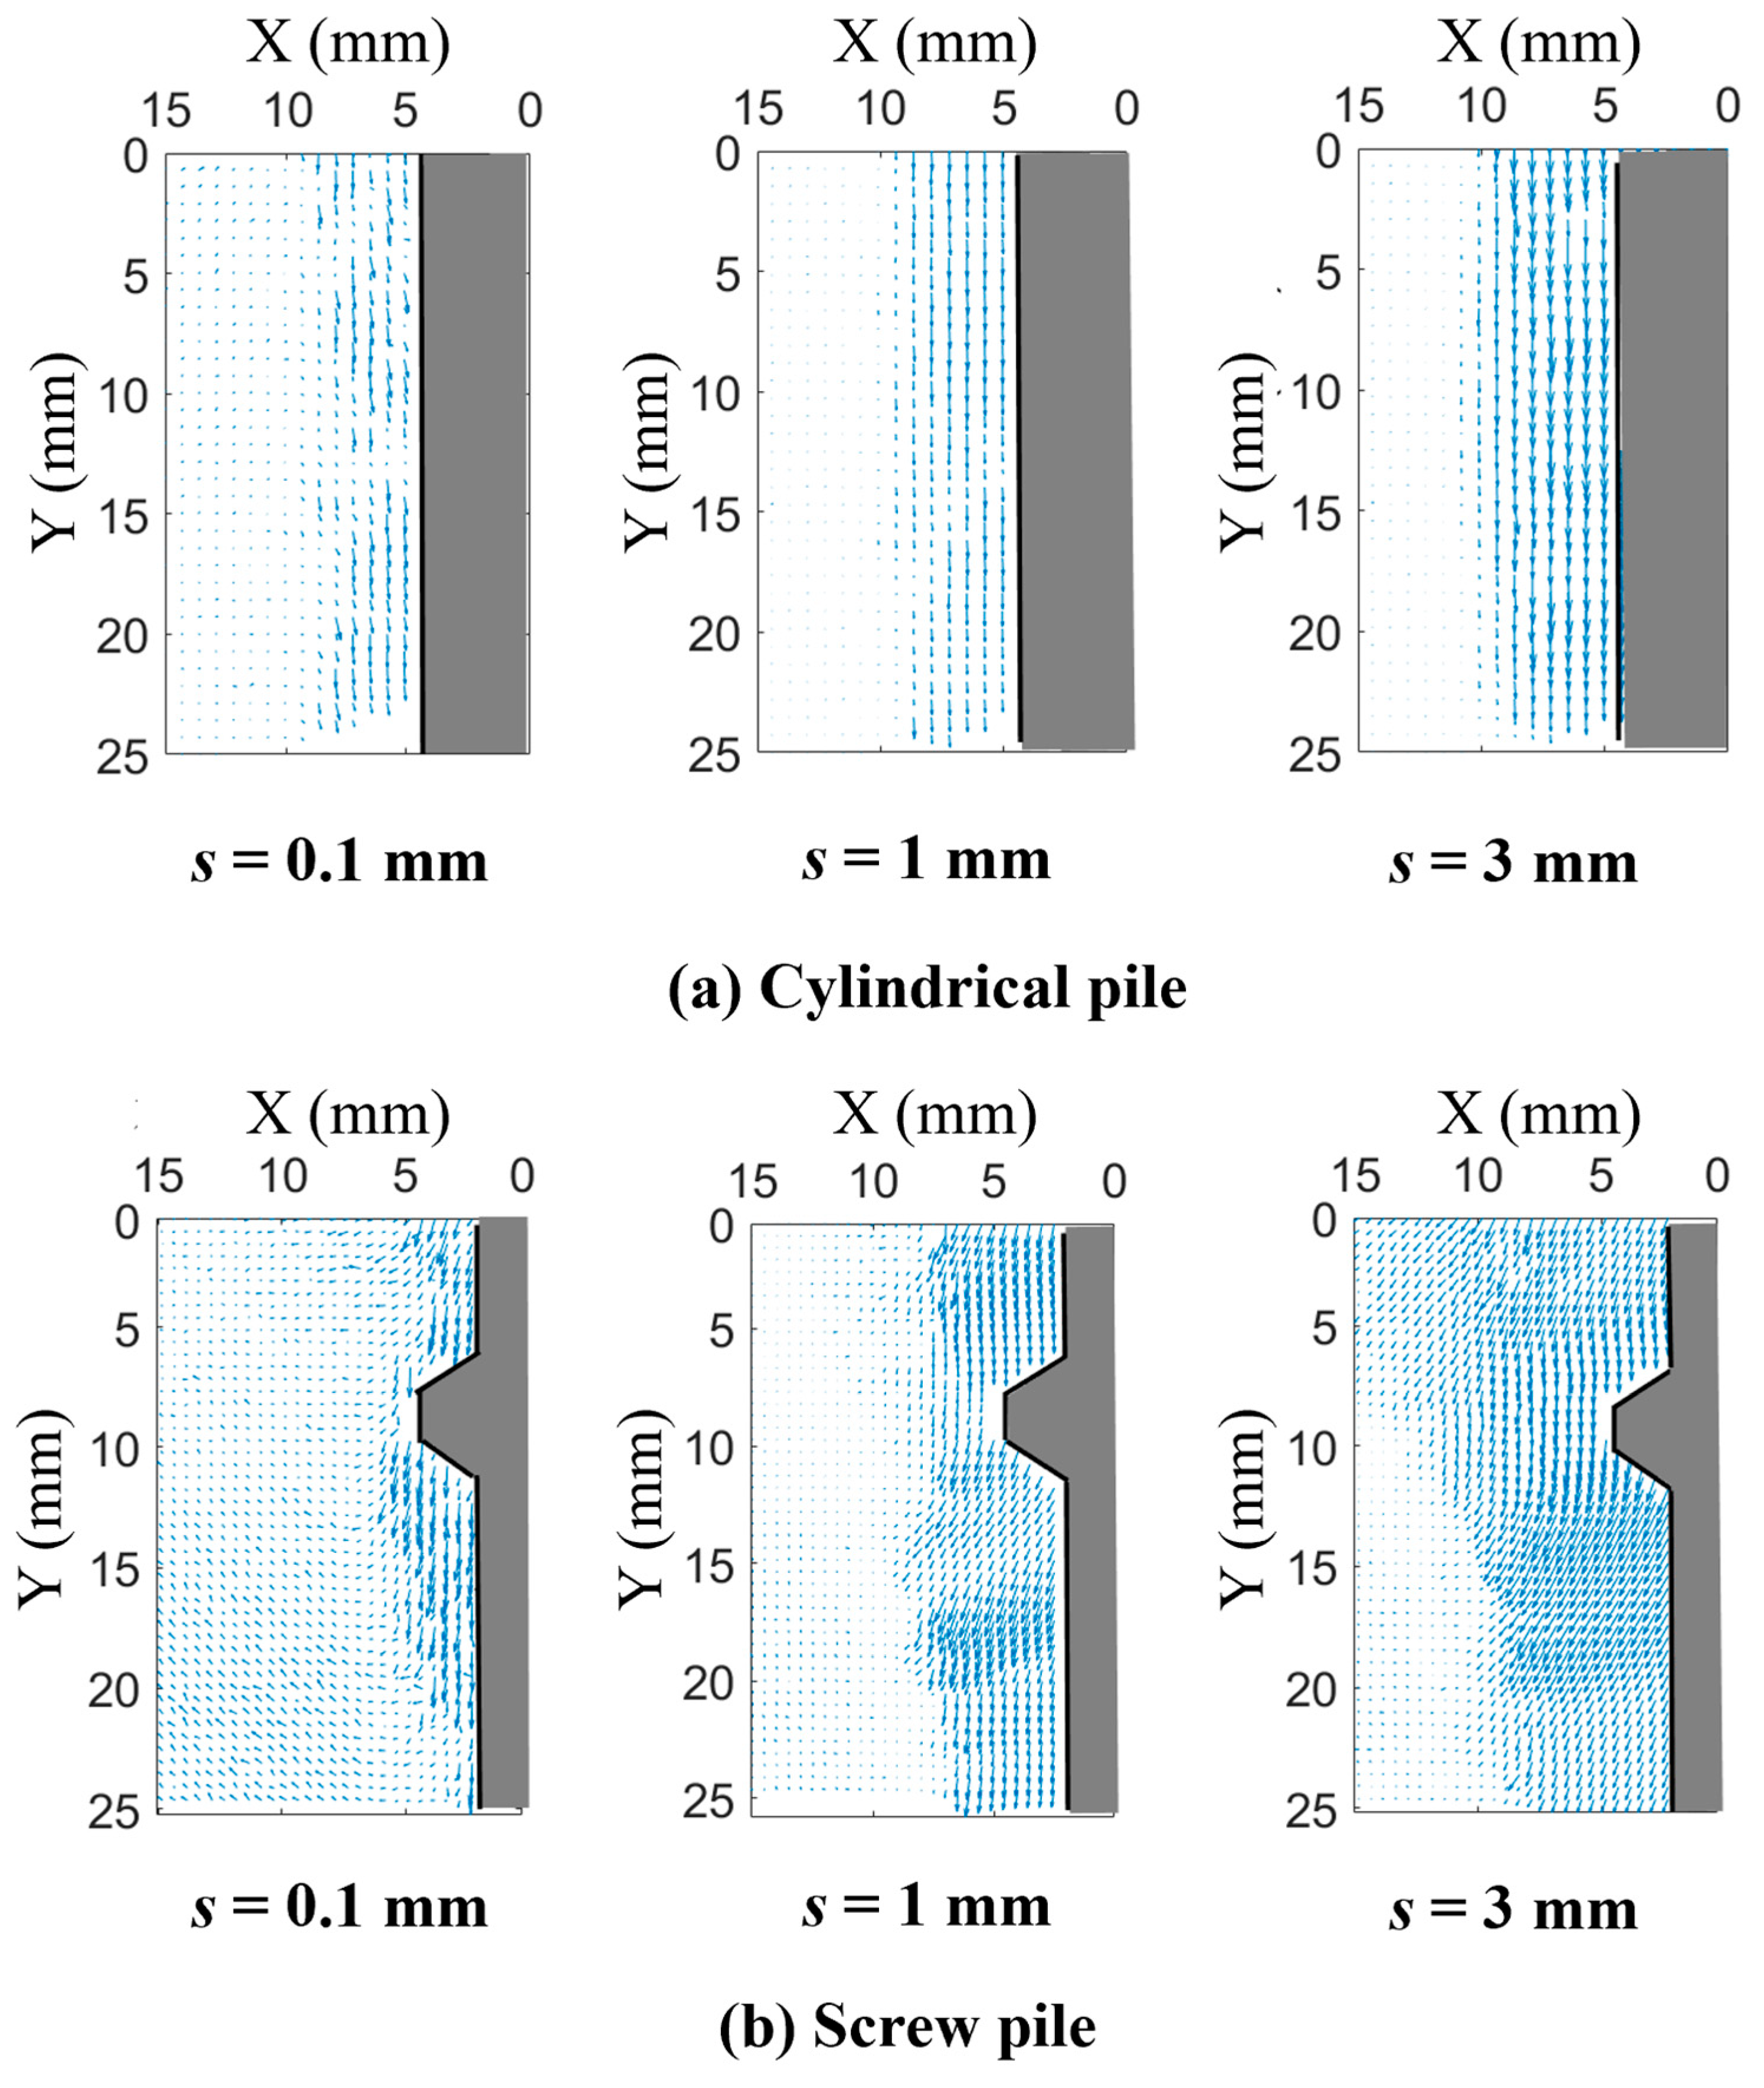
Settlement exceeding 60–80 mm signifies pile failure under load [36]. In the model tests, soil displacement was monitored at a depth of 100 mm. Displacement vector fields were evaluated at settlements of 0.1 mm, 1 mm, and 3 mm.
The displacement vector fields depicted in Figure 5 reveal distinct patterns between the two pile types. At 0.1 mm settlement, both pile types induced localized vertical soil displacement. Negligible lateral displacement occurred around the threads. When settlement reached 1 mm, soil displacement along the screw pile threads formed a distinct wedge-shaped uplift zone. The soil between the threads began to exhibit arching displacements. In contrast, displacement along the cylindrical piles generated a more uniform, cone-shaped uplift pattern. At a settlement of 3 mm, the soil displacement zone surrounding the screw pile expanded horizontally. The soil displacements between the threads evolved from localized independence into interconnection. This formed a continuous shear zone around the threads [37]. Conversely, the soil displacement zone around the cylindrical pile exhibited minimal change in spatial extent. It generated greater vertical displacement during pile installation.
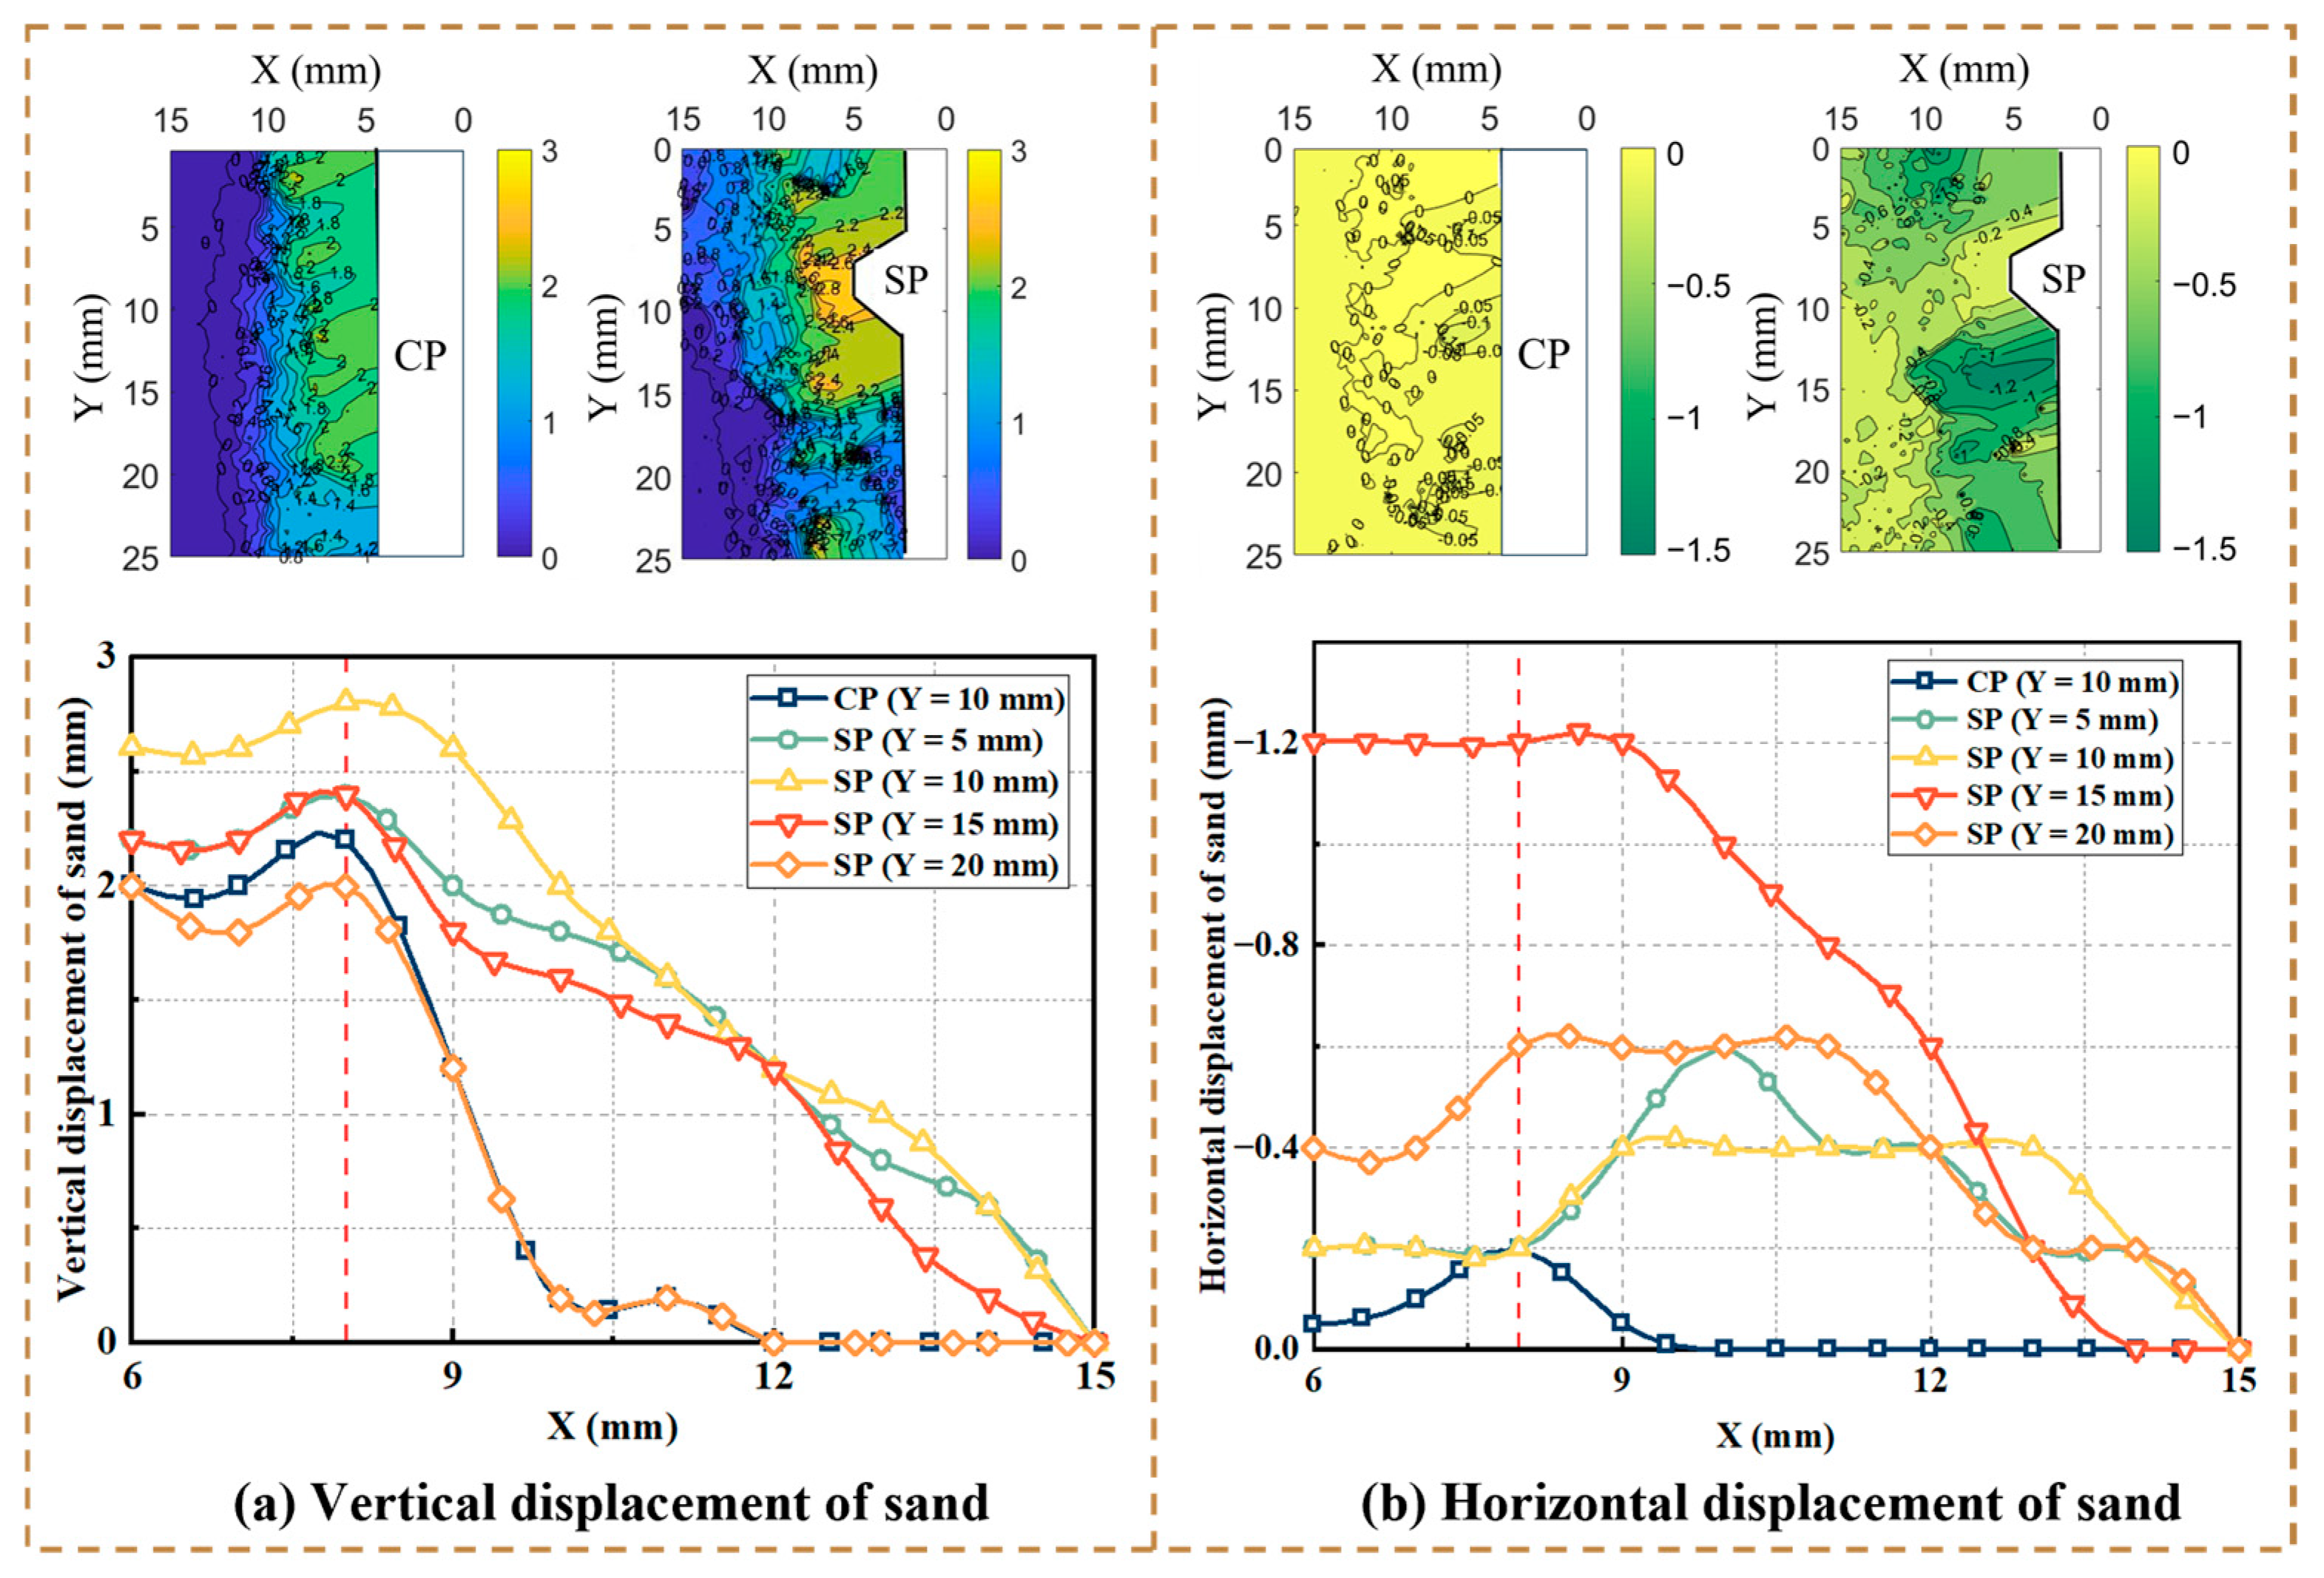
Figure 6 illustrates soil displacements induced by screw and cylindrical piles under 3 mm settlement, with comparative analyses of soil displacements at Y = 5 mm, 10 mm, 15 mm, and 20 mm. Maximum vertical displacements occurred near the threads of the screw pile, reaching 2.8 mm at Y = 10 mm. Cylindrical piles achieved 2.2 mm at the same location. Regions farther from the threads exhibited displacement patterns similar to cylindrical piles. The screw pile induced vertical displacement within a radial extent of approximately 10 mm, twice that of cylindrical piles. The maximum displacement was consistently observed at X = 8 mm. Minimal horizontal displacement occurred around cylindrical piles (<0.2 mm). In contrast, screw piles generated significant lateral displacement beneath threads, reaching peak values of 1.2 mm at Y = 10 mm. This phenomenon arises because during compression, the threads apply diagonal compressive forces to sub-thread soil, thereby enhancing lateral displacement of soil.

3.2. Influence of Threads

In screw pile systems, the bearing capacity is primarily governed by the thread-soil interaction rather than shaft friction along the embedment length. Each thread acts as an individual bearing element, making Q/n (load per thread) the most relevant parameter for understanding load distribution among threads. For screw piles with embedment lengths of 120, 160, 200, and 240 mm, the corresponding number of soil-embedded threads is 6, 8, 10, and 12. Under vertical loading, soil failure progresses from localized shear around individual threads to a continuous shear band along the pile shaft. Figure 7a reveals that when s < 4 mm, increments of load on threads exhibited a positive correlation with thread count. During this stage, the soil was subjected to shear force, causing particles to displace and rearrange. Small particles filled the voids between the large particles. This increased soil density and enhanced particle interlocking and friction. Consequently, the load on threads increased with settlement. Beyond s = 4 mm, the load on threads stabilized. This indicated that the development of the soil shear process was nearly complete. In Figure 7b, the average load on threads decreased as the number of threads increased. This reduction was attributed to a combination of restricted soil displacement due to deeper pile embedment and load-sharing effects resulting from an increasing number of threads.
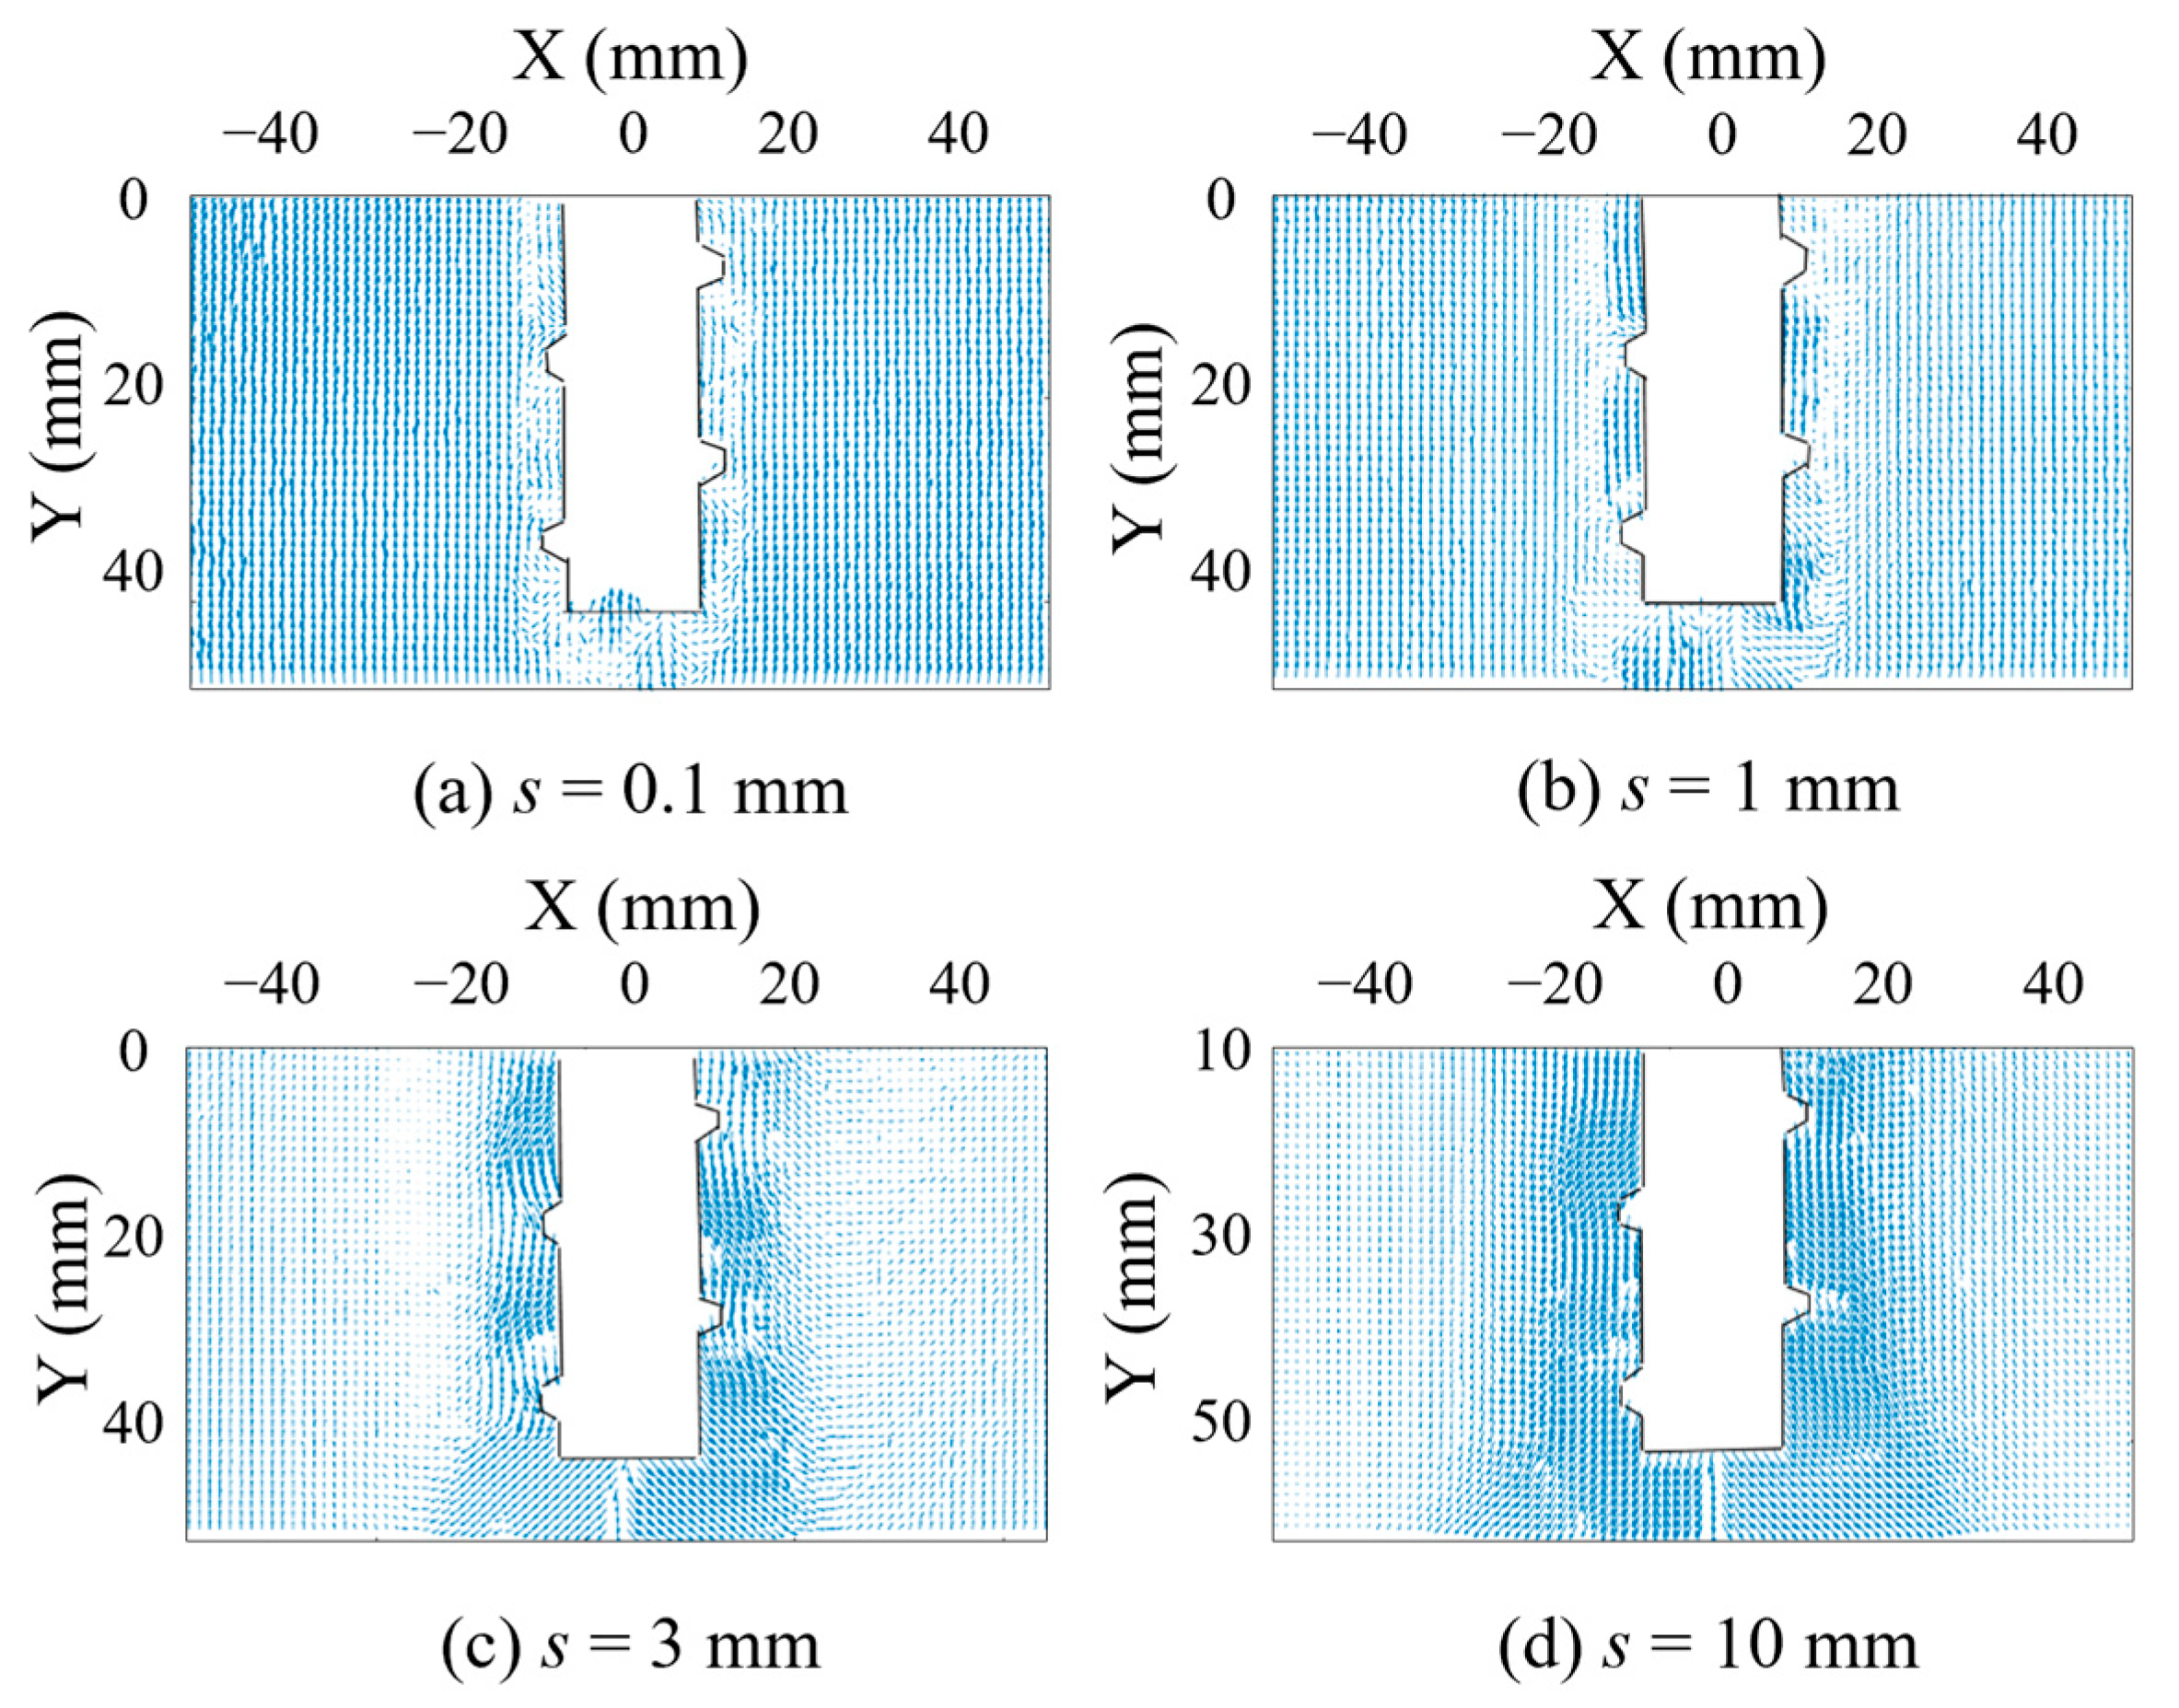
To investigate the influence of threads on soil displacement, two threads at the tip of a screw pile with a 200 mm embedment depth were monitored. Figure 8 illustrates that soil displacement development around the screw pile occurred in two distinct stages. During Stage 1, localized shear failure around individual threads (Figure 8a) progressed to continuous shear failure along the pile shaft (Figure 8b). This was followed by outward bulging of soil between threads and expansion of the soil displacement zone (Figure 8c). Concurrently, soil displacement vectors exhibited discrete logarithmic spiral patterns. This stage, characterized by large soil displacement confined to inter-thread regions, corresponded to the rapidly increasing load in the Q-s curve of Figure 4. In Stage 2, the soil displacement zone extended outward (Figure 8c,d), and displacement vectors formed an interconnected logarithmic spiral pattern. At this stage, the bearing capacity of soil near the pile shaft became fully mobilized. Subsequently, the load was gradually transferred to the soil away from the pile, corresponding to the stage of slowly increasing load on the screw pile in Figure 4.

3.3. Influence of Group Effect

3.3.1. Group Effect Coefficient

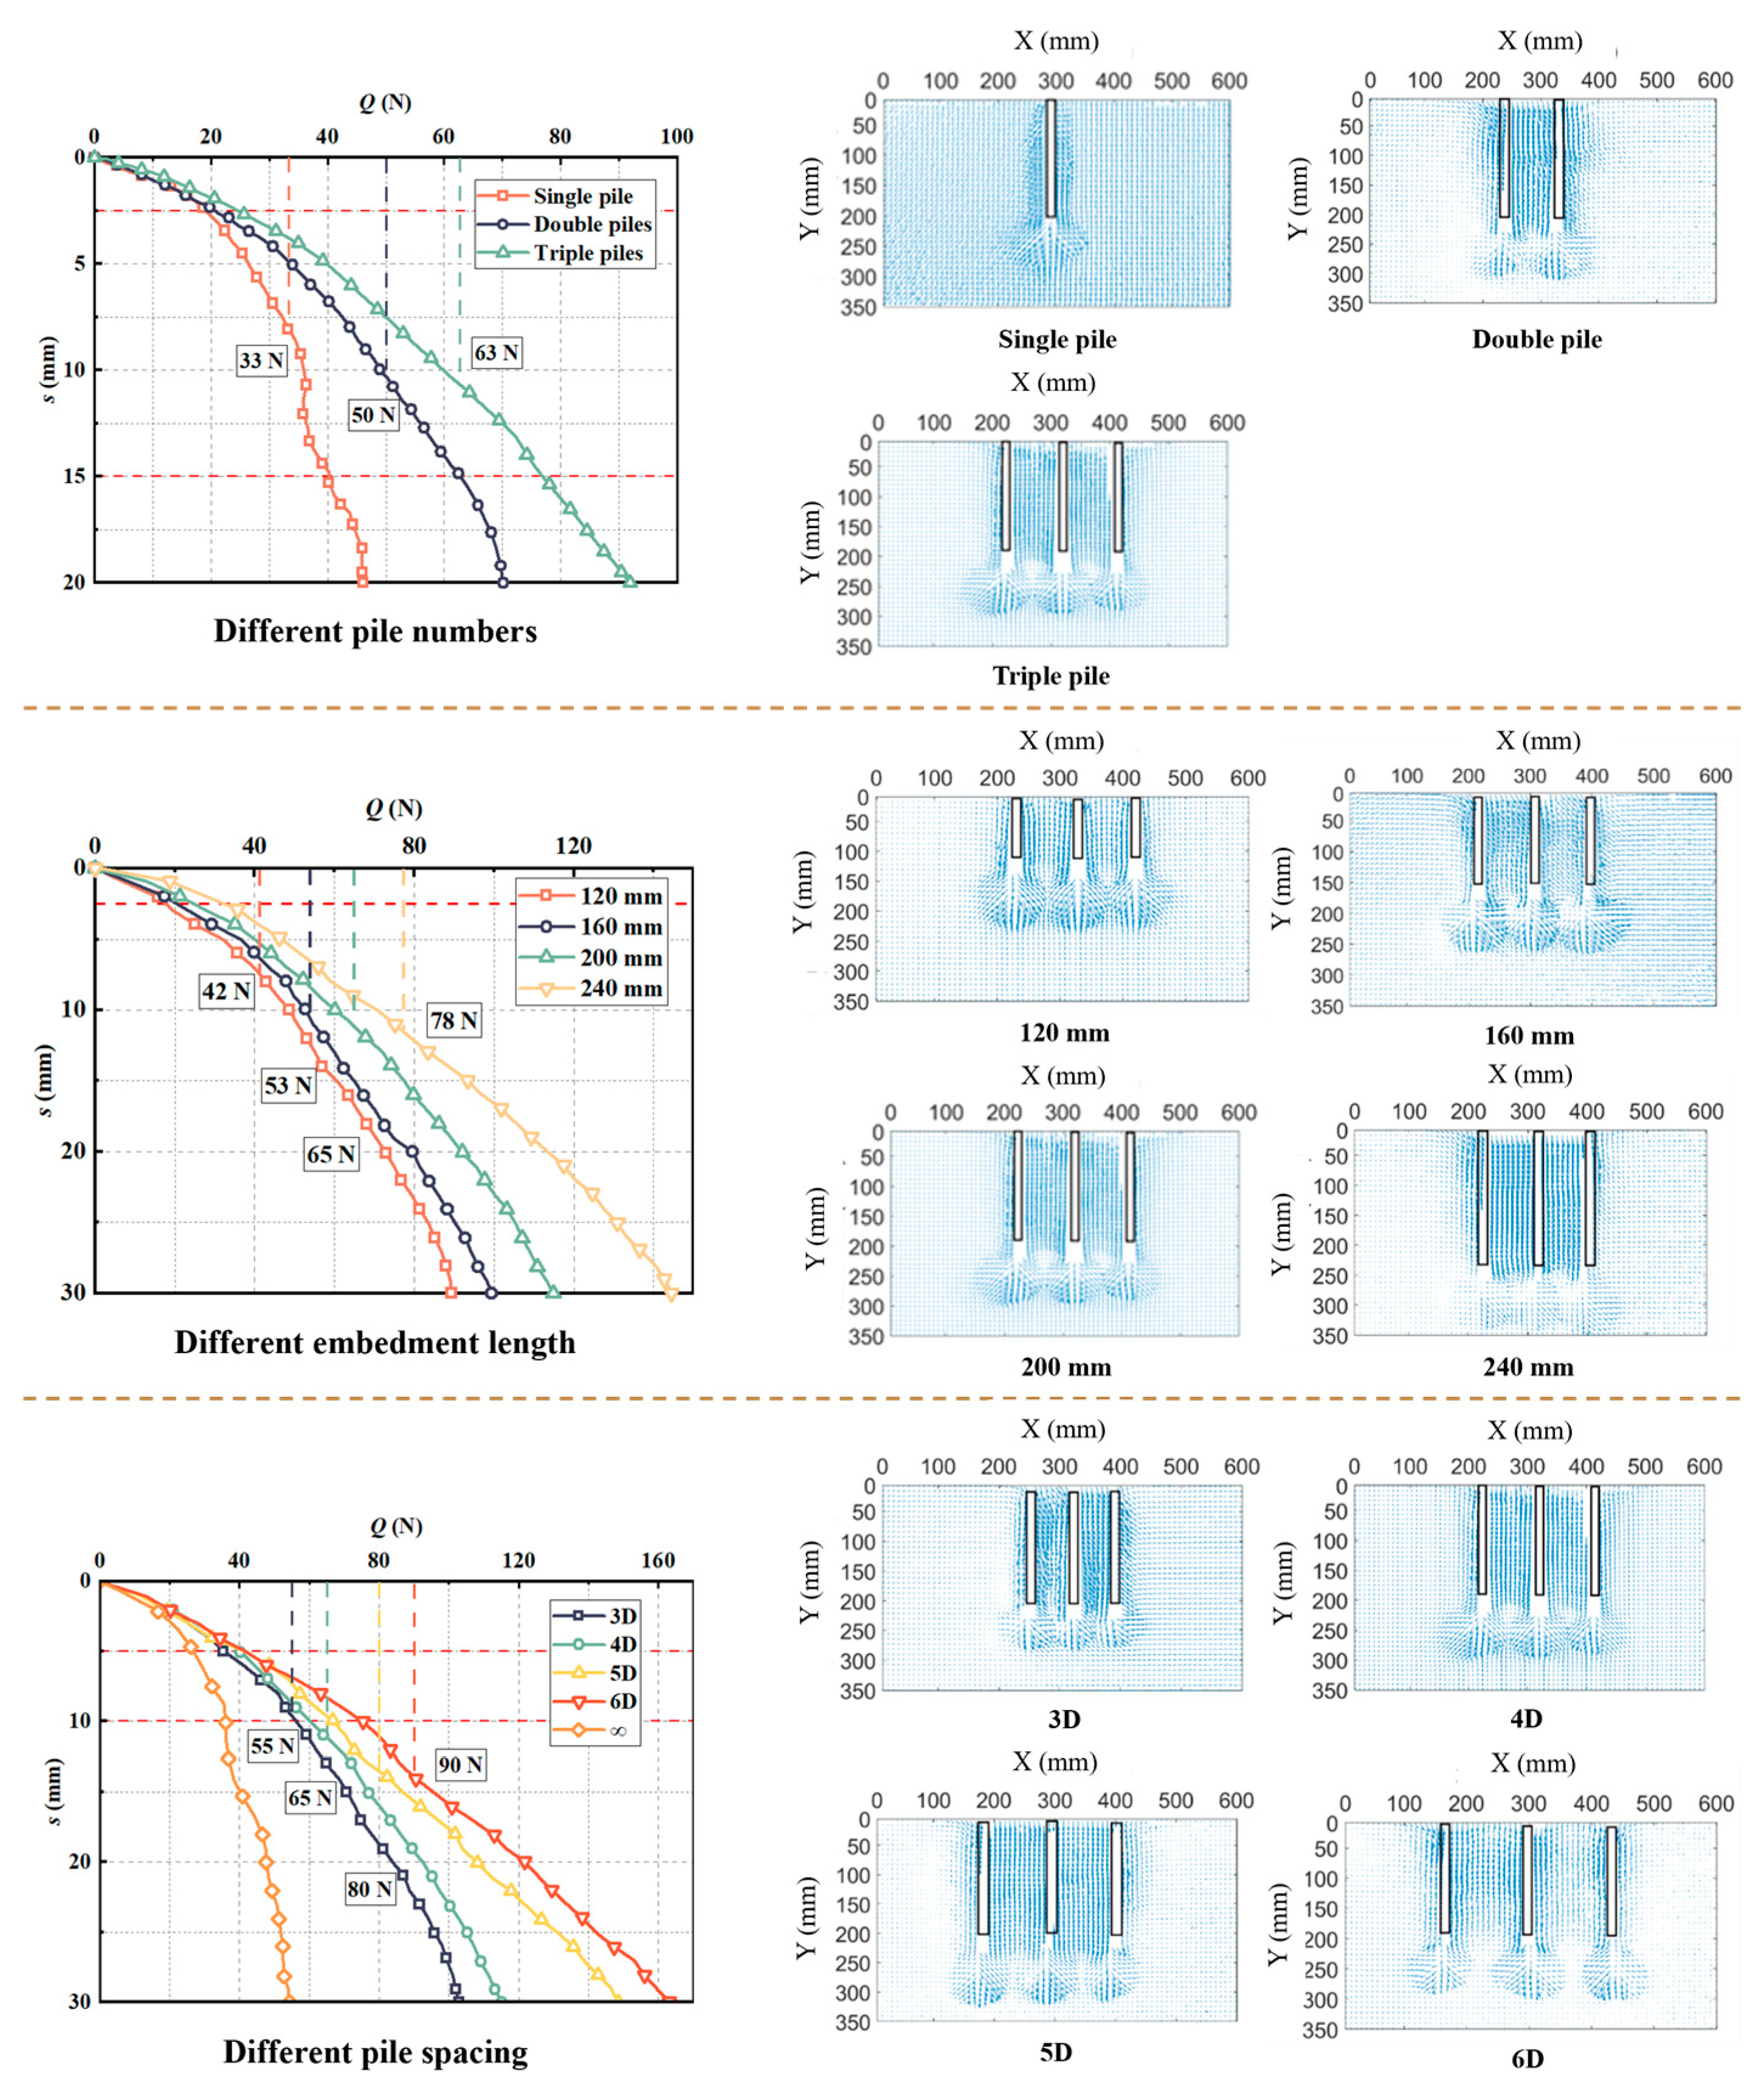
Figure 9 illustrates the variation in the group effect coefficient with the number of piles, embedment depth, and pile spacing. Under ultimate bearing capacity conditions, the coefficients were determined to be 1.00, 0.75, and 0.64 for single, double, and triple piles, respectively. This decreasing trend indicated that as the number of piles increased, the group effect was intensified, which in turn constrained the mobilization of the ultimate capacity of each individual pile. When the embedment depth was increased from 120 mm to 240 mm, the coefficient decreased from 0.70 to 0.63, suggesting that the development of the deep soil shear band was restricted by the group effect. For pile spacings of 3D, 4D, 5D, and 6D, the coefficients were 0.56, 0.66, 0.80, and 0.91, respectively. This result demonstrated that a wider spacing mitigated the stress concentration in the soil between piles, thereby enhancing the soil-pile load transfer effect. Furthermore, as the settlement increased from 5 mm to 30 mm, the group effect coefficient showed a corresponding increase, which suggested that the group effect decreased as pile installation progressed. Consequently, optimal group performance can be achieved by minimizing the number of piles and the embedment length while maximizing the pile spacing and allowing for a controlled settlement. The group effect coefficient was calculated as follows:
η = P u n × Q u
where η is the group effect coefficient, P u and Q u are the ultimate vertical bearing capacities of the pile group and a single pile, n is the total number of piles.

3.3.2. Load-Settlement (Q-s) Curve

The load-settlement curves for single, double, and triple pile configurations exhibit three distinct stages (see Figure 10). Initially, the curves displayed a linear response under settlements below 2.5 mm, indicating elastic deformation of the soil. Subsequently, within the settlement range of 2.5–15 mm, the soil surrounding the piles underwent strain hardening, characterized by a progressive reduction in load-increment rate. Beyond 15 mm settlement, the curves diverged, with the triple pile configuration sustaining the highest load. The ultimate bearing capacities were 33 N, 50 N, and 63 N for the single, double, and triple pile configurations, respectively. This enhancement was attributed to the enlarged pile-soil contact area and increased lateral friction [38], which improved the bearing capacity of the pile group. As pile number increases, overlapping soil displacement zones between adjacent piles inhibit mobilization of individual pile bearing capacity. Displacement vector field analysis revealed that increased pile numbers reduced soil displacement at pile tips and induced loosening of inter-pile soil.
As embedment length increased from 120 mm to 240 mm, the ultimate bearing capacity rose from 42 N to 78 N. The corresponding Q-s curve exhibited a smooth nonlinear response without a distinct inflection point. This indicated an approximately linear load-settlement relationship during pile installation. Deeper embedment promoted progressive development of soil displacement along the pile shaft, enhancing friction and mechanical interlock between the pile and adjacent soil [39]. Consequently, vertical displacement of soil under the pile tip diminished.
For triple pile groups with spacings ranging from 3D to 6D, the Q-s curves displayed two distinct stages. When settlement was below 5 mm, all curves exhibited overlapping linear response due to the small group effect. At this stage, pile spacing exerted negligible influence on group capacity. Beyond s = 5 mm, group effects emerged, causing curve divergence. Ultimate bearing capacity increased from 55 N (3D) to 90 N (6D). The most significant improvement (ΔQ = 22 N) occurred between 4D and 5D spacing [40]. Vector field analysis confirmed maximal inter-pile soil displacement at 3D spacing. At 6D spacing, displacement fields remained independent and aligned with that of individual piles. When spacing exceeded 5D, the bearing capacity of one pile in the group approached the single-pile bearing capacities.

3.3.3. Local Displacement Field

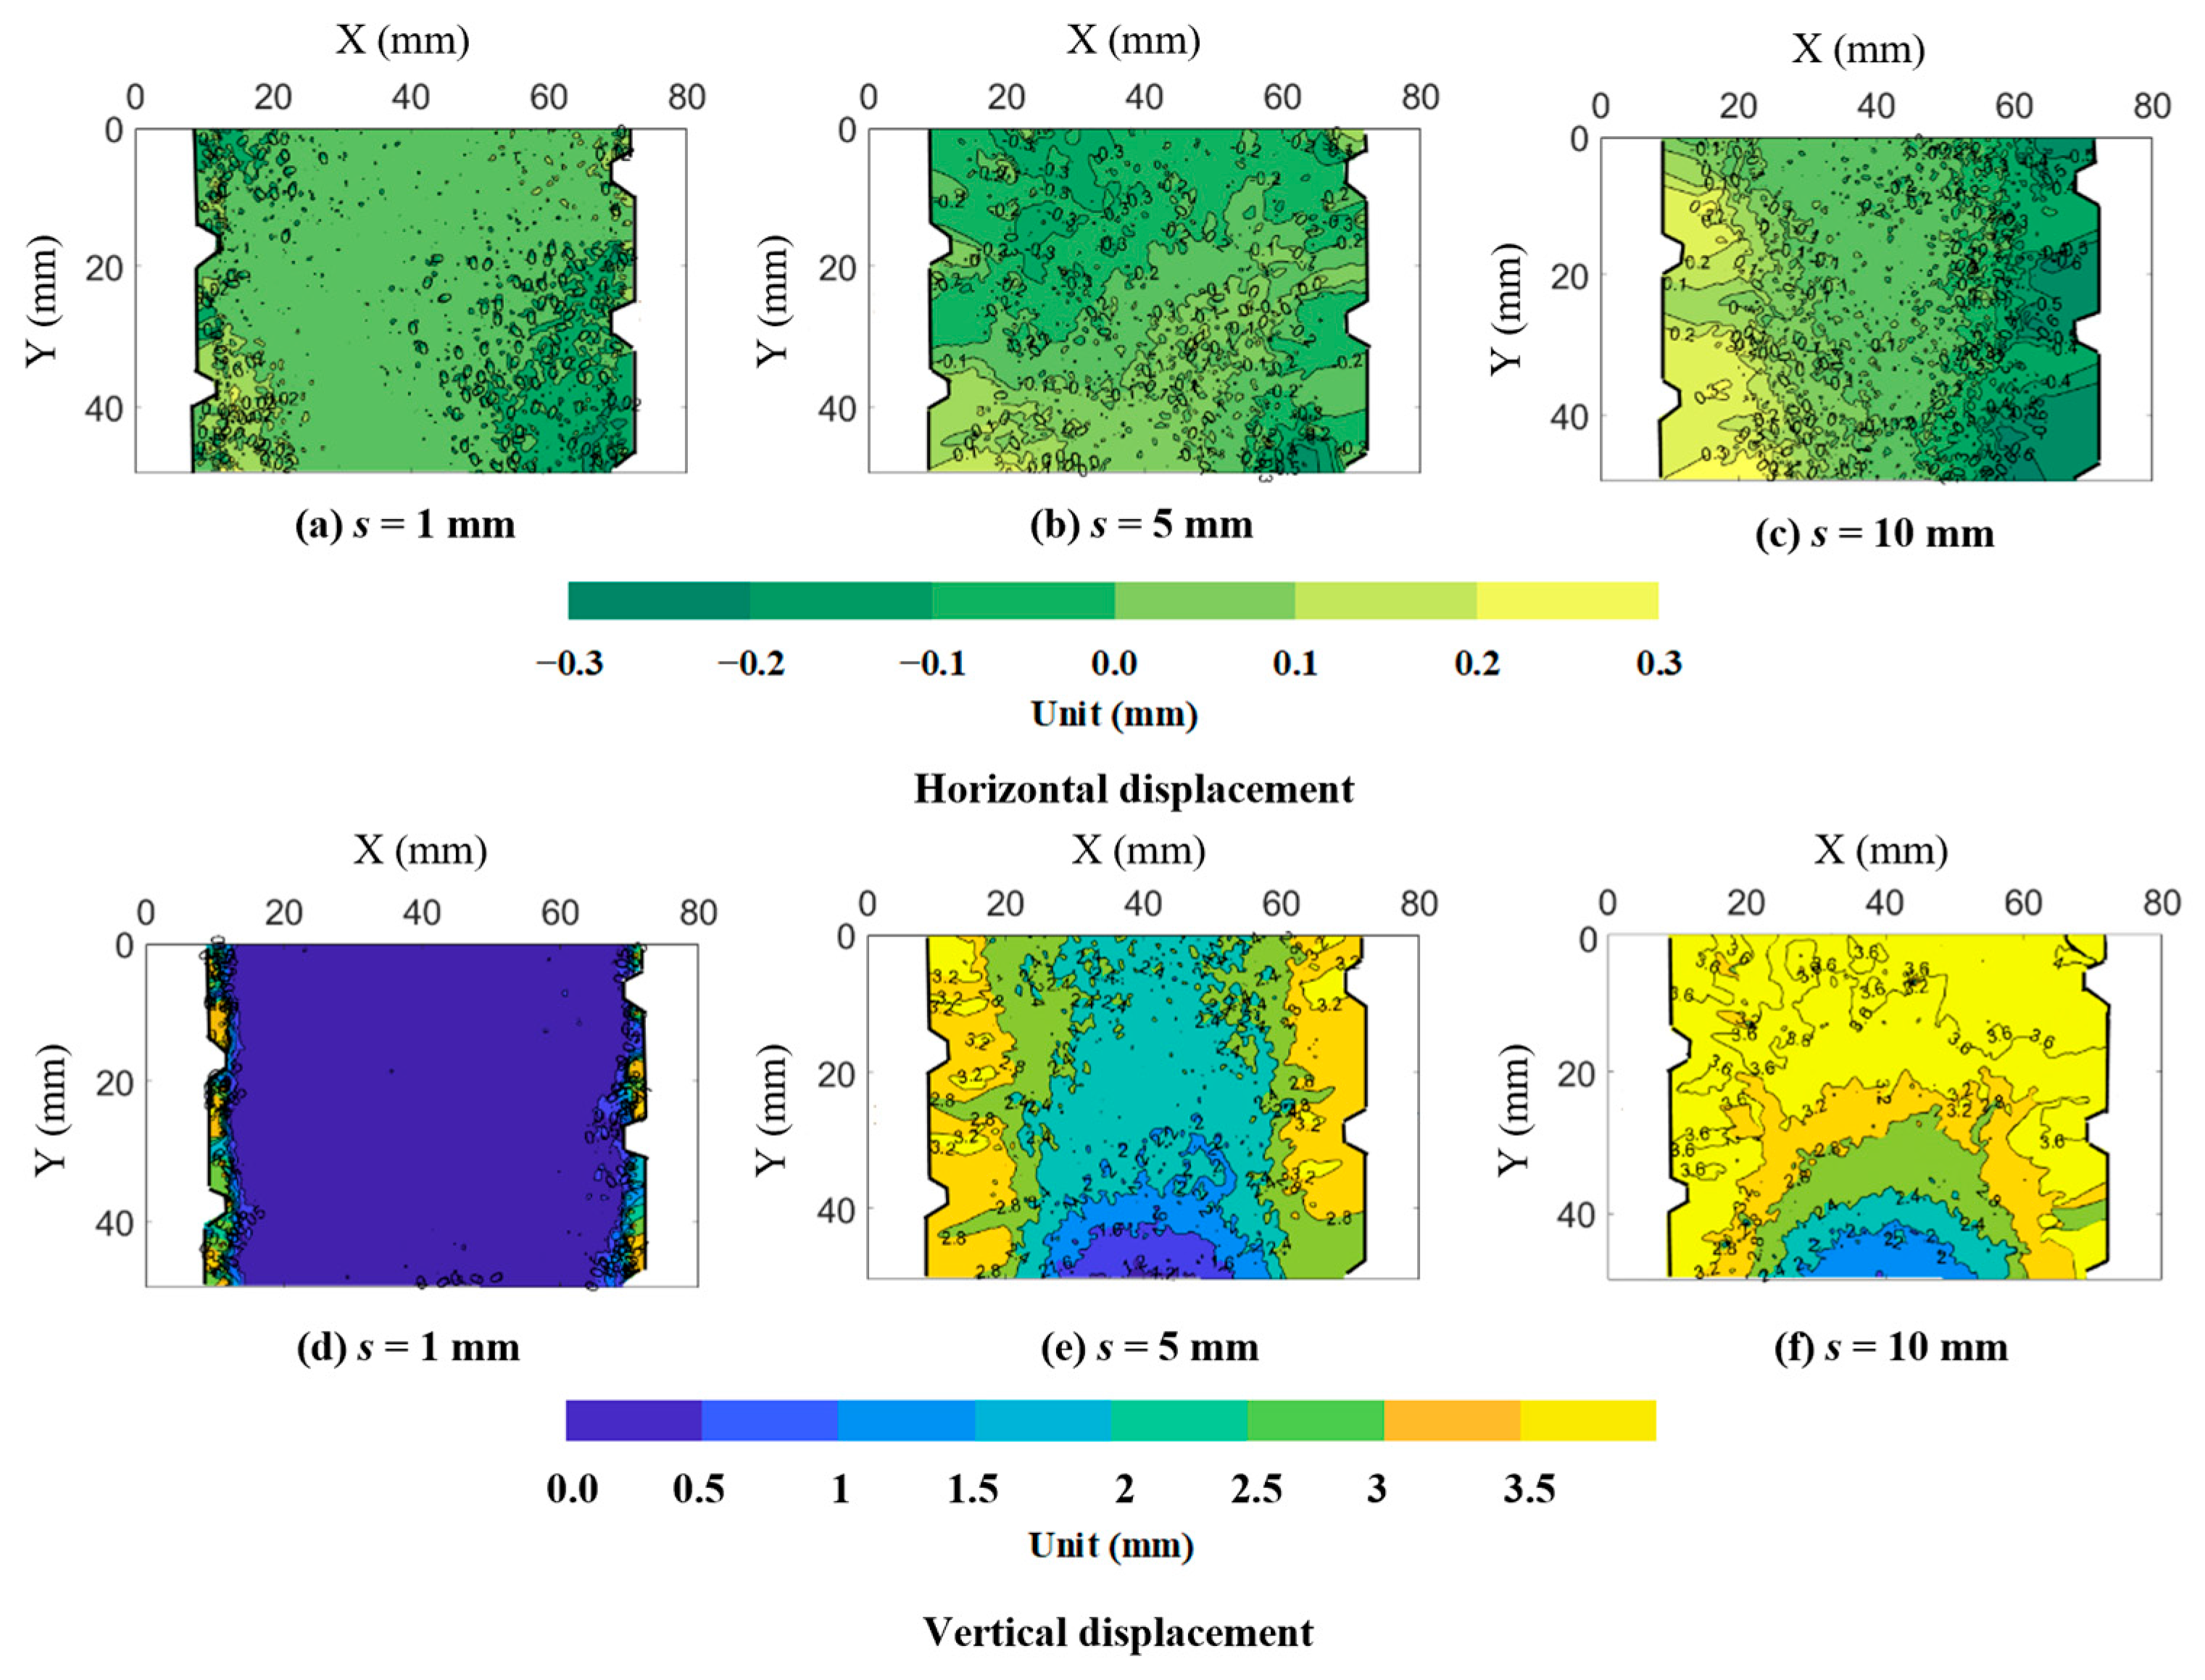
Based on digital image correlation (DIC) technology, the development of horizontal and vertical soil displacements around screw piles was analyzed (see Figure 11). For the horizontal displacement field, when s = 1 mm, soil displacement was primarily concentrated near the threads. Maximum displacement was approximately 0.05 mm, forming an irregular arching pattern along the threads. As s = 5 mm, the soil displacement zone expanded diffusely, reaching a maximum displacement of 0.15 mm. At this stage, the compaction effect of piles on inter-pile soil confined soil displacement. At s = 10 mm, the displacement zone enlarged, with maximum displacement up to 0.3 mm. The displacement induced by the central pile is larger than that of the side piles.
In the vertical displacement field, isolated displacement zones around each pile were observed at s = 1 mm, with maximum displacement of only 0.1 mm. As pile installation (s = 5 mm) progressed, the displacement zone around the central and side piles expanded downward from the ground surface, reaching a maximum displacement of 0.2 mm. By s = 10 mm, displacement contours propagated downward in an arched pattern and extended laterally to affect the entire inter-pile soil, with maximum displacement approaching 0.5 mm.
Each thread on the screw pile functions as a platform plate, generating a concentration of shear and normal stress. As pile installation, the soil around threads transitioned from an elastic to a plastic state, with progressive expansion and interconnection of plastic zones, ultimately triggering soil bulging and ground settlement in the soil mass.

4. Numerical Simulation

Model tests were conducted to investigate the macroscopic load-transfer mechanisms and group effects of screw piles. Due to experimental constraints, model tests cannot characterize mesoscopic phenomena at the soil-pile interface. Therefore, DEM was employed to study these underlying mechanisms and validate experimental findings.

4.1. Model Setup

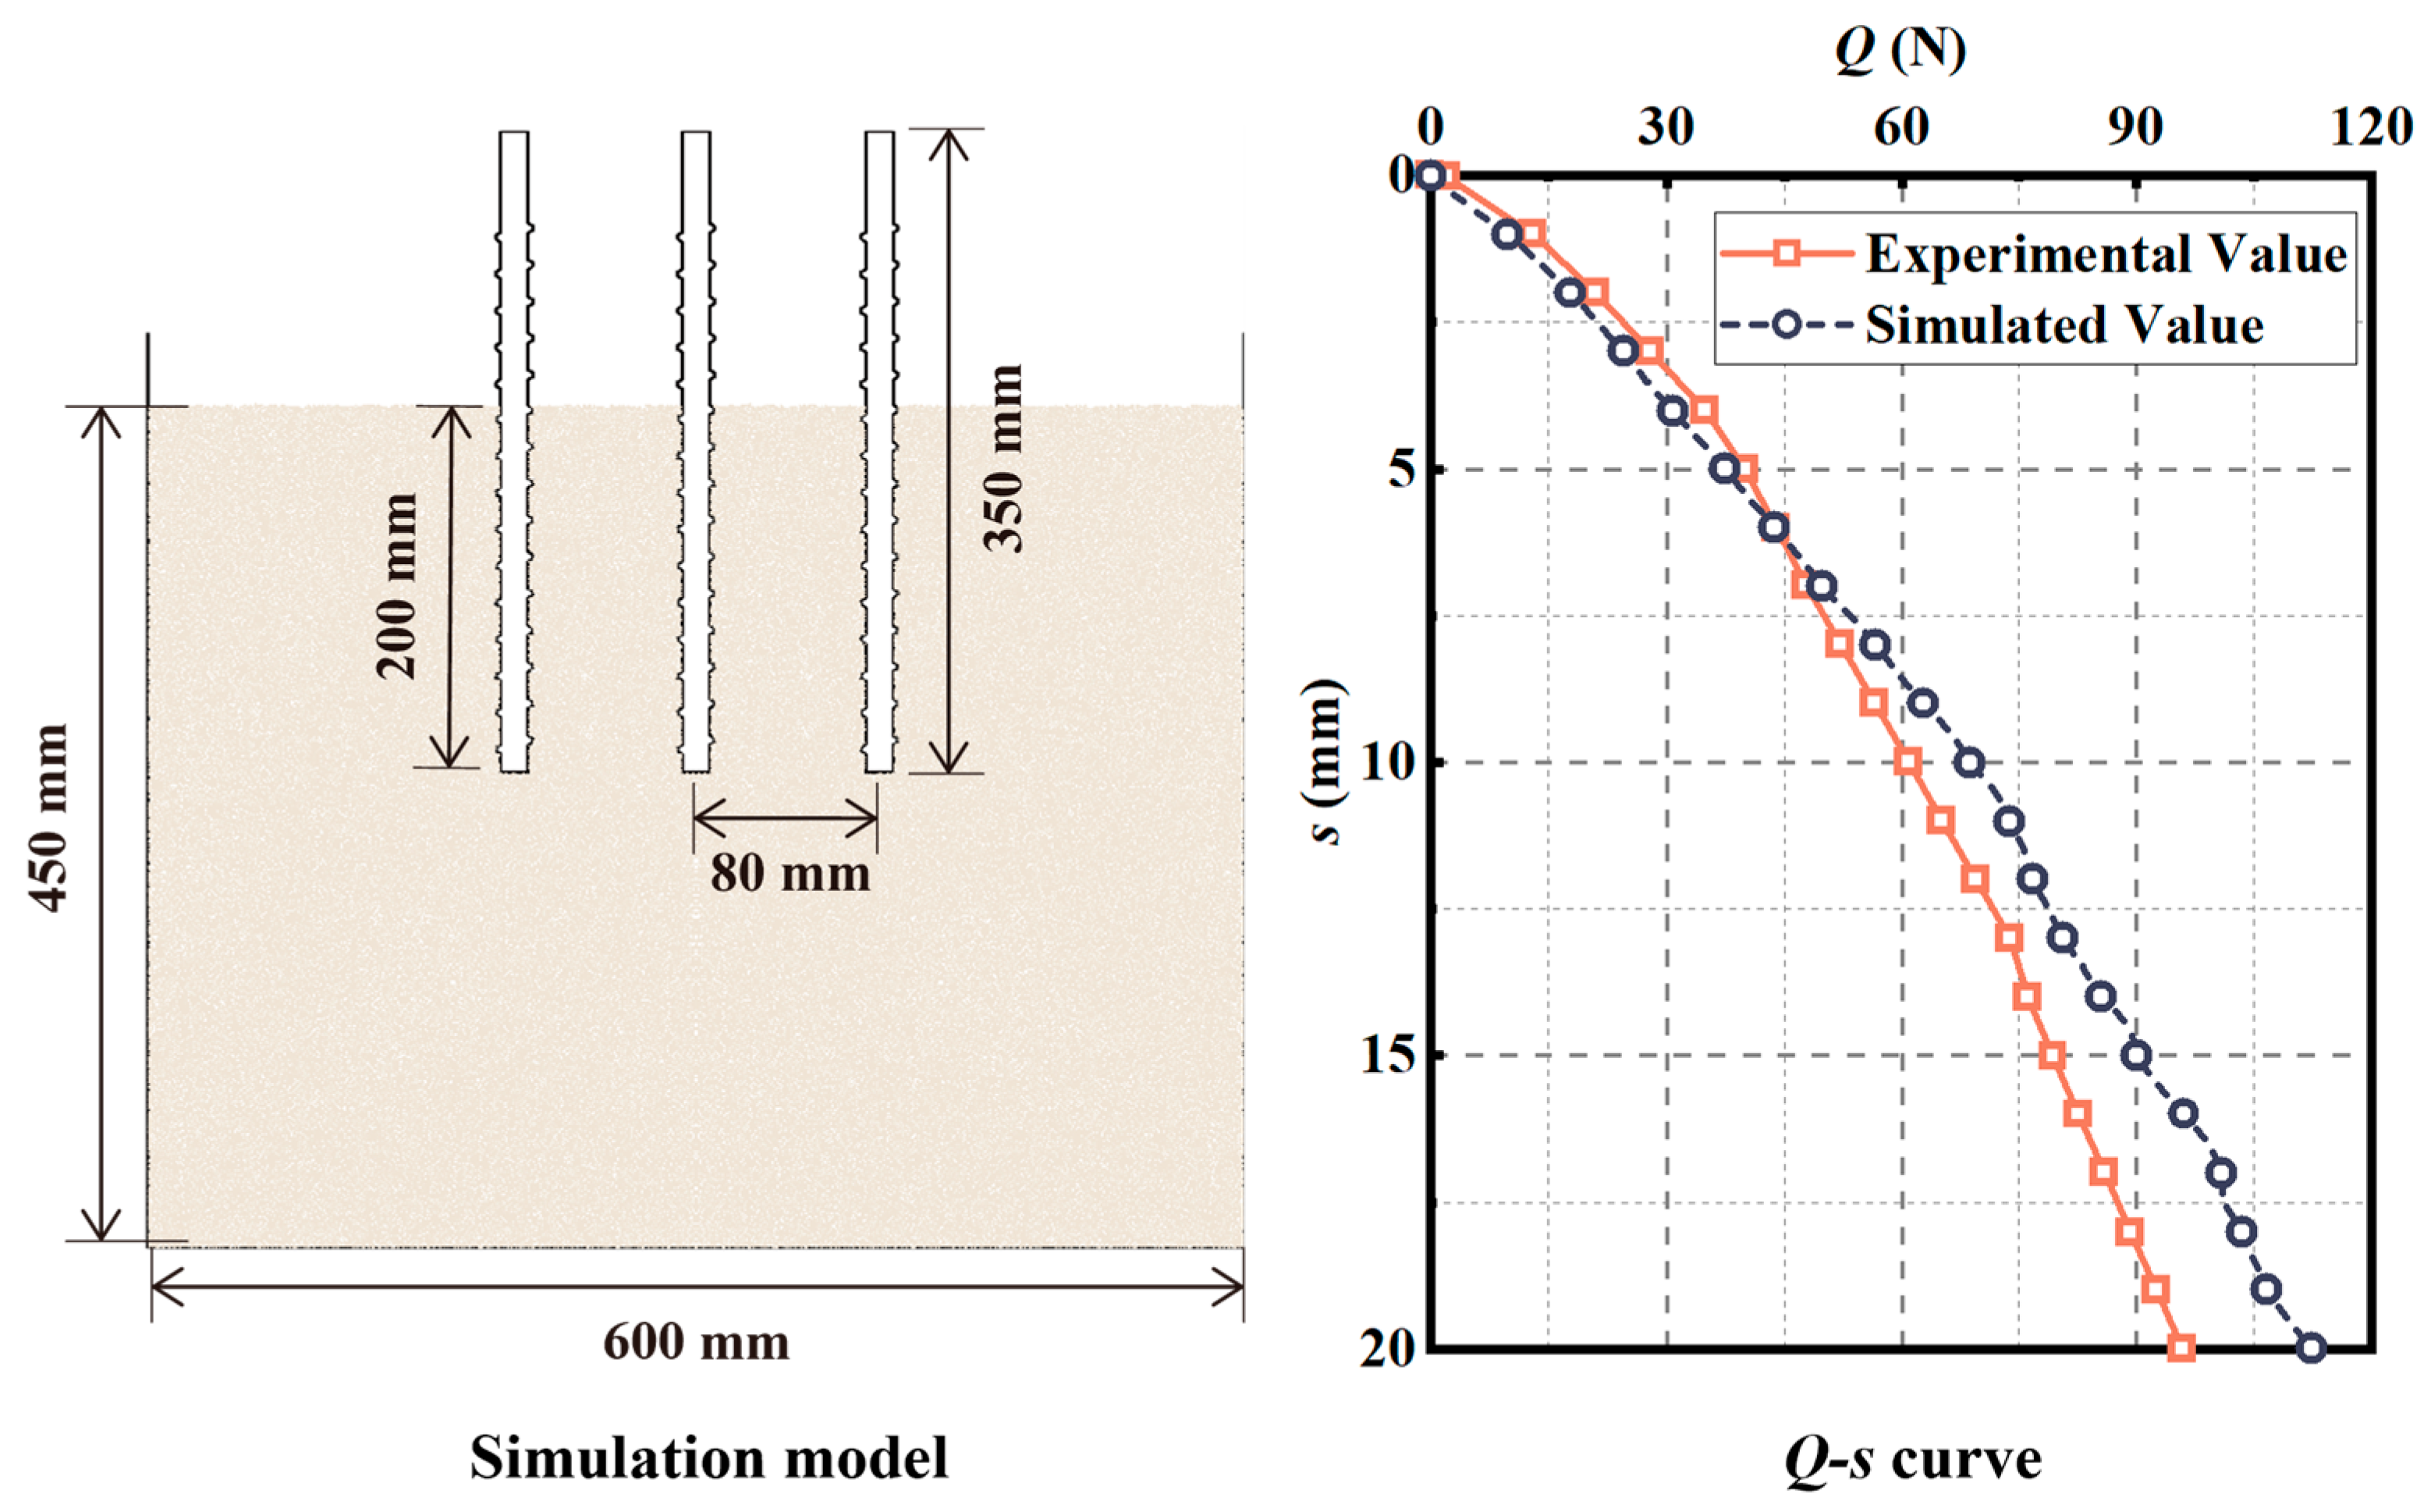
The numerical model adopted grain diameter distribution matching that of model tests (see Figure 3). To enhance computational efficiency while ensuring simulation accuracy, the minimum particle diameter was set at 0.25 mm, as size effects become negligible when the average particle diameter is less than 1/30 of the model dimensions [41]. Additionally, boundary effects were minimized by maintaining distances exceeding 10D between the screw pile group and model tank. Particle contact parameters were calibrated through pile installation with experimental data, adjusting normal stiffness, shear stiffness, friction coefficient, and damping coefficient until the simulated load-settlement curve converged with the experimental curve. Error percentages between simulated and experimental Q-s curves remained below 10%, validating the reliability of calibrated soil parameters (see Figure 12). Calibrated soil parameters are summarized in Table 3, with numerical simulation conditions detailed in Table 4.

4.2. Validation Analysis

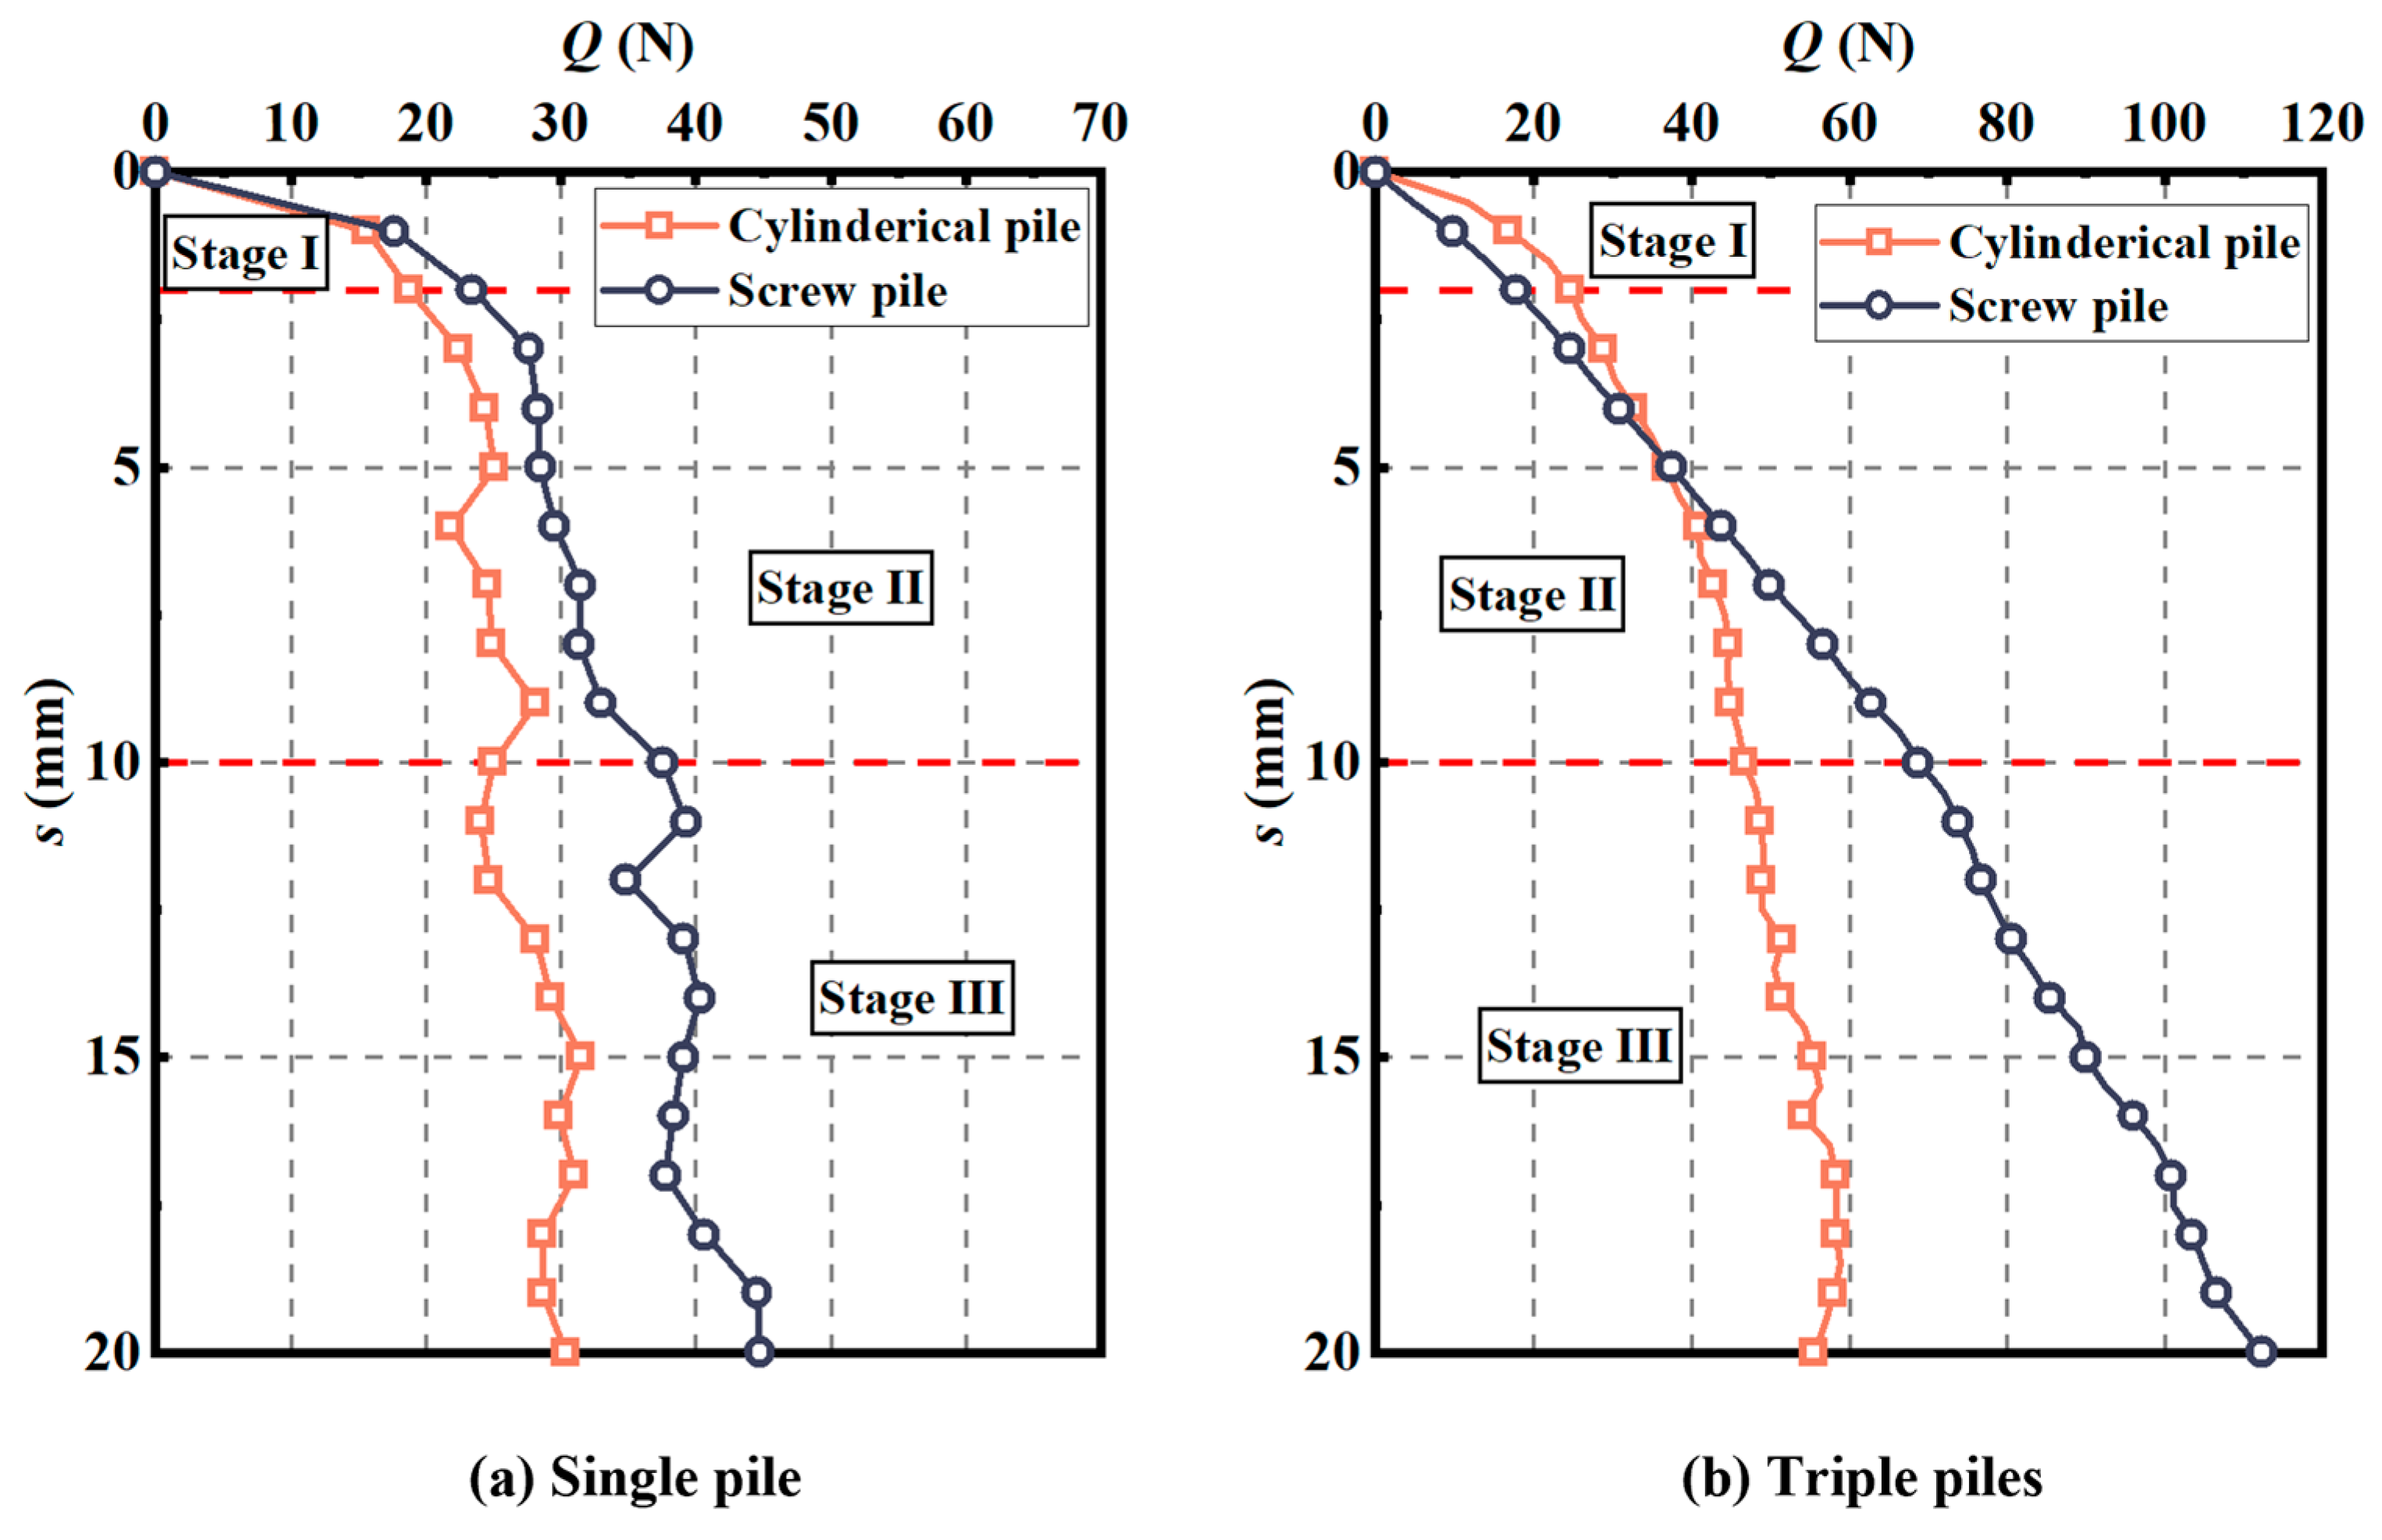
Figure 13 presents the load–settlement curves for cylindrical piles and screw piles. Compared to cylindrical piles, screw piles exhibited higher bearing capacity at the same settlement levels. Simulation results indicated that for single piles at an embedment length of 200 mm, both pile types displayed a three-phase response: linear elastic phase (s < 2 mm), elasto-plastic phase (2 mm < s < 8 mm), and residual load phase (s > 8 mm). The ultimate bearing capacity of a single screw pile was approximately 1.5 times that of a cylindrical pile. For pile groups, the Q-s curve of screw piles showed continuous load increase without a residual load phase, with an ultimate bearing capacity roughly double that of cylindrical pile groups. Compared to single piles, the screw pile group achieved about 1.9 times the ultimate bearing capacity of the single pile, while the cylindrical pile group only reached approximately 1.7 times. This trend was attributed to the threads on screw piles increasing the contact area between soil and piles, distributing loads through both threads and shafts to a larger soil volume, and compacting soil between piles, thereby improving soil strength.
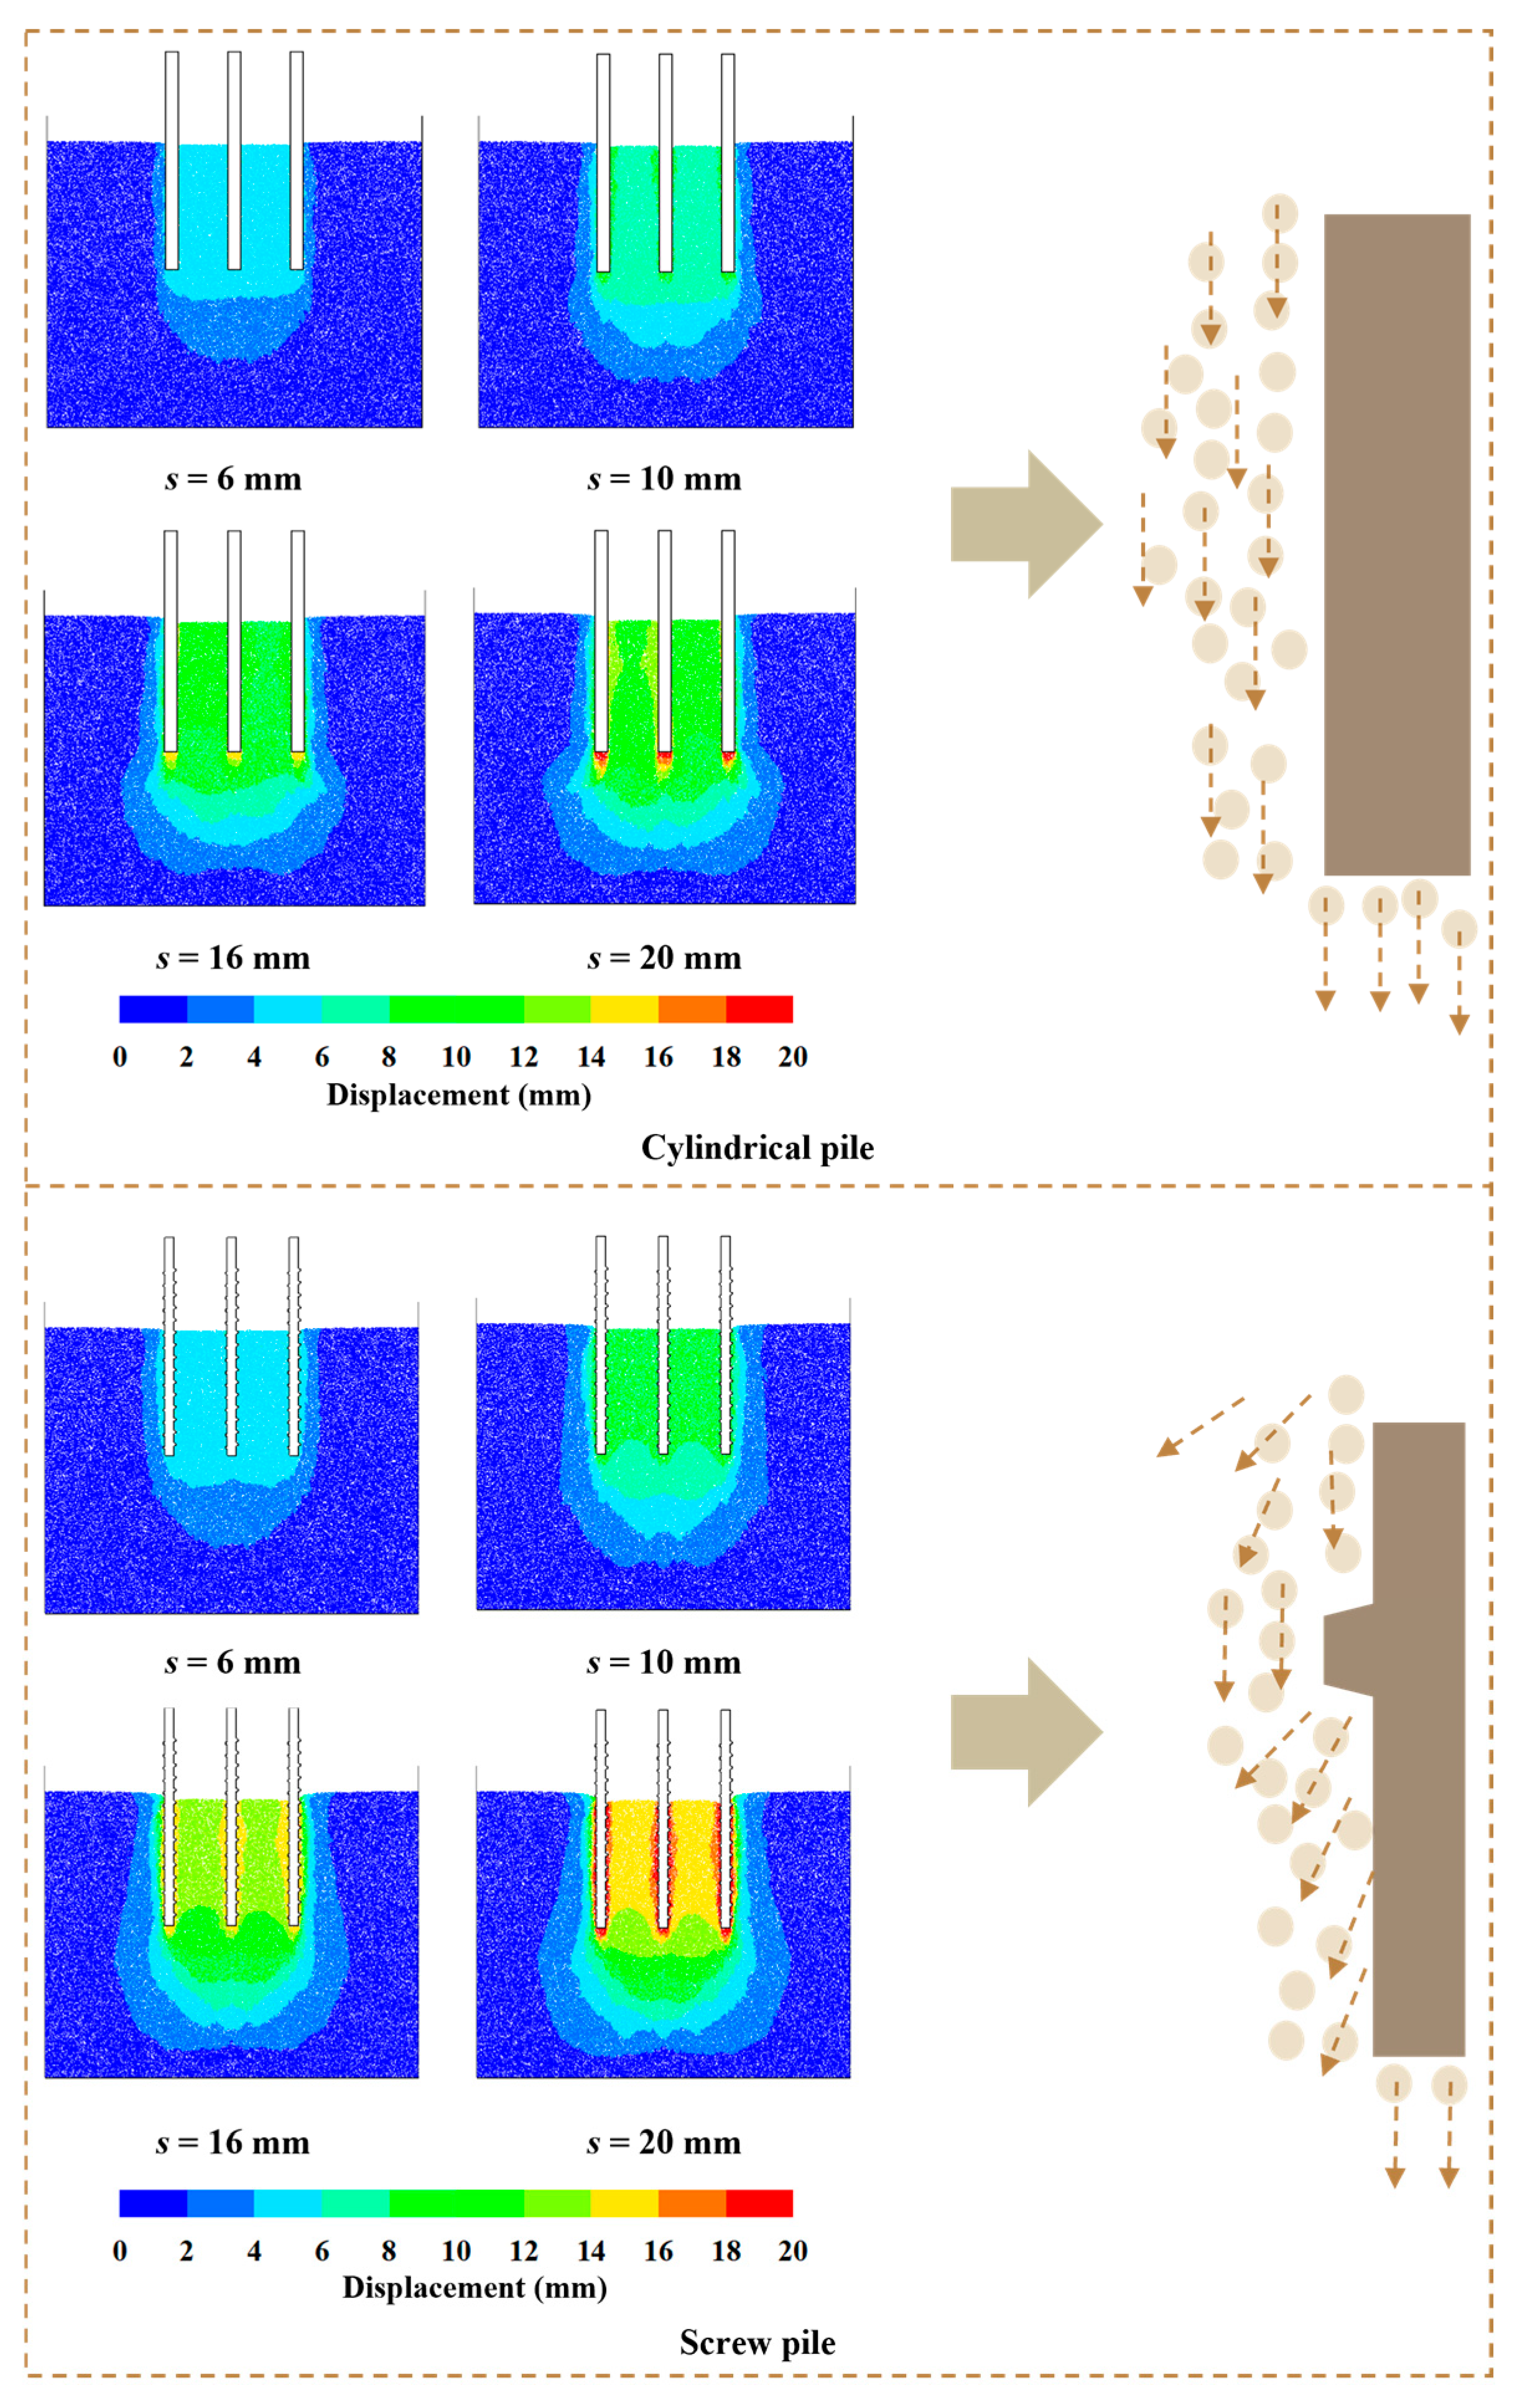
Figure 14 reveals that soil displacement around cylindrical piles is concentrated near the pile tip. In contrast, screw piles expanded the pile-soil contact area through threads, imposing both compressive and shearing actions on the soil during pile installation. This resulted in a more complex and broader displacement field around screw piles, with pronounced shear deformation localized at the threads. As settlement increased from 6 mm to 20 mm, the soil near the pile evolved from localized elastic deformation to widespread plastic deformation. At settlements of 6–10 mm, displacements remained confined to the vicinity of the pile shaft. Between 16 and 20 mm settlement, wedge-shaped heave and arched displacement bands formed along the screw pile shaft, culminating in a hemispherical displacement zone at 20 mm settlement, where displacement attenuated rapidly from the threads toward the far field. Conversely, soil displacement around cylindrical piles exhibited a more uniform zone with a gentler attenuation gradient. Quantitative analysis demonstrated that at 20 mm settlement, the soil displacement width of screw piles was approximately 2.6D, compared to 1.8D for cylindrical piles, indicating a 40% increase in displacement width attributable to the threads.
Particle rotations derived from DEM simulations demonstrated a distinct correlation with theoretical logarithmic-spiral shear surfaces (see Figure 8 and Figure 15). At s = 6 mm, rotation bands were identified at the outer edges of the side piles, where clockwise and counterclockwise rotations corresponded with the initial spiral trajectories around the threads. Minimal rotation in the inter-pile region indicated kinematic constraints between piles, which restricted both particle rotation and shear band formation. As settlement reached 10 mm, the spiral rotation intensified along the threads and extended into inter-pile zones, indicating the expansion of mid-spiral segments. At 16 mm, the rotation bands from neighboring piles coalesced, signifying the establishment of a continuous shear network. At 20 mm, peak rotation magnitudes and overlapping spirals defined a compound failure zone.
The observed trends corresponded with experimental findings that revealed a two-stage failure mechanism. During the initial stage, a distinct spiral shear band formed between the threads, leading to a swift load-settlement response. During the second stage, the spiral shear band expanded outward and interconnected, resulting in a compound spiral failure band.
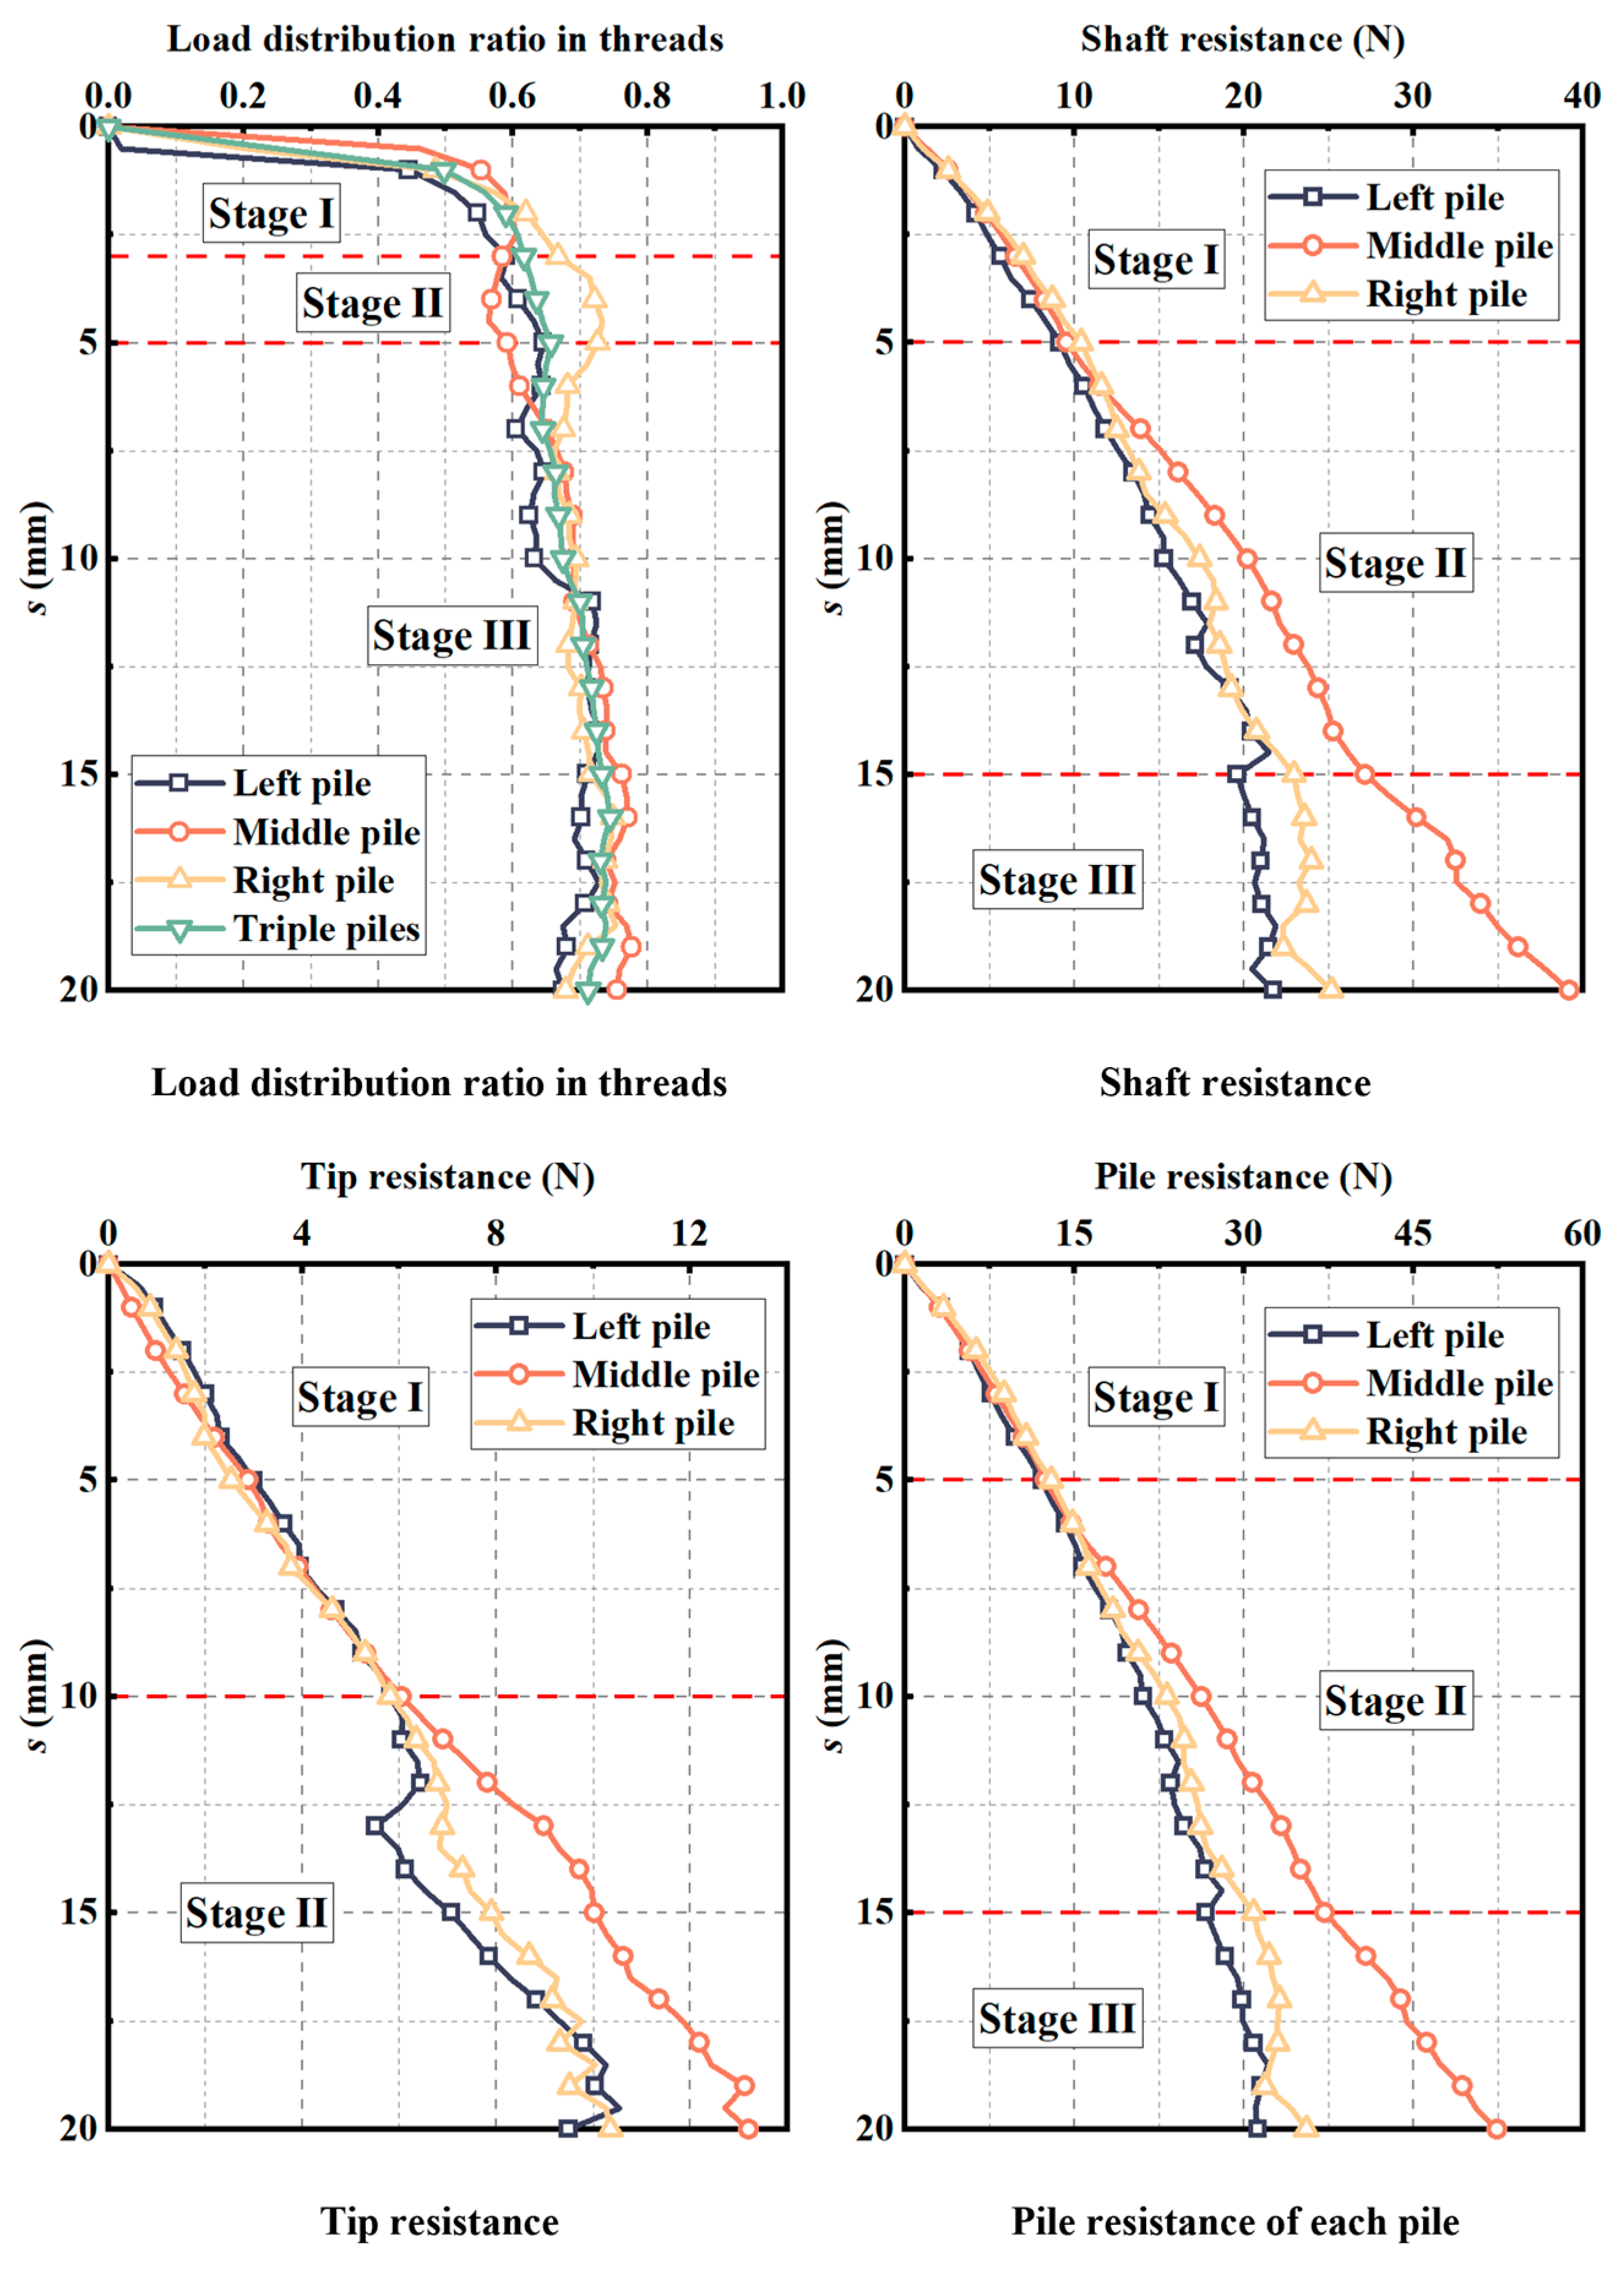
The first picture of Figure 16 illustrates the load resisted by the thread in each pile. In all configurations (left, middle, and right piles), the proportion of load supported by the threads increased significantly as settlements progressed from 0 mm to 3 mm, ultimately reaching 75–80% of the ultimate capacity of each pile. For values exceeding s = 3 mm, this ratio remained stable in the range of 75–80%. In the triple-piles group, the curves for the left and right piles closely aligned with the aggregate triple-pile thread contribution curve, while the middle pile demonstrated a delay in mobilizing thread resistance. The contribution of the middle pile thread capacity reached its maximum at s = 5 mm, suggesting a delayed engagement resulting from an intensified group effect. The delay may be due to the redistribution of soil stresses and strain-compatibility requirements within the closely spaced pile group, resulting in the middle pile threads achieving full frictional resistance development at a greater displacement compared to the outer piles.
The load-transfer behavior along the pile was analyzed by plotting side resistance and tip resistance as Q-s curves for each pile in the group. For s < 5 mm, the side-resistance curves of all three piles demonstrated nearly linear growth, indicating rapid mobilization of skin friction with small displacements. For 5 mm < s < 10 mm, the growth of side resistance exhibited a deceleration and oscillatory increments, indicating local soil yielding or localized rearrangement around the threads. Beyond s = 10 mm, the side-resistance curves exhibited a plateau, with minor fluctuations indicating that the available friction along the pile was nearing full mobilization. In contrast, tip resistance for each pile exhibited a consistent increase across the displacement range, with no significant variation in growth rate, suggesting uniform expansion of the bearing zone at the pile base. The analysis of total resistance revealed a linear trend for s < 10 mm, followed by a transition to slower, undulating growth in the bearing capacity curves of all piles for 10 mm < s < 20 mm. The influence of side resistance on bearing capacity was evident, indicating that the screw pile group primarily operated as a frictional support system.

4.3. Mesoscopic Mechanism Analysis

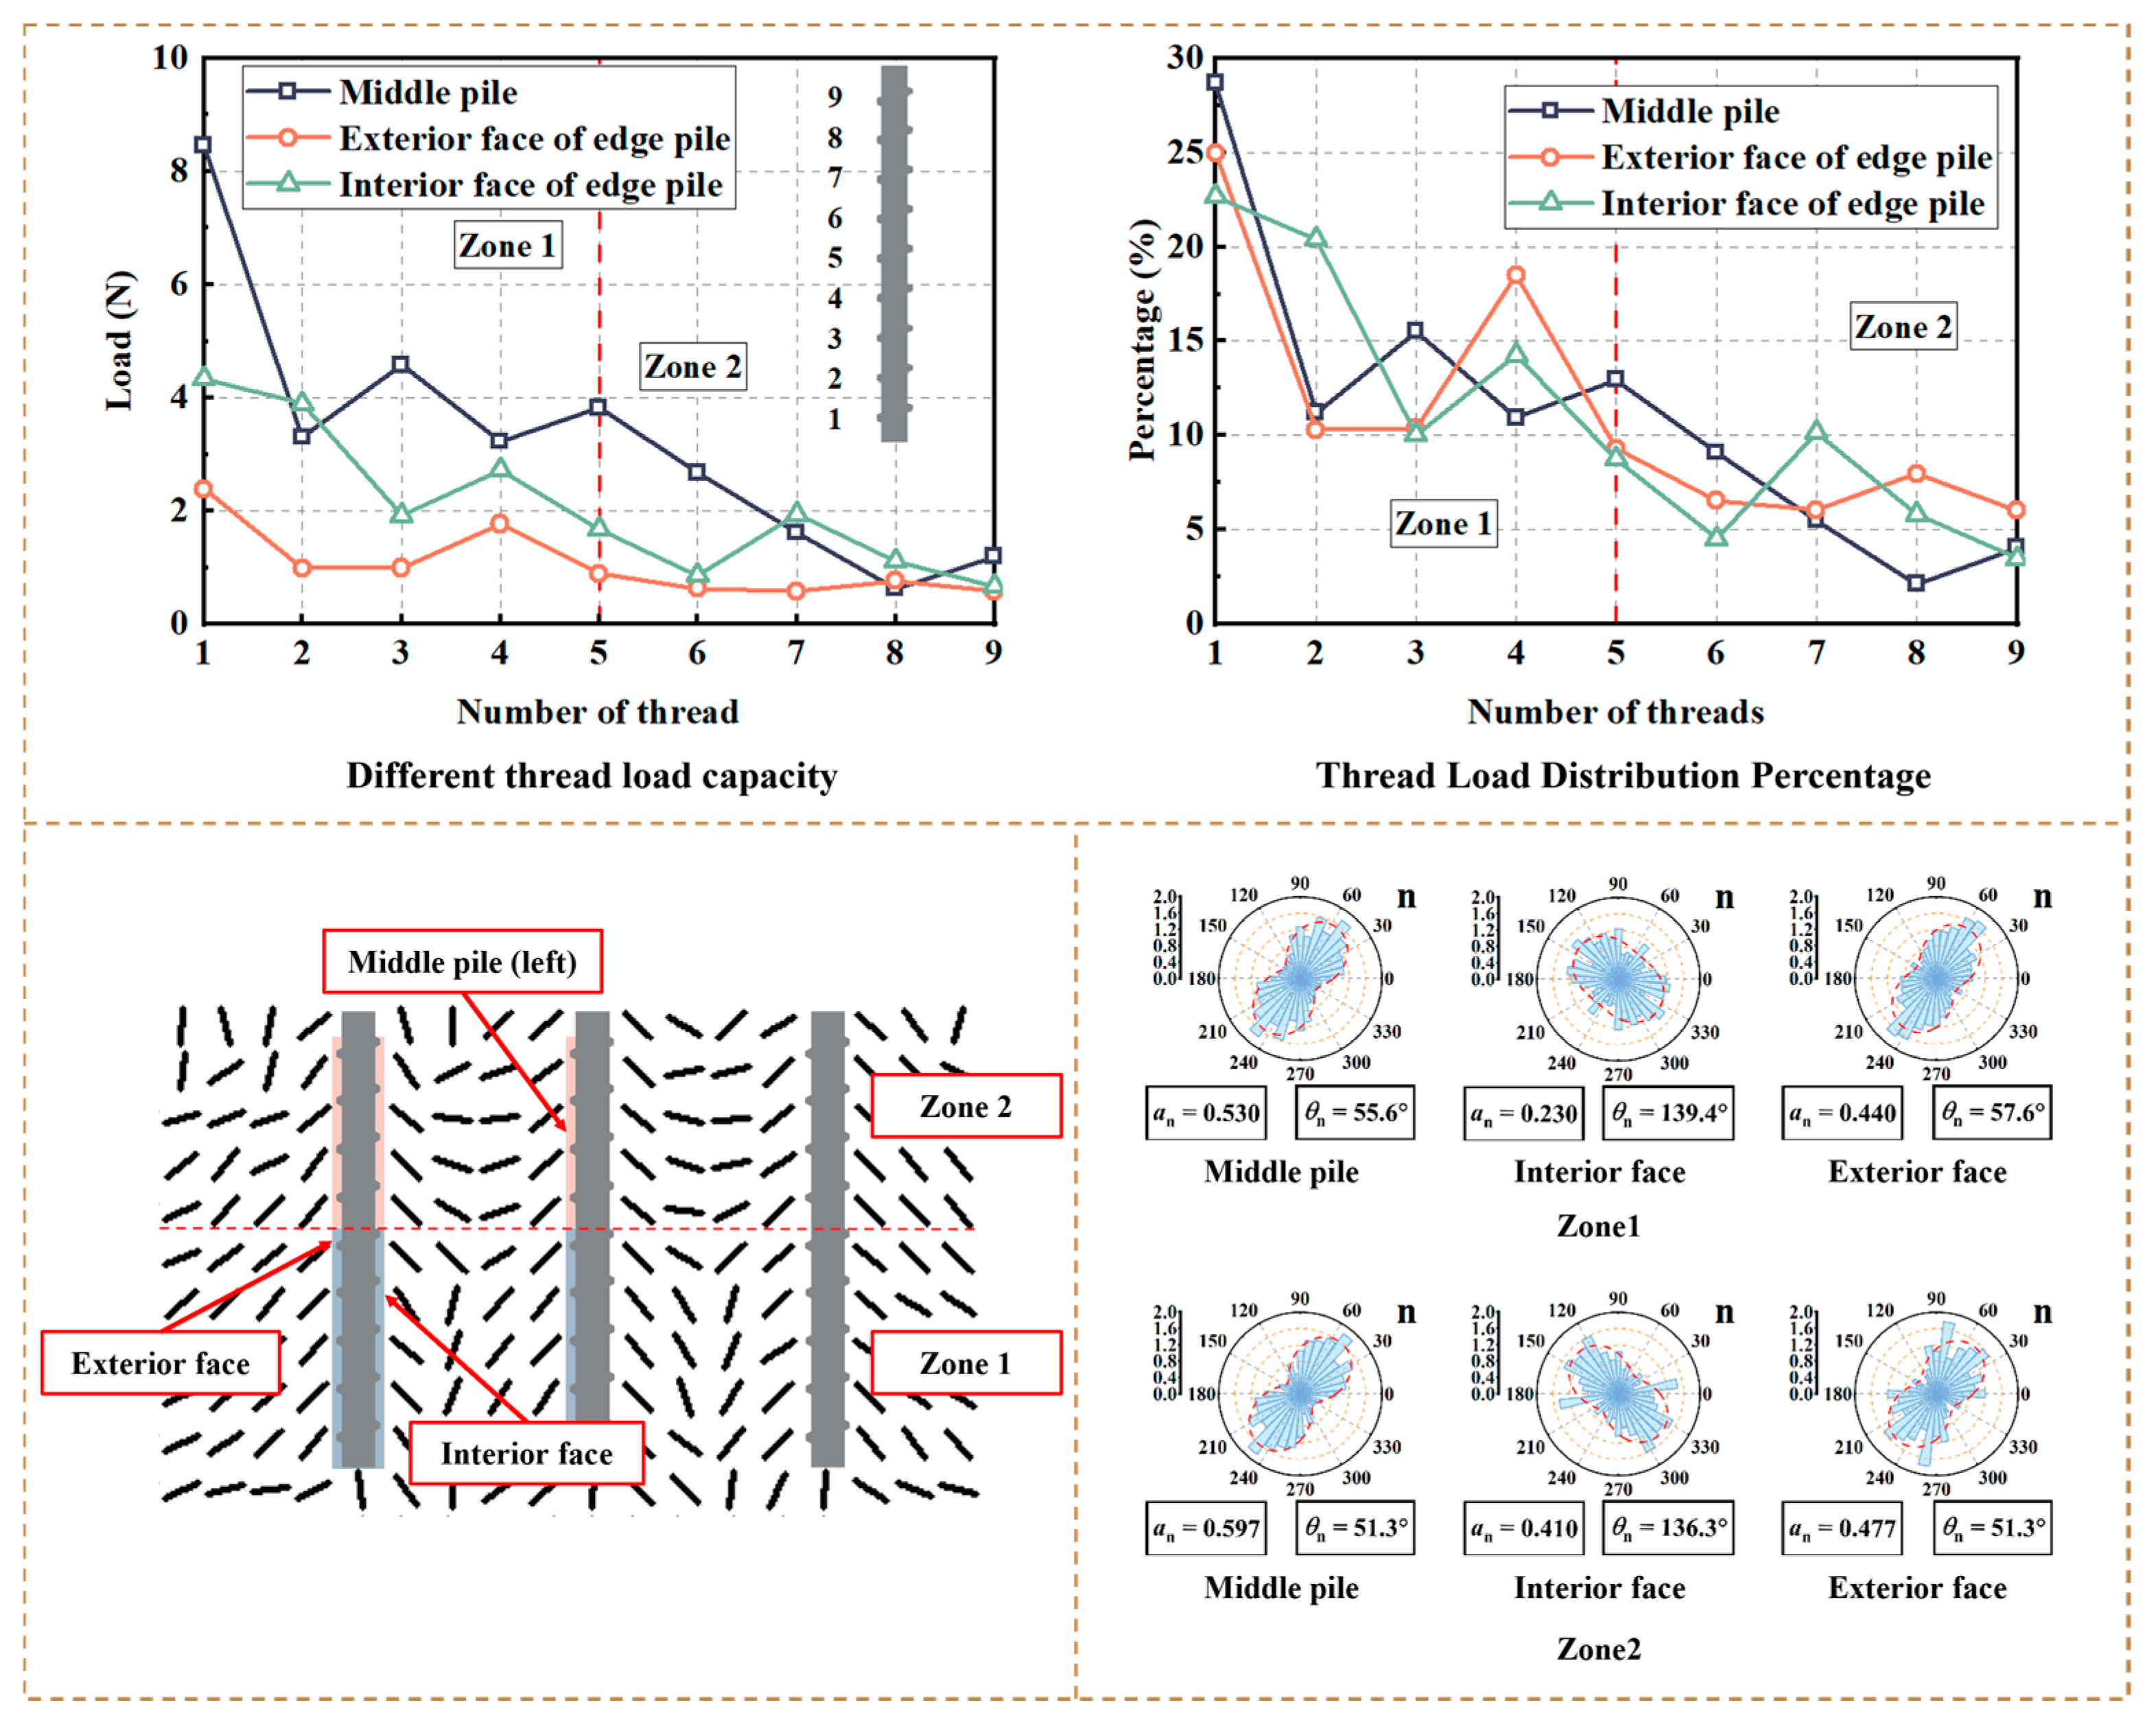
In Case 4, with a settlement of 20 mm, the thread portion supported approximately 70% of the total axial load. Threads 1–5 (Zone 1) represented the predominant source of resistance, with thread 1 bearing the maximum load. Following thread 1, the load decreased and varied among threads 2–5. Threads 6–9 (Zone 2) demonstrated a progressive decline in load share (see Figure 17). Middle pile threads supported higher loads compared to edge pile threads, while interior face threads on edge piles surpassed exterior face threads, indicating a non-uniform radial stress distribution and confinement effect. Axial stress at the pile head is transmitted to the surrounding soil via side shear along the pile body, decreasing with depth. Increased effective confining pressures and the interface friction angle contribute to enhanced lateral friction resistance. The reduction in lateral confinement restricted friction on external surfaces.
The analysis of contact normal forces on the pile surfaces indicated a clear progression of the granular fabric from Zone 1 (threads 1–5) to Zone 2 (threads 6–9). An observable intensification of contact anisotropy ( a n ) from Zone 1 to Zone 2 indicates the progressive development of structured, load-bearing force chains. The structural evolution was accompanied by a systematic rotation of the mean normal force orientation ( θ n ), indicating a reorganization of the contact network during deformation.
The middle pile consistently exhibited the most significant anisotropic fabric, while the interior face of the edge pile displayed the least anisotropy. The observed disparity results from the symmetric confinement of the middle pile, which enabled the development of stable, highly oriented force chains that enhance load transfer efficiency. The interior face of the edge pile, located within the complex stress field of the pile group, exhibited diffuse force transmission pathways, leading to a less organized and more isotropic contact structure. It can be seen that there was a positive correlation between the pile resistance and the contact anisotropy strength a n , and a negative correlation between the pile resistance and the contact normal direction θ n .
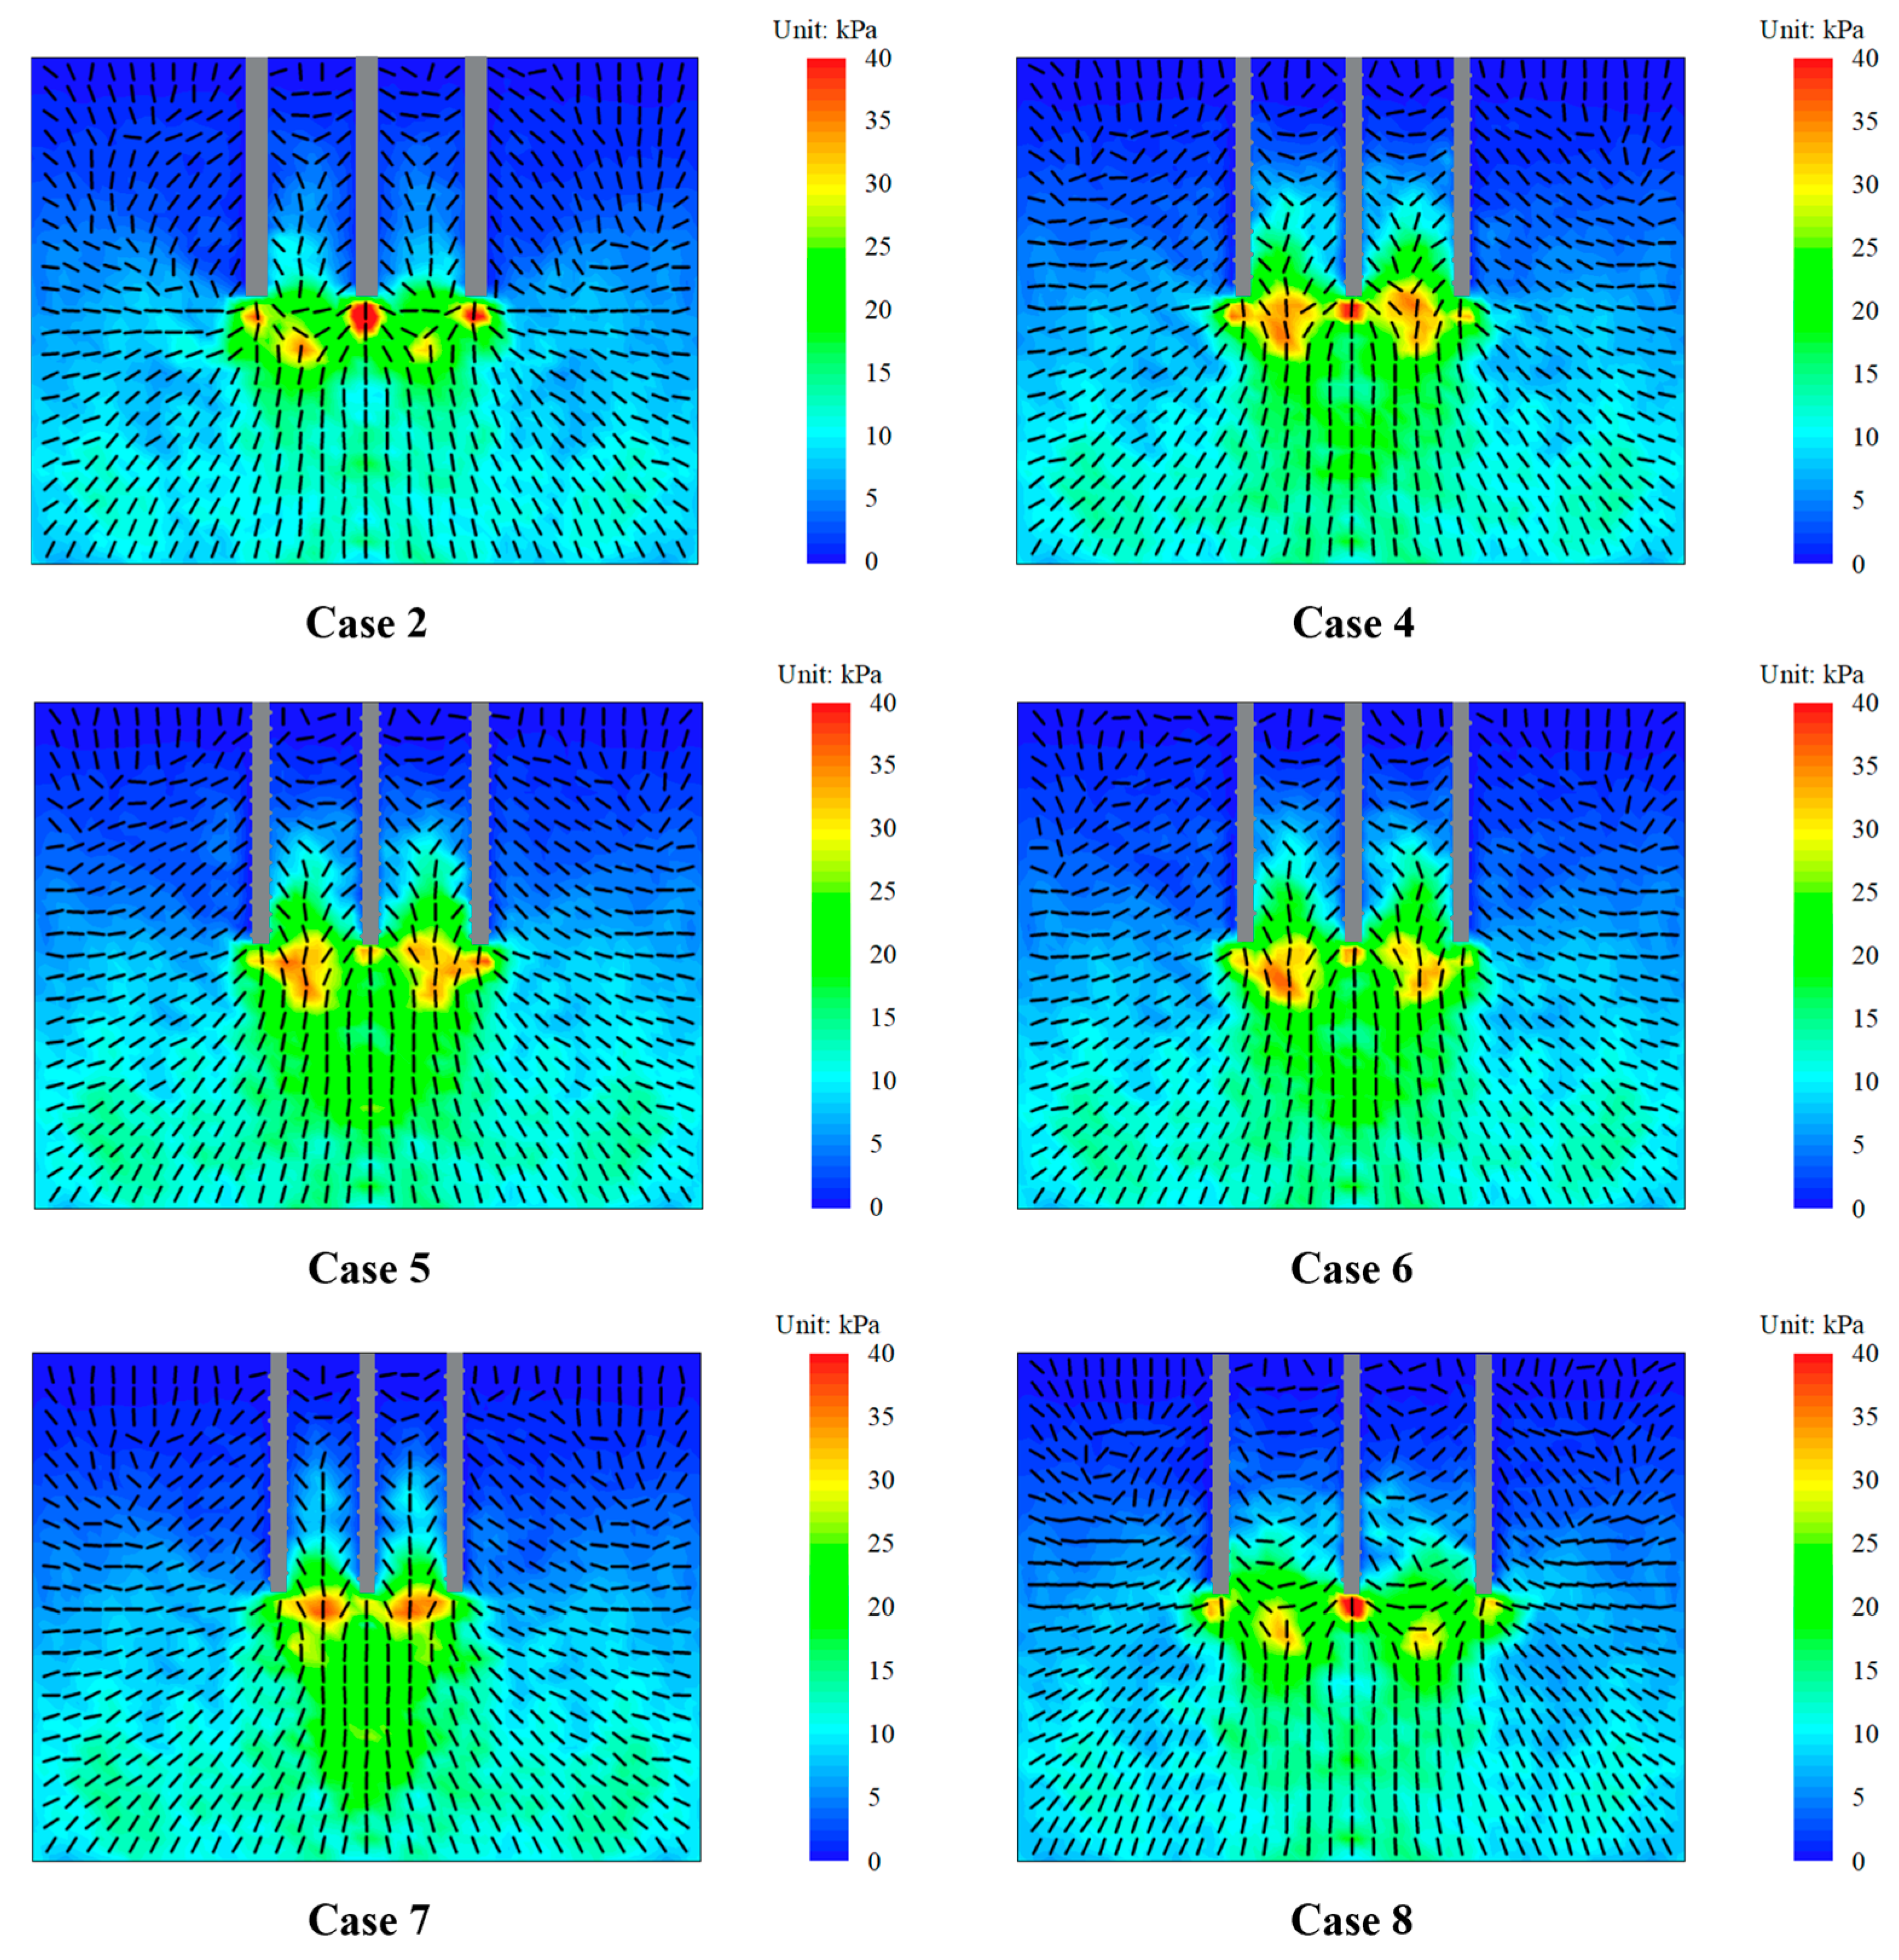
Under s = 20 mm, the principal stress field in fine sand exhibited significant variations associated with pile type, thread pitch, and pile spacing (see Figure 18). Cylindrical piles (Case 2) generated concentrated, narrow, high-intensity stress cores beneath the pile body, with peak values approaching 40 kPa. The lateral regions displayed continuous, uniform tangential stress bands, indicating a relatively uniform distribution of friction along the entire length of the pile. Screw piles (Case 4) conveyed loads to the threads along the pile body through mechanical interlock with the surrounding soil, leading to localized lateral stress peaks of 25 kPa, along with periodic fluctuations corresponding to thread pitch intervals. The stress peaks beneath screw piles were reduced by approximately 15% in comparison to cylindrical piles, demonstrating a lateral extension in stress distribution that led to wider stress zones, in contrast to the uniform distribution characteristic of cylindrical piles.
The analysis of different thread pitches (Cases 4, 5, and 6) revealed distinct stress patterns. The fine-thread (0.75D, Case 5) produced multiple discrete high-stress lobes along the pile body (30–32 kPa) during pile installation. Principal stress vector inclinations ranged from 60° to 70°, indicating significant soil-pile interlocking behavior. Coarse-thread (1.5D, Case 6) generated a singular continuous stress lobe, with peak values approximately 28 kPa. The vector distribution was nearly horizontal (20–30°), demonstrating maximum lateral stress dispersion. The intermediate pitch spacing (1D, Case 4) exhibited transitional characteristics. Stress lobes reached approximately 30 kPa, and vector inclinations ranged from 45° to 55°.
Group pile interaction mechanisms were governed by pile spacing in Cases 4, 7, and 8. In the 3D spacing configuration (Case 7), the merging of adjacent stress cones resulted in central peak values that were approximately 10% greater than those observed in the 4D configuration. In the 5D spacing configuration (Case 8), individual stress cones exhibited relative isolation with lateral extension, leading to peak values that were approximately 12% lower than those observed in the 4D configuration.
The quantitative analysis of stress contour areas surpassing 20 kPa indicated that the shift from cylindrical to screw pile resulted in an approximate 18% increase in the affected area. Expanding thread pitch from 0.75D to 1.5D produced an area increase of approximately 28%, while extending inter-pile spacing from 3D to 5D generated an additional 22% area expansion. The findings demonstrate that the coordinated optimization of thread pitch and inter-pile spacing effectively reduces stress concentration and improves uniform load distribution.
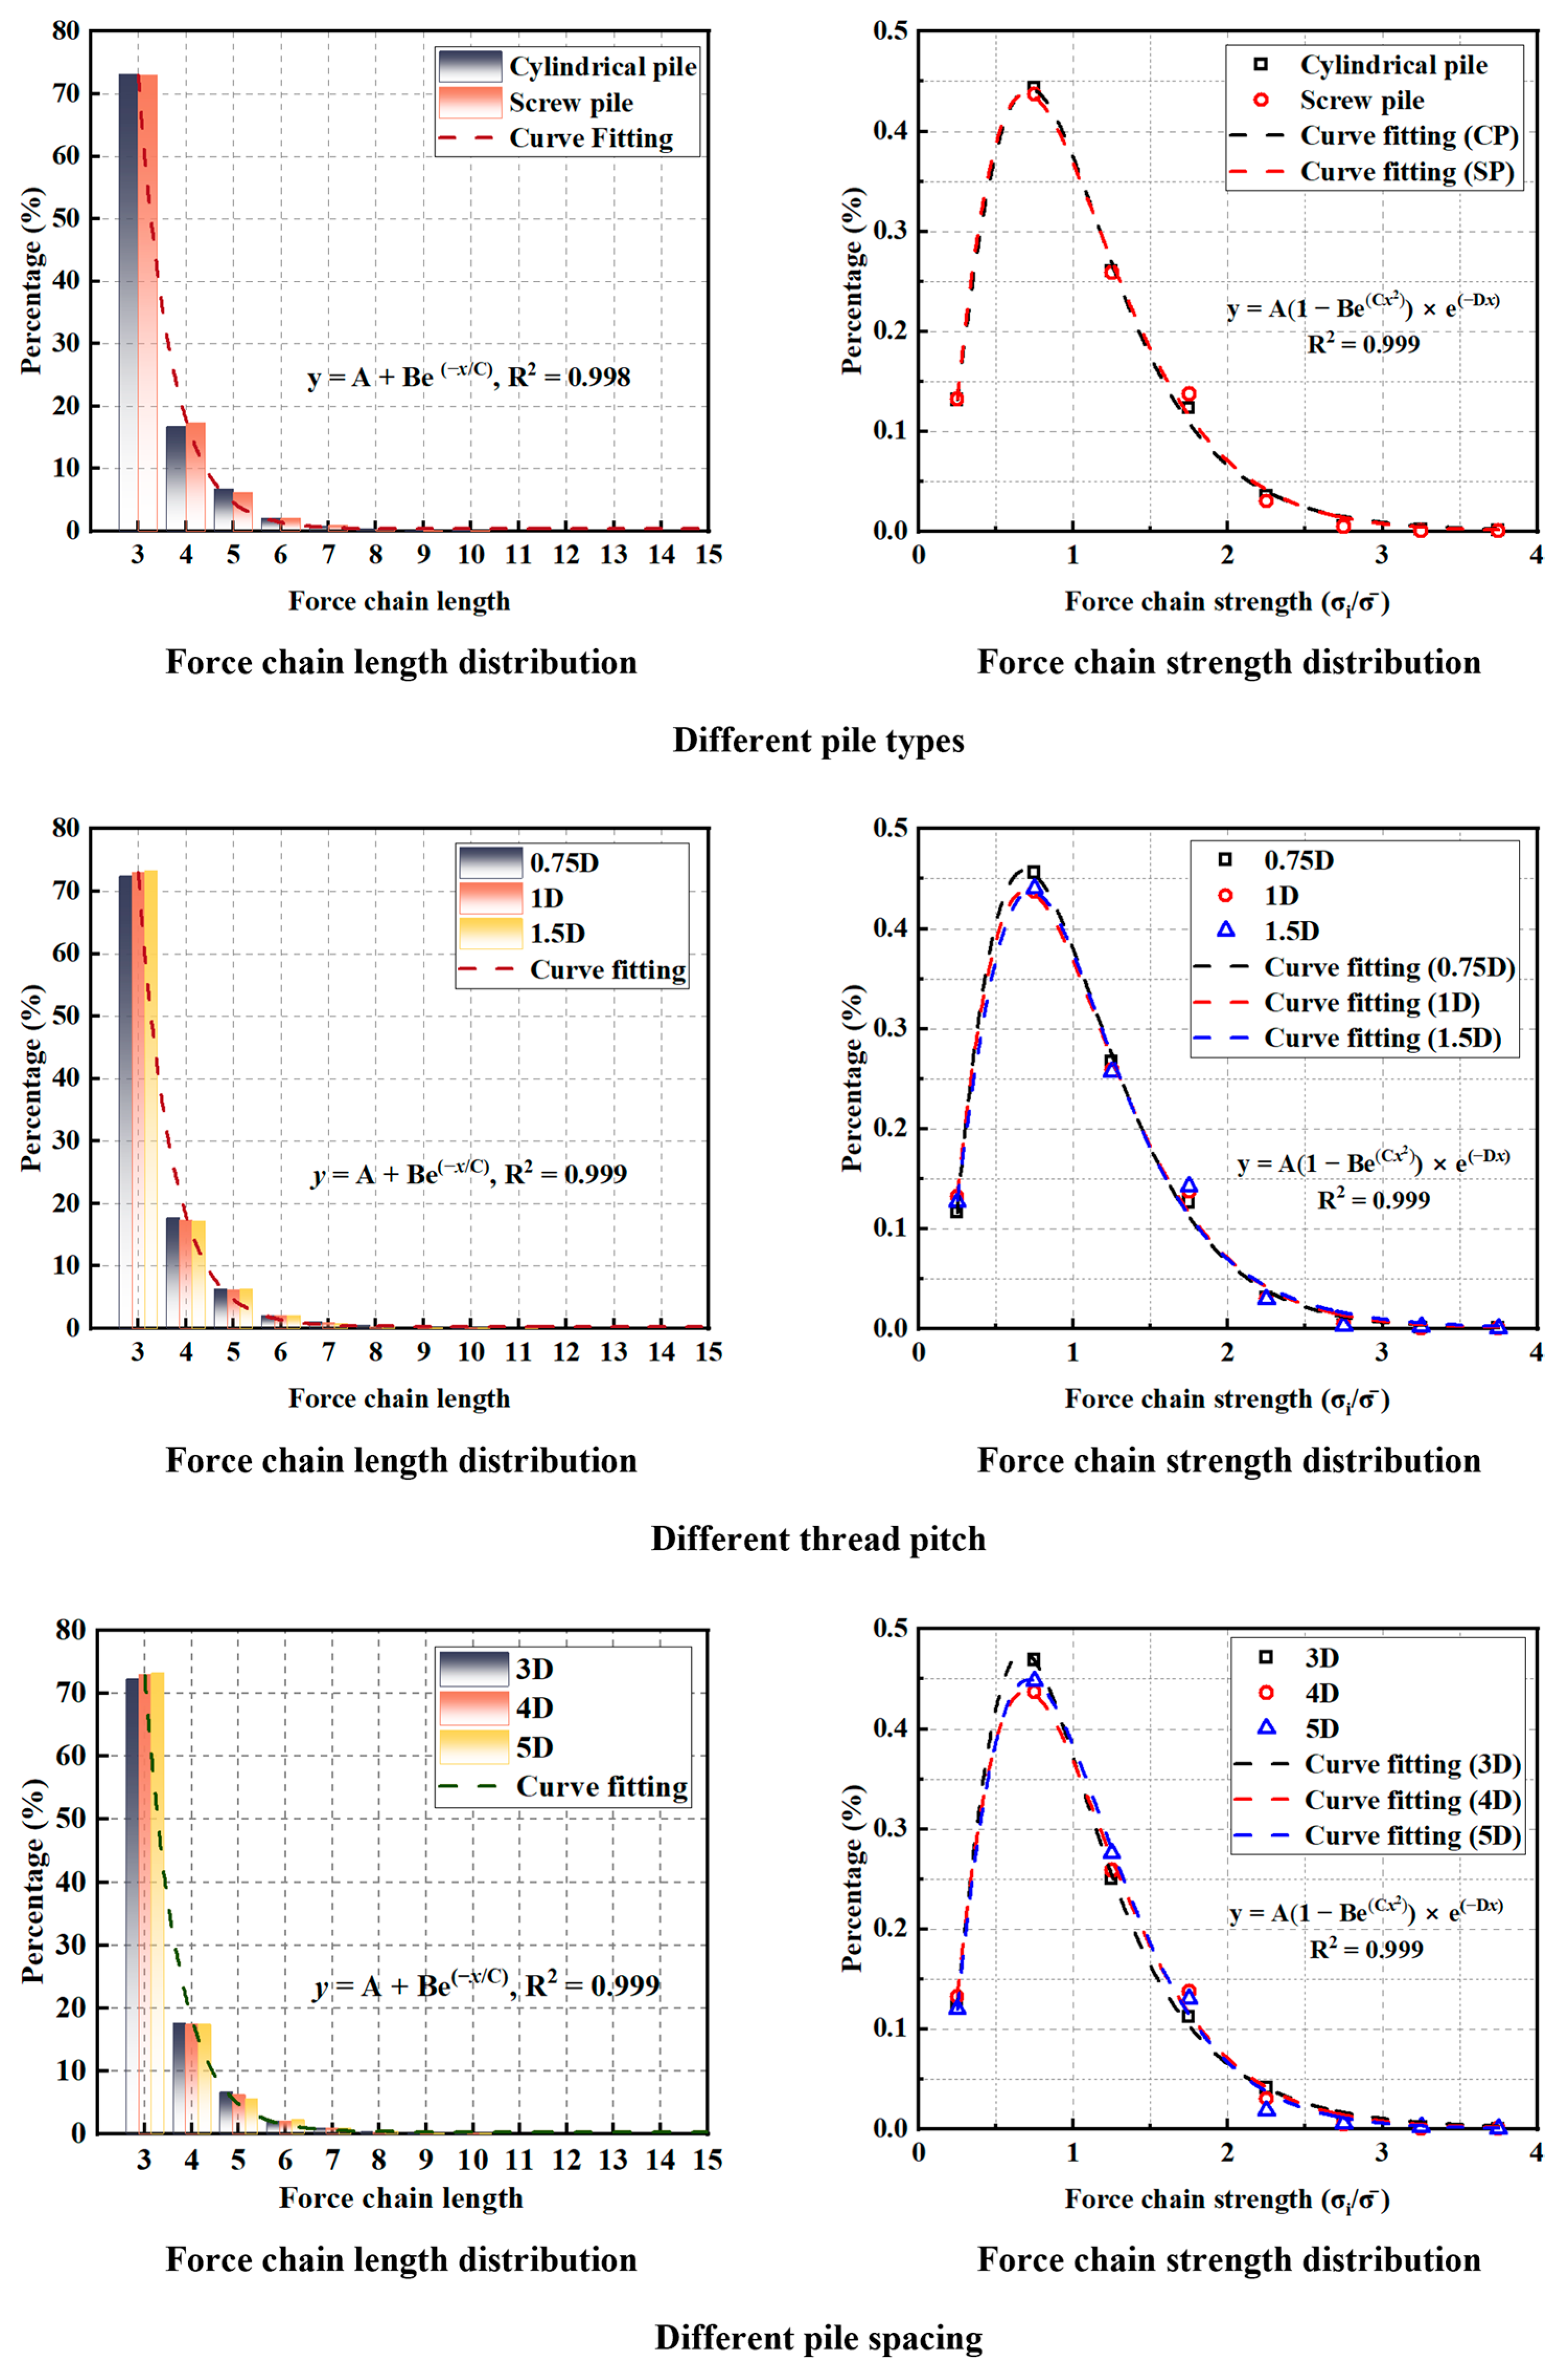
Force-chain networks in sand at a load depth of 20 mm demonstrated significant variations based on pile spacing, thread pitch, and pile type (see Figure 19). Force chain length (FCL) refers to the quantity of particles forming a continuous contact path, while force chain strength (FCS) is characterized as the average maximum principal stress experienced by these particles. Chains with FCS below σ ¯ were categorized as weak, while those with FCS at or above σ ¯ were categorized as strong, where σ ¯ representing the ensemble mean FCS.
The normalized probability density functions of FCL were fitted to an exponential decay model, with R 2 0.998 [42]:
y = A + B e x C
Fine thread or closely spaced piles resulted in a distinct peak at FCL = 3–4. This behavior suggests a recurrent disruption and re-establishment of contact pathways. It also indicates highly localized stress transmission. Coarse thread or widely spaced piles yielded a shallower decay and an extended tail for FCL > 6, signifying more continuous and stable force transmission.
The normalized probability density functions of FCS fitted a composite exponential–Gaussian model ( R 2 0.999 ) [42]:
y = A 1 B e C x 2 × e D x
with modal value ranging from 0.53 σ ¯ and 0.72 σ ¯ across all configurations, indicating the predominance of weak chains. The increased spacing and coarser threading of the high-strength tail resulted in a broader profile, indicating a higher proportion of robust chains that facilitate long-range stress redistribution. Configurations with closely spaced or fine threads exhibited a steeper decay, suggesting a reduced number of strong chains.
The findings indicated a non-monotonic relationship between pile geometry and the strength of force chains. Excessive pile spacing or fine thread compromised the granular backbone and restricted chain continuity, while moderate spacing with coarser thread promoted longer, stronger chains that improved internal force transmission and mechanical stability.

5. Conclusions

Screw piles are widely used in infrastructure such as railways, highways, and ports owing to their large bearing capacity compared to unthreaded piles. Therefore, it is necessary to explore the pile resistance and load-transfer mechanics, as well as the underlying mesoscopic process of screw pile groups during pile installation. In this study, pile resistance, and soil displacement, group pile effects were systematically investigated using a scaled model test combined with the DIC technique. The effects of pile type, pile number, embedment length, and pile spacing on pile resistance and soil displacement have also been discussed in this study. Then, a 2D DEM model was set up according to the laboratory model tests. The underlying mesoscopic mechanics of soil, including force chains, contact anisotropy, and large principal stress, were investigated. Based on both lab tests and numerical simulation results, the following conclusions can be reached:
(1)
The unique load-transfer mechanism of screw piles was attributed to its threads, which was the fundamental reason for its higher pile resistance than unthreaded piles. The ultimate bearing capacity of a single screw pile was approximately 50% higher than that of a cylindrical pile with the same outer diameter and length (33 N compared to 22 N at an embedment length of 200 mm). For pile groups, the group effect coefficient of a triple-pile group composed of screw piles was 0.64, while that of cylindrical piles was 0.55.
(2)
DEM simulations revealed the intrinsic mechanism of this phenomenon at the mesoscopic level, indicating that the pile installation process could be divided into three stages. At the initial stage of loading, large principal stress concentrated at the root of the threads, forming a logarithmic spiral-shaped local shear band. As the load increased, individual shear bands merged along the pile body, creating a continuous spiral-shaped shear band. The direction of contact between soil particles within a region about 1D distant from the pile shaft changed from a discrete state to an oriented arrangement along the direction of the largest principal stress ( θ = 45 ~ 55 ° ).
(3)
The pile resistance of the pile group was related to the embedment length and the pile spacing. Increasing the embedment length from 120 mm to 240 mm resulted in an 85% increase in the ultimate bearing capacity of the triple-pile group. Increasing the pile spacing from 3D to 6D increased the ultimate bearing capacity by 64%, and the group effect coefficient increased from 0.56 to 0.91. According to the DEM model, the pile resistance was influenced by the interaction of soil particles between screw piles.
(4)
Increasing the pitch from 0.75D to 1.5D resulted in an approximately 28% increase in the area of high-stress regions (>20 kPa), reducing stress concentration. By comparing the pile resistance of each pile within a screw pile group with the contact anisotropy of soil, it can be seen that there was a positive correlation between the pile resistance and the contact anisotropy strength a n , and a negative correlation between the pile resistance and the contact normal direction θ n .

Author Contributions

Conceptualization, F.B. and Y.L.; methodology, F.B.; data curation, F.B.; writing—original draft preparation, F.B. and J.Y.; writing—review and editing, Y.L. All authors have read and agreed to the published version of the manuscript.

Funding

This research received no external funding.

Institutional Review Board Statement

Not applicable.

Informed Consent Statement

Not applicable.

Data Availability Statement

The original contributions presented in the study are included in the article, further inquiries can be directed to the corresponding author.

Conflicts of Interest

The authors declare no conflicts of interest.

References

  1. Akbari, P.; Patel, H. A review on analysis and design of pile foundation concealing different soil layers. Int. J. Eng. Dev. Res. 2020, 8, 513–516. [Google Scholar]
  2. Kaladi, F.; Wang, F.; Kherazi, F.Z. Structural Stability: A Comprehensive Review of Pile Foundations in Construction. J. Asian Dev. Stud. 2023, 12, 412–425. [Google Scholar] [CrossRef]
  3. Yang, T.; Zheng, W.; Xie, Y.; Zhang, H.; Yue, X. Evaluating screw-shaft pile composite foundations in round Gravelly soil: A study using model tests and numerical simulations. Heliyon 2023, 9, e20887. [Google Scholar] [CrossRef] [PubMed]
  4. Suleiman, M.T.; Vande Voort, T.; Sritharan, S. Behavior of driven ultrahigh-performance concrete H-piles subjected to vertical and lateral loadings. J. Geotech. Geoenviron. Eng. 2010, 136, 1403–1413. [Google Scholar] [CrossRef]
  5. Chen, Y.; Deng, A.; Wang, A.; Sun, H. Performance of screw-shaft pile in sand: Model test and DEM simulation. Comput. Geotech. 2018, 104, 118–130. [Google Scholar] [CrossRef]
  6. Zhang, S.; Xing, Y.; Xin, G.; Chen, G.; Long, G.; Ma, P.; Han, J. Study on the Bearing Characteristics and the Influence of Pile Characteristics of Rotary Drilling Screw-Shaped Pile. Buildings 2024, 14, 3810. [Google Scholar] [CrossRef]
  7. Ma, J.; Luo, L.; Mu, T.; Guo, H.; Tang, Y. Experimental study on characteristics of pile-soil interaction in screw piles. Buildings 2022, 12, 2091. [Google Scholar] [CrossRef]
  8. Ding, P.; Liu, Y.; Shi, C.; Meng, F.; Li, W.; Deng, Z. Study on Bearing Mechanism of Steel Screw Pile. Buildings 2024, 14, 3376. [Google Scholar] [CrossRef]
  9. Azari, R.; Kamel, E.; Memari, A.M. Current developments and future directions in energy-efficient buildings from the perspective of building construction materials and enclosure systems. Buildings 2024, 14, 1921. [Google Scholar] [CrossRef]
  10. Perko, H.A. Helical Piles: A Practical Guide to Design and Installation; John Wiley & Sons: Hoboken, NJ, USA, 2009. [Google Scholar]
  11. Ali, O.K.; Abbas, H.O. Performance assessment of screw piles embedded in soft clay. Civ. Eng. J. 2019, 5, 1788–1798. [Google Scholar] [CrossRef]
  12. Ideal Foundations. Guide to Screw Piles Construction for Foundations; Ideal Foundations: Smithfield, NSW, Australia, 2025. [Google Scholar]
  13. Bittar, E.; Lehane, B.; Zheng, H. The role of physicochemical processes in aging of shaft friction of driven steel piles in sand. Can. Geotech. J. 2023, 61, 1873–1885. [Google Scholar] [CrossRef]
  14. Ho, H.M.; Malik, A.A.; Kuwano, J.; Rashid, M.A. Influence of helix bending deflection on the load transfer mechanism of screw piles in sand: Experimental and numerical investigations. Soils Found. 2021, 61, 874–885. [Google Scholar] [CrossRef]
  15. Avci, B.; Gurbuz, A. Modulus of subgrade reaction that varies with magnitude of displacement of cohesionless soil. Arab. J. Geosci. 2018, 11, 351. [Google Scholar] [CrossRef]
  16. Sahil, A.W.; Uchimura, T.; Malik, A.A.; Kabir, M.R. A Comparative Study on the End-Bearing Capacity of Toe-Wing & Spiral Screw Piles in Cohesionless Soil. Buildings 2025, 15, 525. [Google Scholar]
  17. Debnath, A.; Singh, V.P. Analysis and design methods of helical piles: A critical review with emphasis on finite element method. Arab. J. Geosci. 2022, 15, 1496. [Google Scholar] [CrossRef]
  18. Elsherbiny, Z.H.; El Naggar, M.H. Axial compressive capacity of helical piles from field tests and numerical study. Can. Geotech. J. 2013, 50, 1191–1203. [Google Scholar] [CrossRef]
  19. Verumandy, K.; Arulrajah, A.; Mirzababaei, M.; Rajeev, P. Static Load Testing of Instrumented Screw Piles in Soft Soil Deposits. Int. J. Geosynth. Ground Eng. 2024, 10, 10. [Google Scholar] [CrossRef]
  20. Sharif, Y.U.; Brown, M.J.; Cerfontaine, B.; Davidson, C.; Ciantia, M.O.; Knappett, J.A. Effects of screw pile installation on installation requirements and in-service performance using the discrete element method. Can. Geotech. J. 2021, 58, 1334–1350. [Google Scholar] [CrossRef]
  21. Li, L.; Wu, W.; El Naggar, M.H.; Mei, G.; Liang, R. DEM analysis of the sand plug behavior during the installation process of open-ended pile. Comput. Geotech. 2019, 109, 23–33. [Google Scholar] [CrossRef]
  22. Li, W.; Zhang, D.J.Y.; Sego, D.C.; Deng, L. Field testing of axial performance of large-diameter helical piles at two soil sites. J. Geotech. Geoenviron. Eng. 2018, 144, 06017021. [Google Scholar] [CrossRef]
  23. Schiavon, J.A.; Tsuha, C.H.C.; Neel, A.; Thorel, L. Centrifuge modelling of a helical anchor under different cyclic loading conditions in sand. Int. J. Phys. Model. Geotech. 2019, 19, 72–88. [Google Scholar] [CrossRef]
  24. Liu, F.; Jiang, M.; Zhu, F. Discrete element analysis of uplift and lateral capacity of a single pile in methane hydrate bearing sediments. Comput. Geotech. 2014, 62, 61–76. [Google Scholar] [CrossRef]
  25. Alwalan, M.F.; El Naggar, M.H. Finite element analysis of helical piles subjected to axial impact loading. Comput. Geotech. 2020, 123, 103597. [Google Scholar] [CrossRef]
  26. Lanyi-Bennett, S.A.; Deng, L. Axial load testing of helical pile groups in glaciolacustrine clay. Can. Geotech. J. 2019, 56, 187–197. [Google Scholar] [CrossRef]
  27. Tehrani, F.S.; Salgado, R.; Prezzi, M. Analysis of axial loading of pile groups in multilayered elastic soil. Int. J. Geomech. 2016, 16, 04015063. [Google Scholar] [CrossRef]
  28. Sales, M.M.; Prezzi, M.; Salgado, R.; Choi, Y.S.; Lee, J. Load-settlement behaviour of model pile groups in sand under vertical load. J. Civ. Eng. Manag. 2017, 23, 1148–1163. [Google Scholar] [CrossRef]
  29. Cundall, P.A.; Strack, O.D.L. A discrete numerical model for granular assemblies. Geotechnique 1979, 29, 47–65. [Google Scholar] [CrossRef]
  30. Lu, Y.E.; Tan, Y.; Li, X. Stability analyses on slopes of clay-rock mixtures using discrete element method. Eng. Geol. 2018, 244, 116–124. [Google Scholar] [CrossRef]
  31. Liu, F. Multi-Scale Analyses of Granular Flows for Disaster Resilience Enhancement; Georgia Institute of Technology: Atlanta, GA, USA, 2019. [Google Scholar]
  32. Azzam, W.R.; Elwakil, A.Z. Model study on the performance of single-finned pile in sand under tension loads. Int. J. Geomech. 2017, 17, 04016072. [Google Scholar] [CrossRef]
  33. JGJ/T 379-2016; Technical Specification for Screw Piles. Ministry of Housing and Urban-Rural Development of the People’s Republic of China, China Architecture & Building Press: Beijing, China, 2016.
  34. GB/T 50145-2007; Standard for Engineering Classification of Soil. Ministry of Housing and Urban-Rural Development of the People’s Republic of China, China Standard Press: Beijing, China, 2007.
  35. Bolton, M.D.; Gui, M.W.; Garnier, J.; Corte, J.F.; Bagge, G. Centrifuge cone penetration tests in sand. Géotechnique 1999, 49, 543–552. [Google Scholar] [CrossRef]
  36. JGJ106-2014; Technical Code for Testing of Building Foundation Piles. Ministry of Housing and Urban-Rural Development of the People’s Republic of China, China Architecture & Building Press: Beijing, China, 2014.
  37. Qu, S.; Zhang, Q.; Guo, Y. Experimental and numerical studies of the failure mode and mechanical performance of helices in screw piles. Int. J. Civ. Eng. 2024, 22, 839–857. [Google Scholar] [CrossRef]
  38. Poulos, H.G.; Davis, E.H. Pile Foundation Analysis and Design; John Wiley and Sons: Hoboken, NJ, USA, 1980. [Google Scholar]
  39. Meyerhof, G. Bearing capacity and settlement of pile foundations. J. Geotech. Eng. Div. 1976, 102, 197–228. [Google Scholar] [CrossRef]
  40. Vesić, A. Experiments with Instrumented Pile Groups in Sand. Performance of Deep Foundations; ASTM International: West Conshohocken, PA, USA, 1969. [Google Scholar]
  41. Tan, X.; Hu, Z.; Cao, M.; Chen, C. 3D discrete element simulation of a geotextile-encased stone column under uniaxial compression testing. Comput. Geotech. 2020, 126, 103769. [Google Scholar] [CrossRef]
  42. Liu, E.; Chen, Q.; Liu, J. Comparison of Force Chain Evolution Characteristics during the Ore Drawing Process between Shallow-hole Shrinkage Stoping and Synchronous Backfill-Shrinkage Stoping. Metal Mine 2021, 7, 73–82. [Google Scholar] [CrossRef]
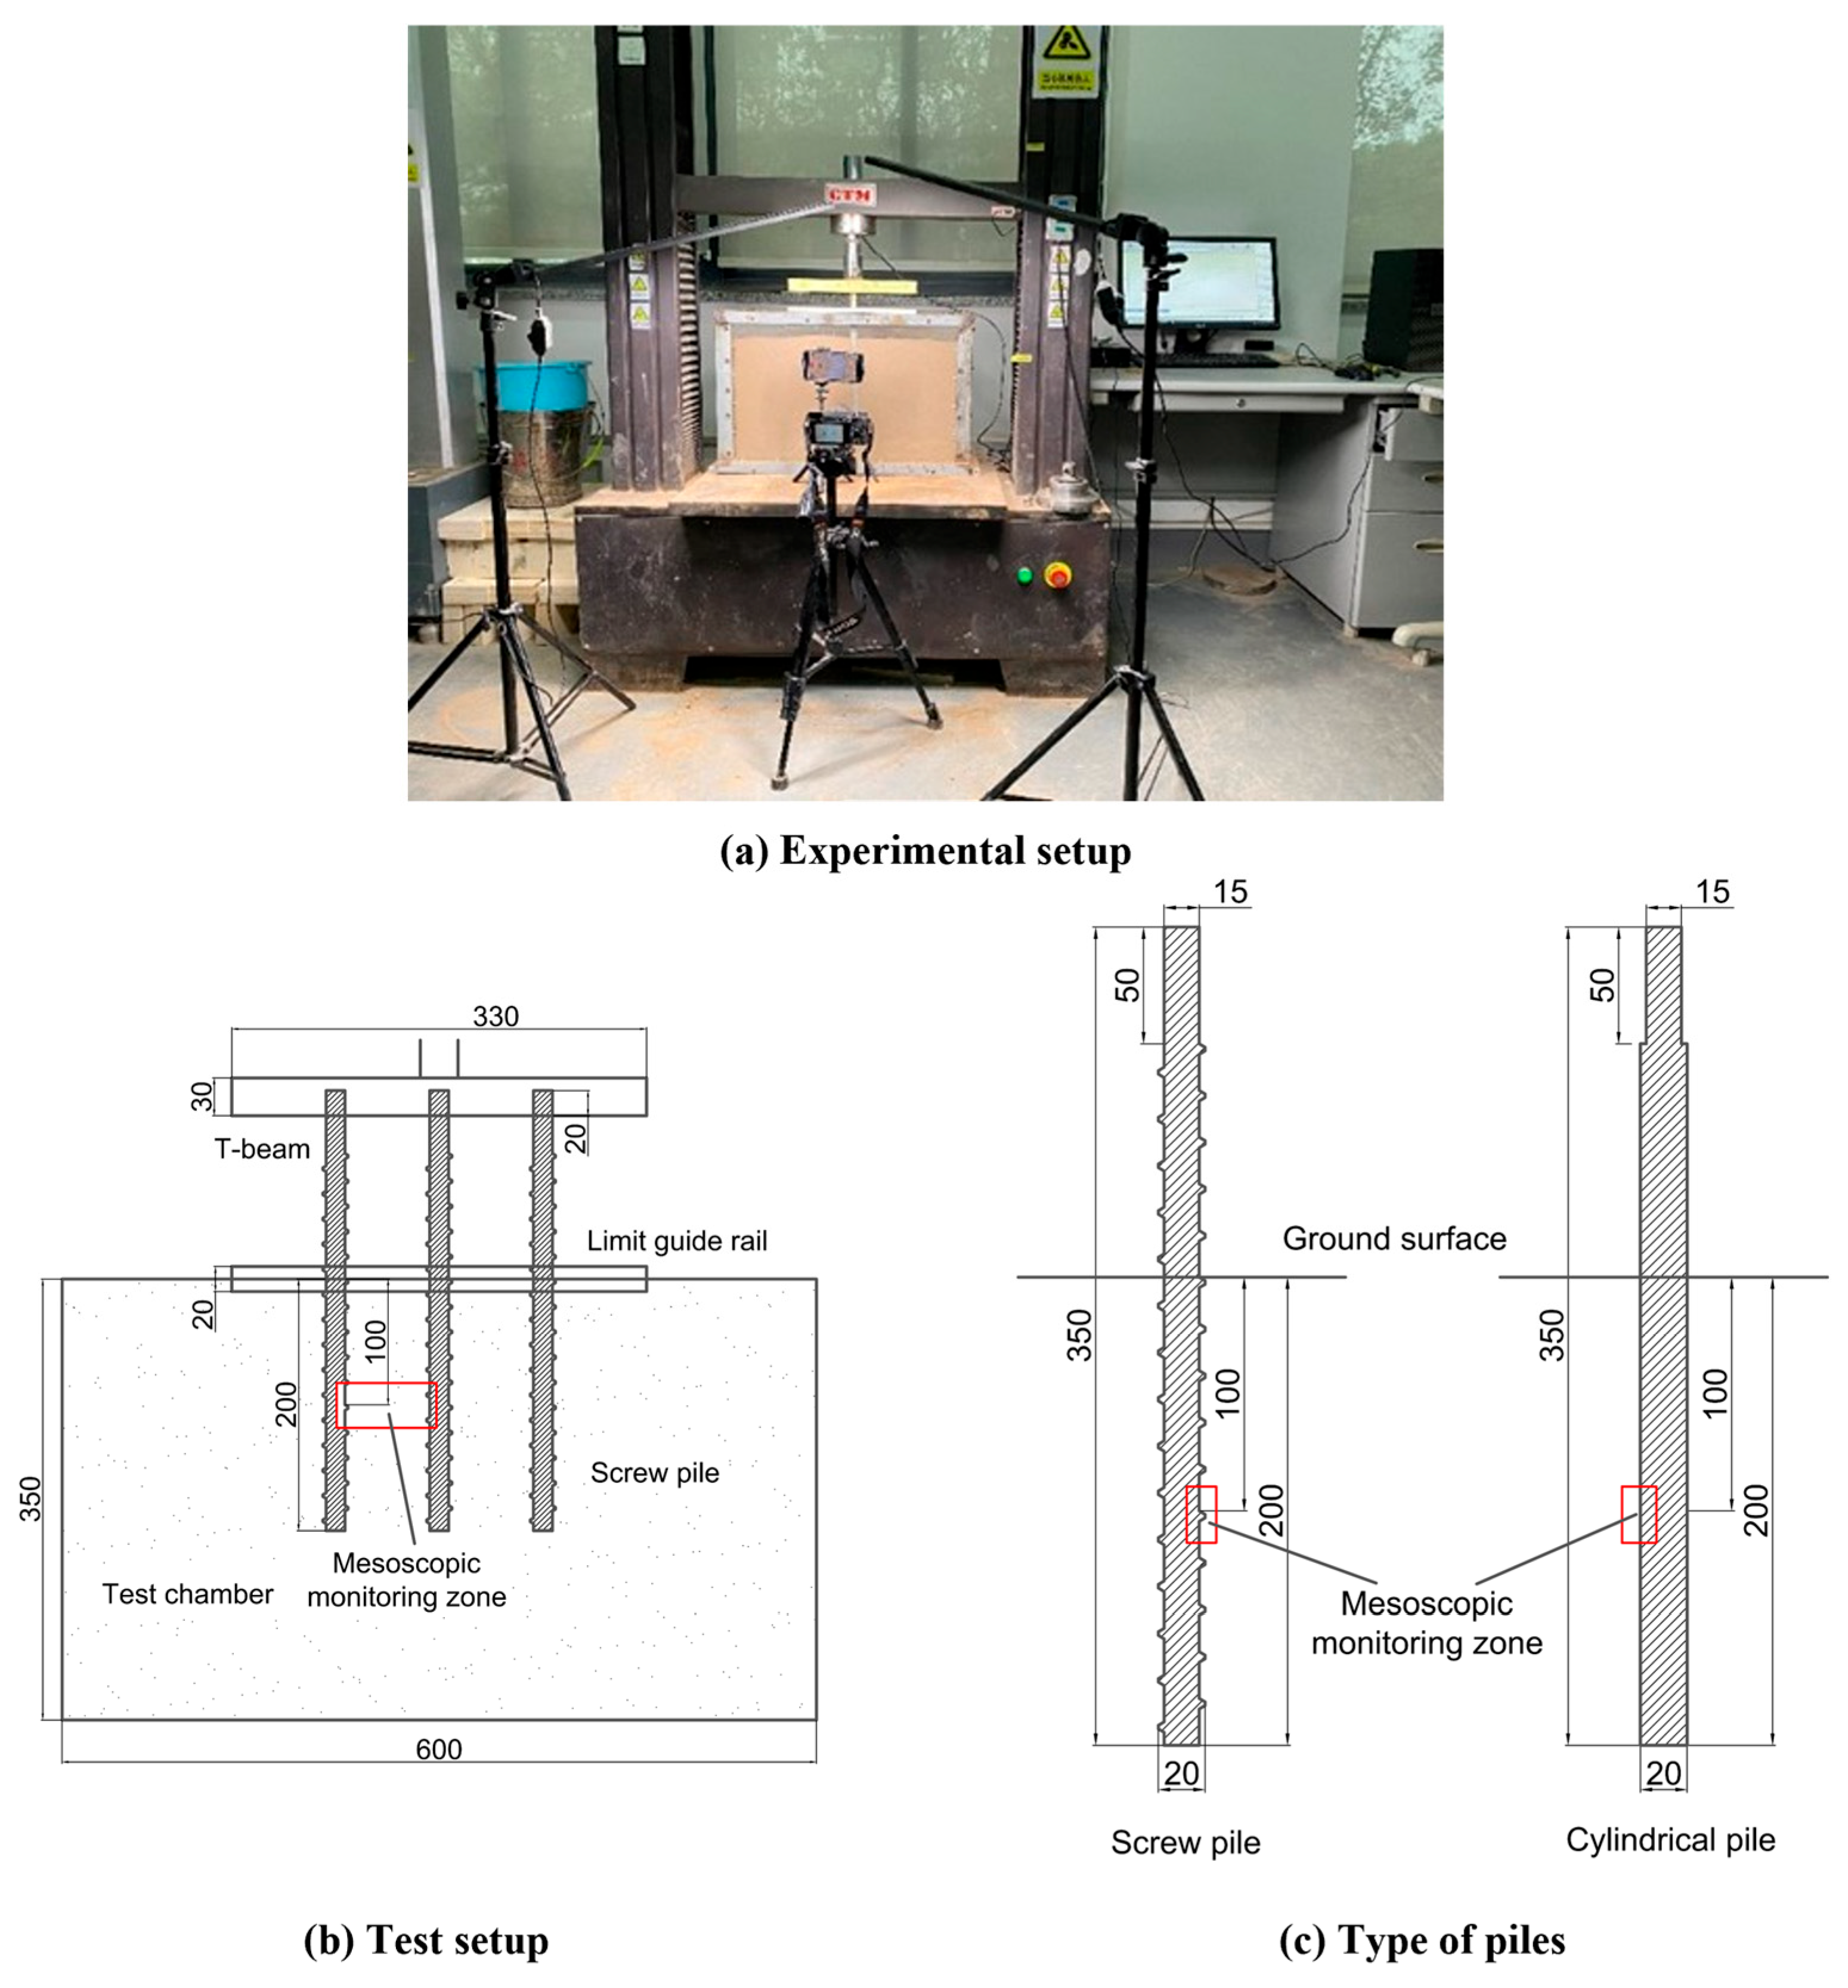
Figure 1. Experimental instruments and equipment.
Buildings 15 03581 g001
Figure 2. Structure of screw pile and beam.
Buildings 15 03581 g002
Figure 3. Grain size distribution curves of tests sand.
Buildings 15 03581 g003
Figure 4. Q-s curve of single pile with different length.
Buildings 15 03581 g004
Figure 5. Displacement vector of soil around piles.
Buildings 15 03581 g005
Figure 6. Soil displacement at different vertical distances.
Buildings 15 03581 g006
Figure 7. Effect of thread number on bearing capacity.
Buildings 15 03581 g007
Figure 8. Soil failure development between threads.
Buildings 15 03581 g008
Figure 9. Group effect coefficient.
Buildings 15 03581 g009
Figure 10. Q-s curves and vector of different experimental conditions.
Buildings 15 03581 g010
Figure 11. Displacement of soil around screw pile.
Buildings 15 03581 g011
Figure 12. Model setup.
Buildings 15 03581 g012
Figure 13. Q-s curve for different pile numbers.
Buildings 15 03581 g013
Figure 14. Soil displacement in the DEM model.
Buildings 15 03581 g014
Figure 15. Particle rotation around pile.
Buildings 15 03581 g015
Figure 16. Q-s curves of DEM model.
Buildings 15 03581 g016
Figure 17. Load distribution analysis of threads.
Buildings 15 03581 g017
Figure 18. Large principal stress and direction vector.
Buildings 15 03581 g018
Figure 19. Force chain probability density function.
Buildings 15 03581 g019
Table 1. Geometric dimensions of test piles.
Pile TypePile LengthInner DiameterOuter DiameterThread PitchCrest ThicknessThread Thickness
InnerOuter
L (mm)d (mm)D (mm)s (mm)B (mm) H i n (mm) H o u t (mm)
SP350.015.020.020.02.55.02.5
CP350.0-20.0----
Table 2. Test parameters for model tests.
Pile Embedment Length/mmPile Spacing
Single pile (CP and SP)120-
160
200
240
Double piles (SP)2004D
Triple piles (SP)120
160
200
240
2003D
5D
6D
Table 3. Parameters for numerical models.
ParametersSoil SamplePile
PFC model objectsBallWall
Density (kg⋅m−3)2650-
Effective modulus (Pa)1 × 1061 × 106
Stiffness ratio1.2141.214
Ball-ball friction coefficient0.65-
Ball-wall friction coefficient-0.25
Rotational friction coefficient0.10.1
Table 4. Numerical simulation conditions.
CasePile TypePile NumberPile SpacingThread Pitch
1Cylindrical pile1--
234D
3Screw pile1-1D
434D
50.75D
61.5D
73D1D
85D
Disclaimer/Publisher’s Note: The statements, opinions and data contained in all publications are solely those of the individual author(s) and contributor(s) and not of MDPI and/or the editor(s). MDPI and/or the editor(s) disclaim responsibility for any injury to people or property resulting from any ideas, methods, instructions or products referred to in the content.