Article

Hygrothermal Performance of Thermal Plaster Used as Interior Insulation: Identification of the Most Impactful Design Conditions

by
Eleonora Leonardi
1,*,
Marco Larcher
1,
Alexandra Troi
1,2,
Anna Stefani
3,4,
Gianni Nerobutto
3,4 and
Daniel Herrera-Avellanosa
1
1
Eurac Research, Institute for Renewable Energies, Viale Druso 1, 39100 Bolzano, Italy
2
Faculty of Design, Coburg University of Applied Sciences, Am Hofbräuhaus 1, 96450 Coburg, Germany
3
Calchèra San Giorgio, Zona Industriale 3/A, 38055 Grigno, Italy
4
Nerobutto Srl, Zona Industriale 3/A, 38055 Grigno, Italy
*
Author to whom correspondence should be addressed.
Buildings 2025, 15(19), 3559; https://doi.org/10.3390/buildings15193559
Submission received: 30 June 2025 / Revised: 1 September 2025 / Accepted: 23 September 2025 / Published: 2 October 2025
(This article belongs to the Section Building Materials, and Repair & Renovation)

Abstract

Internal insulation plasters enable historic building renovation without altering the external appearance of the wall. However, the use of internal insulation must be verified case-by-case through dynamic hygrothermal simulation, and the influence of input parameters on the results is not always clear. This paper aims to (i) characterize a new lime-based insulating plaster with expanded recycled glass and aerogel through laboratory measurements, (ii) assess the damage criteria of the plaster under different boundary conditions through dynamic simulations, and (iii) identify the most impactful design conditions on the relative humidity behind insulation. This innovative plaster combines highly insulating properties (thermal conductivity of 0.0463 W/mK) with good capillary activity while also integrating recycled components without compromising performance. The relative humidity behind insulation remains below 95% in most simulated scenarios, with cases above this threshold found only in cold climates, particularly under high internal moisture loads. The parametric study shows that (i) in the analyzed stones, the thermal conductivity variation of the existing wall has a greater effect on the relative humidity behind insulation than the variation of the vapor resistance factor, (ii) the effect of insulation thickness on the relative humidity behind insulation depends on the difference in thermal resistance of the insulation and existing masonry layers, and (iii) internal moisture load and external climate directly impact the relative humidity behind insulation.

1. Introduction

A significant portion of the European building stock consists of historic buildings [1], which often present challenges for improving energy performance while preserving cultural value. Among various components, external walls can substantially contribute to heat losses during the heating season [2], although the extent of these losses depends on factors such as local climate conditions, wall composition, and building geometry. In the renovation of buildings, it is often not possible to insulate the walls from outside; this may be due to the need to preserve the façade’s appearance, geometric constraints such as proximity to the street or neighboring buildings, or even cost-related considerations [3]. In such cases, internal insulation becomes a viable alternative. Among the internal insulations, insulating plaster offers specific advantages, such as ease of application and suitability for uneven surfaces [4,5,6]. However, internal insulating plasters are still not commonly used and often present thermal properties not comparable to other insulating materials [7,8]. Generally, when an internal insulation is applied, case-by-case verification must be performed, as the risk of condensation or mold growth must be investigated with component dynamic simulations [9]. The answer, however, is not always straightforward, because there is often some uncertainty about the existing wall’s hygrothermal properties and the behavior of the wall. A common rule of thumb in practice says that increasing the internal insulation thickness has a big negative impact on the hygrothermal performance of the wall [10].
A number of studies in the literature focus on the hygrothermal characterization of building materials. Ref. [11] characterized the dry bulk density, porosity, thermal conductivity (as a function of moisture content), specific heat capacity, water vapor resistance factor (μ), free water saturation, and capillary water absorption coefficient of unstabilized rammed earth. They employed standard laboratory methods, including gravimetric tests for density and porosity, steady-state and transient techniques for thermal conductivity, differential scanning calorimetry for specific heat capacity, cup tests for water vapor resistance, and sorption/imbibition experiments for free water saturation and capillary absorption. In [12], the adsorption and desorption isotherms, specific heat capacity, dry and moisture-dependent thermal conductivity, water vapor resistance factor (μ), and liquid transport coefficients for suction and redistribution are measured for a novel hemp–lime composite. They conducted sorption isotherm measurements using DVS and SSS techniques, determined thermal conductivity via C-Therm and Hot Disk methods, assessed water vapor permeability through wet and dry cup tests, measured specific heat capacity using modulated DSC, and performed capillary rise experiments to estimate liquid transport coefficients for both suction and redistribution. Another interesting paper on hygrothermal characterization of a recycled expanded polystyrene-based material is [13]. They characterized the thermal conductivity in a reference dry state, the effects of humidity variations on thermal conductivity, and the sorption and desorption isotherms to investigate the material’s capacity to store and release moisture. They measured thermal conductivity using the Hot-Disk transient plane source method under controlled humidity equilibrium and determined sorption and desorption isotherms by conditioning samples at progressive relative humidity levels until equilibrium was reached. This review highlights that each study investigates the same key hygrothermal parameters while also including specific parameters depending on the research focus. Measurement methods also vary slightly between laboratories. Our study focuses on the parameters required for performing hygrothermal simulations, specifically on translating laboratory experiments into the parameters and curves needed for the simulation software (Wufi® Plus V3.5.0.1).
Some studies focusing on the influence of different input parameters can be found in the literature. For instance, a sensitivity analysis of parameters such as driving rain, insulation thickness, wall orientation, air exchange rate, and moisture barrier is presented in [14]. Among others, their study shows the low influence of the internal insulation thickness on mold risk. A study on cold attics in Västra Götaland (Gothenburg region) found that 60–80% of single-family homes show significant mold growth, largely due to increased insulation for energy efficiency, which cools the attic and raises humidity. Changes in heating systems and air pressure balance further contribute to moisture problems, and the mold growth potential was modeled using Monte Carlo simulations to assess design-related risks [15]. The effect of varying brick and mortar types is investigated in [16] by changing masonry and insulation thickness and indoor moisture loads for four internal insulation systems. Ref. [17] investigates the influence of materials’ hygric properties on the hygrothermal performance of internal thermal insulation systems, finding that the most critical parameters affecting simulation outcomes are the water absorption coefficient of the exterior plaster and the vapor permeability of the insulation material, both of which strongly impact moisture accumulation and the risk of condensation or mold.
These studies analyze the influence of different parameters, but the variations are considered independently rather than in a concatenated manner. A probabilistic approach to moisture risk assessment is presented in [18], where predictive models are developed using Monte Carlo simulations and generalized additive models to evaluate the impact of input parameter variability on mold growth and relative humidity. Similarly, study [9] investigates the balance between energy savings and hygrothermal risks in internal insulation, but it focuses on uncertainties in parameters. In [19], key parameters for realistic hygrothermal simulations at the wall level are identified through a sensitivity analysis. The study concentrates on the variation of the parameters of the different materials of the stratigraphy. In this case, the thermal conductivity of the old plaster and the vapor diffusion resistance factor of the new plaster are the parameters that most influence the simulations. Other design conditions such as insulation thickness and external and internal climates are not considered. Also in [20], a sensitivity analysis on brick parameters is presented. In this case the influence of the different parameters on the relative humidity and temperature of the material is studied. Generally, while these studies consider multiple factors simultaneously, they do so through statistical modeling rather than analyzing the direct physical interactions between them. A comprehensive examination of the interconnected physical factors and how their combined effects influence the success of internal insulation is missing in the literature.
This paper presents (i) a full laboratory characterization of the hygrothermal properties of a new internal insulation plaster and the conversion of the measured properties into parameters and functions needed for the simulations; (ii) the simulations of the behavior of the wall insulated with the plaster when subjected to a range of different boundary conditions to thoroughly evaluate the performance of the plaster; and (iii) a novel parametric study about the influence of the different boundary conditions on the performance of internal insulation. This is investigated with a systematic parametric study involving more than 90 simulations, where the following parameters were varied: internal and external climate, insulation thickness, and existing wall material.

2. Materials and Methods

2.1. Laboratory Measurements and Data Processing for Building Hygrothermal Simulations

A low-density mineral thermal plaster has been developed, composed of pure lime, micronized natural pozzolans, expanded minerals derived from recycled glass, and aerogel. The plaster is free from materials harmful to health and the environment. This plaster will be indicated as SE in this paper.
A comprehensive hygrothermal analysis of the specified plaster is conducted, encompassing the measurement of various parameters, including bulk and true density, thermal conductivity, volumetric heat capacity, moisture storage function, free saturation water content, water vapor resistance factor, water uptake coefficient by partial immersion, and drying behavior. After these measurements, the obtained data undergoes post-processing to derive the additional parameters and functions necessary for modeling the combined transport of heat and moisture in the WUFI Plus software [21].
Bulk density ( 𝜌 b ) is determined by the ratio of dry mass to volume, with the dry state achieved through sample drying in a ventilated oven at 40 °C until a constant mass is attained. True density ( 𝜌 t ) is measured on dry samples utilizing a helium pycnometer (Ultrapycnometer 1000, Quantochrome Instruments). The porosity ( 𝜙 ) is then computed from the bulk and true density using Equation (1) [22].
𝜙 = 1 𝜌 b 𝜌 t
The thermal conductivity ( 𝜆 ) and volumetric heat capacity ( C v o l ) are determined employing the thermal properties analyzer, ISOMET 2114, with the utilization of a surface probe. Subsequently, the specific heat capacity ( C s ) is calculated through the application of Equation (2) [23].
C s = C v o l / 𝜌 b  
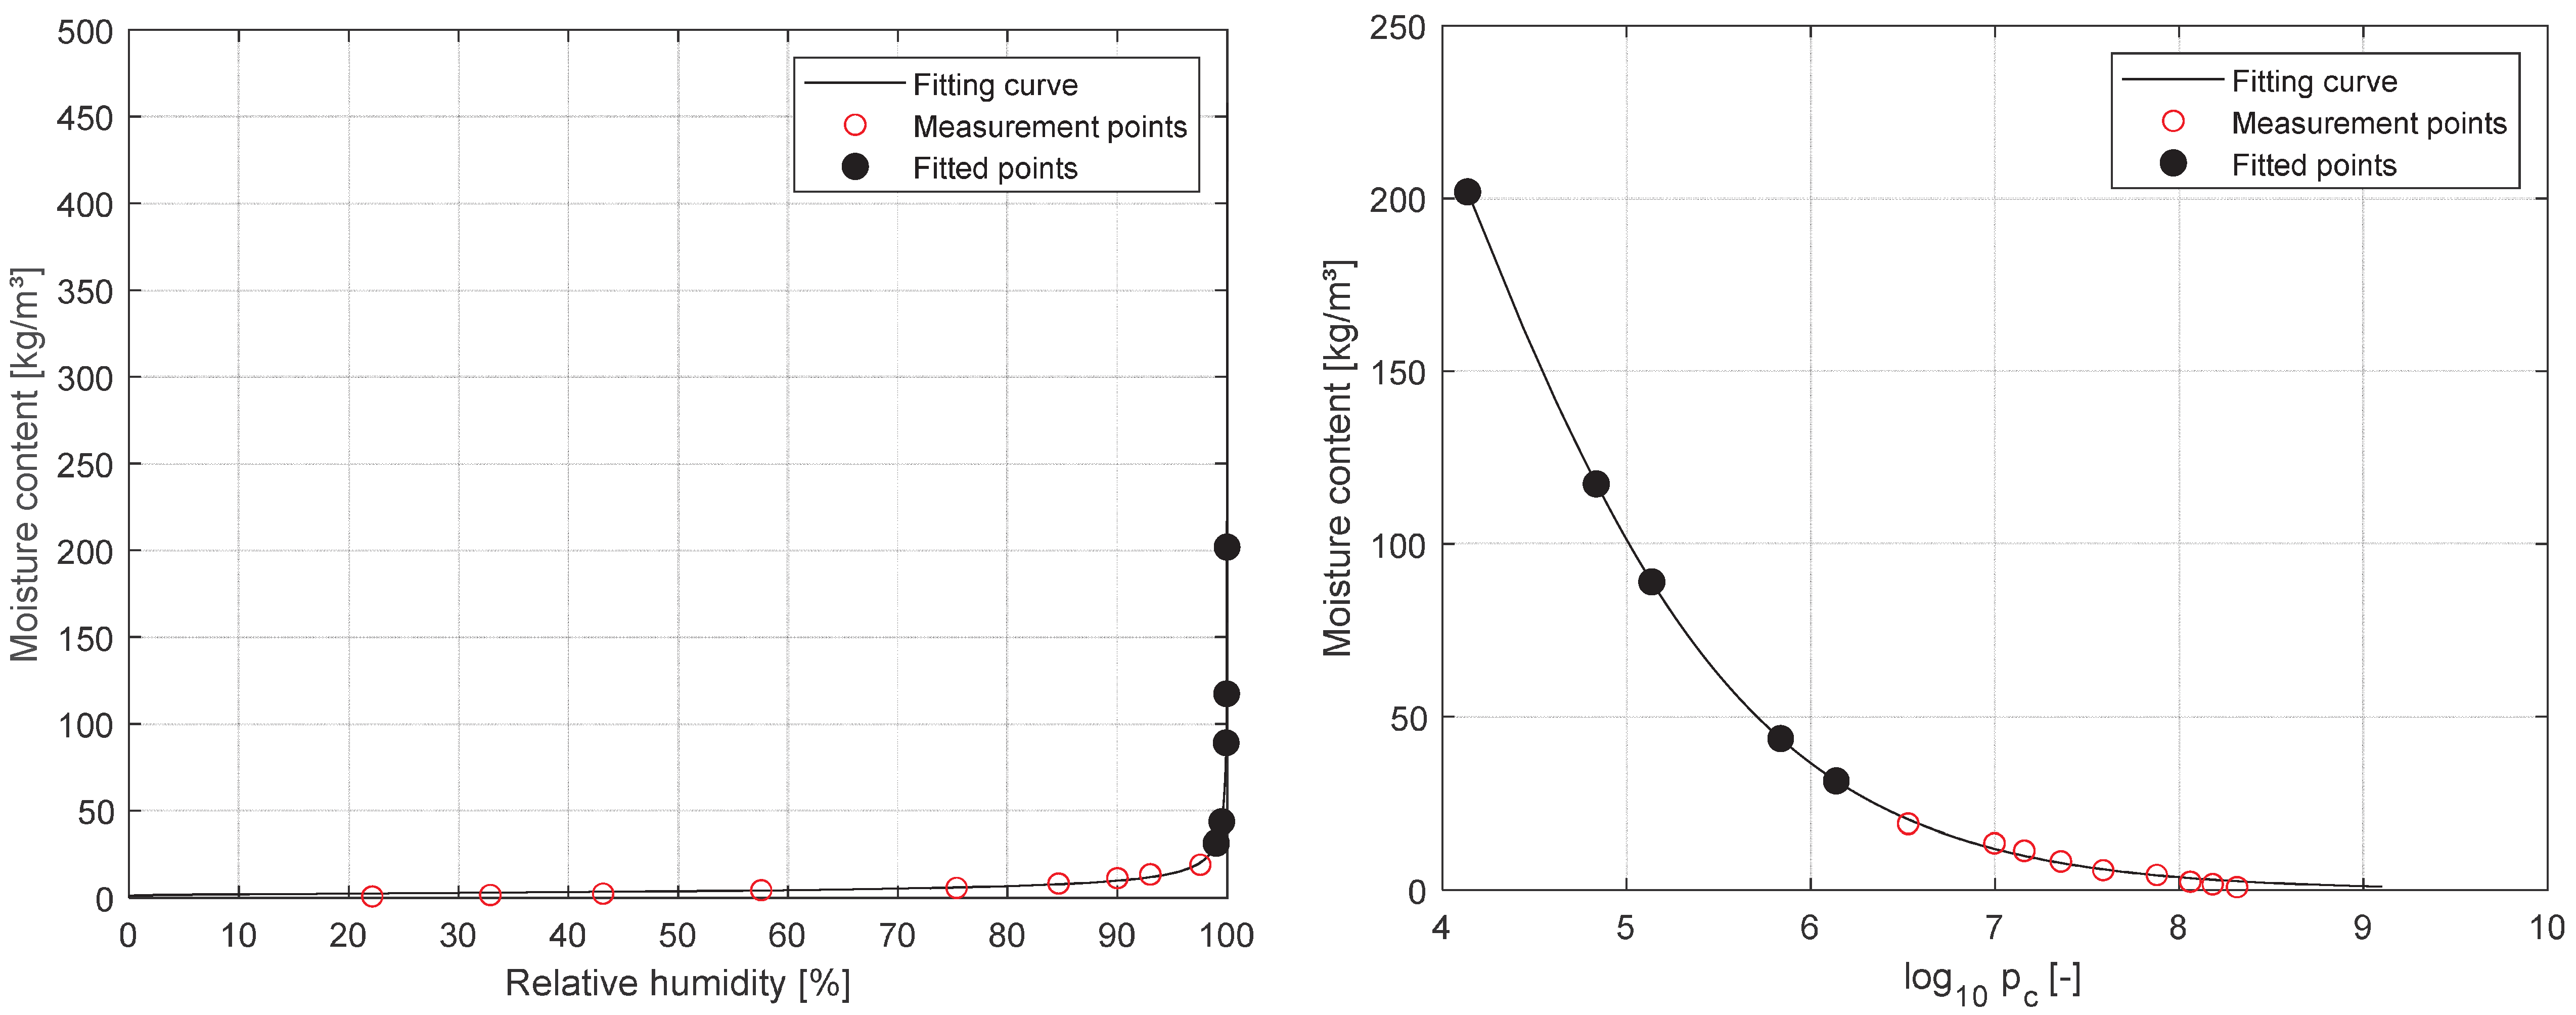
The moisture storage function, w ( 𝜑 ) , is assessed in accordance with the ISO 12572 standard [24], utilizing the desiccator method at a temperature of 23 °C. This involves measurements at nine distinct relative humidities spanning the entire hygroscopic spectrum: 22.8%, 32.9%, 43.2%, 58.2%, 75.4%, 84.7%, 90.0%, 93.0%, and 97.4%. For the determination of the free saturation water content ( w f ), samples are immersed in water until a constant mass is achieved, and w f is subsequently derived by computing the difference from the mass of the dry sample. To calculate the moisture storage function in the overhygroscopic regime, an interpolation method is applied using Equation (3) [25,26]:
w p c = w f 1 + p c p k 1 p k 2
Here, w ( p c ) denotes the water content in relation to the capillary pressure, with p k 1 and p k 2 representing the two fitting parameters. Upon acquiring the moisture storage function as a function of capillary pressure ( p c ) , it can be articulated as a function of relative humidity ( 𝜑 ) using Equation (4), commonly referred to as Kelvin’s formula [27].
𝜑 = e p c 𝜌 w R D T ,
where, 𝜌 W represents the density of water, R D is the gas constant for water vapor, and T denotes the absolute temperature. The water vapor resistance factor is determined following the EN ISO 12572 standard [24] using the cup method. Measurements are conducted at 23 °C under two different conditions: dry cup condition ( 𝜑 i n = 0.03 ,   𝜑 o u t = 0.5 ) and wet cup condition ( 𝜑 i n = 0.93 ,   𝜑 o u t = 0.5 ).
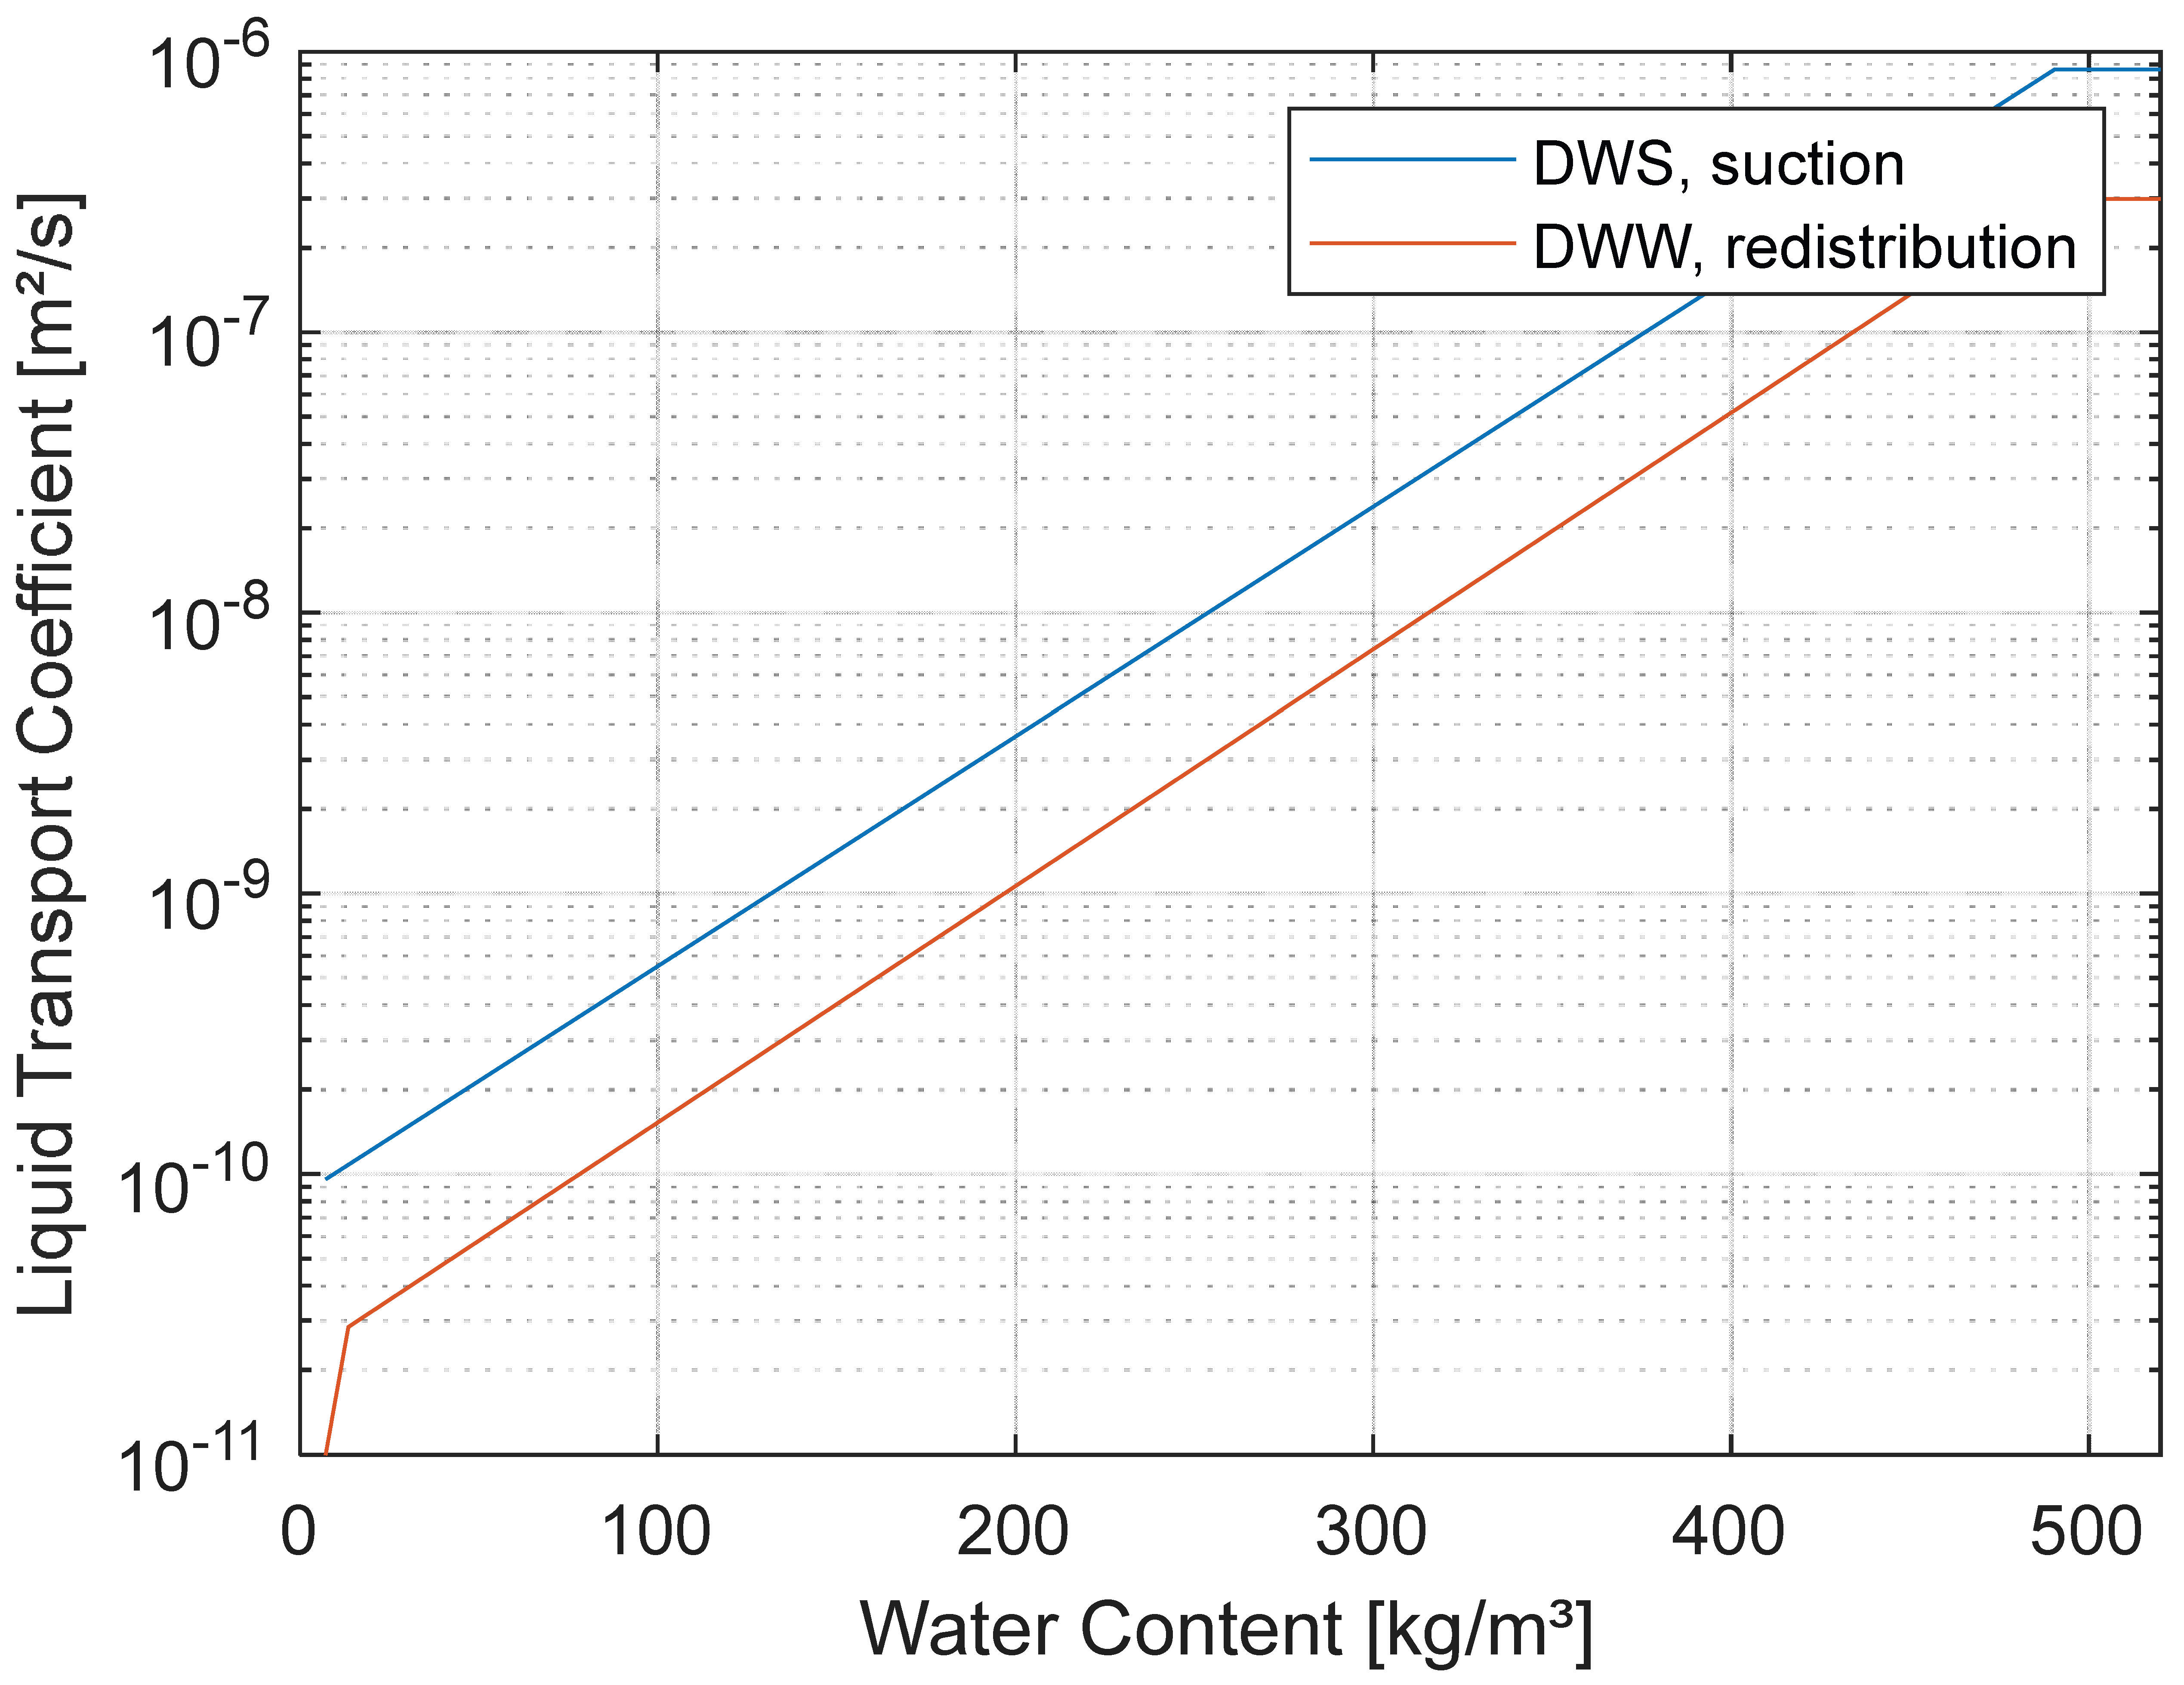
The water uptake coefficient by partial immersion, A w , is measured according to the standard ISO 15148 standard [28]. Subsequently, the liquid transport coefficient for suction as a function of water content, D W S ( w ) , is assumed to be zero for water contents less than w 80 = w ( 𝜑 = 0.8 ) and is determined using Equation (5) for water contents larger than w 80 [27,29]:
D W S w = 3.8   ·   A w w f 2 · 1000 w w f 1
To obtain the liquid transport coefficient for redistribution D w w (w), an iteration process [27] is performed. A drying test [30] is simulated with WUFI Pro, and the coefficient is adjusted to match the measured drying curves with the simulated one.
The methodology used to determine the liquid transport coefficients is an approximation, yet it demonstrates sufficient accuracy for the moisture ranges examined in this study. The main emphasis of this research lies in the hygroscopic regime, where vapor diffusion outweighs liquid transport in significance.

2.2. Hygrothermal Simulations and Simulated Variants

Hygrothermal simulations of a wall are carried out with the WUFI® Plus V3.5.0.1 software. This enables a complete and comprehensive simulation of the combined transport of heat and moisture in a dynamic regime. Furthermore, it allows for studying the effect of several variables by means of parametric simulations. A rectangular box of 4 × 4 × 3 m is modeled. The ceiling and the floor are considered adiabatic, while the walls border all the outdoor boundaries. A 45 cm thick existing masonry, with the insulation plaster (SE) applied internally, is simulated. The stratigraphy can be seen in Figure 1. No windows or doors are modeled. For the same purpose, Wufi® Pro could also be used; however, Wufi Plus allows for working much faster by being able to launch simulations in batch mode.
The following model input parameters are parametrically varied to evaluate the influence of each of them on the results of the simulations: material of existing wall, external climate, internal climate, and insulation thickness (see Table 1). All variants are concatenated; thus, ninety simulations are carried out. The acronyms used in the results’ plots are shown in the table.
Five types of existing walls are simulated (see Table 2). Sandstone Velbke, granite, and sandstone have similar thermal conductivity and different water vapor diffusion resistance factors, while tuff, solid brick ARB, and sandstone Velbke have a similar water vapor diffusion resistance factor and different thermal conductivities. The materials are taken from the Wufi material database.
For the purpose of this study, we categorized the climates based on perceived seasonal characteristics. Brunico was considered representative of a colder climate due to its significant snowfall and prolonged winter conditions; Bolzano, with its relatively moderate temperatures and lower humidity compared to Bari, was deemed temperate; and Bari was identified as a hot and humid location due to its elevated summer temperatures and Mediterranean influence, despite the Bsk classification. This approach allows for capturing a range of conditions relevant to the objectives of this study. As shown in Table 3, Brunico presents the lowest temperatures, while Bari has the highest, and Bolzano is in the middle. The normal rain sum is similar for all three climates, with Bolzano slightly higher. The driving rain on the north façade is similar for Bolzano and Brunico but much bigger for Bari. The driving rain is even higher on the other orientations of the wall. WUFI® Plus allowed the simulation of a wall for the four orientations at the same time. After analyzing the results, it was seen that the wall on the north façade and the wall on the façade with worse driving rain give similar results. This is most likely because the direct solar radiation compensates for the additional driving rain in the other directions. Thus, we show the analysis on the north wall.
Normally in a building simulation (i.e., with WUFI® Plus), internal loads are given as input, and the indoor climate is the result of the simulation. However, since we are interested in a direct comparison between the various simulations, we decide to set an ideal heating and ideal de-/humidification and set the offset temperature and relative humidity following the EN 15026 [31]. Three different internal climates are simulated. The temperature and relative humidity are based on the external temperature (Figure 2). The internal temperature ranges from 20 °C to 25 °C, and it is the same for all three profiles. The relative humidity ranges from 30% to 60% for the profile with medium moisture load (M), from 35% to 65% for the profile with medium moisture load +5% (M5), and from 40% to 70% for the profile with high moisture load (H).
Table 4 shows the initial conditions set for the internal parameters. However, the simulation duration of 5 years ensures that the final results are not affected by these values.
Table 5 shows the parameters set for the wall. The internal and external surface resistances, Rsi and Rse, are set following the EN 15026 [31]. The light absorption coefficient of a surface quantifies the fraction of incident light energy that the surface absorbs rather than reflects or transmits. It depends on the material’s color, texture, and finish. The emission coefficient of a surface describes its efficiency in emitting thermal radiation compared to an ideal blackbody. This depends on the material’s surface properties. For the two coefficients, standard values for a plastered light-colored façade are assumed. R1 and R2 are driving rain coefficients used to quantify how normal rain and wind velocity contribute to the driving rain load on a surface, accounting for its orientation and position on the building facade, with R1 representing the rain contribution independent of wind, and R2 scaling the wind’s effect based on the specific location on the facade. The rainwater absorption factor quantifies the proportion of rainwater available for capillary absorption by a surface after accounting for water loss due to splash-off, varying based on the surface’s roughness, orientation, inclination, and precipitation type.
All simulations are run for five years (this is verified to be enough to reach stability), and the results of the last year are analyzed.

2.3. Results Analysis

The primary parameter analyzed to estimate the success of internal insulation is the relative humidity of the insulation in the last thin layer of the mesh attached to the existing wall (for 4 cm of insulation, the analyzed layer is at 5.7 cm from the internal surface, and for 12 cm of insulation, at 13.7 cm)—called in this paper “relative humidity behind the insulation”—as this is the layer where the relative humidity is the highest. This is investigated across all simulations, counting the hours when the 95% limit is exceeded [32,33], in order to check the risk-free functioning of the internal insulation.
The impact of various design conditions is then evaluated by comparing the maximum relative humidity values behind the insulation, because this is a significant parameter that in these cases reflects the trend of the entire critical period. For example, to determine the influence of the thickness of internal insulation, the difference between the maximum, minimum, and mean relative humidity behind the insulation for the simulation with 12 cm and for the one with 4 cm internal insulation is calculated for each case (varying internal climate, external climate, and existing wall material). Furthermore, to analyze the influence of the water vapor diffusion resistance factor of the existing wall, sandstone Velbke, sandstone, and granite are considered, while tuff, solid brick ARB, and sandstone Velbke are considered for the influence of the thermal conductivity of the existing wall.
Additionally, to explore how the existing stone type influences the effect of insulation thickness, the variation in maximum relative humidity behind the insulation between 4 cm and 12 cm insulation thicknesses is examined. This variation was evaluated as a function of the change in the ratio between the thermal resistance of the insulation and that of the stone substrate.

3. Results and Discussion

The organization of this section is as follows: initially, the results of the laboratory measurements on the SE plaster are outlined, followed by the simulation results. Finally, the dependence of the wall’s behavior on the different parameters is presented.

3.1. Laboratory Measurements and Data Processing for Building Hygrothermal Simulations

Table 6 provides a summary of the measurements carried out on the plaster SE. It includes essential properties, namely bulk density, porosity, thermal conductivity, specific heat capacity, water vapor resistance factor (measured in both dry and wet conditions), free saturation water content, and water uptake coefficient through partial immersion. The analyzed plaster presents good thermal conductivity; it is an average value for aerogel-based plasters, which are in any case the best-performing plasters on the market. In [7], different insulating plasters are presented, which contain different lightweight additives, like silica aerogel, expanded perlite, expanded vermiculite, and expanded polystyrene beads, to enhance their thermal performance. In their study, cement-based insulating plasters present an average thermal conductivity of 0.077 W/(mK), while natural hydraulic lime-based insulating plasters present 0.097 W/(mK), ranging from 0.055 W/(mK) to 0.2 W/(mK). More recent studies present thermal conductivity values for perlite-based plasters from 0.059 W/(mK) to 0.118 W/(mK) [32], while for aerogel-based plasters, values are from 0.03 W/mK to 0.05 W/mK [33].
Figure 3 depicts the moisture storage function obtained from laboratory measurements. As detailed in Section 2, the data points within the hygroscopic range (from 22.8% to 97.4% relative humidity) and the free saturation water content are directly measured. Conversely, the points within the overhygroscopic range are extrapolated using the fitting function described in Equation (3).
The liquid transport coefficient for suction is derived from the water uptake coefficient by partial immersion through equation, while the liquid transport coefficient for redistribution is derived by matching simulated and measured drying tests. The obtained liquid transport coefficients as a function of the water content are displayed in Figure 4.
As explained in Section 2.1, for the liquid transport coefficient for redistribution, since the laboratory drying test was carried out for two samples (SE12 and SE13), the procedure of matching is carried out twice and two sets of coefficients are derived, afterwards they are averaged (see Table 7). Figure 5 shows the measured drying curve (blue and green solid lines) and the simulated one (blue and green dashed lines) after the matching procedure. The black dashed line shows the drying curve obtained with the averaged coefficients. These are the coefficients used for the simulations.

3.2. Simulation Results

The results presentation is organized as follows: in this first section, a general overview of the results is shown; in Section 3.3, Section 3.4, Section 3.5 and Section 3.6, the influence of each parameter on the behavior of the wall is presented; eventually, the influences of the different parameters are compared and discussed (Section 3.7).
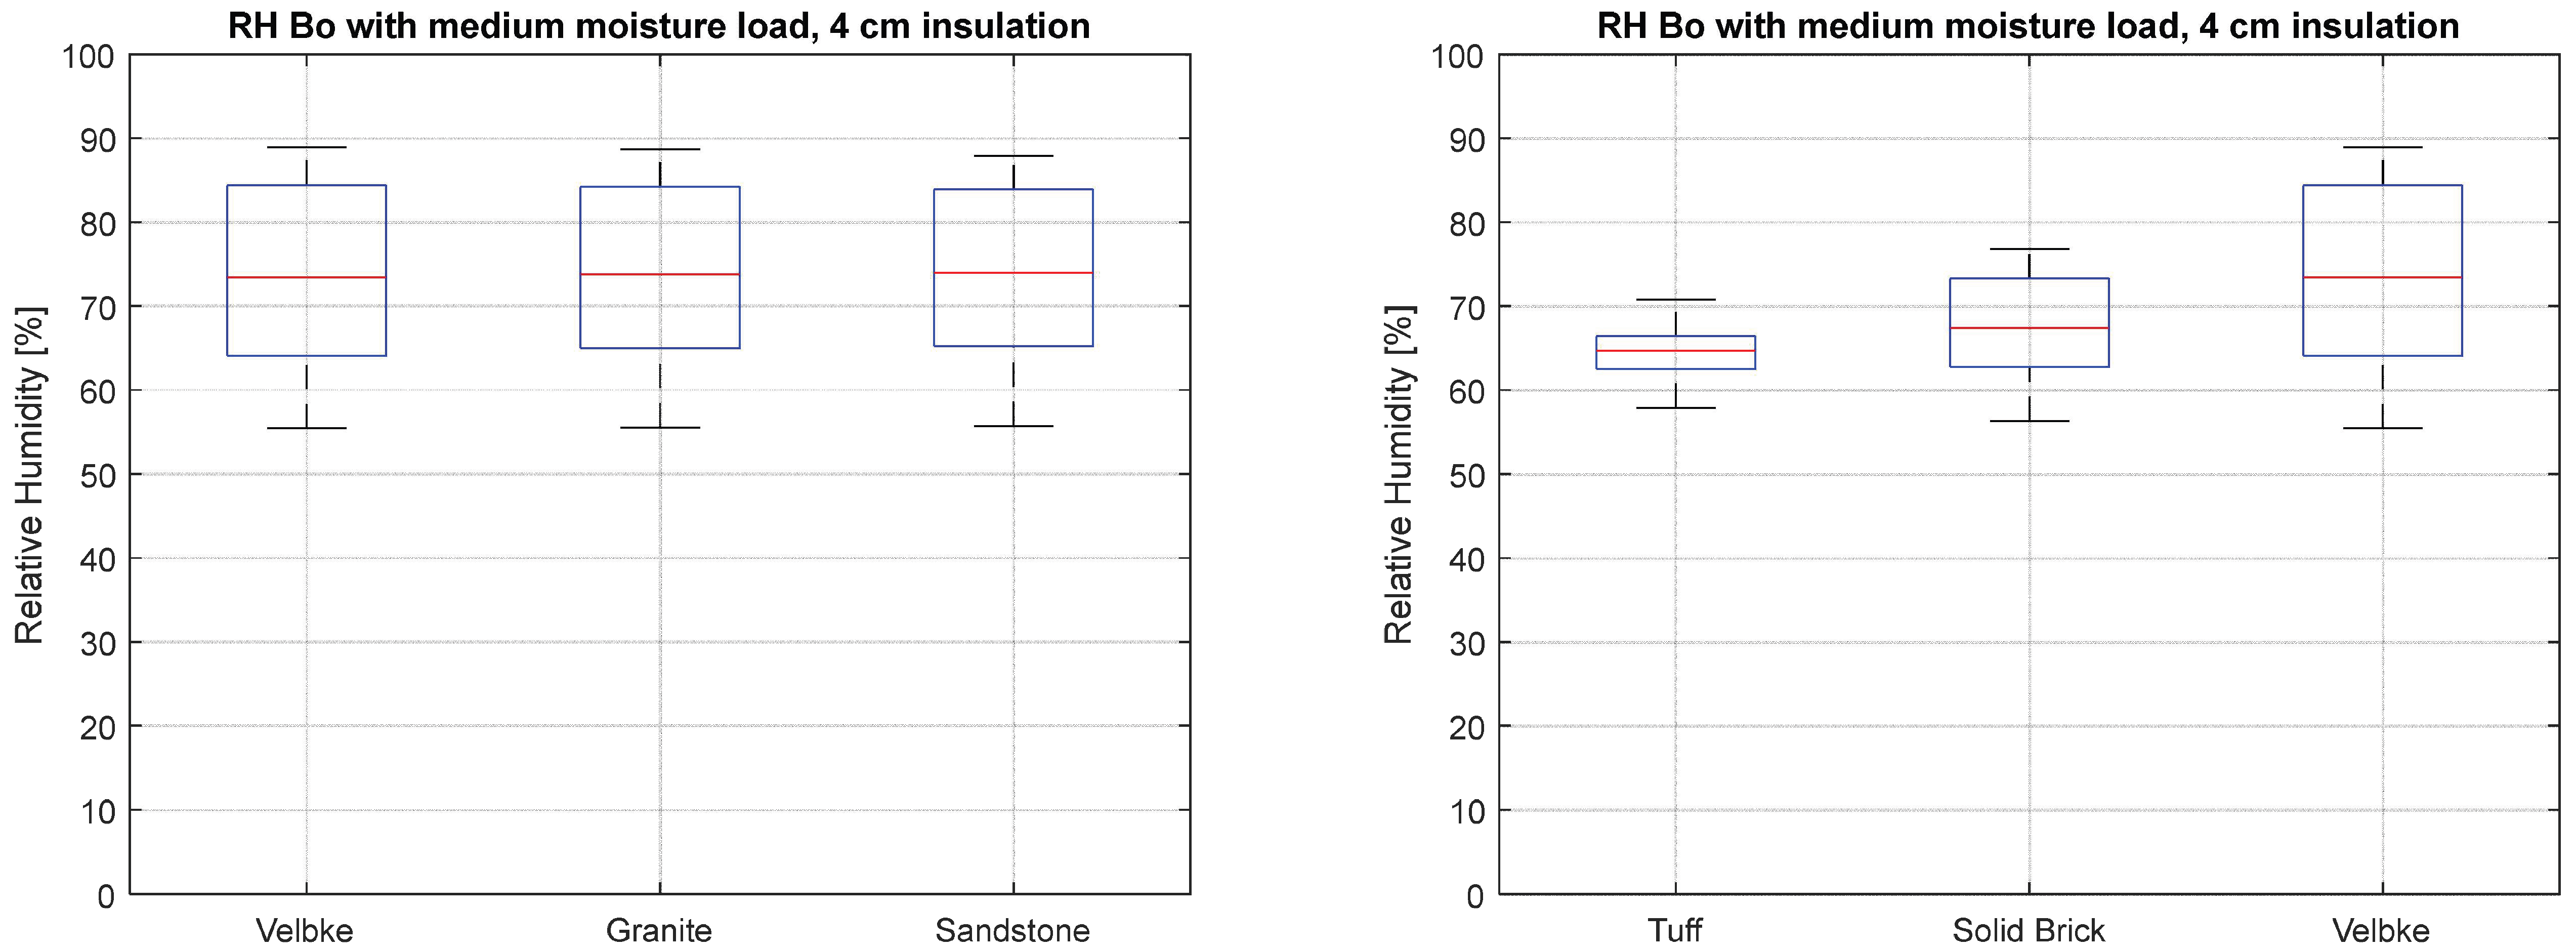
The relative humidity behind the insulation is analyzed to assess the behavior of the wall with the internal insulation, as explained in Section 2.3. For instance, Figure 6 shows the relative humidity evolutions behind the insulation during the last year of simulation for a building located in Bolzano with a medium moisture load and 4 cm of insulation. On the left plot, the existing masonry wall is simulated with different stones with similar thermal conductivities and different water vapor resistance factors, and on the right-hand side, using the three stones that have different thermal conductivities and similar water vapor resistance factors. It can be noticed that there is a similarity between the results of the stones with different vapor resistance factors and a big deviation in the results for the stone with different thermal conductivities, especially in wintertime. The same conclusions can be drawn even more clearly from the box plots of the distribution of RH (Figure 7). The three box plots on the left are very similar, while the three box plots on the right are different; the maximum, the 75th percentile, and also the median show a big change. In any case, all simulations stay well under the established threshold of 95%, and thus the insulation under these conditions can be applied without risks, according to the benchmark defined in [34,35].
Table 8 shows a summary of all 90 simulations with the number of hours when the relative humidity behind the insulation exceeds 95%. In Bolzano and Bari, the relative humidity behind the insulation never exceeds 95% for any of the analyzed cases. In Brunico, the cases with medium moisture load always work, as well as the cases with the tuff as the existing wall. The operation is critical for the high moisture load.

3.3. Influence of the Existing Wall Properties

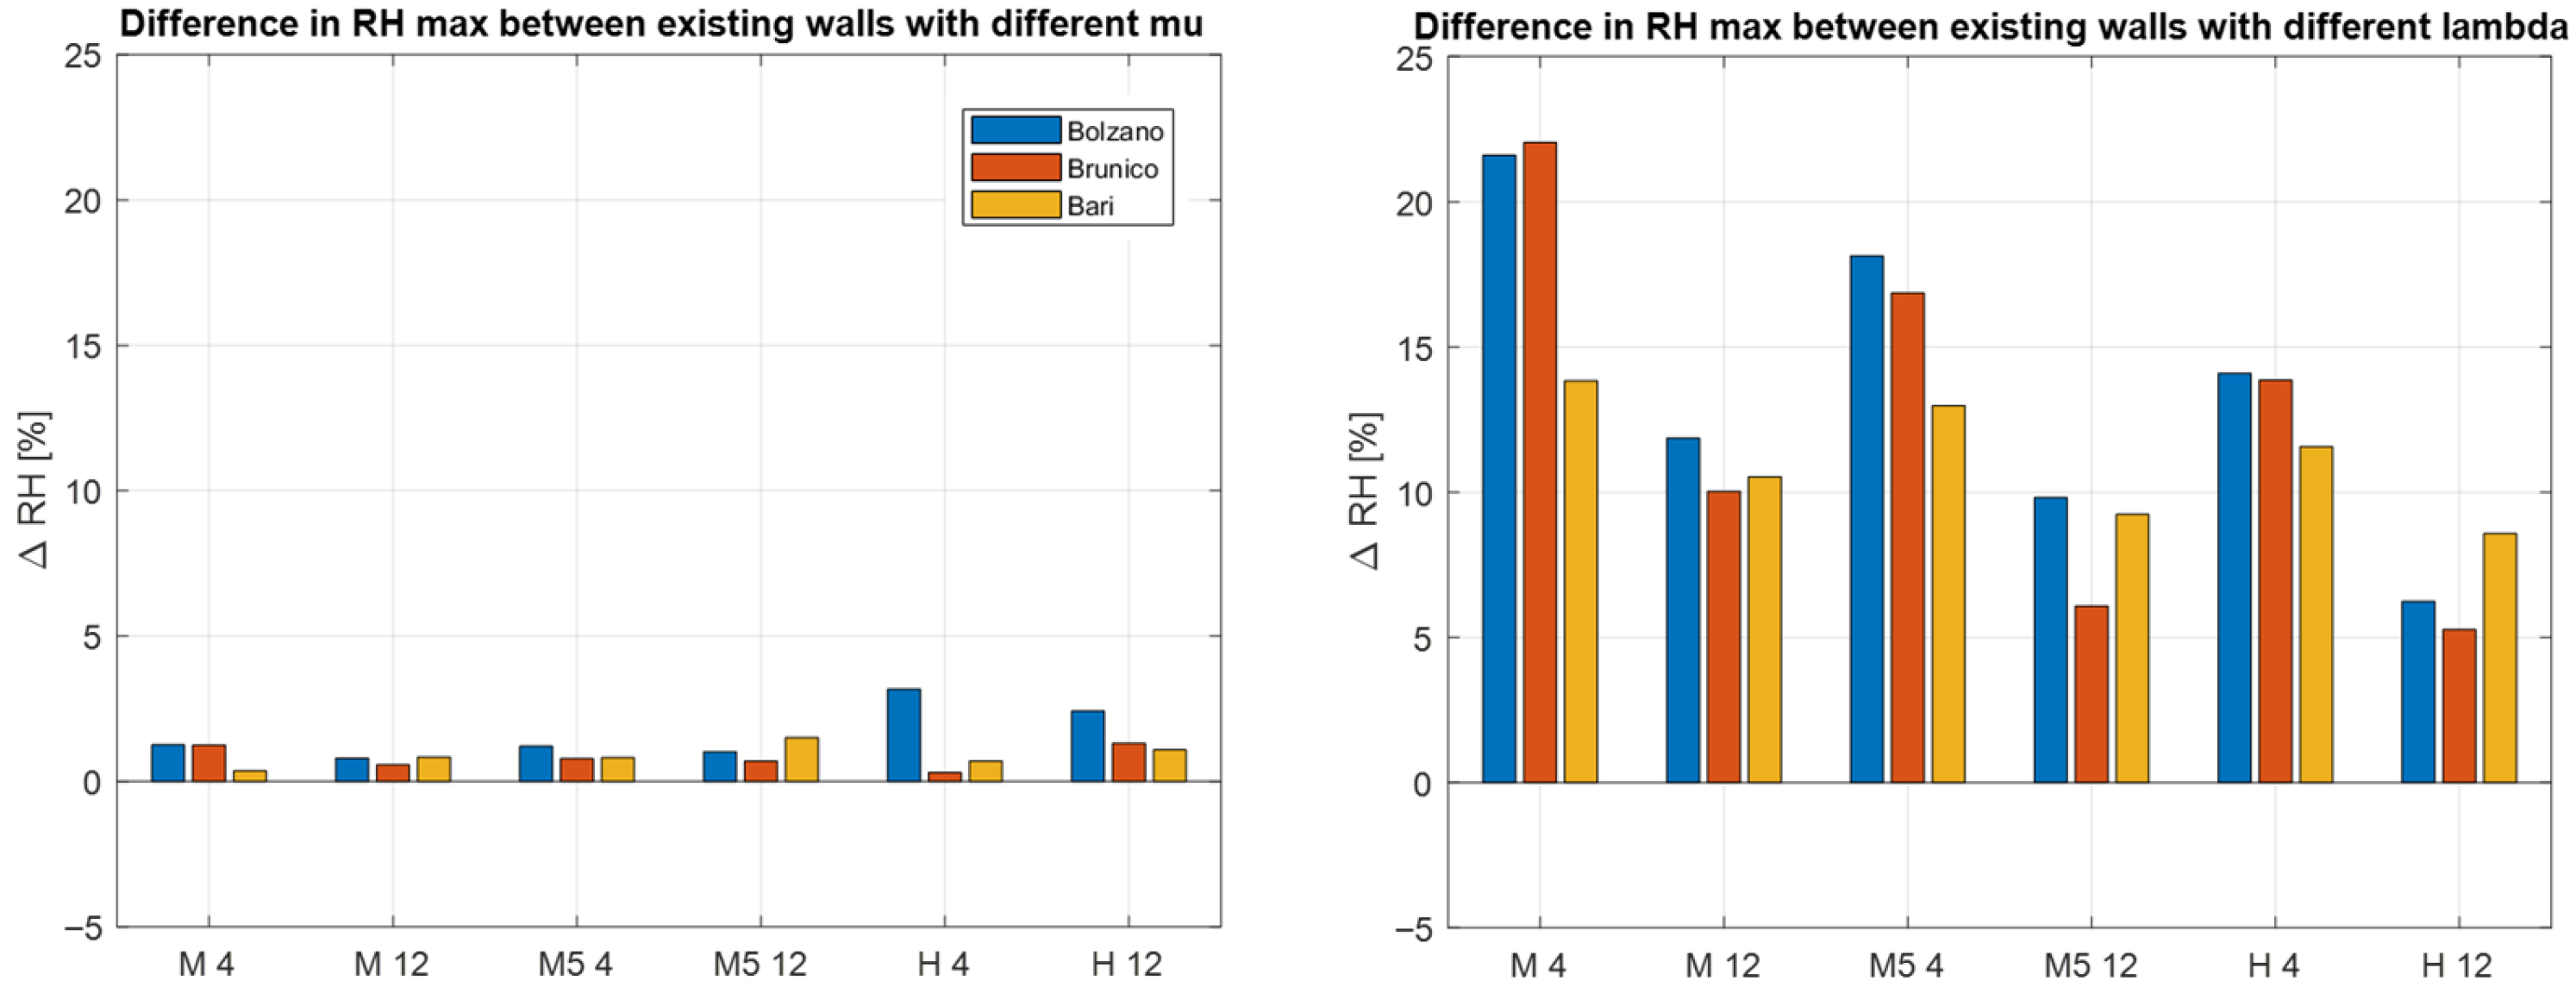
Figure 8 shows the difference in the maximum relative humidity behind the insulation depending on the stone used for the existing wall. The difference is calculated case-by-case as a difference between the stone with the highest relative humidity and the stone with the lowest relative humidity.
On the left, the stones with similar thermal conductivities and different water vapor resistance factors are displayed, while on the right, the stones with different thermal conductivities and similar water vapor resistance factors are displayed. It can be noticed that the differences on the left (they range from 0.3% to 3.2%) are much lower than the differences on the right (they range from 5.3% to 22.0%).

3.4. Influence of Insulation Thickness

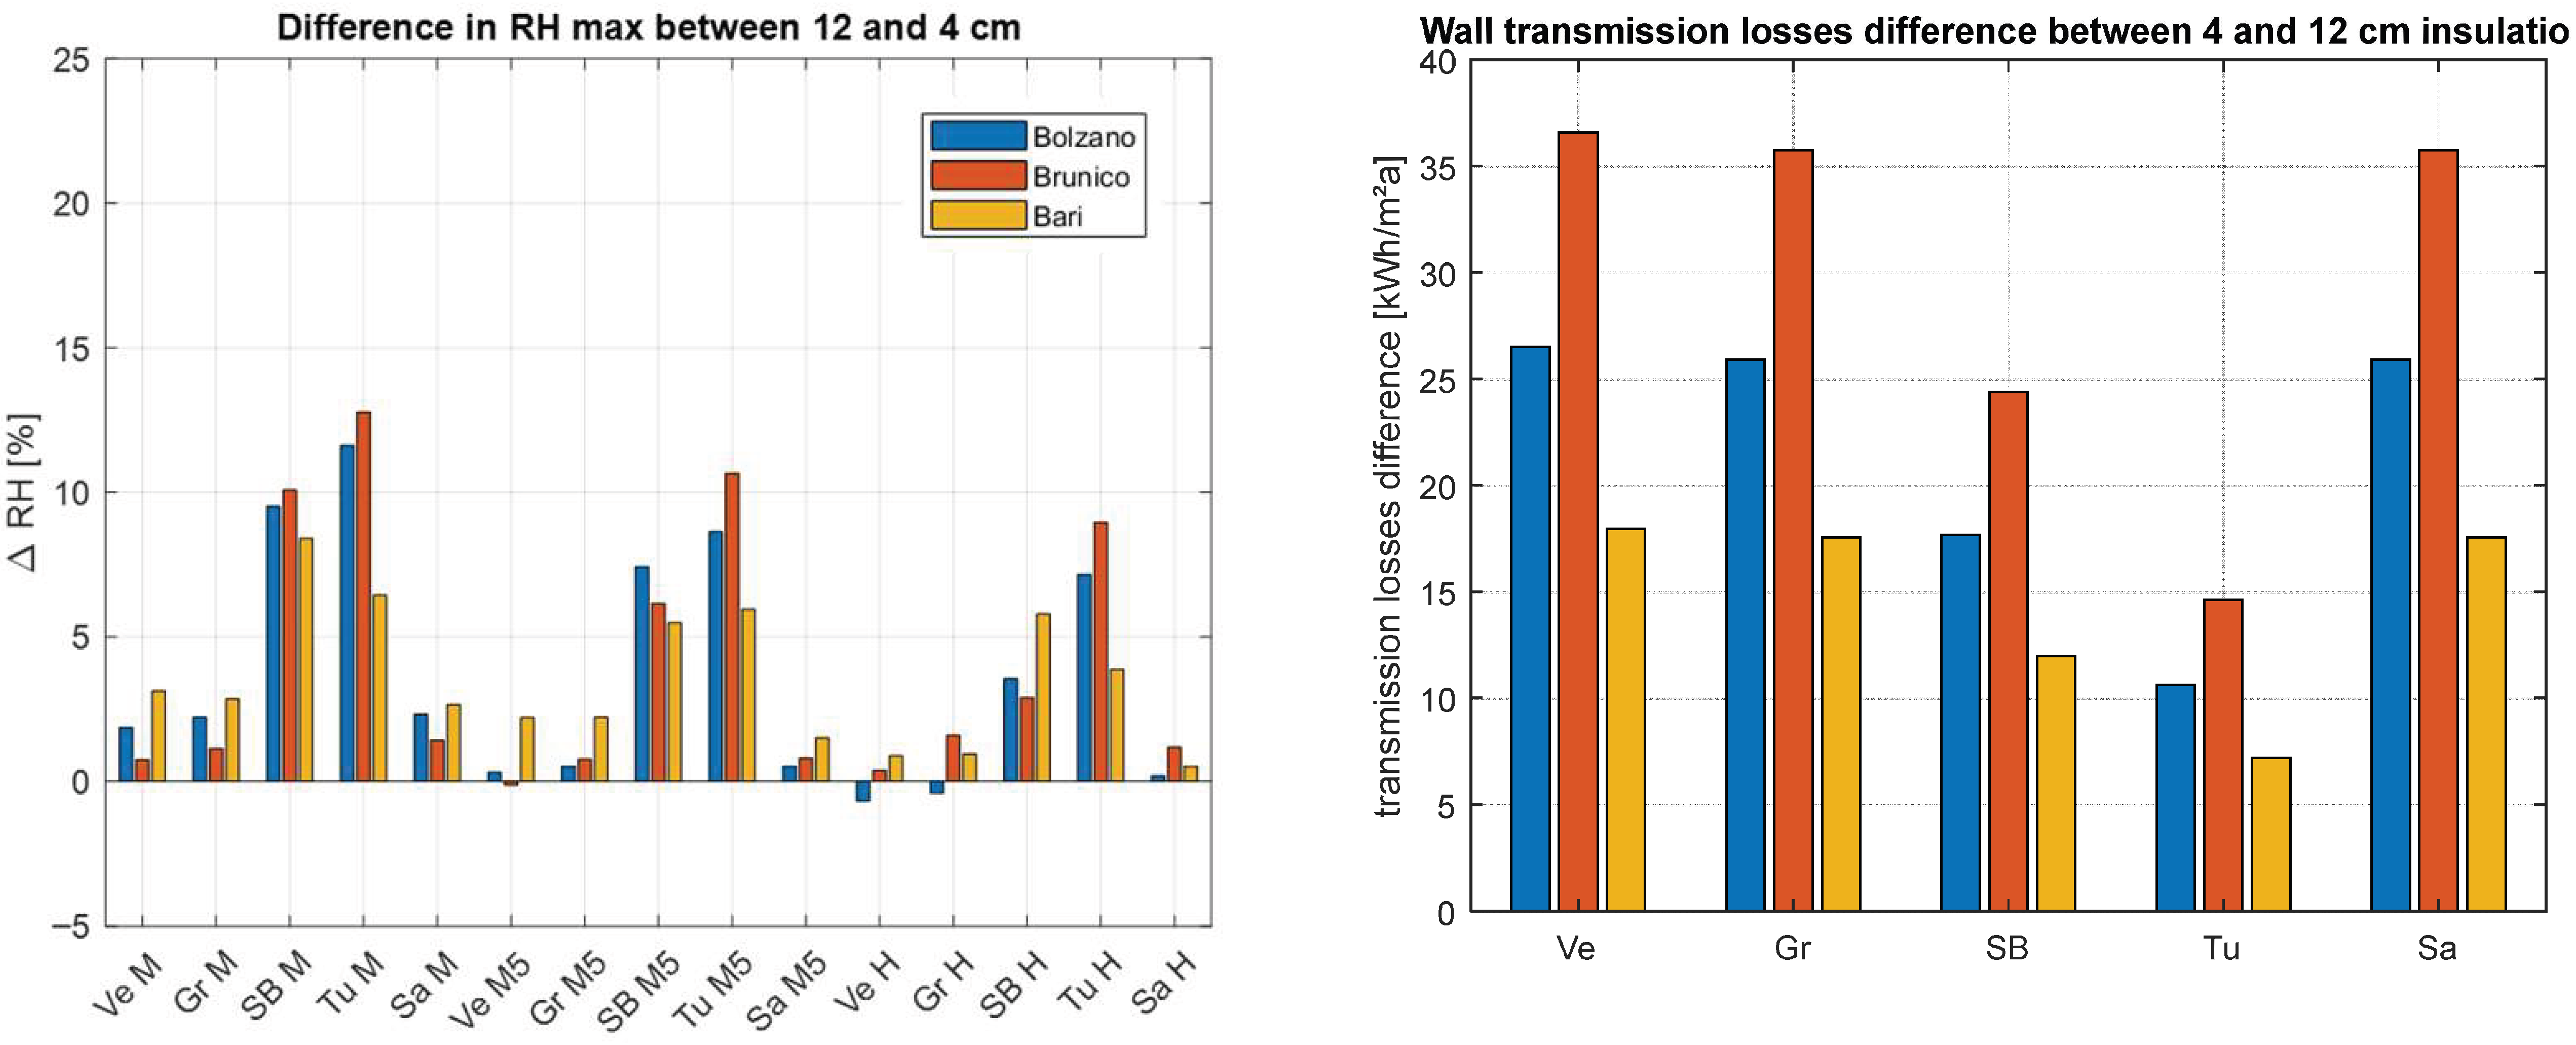
The left graph of Figure 9 represents the difference in the maximum relative humidity behind the insulation between 12 and 4 cm insulation thickness for the different cases. It can be noticed that for sandstone Velbke, granite, and sandstone, the differences are low and range from −0.7% for Velbke, high moisture load, Bolzano (meaning that the results obtained with 12 cm are better than those with 4 cm) to 3.1% for Velbke, medium moisture load, Bari. For solid brick and tuff, the differences are higher, going from 3.9% for tuff, high moisture load, Bari to 12.8% for tuff, medium moisture load, Brunico. The right graph of the picture represents the total wall winter transmission losses difference (energy savings per m2 wall) for the different types of stones. For walls with a greater dependence on insulation thickness, the difference in relative humidity is smaller (sandstone Velbke, granite, sandstone). Instead, for solid brick and tuff, applying more cm of insulation means raising the RH significantly while savings remain small in comparison with other cases.

3.5. Influence of Internal Moisture Loads

Figure 10 shows the differences in the maximum relative humidity behind the insulation between the cases with different moisture loads. The difference is calculated case-by-case between the cases with the highest relative humidity and the cases with the lowest relative humidity. The differences vary between 2.1% for sandstone, 12 cm, Bolzano, and 13.6% for tuff, 4 cm, Bolzano.

3.6. Influence of External Climate

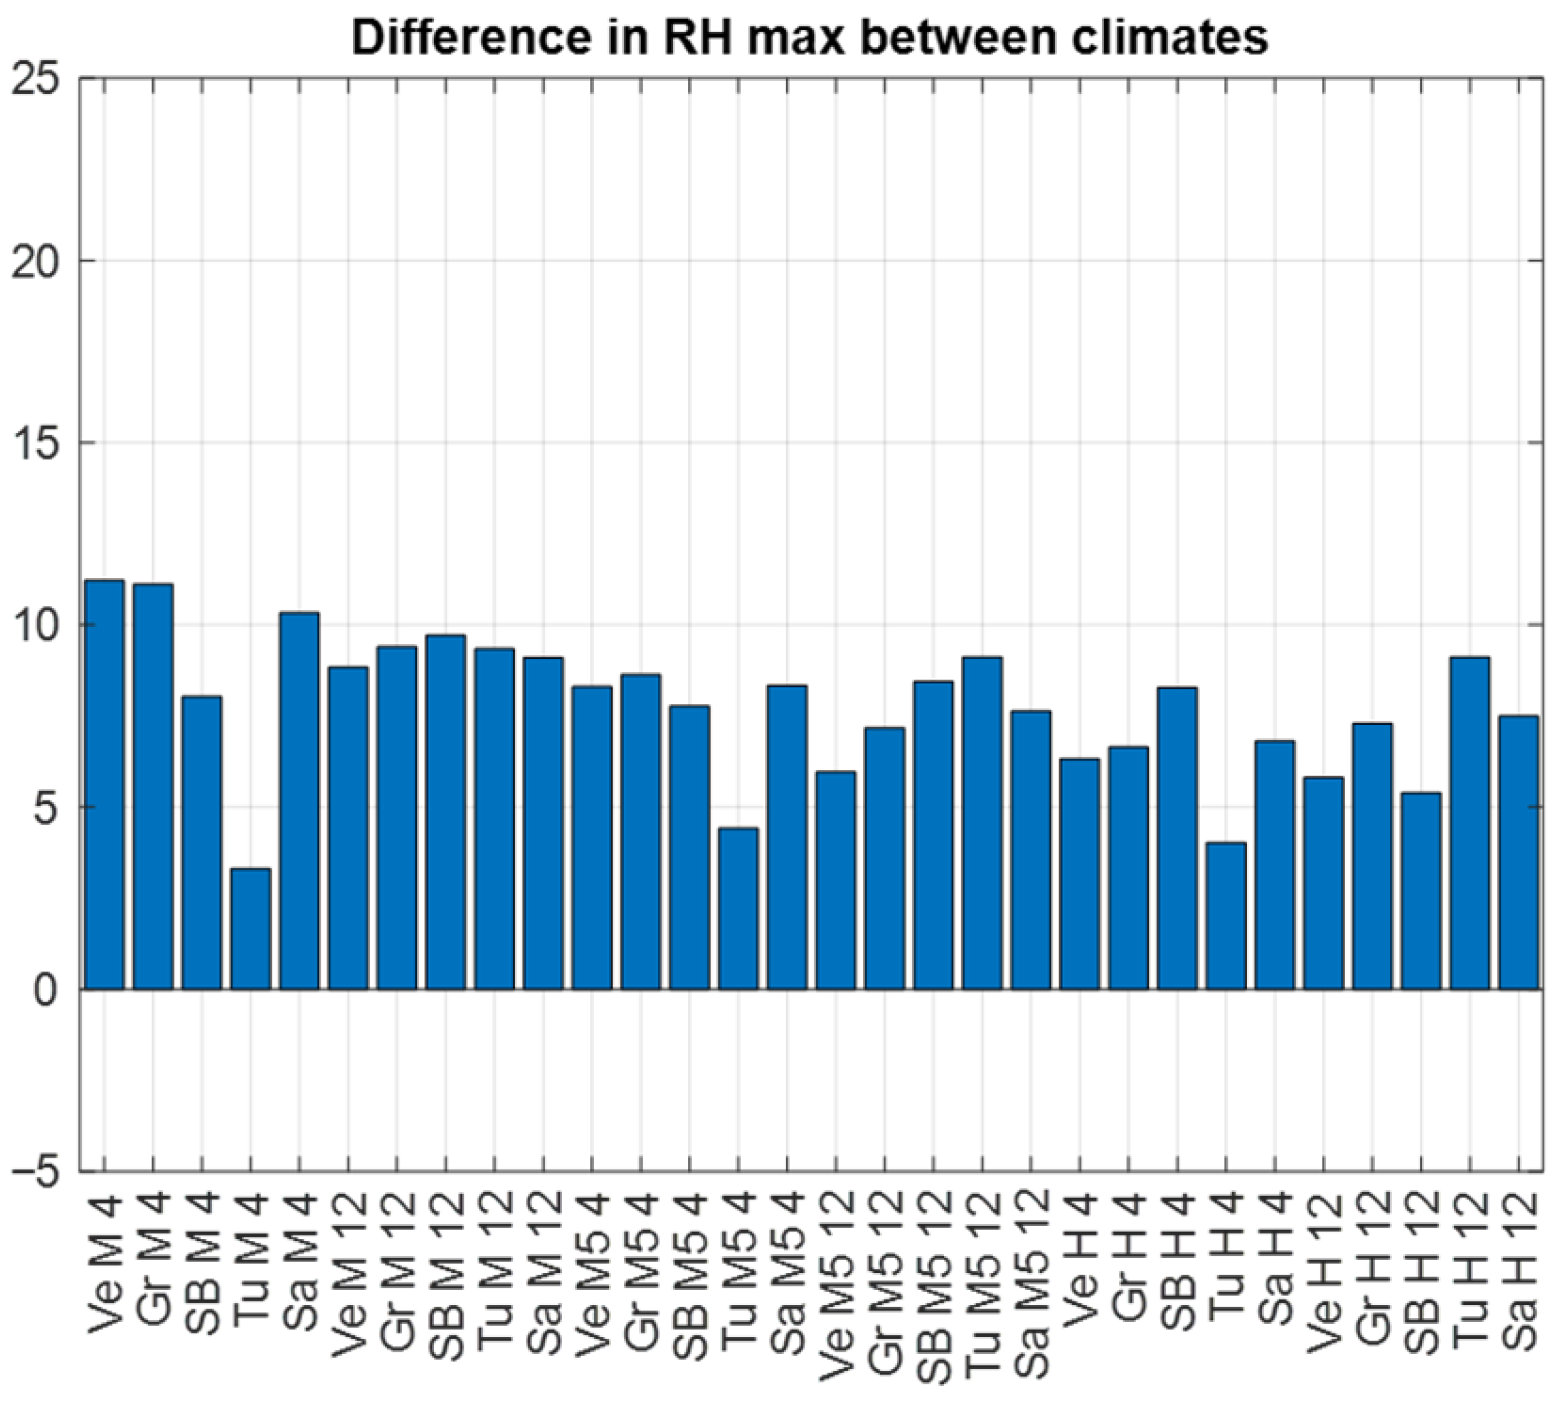
Figure 11 shows the differences in the maximum relative humidity behind the insulation between the different climates. The difference is calculated case-by-case between the cases with the highest relative humidity and the cases with the lowest relative humidity. The differences range from 3.3% for tuff, medium moisture load, 4 cm to 11.2% for Velbke, medium moisture load, 4 cm.

3.7. Discussion of the Influence of the Different Parameters

Table 9 summarizes the results shown in the sections before. The maximum, minimum, and mean differences between maximum relative humidity behind the insulation for the variation of the different parameters are shown. Looking at the mean, the thermal conductivity of the existing wall material has a much bigger influence on the relative humidity behind the insulation than the vapor resistance factor. This can also be noticed looking at the minimum and maximum. The mean difference obtained by the variation of insulation thickness is low compared to the other parameters’ variation. In this case, we also have a negative minimum in some cases: this means that it is more convenient to use 12 cm than 4 cm of internal insulation. However, there are some cases in which putting 12 cm instead of 4 cm makes the situation much worse; thus, the maximum is relatively high. The variation of the internal moisture load and the external climate has a big influence on the relative humidity behind the insulation; they have similar means, minimums, and maximums with slight differences.
Generalizing, for the selected cases, it can be said that the thermal conductivity of the existing wall material has the biggest influence, while the vapor resistance factor of the existing wall material has the lowest.
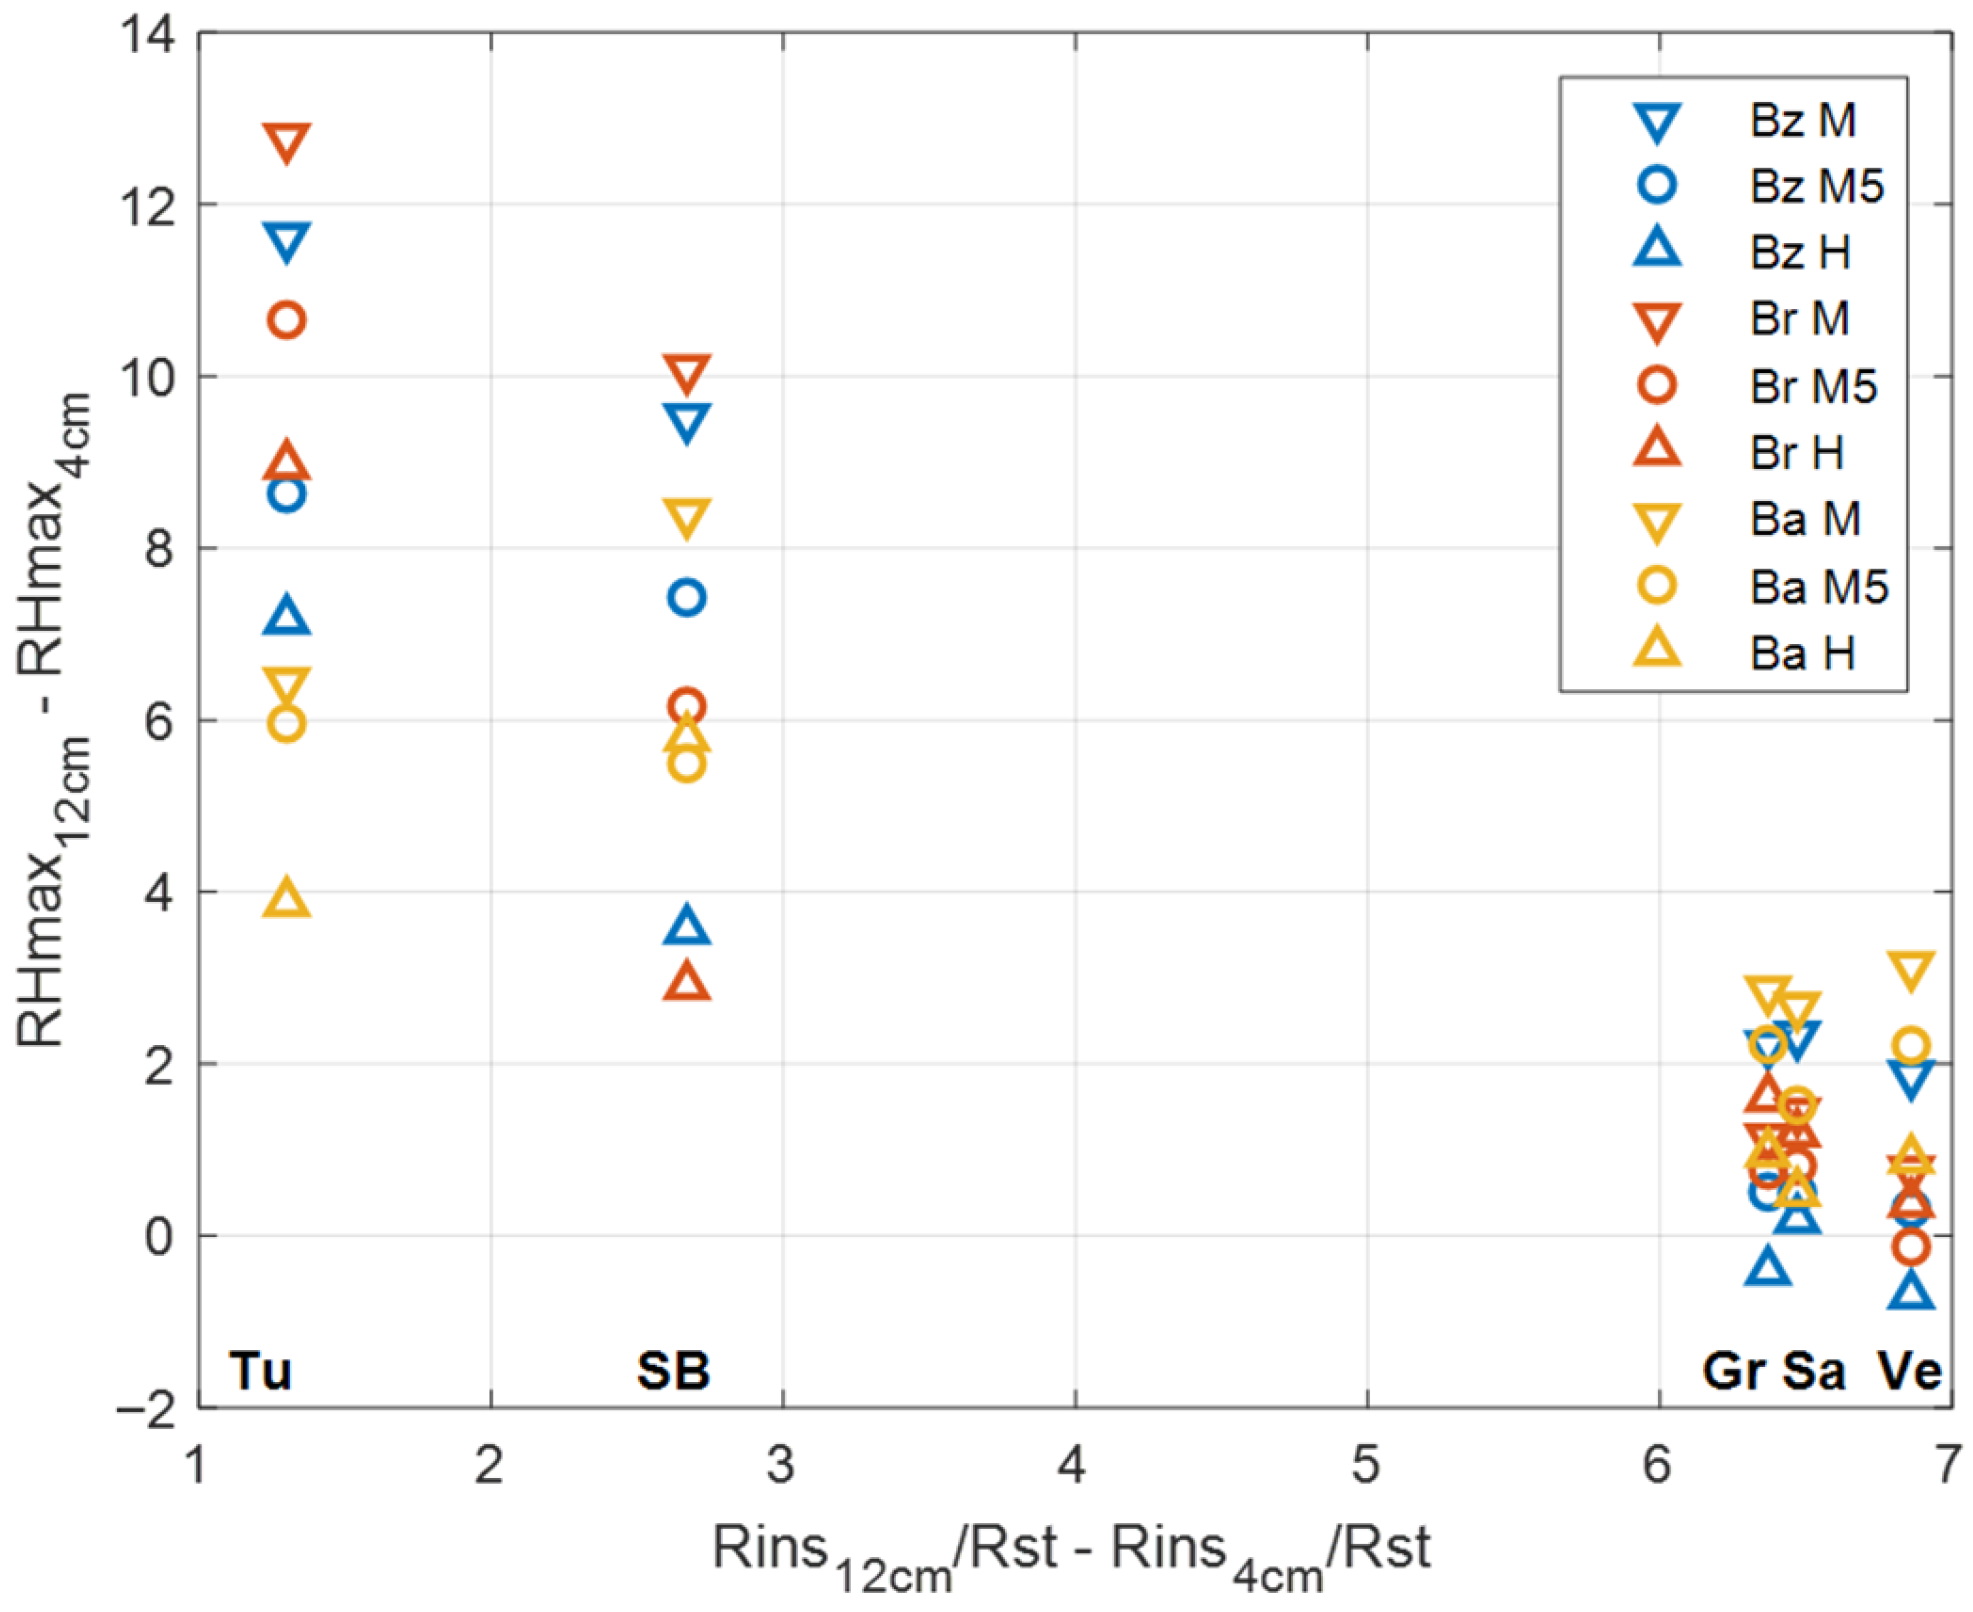
In order to explain the influence of the insulation thickness on the results, Figure 12 shows the difference between the maximum relative humidity behind the insulation between 12 cm and 4 cm insulation thickness as a function of the difference between the ratio of insulation resistance and existing stone resistance between 12 and 4 cm insulation thickness. Looking at the value of the x-axis for the tuff and the solid brick: if the internal insulation changes from 4 to 12 cm, the difference in resistance of the insulation is 1.3 and 2.7 in comparison to the resistance of the existing wall stone. For granite, sandstone, and sandstone Velbke, these ratios are 6.4, 6.5, and 6.9. This means that for tuff and solid brick, the difference in resistance by putting 12 cm instead of 4 cm of insulation is still comparable to the resistance of existing stone. For the others, however, this difference in resistance by changing the thickness of insulation is much greater than the resistance of stone. For these last cases (granite, sandstone, and sandstone Velbke), we have a maximum difference in the maximum relative humidity behind the insulation by varying the internal insulation from 4 to 12 cm of 3.1%, while for tuff and solid brick we have more variability (the difference in relative humidity ranges from 2.9% to 12.8%). This can be seen also in Figure 8.

4. Conclusions

This paper outlines the experimental investigation conducted to characterize the hygrothermal behavior of a novel recycled material insulating plaster, referred to as plaster “SE.” Subsequently, the gathered experimental data is employed to develop a realistic dynamic simulation model at building scale. This model allows for the evaluation of the performance of the internal insulating plaster. Furthermore, the influence of the different parameters (existing wall properties, insulation thickness, internal and external climate) on the wall behavior is analyzed and compared.
The insulating plaster works very well for most of the simulated cases, and it only presents some difficulties for the climate of Brunico and for the highest moisture loads.
The thermal conductivity of the existing wall shows the biggest influence on simulation results, and the vapor resistance factor shows the lowest. This is an interesting result that should be extended to other climates, including also those with more significant wind-driven rain. In addition to that, it is worth noting that in this study, the mortar joints of the existing wall are neglected, as the wall is modeled in 1D as if it were composed solely of bricks or stone. Although some studies have demonstrated that the influence of mortar joints is relatively small, this aspect should be considered in future research to further refine the analysis. Furthermore, this study is limited to a set of five real stones, so the effect of the other parameters may also play a role. It would be interesting to study the sole effect of thermal conductivity or vapor resistance factors, changing just these parameters in the existing stones from the database. The thickness of insulation presents a low influence when the insulation thermal resistance is much bigger than that of the existing walls. For some cases, it is even more convenient to put 12 cm instead of 4 cm of insulation when it comes to the interstitial relative humidity, as it profits from the fact that with more insulation, the moisture storage capacity is also greater. An extension of this study to other types of insulation and other climates will be needed to demonstrate the applicability of these results to other conditions. The impact of internal moisture load and external climate is in line with the results found in previous partial studies. As mentioned before, simulations were conducted exclusively on 1D elements, which means that thermal bridges—an important aspect in the case of internal insulation—are not analyzed. Specific analyses of thermal bridges should always be carried out for each real building to ensure accurate assessments of hygrothermal performance.

Author Contributions

Conceptualization, E.L., M.L., A.T., A.S., G.N., and D.H.-A.; methodology, E.L.; simulations, E.L.; writing—original draft preparation, E.L.; visualization, E.L.; supervision, D.H.-A. and A.T.; project administration, D.H.-A. and A.T.; funding acquisition, A.S. and G.N. All authors have read and agreed to the published version of the manuscript.

Funding

This study received the support of two research projects. Material development and hygrothermal measurements were performed within the project “ERG–Nuovi intonaci in materiali riciclabili ad economia circolare” funded by APIAE—Provincia Autonoma di Trento (LP6/99 Pratica 24-19). The data analysis and the parametric study were carried out within the PNRR research activities of the consortium iNEST (Interconnected North-East Innovation Ecosystem) funded by the European Union Next-GenerationEU (Piano Nazionale di Ripresa e Resilienza (PNRR)—Missione 4 Componente 2, Investimento 1.5—D.D. 1058 23/06/2022, ECS_00000043). This manuscript reflects only the authors’ views and opinions; neither the European Union nor the European Commission can be considered responsible for them.

Data Availability Statement

A table of simulations’ data is published here: https://doi.org/10.5281/zenodo.17130796. Other data supporting the conclusions of this article will be made available by the authors on request.

Acknowledgments

The authors thank the Department of Innovation, Research University, and Museums of the Autonomous Province of Bozen/Bolzano for covering the Open Access publication costs.

Conflicts of Interest

Authors Anna Stefani and Gianni Nerobutto were employed by the companies Calchèra San Giorgio and Nerobutto Srl. The remaining authors declare that the research was conducted in the absence of any commercial or financial relationships that could be construed as a potential conflict of interest. The funders had no role in the design of the study; in the collection, analyses, or interpretation of data; in the writing of the manuscript; or in the decision to publish the results.

Abbreviations and Nomenclature

The following abbreviations and nomenclature are used in this manuscript:
A w [kg/(m2s0.5)]Water uptake coefficient by partial immersion
C s [J/kgK]Specific heat capacity
C v o l [J/(m3K)]Volumetric heat capacity
D w s ( w ) [m2/s]Liquid transport coefficient for suction as a function of water content
D w w ( w ) [m2/s]Liquid transport coefficient for redistribution as a function of water content
p c [Pa]Capillary pressure
p k 1 [Pa]Fitting parameter 1
p k 2 [-]Fitting parameter 2
R D [J/(kg K)]Gas constant of water vapor
T [K]Absolute temperature
w ( 𝜑 ) [-]Moisture storage function
w p c [kg/m3]Water content as a function of the capillary pressure pc
w f [kg/m3]Water content at free saturation
𝜆 [W/(mK)]Thermal conductivity
𝜌 b [kg/m3]Bulk density
𝜌 t [kg/m3]True density
𝜌 W [kg/m3]Density of water
ϕ [-]Porosity
𝜑 [-]Relative humidity (RH [%])

References

  1. Wedebrunn, O. Energy Efficiency Solutions for Historic Buildings; A Handbook; Birkhäuser: Basel, Switzerland, 2015. [Google Scholar]
  2. Blumberga, A.; Freimanis, R.; Biseniece, E.; Kamenders, A. Hygrothermal Performance Evaluation of Internally Insulated Historic Stone Building in a Cold Climate. Energies 2023, 16, 866. [Google Scholar] [CrossRef]
  3. Vereecken, E.; Roels, S. Capillary Active Interior Insulation Systems for Wall Retrofitting: A More Nuanced Story. Int. J. Archit. Herit. 2016, 10, 558–569. [Google Scholar] [CrossRef]
  4. Kassim, M.; Aslani, A.; Zahedi, R. Energy Performance Analysis of Thermal Insulating Plaster in the Different Climate Zones. Therm. Sci. Eng. Prog. 2024, 47, 102294. [Google Scholar] [CrossRef]
  5. Marincioni, V.; Gori, V.; de Place Hansen, E.J.; Herrera-Avellanosa, D.; Mauri, S.; Giancola, E.; Egusquiza, A.; Buda, A.; Leonardi, E.; Rieser, A. How Can Scientific Literature Support Decision-Making in the Renovation of Historic Buildings? An Evidence-Based Approach for Improving the Performance of Walls. Sustainability 2021, 13, 2266. [Google Scholar] [CrossRef]
  6. Zhou, X.; Carmeliet, J.; Derome, D. Assessment of Moisture Risk of Wooden Beam Embedded in Internally Insulated Masonry Walls with 2D and 3D Models. Build. Environ. 2021, 193, 107460. [Google Scholar] [CrossRef]
  7. Barbero, S.; Dutto, M.; Ferrua, C.; Pereno, A. Analysis on Existent Thermal Insulating Plasters towards Innovative Applications: Evaluation Methodology for a Real Cost-Performance Comparison. Energy Build. 2014, 77, 40–47. [Google Scholar] [CrossRef]
  8. Freimanis, R.; Vanaga, R.; Balodis, V.; Zundans, Z.; Blumberga, A. Hygrothermal Assessment of Insulation Systems for Internal Insulation of Solid Masonry Walls under Various Conditions. Buildings 2023, 13, 2511. [Google Scholar] [CrossRef]
  9. Vereecken, E.; Van Gelder, L.; Janssen, H.; Roels, S. Interior Insulation for Wall Retrofitting—A Probabilistic Analysis of Energy Savings and Hygrothermal Risks. Energy Build. 2015, 89, 231–244. [Google Scholar] [CrossRef]
  10. Pagoni, P.; Møller, E.B.; Peuhkuri, R.H. Decisive Parameters for Moisture Safe Internal Insulation of Masonry—Long Time Monitoring in Inhabited Dwellings. Energy Build. 2024, 312, 114180. [Google Scholar] [CrossRef]
  11. Losini, A.E.; Woloszyn, M.; Chitimbo, T.; Pelé-Peltier, A.; Ouertani, S.; Rémond, R.; Doya, M.; Gaillard, D.; Force, M.S.; Outin, J.; et al. Extended Hygrothermal Characterization of Unstabilized Rammed Earth for Modern Construction. Constr. Build. Mater. 2023, 409, 133904. [Google Scholar] [CrossRef]
  12. Mahmood, O.; Kavgic, M.; Noel, M. Hygrothermal and Mechanical Characterization of Novel Hemp-Lime Composites with Enhanced Consistency. Constr. Build. Mater. 2024, 450, 138720. [Google Scholar] [CrossRef]
  13. Maaroufi, M.; Belarbi, R.; Abahri, K.; Benmahiddine, F. Full Characterization of Hygrothermal, Mechanical and Morphological Properties of a Recycled Expanded Polystyrene-Based Mortar. Constr. Build. Mater. 2021, 301, 124310. [Google Scholar] [CrossRef]
  14. Nielsen, A. Use of Sensitivity Analysis to Evaluate Hygrothermal Conditions in Solid Brick Walls with Interior Insulations; Kyoto University: Kyoto, Japan, 2012. [Google Scholar]
  15. Hagentoft, C.-E. Probabilistic Analysis of Hygrothermal Conditions and Mould Growth Potential in Cold Attics. Impact of Weather, Building System and Construction Design Characteristics. In Proceedings of the International Conference on Durability of Building Materials and Components, Porto, Portugal, 29 June–2 July 2021. [Google Scholar]
  16. Jensen, N.F.; Bjarløv, S.P.; Rode, C.; Møller, E.B. Hygrothermal Assessment of Four Insulation Systems for Interior Retrofitting of Solid Masonry Walls through Calibrated Numerical Simulations. Build. Environ. 2020, 180, 107031. [Google Scholar] [CrossRef]
  17. Zeng, L.; Chen, Y.; Cao, C.; Lv, L.; Gao, J.; Li, J.; Zhang, C. Influence of Materials’ Hygric Properties on the Hygrothermal Performance of Internal Thermal Insulation Composite Systems. Energy Built Environ. 2023, 4, 315–327. [Google Scholar] [CrossRef]
  18. Marincioni, V.; Marra, G.; Altamirano-Medina, H. Development of Predictive Models for the Probabilistic Moisture Risk Assessment of Internal Wall Insulation. Build. Environ. 2018, 137, 257–267. [Google Scholar] [CrossRef]
  19. Panico, S.; Larcher, M.; Marincioni, V.; Troi, A.; Baglivo, C.; Congedo, P.M. Identifying Key Parameters through a Sensitivity Analysis for Realistic Hygrothermal Simulations at Wall Level Supported by Monitored Data. Build. Environ. 2023, 229, 109969. [Google Scholar] [CrossRef]
  20. Xing-guo, G.; Hongtao, L.; Jingxin, Z.; Xiang-wei, L.; Guo-jie, C. Sensitivity Analysis Applied to Hygrothermal Simulation of a Brick Building in Hot and Humid Climate. Procedia Eng. 2017, 205, 665–671. [Google Scholar] [CrossRef]
  21. Lengsfeld, K.; Raumklima, A.; Holm, K.A. Entwicklung Und Validierung Einer Hygrothermischen Raumklima-Simulationssoftware WUFI®-Plus. Bauphysik 2024, 29, 178–186. [Google Scholar] [CrossRef]
  22. Scheffler, G.A. Validation of Hygrothermal Material Modelling Under Consideration of the Hysteresis of Moisture Storage. Ph.D. Thesis, Dresden University of Technology, Dresden, Germany, 2008. [Google Scholar]
  23. Nolte, P.W.; Malvisalo, T.; Rimbach, A.C.; Steudel, F.; Ahrens, B.; Schweizer, S. Lock-in Thermography for the Development of New Materials. Mater. Today Proc. 2017, 4, S128–S134. [Google Scholar] [CrossRef]
  24. ISO 12572:2016; Hygrothermal Performance of Building Materials and Products—Determination of Water Vapour Transmission Properties—Cup Method. ISO: Geneva, Switzerland, 2016.
  25. Holm, A.; Kuenzel, H.M. Uncertainty Approaches for Hygrothermal Building Simulations—Drying of an AAC Flat Roof in Different Climates; IBPSA: Atlanta, GA, USA, 2001; Volume 7, pp. 949–956. [Google Scholar]
  26. Holm, A.H. Ermittlung der Genauigkeit von Instationären Hygrothermischen Bauteilberechnungen Mittels Eines Stochastischen Konzeptes. Ph.D. Thesis, International Institute of Refrigeration, Paris, France, 2001. [Google Scholar] [CrossRef]
  27. Künzel, H. Simultaneous Heat and Moisture Transport in Building Components: One-and Two-Dimensional Calculation. Eng. Environ. Sci. Phys. 1995. Available online: https://publica-rest.fraunhofer.de/server/api/core/bitstreams/74f34b4c-4876-4a9b-ac87-f7476d48ca60/content (accessed on 22 September 2025).
  28. EN ISO 15148:2002; Hygrothermal Performance of Building Materials and Products—Determination of Water Absorption Coefficient by Partial Immersion. ISO: Geneva, Switzerland, 2002.
  29. Fraunhofer IBP Liquid Transport Coefficient. Available online: https://www.wufi-wiki.com/mediawiki/index.php/Details:LiquidTransportCoefficients (accessed on 20 February 2025).
  30. Rieser, A.; Herrera-Avellanosa, D.; Leonardi, E.; Larcher, M.; Pfluger, R. Experimental Measurement of Material’s Drying Coefficient for Internal Insulation: New Approaches for Laboratory Testing. IOP Conf. Ser. Earth Environ. Sci. 2021, 863, 012048. [Google Scholar] [CrossRef]
  31. EN 15026:2023; Hygrothermal Performance of Building Components and Building Elements—Assessment. BSI: Bonn, Germany, 2023.
  32. Fenoglio, E.; Fantucci, S.; Serra, V.; Carbonaro, C.; Pollo, R. Hygrothermal and Environmental Performance of a Perlite-Based Insulating Plaster for the Energy Retrofit of Buildings. Energy Build. 2018, 179, 26–38. [Google Scholar] [CrossRef]
  33. Karim, A.N.; Johansson, P.; Sasic Kalagasidis, A. Knowledge Gaps Regarding the Hygrothermal and Long-Term Performance of Aerogel-Based Coating Mortars. Constr. Build. Mater. 2022, 314, 125602. [Google Scholar] [CrossRef]
  34. Künzel, H.; Krus, M.; Mach, V.; Hofbauer, W.; Gabrio, T.; Löfflad, H.; Moriske, H.-J.; Ruisinger, U.; Sedlbauer, K. Calculative Prognosis of Mould Growth Risk (WTA Leeflet 6.3); 6-3-05/D; WTA Publications/Fraunhofer IRB Verlag: Munich, Germany, 2007. [Google Scholar]
  35. Scheffler, G.; Worch, A. Interior Insulation According to WTA II: Evaluation of Internal Insulation Systems with Numerical Design Methods (WTA Leeflet 6.5); 6–5; Committee WTA Publications/Fraunhofer IRB Verlag: Munich, Germany, 2014. [Google Scholar]
Figure 1. Stratigraphy of the simulated element.
Buildings 15 03559 g001
Figure 2. Internal temperature (on the left) and internal relative humidity (on the right) set on the external temperature.
Buildings 15 03559 g002
Figure 3. Moisture storage function of the plaster SE as a function of the relative humidity on the left and as a function of log10 pc on the right.
Buildings 15 03559 g003
Figure 4. Liquid transport coefficients for suction, D W S , and for redistribution, D w w , as a function of the water content for the plaster SE.
Buildings 15 03559 g004
Figure 5. Drying curve measured (blue and green solid lines) and simulated with coefficient shown in Table 7 (blue and green dashed lines). Simulated drying curve with averaged coefficient (black dashed line).
Buildings 15 03559 g005
Figure 6. Relative humidity behind the insulation for the last year of the simulation with the external climate of Bolzano, the internal climate of medium moisture load, and 4 cm of internal insulation. On the left are the results for the three existing walls with similar thermal conductivities and different water vapor resistance factors; on the right are the three existing walls with similar vapor resistance factors and different thermal conductivities.
Buildings 15 03559 g006
Figure 7. Box plots of relative humidity behind the insulation for the last year of the simulation with the external climate of Bolzano, the internal climate of medium moisture load, and 4 cm of internal insulation. On the left are the results for the three existing walls with similar thermal conductivities and different water vapor resistance factors; on the right are the three existing walls with similar vapor resistance factors and different thermal conductivities.
Buildings 15 03559 g007
Figure 8. Difference in the maximum relative humidity between the different stones (on the left, for the stones with different vapor resistance factors, and on the right, for the stones with different thermal conductivities) for the three different climates: Bolzano, Brunico, and Bari. The difference is calculated case-by-case between the stone with the highest relative humidity and the stone with the lowest relative humidity. The stones are written above the columns for the left diagram. For the right diagram, the stone with the highest relative humidity is sandstone Velbke, and the one with the lowest relative humidity is tuff, so the shown difference is always between these two. The three colors represent the different cities.
Buildings 15 03559 g008
Figure 9. The difference in the maximum relative humidity between the 12 and 4 cm insulation thicknesses is shown on the left. Difference in the whole wall transmission losses per year between 12 and 4 cm insulation for the different existing materials on the right. The three colors represent the different external climates.
Buildings 15 03559 g009
Figure 10. The difference in the maximum relative humidity between the different moisture loads’ simulations. The difference is calculated case-by-case between the cases with the highest relative humidity (always happening for high moisture load, except for the case with tuff 12 cm, when it is happening for medium moisture load +5%) and the cases with the lowest relative humidity (always happening for medium moisture load). The three colors represent the different external climates.
Buildings 15 03559 g010
Figure 11. The difference in the maximum relative humidity between the different cities’ simulations. The difference is calculated case-by-case between the cases with the highest relative humidity (always happening for Brunico) and the cases with the lowest relative humidity (always happening for Bari, except for the case with tuff and 4 cm insulation thickness when it is happening for Bolzano).
Buildings 15 03559 g011
Figure 12. The difference between the maximum relative humidity behind 12 and 4 cm of insulation is plotted as a function of the ratio between the difference of the insulation resistance for 12 cm of insulation and for 4 cm of insulation and the existing stone resistance.
Buildings 15 03559 g012
Table 1. Simulation variants and acronyms used in the graphs.
ParametersVariantsNumber of Variants
Existing wallSandstone Velbke (Ve), granite (Gr), solid brick ARB (SB), tuff (Tu), sandstone (Sa)5
External climateBolzano (Bo), Brunico (Br), Bari (Ba) (Italy)3
Internal climateMedium moisture load (M), medium moisture load +5% (M5), high moisture load (H)3
Insulation thickness4 cm (4), 12 cm (12)2
Table 2. Parameters of simulated types of existing walls.
MaterialShort NameSourceThermal Conductivity [W/mK]Water Vapor Diffusion Resistance Factor [-]Water Absorption Coefficient [kg/m2s0.5]
GraniteGrTU Dresden1.660540.0086
SandstoneSaTU Dresden1.684730.0816
Sandstone VelbkeVeTU Dresden1.787110.65
TuffTuTU Dresden0.3382100.0983
Solid brick ARBSBTU Dresden0.6954100.25
Table 3. Temperature and rain summary for the three simulated climate.
ParameterBolzanoBrunicoBari
Short nameBoBrBa
Mean temperature12.5 °C7.6 °C15.3 °C
Maximum temperature34.6 °C33.7 °C40.8 °C
Minimum temperature−8.1 °C−18.7 °C−3.2 °C
Normal rain, sum704.6 mm/a622.4 mm/a620.4 mm/a
Driving rain, north27 mm/a30 mm/a143 mm/a
Driving rain, worse directionS 106 mm/aS 111 mm/aNW 189 mm/a
Table 4. Set of the initial conditions.
NameValue
Initial indoor temperature20 °C
Initial indoor relative humidity55%
Initial indoor CO2 concentration400 ppmv
Table 5. Set of parameters for the wall.
NameValueUnit
Rsi0.13m2K/W
Rse0.04m2K/W
Absorption0.6[-]
Emission0.9[-]
Rain load R10[-]
Rain load R20.07[s/m]
Rainwater absorption factor0.7[-]
Table 6. Main hygrothermal properties for the plaster SE.
Bulk Density
𝜌 b [kg/m3]
Porosity
ϕ [-]
Thermal Conductivity
𝜆 [W/(mK)]
Specific Heat Capacity
C s [J/(kgK)
Water Vapor Resistance Factor
μ [-]
Free Saturation
w f [kg/m3]
Water Uptake Coefficient
A w [kg/m2s0.5]
Mean value2950.8490.046648 μ d r y : 4.2490 0.23
μ w e t : 4.1
Uncertainty±5±0.003±0.006±53±0.1±10±0.07
Table 7. Estimated liquid transport coefficient for redistribution for the two samples SE12 and SE13 and averaged liquid transport coefficients for redistribution, used in Wufi Plus.
Name Sample and FitDww (Liquid Transport Coefficient for Redistribution)
RH 80%RH 93%RH 100%
SE121.00 × 10−113.20 × 10−114.00 × 10⁻⁷
SE131.00 × 10−112.50 × 10−111.95 × 10⁻⁷
SE average1.00 × 10−112.85 × 10−112.98 × 10⁻⁷
Table 8. Number of hours when the relative humidity behind the insulation exceeds 95%.
StoneMedium Moisture LoadMedium Moisture Load +5%High Moisture Load
4 cm12 cm4 cm12 cm4 cm12 cm
Brunico
Granite000242938078754
Sandstone00097134838749
Sandstone Velbke0041524936036235
Tuff000000
Solid brick ARB000001237
Bolzano
Granite000000
Sandstone000000
Sandstone Velbke000000
Tuff000000
Solid brick ARB000000
Bari
Granite000000
Sandstone000000
Sandstone Velbke000000
Tuff000000
Solid brick ARB000000
Table 9. Maximum, minimum, and mean differences between maximum relative humidity behind the insulation for the different parameters’ variations.
Parameter VariationMeanMinimumMaximum
Existing wall material with different vapor resistance factors1.1%0.3%3.2%
Existing wall material with different thermal conductivities12.4%5.3%22.0%
Insulation thickness3.7%−0.7%12.7%
Internal moisture load7.8%2.1%13.6%
External climate7.8%3.3%11.2%
Disclaimer/Publisher’s Note: The statements, opinions and data contained in all publications are solely those of the individual author(s) and contributor(s) and not of MDPI and/or the editor(s). MDPI and/or the editor(s) disclaim responsibility for any injury to people or property resulting from any ideas, methods, instructions or products referred to in the content.