Article

Spatial Organization Patterns and Their Impact on Evacuation Efficiency: Evidence from Primary School Teaching Buildings

1
School of Architecture, Zhengzhou University, Zhengzhou 450001, China
2
School of Civil Engineering, Zhengzhou University, Zhengzhou 450001, China
*
Author to whom correspondence should be addressed.
Buildings 2025, 15(19), 3560; https://doi.org/10.3390/buildings15193560 (registering DOI)
Submission received: 1 September 2025 / Revised: 26 September 2025 / Accepted: 30 September 2025 / Published: 2 October 2025
(This article belongs to the Section Building Energy, Physics, Environment, and Systems)

Abstract

Primary school teaching buildings represent a typical category of densely populated public architecture, where the safe evacuation of occupants is essential to ensuring their safety. The spatial organizational structure plays a pivotal role in determining overall evacuation efficiency. However, systematic research linking spatial organization with evacuation performance remains limited. This study addresses this gap by analyzing 102 real-world cases of primary school teaching buildings, identifying common spatial organizational patterns, and developing a spatial structural framework based on fundamental units and their organizational relationships. A hybrid methodology integrating weighted network analysis and evacuation simulation is employed to quantitatively evaluate the relationship between spatial organization types and evacuation performance, ultimately proposing three design principles—Integrity, Balance, and Stability—to guide evacuation efficiency optimization. The findings provide a methodological reference for evacuation research in public buildings and offer practical design guidance for optimizing primary school facility layouts.

1. Introduction

Safe evacuation is critical to protecting the lives of building occupants and minimizing potential losses. It refers to how individuals relocate from hazardous areas to designated safe zones in response to real or perceived threats [1,2]. Evacuation efficiency reflects this process’s safety, effectiveness, and orderliness, and is a key metric for evaluating a building’s overall safety performance.
The spatial organization of architectural space plays a critical role in shaping evacuation efficiency. Buildings are complex systems of interconnected spaces, functions, circulation routes, and occupants. Their spatial configuration fundamentally determines internal traffic flow, exit placement, functional layout, and occupant distribution, significantly influencing movement trajectories and potential congestion zones during evacuation. Consequently, spatial organization is a determinant factor in overall evacuation performance.
Primary school teaching buildings are a typical example of densely populated public facilities. Due to their physiological, psychological, and cognitive immaturity, primary school students represent a particularly vulnerable population with limited ability to assess environmental risks or respond effectively [3]. Ensuring safe evacuation in such buildings is therefore critically important. However, current research on evacuation safety primarily focuses on large-scale or architecturally unique facilities, while general-purpose buildings such as primary schools have received comparatively limited attention. The few existing studies tend to examine isolated factors influencing evacuation [4] or emphasize behavioral differences among occupants—such as the unique characteristics of children [5]—without systematically investigating how spatial organization impacts evacuation efficiency or how architectural design can be optimized accordingly.
This study proposes a methodological framework to examine the relationship between spatial organization and building evacuation efficiency. By integrating case-based typological analysis, weighted network analysis, and evacuation simulation, the research quantitatively assesses the impact of different spatial configurations on evacuation performance. The study identifies key spatial patterns that link spatial structure to evacuation efficiency, providing a theoretical framework for future research on evacuation in public buildings and offering practical guidance for designing and optimizing educational facilities.
The structure of this paper is organized as follows: Section 2 reviews the relevant literature on spatial organization and evacuation efficiency. Section 3 describes the research methodology and analytical framework. Section 4 presents the empirical data from three analytical perspectives: case analysis, elemental composition, and unit combination. Section 5 summarizes the fundamental patterns linking spatial organization characteristics with evacuation efficiency, and proposes optimization principles and practical guidance methods, which are further validated through a real-world project. The final section concludes the study, outlines its limitations, and suggests directions for future research.

2. Literature Review

Research on Building Evacuation: Safe evacuation encompasses three critical dimensions: occupants, spatial configurations, and potential hazards. Within this context, architectural evacuation research can be categorized into three interrelated subfields: spatial optimization, evacuation route planning, and behavioral guidance [6]. Among these, spatial configuration represents the objective dimension, encompassing overall spatial organization, functional layout, and the morphological and dimensional characteristics of specific spaces—all of which directly influence the distribution of building occupants. In contrast, occupant-related attributes represent the subjective dimension, encompassing physiological traits and behavioral-psychological characteristics that shape individual and collective evacuation behavior [7]. These attributes are also closely linked to developing effective evacuation guidance strategies [8,9].
Research on Evacuation in Primary School Buildings: Given the unique physiological and behavioral characteristics of children [10], the high occupant density in schools, and the widespread presence of such facilities, ensuring evacuation safety in primary school educational buildings requires particular attention. Current research on school evacuations primarily addresses two significant aspects: age-specific behavioral data and spatial factors influencing evacuation outcomes. Behavioral data [11,12,13] are typically obtained through evacuation drills, controlled experiments, and questionnaire surveys to identify patterns in children’s movement and behavioral responses during emergencies [14,15]. On the spatial side, studies frequently examine how classroom layouts, corridor and stairwell dimensions, and overall spatial arrangements affect evacuation efficiency [16,17,18,19,20]. Some research also explores evacuation route management and organizational strategies within school settings [21].
Network Analysis Methods: Network analysis involves abstracting real-world systems into graphs, in which components and their relationships are represented as nodes and edges [22,23,24,25]. This method emphasizes complex systems’ topological structure and intrinsic characteristics and has been widely applied in various engineering domains [26,27,28]. In evacuation research, the EVACNET [29] model exemplifies a macroscopic network approach that treats evacuation as a flow network, solving for node-to-node capacities to simulate occupant movement. Other studies employ graph-theoretic methods to construct topological representations of building layouts, aiming to identify potential congestion zones [30,31,32]. Building Information Modeling (BIM)-based approaches have recently generated geometric network models that capture the spatial relationships among rooms, corridors, and exits across multi-level buildings [33,34]. These models facilitate the calculation of evacuation time [35], identification of shortest paths [36,37,38], and detection of bottlenecks [39,40], thereby supporting the evaluation of spatial evacuation performance [41,42]. Some studies have further applied network-based attack simulations to assess the robustness and safety of evacuation routes under disaster scenarios [43,44,45].
Evacuation Simulation Methods: Evacuation simulation enables the quantitative assessment of how spatial, occupant, and hazard-related variables impact evacuation performance. These tools provide rapid feedback under complex conditions and generate visual outputs to illustrate congestion patterns and path usage [46,47]. As such, simulation has become a core methodology in evacuation research. Early models conceptualized crowd movement based on fluid dynamics [48]. Over time, more sophisticated frameworks have emerged, incorporating multiple factors—such as the human–environment–hazard framework—to simulate occupant movement within complex architectural environments [49]. Microscopic simulation models, including Cellular Automata [50,51,52], Social Force models [53,54], and Agent-Based simulations [55,56], are now widely used in fire safety assessments and building performance evaluations.
While existing studies have employed both network-based and simulation-based approaches to examine specific factors influencing evacuation in school buildings, several critical research gaps remain:
  • Most current studies focus on individual spatial variables—such as classroom layouts, corridor configurations, or stairwell dimensions—and their respective effects on evacuation efficiency. However, there is a notable lack of research addressing the overall spatial organization of primary school educational buildings. The absence of a systemic, structure-oriented approach constrains the development of design strategies that improve evacuation performance from a spatial-relational perspective.
  • Simulation-based analyses are often limited to isolated case studies for fire safety or building performance evaluation. Few studies synthesize large-scale empirical evidence to extract generalizable spatial patterns or propose broadly applicable design principles. This limits the practical translation of current research findings into real-world architectural design practice.

3. Materials and Methods

Primary school educational facilities are closely integrated into daily life as a widely distributed high-occupancy public building. Case studies reveal a distinctive spatial structure in such buildings: they are typically composed of clearly defined spatial units connected into a whole through corridors, courtyards, or other transitional spaces. Based on this characteristic, the concept of a “basic unit” is defined as the smallest spatial module enabling the completion of a horizontal evacuation phase. The composition and combination of these basic units constitute the core focus of evacuation research in primary school buildings.
The elemental composition types form the foundation of the spatial organization framework. A typical basic unit is composed of three key spatial elements: origin spaces (e.g., classrooms), connecting spaces (e.g., corridors and doorways), and exit spaces (e.g., staircases and emergency exits). The arrangement and interrelationships of these components directly shape evacuation performance.
The unit combination pattern embodies the internal logic of spatial organization. Units can be combined to form the overall architectural structure, resulting in variations in pathway configurations, connectivity characteristics, and resilience under emergency conditions. These differences influence both the safety and the efficiency of the evacuation process.
A systematic analysis of 102 primary school educational buildings was conducted to extract patterns of spatial organization. Based on these findings, a hierarchical analytical framework was developed, encompassing two interrelated levels of analysis: elemental composition and unit combination. The methodological innovations of this study lie in the following three aspects:
Typological Analysis of Spatial Configurations: A hierarchical framework of “unit composition–unit combination” was derived from 102 real-world cases of primary school buildings. This framework was the basis for extracting and quantitatively analyzing spatial organizational features.
Integration of Qualitative and Quantitative Methods: The study employed weighted network analysis to assess evacuation balance and identify critical nodes qualitatively. In contrast, evacuation simulations validated the qualitative findings and quantified performance indicators such as evacuation efficiency and congestion. This represents an improvement over conventional approaches that rely solely on evacuation time or flow metrics.
Design Principle Derivation: The study distilled a set of generalizable patterns linking spatial organization and evacuation performance and formulated three optimization design principles. This establishes a closed-loop workflow from data acquisition and model construction to design application.

3.1. Case Study Method

The case study method facilitates the identification and synthesis of recurring features across practical examples. The present research systematically extracted and analyzed spatial structural characteristics from multiple primary school cases using frequency statistics and correlation analysis. This process enabled the derivation of spatial organizational patterns and provided the foundation for constructing quantifiable spatial models.
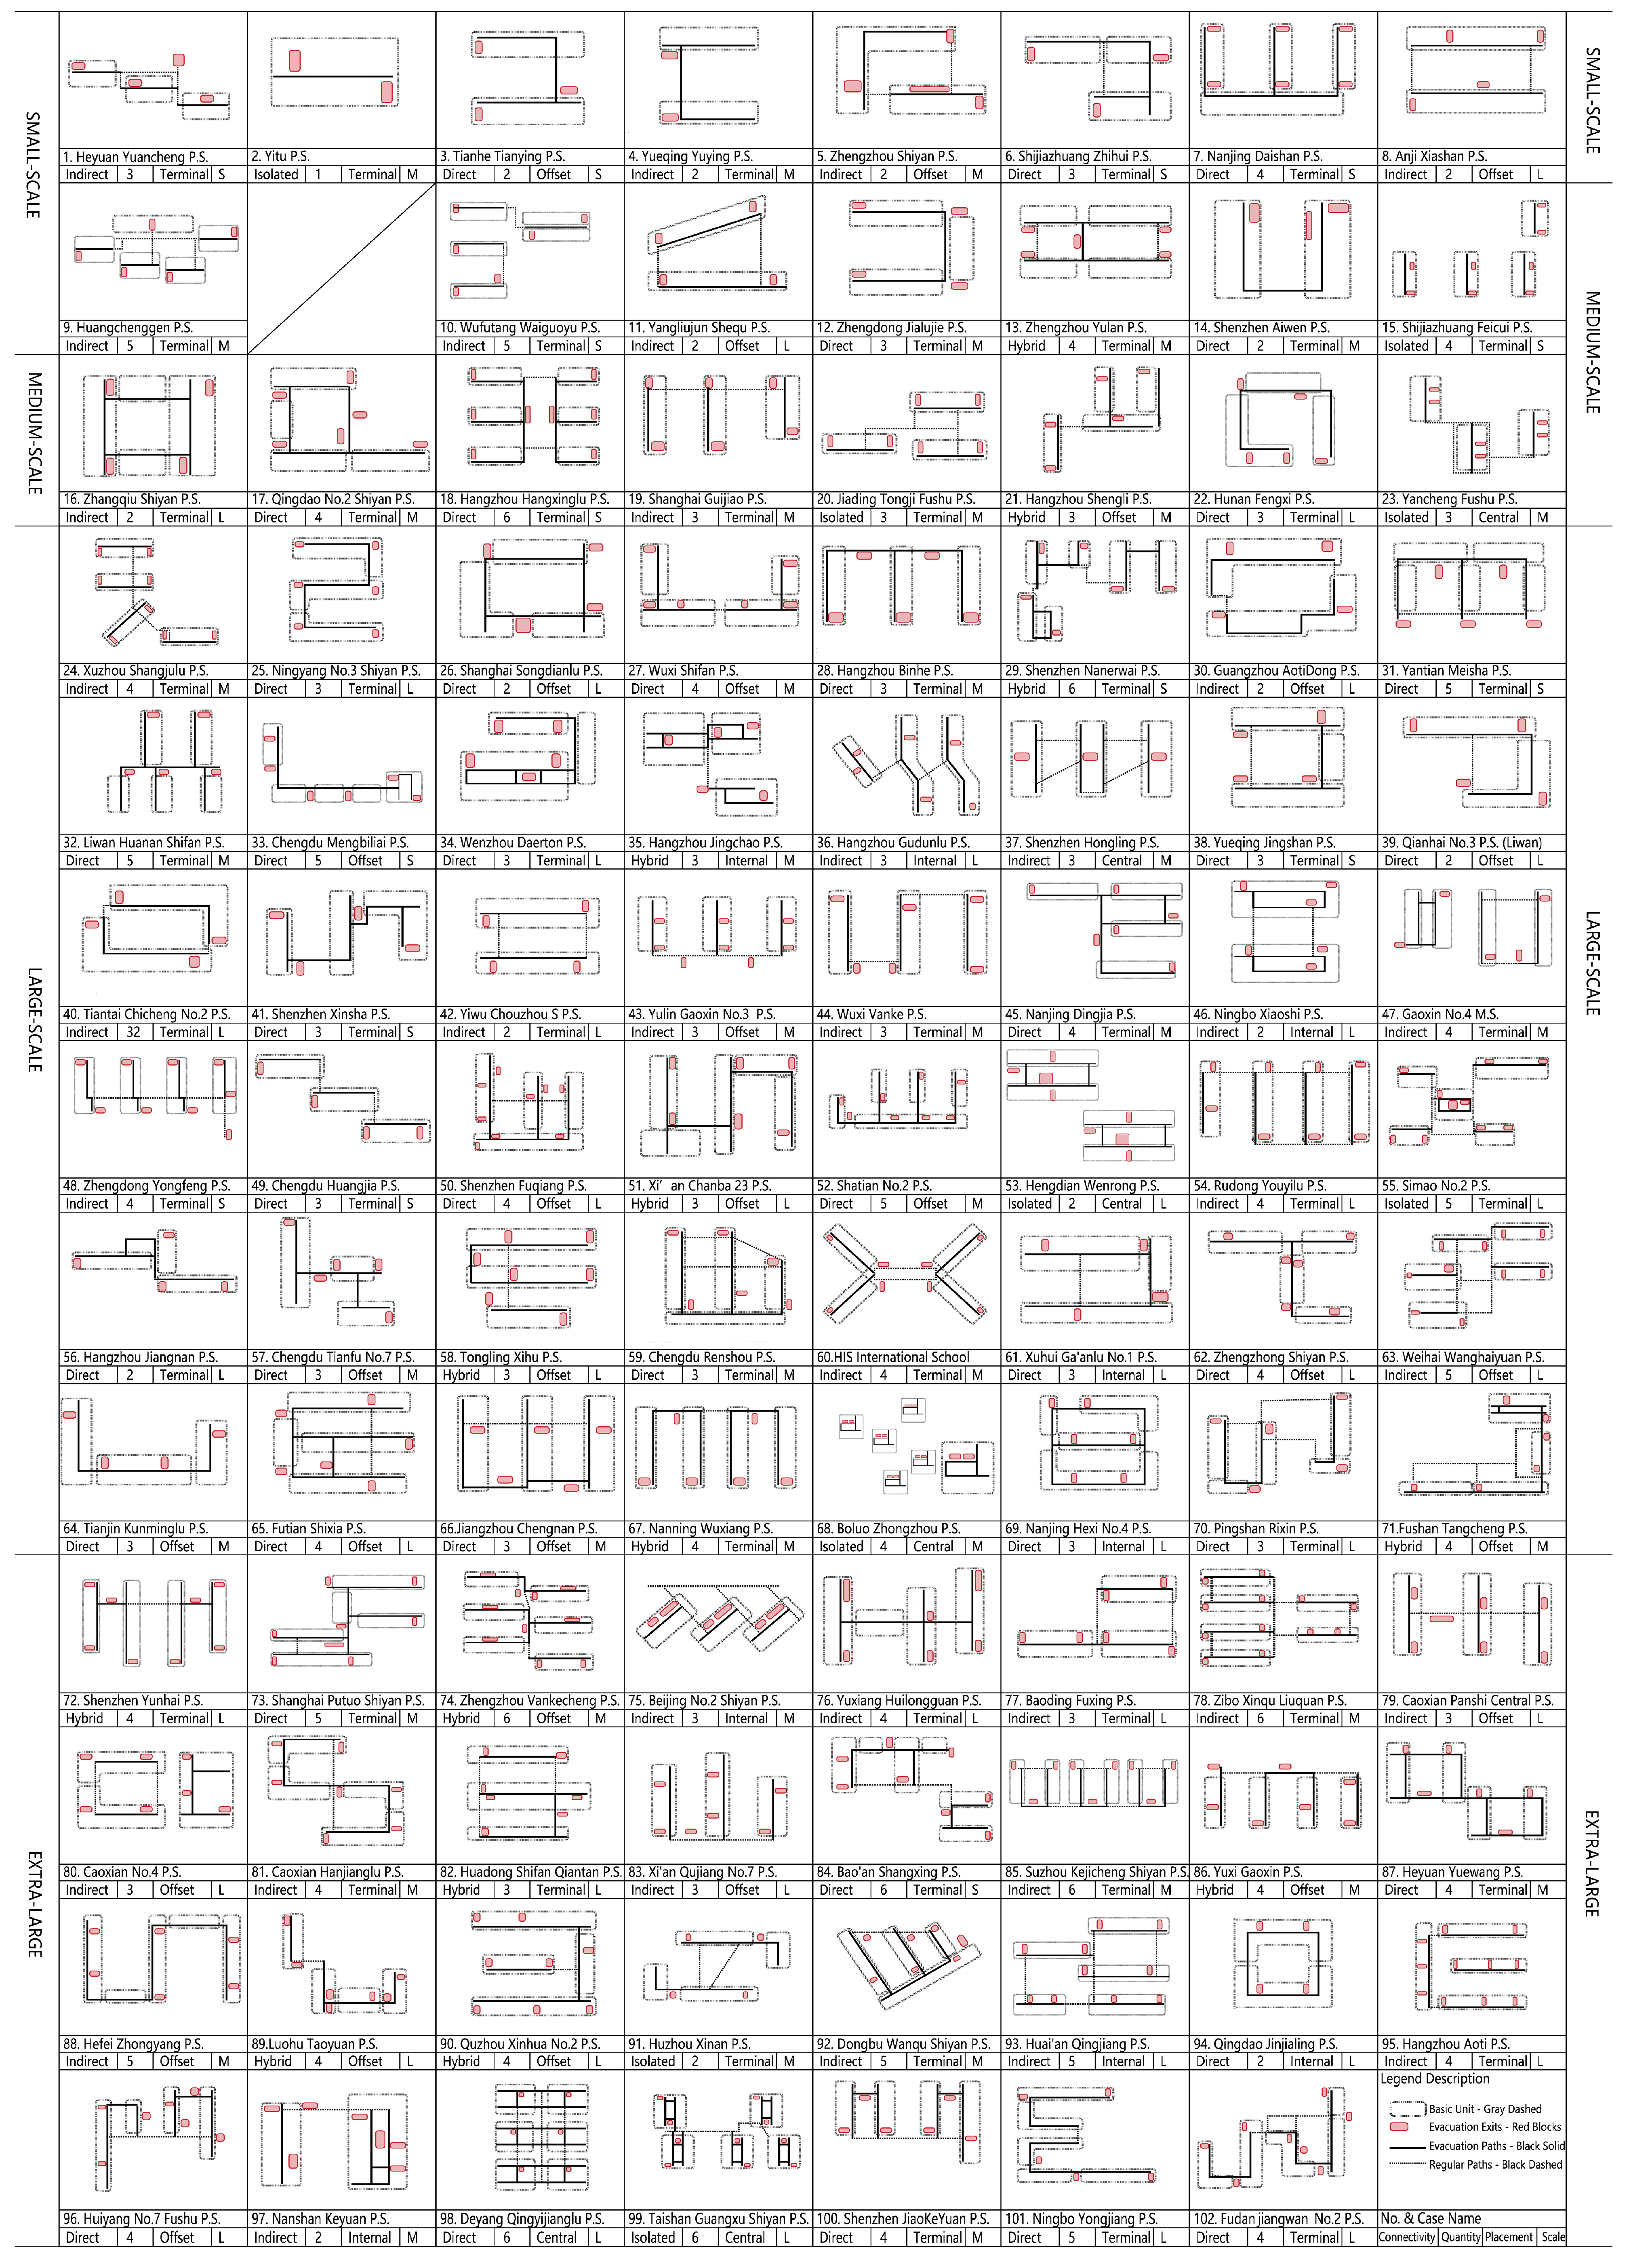
Based on the typical floor plans of selected cases, the classification focuses on three key aspects: case scale, elemental composition types, and unit combination modes. A schematic diagram illustrating the typological classification is provided in Table 1. 102 primary school building cases in China were collected for analysis. The basic case information was sourced from the research team’s practical projects, published architectural research literature, and architectural information platforms such as gooood (https://www.gooood.cn/) and ArchDaily (https://www.archdaily.cn/cn). Detailed metadata for all case samples is provided in Supplementary Table S1.
This case dataset demonstrates strong representativeness and typicality. The selected cases span a diverse range of building scales, including small, medium, large, and extra-large facilities. They all adopt the standard “six classes per grade” configuration—a widely implemented model in Chinese primary schools—which ensures alignment with mainstream architectural practices. To ensure both temporal relevance and regional diversity, the cases are drawn from multiple geographic regions, including North, East, South, and Central-Western China, with construction dates primarily falling between 2013 and 2023. Regarding spatial typology, the dataset incorporates a broad spectrum of organizational forms, such as linear, looped, branched, courtyard-based, and standalone configurations. These collectively reflect the dominant patterns observed in the spatial organization of contemporary primary school teaching buildings.
The case scale classification is based on China’s commonly adopted “six-class-per-grade” model. It is categorized into four types: small-scale (≤18 classes), medium-scale (24–30 classes), large-scale (36–42 classes), and extra-large-scale (≥48 classes).
Elemental Composition types involve two aspects: unit scale and spatial layout. Unit scale refers to the number of primary spaces (mainly classrooms) within a single unit, classified as small-scale (2–3 rooms), medium-scale (4–5 rooms), and large-scale (6–8 rooms). The spatial layout pattern describes the spatial relationships among staircases (or other emergency exits), classrooms, and corridor spaces, and can be categorized into terminal, internal, central, and offset layouts.
Unit Combination patterns also consist of the number of units and their connection types. The number of units refers to the typical quantity of spatial units per floor. Connection types are defined by whether evacuation paths are shared between units and inter-unit interactions occur. They are classified into four types: isolated, indirect, direct, and hybrid.

3.2. Network-Based Method

The weighted network-based approach for evaluating building evacuation efficiency integrates spatial layout, functional zoning, and occupant distribution into a cohesive analytical model. It quantifies spatial configuration’s direct and objective influence on evacuation performance, making it suitable for efficient, macro-scale assessments of evacuation capacity [57].
This method comprehensively evaluates evacuation balance across a building’s spatial network. It supports targeted optimization strategies—such as relocating or resizing exits—based on the spatial distribution of key performance metrics. Furthermore, it facilitates the identification of critical nodes under simulated damage conditions, thereby enhancing the overall accessibility and resilience of the evacuation network.

3.2.1. Weight Assignment Rules

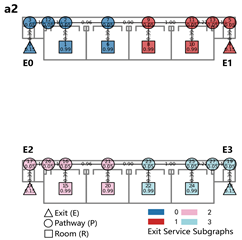
In the evacuation network, nodes represent individual architectural spaces, and their weights reflect the instantaneous capacity—typically defined as the current number of occupants within each space. For spaces where occupant numbers can be clearly determined, the weight coefficient w i of the occupancy of node i is calculated using the normalized occupant count. The normalization follows a min–max method, where the maximum and minimum values are taken from the full set of nodes within the network. To avoid zero values, w i is constrained within the range of 0.01–0.99.
For spaces where occupant numbers are not explicitly available, the node weight w i is determined using a combination of spatial area and estimated occupancy density, following the formula: w i = α i × β i . where α i is the normalized area of node i , and β i is the normalized occupancy density. All the parameters are processed through min–max normalization. Generally, a node is considered more important—and thus assigned a higher weight—if it accommodates more people, covers a larger area, or has a higher occupancy density. Each node is positioned at the geometric center of its respective space and is assigned a unique identifier and coordinate.
Edges represent the physical connections between adjacent spaces. The edge weight calculates the weighted path length from any node to the nearest exit, thereby determining exit assignment. The edge weight w p is defined as the normalized physical length between nodes: w p = γ p . where γ p is the normalized distance of edge p , based on the actual linear distance between the geometric centers of connected nodes. Normalization is performed using the network’s maximum and minimum edge lengths, and values are constrained within 0.01–0.99. All edge lengths are derived from CAD drawings of the building plan.
Based on the above principles, a weighted evacuation network is constructed that accurately reflects both the spatial organization and the connectivity structure. This network is the foundation for quantitative analysis of evacuation efficiency in building environments.

3.2.2. Evacuation Efficiency Evaluation Metrics

The core evaluation indicators employed in this method are summarized below, and the corresponding calculation formulas are provided in Table 2.
  • Exit Capacity ( C k ): This metric quantifies the evacuation demand imposed on exit node k by all interior nodes it serves. It reflects the spatially distributed occupant pressure directed toward each exit. A higher C k value indicates greater reliance on a specific exit.
  • Evacuation Balance Statistic (EBS): Based on the distribution of C k across all exits, this metric evaluates how evenly the evacuation load is shared among exits. A lower EBS value indicates a more balanced distribution across the network.
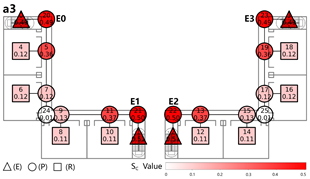
  • Exit Capacity Sensitivity ( S C ): This indicator represents the average variation in Exit Capacities before and after the removal of node i. A higher S C value suggests that the node is more structurally critical to the evacuation network.

3.2.3. Process of Weighted Network Analysis

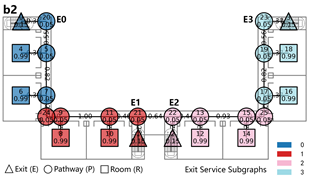
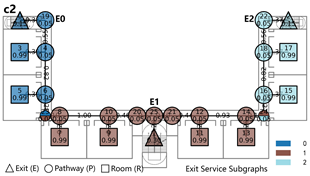
The specific analytical process includes the following steps (see Figure 1, detailed in [57]):
  • Model Construction: Architectural spatial information is extracted to construct a weighted evacuation network model, following “space-to-network” translation principles and predefined weight assignment rules.
  • Exit Mapping: The shortest weighted evacuation path is determined from each non-exit node to its nearest exit, and the network is partitioned into subgraphs based on exit service areas.
  • Performance Evaluation: C k and EBS indicators are calculated to assess the evacuation load distribution and overall network balance.
  • Stability Analysis: Targeted attack simulations are conducted by removing each non-exit node sequentially and observing the resulting variations in evacuation metrics. S C values are computed to evaluate the network’s structural stability and identify critical nodes that impact evacuation reliability.

3.2.4. Weight Assignment in the Proposed Model

Based on the established weight assignment rules, the spatial nodes in the primary school building cases examined in this study are defined as follows:
Classroom nodes (R = 0.99) represent the highest-density spaces in the network, with an occupant density of approximately 0.8 persons/m2 and a typical capacity of 48 students. Each classroom has the largest floor area (around 60 m2), and its weight reflects its maximum occupant load and spatial scale.
Corridor nodes (p = 0.05) serve as connecting spaces, typically with a floor area of about 10 m2 and an estimated density of 0.1 persons/m2, thus assigned relatively low weights.
Exit nodes (E) are categorized into independent and shared exits, with weights of 0.15 and 0.30, respectively. According to the proposed methodology, exit node weights represent the relative size differences between different types of exits, but they do not directly affect the computation of core network indicators. For instance, in this study, the scale of a shared exit is approximately twice that of an independent exit. Considering the high instantaneous occupant density near exits and the typical spatial area of an independent exit (approximately 30 m2), a weight of 0.15 is assigned to independent exits and 0.30 to shared exits.
A sensitivity and robustness analysis of the node weight assignments is provided in Appendix A, Table A1.

3.3. Evacuation Simulation Method

3.3.1. Selection of Simulation Software

The network analysis approach focuses on qualitatively evaluating evacuation characteristics from a holistic perspective, particularly emphasizing how differences in spatial organizational structures influence evacuation patterns. This method does not emphasize detailed occupant behaviors, individual mobility, or precise evacuation times. In contrast, simulation quantitatively assesses evacuation processes, incorporating specific behavioral rules, sequences, and occupant parameters while providing intuitive graphical outputs. Integrating both approaches enables a comprehensive evaluation of the evacuation performance of architectural spaces.
Building layouts’ organizational relationships and formal-spatial scales notably impact overall evacuation efficiency. Factors such as staircase dimensions, exit widths, and corridor lengths influence evacuation differently depending on the specific stages at which each space participates. Detailed analysis of these variable impacts can be found in Appendix B, Table A2. However, the present study primarily examines how spatial organizational patterns affect evacuation efficiency, without delving deeply into other influencing factors.
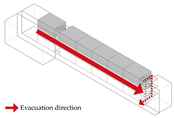
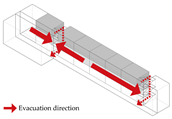
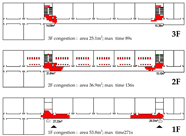
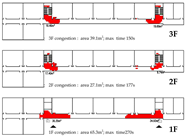
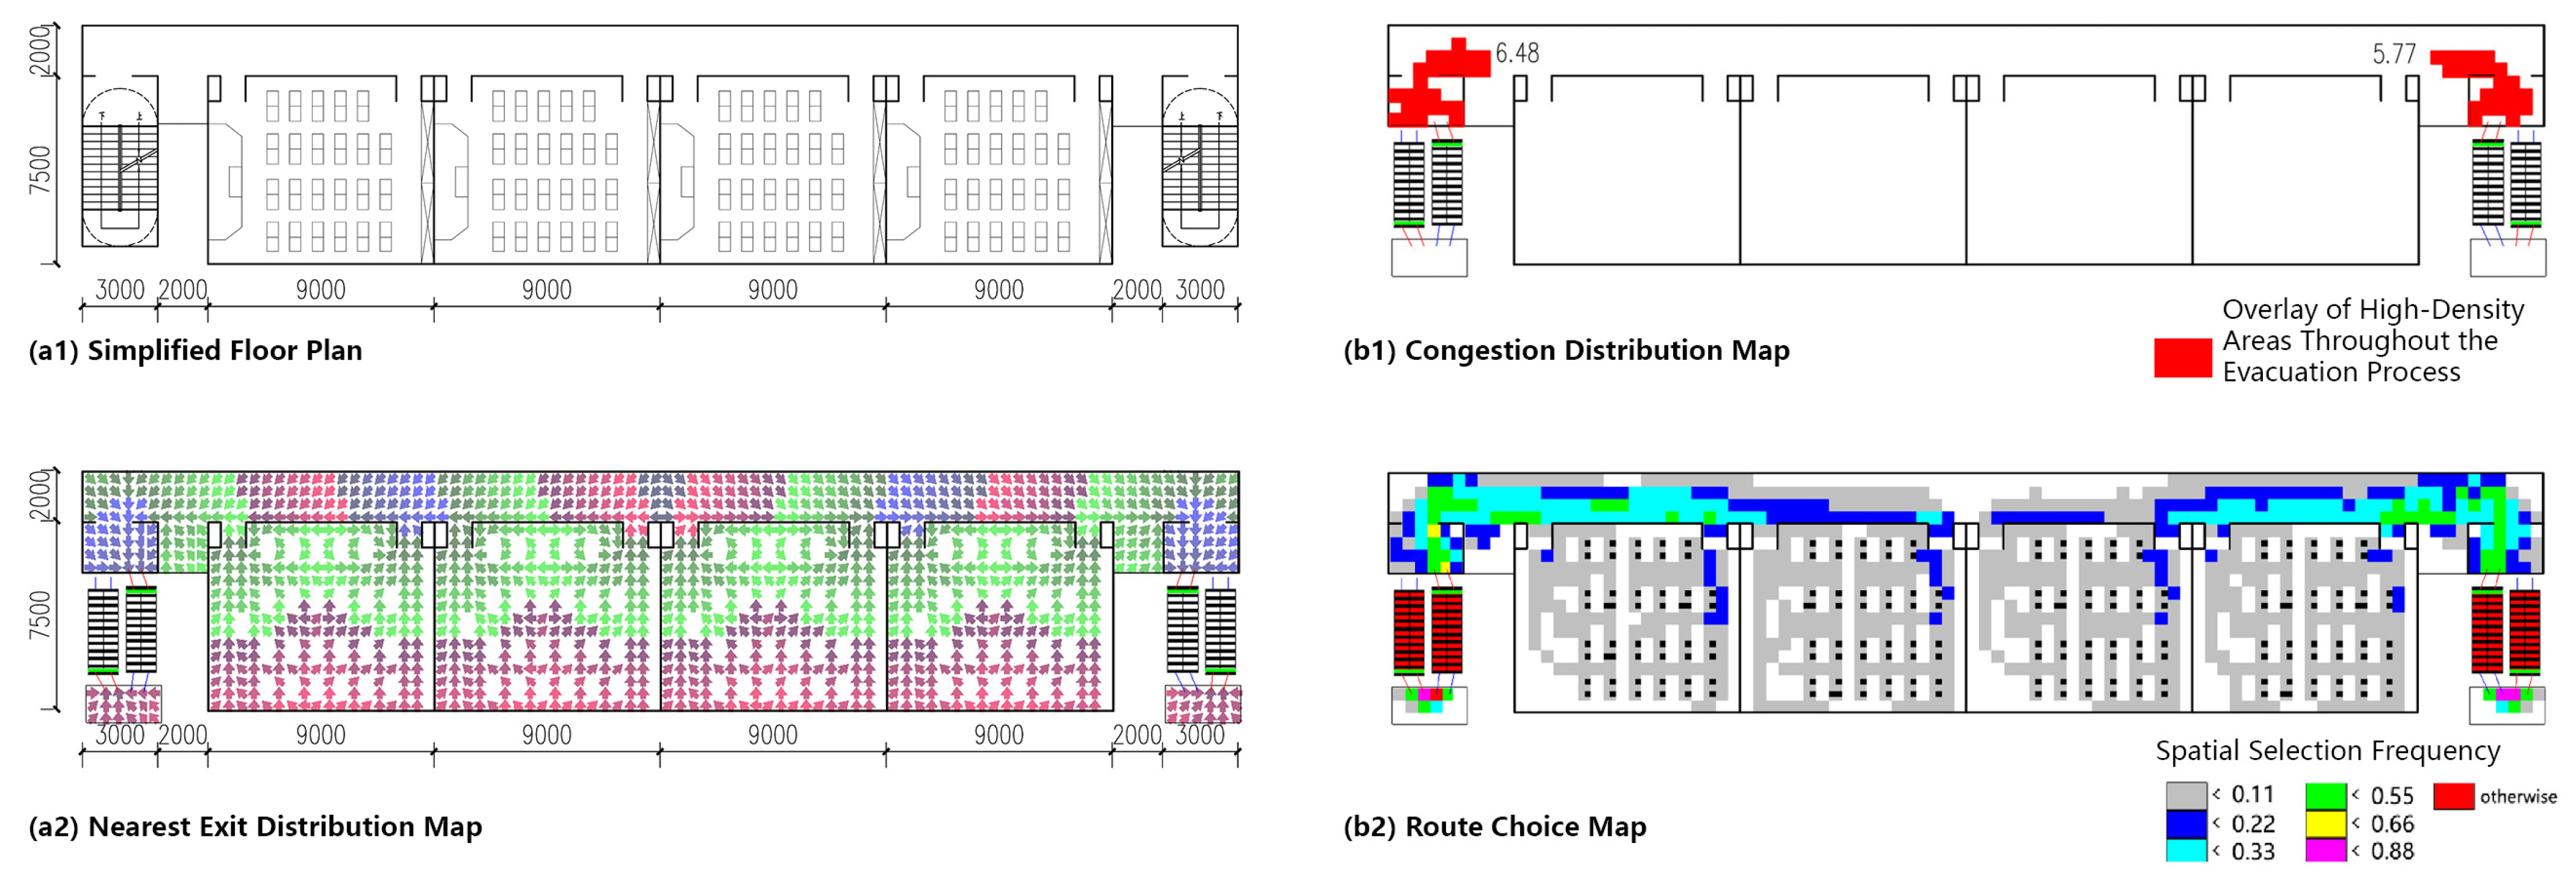
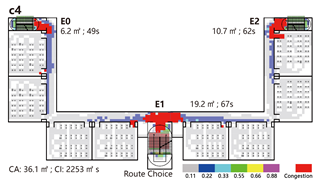
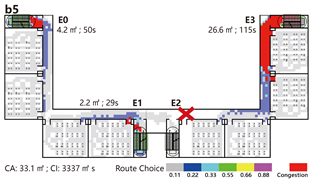
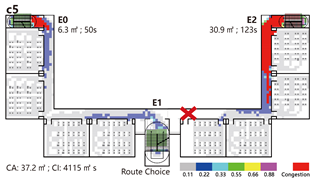
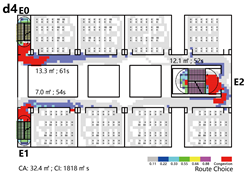
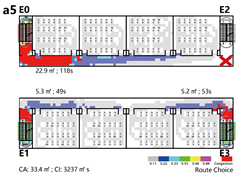
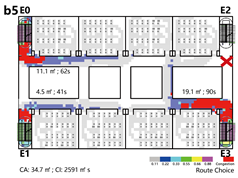
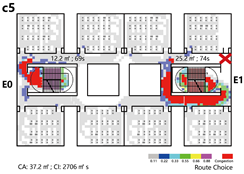
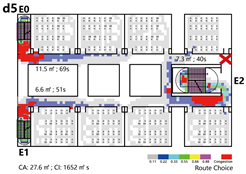
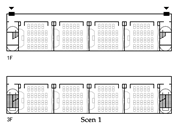
This study employs the widely adopted evacuation simulation software buildingEXODUS version 6.3 developed by the Fire Safety Engineering Group (FSEG) at the University of Greenwich [58]. The software comprehensively incorporates the dynamic interactions among occupants, hazards, and spatial environments, making it well-suited for simulating evacuation and escape behaviors in complex architectural settings. It provides quantitative outputs, such as evacuation time and the number of evacuees, and graphical results, including congestion zones and path selection patterns. The simulation models and representative outputs are shown in Figure 2. Prior studies [59] have validated the reliability of buildingEXODUS for evaluating evacuation performance in educational buildings.

3.3.2. Pedestrian Movement Parameter Settings

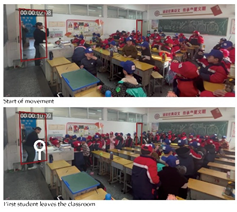
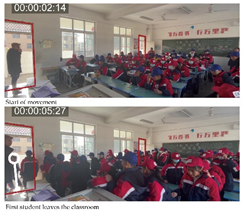
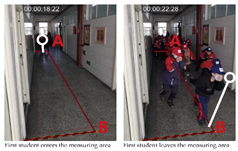
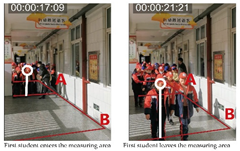
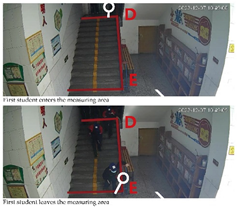
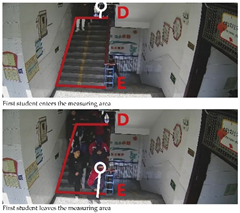
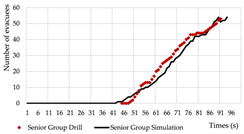
Ensuring the accuracy of evacuation simulations critically depends on the appropriate setting of pedestrian movement parameters. Given the limited existing research on the evacuation mobility characteristics of Chinese primary school students [11,12,13,14,15], the research team conducted an evacuation drill experiment in December 2023 to obtain empirical data on children’s evacuation performance (Table 3). The collected parameters serve not only as input for the simulation models but also provide a basis for validating the reliability of the simulation results.
The evacuation drill was conducted in a 24-class urban primary school in Henan Province, China. The building comprises four stories of standard classrooms, each accommodating approximately 55 students, with a floor height of 3.6 m. Two open double-flight staircases were provided on each level. Evacuation data were collected using video tracking and observational statistics.
This drill adopted a pre-informed and organized evacuation format. Participants were notified in advance and guided by adult supervisors throughout the process, with firefighters and teachers present to ensure orderly movement and safety. It is important to note that while evacuation drills can reflect certain patterns of occupant movement and dispersal, they cannot fully replicate the uncertainty and behavioral variability—such as panic, congestion, or confusion—that may arise among children in actual emergency scenarios.
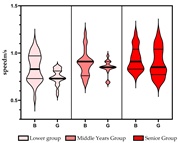
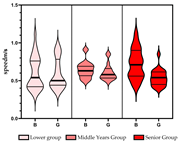
The evacuation drill data were analyzed across four primary indicators: reaction time, horizontal walking speed, downstairs speed, and upstairs speed. As shown in the violin plots (Appendix C, Table A3), age and gender emerged as the main factors influencing children’s physical evacuation performance: Reaction time ranged from 3.02 to 8.44 s; Horizontal speed ranged from 1.65 to 2.15 m/s; Downstairs speed ranged from 0.84 to 0.90 m/s; Upstairs speed ranged from 0.54 to 0.72 m/s.
Based on these results and findings from existing literature and the specific conditions in China, the primary school student population was categorized into three groups by grade level: lower, middle, and upper grades. Detailed parameter values for each group are presented in Table 4.
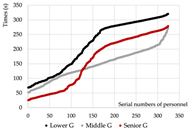
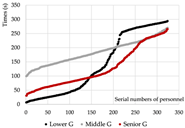
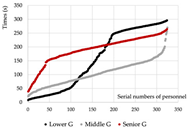
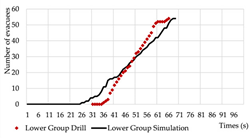
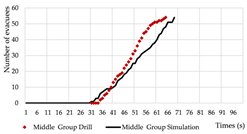
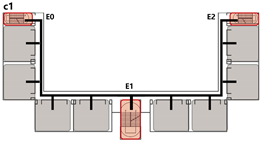
Based on the spatial configuration of the evacuation drill school and the assigned movement parameters, simulation models were developed for each grade group. A comparative analysis of the simulation results and the actual drill data is presented in Table 3 (c1–c3).
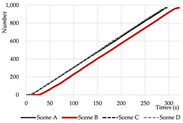
The analysis shows that for the lower-grade group, the slope of the simulated evacuation curve is steeper than the drill data in the early stage, slightly lower in the later stage, and overall smoother compared with the drill curve. For the middle-grade group, the simulation aligns closely with the drill data at the beginning, but the drill values become higher in the later stage. The high-grade group demonstrates the best overall fit between simulation and drill data. Video analysis suggests that these differences may stem from hesitation in path judgment among lower- and middle-grade children during the initial and final stages of evacuation, as well as more frequent occurrences of running and overtaking behaviors. In contrast, the behavior of the high-grade group is more stable, leading to closer alignment between simulation and drill results.
Overall, the evacuation simulation and drill data exhibit consistent trends across all grade groups, with the high-grade group showing the highest degree of agreement, thereby validating the reliability of the model configuration. Nevertheless, it should be acknowledged that although the model provides a relatively high level of fidelity in simulating evacuation processes, its precision in capturing behavioral aspects remains limited.

3.3.3. Simulation Scenario Setup in the Proposed Model

Simulation Scenario Settings: Two types of evacuation scenarios are simulated for each spatial model. Normal evacuation (routine conditions): occupants evacuate using designated and fully functional exit routes. Emergency evacuation (disrupted conditions): critical evacuation paths are assumed to be obstructed or damaged. The disruption points are selected based on key nodes identified through the weighted network analysis, thereby simulating worst-case evacuation conditions.
To balance modeling complexity with the integrity of the evacuation process, all simulation models were configured such that occupants from a single grade level on the third floor evacuate to the ground-floor exits via staircases. The analysis focuses on the third floor’s evacuation paths and congestion distribution. Each model was subjected to five stochastic simulation runs, and the average evacuation time across the five runs was recorded as the final simulation result. The path and congestion visualization from the run closest to the average evacuation time were selected for further analysis of congestion-related indicators.
  • Each classroom was set to a standard size of 9.0 m × 7.5 m, with a uniform floor height of 3.6 m across all building levels.
  • Based on the simulation platform’s basic grid size of 0.5 m × 0.5 m, the corridor width was configured as 2.0 m, allowing for four-person parallel movement.
  • Stair widths were set to 1.0 m for independent exits and 2.0 m for shared exits.
  • It should be noted that according to Chinese primary school design codes, one pedestrian flow unit is defined as 0.6 m in width. This differs slightly from the simulation settings, where a 1.0 m width (equivalent to two parallel in the simulation) corresponds to approximately 1.2 m in real-world evacuation standards.
To ensure comparability across all cases, the number of occupants and total evacuation width were consistent among different models. The population distribution was determined based on spatial layout information, assuming full occupancy of each functional space with an equal gender ratio. Movement speeds were assigned according to the “Middle Group” parameters in Table 4 and literature [60]. Uniform assignment of pedestrian attributes across all scenarios helps to isolate the effects of spatial configuration on evacuation performance.
The evacuation scenarios in this study were modeled based on the principle of nearest-exit evacuation, whereby occupants move toward and exit through the closest available egress point. This approach reflects one of the fundamental principles of building evacuation design. Given that this research focuses on exploring the influence of spatial organization patterns on evacuation efficiency, the nearest-exit strategy was adopted as a baseline assumption.
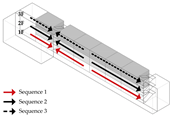
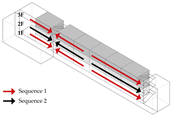
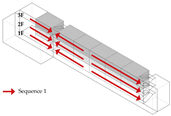
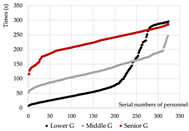
It should be noted that the “nearest-exit” strategy simplifies real-world evacuation guidance factors such as teacher-led instructions and signage-based wayfinding. Evacuation guidance encompasses aspects such as evacuation paths and evacuation sequences. Appropriate guidance strategies not only influence the distribution of occupants within space but also regulate and control interactions among different evacuation attributes, thereby reducing congestion. Guidance strategies tailored to the evacuation characteristics of occupants constitute an important managerial approach for enhancing evacuation efficiency and improving safety, and they provide practical guidance for the development of evacuation plans in existing primary school buildings. Detailed analyses are provided in Appendix D, Table A4 and Table A5.

4. Results

4.1. Case Statistics and Summary of Spatial Organizational Features

4.1.1. Case Profile Statistics

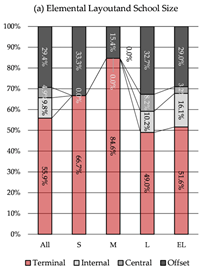
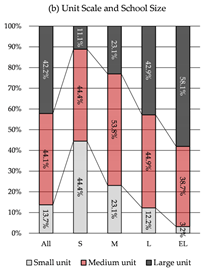
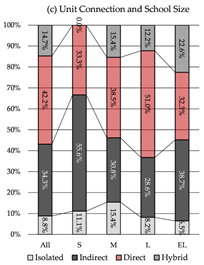
The statistical analysis of the 102 cases reveals the following distribution by scale: small-scale (8.8%), medium-scale (12.7%), large-scale (48.0%), and extra-large-scale (30.4%), with large and extra-large schools accounting for the majority of the sample. In terms of elemental composition patterns, the majority of cases employ a terminal layout, with exits positioned at both ends of the unit, and are predominantly composed of medium- and large-scale units in terms of internal capacity. Regarding unit combination types, direct connection emerges as the most prevalent inter-unit linkage strategy, and most buildings consist of three to four units per floor. These statistical trends are illustrated in Figure 3.

4.1.2. Spatial Organizational Patterns Identified in the Case Studies

The analysis indicates a clear correlation between school scale and spatial organizational characteristics. Based on the previously defined classification system, this section examines how Elemental Layout, Unit Scale, Unit Connection Mode, and Unit Count vary with building size. See Table 5.
Elemental Layout: Overall, the terminal layout is the most common configuration (55.9%), followed by the offset layout (29.3%). In small- and medium-scale schools—where spatial structures tend to be simpler—terminal layouts predominate within units (66.7–84.6%). As building scale increases, the diversity of internal layouts expands, with internal and central layouts appearing more frequently; however, they remain minor configurations (0–19.3%). See Table 5a.
Unit Scale: Medium-scale units are the most prevalent across all school sizes, accounting for a stable proportion (38.7–53.8%). Small-scale schools typically adopt small and medium units (88.9% combined). With increasing school size, the proportion of large-scale units rises significantly (from 11.1% to 58.1%), while small-scale units decrease markedly (from 44.4% to 3.2%). See Table 5b.
Unit Connection Mode: Across all cases, direct connections account for the largest share (42.2%), followed by indirect connections (34.3%) and isolated units (8.8%). As building scale increases, inter-unit connectivity becomes more complex, with hybrid configurations becoming more prevalent. Indirect connections dominate in small-scale schools (55.6%), while medium- and large-scale schools increasingly adopt direct connections via shared staircases. In extra-large schools, spatial complexity results in a relatively even distribution among all three connection types (Table 5c).
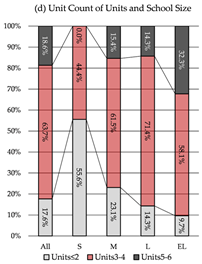
Unit Count: Most schools feature three to four units per floor (63.7%), reflecting a clear correlation between unit quantity and school scale. Small-scale schools commonly have two or fewer units per floor (55.6%), medium- and large-scale schools are dominated by three to four units (61.5–71.4%), while extra-large schools show a significant increase in cases with more than four units (up to 32.3%) (Table 5d).
The terminal layout emerges as the most prevalent elemental composition across school sizes, though internal diversity increases with scale. Both unit scale and unit quantity are strongly correlated with overall building size: larger schools tend to accommodate more and larger units. Regarding connection types, direct connections are generally more common than indirect ones, and connectivity becomes increasingly complex and diverse in larger facilities. These spatial organizational patterns provide the empirical foundation for the subsequent quantitative analysis of structural relationships and support the development of representative spatial simulation models.

4.2. Analysis of Elemental Composition

The elemental composition pattern forms the analytical basis for examining spatial units. Each unit’s internal arrangement of core elements significantly influences evacuation dynamics and load distribution during emergencies. A critical factor in this configuration is the spatial relationship between functional spaces (e.g., classrooms) and evacuation components (e.g., staircases and emergency exits), which collectively determine the unit’s layout typology.

4.2.1. Typology of Elemental Composition

Drawing on the preceding case analysis findings, this study adopts a medium-scale unit with dual staircases and a single corridor as the base model. This composition is consistent with prevalent design practices in primary schools of various sizes and complies with current Chinese building codes regarding maximum evacuation distance and staircase provisions. Based on the spatial organization of unit components, four types are defined:
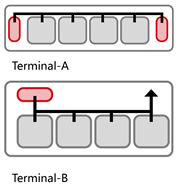
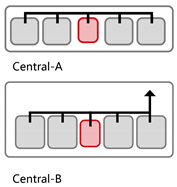
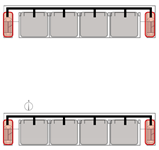
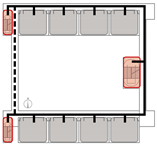
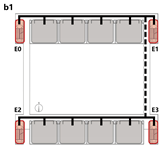
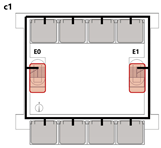
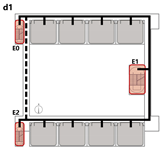
  • Terminal Layout: Two exits are symmetrically located at both corridor ends. All classrooms are positioned between the exits, allowing bidirectional evacuation from each room.
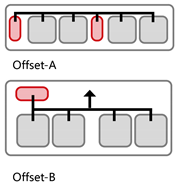
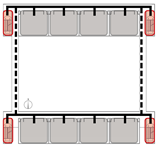
  • Internal Layout: Exits are positioned within the central portion of the unit, concentrating occupant flow toward the center. While overall evacuation distances are short, short single-loaded corridor segments emerge at both ends, requiring unidirectional evacuation from the classrooms at the extremities.
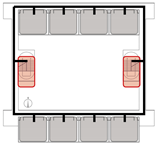
  • Central Layout: Both exits are placed near the unit’s center, with sufficient spacing to meet code requirements. This layout results in long dead-end corridors on both sides, causing all classrooms to rely on unidirectional evacuation routes.
  • Offset Layout: Exits are asymmetrically arranged, with one at the end and the other near the center. This allows some classrooms to evacuate bidirectionally, while others are restricted to single-direction evacuation via dead-end corridors.
  • Based on this classification system, representative spatial models were developed for each type. The corresponding results are summarized in Table 6.

4.2.2. Network Characteristic Analysis of Elemental Composition

Evacuation Balance: In terms of evacuation balance, the terminal, internal, and central layouts exhibit symmetrical network structures, with both exit nodes sharing identical evacuation Capacities ( C k ) and yielding an Evacuation Balance Statistic (EBS) of 0.00. This indicates optimal load distribution and well-balanced evacuation performance. In contrast, the offset layout forms an asymmetrical network, characterized by a notable discrepancy between the Cₖ values of the two exits and an EBS of 0.66. This reflects a significant imbalance, suggesting that under a nearest-exit strategy, one exit may be underutilized, resulting in uneven distribution of evacuees.
Evacuation Stability: In terms of evacuation stability, the effects of node removal—simulated as “attacks”—vary depending on node type and spatial location. Removing an exit node (E) results in the most severe disruption, as the remaining exit must absorb the entire C k . Room nodes (R) have minimal impact, with only minor fluctuations in the EBS following their removal. The influence of pathway nodes (P) is closely tied to their proximity to exits: when a P node directly connected to an exit is removed, the impact is nearly equivalent to removing the exit itself. In contrast, P nodes situated farther from exits exhibit significantly less influence on network stability.
Each configuration pattern exhibits distinct evacuation stability characteristics. In the terminal layout, attacking any pathway node (P) may sever the primary evacuation route; however, bidirectional evacuation remains feasible on both sides of the corridor. Consequently, S C values are relatively small, and the farther a P node is from the exit, the lower its corresponding value. In the internal layout, all P nodes—except those directly connected to the exits—display comparable S C values, indicating a relatively even distribution of node importance across the layout. In the central layout, most P nodes exhibit high S C values because all room nodes (R) rely on unidirectional evacuation through extended corridor segments. Thus, disrupting any centrally located P node may compromise the evacuation network. In the offset layout, due to its asymmetric structure, the internal exit and its adjacent P nodes exhibit the highest S C values. This is because the internal exit handles a disproportionately large evacuation load under the nearest-exit strategy, and its failure significantly weakens the evacuation system’s robustness.
In summary, critical nodes primarily include the exits and their directly connected pathway nodes across the terminal, internal, and central configurations. In the offset layout, particular attention must be given to the internal exit and its adjacent P nodes, which bear disproportionate importance in evacuation dynamics.

4.2.3. Evacuation Simulation Analysis of Elemental Composition

Evacuation simulations were conducted to assess the performance of each configuration under both normal and disrupted (emergency) conditions. In the emergency scenario, path failure points were designated at critical nodes identified via weighted network analysis to replicate evacuation capacity under the most adverse conditions.
(1)
Normal Scenario
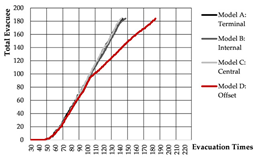
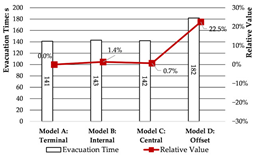
Evacuation Time: The evacuation time performances of Models A, B, and C are relatively comparable, while Model D demonstrates a substantial increase in evacuation duration, indicating lower overall efficiency.
Path Selection: Models A, B, and C exhibit symmetrical evacuation behavior. In Model A, evacuees disperse toward both ends, which helps alleviate congestion risk. In contrast, Models B and C show a tendency for evacuees to converge toward the center, increasing the likelihood of crowding. Model D displays an asymmetrical path pattern, with excessive clustering near the central staircase.
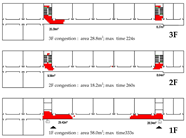
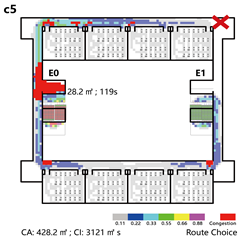
Congestion: Model D experiences the most severe congestion. Under the nearest-exit strategy, most evacuees move toward the centrally located staircase, resulting in severe bottlenecks—its congestion index increases by 183.8% compared to Model A. Model A performs best in mitigating congestion, as bi-directional dispersal at both ends reduces crowding pressure. Models B and C exhibit centralized evacuation characteristics, where short-term high-density flow increases conflict, ultimately undermining evacuation efficiency.
(2)
Emergency Scenario
Under emergency conditions, evacuation performance differs substantially from that observed in normal scenarios. Since only Model A can complete a full evacuation via a single remaining exit, the number of safely evacuated occupants varies significantly across the other models.
Evacuees: Although Model A experiences increased evacuation time and congestion, it still manages to evacuate all occupants through one exit. Due to a disruption in the original evacuation path, 25.0% of occupants in Model B—located in one of the end classrooms—could not evacuate. In Models C and D, evacuation failure occurred for 50.0% of the occupants, corresponding to the two end classrooms.
Path Selection: In Model A, evacuees must converge on a single exit, resulting in intense congestion pressure and extended travel distances. This highlights the need to consider accumulation-related risks in such configurations. Models B and D retain partial dual-exit evacuation capability, although under stress. In Model C, evacuation becomes unidirectional due to the close placement of exits, reducing route redundancy and flexibility.
Quantitative evaluation based on weighted network modeling and evacuation simulation demonstrates that different elemental composition patterns significantly affect internal evacuation characteristics, particularly balance and stability. The comparison reveals that units with symmetrical layouts at both ends exhibit superior evacuation performance, characterized by even occupant distribution and balanced path utilization. These features effectively mitigate congestion and enhance the overall spatial safety and robustness. Corridor dead ends should be minimized or avoided in design. The subsequent analysis of unit combination types is grounded in this two-end symmetrical layout paradigm.

4.3. Analysis of Unit Combination Patterns

The mode of connection between spatial units reflects the underlying organizational logic of the overall layout. Units are integrated into a larger spatial system through various interconnection strategies. In architectural design practice, functional needs, economic considerations, and site constraints often lead to the shared use of staircases, corridors, or other evacuation-related components across adjacent units, giving rise to diverse unit combination patterns. These variations in inter-unit connectivity profoundly impact the safety and efficiency of evacuation processes.

4.3.1. Typology of Configuration Patterns

Building on the terminal layout of individual units identified in the previous section, this study develops a typology of combination types based on the connection modes between two adjacent units. The classification framework considers two dimensions: the connection dimension and the connection mode (Table 7).
Building on the terminal layout of individual units identified in the previous section, this study develops a typology of combination types based on the connection modes between two adjacent units. The classification framework considers two dimensions: the connection dimension and the connection mode.
(1)
Classification by the Connection Dimension
The connection dimension refers to the number of paths linking two adjacent units. It can be categorized into three main types: unidirectional, bidirectional, and multidimensional connections. In practical school design, unidirectional and bidirectional connections are most commonly employed, particularly across various scales of primary school buildings. In contrast, multidimensional connections are typically found in large-scale educational complexes featuring atriums or multifunctional shared spaces, where spatial functions are more complex.
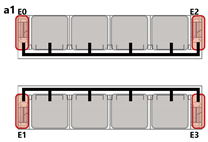
  • Unidirectional Connection: A single linear path connects two units, maintaining a high degree of independence between them, with interaction limited to the connection point.
  • Bidirectional Connection: Units are linked at both ends in a loop-like structure, strengthening inter-unit interaction and providing redundant evacuation paths during emergencies.
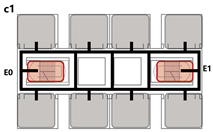
  • Multidimensional Connection: Multiple pathways connect the units, forming a networked structure that offers greater flexibility in route selection and maximizes unit interdependence.
(2)
Classification by the Connection Mode
Connection modes are defined based on whether evacuation paths are shared and whether significant functional interactions occur between units. Four primary types are identified: isolated, indirect, direct, and hybrid connections. All four are commonly encountered in real-world architectural practice.
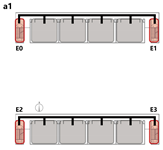
  • Isolated Mode: Each unit operates as a fully independent evacuation system, with no functional or physical linkage to adjacent units.
  • Indirect Mode: A spatial link exists for daily circulation; however, evacuation processes remain largely autonomous within each unit under normal conditions. Such connections may provide backup evacuation routes in emergencies.
  • Direct Mode: Units are closely integrated, sharing staircases and corridors to form a unified evacuation system. Effective evacuation requires mutual reliance between connected units.
  • Hybrid Mode: Part of the circulation space and vertical evacuation elements (e.g., stairs) are shared, forming the primary evacuation and circulation axis, while other parts of the units remain autonomous, functioning independently for both daily use and emergency response.
A series of representative spatial models is developed using the connection dimension as the primary classification criterion and the connection mode as the secondary classification layer. These models are subsequently subjected to quantitative assessment through network characteristic analysis and evacuation simulation to explore the relationship between unit combination patterns and evacuation efficiency.

4.3.2. Unidirectional Connections: Network and Simulation Analysis

Unidirectional connections establish linear pathways between spatial units, preserving high independence in evacuation processes. Under normal conditions, each unit typically completes evacuation independently. However, limited inter-unit interaction may occur when staircases are shared between adjacent units.
This typology identifies three distinct connection patterns: Isolated, Indirect, and Direct. The results are presented in Table 8.
(1)
Network Characteristic Analysis
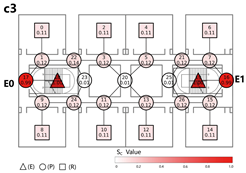
Evacuation Balance: All three models exhibit symmetrical network structures, with comparable C k values for each exit node and EBS close to zero, indicating a high degree of balance. Model C’s shared exit node E1 accommodates evacuation flows from four adjacent rooms. However, due to its larger capacity (i.e., an adequate width twice that of E0/2), the C k values remain balanced. Nonetheless, potential inefficiencies arising from occupant volume and width constraints merit further investigation through simulation.
Evacuation Stability: Consistent with Section 4.2.2, exit nodes (E) exert the most significant influence on network performance, while the impact of room nodes (R) remains relatively minor. The influence of path nodes (P) varies with their distance to exits, with remote nodes causing less disruption. In Models A and B, both networks demonstrate similar stability: branches evacuate independently, and failure of any path node results in partial disconnection. Nevertheless, unidirectional evacuation from all rooms remains achievable. Model B benefits from an inter-unit connecting corridor that enables collaborative evacuation, enhancing safety. In contrast, Model C highlights the critical vulnerability of the shared exit E1 and its adjacent path nodes—failures at these locations cause substantial imbalances, with S C values nearly double those of terminal exits (E0/2).
All three unidirectional connection types demonstrate strong evacuation balance due to their symmetrical network structures. The shared exit nodes represent the most vulnerable points in direct connection configurations and should be carefully assessed for connectivity robustness.
(2)
Evacuation Simulation Analysis
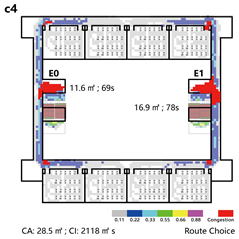
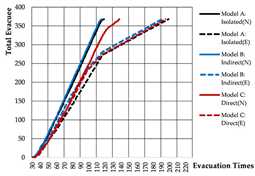
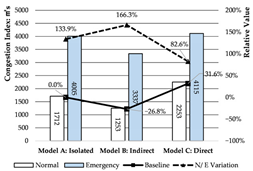
Normal Scenario: Models A and B outperform Model C in terms of evacuation time, with only minor differences between A and B. The main differences in path utilization and congestion occur near the central staircase. Model B records the lowest congestion index, while Model C exhibits the highest, suggesting that four converging flows at a shared staircase are less efficient under identical total stair width than two independently separated flows.
Emergency Scenario: Path blockages were introduced near the central staircase based on the key nodes identified through network analysis. Due to the linear and unidirectional layout, evacuees from the affected branch can only exit via the right-side staircase once a path segment is blocked. As a result, evacuation times across all three models are primarily determined by the performance of this single remaining exit, leading to similar durations. However, in terms of congestion, Model B again performs best—the presence of two adjacent central exits allows partial flow diversion and minimizes crowding.
The indirect connection configuration demonstrates the highest evacuation efficiency. Under normal conditions, each unit evacuates independently; however, in emergency scenarios, shared circulation routes enable collaborative evacuation, improving overall system performance. In architectural practice, it is recommended to place staircase exits adjacent to both sides of the entrance lobby to support this flexibility. By contrast, shared staircases in direct connection configurations tend to become significant congestion bottlenecks.

4.3.3. Bidirectional Connections: Network and Simulation Analysis

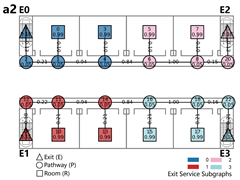
Bidirectional connection refers to a ring-shaped circulation pathway formed by the end-to-end linkage of two adjacent spatial units. This configuration serves as the spatial foundation for enclosed or courtyard-style layouts. This context examines four inter-unit connection types—Isolated, Indirect, Direct, and Hybrid—Corresponding spatial models are constructed for each type, and the analytical results are summarized in Table 9.
(1)
Network Characteristic Analysis
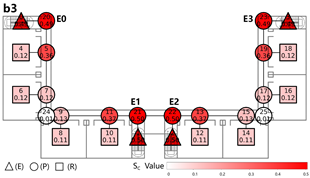
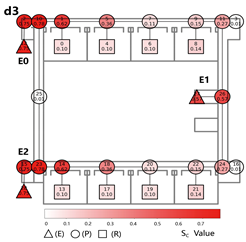
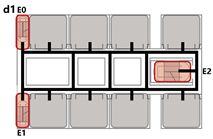
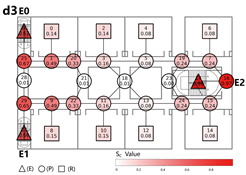
Evacuation Balance: Models A, B, and C exhibit symmetrical network structures, with similar C k values and EBS, indicating a well-balanced evacuation process. In contrast, Model D represents an asymmetrical network. Following the principle of proximity-based evacuation, the shared exit E1 (weight = 0.30) serves only two R-nodes, while exits E0 and E2 (weight = 0.15) serve three R-nodes, respectively. This leads to significant disparities in C k values across exits and a much higher EBS of 0.32, indicating a pronounced imbalance in evacuation distribution.
Evacuation Stability: In Model A, each unit functions independently. The removal of any path node severs connectivity, creating isolated branches and resulting in the highest S C values at the exit nodes. Model B follows a similar pattern but demonstrates greater robustness: even if the shared path between units is disrupted, overall connectivity remains intact due to a continuous primary route, allowing for flexible redistribution of evacuation loads. Model C depends on a shared exit and connecting path nodes, which become critical points of failure. When compromised, these nodes trigger severe shifts in network equilibrium, with S C values at the shared exit are approximately twice those of terminal exits in Model A—reflecting low resilience due to limited redundancy. Model D presents a distinct case: although a shared exit exists, the independent exits E0 and E1 exhibit higher S C values than the shared E2, as they serve more rooms. Their failure forces many occupants to reroute through remaining exits, significantly reconfiguring evacuation paths. Overall, the evacuation stability of Model D lies between that of Models B and C.
Indirect connections exhibit the highest evacuation stability among the various connection types, outperforming isolated configurations. Direct connection models with limited exit nodes are vulnerable to severe imbalance when exits or adjacent path nodes are compromised. Hybrid configurations offer moderate stability, falling between indirect and direct patterns.
(2)
Evacuation Simulation Analysis
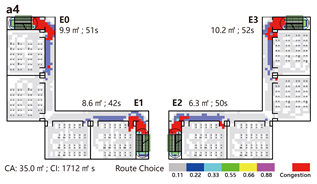
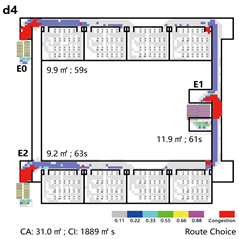
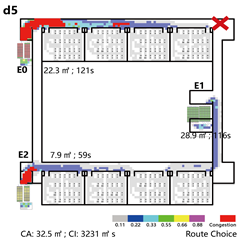
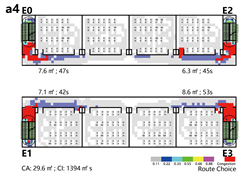
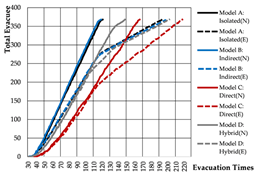
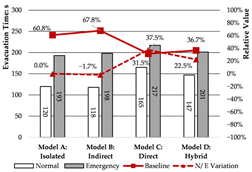
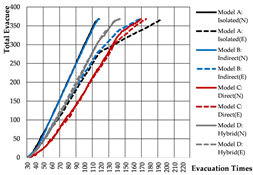
Normal Scenario: In terms of total evacuation time, Models A and B demonstrate the highest efficiency, with Model D performing better than Model C. Regarding path configuration and congestion, Models A and B show similar evacuation patterns. Under the principle of proximity-based evacuation, the shared corridor in Model B contributes minimally, indicating that each unit functions independently during evacuation. In contrast, the shared corridor in Model C becomes a critical evacuation route; however, due to its limited stair capacity, it poses a considerable crowding risk and results in the highest congestion index. In Model D, only the shared staircase on the right side serves both units, functioning as the sole evacuation path for both.
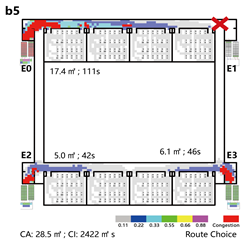
Emergency Scenario: Evacuation time varies considerably under emergency conditions. Models A and B, which previously performed well under normal conditions, experience substantial increases in evacuation time by 60.8% and 67.8%, respectively. Model C continues to exhibit the longest evacuation duration, while Model D shows only a moderate increase.
Regarding path utilization and congestion, Model A is hindered by unidirectional evacuation within the affected unit, resulting in severe crowding and no support from adjacent units. Although a shared corridor is present in Model B, the alternative exit (E3) is too distant from the compromised exit (E1) to alleviate congestion effectively. In Model C, strong connectivity between damaged and intact units leads to minimal rerouting of evacuation paths; as a result, exit E0 becomes overloaded, producing the highest congestion level. Model D combines indirect and direct evacuation features, offering moderate adaptability in response to disruptions.
In summary, both isolated and indirect connection types demonstrate efficient evacuation performance regarding time, route selection, and congestion, with indirect configurations exhibiting greater stability. However, isolated layouts lack redundancy during emergency scenarios, limiting their adaptability. Direct connections frequently result in excessive crowding and reduced evacuation efficiency due to converging occupant flows. Hybrid configurations perform at a moderate level, and with appropriate evacuation guidance, can provide a balanced compromise between efficiency and safety.

4.3.4. Multidimensional Connections: Network and Simulation Analysis

Multidimensional connections refer to spatial configurations in which multiple pathways link adjacent units, creating a mesh-like network that facilitates diverse route choices and enhances inter-unit interaction. This type is commonly employed in comprehensive teaching buildings with complex functional programs.
The analytical results are summarized in Table 10.
(1)
Network Characteristic Analysis
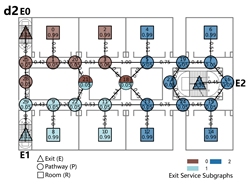
Evacuation Balance: Models A, B, and C exhibit symmetrical network structures, indicating a well-balanced evacuation pattern. Although Model D features an asymmetrical layout, the presence of multiple connection paths helps maintain similar C k values across exits, ensuring an acceptable level of evacuation balance.
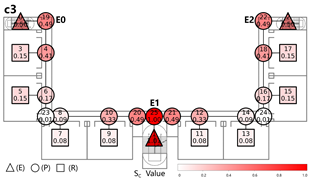
Evacuation Stability: Unlike unidirectional and bidirectional layouts, multidimensional configurations demonstrate distinct network behavior. In Model B, path nodes (P) directly connected to room nodes (R) display higher S C values, which diminish with increasing distance from exits. The existence of multiple redundant paths between units reduces the impact of individual path failures. In Model C, the shared exits E0/E1 and their connected path nodes constitute the most critical nodes, whereas other paths exhibit minimal and evenly distributed influence. Model D integrates characteristics of both Models B and C: its shared exit E2 shows a higher S C than the independent exits E0/E1, indicating that more rooms rely on E2 due to its advantageous connectivity.
Compared to unidirectional and bidirectional systems, multidimensional connections offer enhanced safety and robustness. The abundance of redundant paths facilitates more equitable redistribution of evacuation loads in the event of node failures, thereby improving overall network resilience.
(2)
Evacuation Simulation Analysis
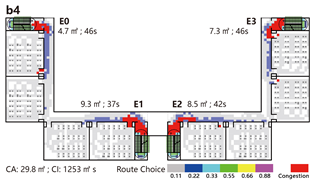
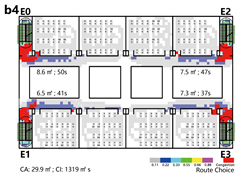
Normal Scenario: Evacuation times and congestion patterns in multidimensional configurations resemble those observed in bidirectional networks. Shared corridors are generally underutilized under normal conditions, and congestion tends to concentrate near exit points.
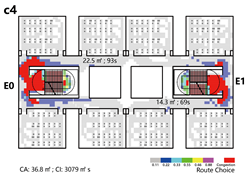
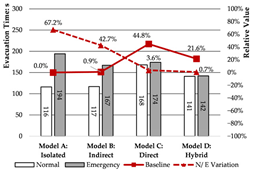
Emergency Scenario: Evacuation performance varies markedly under disruption. Model A exhibits the greatest increase in evacuation time (67.2%), followed by Model B (42.7%). In contrast, Models C and D maintain relatively stable evacuation durations, with Model D showing a linear and consistent evacuation curve and achieving the highest efficiency. Regarding congestion, Model A experiences severe crowding due to the lack of alternative routes. Model B supports partial diversion through connecting corridors. Models C and D benefit from multiple redundant paths, facilitating smoother evacuation flows and reducing localized clustering, thereby minimizing overall congestion.
Multidimensional unit connections provide extensive redundant evacuation pathways and demonstrate strong safety stability. Evacuation routes are no longer confined to linear corridors but evolve into flexible, networked systems. Notably, hybrid connection models capitalize on the number and effective width of evacuation staircases, resulting in high redundancy and improved evacuation performance.
5. Discussion

5.1. Spatial Organization and Its Correlation with Evacuation Efficiency in School Buildings

The spatial organization of primary school teaching buildings—particularly the composition patterns and combination methods of basic units—significantly impacts evacuation performance. Specifically, unit composition patterns influence evacuation behavior within individual units, while unit combination methods shape overall connectivity and evacuation dynamics throughout the building. Relevant simulation results and comparative data are presented in Table 11.

5.1.1. Summary of Elemental Composition Characteristics

Elemental Composition types significantly affect internal evacuation characteristics and balance. The spatial relationships among rooms, exits, and connecting paths are key determinants of this influence. Under fixed total evacuation width conditions, layouts featuring evenly distributed and decentralized staircases and exits demonstrate higher evacuation efficiency than centralized configurations. Units with symmetrically placed exits at both ends enable more orderly occupant dispersal and balanced route selection, reducing congestion and maintaining effective unidirectional evacuation even in path disruption—indicating high spatial safety reliability. In contrast, when exits are centrally located, the layout often creates cul-de-sac corridors at both ends. In such configurations, rooms at the ends depend entirely on central corridors, leading to crowd convergence and reduced capacity for diversion. During emergencies, loss of corridor functionality may render safe evacuation impossible, increasing risk. It is therefore recommended to avoid or minimize the length of end corridors in such cases.
These findings are consistent with the requirements outlined in China’s current fire safety design codes. According to Article 5.5.17 of the Code for Fire Protection Design of Buildings (GB 50016—2014, 2018 edition) [61], in Class I and II multi-story school buildings, when classrooms are located along a one-sided dead-end corridor, the distance from the door of the farthest classroom to the nearest exit must not exceed 22 m. Article 7.1.2 of the General Code for Fire Protection (GB 55037—2022) stipulates that building evacuation exits should be distributed to ensure that occupants have multiple evacuation paths in different directions during a fire emergency [62].

5.1.2. Summary of Unit Configuration Characteristics

The overall spatial configuration of a building results from the combination of individual units through different connection strategies. Variations in the connection dimension and connection type significantly influence evacuation efficiency.
In terms of connection dimension: Unidirectional connections form linear paths with short travel distances but are vulnerable to failure—once a route is blocked, evacuation is disrupted. Indirect connections offer greater reliability by supporting both independent and cooperative evacuation. Bidirectional connections create looped paths that remain connected under disruption, enabling load redistribution. Combining multiple strategies, hybrid types enhance efficiency and safety when paired with proper guidance. Multidimensional connections form mesh-like networks with multiple redundant routes, allowing flexible rerouting and high resilience. Overall, greater connection dimensionality improves redundancy and strengthens network robustness.
In terms of connection mode: Isolated units perform well under normal conditions but lack emergency redundancy, resulting in low safety and stability. Indirect connections preserve daily independence while enabling partial diversion during emergencies. They serve as redundant safety paths and support evacuation guidance strategies. Direct connections require cross-unit collaboration at all times. Shared exits become critical nodes, and disruptions can severely affect load balance. Hybrid connections integrate indirect and direct features, offering reliable performance and stability across dimensions. Connection type selection should integrate local evacuation behavior with global network performance to inform architectural design strategies.
A summary of the correlation between spatial organizational features and evacuation efficiency in primary school teaching buildings is presented in Table 12.

5.2. Spatial Design Principles for Optimizing Evacuation Efficiency

5.2.1. Optimization Design Principles

The structural organization of space significantly influences overall evacuation efficiency. Based on this understanding, this study proposes a set of architectural spatial optimization principles to improve evacuation performance. Integration ensures coordination, Balance supports efficiency, and Stability safeguards reliability. These principles should work together to guide the spatial design of public buildings.
Network Integrity Principle: Buildings are complex systems composed of spaces and occupants. When considering architectural spaces as an integrated network, it is essential to focus on local evacuation conditions within individual zones and assess the collaborative interactions and potential shared usage of evacuation resources between different areas at the overall building level.
Exit Balance Principle: Evacuation balance is a key determinant of overall efficiency. Spatial organizational features influence the distribution of corridors, staircases, and emergency exits. Among these, the location of exits broadly defines evacuation routes and the dispersion patterns of evacuees. Thus, the exit arrangement is critical in ensuring a safe, orderly, and efficient evacuation process.
Path Stability Principle: The stability of evacuation paths is the foundation of safety during emergencies. Building spaces should be capable of maintaining safe and reliable evacuation processes even in the event of primary path disruption. Sufficient redundant evacuation routes must be provided to ensure the continuity and safety of evacuation under disaster conditions.
The proposed evacuation-oriented design principles can serve as a valuable reference for optimizing educational facilities and other densely occupied building types with similar spatial organization patterns, such as office buildings, hotels, and healthcare facilities. Many of these buildings adopt linear corridor-based layouts, sharing analogous spatial characteristics. Accordingly, addressing spatial integrity, balance, and robustness within functional units is essential. When extending this research framework to other building typologies, it is necessary to further adapt the principles by incorporating user-specific characteristics and corresponding regulatory requirements.
Table 13 provides a design checklist based on evacuation optimization for designers’ reference. It should be noted that the analyses and design checklist in this study are grounded in Chinese primary school codes and may require adaptation for application under different regional standards.

5.2.2. Optimization Pathways and Design Recommendations

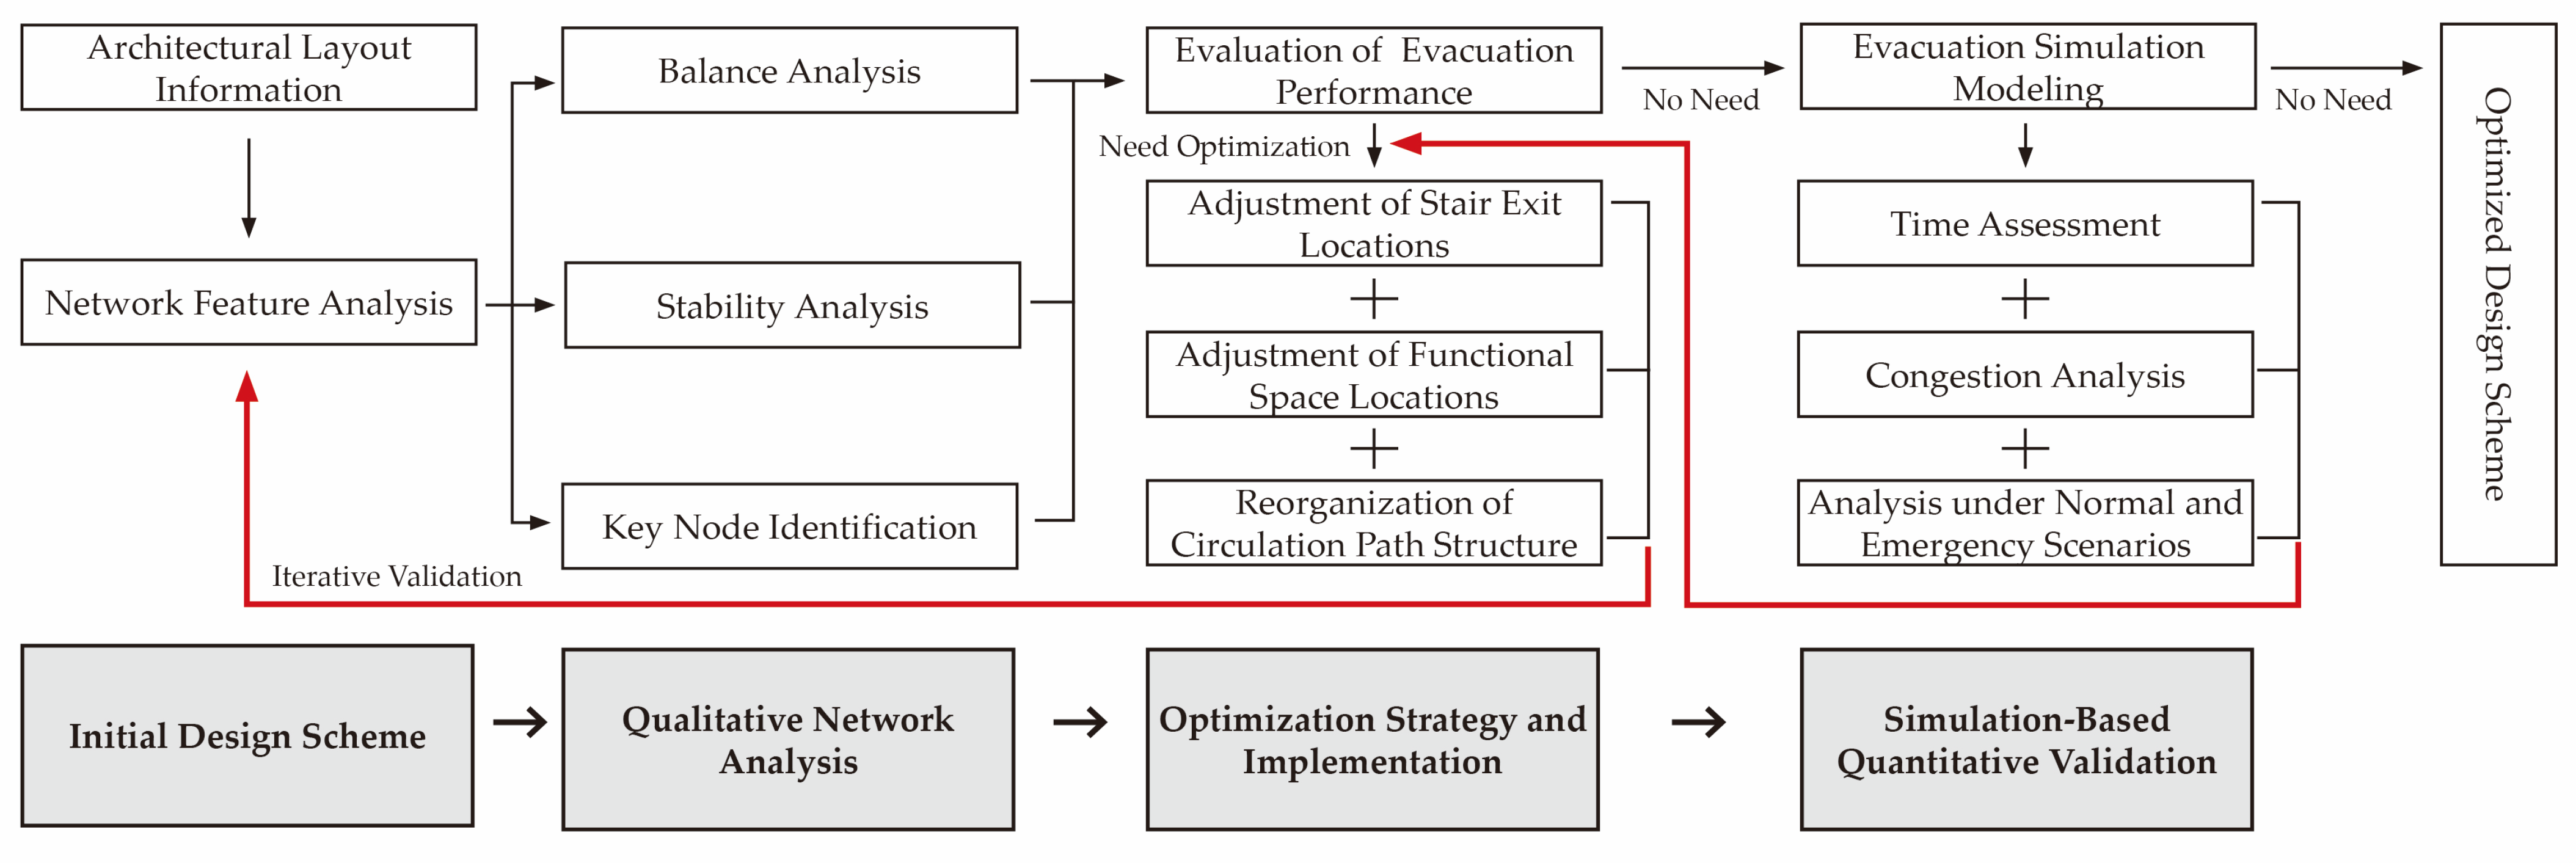
This study proposes an evacuation-oriented evaluation and design optimization framework for architectural spaces (Figure 4), which can be applied in practical design processes. By analyzing the synergy between occupant characteristics, spatial attributes, and evacuation performance, the framework integrates overall layout, circulation flows, and functional zoning with key evacuation-related aspects such as structural organization, occupant distribution, and spatial form selection. Three major strategies are proposed based on these interrelationships: layout typology adjustment, exit distribution optimization, and redundancy path enhancement. These strategies can assist designers in rapidly evaluating the effectiveness of alternative spatial layouts during the early design phase.

5.2.3. Practical Case: Optimized Design of a School Project

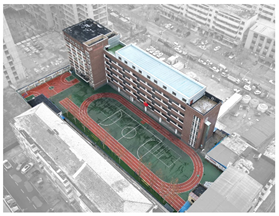
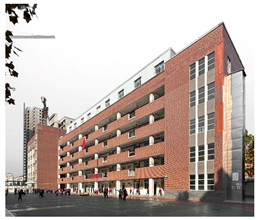
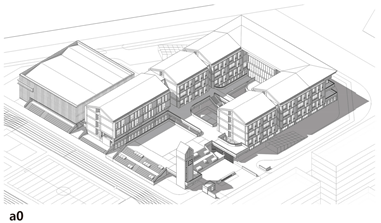
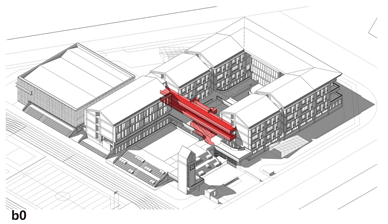
To demonstrate the application of the proposed spatial organization optimization framework for evacuation performance, a primary school project designed by the research team was selected as a case study. Comparative architectural plans and the final building form are presented before and after optimizing evacuation-oriented spatial relationships.
The project is located in Zhengzhou, Henan Province, China, with a total floor area of 15,700 m2 and consists of four floors above ground. Due to site constraints, the available land is relatively limited. Network modeling and evacuation simulation were conducted based on the original and optimized design schemes. The Supplementary Materials (File S3) provide detailed model parameters and simulation data. The settings for occupant attributes and evacuation strategies remain consistent with those described in previous sections.
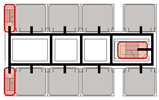
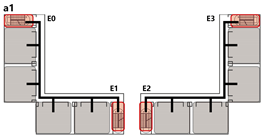
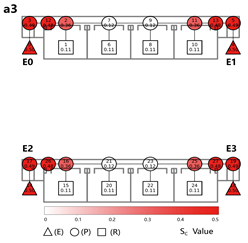
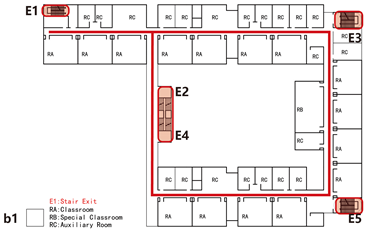
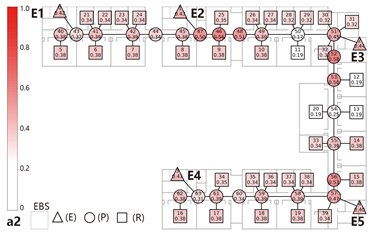
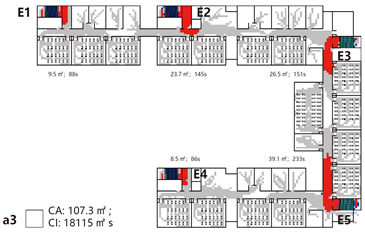
Simulation Results: The original design scheme revealed certain deficiencies in evacuation balance and stability (EBS = 0.34). Influenced by the linear spatial configuration, the planar structure demonstrated poor safety stability. The failure of any path node would disrupt the main linear route, maintaining the EBS at a relatively high level throughout (Table 14a2). Simulation results further indicated that E3 and E5, serving as shared exits between two units, experienced severe congestion (Table 14a3).
Problem Analysis: The linear layout led to a high degree of functional space concentration, with most exits serving as shared egress points between adjacent units. However, the number of occupants served by each exit varied significantly, underutilizing certain exits’ evacuation capacities. Furthermore, the proximity between exits and teaching spaces reduced travel distances, limiting the opportunity for queuing and buffering during the horizontal evacuation phase and thereby exacerbating congestion. A comprehensive redistribution of exit locations is necessary to mitigate these imbalances and improve utilization efficiency.
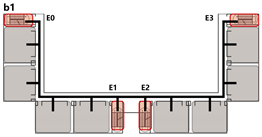
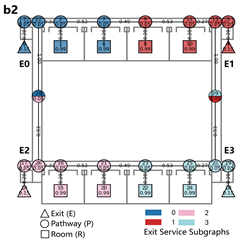
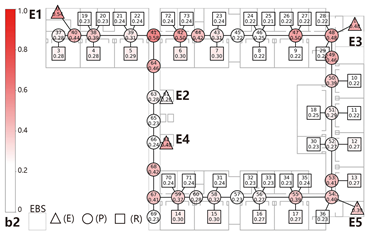
Optimization Strategy: A public corridor was added to transform the configuration into a courtyard-enclosed form based on the existing semi-enclosed linear layout. The staircases at E2 and E4 were converted into scissor staircases integrated with the public corridor. This ring-shaped path system provided redundant evacuation routes that significantly enhanced evacuation stability. Network analysis indicated a marked improvement in resilience, as the impact of the main path node failure on the EBS indicator was substantially reduced (Table 14b2).
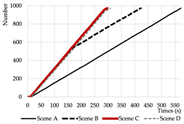
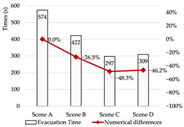
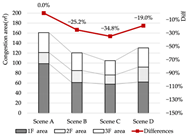
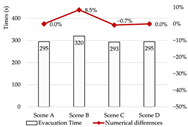
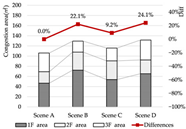
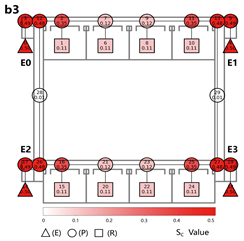
While maintaining the total exit width, the staircases at E3 and E5—which bore the highest evacuation load—were widened from three occupant lanes (1.5 m) to four lanes (2.0 m). Simultaneously, each segment of the scissor staircases at E2 and E4 was adjusted to two lanes (1.0 m). Results showed a 26.6% reduction in total evacuation time and a 41.3% decrease in congestion, indicating significant performance improvement (Table 14b3).
In summary, while preserving the fundamental characteristics of the original design to the greatest extent possible, the optimized scheme achieved significant improvements in both evacuation time and congestion levels, demonstrating the effectiveness of the proposed optimization measures.

6. Conclusions

This study is grounded in a comprehensive analysis of multiple real-world cases of primary school teaching buildings. It identifies and generalizes key organizational characteristics and establishes a spatial structural framework based on basic units and their organizational relationships. Two interrelated analytical levels are proposed: unit composition and elemental composition. By constructing hierarchical and typologically distinct comparative models and employing an integrated method that combines weighted network analysis with evacuation simulation, the study quantitatively examines the relationship between different spatial organizational patterns and evacuation efficiency, ultimately identifying generalizable spatial-efficiency correlation patterns.
From a theoretical perspective, this research highlights the critical role of spatial organization in shaping evacuation performance, extending beyond previous studies that have focused primarily on occupant capacity or the geometric properties of circulation spaces. By incorporating the macro-level configuration of building layouts into evacuation analysis, the study provides a methodological innovation that may serve as a reference paradigm for evacuation research in educational and other public buildings.
From a practical standpoint, the correlation patterns and planning principles proposed in this study offer guidance for designing primary school teaching buildings and other similar facilities. Although site conditions, building scales, and functional requirements may vary across cases, the fundamental relationship between spatial organization and evacuation efficiency remains applicable, offering a reliable reference for spatial configuration decisions in early design stages.
This study has certain limitations. To balance modeling complexity and the integrity of the evacuation process, all simulation models were set under a unified scenario in which occupants from a single grade level on the third floor evacuate through staircases to reach the first-floor exits. The analysis does not extensively consider the influence of individual behavioral characteristics, physical mobility, or evacuation guidance strategies. Furthermore, dynamic hazards such as smoke propagation and fire development were not simulated. As a result, the findings are primarily applicable to spatial configuration comparisons and are intended to support early-stage architectural design decisions regarding spatial organization patterns.
For comprehensive evaluations of building evacuation safety, it is essential to incorporate specific contextual factors, including the building’s functional typology, occupant characteristics, usage patterns, and management strategies. These analyses should also be conducted per relevant local fire codes and regulatory frameworks. It should be noted that the analyses in this study are grounded in the spatial characteristics and design codes of Chinese primary school buildings. For regions such as Europe and North America that adopt different design standards, the identified spatial organization patterns and evacuation principles may require appropriate adjustment and contextual adaptation before practical application.
Future work will extend beyond primary schools to other densely populated public buildings—such as research offices, dining halls, trade markets, and entertainment venues—each characterized by distinct spatial organizations, with a focus on their design and evacuation efficiency.

Supplementary Materials

The following supporting information can be downloaded at: https://www.mdpi.com/article/10.3390/buildings15193560/s1, Table S1. Metadata of the 102 Primary School Teaching Building Cases. File S1. Python Code for Weighted Network Analysis and a Sample File. File S2. Simulation Input Files, Raw Results, and Architectural CAD Drawings. File S3. Materials Related to the Optimized Validation Case.

Author Contributions

Conceptualization, S.C. and J.Z.; Methodology, S.C. and J.Z.; Software, S.C.; Formal analysis, S.C.; Writing—original draft preparation, S.C.; Writing—review and editing, W.L.; Resources, S.C. and J.Z.; Funding acquisition, J.Z. investigation, W.L. project administration, W.L. All authors have read and agreed to the published version of the manuscript.

Funding

This research was funded by the National Natural Science Foundation of China, grant numbers 52478035 and 51878620.

Data Availability Statement

The original contributions presented in the study are included in the article.

Acknowledgments

The work was supported by Zhengzhou University.

Conflicts of Interest

The authors declare no conflicts of interest.

Abbreviations

The following abbreviations are used in this manuscript:
C k Exit Capacity
EBSEvacuation Balance Statistic
S C Exit Capacity Sensitivity
ES MapThe service range map of each exit node
CICongestion Index
CACongested Area
ECREvacuation Completion Rate
PC Map (N)Path and Congestion Map (Normal Scenario)
PC Map (E)Path and Congestion Map (Emergency Scenario);
MMean
SDStandard Deviation

Appendix A

Appendix A presents an analysis of the sensitivity and robustness of the results concerning the weighting scheme of network nodes.
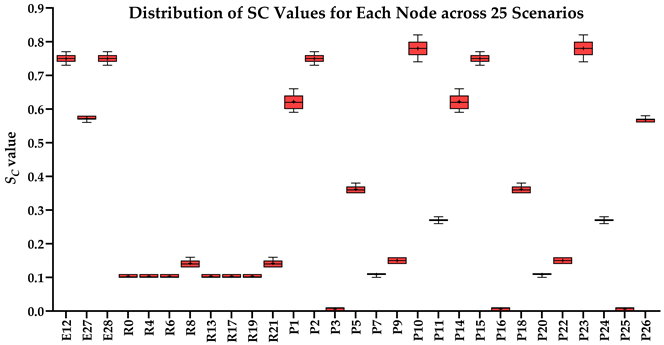
The R nodes, representing classrooms, are assigned the highest fixed weight (R = 0.99) and remain unchanged throughout the experiments. In contrast, the weights of path nodes (P) and exit nodes (E) vary more significantly, as they are influenced by spatial area. The experimental design involves constructing 25 comparative models by systematically varying the weights of P and E nodes, while keeping the classroom node weight (R) constant at 0.99. Detailed model settings are provided in Appendix A, Table A1.
The path node weight (P) is set at a baseline of 0.05, with five perturbation levels ranging from ±80%, i.e., P = {0.01, 0.03, 0.05, 0.07, 0.09}; the exit node weight (E) is set at a baseline of 0.15, with five perturbation levels up to ±66.7%, i.e., E = {0.05, 0.10, 0.15, 0.20, 0.25}, and the shared exit node weight is defined as twice the value of the corresponding independent exit node; the classroom node weight (R) remains fixed at 0.99 in all scenarios.
The results indicate that when the classroom node weight (R = 0.99) remains fixed, variations in the path node weight (P, baseline = 0.05) within a ±80% range and in the exit node weight (E, baseline = 0.15) within a ±66.7% range have a limited impact on the overall outcomes. The key network performance indicators—EBS and S C —exhibited consistent trends across all tested scenarios. No significant structural deviations were observed in the computed values, suggesting that the analysis framework demonstrates strong robustness concerning the node weighting scheme.
Table A1. Sensitivity and robustness analysis of node weight settings.
P Node Weight
0.010.030.050.070.09
E Node Weight0.05 (0.10)EBS = 0.33EBS = 0.33EBS = 0.32EBS = 0.32EBS = 0.31
0.10 (0.20)EBS = 0.33EBS = 0.33EBS = 0.32EBS = 0.32EBS = 0.31
0.15 (0.30)EBS = 0.33EBS = 0.33EBS = 0.32EBS = 0.32EBS = 0.31
0.20 (0.40)EBS = 0.33EBS = 0.33EBS = 0.32EBS = 0.32EBS = 0.31
0.25 (0.50)EBS = 0.33EBS = 0.33EBS = 0.32EBS = 0.32EBS = 0.31
Distribution of SC ValuesBuildings 15 03560 i001
Note: Values in parentheses for E represent the weights of shared exit nodes.

Appendix B

Analysis of the Impact of Stair Dimensions, Exit Width, and Corridor Length on Evacuation Efficiency

Due to different roles during various evacuation stages, spatial elements such as staircase width, exit width, and corridor length influence evacuation efficiency to varying degrees. To investigate the compatibility between key evacuation pathway components, simulation-based analysis was conducted to assess how different spatial dimensions affect overall evacuation performance.
Three primary spatial variables were considered: corridor width, stair width, and exit width. Each variable was assigned two levels: a standard width (corresponding to 4/3/3 occupant flow lanes for corridor/stair/exit, with each lane representing 0.5 m in physical width) and a bottleneck width (2/2/2 flow lanes). This configuration resulted in eight scenarios, with Scenarios 1–4 using standard exit widths and Scenarios 5–8 incorporating exit bottlenecks. Aside from these variable settings, all other conditions across the scenarios were held constant. To reflect the cumulative effect of vertical evacuation demand, all simulations assumed full occupancy across three floors, totaling 552 individuals, with an equal gender distribution. The detailed simulation results are presented in Table A2.
Table A2. Sensitivity analysis of Corridor Width × Stair Width × Exit Width factors.
Corridor● Stair●Corridor○ Stair●Corridor● Stair○Corridor○ Stair○
Scenario Setup MatrixExit●Buildings 15 03560 i002Buildings 15 03560 i003Buildings 15 03560 i004Buildings 15 03560 i005
Exit○Buildings 15 03560 i006Buildings 15 03560 i007Buildings 15 03560 i008Buildings 15 03560 i009
Simulation ResultsExit●Buildings 15 03560 i010Buildings 15 03560 i011Buildings 15 03560 i012Buildings 15 03560 i013
T = 161 s; CI = 5784 m2·sT = 170 s; CI = 6111 m2·sT = 169 s; CI = 6428 m2·sT = 175 s; CI = 7022 m2·s
Exit○Buildings 15 03560 i014Buildings 15 03560 i015Buildings 15 03560 i016Buildings 15 03560 i017
T = 238 s; CI = 9101 m2·sT = 241 s; CI = 9078 m2·sT = 242 s; CI = 10,409 m2·sT = 248 s; CI = 10,610 m2·s
Data AnalysisBuildings 15 03560 i018Buildings 15 03560 i019Buildings 15 03560 i020Buildings 15 03560 i021
Evacuation Time Curve under Normal Exit Evacuation Time Curve under Bottleneck ExitEvacuation Time ComparisonComparison of Congestion Indicators
Note: ● Indicates a space with normal width (corridor/stair/exit with flow lanes of 4/3/3); ○ Indicates a space with bottleneck width (corridor/stair/exit with flow lanes of 2/2/2).
The findings reveal that the influence of each spatial component on evacuation efficiency varies depending on the stage of the evacuation process in which it is involved. Exit bottlenecks had the most pronounced impact, significantly increasing total evacuation time and congestion levels. Stair bottlenecks mainly contributed to elevated congestion but had a smaller effect on total evacuation time. In contrast, corridor bottlenecks exhibited the least impact on both metrics, suggesting that their influence on overall efficiency is comparatively limited.

Appendix C

Empirical Data on Children’s Locomotion Abilities Obtained from Evacuation Drills

Table A3. Evacuation drill data summary for each group.
Reaction Time(s)Horizontal Speed(m/s)Stairs Down Speed(m/s)Stairs Up Speed(m/s)
ChartsBuildings 15 03560 i022Buildings 15 03560 i023Buildings 15 03560 i024Buildings 15 03560 i025
MSDMdMSDMdMSDMdMSDMd
LB8.442.418.001.820.271.790.840.140.830.600.210.54
G8.292.407.401.650.151.630.740.080.730.590.200.50
MiB4.020.953.801.990.302.020.890.130.910.640.110.63
G4.391.703.901.760.471.880.850.070.850.610.110.58
SB3.021.672.802.150.362.130.940.130.910.720.200.71
G4.121.744.001.860.231.780.900.150.850.540.110.54
Note: L for the lower group, Mi for the middle group, S for the Senior group; B for boys, G for girls. M = Mean; SD = Standard Deviation; Md = Median.

Appendix D

Analysis of the Correlation Between Evacuation Paths, Evacuation Sequences, and Guidance Strategies with Evacuation Efficiency

Appropriate guidance strategies can regulate and control crowd interactions across different evacuation attributes, thereby reducing congestion. Such strategies can support evacuation management in real disaster scenarios, daily crowd dispersal control, and the planning of fire evacuation drills. To quantitatively analyze the correlation between evacuation paths, evacuation sequences, and guidance strategies with evacuation efficiency, simulations were conducted in Appendix D based on the school examined in the previous drill survey.
(1)
Route Guidance Strategy Experiment
Four scenarios were established: unilateral evacuation, offset evacuation, balanced evacuation, and random evacuation. The results are presented in Table A4.
Evacuation time: The four scenes differ significantly in evacuation time, ranging from 26.5% to 37.5% of Scene A. Scene A had the longest time, with Scene B more efficient early on but slowing later. Scenes C and D showed evenly distributed times.
Congestion: Congestion varied across scenes, from 19.0% to 34.8%. Scene C had the best performance, while Scene A had the highest congestion. Scene B reduced congestion by 25.2% compared to Scene A. Scenes C and D showed balanced congestion distribution.
In summary, a balanced evacuation path enhances efficiency, optimizes stair usage, prevents cross-flow, and reduces congestion.
Table A4. Evacuation route guidance simulation results.
Scene AScene BScene CScene D
ModelBuildings 15 03560 i026Buildings 15 03560 i027Buildings 15 03560 i028Buildings 15 03560 i029
Congestion mapBuildings 15 03560 i030Buildings 15 03560 i031Buildings 15 03560 i032Buildings 15 03560 i033
ComparisonBuildings 15 03560 i034Buildings 15 03560 i035Buildings 15 03560 i036Buildings 15 03560 i037
Evacuation time curveExit flow CurveComparison of eva-times Comparison of congestion
Note: The Exit Flow Curve represents the number of occupants passing through a safety exit per unit of time. It is used to describe the capacity of the exit, where a higher and more stable flow indicates greater evacuation efficiency.
(2)
Sequence Guidance Strategies Experiment
Four scenarios were established: low–middle–high, high–middle–low, simultaneous evacuation of low and high groups, and simultaneous evacuation of all groups. The results are presented in Table A5.
Evacuation time: Differences in evacuation time across the four scenes range from −0.7% to 8.5%, showing minor variations. Scenes A, C, and D had similar times and exit flow curves, with all spaces operating at full capacity. Scene B lagged, resulting in a longer evacuation time.
Crowd performance: In Scene A, personnel evacuated from lower to higher floors, with later groups clashing and reducing the lower group’s efficiency. Scene B had seniors evacuating first, causing the lower group to wait and increasing the risk. Scene C’s simultaneous evacuation of lower and senior grades led to more complex interactions, while Scene D’s simultaneous evacuation across groups resulted in more interactions at different stages.
Congestion: Congestion differences ranged from 9.2–24.1%. Scene A performed best, optimizing evacuation based on personnel location and attributes. Scene C’s staggered evacuation of seniors and lower grades helped reduce congestion. Scenes B and D experienced more congestion due to waiting and group conflicts.
In summary, an evacuation sequence strategy that considers personnel location and attributes can reduce congestion and conflict among groups.
Table A5. Evacuation sequence guidance simulation results.
Scene AScene BScene CScene D
ModelBuildings 15 03560 i038Buildings 15 03560 i039Buildings 15 03560 i040Buildings 15 03560 i041
Crowd performanceBuildings 15 03560 i042Buildings 15 03560 i043Buildings 15 03560 i044Buildings 15 03560 i045
Congestion mapBuildings 15 03560 i046Buildings 15 03560 i047Buildings 15 03560 i048Buildings 15 03560 i049
ComparisonBuildings 15 03560 i050Buildings 15 03560 i051Buildings 15 03560 i052Buildings 15 03560 i053
Evacuation time curveExit flow CurveComparison of eva-times Comparison of congestion
Note: Crowd performance refers to the individual evacuation completion times of different groups. The intersections of different curves indicate the presence of interactions, merging, or convergence among evacuees during the evacuation process.

References

  1. Adrian, J.; Klüpfel, H.; Schadschneider, A.; Seyfried, A.; Amos, M.; Baratchi, M.; Beermann, M.; Bode, N.; Boltes, M.; Corbetta, A.; et al. A Glossary for Research on Human Crowd Dynamics. Collect. Dyn. 2019, 4, 1–14. [Google Scholar] [CrossRef]
  2. Gwynne, S.; Galea, E.R.; Owen, M.; Lawrence, P.J.; Filippidis, L. A Review of the Methodologies Used in the Computer Simulation of Evacuation from the Built Environment. Build. Environ. 1999, 34, 741–749. [Google Scholar] [CrossRef]
  3. Glenn, N.; Hamilton, G.N.; Lennon, P.F. Toward Fire Safe Schools: Analysis of Modelling Speed and Specific Flow of Children During Evacuation Drills. Fire Technol. 2020, 56, 605–638. [Google Scholar]
  4. Lian, H.; Zhang, S.; Li, G.; Li, L. Pedestrian Simulation on Evacuation Behavior in Teaching Building of Primary School Emergencies and Optimized Design. Buildings 2023, 13, 1747. [Google Scholar] [CrossRef]
  5. Bahmani, H.; Ao, Y.; Yang, D.; Wang, D. Students’ Evacuation Behavior during an Emergency at Schools: A Systematic Literature Review. Int. J. Disaster Risk Reduct. 2023, 87, 103584. [Google Scholar] [CrossRef]
  6. Haghani, M. Optimising Crowd Evacuations: Mathematical, Architectural and Behavioural Approaches. Saf. Sci. 2020, 128, 104745. [Google Scholar] [CrossRef]
  7. Wang, J.; Boltes, M.; Seyfried, A.; Steffen, B. Experimental Study on Age and Gender Differences in Microscopic Movement Characteristics of Students. Chin. Phys. B 2021, 30, 098902. [Google Scholar] [CrossRef]
  8. Chu, J.C.; Yeh, C.Y. Emergency Evacuation Guidance Design for Complex Building Geometries. J. Infrastruct. Syst. 2012, 18, 288–296. [Google Scholar] [CrossRef]
  9. Duarte, E.; Rebelo, F.; Teles, J.; Wogalter, M.S. Behavioral Compliance for Dynamic versus Static Signs in an Immersive Virtual Environment. Appl. Ergon. 2014, 45, 1367–1375. [Google Scholar] [CrossRef]
  10. Lárusdóttir, A.R. Evacuation of Children: Focusing on Daycare Centers and Elementary Schools. Master’s Thesis, Technical University of Denmark, Kongens Lyngby, Denmark, 2013. [Google Scholar]
  11. Ono, R.; Valentin, M.; Vittorino, F. Walking Speed Data of Fire Drills at an Elementary School. In Proceedings of the 5th International Symposium: Human Behaviour in Fire, Cambridge, UK, 19–21 September 2012. [Google Scholar]
  12. Ono, R.; Valentim, M.V.; Vittorino, F. Method for Collecting Data of Children Descending Movement on Stairs in Schools. Fire Mater. 2021, 45, 508–528. [Google Scholar] [CrossRef]
  13. Kim, E.S.; Lee, J.S.; Kim, S.Y. Measurement and Analysis of Moving Velocity of Elementary School Students under an Escape Drill. Fire Sci. Eng. 2003, 17, 1–6. [Google Scholar]
  14. Xie, K.; Yu, S.; Jia, L.; Zhang, L. Stampede Prevention Design of Primary School Buildings in China: A Sustainable Built Environment Perspective. Int. J. Environ. Res. Public Health 2018, 15, 1517. [Google Scholar] [CrossRef] [PubMed]
  15. Hamilton, G.N.; Lennon, P.F.; O’Raw, J. Human Behaviour during Evacuation of Primary Schools: Investigations on Pre-Evacuation Times, Movement on Stairways and Movement on the Horizontal Plane. Fire Saf. J. 2017, 91, 937–946. [Google Scholar] [CrossRef]
  16. Rostami, R.; Alaghmandan, M. Performance-Based Design in Emergency Evacuation: From Maneuver to Simulation in School Design. J. Build. Eng. 2020, 33, 101598. [Google Scholar] [CrossRef]
  17. Ding, N.; Ma, Y.; Dong, D.; Wang, Y. Experiment and Simulation Study of Emergency Evacuation during Violent Attack in Classrooms. J. Saf. Sci. Resil. 2021, 2, 208–221. [Google Scholar] [CrossRef]
  18. Xu, G.; Liang, Z.Y.; Liu, H.Y. Simulation of Impact of Classroom Layout on Evacuation Efficiency Based on Cellular Automata. Appl. Mech. Mater. 2012, 263–266, 1497–1502. [Google Scholar] [CrossRef]
  19. Chen, L.; Tang, T.Q.; Huang, H.J.; Huang, H.Y. Elementary Students’ Evacuation Route Choice in a Classroom: A Questionnaire-Based Method. Phys. A 2018, 503, 1–16. [Google Scholar] [CrossRef]
  20. Li, W.; Li, Y.; Yu, P.; Liu, T. Modeling, Simulation and Analysis of the Evacuation Process on Stairs in a Multi-Floor Classroom Building of a Primary School. Phys. A 2017, 469, 157–172. [Google Scholar] [CrossRef]
  21. Kim, H.K. An Architectural Study on Optimum Evacuation Route of School Facilities. J. Korea Converg. Soc. 2021, 12, 177–183. [Google Scholar]
  22. Newman, M.E.J. Networks: An Introduction; Oxford University Press: Oxford, UK, 2010. [Google Scholar]
  23. Kantarci, B.; Labatut, V. Classification of Complex Networks Based on Topological Properties. In Proceedings of the 2013 International Conference on Cloud and Green Computing, Karlsruhe, Germany, 30 September–2 October 2013; pp. 297–304. [Google Scholar]
  24. Böttcher, L.; Porter, M.A. Complex Networks with Complex Weights. Phys. Rev. E 2024, 109, 024314. [Google Scholar] [CrossRef]
  25. Costa, L.F.; Oliveira, O.N., Jr.; Travieso, G.; Rodrigues, F.A.; Villas Boas, P.R.; Antiqueira, L.; Viana, M.P.; Correa Rocha, L.E. Analyzing and Modeling Real-World Phenomena with Complex Networks: A Survey of Applications. Adv. Phys. 2011, 60, 329–412. [Google Scholar] [CrossRef]
  26. Kim, S.; Shekhar, S.; Min, M. Contraflow Transportation Network Reconfiguration for Evacuation Route Planning. IEEE Trans. Knowl. Data Eng. 2008, 20, 1115–1129. [Google Scholar] [CrossRef]
  27. Rashid, N.U.; Chan, K.T. A Review on Transportation Network Based on Complex Network Approach. arXiv 2023, arXiv:2308.04636. [Google Scholar] [CrossRef]
  28. Háznagy, A.; Fi, I.; London, A.; Németh, T. Complex Network Analysis of Public Transportation Networks: A Comprehensive Study. In Proceedings of the 2015 International Conference on Models and Technologies for Intelligent Transportation Systems (MT-ITS), Budapest, Hungary, 3–5 June 2015; pp. 371–378. [Google Scholar]
  29. Francis, R.L.; Saunders, P.B. EVACNET: Prototype Network Optimization Models for Building Evacuation; Operations Research Division, Center for Applied Mathematics, National Bureau of Standards: Washington, DC, USA, 1979. [Google Scholar]
  30. Lee, J. 3D Data Model for Representing Topological Relations of Urban Features. In Proceedings of the 21st Annual ESRI International User Conference, San Diego, CA, USA, 9–13 July 2001. [Google Scholar]
  31. Weiss, A.; Williams, L.; MacGregor Smith, J. Performance & Optimization of M/G/c/c Building Evacuation Networks. J. Math. Model. Algorithms 2012, 11, 361–386. [Google Scholar]
  32. Donato, V. Towards Design Process Validation Integrating Graph Theory into BIM. Archit. Eng. Des. Manag. 2017, 13, 22–38. [Google Scholar] [CrossRef]
  33. Deng, H.; Ou, Z.; Zhang, G.; Deng, Y.; Tian, M. BIM and Computer Vision-Based Framework for Fire Emergency Evacuation Considering Local Safety Performance. Sensors 2021, 21, 3851. [Google Scholar] [CrossRef]
  34. Park, S.; Kim, S.Y.; Yu, K.; Kim, J.O. Indoor Network Generation Using Building Evacuation Maps. J. Korean Soc. Hazard Mitig. 2018, 18, 387–394. [Google Scholar] [CrossRef]
  35. Gupta, A.K.; Yadav, P.K. SAFE-R: A New Model to Study the Evacuation Profile of a Building. Fire Saf. J. 2004, 39, 539–556. [Google Scholar] [CrossRef]
  36. Fu, R.; Zhang, C.; Wang, Y.; Yue, Y.; Di Sarno, L. Building Layout Assessment on Fire Evacuation Efficiency by Integrating Graph Theory and Virtual Reality. J. Build. Eng. 2024, 98, 111498. [Google Scholar] [CrossRef]
  37. Hu, Y.; Liu, X. Optimization of Grouping Evacuation Strategy in High-Rise Building Fires Based on Graph Theory and Computational Experiments. IEEE/CAA J. Autom. Sin. 2018, 5, 1104–1112. [Google Scholar] [CrossRef]
  38. Li, J.J.; Zhu, H.Y. A Risk-Based Model of Evacuation Route Optimization under Fire. Procedia Eng. 2018, 211, 365–371. [Google Scholar] [CrossRef]
  39. Desmet, A.; Gelenbe, E. Graph and Analytical Models for Emergency Evacuation. In Proceedings of the 2013 IEEE International Conference on Pervasive Computing and Communications Workshops (PERCOM Workshops), San Diego, CA, USA, 18–22 March 2013; pp. 523–527. [Google Scholar]
  40. Mirahadi, F.; McCabe, B.Y. EvacuSafe: A Real-Time Model for Building Evacuation Based on Dijkstra’s Algorithm. J. Build. Eng. 2021, 34, 101687. [Google Scholar] [CrossRef]
  41. Gao, J.; He, J.; Gong, J. A Simplified Method to Provide Evacuation Guidance in a Multi-Exit Building under Emergency. Phys. A 2020, 545, 123554. [Google Scholar] [CrossRef]
  42. Kurdi, H.; Almulifi, A.; Al-Megren, S.; Youcef-Toumi, K. A Balanced Evacuation Algorithm for Facilities with Multiple Exits. Eur. J. Oper. Res. 2021, 289, 285–296. [Google Scholar] [CrossRef]
  43. Lovas, G.G. On the Importance of Building Evacuation System Components. IEEE Trans. Eng. Manag. 1998, 45, 181–191. [Google Scholar] [CrossRef]
  44. Zu, Y.; Dai, R. Distributed Path Planning for Building Evacuation Guidance. Cyber-Phys. Syst. 2017, 3, 1–21. [Google Scholar] [CrossRef]
  45. Shin, Y.; Moon, I. Robust Building Evacuation Planning in a Dynamic Network Flow Model under Collapsible Nodes and Arcs. Socio-Econ. Plan. Sci. 2023, 86, 86–101455. [Google Scholar]
  46. Ronchi, E.; Kuligowski, E.D.; Reneke, P.A. The Process of Verification and Validation of Building Fire Evacuation Models. Fire Technol. 2013, 1822, 1–23. [Google Scholar]
  47. Jullien, Q.; Dréan, V.; Wyzgolik, A.; Ntoung, J.Z.; Blouin, M.; Kabalan, B.; Gwynne, S.; Ganiyu, A.A.; Collin, A.; Pianet, G.; et al. Evacuation Modelling—Application to an Office Building Using Several Simulation Tools. In Proceedings of the Fire and Evacuation Modelling Technical Conference (FEMTC), Virtual, 9–11 September 2020. [Google Scholar]
  48. Henderson, L.F. The Statistics of Crowd Fluids. Nature 1971, 229, 381–383. [Google Scholar] [CrossRef]
  49. Helbing, D.; Vicsek, T. Optimal Self-Organization. New J. Phys. 1999, 1, 13. [Google Scholar] [CrossRef]
  50. Kirchner, A.; Schadschneider, A. Simulation of Evacuation Processes Using a Bionics-Inspired Cellular Automaton Model for Pedestrian Dynamics. Phys. A 2002, 312, 260–276. [Google Scholar] [CrossRef]
  51. Qiu, H.; Lin, X.; Qiao, Z. Effect of Different Time Step Sizes on Pedestrian Evacuation Time in Cellular Automaton Model. Fire 2024, 7, 100. [Google Scholar] [CrossRef]
  52. Liu, Y.; Li, J.; Sun, C. Cellular Automaton Model for Pedestrian Evacuation Considering Impacts of Fire Products. Fire 2023, 6, 320. [Google Scholar] [CrossRef]
  53. Helbing, D.; Molnár, P. Social Force Model for Pedestrian Dynamics. Phys. Rev. E 1995, 51, 4282–4286. [Google Scholar] [CrossRef]
  54. Zhang, J.; Zhu, J.; Dang, P.; Wu, J.; Zhou, Y.; Li, W.; Fu, L.; Guo, Y.; You, J. An Improved Social Force Model (ISFM)-Based Crowd Evacuation Simulation Method in Virtual Reality with a Subway Fire as a Case Study. Int. J. Digit. Earth 2023, 16, 1186–1204. [Google Scholar] [CrossRef]
  55. Christensen, K.; Sasaki, Y. Agent-Based Emergency Evacuation Simulation with Individuals with Disabilities in the Population. J. Artif. Soc. Soc. Simul. 2008, 11, 9. [Google Scholar]
  56. Cao, R.F.; Li, W.; Zhang, X. Development of a Fire-Integrated Agent-Based Indoor Evacuation Model: Radiation, Temperature, Gas Effects. Build. Environ. 2023, 229, 109812. [Google Scholar]
  57. Cao, S.; Zhang, J.; Lv, Z. A Weighted Network Approach for Evaluating Building Evacuation Efficiency: A Case Study of a Primary School Teaching Facility. Buildings 2025, 15, 2901. [Google Scholar] [CrossRef]
  58. Galea, E.R.; Lawrence, P.; Gwynne, S.; Filippidis, L.; Blackshields, D.; Cooney, D. buildingEXODUS V6.3 Technical Manual and User Guide; University of Greenwich: Greenwich, UK, 2013. [Google Scholar]
  59. Cuesta, A.; Ronchi, E.; Gwynne, S.M.; Kinsey, M.J.; Hunt, A.L.; Alvear, D. School Egress Data: Comparing the Configuration and Validation of Five Egress Modelling Tools. Fire Mater. 2016, 41, 535–554. [Google Scholar] [CrossRef]
  60. Cao, S.; Zhang, J. Research on the Functional Layout of Elementary School Building Based on the Perspective of Safe Evacuation. South Archit. 2024, 5, 58–69. [Google Scholar]
  61. GB 50016—2014; Code for Fire Protection Design of Buildings, 2018 ed. Ministry of Housing and Urban-Rural Development of the People’s Republic of China: Beijing, China, 2018.
  62. GB 55037—2022; General Code for Fire Protection of Buildings and Constructions. Ministry of Housing and Urban-Rural Development of the People’s Republic of China, State Administration for Market Regulation: Beijing, China, 2022.
Figure 1. (a) Weighted Network Analysis Process and Result Overview. (b1) Spatial Map: The architectural floor plan with clearly defined spatial nodes and boundaries; (b2) Network Map: The weighted network constructed based on the spatial layout; (b3) ES Map: The service range of each exit node, represented with distinct colors.; (b4) S C Map: The sensitivity distribution of Exit Capacity; nodes shown in deeper red indicate greater influence on the overall network.
Buildings 15 03560 g001
Figure 2. (a) Evacuation Simulation Model—(a1) The architectural plan is simplified into a grid-based model with cells of 0.5 m × 0.5 m, representing building space. (a2) After defining exit locations, the model automatically generates a spatial distribution map showing the distance from each grid cell to the nearest exit.; (b) Simulation-Based Results—(b1) Cumulative congestion distribution refers to aggregating high-density areas throughout the evacuation process. A congestion index can be calculated as follows: Congestion Index (CI, in m2·s) = Congested Area (CA, in m2) × Duration of congestion(s). (b2) Cumulative Route Choice captures the spatial selection behavior of evacuees during the entire evacuation process. It is used to identify frequently used paths and potential bottlenecks.
Buildings 15 03560 g002
Figure 3. Summary of Unit Organization Information by Case. Red rectangles represent staircases or safety exits, gray rectangles denote rooms, black line segments indicate corridor paths and connections, and gray dashed lines outline the unit boundaries.
Buildings 15 03560 g003
Figure 4. Process of Evacuation Performance Based on Spatial Organization.
Buildings 15 03560 g004
Table 1. Classification of statistical items by case 1.
Terminal LayoutInternal LayoutCentral LayoutOffset Layout
Elemental Composition 2Buildings 15 03560 i054Buildings 15 03560 i055Buildings 15 03560 i056Buildings 15 03560 i057
Unit Combination 3IsolatedIndirect Direct Hybrid
Buildings 15 03560 i058Buildings 15 03560 i059Buildings 15 03560 i060Buildings 15 03560 i061Buildings 15 03560 i062Buildings 15 03560 i063Buildings 15 03560 i064
1 Red rectangles indicate staircases or safety exits, gray rectangles represent rooms, black line segments denote corridor paths and connections, and black arrows indicate potential connections between units. 2 Four types of Elemental Composition are shown: Terminal Layout (exits distributed at both ends), Internal Layout (exits located within the unit), Central Layout (exits centrally clustered), and Offset Layout (exits asymmetrically placed at both ends and within the interior). 3 Four types of Unit Combination Patterns are illustrated: Isolated Mode (independent evacuation without connection), Indirect Connection Mode (units connected for daily use but evacuate separately), Direct Connection Mode (units share evacuation stairs and corridors with mutual impact), and Hybrid Connection Mode (a combination of direct and indirect evacuation paths).
Table 2. Formulas and definitions of evacuation weighted network indicators.
Equation   ( 1 )   Exit   Capacity   ( C k ) Equation     ( 2 )   Evacuation   Balance   Statistic   ( E B S ) Equation     ( 3 )   Exit   Capacity   Sensitivity   ( S C )
C k = 1 w k i k G w i ; w i = α i * β i E B S = a = 1 k C m C a k 1 C m S C i = 1 k a = 1 k C a , a f t e r C a , b e f o r e C a , b e f o r e
G : the subset of nodes served by exit k . w k : the weight coefficient of exit node   k . w i : the weight of node   i , representing its occupant capacity.
α i : the normalized area scale of node i . β i : the normalized occupant density of node i .
k : the number of evacuation exit nodes. C a : the Exit Capacity of the a -th exit node. C m : the maximum exit load across all exits, i.e., C = max C a k : the number of evacuation exit nodes. C a , b e f o r e : the Exit Capacity of exit a before the attack on node i .
C a , a f t e r : the Exit Capacity of exit a after the attack on node i , based on the updated evacuation paths.
Table 3. School information, drill process, and comparative validation results of evacuation exercises.
School Information(a1) Aerial view of the school(a2) Photo of the school building(a3) Site plan
Buildings 15 03560 i065Buildings 15 03560 i066Buildings 15 03560 i067
Example of the Drill Process (b1) Scene 1: Lower Group(b2) Scene 2: Middle Group(b3) Scene 3: Senior Group
Classroom MovementBuildings 15 03560 i068Buildings 15 03560 i069Buildings 15 03560 i070
Corridor MovementBuildings 15 03560 i071Buildings 15 03560 i072Buildings 15 03560 i073
Staircase MovementBuildings 15 03560 i074Buildings 15 03560 i075Buildings 15 03560 i076
Experiment–Simulation Comparison(c1) Scene 1 Evacuation time curve(c2) Scene 2 Evacuation time curve(c3) Scene 3 Evacuation time curve
Buildings 15 03560 i077Buildings 15 03560 i078Buildings 15 03560 i079
Note: a1–a3 present basic information about the participating school in the evacuation drills. b1–b3 illustrate the evacuation process of students from lower, middle, and upper grades across three spatial stages: Classroom, Corridor, and Staircase. White circles denote the starting and ending frames of an individual student’s movement along the marked path, which are used to extract travel time and calculate movement speed. c1–c3 display comparative curves of evacuation time between empirical drill data and simulation results for different student groups.
Table 4. Physical mobility data for elementary school students in China.
GroupBody MorphologyEvacuation Movement SpeedDriveMobilityAgilityResponsePatience
HeightWeightChestShoulderHorizontalStaircase (Down)Staircase (Up)
cmkgcmcmm/sDimensionlesss
LB129.828.962.429.61.82 (0.27)0.84 (0.14)0.60 (0.21)7–80.904–60–155–10
M140.236.067.731.51.99 (0.30)0.89 (0.13)0.64 (0.11)8–100.955–60–1010–15
H152.645.973.836.62.15 (0.36)0.94 (0.13)0.72 (0.20)10–111.006–70–510–15
LG128.526.959.829.61.65 (0.15)0.74 (0.08)0.59 (0.20)6–80.854–50–155–10
M140.134.165.531.51.76 (0.47)0.85 (0.07)0.61 (0.11)8–90.904–50–1010–15
H152.743.173.136.61.86 (0.23)0.90 (0.15)0.54 (0.11)9–100.955–60–510–15
Note: L for the lower group, M for the middle group, S for the Senior group; B for boys, G for girls. The parameters Drive, Mobility, and Agility are defined within the buildingEXODUS software; they represent, respectively: the individual’s competitiveness in congestion scenarios (Drive), variation in physical movement ability (Mobility), and capacity to negotiate obstacles (Agility). Values in parentheses indicate standard deviations.
Table 5. Summary of analytical results by case.
Spatial ItemsFrequency by Scale Category (in %)Total
SmallMediumLargeExtra-Large
Elemental CompositionElemental LayoutTerminal 6 (66.6)11 (84.6)24 (48.9)16 (51.6)57 (55.8)
Offset3 (33.3)2 (15.3)16 (32.6)9 (29.0)30 (29.4)
Central0 (0.0)0 (0.0)4 (8.1)1 (3.2)5 (4.9)
Internal0 (0.00)0 (0.0)5 (10.2)5 (16.1)10 (9.8)
Unit ScaleSmall Unit4 (44.4)3 (23.0)6 (12.2)1 (3.2)14 (13.7)
Medium Unit4 (44.4)7 (53.8)21 (42.8)12 (38.7)44 (43.1)
Large Unit1 (11.1)3 (23.0)22 (44.9)18 (58.0)44 (43.1)
Unit CombinationUnit Connection ModeIndirect5 (55.5)4 (30.7)14 (28.5)12 (38.7)35 (34.3)
Direct3 (33.3)5 (38.4)25 (51.0)10 (32.2)43 (42.1)
Hybrid0 (0.0)2 (15.3)6 (12.2)7 (22.5)15 (14.7)
Isolated1 (11.1)2 (15.3)4 (8.1)2 (6.4)9 (8.8)
Unit Count11 (11.1)0 (0.0)0 (0.0)0 (0.0)1 (0.9)
24 (44.4)3 (23.0)8 (16.3)3 (9.6)18 (17.6)
32 (22.2)5 (38.4)21 (42.8)6 (19.3)34 (33.3)
42 (22.2)3 (23.0)13 (26.5)12 (38.7)30 (29.4)
50 (0.0)2 (15.3)7 (14.2)10 (32.2)19 (18.6)
Total9134931102
Buildings 15 03560 i080Buildings 15 03560 i081Buildings 15 03560 i082Buildings 15 03560 i083
Note: Figures a–d respectively represent the percentage frequency distributions of different Elemental Layouts, Unit Scales, Unit Connection Modes, and Unit Counts across each Scale Category.
Table 6. Analysis results of elemental composition.
Model A: Terminal LayoutModel B: Internal LayoutModel C: Central LayoutModel D: Offset Layout
ModelBuildings 15 03560 i084Buildings 15 03560 i085Buildings 15 03560 i086Buildings 15 03560 i087
Network AnalysisES
Map
Buildings 15 03560 i088Buildings 15 03560 i089Buildings 15 03560 i090Buildings 15 03560 i091
C k E0: 14.2E1: 14.2E0: 14.2E1: 14.2E0: 14.2E1: 14.2E0: 7.3E1: 21.1
EBS0.000.000.000.66
S C MapBuildings 15 03560 i092Buildings 15 03560 i093Buildings 15 03560 i094Buildings 15 03560 i095
KeyExits and Exit-Connected Path NodesInterior Exit and Path Node
Evacuation SimulationPC Map(N)Buildings 15 03560 i096Buildings 15 03560 i097Buildings 15 03560 i098Buildings 15 03560 i099
T = 141 s (SD = 1.3); CA = 12.3 m2; CI = 588 m2·sT = 143 s (SD = 1.9); CA = 17.6 m2; CI = 1027 m2·sT = 142 s (SD = 1.5); CA = 14.2 m2; CI = 796 m2·sT = 182 s (SD = 1.4); CA = 15.6 m2; CI = 1669 m2·s
PC Map(E)Buildings 15 03560 i100Buildings 15 03560 i101Buildings 15 03560 i102Buildings 15 03560 i103
T = 224 s (SD = 3.5); ECR = 100% T = 145 s (SD = 1.6); ECR = 75.0%T = 147 s (SD = 1.2); ECR = 50.0%T = 92 s (SD = 1.1); ECR = 50.0%
CA = 15.4 m2; CI = 1801 m2·sCA = 9.2 m2; CI = 561 m2·sCA = 8.5 m2; CI = 282 m2·sCA = 0.5 m2; CI = 8 m2·s
Note 1: ES Map illustrates the service range of each exit node, represented with distinct colors. S C Map illustrates the sensitivity distribution of Exit Capacity. PC Map (Path and Congestion Map) illustrates cumulative congestion distribution by aggregating high-density areas and simultaneously captures the spatial selection behavior of evacuees throughout the evacuation process. N for Normal Scenario; E for Emergency Scenario. T: Average evacuation time over 5 simulation runs (with standard deviation).; ECR: Completion Rate of the Evacuation Occupant. Note 2: a1–d1 are schematic diagrams of different models, illustrating staircase locations and their connections; a2–d2 show the distribution of node ranges served by each exit; a3–d3 present the S C Map, where nodes shown in deeper red indicate greater influence on the overall network; a4–d4 depict congestion distributions under the Normal Scenario, with red areas marking congestion extent and duration; and a5–d5 depict congestion distributions under the Emergency Scenario, where red × marks indicate path breakpoints.
Table 7. Classification of unit combination patterns.
Mode
IsolatedIndirect Direct Hybrid
DimensionUnidirectionalBuildings 15 03560 i104Buildings 15 03560 i105Buildings 15 03560 i106——
BidirectionalBuildings 15 03560 i107Buildings 15 03560 i108Buildings 15 03560 i109Buildings 15 03560 i110
MultidimensionalBuildings 15 03560 i111Buildings 15 03560 i112Buildings 15 03560 i113Buildings 15 03560 i114
Note: Red rectangles represent staircases or safety exits, gray rectangles denote rooms, black line segments indicate direct corridor paths and connections, and black dashed lines represent potential corridor paths.
Table 8. Unidirectional connection dimension analysis.
Model A: IsolatedModel B: IndirectModel C: Direct
ModelBuildings 15 03560 i115Buildings 15 03560 i116Buildings 15 03560 i117
Network AnalysisES MapBuildings 15 03560 i118Buildings 15 03560 i119Buildings 15 03560 i120
C k E0E1E2E3E0E1E2E3E0E1E2
14.214.5 14.5 14.214.214.5 14.514.214.314.514.3
EBS0.020.020.01
S C MapBuildings 15 03560 i121Buildings 15 03560 i122Buildings 15 03560 i123
Key NodeInterior Exit and its connected Path Node
Evacuation Simulation PC Map
(N)
Buildings 15 03560 i124Buildings 15 03560 i125Buildings 15 03560 i126
T = 118 s (SD = 1.5); CA = 35.0 m2; CI = 1712 m2·sT = 116 s (SD = 1.7); CA = 29.8 m2; CI = 1253 m2·sT = 137 s (SD = 1.3); CA = 36.1 m2; CI = 2253 m2·s
PC Map
(E)
Buildings 15 03560 i127Buildings 15 03560 i128Buildings 15 03560 i129
T = 198 s (SD = 2.4); CA = 42.9 m2; CI = 4005 m2·sT = 190 s (SD = 1.9); CA = 33.1 m2; CI = 3337 m2·sT = 194 s (SD = 2.8); CA = 37.2 m2; CI = 4115 m2·s
Note 1: PC Map (N): Path and Congestion Map (Normal Scenario), (E) for Emergency Scenario; T: average evacuation time. Note 2: a1–c1 are schematic diagrams of different models, primarily illustrating staircase locations and their connections; a2–c2 show the distribution of node ranges served by each exit; a3–c3 present the S C Map, where nodes shown in deeper red indicate greater influence on the overall network; a4–c4 depict congestion distributions under the simulated Normal Scenario, with red areas marking congestion extent and duration; and a5–c5 depict congestion distributions under the simulated Emergency Scenario, where red × marks indicate path breakpoints.
Table 9. Bidirectional connection dimension analysis.
Model A: IsolatedModel B: IndirectModel C: DirectModel D: Hybrid
ModelBuildings 15 03560 i130Buildings 15 03560 i131Buildings 15 03560 i132Buildings 15 03560 i133
Network AnalysisES
Map
Buildings 15 03560 i134Buildings 15 03560 i135Buildings 15 03560 i136Buildings 15 03560 i137
C k E0E1E2E3E0E1E2E3E0E1E0E1E2
14.514.514.514.514.714.714.714.714.714.721.67.821.6
EBS0.000.000.000.32
S C MapBuildings 15 03560 i138Buildings 15 03560 i139Buildings 15 03560 i140Buildings 15 03560 i141
KeyExits and Exit-Connected Path NodesCo-Exit
Evacuation SimulationPC Map
(N)
Buildings 15 03560 i142Buildings 15 03560 i143Buildings 15 03560 i144Buildings 15 03560 i145
T = 120 s(SD = 1.2); CA = 29.0 m2; CI = 1217 m2·sT = 118 s (SD = 1.6); CA = 29.3 m2; CI = 1219 m2·sT = 165 s (SD = 1.8); CA = 28.5 m2; CI = 2118 m2·sT = 147 s (SD = 1.5); CA = 31.0 m2; CI = 1889 m2·s
PC Map
(E)
Buildings 15 03560 i146Buildings 15 03560 i147Buildings 15 03560 i148Buildings 15 03560 i149
T = 193 s (SD = 2.9); CA = 35.0 m2; CI = 2660 m2·sT = 198 s (SD = 3.3); CA = 28.5 m2; CI = 2422 m2 sT = 217 s (SD = 4.1); CA = 28.2 m2; CI = 3121 m2·sT = 201 s (SD = 3.7); CA = 32.5 m2; CI = 3231 m2·s
Note: a1–d1 are schematic diagrams of different models, primarily illustrating staircase locations and their connections; a2–d2 show the distribution of node ranges served by each exit; a3–d3 present the S C Map, where nodes shown in deeper red indicate greater influence on the overall network; a4–d4 depict congestion distributions under the simulated Normal Scenario, with red areas marking congestion extent and duration; and a5–d5 depict congestion distributions under the simulated Emergency Scenario, where red × marks indicate path breakpoints.
Table 10. Multidimensional connection dimension analysis.
Model A: IsolatedModel B: IndirectModel C: DirectModel D: Hybrid
ModelBuildings 15 03560 i150Buildings 15 03560 i151Buildings 15 03560 i152Buildings 15 03560 i153
Network AnalysisES
Map
Buildings 15 03560 i154Buildings 15 03560 i155Buildings 15 03560 i156Buildings 15 03560 i157
C k E0E1E2E3E0E1E2E3E0E1E0E1E2
14.214.214.214.215.114. 815.314.614.614.614.515.214.9
EBS0.000.030.000.03
S C MapBuildings 15 03560 i158Buildings 15 03560 i159Buildings 15 03560 i160Buildings 15 03560 i161
KeyExits and Exit-Connected Path NodesCo-Exit
Evacuation SimulationPC Map
(N)
Buildings 15 03560 i162Buildings 15 03560 i163Buildings 15 03560 i164Buildings 15 03560 i165
T = 116 s (SD = 1.1); CA = 29.6 m2; CI = 1394 m2·sT = 117 s (SD = 1.6); CA = 29.9 m2; CI = 1319 m2·sT = 168 s (SD = 2.3); CA = 36.8 m2; CI = 3079 m2·sT = 141 s (SD = 1.8); CA = 32.4 m2; CI = 1818 m2·s
PC Map
(E)
Buildings 15 03560 i166Buildings 15 03560 i167Buildings 15 03560 i168Buildings 15 03560 i169
T = 194 s (SD = 3.2); CA = 33.4 m2; CI = 3237 m2·sT = 167 s (SD = 3.8); CA = 34.7 m2; CI = 2591 m2·sT = 174 s (SD = 3.4); CA = 37.2 m2; CI = 2706 m2·sT = 142 s (SD = 2.9); CA = 27.6 m2; CI = 1652 m2·s
Note: a1–d1 are schematic diagrams of different models, primarily illustrating staircase locations and their connections; a2–d2 show the distribution of node ranges served by each exit; a3–d3 present the S C Map, where nodes shown in deeper red indicate greater influence on the overall network; a4–d4 depict congestion distributions under the simulated Normal Scenario, with red areas marking congestion extent and duration; and a5–d5 depict congestion distributions under the simulated Emergency Scenario, where red × marks indicate path breakpoints.
Table 11. Comparative simulation results of unit organization types.
Evacuation Time CurveComparison of Eva-Times 1,2Comparison of Congestions 1,2
Elemental compositionBuildings 15 03560 i170Buildings 15 03560 i171Buildings 15 03560 i172
Units CombinationUnidirectionalBuildings 15 03560 i173Buildings 15 03560 i174Buildings 15 03560 i175
BidirectionalBuildings 15 03560 i176Buildings 15 03560 i177Buildings 15 03560 i178
MultidimensionalBuildings 15 03560 i179Buildings 15 03560 i180Buildings 15 03560 i181
1 Relative value is calculated as (Data B − Data A) / Data B × 100%. 2 The Baseline data curve represents the relative values of other models compared to Model A, while the N/E Variation data curve indicates the differences between the Emergency Scenario and the Normal Scenario for a given model.
Table 12. Summary of correlations between spatial configuration and evacuation efficiency.
TypeModelEvacuation CharacteristicsEvaluation
Structural FeaturesNormal EfficiencyCongestion PerformanceEmergency Stability
Elemental compositionTerminalBuildings 15 03560 i182Symmetrical●●●●●●●●●●●●●●●●
Highest efficiency; balanced paths; low congestion; full evacuation; stable routes.
InternalBuildings 15 03560 i183Symmetrical●●●○●●○○●●○○●●●○
Balanced in normal conditions; terminal areas fail after attack due to central exits.
CentralBuildings 15 03560 i184Symmetrical●●●○●○○○●○○○●○○○
Single-sided cul-de-sac corridors serve many classrooms; path-node attacks affect large areas; concentrated exits cause congestion.
OffsetBuildings 15 03560 i185Imbalance●●●○●●○○●○○○●●○○
Marked imbalance; attacks on central exits have the greatest impact.
Units Connection DimensionUnidirectionalIndirectBuildings 15 03560 i186Symmetrical●●●●●●●○●●●●●●●○
Good balance; room loads redistributed to other exits; high stability.
DirectBuildings 15 03560 i187Symmetrical●●○○●●○○●●○○●●●○
Heavy load on shared exits; severe impact if attacked; large balance variation.
BidirectionalIndirectBuildings 15 03560 i188Symmetrical●●○○●●●●●●○○●●●○
More stable than independent networks; room loads dispersed to adjacent exits.
DirectBuildings 15 03560 i189Symmetrical●○○○●○○○●●○○●●○○
Symmetrical; few exit nodes; public exit attacks cause severe impact.
HybridBuildings 15 03560 i190Asymmetry●●○○●●●○●●●●●●●○
Combines indirect and direct evacuation features; with optimized path guidance, time, routes, and congestion perform best.
MultidimensionalIndirectBuildings 15 03560 i191Symmetrical
Balanced
●●●●●●●○●●○○●●●○
Symmetrical; good balance; sufficient path diversion with strong effect.
DirectBuildings 15 03560 i192Symmetrical
Balanced
●●○○●○○○●●○○●●○○
Symmetrical; few exits; attacks on shared exits and adjacent path nodes cause severe impact.
HybridBuildings 15 03560 i193Asymmetry●●●●●●●○●●●●●●●●
Redundant safety paths; stable balance index; flexible mesh-like evacuation with good diversion.
Note: Black solid circles (●) indicate better performance, while black hollow circles (○) indicate poorer performance.
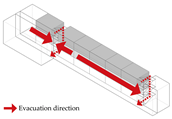
Table 13. Design checklist based on evacuation optimization.
Integrity1Check the internal organization of unit elements and ensure sufficient internal exits.
2Analyze inter-unit connections and consider the overall characteristics of the path system.
3Verify room-to-exit connections to ensure the possibility of bidirectional evacuation.
4Inspect terminal rooms and avoid excessively long single-direction corridors.
Balance5Evaluate the relationship among exit quantity, location, and paths, considering distance and balance.
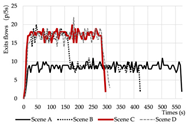
6Verify the relationship between exit widths and the distribution of functional rooms.
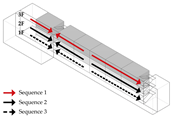
7Ensure occupant loads are relatively balanced across exits to prevent overloading a single exit.
Stability8Assess whether evacuation can still be completed if certain paths fail.
9Analyze redundant evacuation routes and ensure their accessibility.
Table 14. Optimized design analysis of the primary school practice project.
(A) Initial Scheme(B) Optimized Scheme
ModelBuildings 15 03560 i194Buildings 15 03560 i195
PlanBuildings 15 03560 i196Buildings 15 03560 i197
EBS AnalysisBuildings 15 03560 i198Buildings 15 03560 i199
EBS = 0.34EBS = 0.23
PC MapBuildings 15 03560 i200Buildings 15 03560 i201
T = 321 s (SD = 5.7); CA = 107.3 m2; CI = 18,115 m2·sT = 254 s (SD = 4.3); CA = 78.8 m2; CI = 10,639 m2 s
Note: EBS Analysis visualizes the impact on evacuation balance when individual nodes are attacked; values range from 0 to 1.0. A redder color denotes a lower balance, which helps assess and compare the performance of different design schemes. Compared with b2, the major path nodes in a2 appear in deeper red, indicating that the overall balance level of Scheme A is lower than that of Scheme B.
Disclaimer/Publisher’s Note: The statements, opinions and data contained in all publications are solely those of the individual author(s) and contributor(s) and not of MDPI and/or the editor(s). MDPI and/or the editor(s) disclaim responsibility for any injury to people or property resulting from any ideas, methods, instructions or products referred to in the content.