Article

Research on the Fatigue Reliability of a Catenary Support Structure Under High-Speed Train Operation Conditions

School of Civil Engineering, Zhengzhou University, Zhengzhou 450001, China
*
Author to whom correspondence should be addressed.
Buildings 2025, 15(19), 3542; https://doi.org/10.3390/buildings15193542
Submission received: 27 August 2025 / Revised: 21 September 2025 / Accepted: 29 September 2025 / Published: 1 October 2025
(This article belongs to the Special Issue Buildings and Infrastructures under Natural Hazards)

Abstract

As the core component of electrified railway power supply systems, the fatigue performance and reliability of catenary support structures are directly related to the operational safety of high-speed railways. To address the problem of structural fatigue damage caused by increasing train speed and high-frequency operation, this study develops a refined finite element model including a support structure, suspension system and support column, and the dynamic response characteristics and fatigue life evolution law under train operation conditions are systematically analyzed. The results show that under the conditions of 250 km/h speed and 100 times daily traffic, the fatigue lives of the limit locator and positioning support are 43.56 years and 34.48 years, respectively, whereas the transverse cantilever connection and inclined cantilever have infinite life characteristics. When the train speed increases to 400 km/h, the annual fatigue damage of the positioning bearing increases from 0.029 to 0.065, and the service life is shortened by 55.7% to 15.27 years, which proves that high-speed working conditions significantly aggravate the deterioration of fatigue in the structure. The reliability analysis based on Monte Carlo simulation reveals that when the speed is 400 km/h and the daily traffic is 130 times, the structural reliability shows an exponential declining trend with increasing service life. If the daily traffic frequency exceeds 130, the 15-year reliability decreases to 92.5%, the 20-year reliability suddenly decreases to 82.4%, and there is a significant inflection point of failure in the 15–20 years of service. Considering the coupling effect of environmental factors (wind load, temperature and freezing), the actual failure risk may be higher than the theoretical value. On the basis of these findings, engineering suggestions are proposed: for high-speed lines with a daily traffic frequency of more than 130 times, shortening the overhaul cycle of the catenary support structure to 7–10 years and strengthening the periodic inspection and maintenance of positioning support and limit locators are recommended. The research results provide a theoretical basis for the safety assessment and maintenance decision making of high-speed railway catenary systems.

1. Introduction

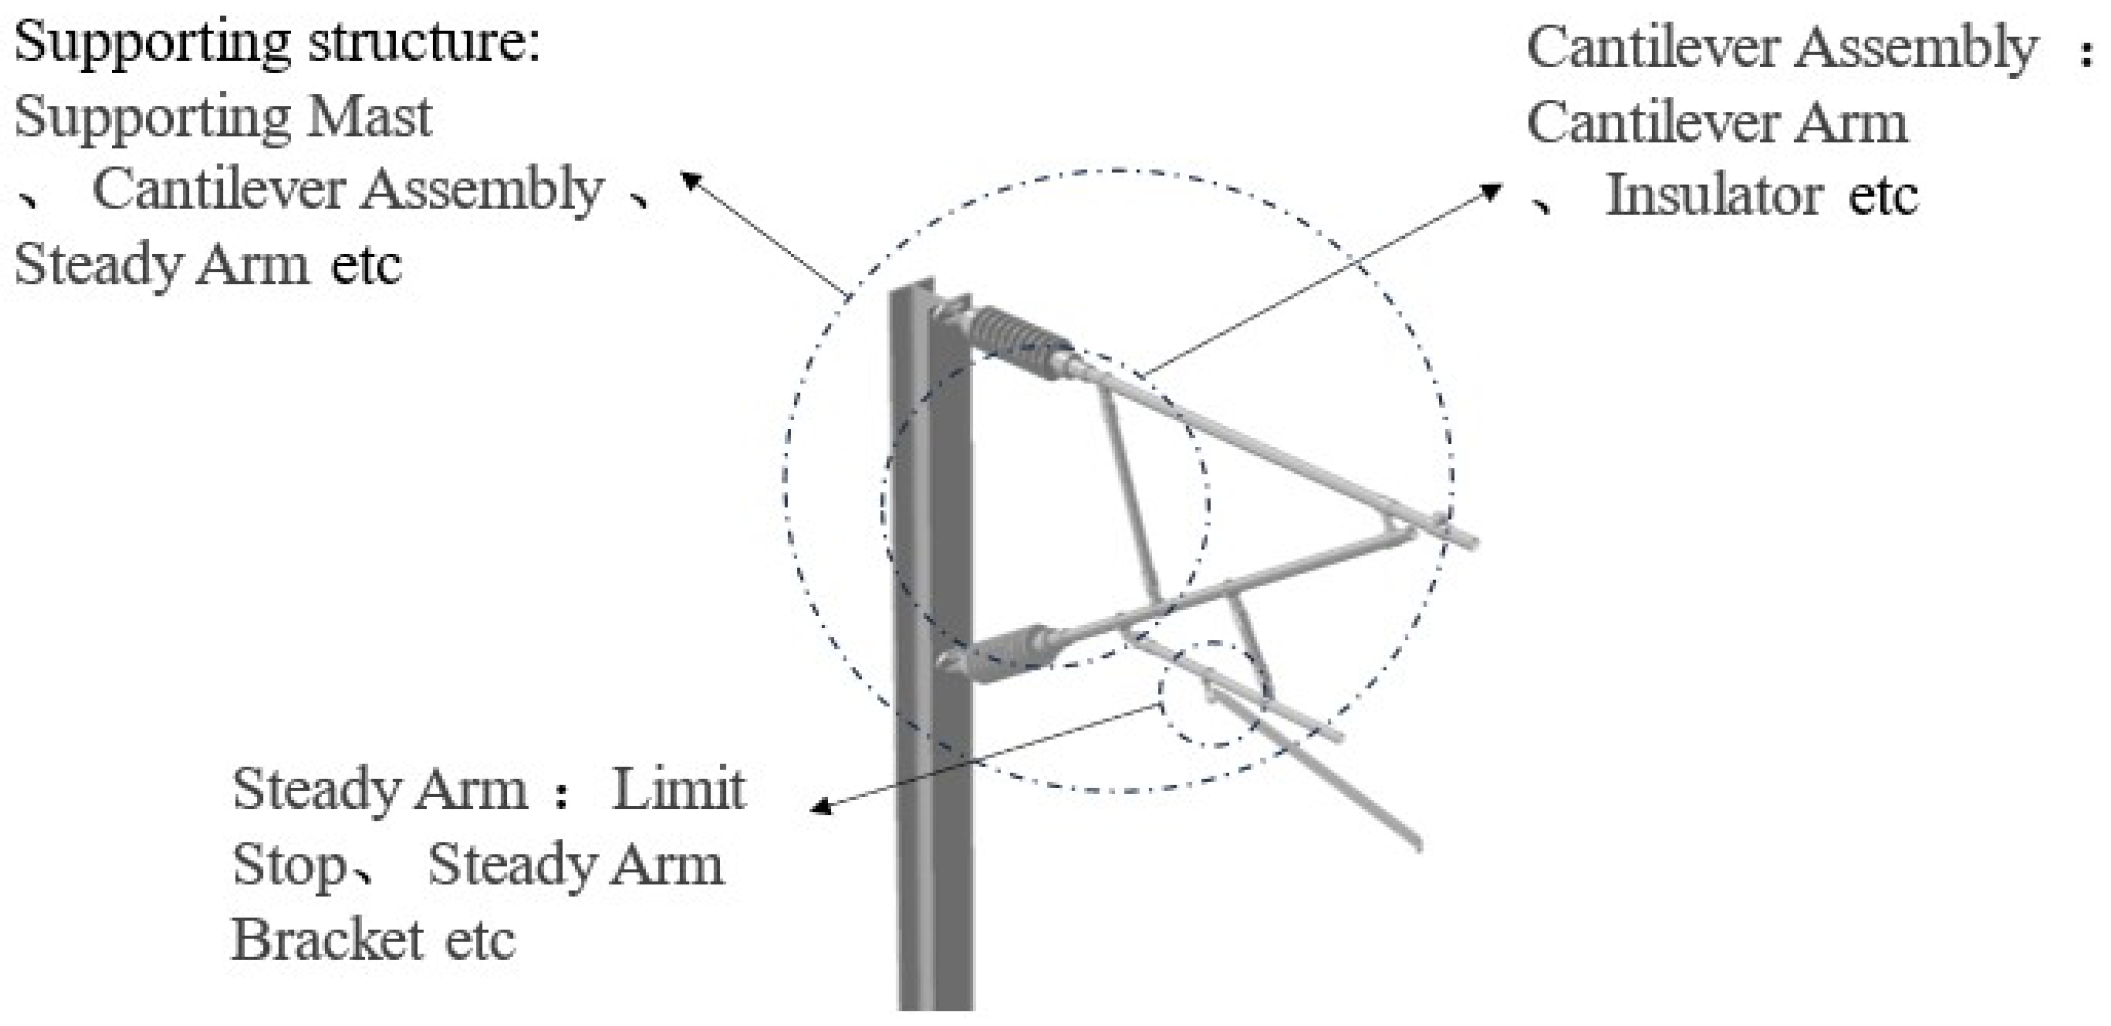
The catenary system (Figure 1) provides stable electrical energy for the train pantograph, and its importance is self-evident. The engineering structure of the catenary system is composed of a pillar system, support components, a positioning device, a suspension system, and other core modules. The suspension system includes a bearing cable, contact wire, suspension components, and their connecting parts [1]. As the core structure to ensure the normal operation of the system and the safe power collection of the train, the catenary support system includes a number of key components, such as pillars, cantilevers, and positioning devices, as shown in Figure 2. As the supporting framework of the whole device, the pillar bears the weight from the overhead contact system and other related components and transmits these loads to the foundation and subgrade. The cantilever is an important component connecting the pillar and the catenary line, which is mainly responsible for positioning and supporting the catenary line and the catenary line to ensure its accurate position in space to meet the good current collection requirements of the pantograph. The positioning device can accurately fix the lateral position of the contact wire, prevent excessive lateral offset of the contact wire during train operation, and ensure reliable contact between the pantograph and the contact wire.
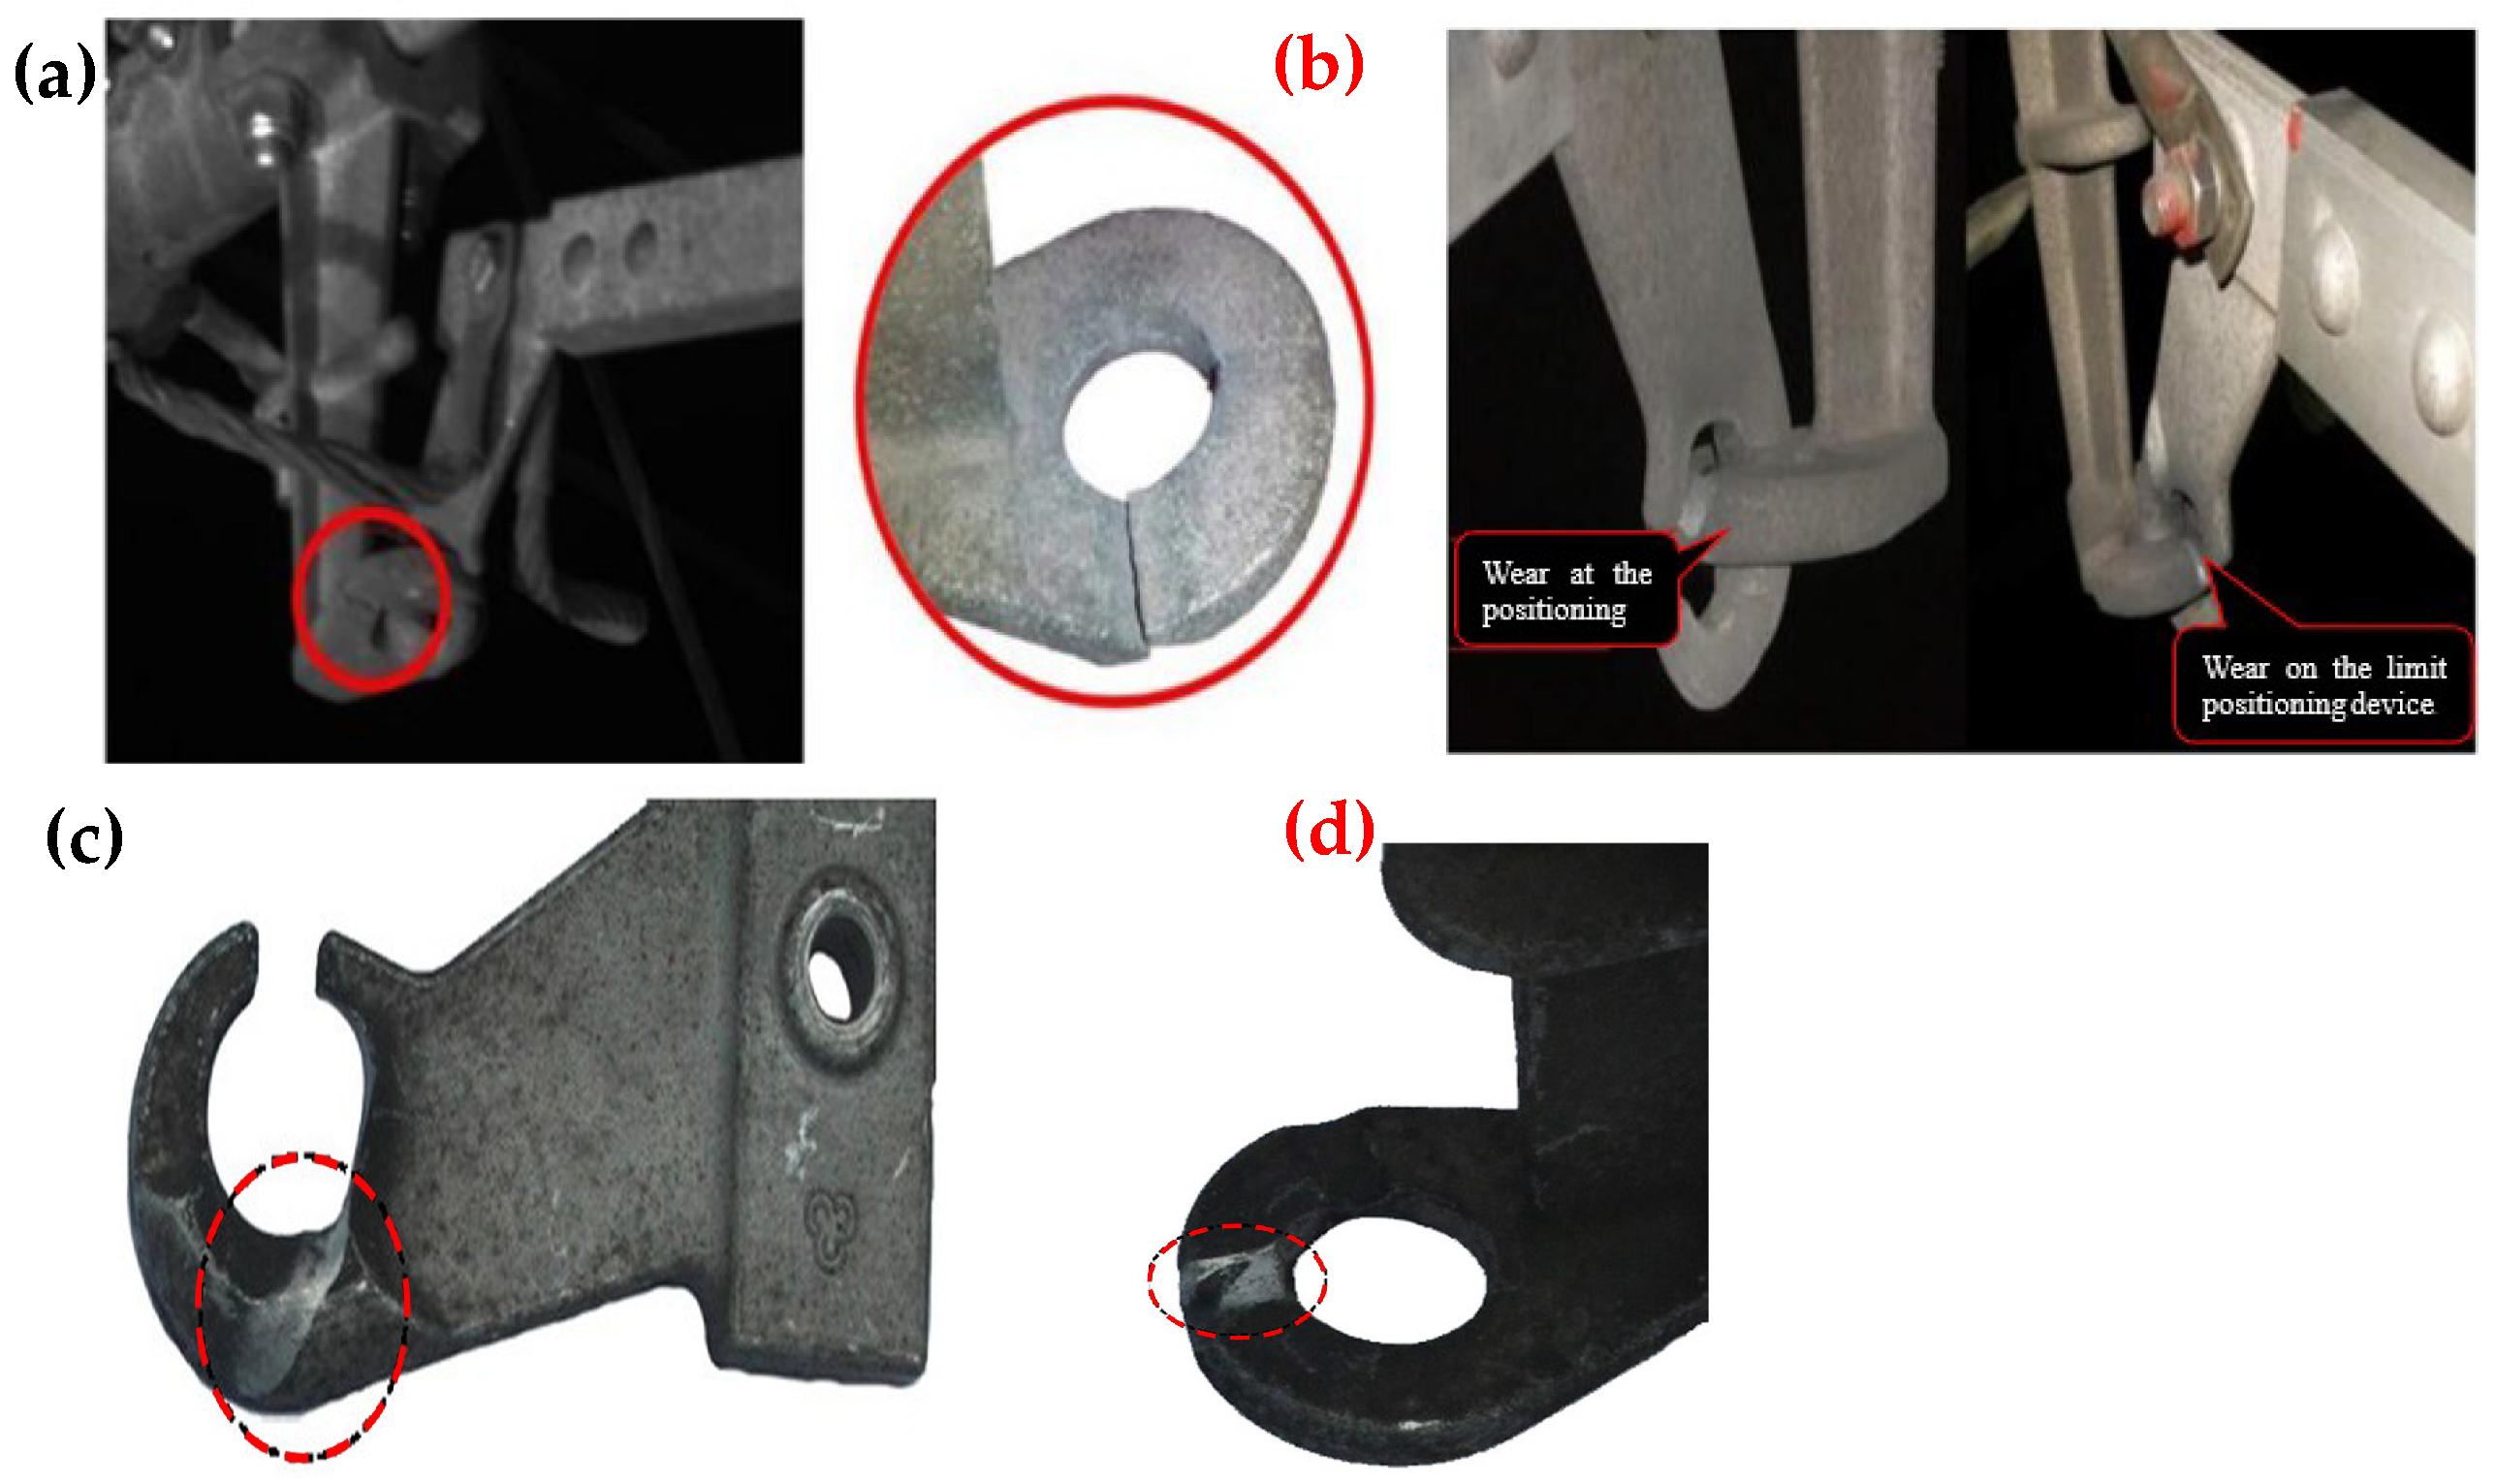
In recent years, high-speed railway catenary support structure fracture accidents have occurred frequently [2], as shown in Figure 3, which severely affects the safe operation of high-speed railways. With the continuous improvement in the operation speed of high-speed railways and the increasing expansion of high-speed railway networks to complex terrain areas, the threat of vibration generated by high-speed train operation and complex environmental conditions to the stress safety and working reliability of catenary support structures is further highlighted. Therefore, it is necessary to conduct in-depth research on the catenary support structure of high-speed railways to understand its response characteristics and fatigue resistance under complex vibration loads, which has important theoretical guidance for the scientific design and daily maintenance of the catenary support structure and has great practical significance for ensuring the safe and efficient operation of electrified railways and promoting the sustainable development of the railway industry.
In the modern rail transit sector, fatigue failure issues in the auxiliary structures of high-speed railways have garnered significant attention within the engineering community. Wang et al. [3] studied the fatigue performance and life prediction of high-speed railway concrete under fatigue and environmental damage. The results show that the fatigue life of concrete decreases with increasing stress levels and frequencies. At a stress level of 0.55 or lower, the samples can endure more than 2 million cycles, and the model predictions match the experimental results well below 0.60. At the 0.7 stress level, if the frequency exceeds 25 Hz, the fatigue life is less than 300 cycles. The fatigue life also decreases linearly with performance damage, and cracks reduce it because of stress concentration. Yin et al. [4] studied the establishment of load spectra for high-speed train bogie frames to improve fatigue reliability. They calculated Pearson correlation coefficients among 15 loads, divided them into three subsystems, and established a test load spectrum considering the load amplitude, frequency, phase, and sequence. The spectrum had a high prediction accuracy, with 80% of the measuring points having a stress ratio of 0.9–1.3. After damage-consistency calibration, the prediction accuracy was further enhanced. Wang et al. [5] studied heavy-haul railway tunnel base structures under train–groundwater coupling via field tests and simulations. The results validate the model, show the 0–5 Hz load frequency, and reveal that groundwater affects the base’s stress state. Water in the base reduces vertical displacement/acceleration, increases the principal stress, and shortens the inverted arch’s fatigue life by 21.07% (grade—IV) and 29.28% (grade—V). Qian et al. [6] studied metro tunnel structural fatigue under high-speed railway loads. They simplified the dynamic load, chose the experimental sinusoidal wave, and found the most unfavorable positions. Gypsum simulated segmental linings for fatigue evaluation. Tests matched simulations, showing that the tunnel meets the 120-year requirement. No fatigue failure occurred, but the standard model had displacement issues that needed attention. Xiang et al. [7] studied the failure of a section insulator’s support rod in urban rail systems. The rod, made of AISI-304/L/C steel, had no defects. Its failure was due to high-cycle fatigue, starting at a stress-concentrated edge. Arc-discharge-induced cracks help initiate fatigue cracks, and the alternating load arises from changes in the train direction and pantograph–insulator interactions. Peng et al. [8] studied the fatigue of railway bogie frames. An innovative method determines their fatigue life while considering track and wheel issues and predicting wear limits. A coupled model is built and verified. The dynamic stress of the bogie frame is studied, and a stress-spectrum-compiling method considering wheel wear is proposed. Stress spectra are used to analyze the impact on fatigue life, and a 0.034 mm wear limit for 24th-order wheel polygons in high-speed trains is set. This benefits bogie frame safety and railway system maintenance. Sunar and Fletcher [9] studied the effects of arcs on copper–silver contact wires. The arc-damaged wires had a 50% shorter fatigue life, especially on the tensile surface. Arc discharge damaged the wire, accelerating fatigue. In contrast, when bending with arcing, fatigue limits the lifespan. Fatigue can be a controlling failure factor, so it should be considered in design and maintenance. Wang and Ma [10] derived a stochastic dynamic damage constitutive model for high-speed railway tunnels and base concrete. After verification, they analyzed the defective structures. The model reflects the properties of the concrete. Seams increase vibration, and groundwater worsens damage. The current design parameters meet anti-fatigue needs without seams but not with seams (56 years of life with groundwater, 62 years without). Dou et al. [11] studied high-speed trains’ cast aluminum beam fatigue via simulations and experiments. They proposed a method for calculating the stress concentration factor and carried out a 10-million-cycle test with no cracks found. The FE model was accurate. The supporting seat filet had the maximum stress concentration (KD = 2.45), and the beam fatigue limit (35.4 MPa) exceeded the simulated maximum stress, meeting service life needs. Xu et al. [12] studied the contact wire at the steady arm in high-speed railway catenaries. They obtained a material model via a uniaxial test and built and validated models. The top and wing points were the weakest. A comparison of the models revealed beam element limits. Fatigue tests produced an S–N curve. The fatigue life decreased by approximately 50% from 350 to 400 km/h. Test results can help assess service life. Reference [13] indicated that fatigue failure is one of the primary failure modes in catenary system malfunctions and structural damage. During train operations, the catenary support structures are continuously subjected to complex cyclic loading, making them highly susceptible to fatigue damage. Tan et al. [14] aimed to advance the development of high-speed catenary equipment technology and conducted field investigations to analyze and summarize five typical failure issues and their root causes. They also reviewed the current research status of related failure mechanisms and proposed future research directions. Qi et al. [15] studied the fatigue load spectrum and life assessment of critical components in high-speed railway catenary systems. They developed a pantograph–catenary coupling model to calculate contact forces, used finite element analysis (FEA) to extract the load histories of key components, and applied the rainflow counting method to compile fatigue load spectra. Their results revealed that train speed significantly affects fatigue life, with steady arms exhibiting the shortest lifespan. Geng [16] investigated the aerodynamic fatigue effects of 400 km/h tunnel wind on catenary supports and proposed a wind load conversion method based on numerical simulations of tunnel wind characteristics. They established FEA models to analyze structural strength and fatigue under aerodynamic loads. Zhang [17] focused on the fatigue performance of H-shaped steel mast base welds under wind loads and validated FEA models to identify hot-spot stress locations and calculate fatigue life via stress–life (S–N) curves. Song et al. [18] analyzed the impact of stochastic wind fields on catenary fatigue by simulating pulsating wind time histories, deriving aerodynamic forces, and combining rainflow counting with the Goodman line correction to estimate fatigue life and identify vulnerable regions (e.g., midspan contact lines). Liu [19] conducted fatigue studies on elastic hangers through dynamic vibration simulations and refined FEA models, quantifying stress amplitudes and predicting fatigue life across operational speed ranges. Additionally, Liu et al. [20] addressed premature failure of integrated droppers, attributing it to stress concentration at crimped ends caused by bending fretting fatigue. Their solution involved optimizing crimping models and measurement protocols, validated by fatigue tests to extend service life by 30%. These studies collectively advance methodologies for fatigue analysis, emphasizing load spectrum generation, multiphysics modeling, and design optimization in high-speed catenary systems. Patel et al. [21] assessed the remaining fatigue life of a steel railway bridge via stress–life and fracture mechanics methods. Using STAAD Pro V8i for 25T-2008 loading simulations at various speeds, they reported that the remaining life decreases with increasing speed at a constant GMT. A 5-MPa stress band is more accurate. The fracture approach is conservative, and the method difference is more stable at this stress band. Their approach is effective for old steel railway bridge assessments. Al-Karawi’ et al. [22] explored the mean stress effect on HFMI-treated welded parts of railway steel bridges. Using training data and Eurocode models, they reported that λHFMI is larger for shorter bridges. Single-train bridges can use R ratios for the mean stress. Eurocode’s single-vehicle models are inaccurate, but the light traffic mix is better. λHFMI expressions are vital for design. After bridge erection, self-weighting does not affect the HFMI-induced residual stress. Further research on λHFMI and the maximum allowable stress is needed. Verdenius et al. [23] used Dutch railway axle load data (2012–2019) to assess bridge fatigue. The EN 1991-2 [24] Annex D model was often conservative but not always conservative. Three new models were developed: Model I (equivalent axle load), Model II (annual summed mass), and Model III (historic traffic). They better represent real-world fatigue loads, with lower variation and higher reliability. The key factors include the equivalent axle load and train type. However, there are uncertainties in dynamic amplification and influence line models and a lack of riveted connection test data. Correia et al. [25] studied the fatigue strength of riveted railway bridge joints. LR and OR were used for S–N curve fitting; the slope B of the OR was relatively large, and different fatigue lives were predicted, especially in the high-cycle regime. In the stochastic analysis, the Gumbel distribution had the highest fatigue strength, whereas the Weibull distribution had the lowest. Regression methods had little impact on the fatigue life, and constant exponents led to increased strength. There was less stochastic analysis with the Weibull model than with the CFC model, etc., and a constant exponent was closer to the CFC. Simultaneously, emerging innovative measurement methodologies aim to improve the accuracy of structural monitoring and model validation. Gogolik et al. [26] introduced a novel distortion measurement technique, highlighting the potential of vision-based systems to generate high-resolution, detailed data for calibrating numerical models and monitoring structural health under real operational conditions. In recent years, high-resolution vision-based measurement technologies have gradually matured. Integrating this type of data into the processes of model calibration and predictive analysis can effectively reduce the uncertain factors within models. As a result, the reliability of predictive outcomes for structural health monitoring can be significantly enhanced.
Traditional fatigue life analysis relies on deterministic parameter assumptions, predicting structural failure cycles through S–N curves and Miner’s rule. However, it fails to quantify uncertainties such as scatter in material properties, randomness in load amplitudes, and environmental variations, which may lead to unconservative fatigue life assessment results. Some researchers have conducted studies on the fatigue reliability of auxiliary structures in high-speed railways. Lu et al. [27] developed a time-dependent fatigue reliability method for heavy-haul railway steel bridges. It has a stress range model and an improved outcrossing rate method. Tests on a real bridge show that the method works well. Increasing axle weight or operation frequency lowers bridge reliability; a small axle weight and high frequency are optimal for reliability and freight needs. Li et al. [28] proposed a fatigue reliability analysis method for high-speed train motor hangers. They built a model, used Bayesian updating to reduce uncertainty, and applied subset simulation to calculate failure probability. The P-S-N curve and P0 choice mattered, and the method was more efficient than the Monte Carlo simulation. Hu et al. [29] proposed a dynamic fatigue reliability method for contact wires on the basis of high-speed pantograph–catenary dynamic simulations. By developing a finite element model to calculate stress time histories, applying the rainflow counting method to analyze stress cycles, and establishing a fatigue reliability model, they derived the time-dependent reliability curve of the contact wire, which illustrates how fatigue reliability decreases with operational time. Tawfik et al. [30] reviewed rail wheel RCF research. Hertz theory has limits in stress prediction. The fatigue crack life has three stages. Bending, shear, etc., stresses cause rail failure. Common defects have specific causes. Multiple factors affect cracks. Rail grinding, high-strength materials, and reprofiling can reduce RCF defects. Rao, K.B. [31] presented a data-driven probabilistic fatigue assessment method. Taking the eyebar assembly of the Harahan Bridge as an example, it quantifies safety under uneven load distributions caused by boundary changes. The method considers the coupling of fatigue and eyebar tautness. The results show that component failure under the brittle failure assumption is equivalent to system failure, and the impact of realignment on reliability is evaluated. Railway equipment reliability is key for design/maintenance. For TGV prestressed screwed connections, Chateauneuf A. et al. [32] proposed a reliability-based fatigue design and assessment method to address loading variations from tunnel pressure waves and material strength uncertainties. A fatigue reliability index equation is formulated to evaluate vehicle body reliability under fluctuating tunnel pressures, considering the pressure distribution, fatigue strength characteristics, and stress-transfer functions from pressure loads. This methodology balances cost/reliability and assesses fatigue, corrosion, and imperfect maintenance, including the lifecycle, deterioration, and uncertainties. The results show that connections are sensitive to friction/tightening/prestressing variations despite high load resistance, indicating robustness in operational/maintenance contexts. In summary, current research on the fatigue life and fatigue reliability of auxiliary structures in high-speed railways has achieved notable progress. However, research on long-term cumulative fatigue damage in catenary support systems under coupled complex loads such as dynamic train forces, wind, and temperature variations remains limited. The existing studies have several limitations: some focus solely on single load types—Zhang [17] focused on wind load alone with ≤2 × 10⁶ cycles; Song et al. [18] explored wind-induced fatigue over a 50-year life span without train loads; and Qi et al. [13] studied the pantograph–catenary system in isolation for a 120-year life cycle, excluding wind and icing effects. Other studies lack long-term cumulative damage analysis. Geng et al. [16] investigated aerodynamic loads inside tunnels through a one-day simulation, ignoring repeated traffic cycles. The present paper therefore closes this gap by propagating the full traffic–wind–thermal load spectrum through a 20-year damage accumulation and time-dependent reliability framework. Additionally, there is insufficient understanding of the inherent scatter in the material parameters of catenary supports and stochastic external excitations (e.g., train traffic frequency and speed) in real-world service environments. As high-speed trains continue to operate at increasing speeds and railway networks expand, accurately understanding the generation mechanisms and action patterns of operational loads and further investigating their impacts on catenary support structures are critical to ensuring safe and reliable train operations and enabling scientific maintenance of railway infrastructure. In this study, we apply fatigue reliability theory to construct probabilistic limit state equations for catenary support structures. Key variables such as critical damage thresholds, equivalent stress amplitudes, and S–N curve parameters are treated as stochastic processes. By employing Monte Carlo simulations, we quantify the exceedance probability of cumulative fatigue damage, providing a more realistic reflection of time-dependent failure risks in these structures.

2. Analysis of Loads and Actions Caused by High-Speed Train Operation

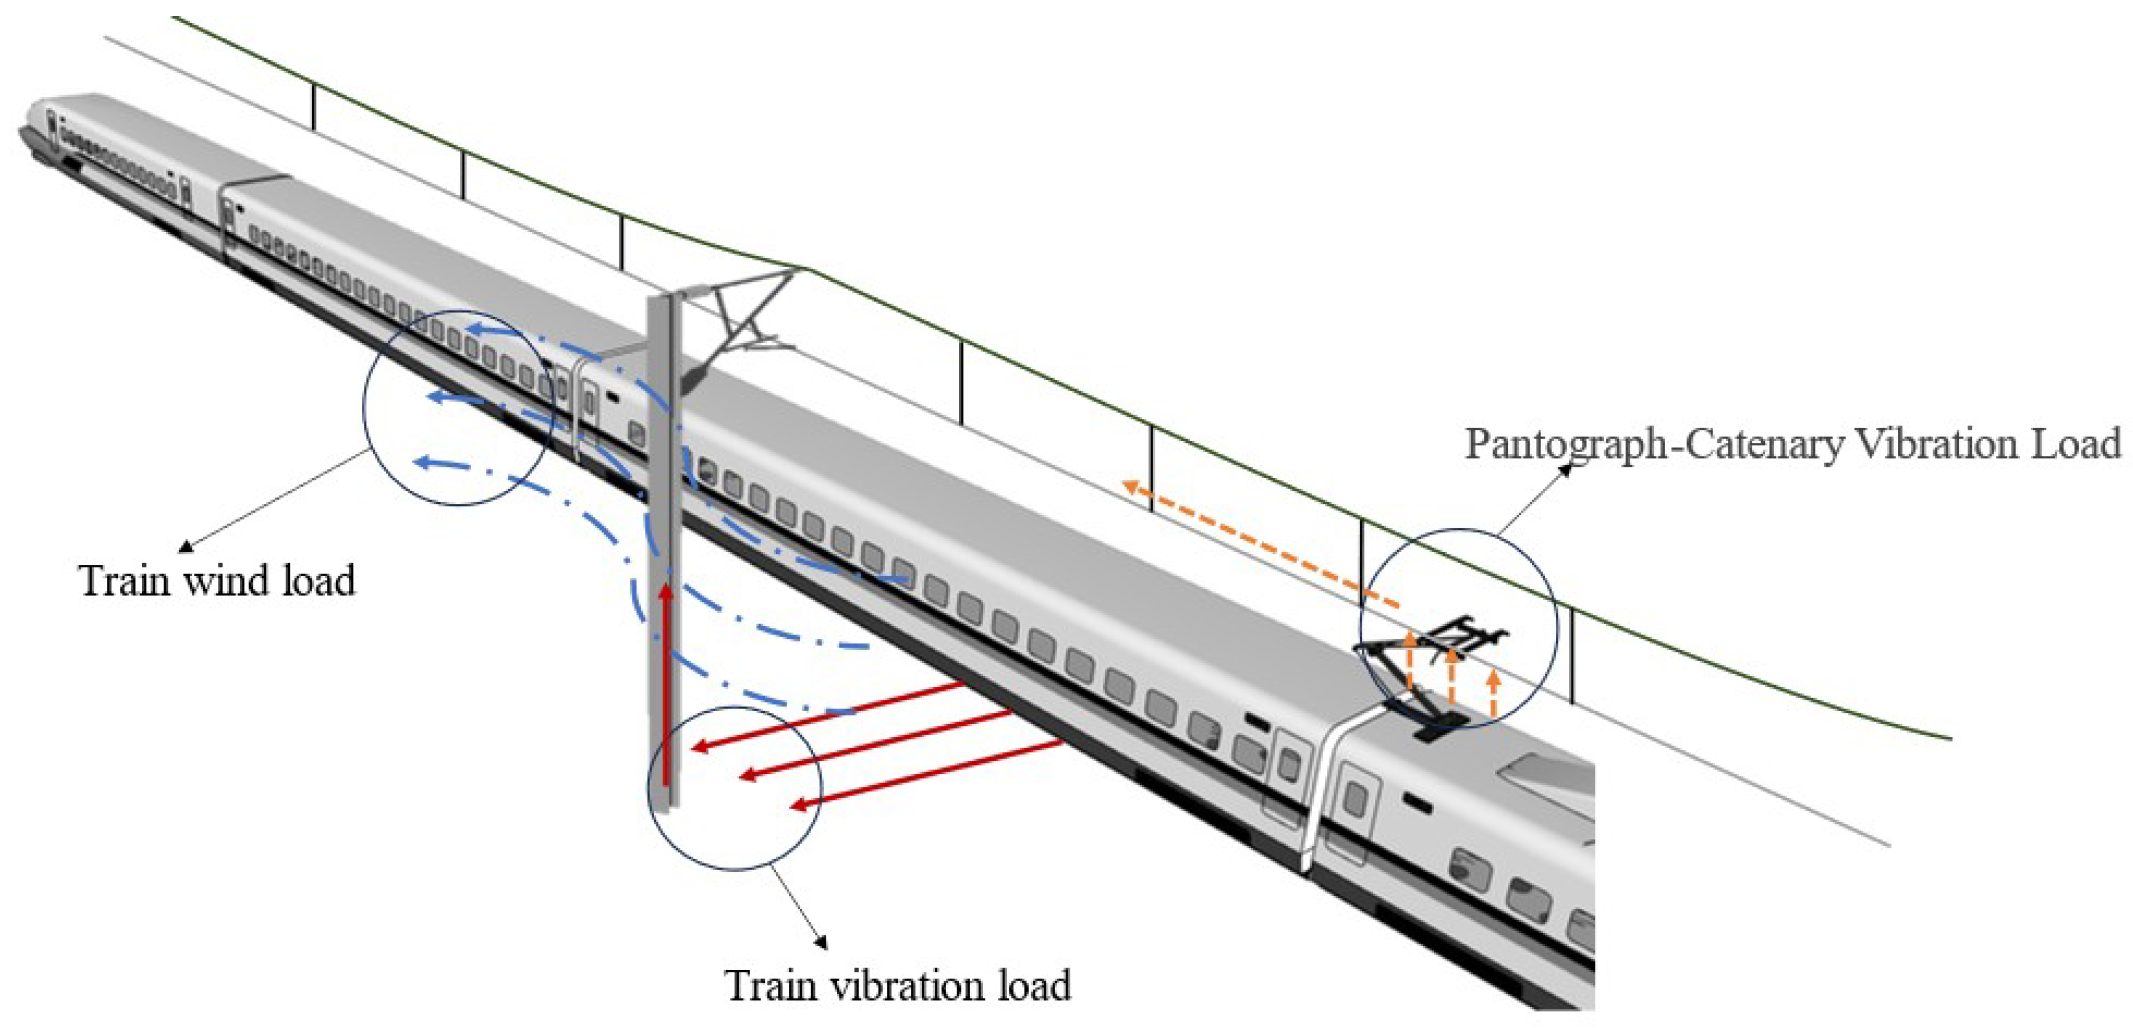
In modern high-speed railway transportation power supply systems, the catenary support structure is the key infrastructure, and its operational stability directly determines the continuity and reliability of the power supply system. However, high-speed trains produce a variety of complex loads and actions in the process of operation, which greatly affects the performance, safety and service life of the train itself and the track, catenary and other infrastructure. Owing to the knowledge of train dynamics, the speed per hour of high-speed train operation is limited by key factors such as pantograph catenary interaction (pantograph catenary vibration load), fluid structure coupling (train wind load) and wheel rail contact (train vibration load). When a high-speed train is running, the catenary support structure has three main functions: train vibration load, train wind load and pantograph catenary vibration load, as shown in Figure 4. Therefore, this paper comprehensively considers a variety of loads that may be generated under train operation conditions, including train vibration loads, train wind loads and pantograph catenary vibration loads. By comprehensively considering these loads and studying the dynamic response of the catenary support structure under their coupling effect, the mechanical properties of the catenary support structure under a complex load environment are comprehensively analyzed, which provides a more comprehensive and accurate basis for the subsequent fatigue life and fatigue reliability analysis.

2.1. Train Vibration Load

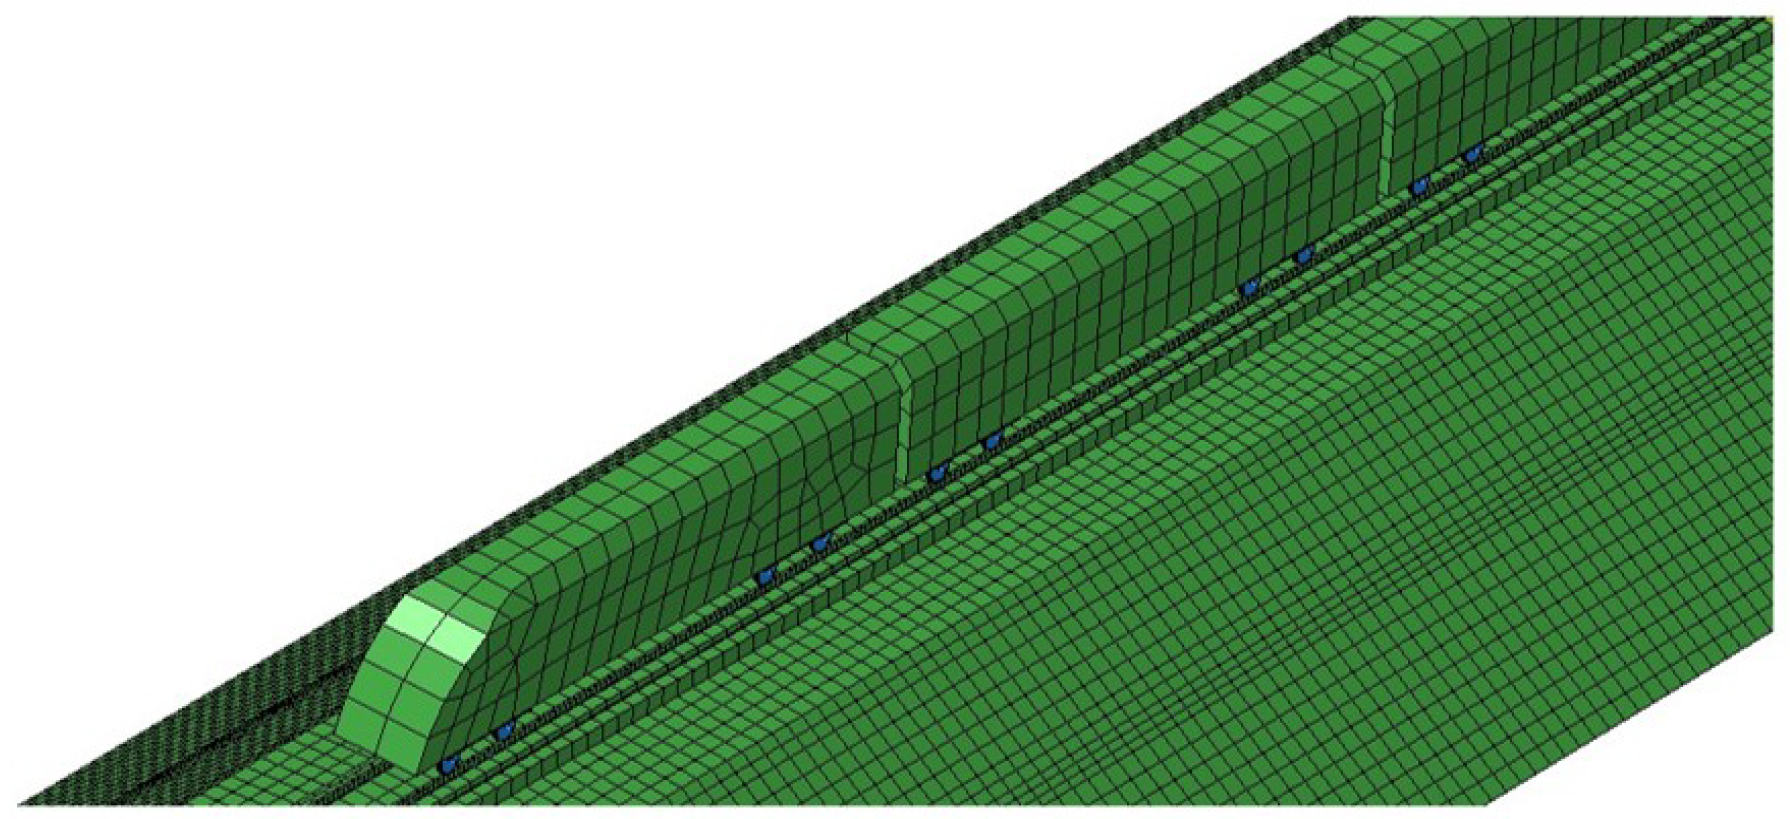
This paper uses the train track subgrade coupling dynamic model built in the previous research results of the research group [33], and its modeling method and verification process meet the technical requirements of the code for the design of high-speed railways (TB 10621-2016) [34]. A schematic diagram of the train track subgrade model is shown in Figure 5.
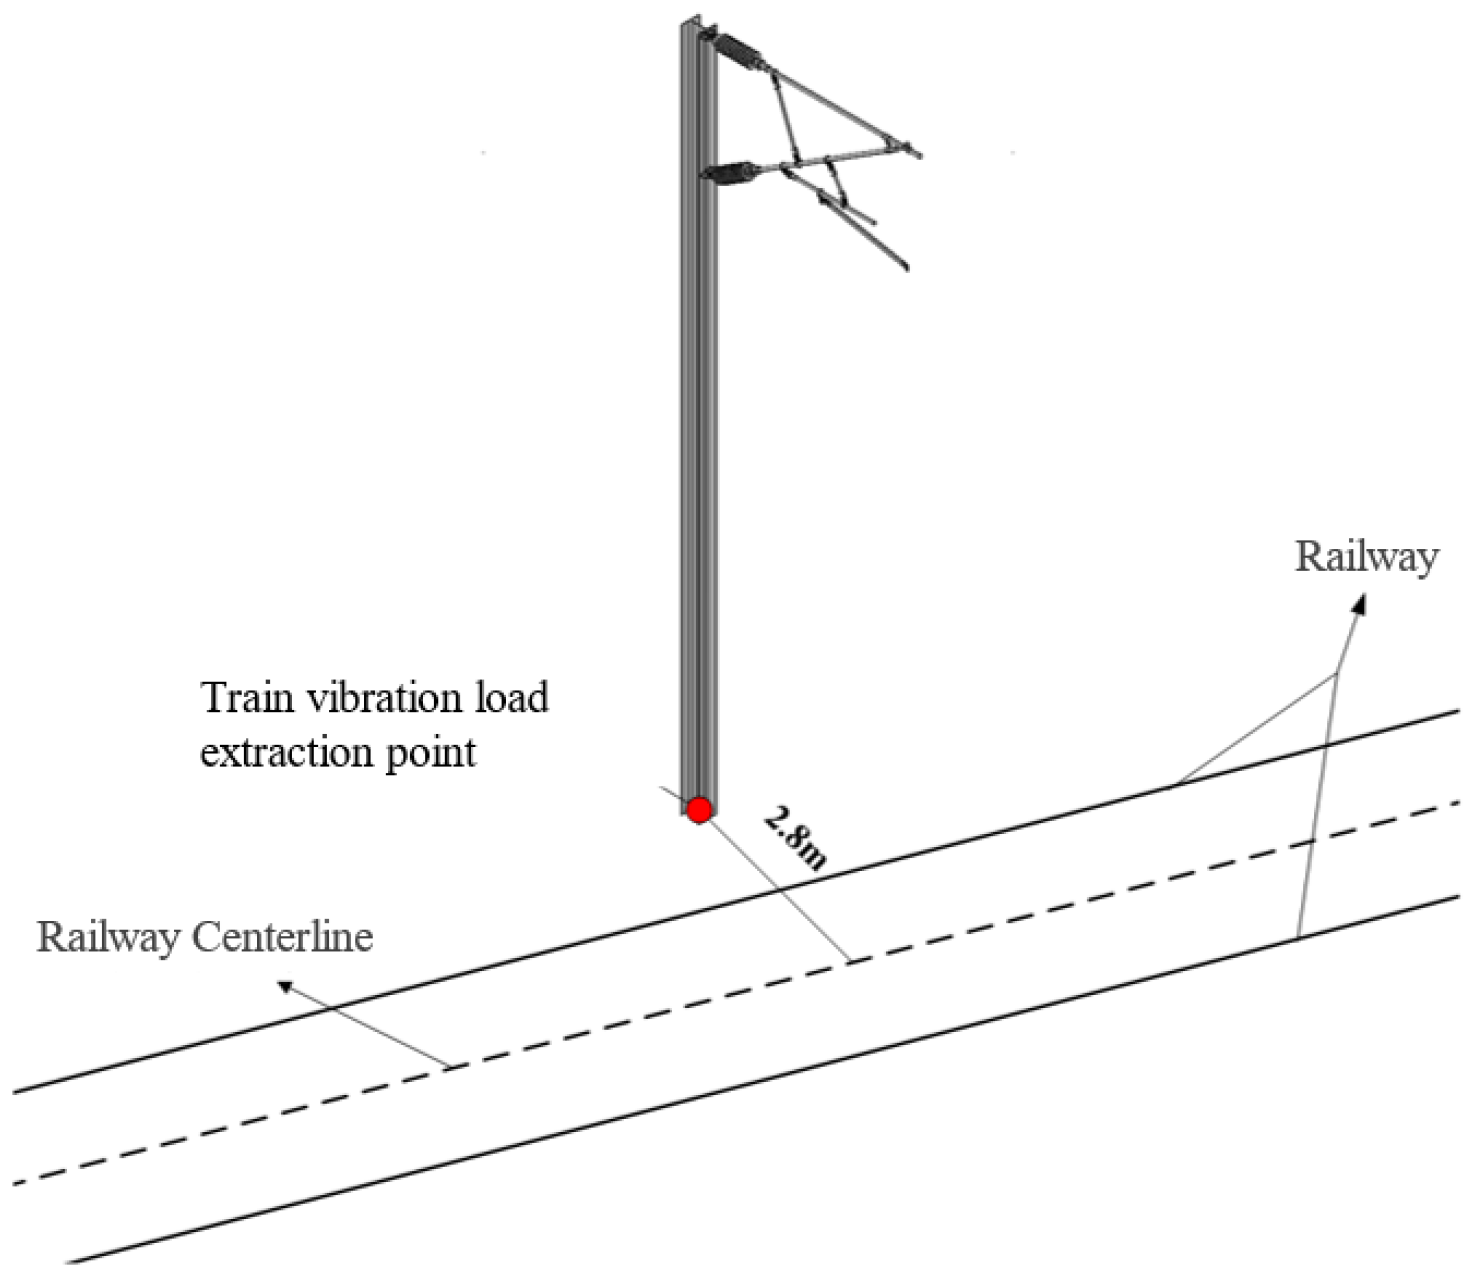
According to the regulations on the distance between the catenary pillar and the track center in the code for the design of the railway electric traction power supply (TB 10009-2016) [35], the linear section of the lateral clearance of the catenary pillar (i.e., the distance between the inner edge of the pillar and the track center) is generally not less than 2.5 m, and 2.8–3.0 m is usually used. In this work, the acceleration of the subgrade surface at 2.8 m from the track center is extracted. As shown in Figure 6.

2.2. Train Wind Load

In the process of extracting the aerodynamic load of the catenary support structure, this study uses the theoretical model of the train wind field in reference [36]. After demonstration, the simplified model meets the geometric accuracy requirements of the simulation model in railway application aerodynamics Part 4: Code for numerical simulation of the aerodynamic performance of trains (TB/T 3503.4-2018) [37]. Figure 7 shows the optimized three-dimensional geometric model of the eight-marshaling train, in which Figure 7a,b show the side view and front view projections, respectively.
In the direction of train operation (z direction), the catenary pillar significantly impacts the train wind because of the large stress area. When the train is running at high speed, the wind of the train directly acts on the column in the Z direction. Its structural characteristics enable the wind load to be effectively applied, causing vibration and displacement of the column and threatening structural stability for a long period of time. Therefore, wind speed monitoring points are set along the Z direction, the corresponding wind speed is taken every 1 m, and the corresponding monitoring points are also set at the positions of the support device and the positioning device. The disturbance of train wind to the suspension structure is transmitted to the support structure through the messenger cable and contact wire. Wind speed monitoring segments are set every 5 m for the messenger wire and contact line, and a schematic diagram of the train wind load extraction points is shown in Figure 8.

2.3. Pantograph Catenary Interaction Model and Pantograph Catenary Vibration Load

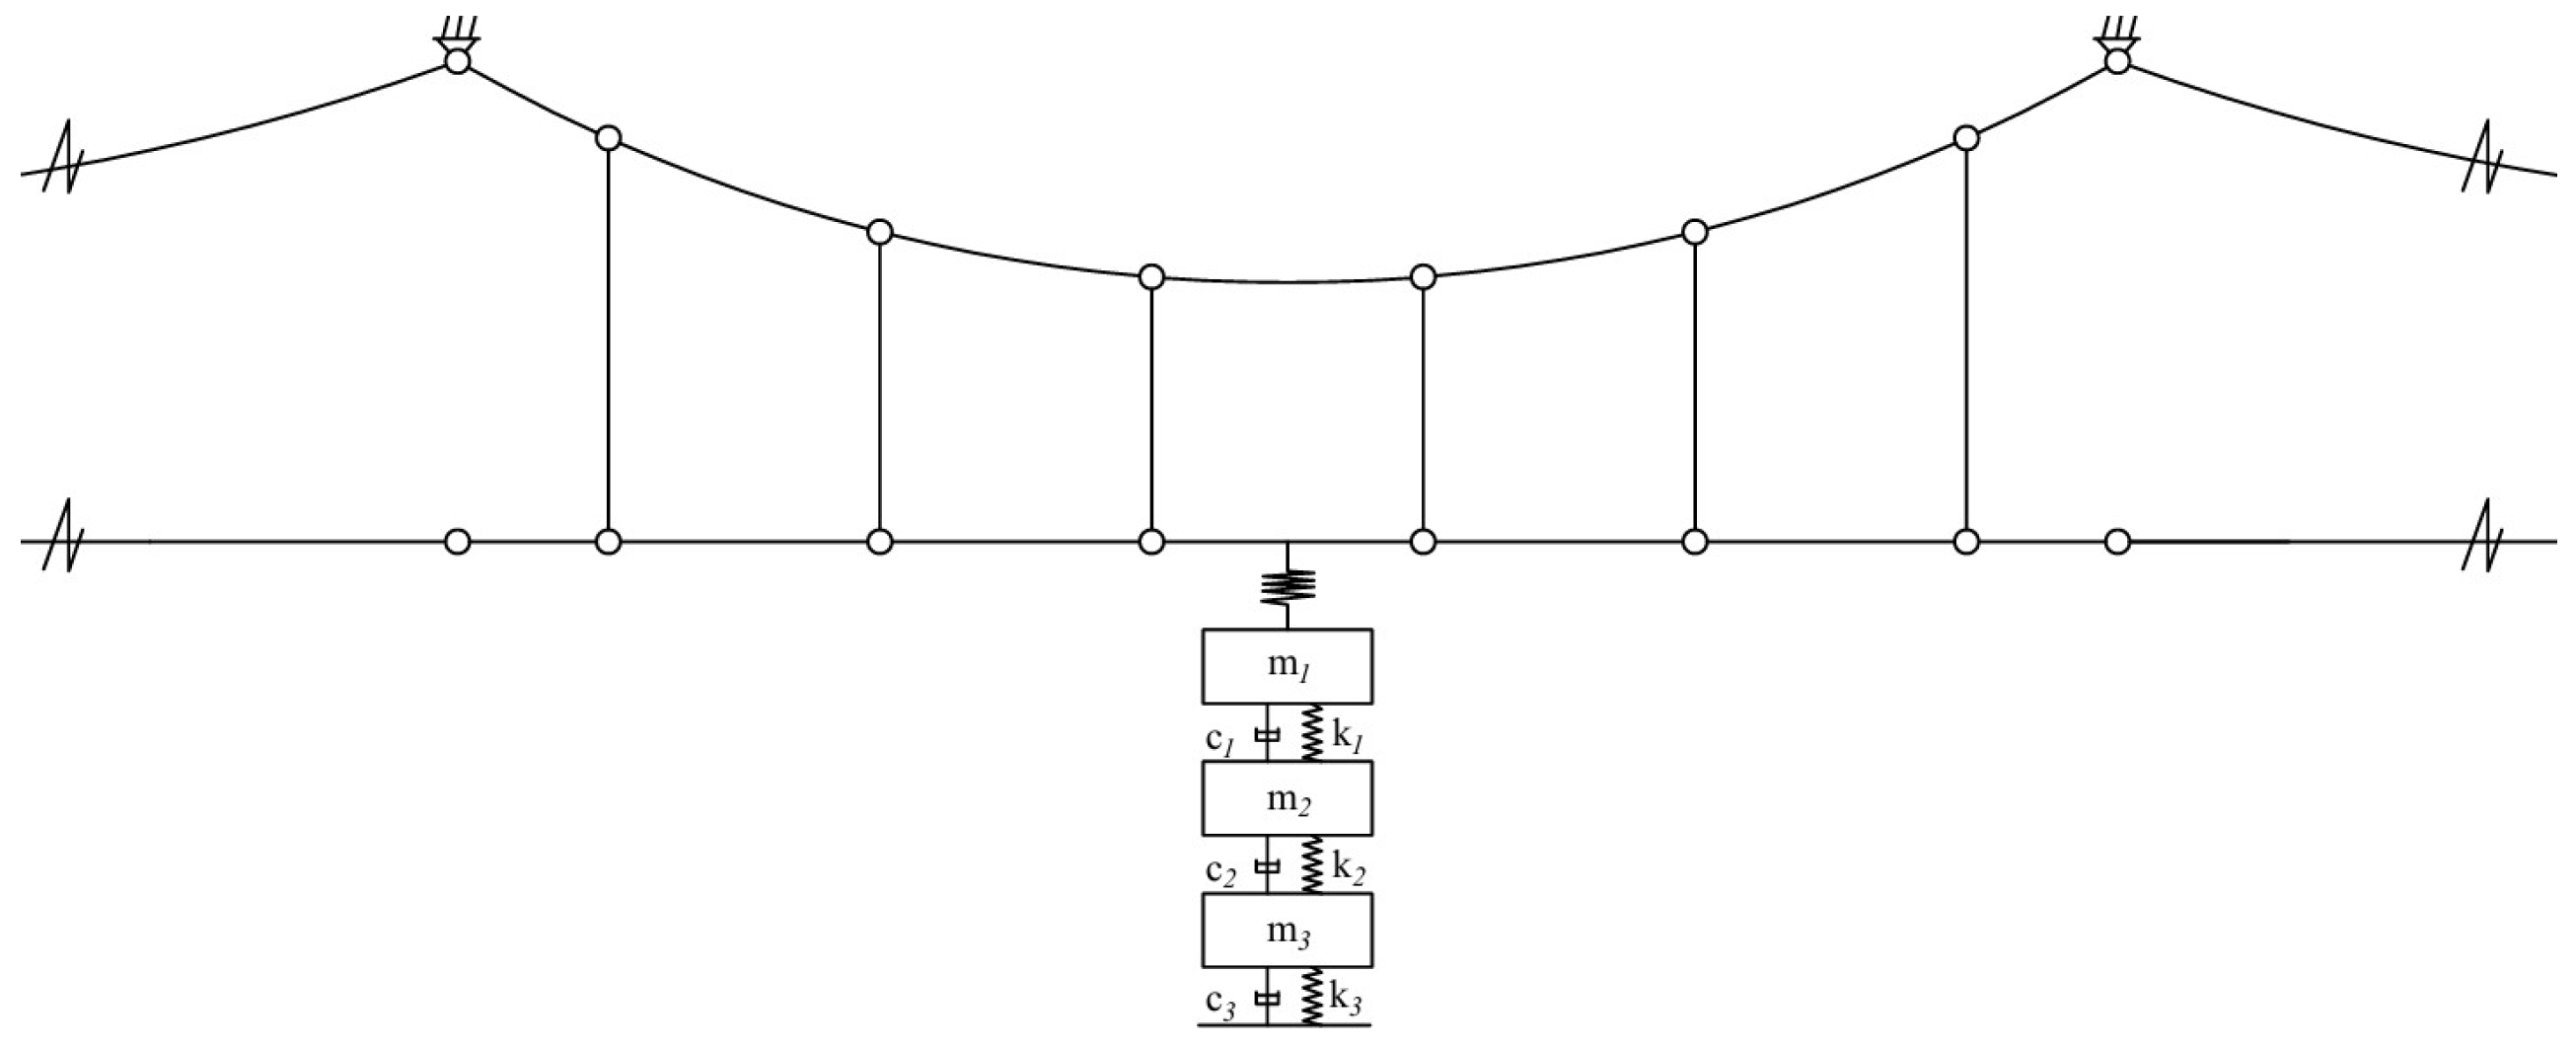
When the catenary support structure is working, in addition to being affected by the ground vibration and wind of the train, it also needs to bear the dynamic load caused by the impact of the pantograph on the contact line. Under impact loading, each connecting part of the positioning device and the cantilever system generates a component force and then generates stress in the internal components of the cantilever. These stresses are major factors in the fatigue failure of the catenary support structure. In this section, the pantograph catenary interaction model is established via ABAQUS 2021 software to calculate the dynamic load generated by the pantograph. The process of establishing the pantograph–catenary interaction model is described in detail below. A schematic diagram of the pantograph–catenary interaction model is shown in Figure 9.

2.3.1. Pantograph Catenary Interaction Model

When establishing the catenary model, it is necessary to consider the dead weight of the contact line and the messenger cable and to ensure axial tension and bending resistance. It can be simplified with beam elements (see Figure 10) and simulated with a beam element discrete model in the finite element software ABAQUS. The basic parameters are shown in Table 1.
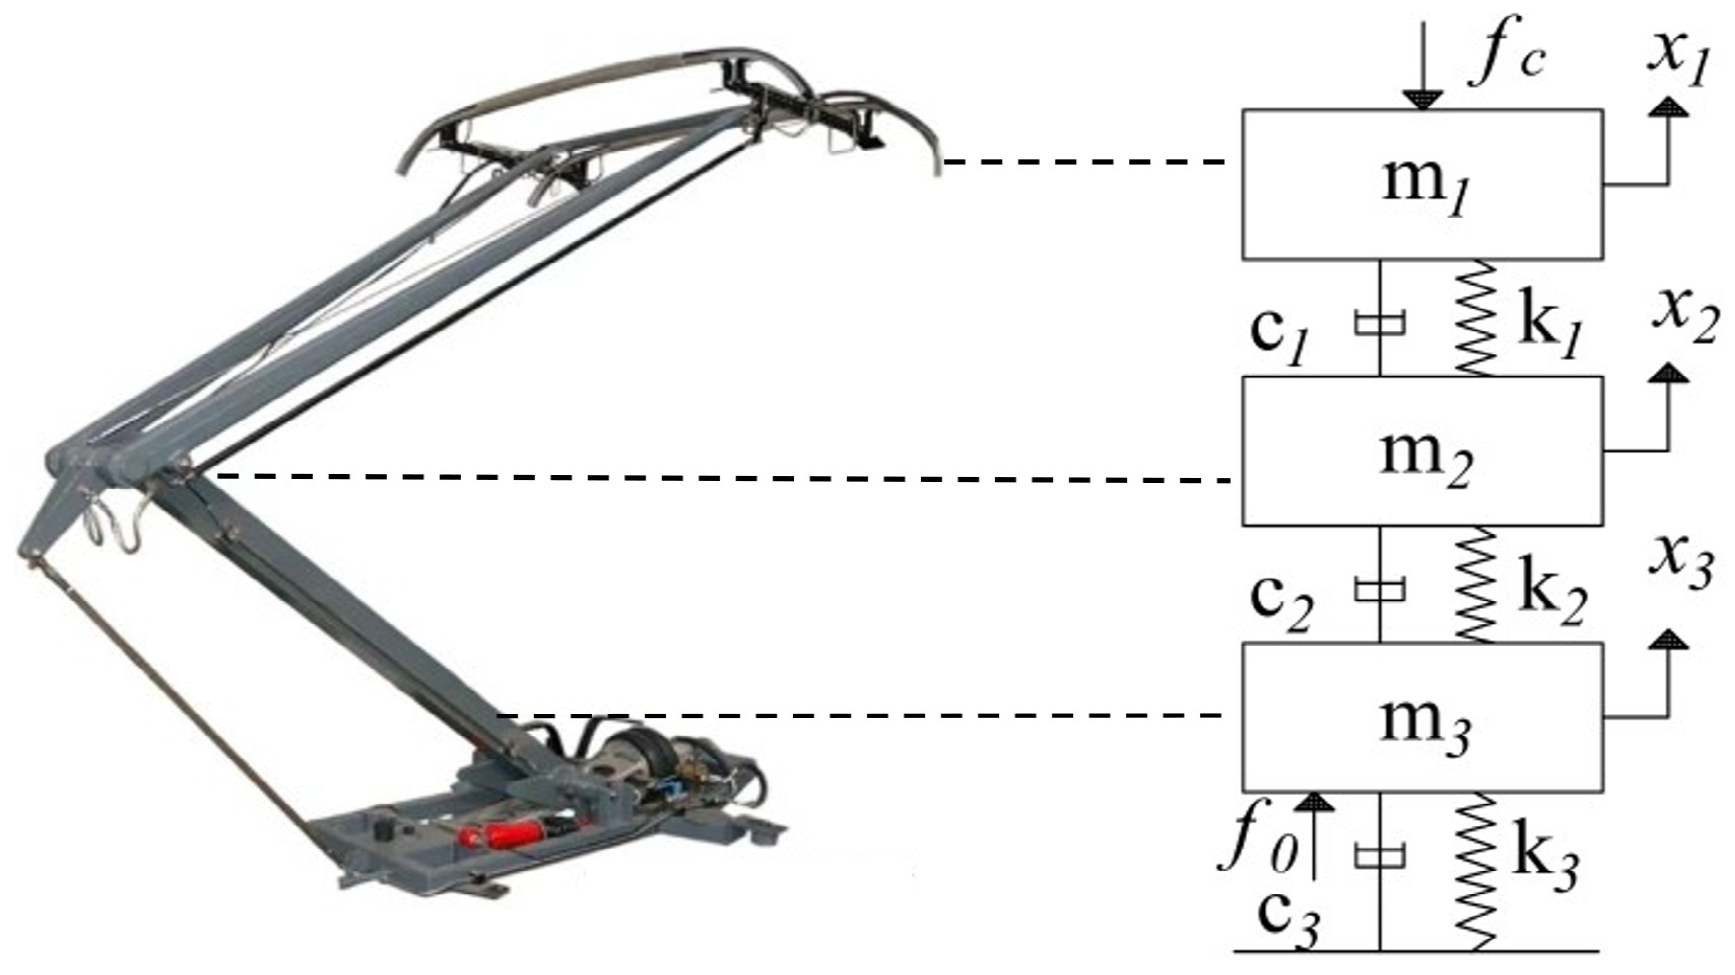
The equivalent model of three mass pantographs is established as shown in Figure 11, and its motion differential equation is as follows:
m 1 x ¨ 1 + c 1 ( x ˙ 1 x ˙ 2 ) + k 1 ( x 1 x 2 ) = f c m 2 x ¨ 2 + c 1 ( x ˙ 2 x ˙ 1 ) + c 2 ( x ˙ 2 x ˙ 3 ) + k 1 ( x 2 x 1 ) + k 2 ( x 2 x 3 ) = 0 m 3 x ¨ 3 + c 2 ( x ˙ 3 x ˙ 2 ) + c 3 x ˙ 3 + k 2 ( x 3 x 2 ) + k 3 x 3 = f 0
where f c represents the dynamic contact force; f 0 denotes the static lift force of the pantograph; m 1 , c 1 , k 1 is the equivalent mass parameter of the pantograph head; m 2 , c 2 , k 2 is the equivalent parameter of the upper frame; and m 3 , c 3 , k 3 is the equivalent parameter of the lower frame. The DS380 pantograph is adopted, and its parameters are listed in Table 2.
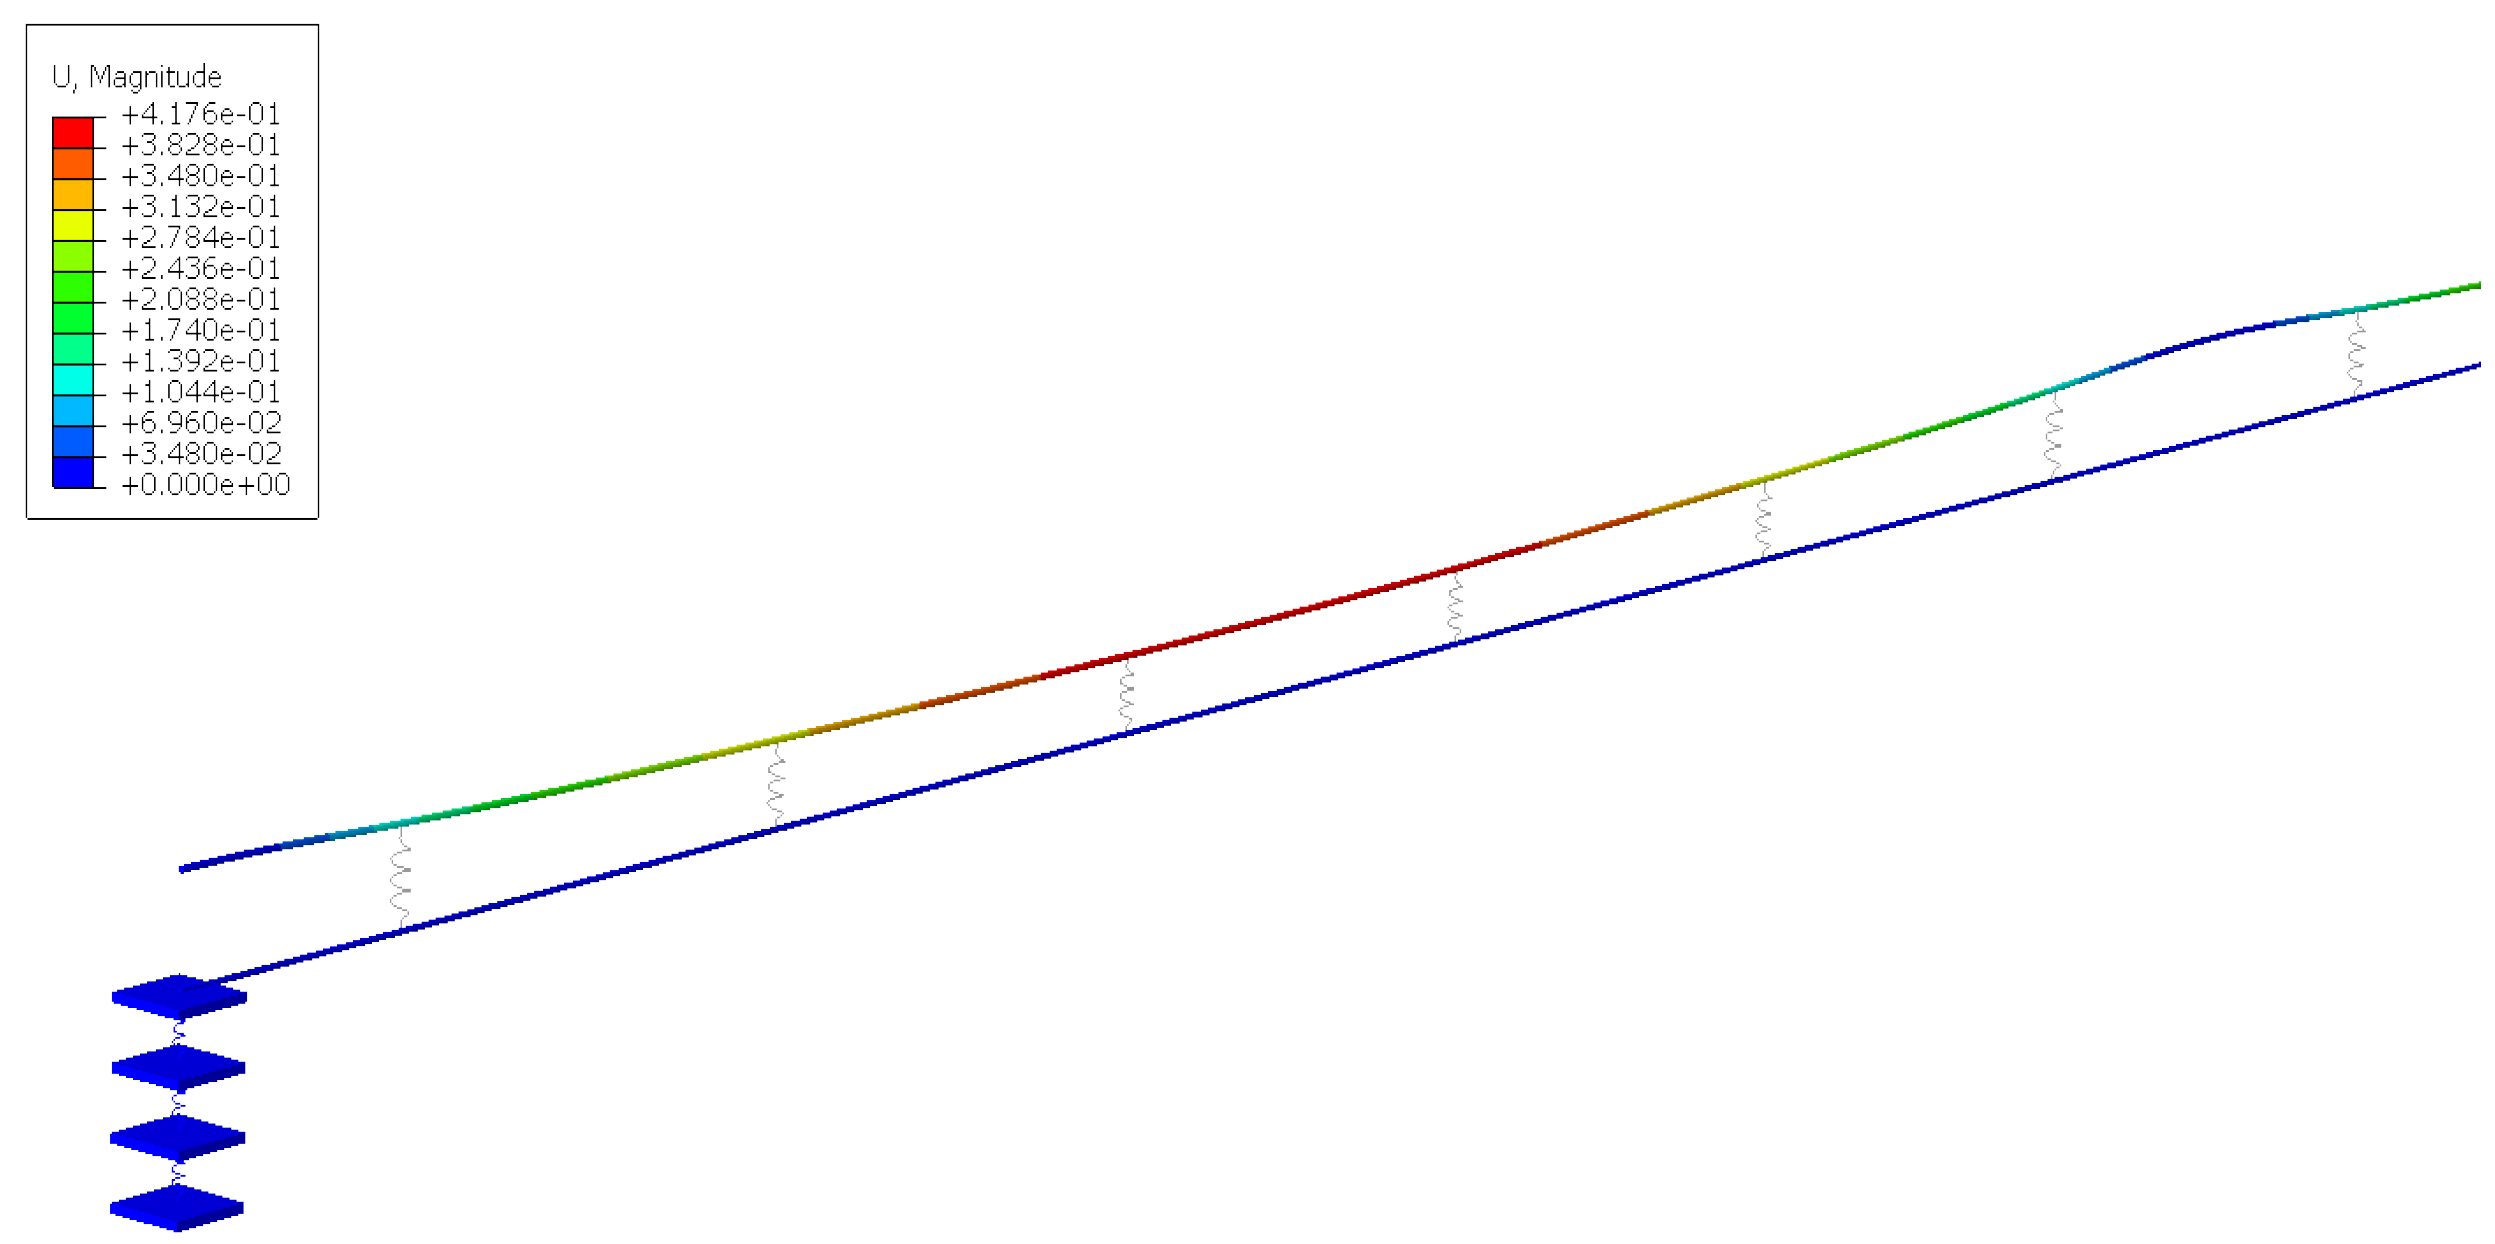
The contact stiffness is set to 50,000 N/m, the nonlinear contact algorithm is used to solve the contact problem, and the contact force corresponding to the contact penetration is quantified by the time-varying linear function (as shown in Formula (2)). During dynamic sliding simulation, real-time contact state detection is performed: if the vertical coordinate value of the sliding plate node is less than the corresponding position coordinate of the contact line (i.e., there is a geometric gap), it is determined that the contact force is inactive, as shown in Figure 12. When the sliding plate node produces positive penetration (the coordinate value is greater than the contact line position), the contact force calculation module is activated, and its value is positively correlated with the contact stiffness coefficient and penetration depth.
f C ( t ) = k c Δ ξ ( t ) Δ ξ ( t ) 0 0 Δ ξ ( t ) < 0
where f C ( t ) represents the contact force (N), which is a function of time t; k c is the contact stiffness (N/m); and Δ ξ ( t ) denotes the penetration distance (m).
After the catenary model, pantograph model and contact model are set, the pantograph catenary interaction model is established, as shown in Figure 12.

2.3.2. Verification of the Pantograph Catenary Interaction Model

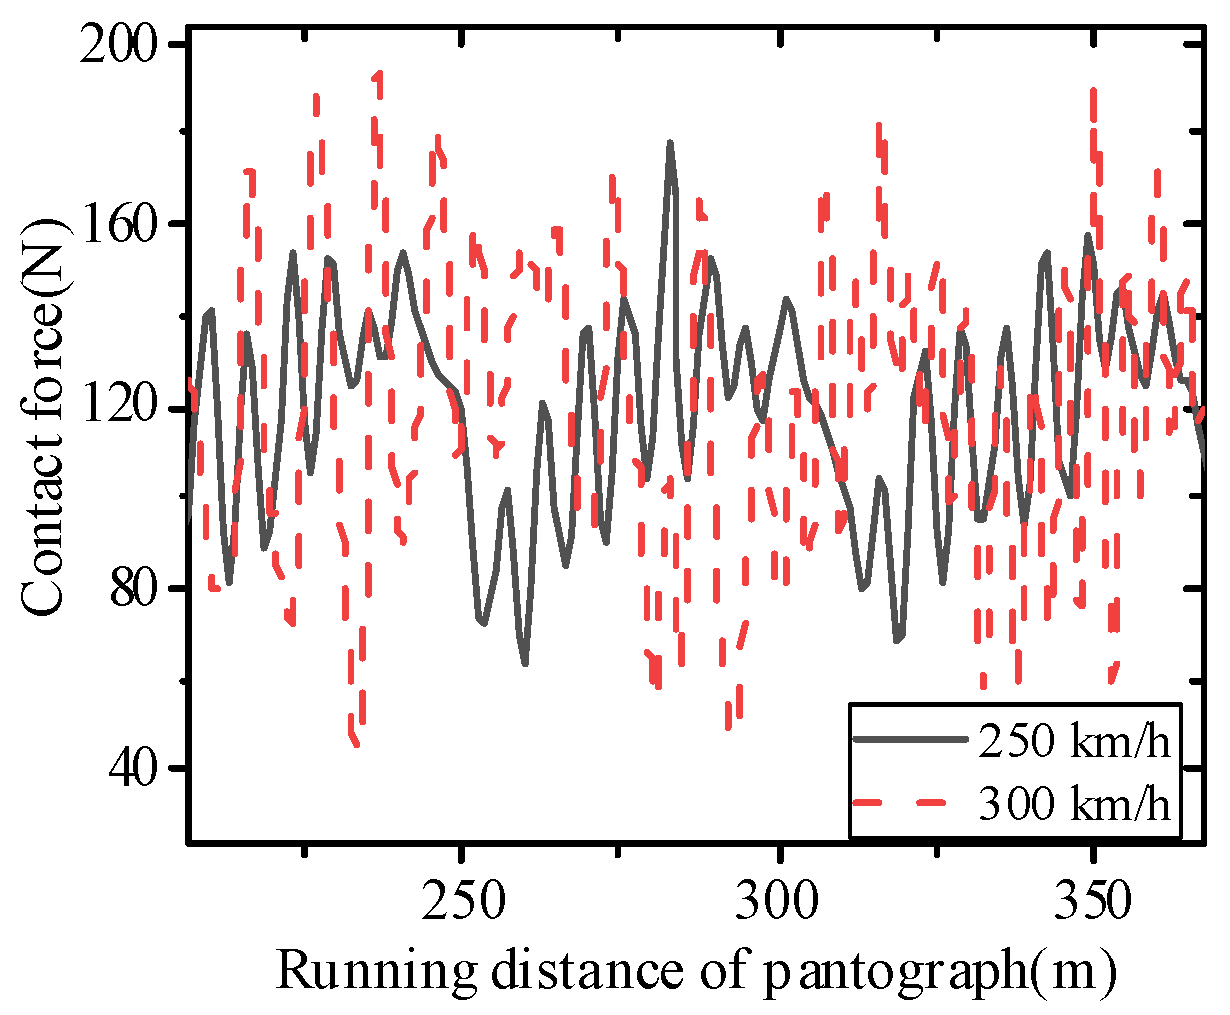
The verification of the pantograph–catenary coupling model in this section mainly includes two parts. One is based on the verification of the reference model in the standard and the verification with the existing model data. In this work, a beam element is used to simulate the contact wire and messenger wire, and a connector element is used to simulate the suspender. The static contact force is 70 N, ignoring aerodynamics. In accordance with the reference model requirements of the “GB/T 32591-2016 verification of pantograph catenary dynamic interaction simulation” of rail transit current collection systems [38], a pantograph catenary dynamic simulation model is established, and the speed is set at 250 km/h and 300 km/h to solve the contact force data. When the speed is 250 km/h, the maximum contact force is 178.5 N, and the minimum contact force is 63.6 N. When the speed is 300 km/h, the maximum contact force is 193.1 N, and the minimum contact force is 43.8 N. The contact force simulation results under the two speeds are shown in Figure 13.
The pantograph–catenary interaction submodel was rigorously verified against the Chinese National Standard GB/T 32591-2016: Verification of dynamic interaction simulation between the pantograph and overhead contact system in a rail transit current collection system [38]. As mandated by the standard, the simulated contact force values (e.g., maximum force of 178.5 N and minimum force of 63.6 N at 250 km/h) fall well within the acceptable range prescribed for a validated model. The train-vibration input is validated against TB 10621-2016 subgrade acceleration standards, whereas the train-wind field is checked with TB/T 3503.4-2018 wind-tunnel codes. Stress concentrations occur precisely at known critical locations (bolted joints and bracket filets), and their amplitudes scale linearly with train speed—behavior consistent with field observations [13,15]. This standardization ensures that the dynamic output of this submodel, which serves as a critical input load for the support structure, accurately reflects real-world pantograph–catenary interaction dynamics.

2.3.3. Pantograph Catenary Vibration Load

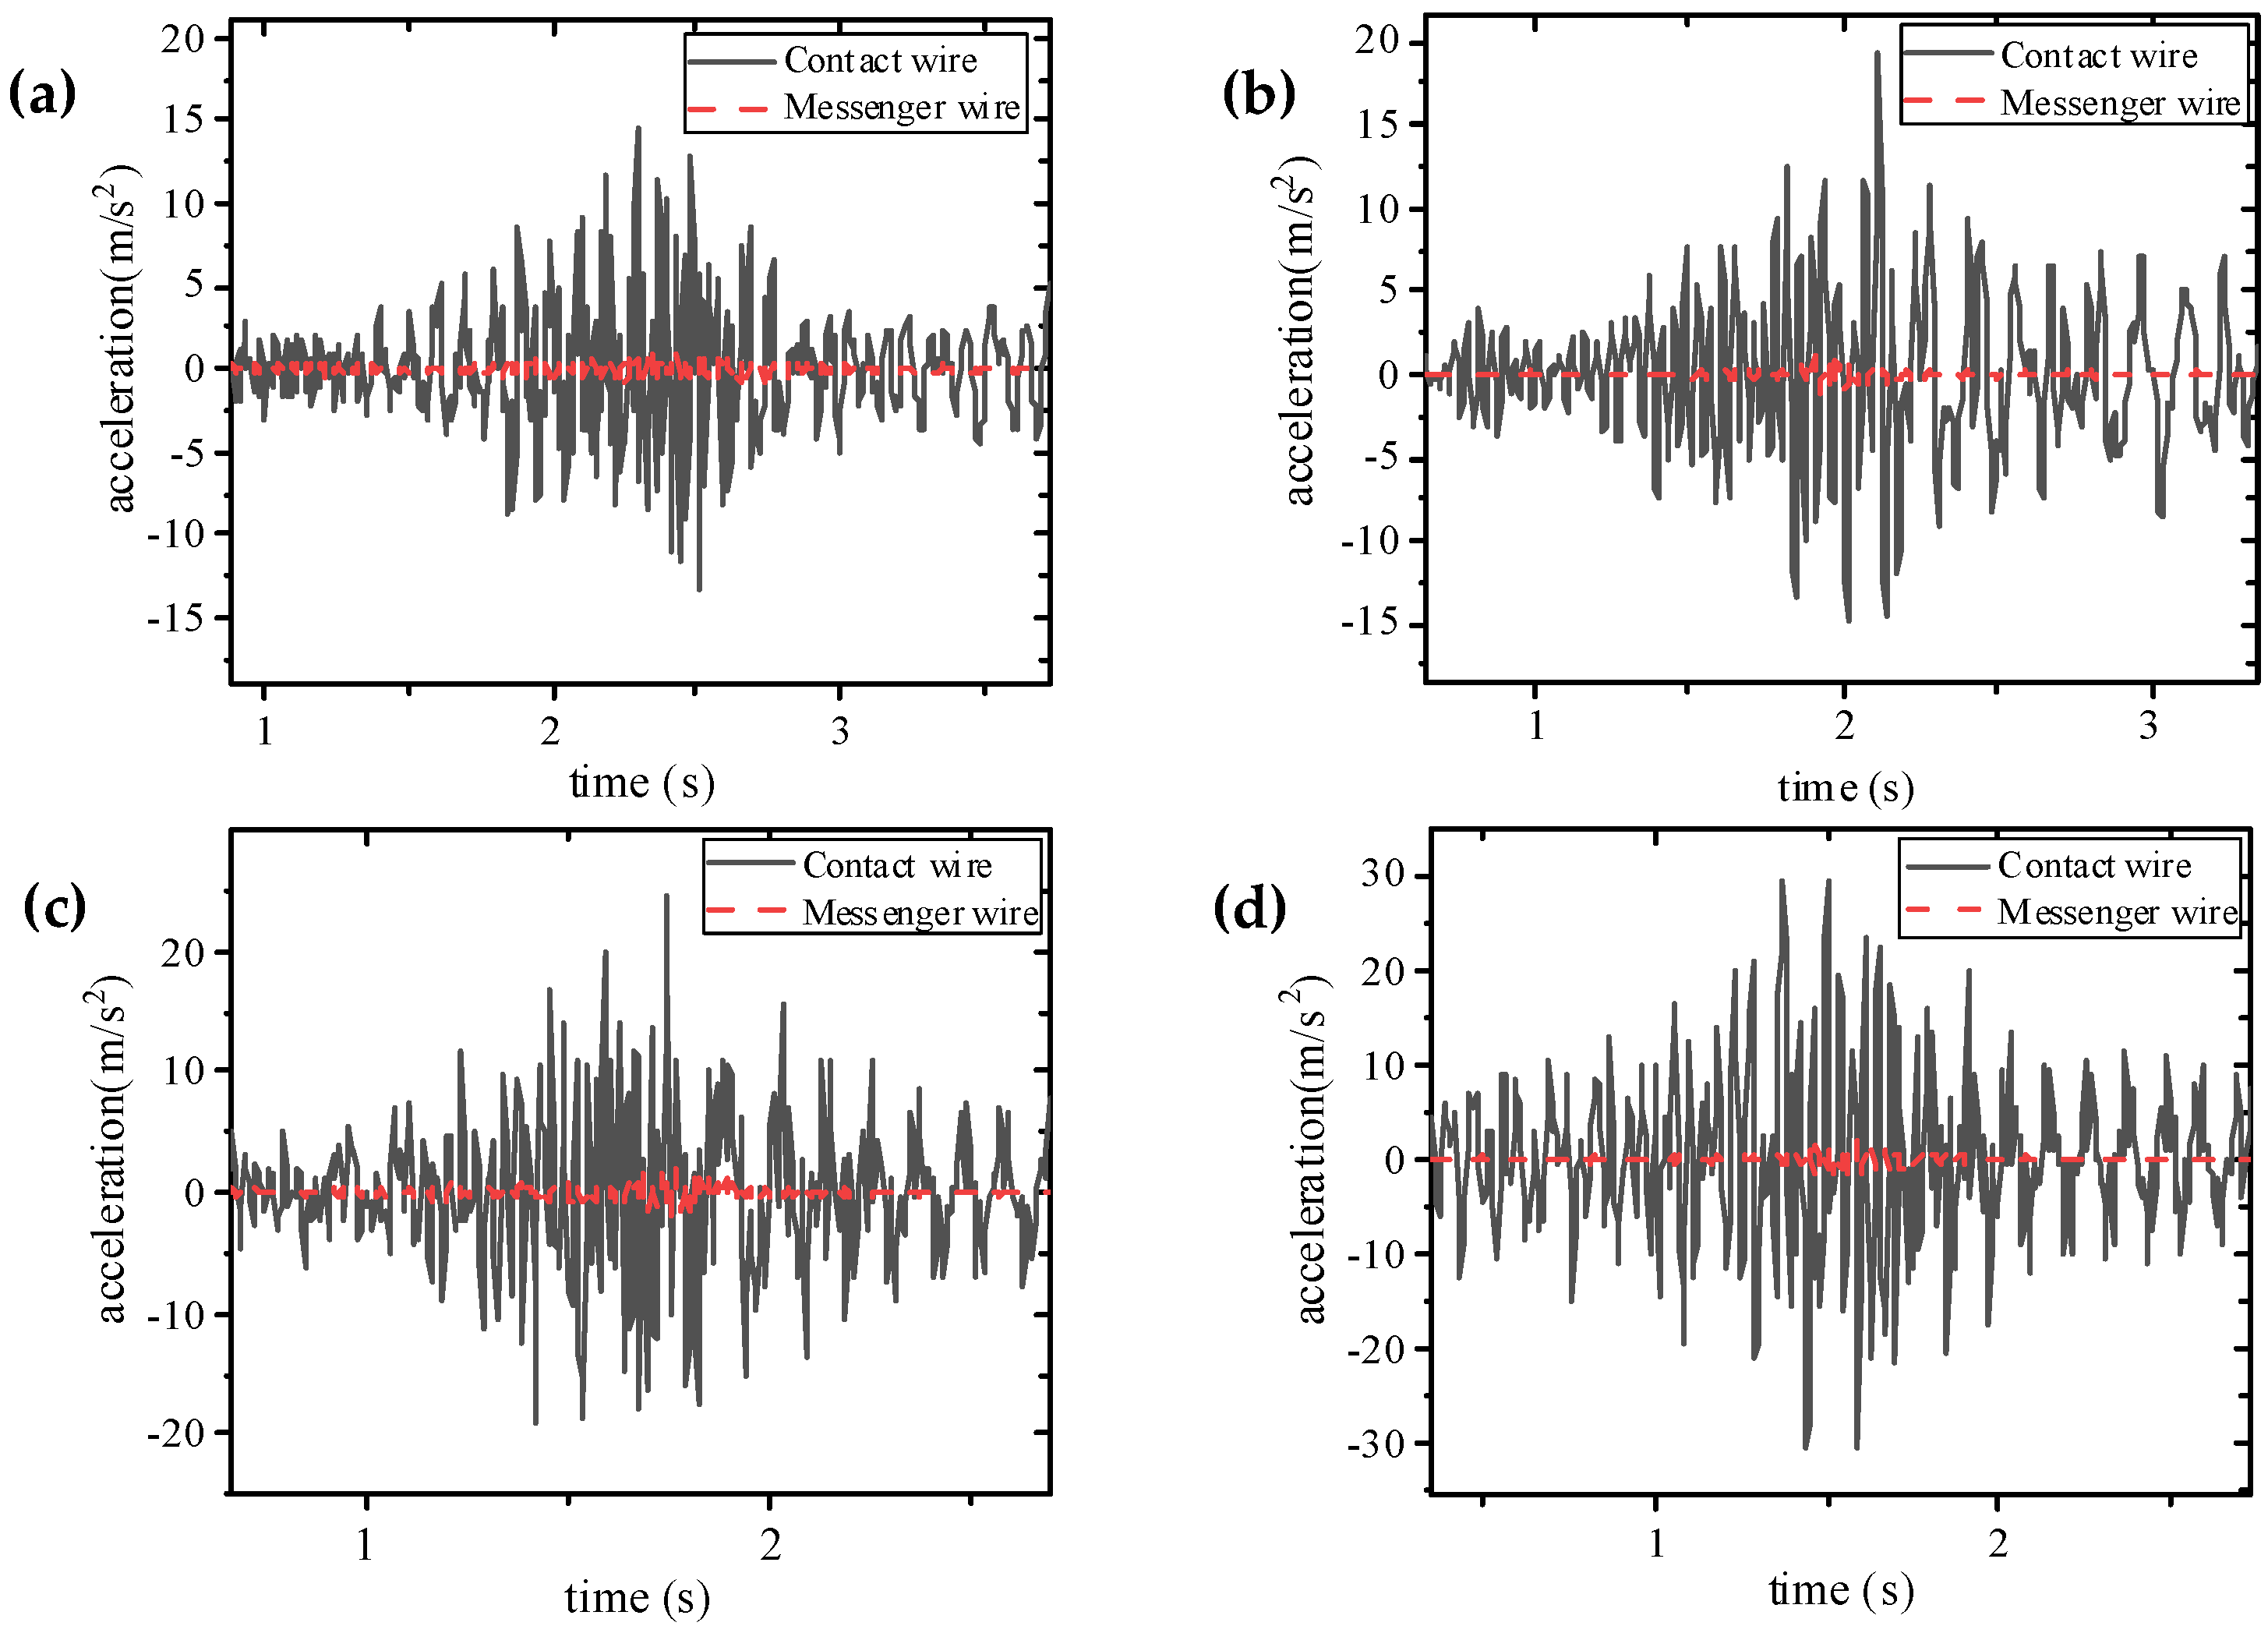
In the process of train operation, owing to the influence of factors such as the rise and fall of the pantograph, the pantograph catenary vibration mainly occurs in the vertical direction, that is, perpendicular to the ground [39]; thus, in the subsequent analysis of this paper, only the vertical vibration of the pantograph catenary is considered. To simplify the treatment, a high-strength spring [40] is assumed in the finite element software at the constraint of the messenger cable and contact line, which is conducive to calculation but does not affect the transmission. To analyze the failure mechanism of the catenary support device under the action of pantograph catenary vibration, the influence of pantograph catenary vibration on the catenary support structure was studied through vertical acceleration at the connection of the catenary support structure and the suspension structure. The number of catenary spans is 6, and the connection position of the third and fourth spans is selected as the acceleration acquisition point (see Figure 14). Time history data of pantograph catenary acceleration under different train speeds is shown in Figure 15.

3. Finite Element Modeling and Dynamic Response Analysis of the Catenary Support Structure

In this section, the catenary structure along an actual railway is taken as the research object. First, a structure conforming to engineering practice is established, a finite element model is established, and modal analysis is carried out to obtain the vibration mode and natural frequency parameters of the structure. Moreover, the most unfavorable position of the structure under dynamic loading is determined, and the typical stress danger points in the overall structure are further confirmed. This process focuses on the stress characteristics of each part of the structure and the dynamic response of the structure. Finally, the modal analysis and dynamic response analysis results are extracted to provide data support for the subsequent structural fatigue life and fatigue reliability analysis.

3.1. Finite Element Modeling of the Catenary System

The catenary support structure is a complex link structure. Contains several key components. The detailed parameters of different parts of the catenary support structure are described in detail below.
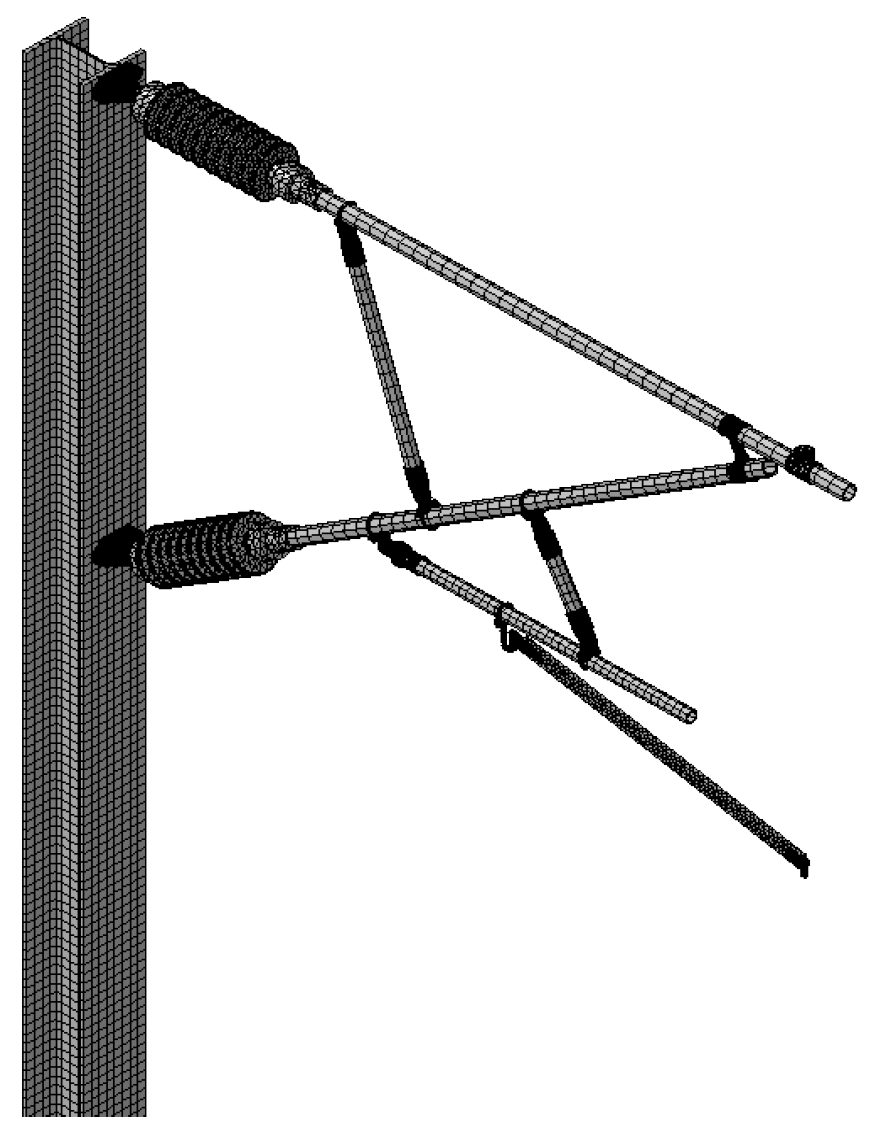
Owing to the relatively complex structure of the connection position between the transverse cantilever and the inclined cantilever, the position of the rod insulator, the positioning ring and the position of the limit locator, the catenary support structure is divided into a second-order tetrahedral grid, with a total of 300,000 grids. Owing to its relatively simple structure, the pillar is divided into more excellent hexahedral grids with 10,000 grids. Figure 16 shows the overall grid diagram of the catenary support device. Table 3 and Table 4 list the specific material parameters of the catenary support structure.
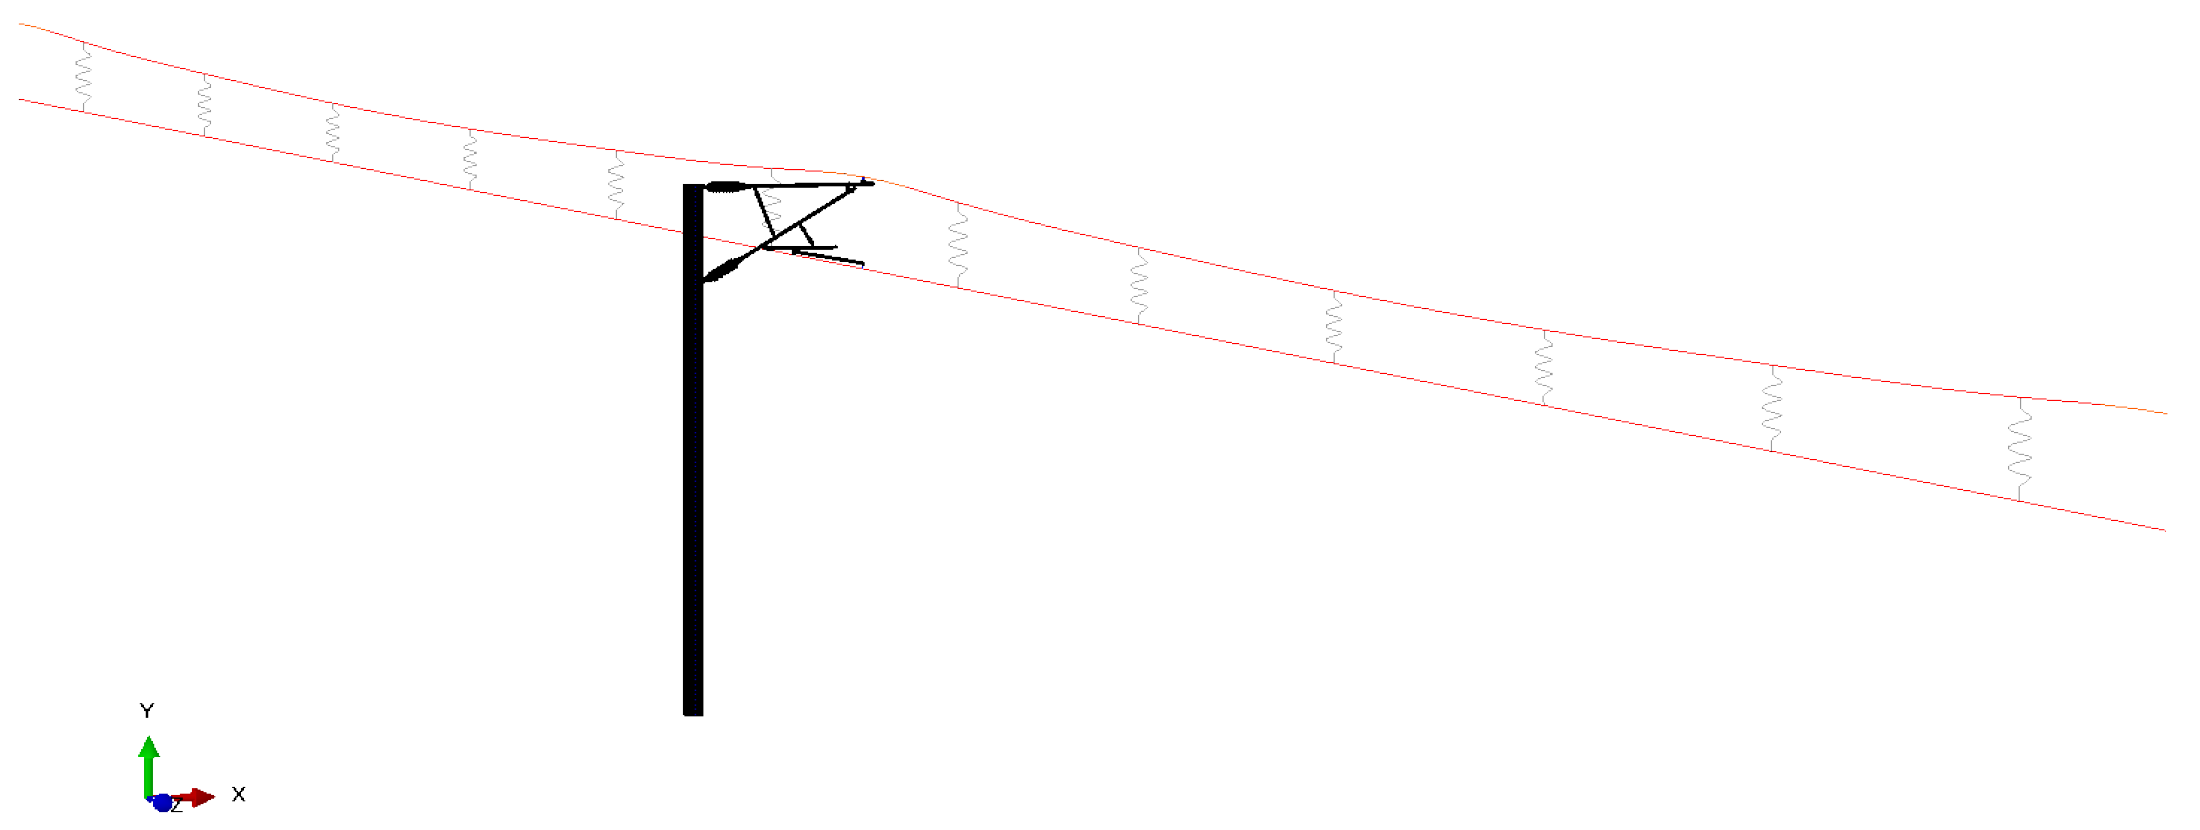
In actuality, the catenary support structure and catenary suspension work together as a whole, so when studying the impact of train operation conditions, we cannot ignore the closely related role of the catenary suspension (contact wire, messenger wire, suspension string, etc.). This section is consistent with Section 2.3, and a single-column two-span model is established. The detailed settings of the finite element model connection are shown in the table. The single-column two-span model established in this section is shown in Figure 17.

3.2. Analysis of the Natural Vibration Characteristics of the Model

The modal characteristics of the catenary reflect its natural vibration properties. The key parameters, such as the natural frequency and mode shape of the structure, can be obtained via the modal analysis method, which belongs to the research category of deterministic vibration characteristics. Under the action of external loads, the dynamic response characteristics of the catenary system significantly differ because of the difference in the natural vibration period. The modal study of the catenary can not only accurately identify the intrinsic vibration frequency of the structure but also deduce the dynamic damping parameters of the structure on the basis of the material damping characteristics and then effectively evaluate whether the support structure has resonance risk. The analysis method has important guiding value for the optimization design and engineering practice of catenary systems [41]. The modal characteristics of the catenary system are studied below.
In the finite element method, continuous medium discretization technology is usually used to solve the structural response on the basis of the construction of balance equations and the preset numerical algorithm. For the modal analysis of the simplified catenary model, its dynamic control equation can be expressed as [42]:
M X ¨ ( t ) + C X ˙ ( t ) + K X ( t ) = F ( t )
where M , C , and K represent the mass matrix, damping matrix, and stiffness matrix of the structure, respectively; X ¨ ( t ) , X ˙ ( t ) , and X ( t ) denote the acceleration vector, velocity vector, and displacement vector, respectively; and F ( t ) indicates the force vector.
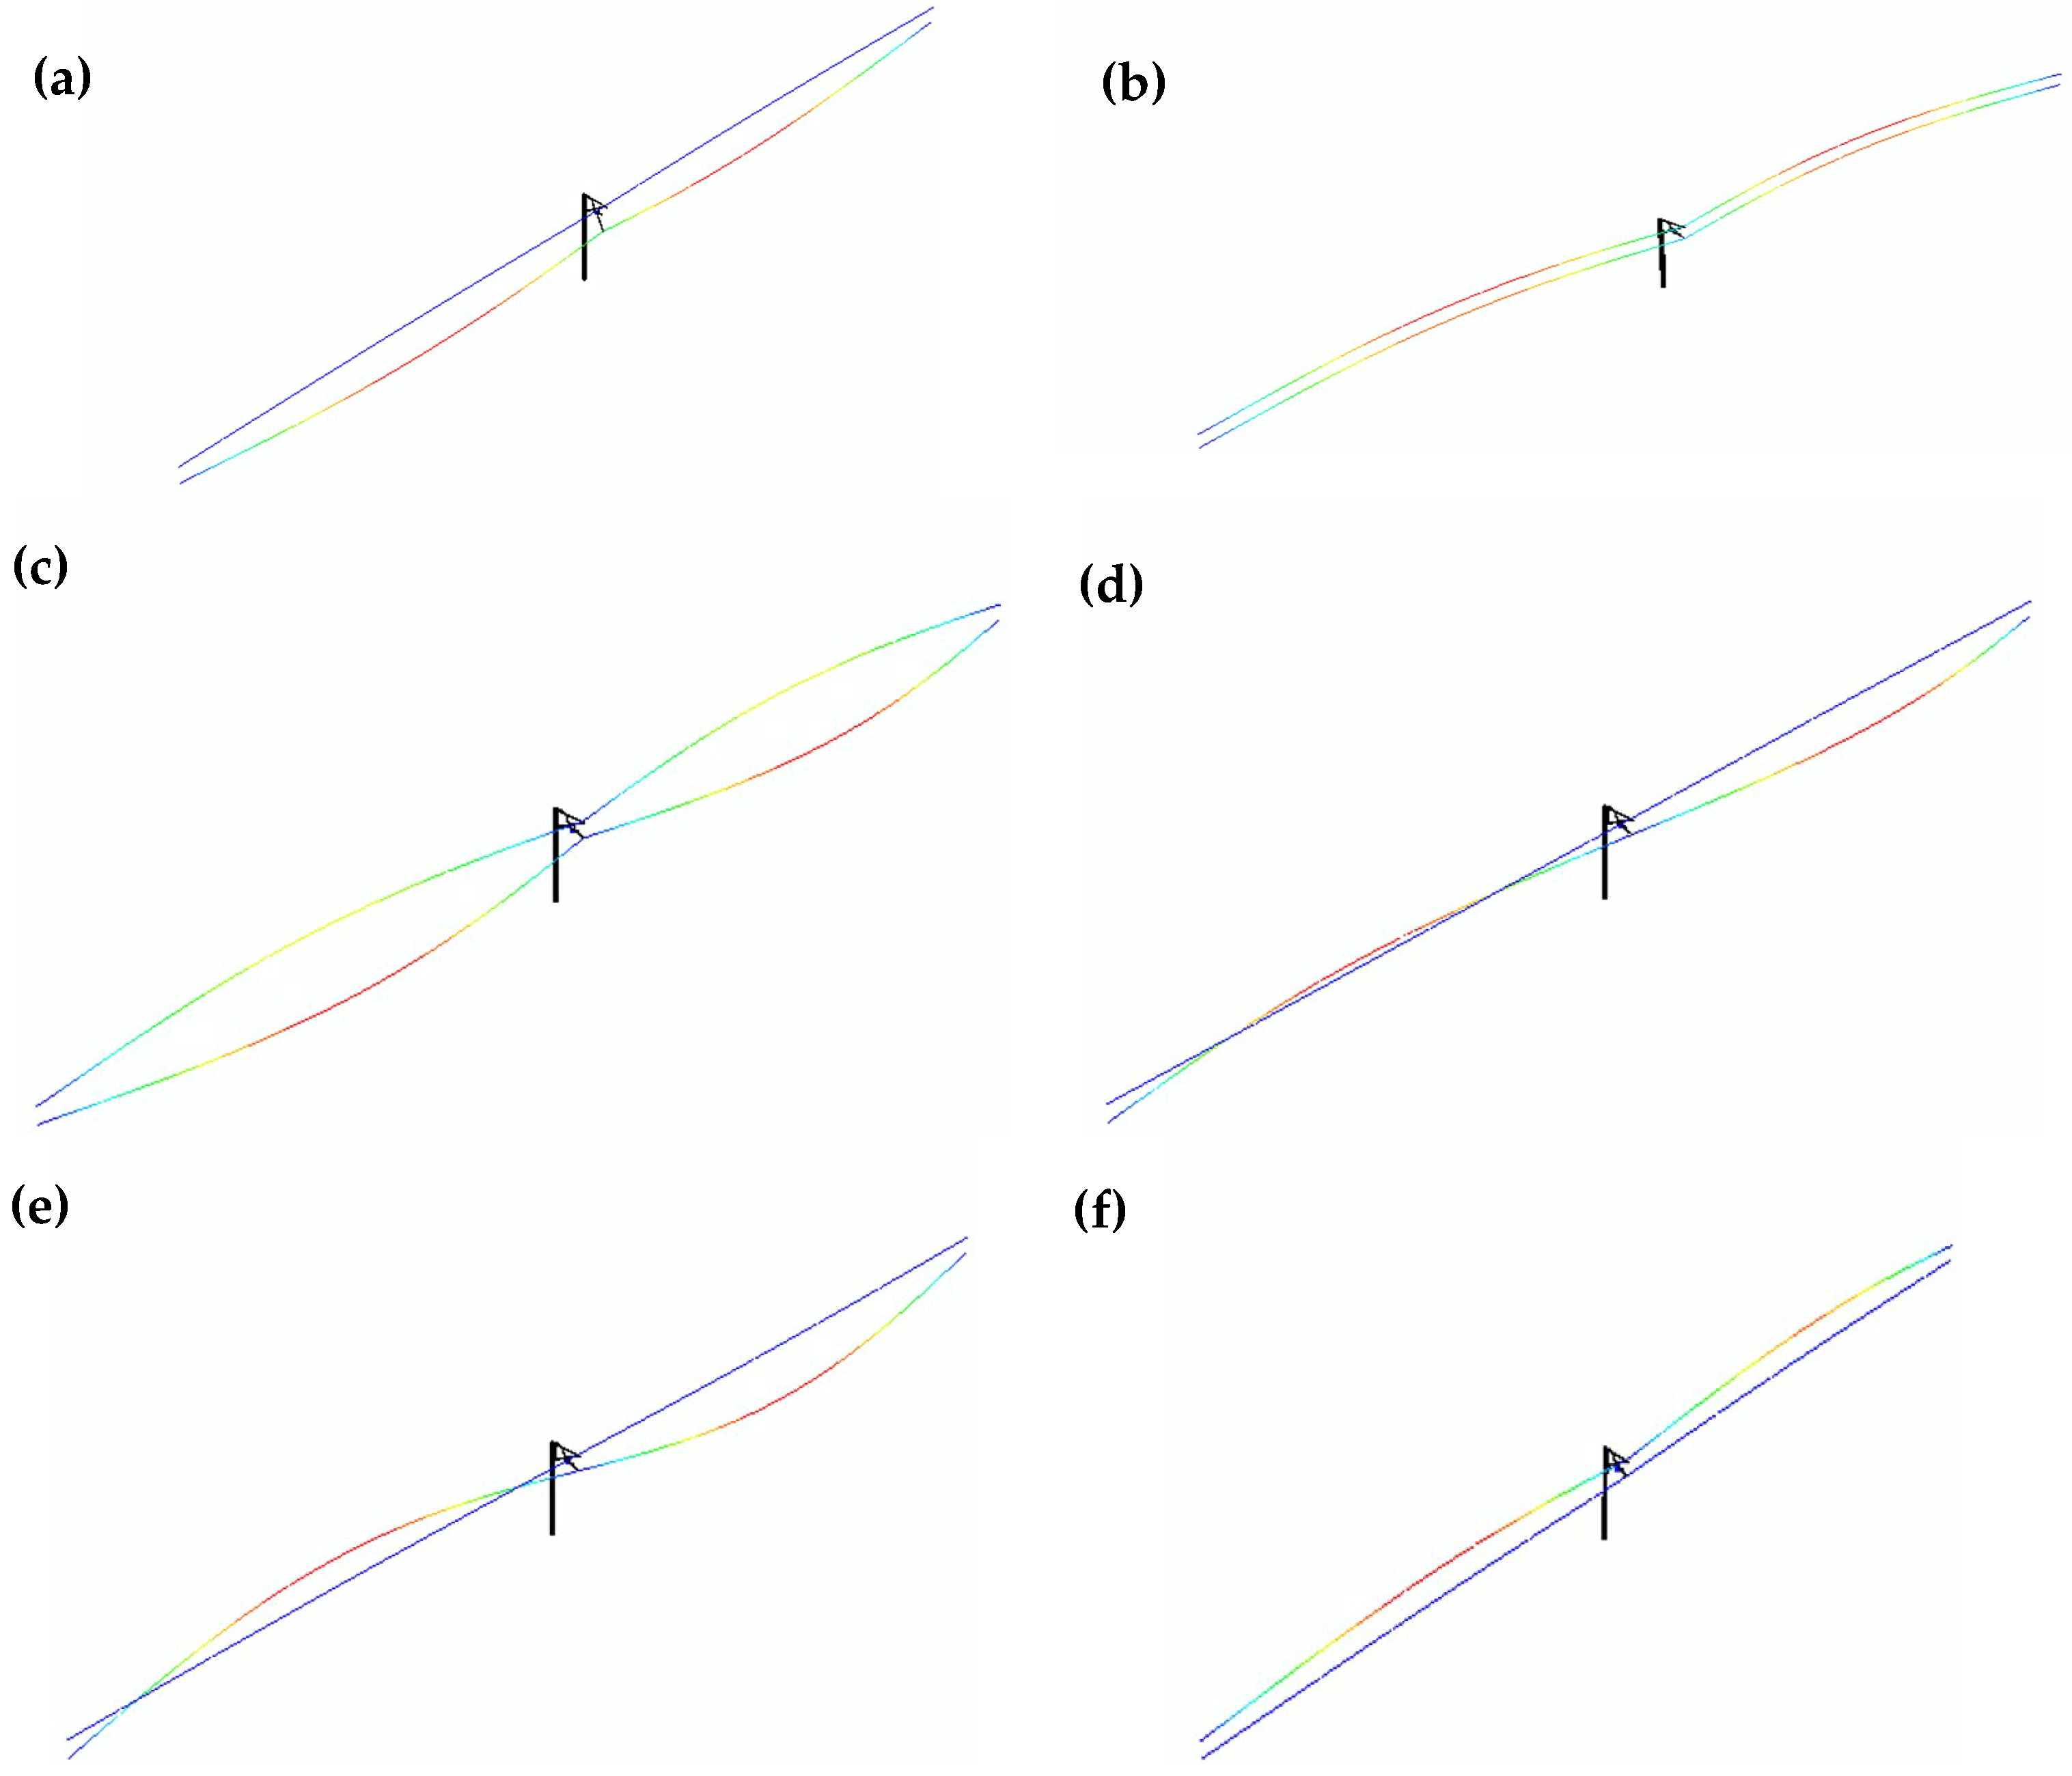
On the basis of the model in Section 3.1, modal analysis is carried out for the single-column two-span model. The first six modes (see Figure 18) and natural frequencies (see Table 5) of the model are as follows.
The dynamic characteristics analysis reveals that the frequency of the first 50 orders of the catenary system is within 10 Hz, the frequency spectrum is dense, and the difference between each order is small. The first-order mode of the catenary system is the antisymmetric arrangement along the line direction; the second-order mode is the positive symmetric arrangement, which is mainly the out-of-plane vibration of the suspension system; the third-order mode is the vertical vibration of the antisymmetric suspension system; the fourth-order mode is the positive symmetric arrangement, which is the out-of-plane vibration of the suspension system; the fifth-order mode is the vertical vibration of the antisymmetric suspension system; and the sixth-order mode is the vertical vibration of the positive symmetric suspension system.

3.3. Model Validation

To further verify the correctness of the model, it is necessary to compare the results of this research with those of existing studies. Through the previous modeling method, this section establishes a catenary structure with the same number of spans as in references [43,44], and the first two natural frequencies of the model are shown in Table 6.
As shown in Table 6, the first and second natural frequencies of the proposed model are 1.141 Hz and 1.235 Hz, respectively, whereas those of the reference model [43,44] are 1.090 Hz and 1.105 Hz, with relative deviations of 6.3% and 8.4%, respectively (both within 9%). The first 50 natural frequencies of the proposed model range between 1 Hz and 4 Hz, which is consistent with the reference model [43,44]. The results indicate that the finite element model established in this study is reliable and can be used to simulate more engineering cases.
Beyond modal validation, the integrated model’s dynamic response credibility is further supported by input load validation, where primary dynamic excitations—pantograph-catenary vibration, train vibration, and train wind loads—are derived from established validated submodels (detailed in Section 2.1, Section 2.2, and Section 2.3.2) following industry-recognized modeling standards; output physical rationality, such as dynamic stress responses (Section 3.4), exhibit expected characteristics: stress concentrations at known critical sites such as bolted joints and geometric transitions (e.g., steady arm bracket), stress time histories correlated with train passage and pantograph dynamics, and calculated stress amplitudes far below material yield strength (consistent with high-cycle fatigue failure modes in service); and comparative consistency, where the steady arm bracket’s maximum stress fluctuations and shortest fatigue life align with findings from relevant catenary system experiments and simulations [13,15], indirectly validating the model’s criticality ranking accuracy.
Notably, while the preceding validation focuses on modal characteristics (natural frequencies and mode shapes), the accuracy of finite element models in predicting dynamic responses—including stress distributions—fundamentally relies on precise mass and stiffness matrix representations, which are validated via modal analysis [43,45]. Models reproducing global dynamics are deemed reliable for stress responses within the validated frequency range [42]. This modal-parameter-first validation approach is a mature methodology for large structures [46,47]. This study adds three checks following the hierarchical strategy [46,47]: 1. Eigenfrequencies within 4% of Ma et al.’s [43] 55 m test; 2. Pantograph-catenary forces complying with GB/T 32591-2016; 3. The hot-spot stresses (52 MPa at the steady-arm bracket and 33 MPa at the limit stop) within the field measurement range of Qi et al. [13] are 45–60 MPa. Although local strain measurement on 27.5 kV hardware is difficult and dangerous, the validation chain confirms the reliability of the stress analysis for this fatigue study.
This study validated the FE model primarily through modal parameters, acknowledging the lack of direct stress validation. Obtaining such field data is extremely challenging; however, owing to the high-voltage, high-speed operational environment, this complexity makes strain gauge installation and long-term operation not only costly but also potentially hazardous, leading to limited comprehensive field measurements available in the public domain or even from railway operators. Despite this limitation, the established validation chain—including the pantograph–catenary submodel’s compliance with standards, modal consistency with published benchmarks, and physical plausibility of dynamic stress responses (such as stress concentrations at expected locations and reasonable stress magnitudes)—strongly supports the model’s credibility for its intended comparative and trend analysis.

3.4. Dynamic Response Analysis of the Catenary Support Structures

The modeling of the catenary devices was introduced in detail in the previous section. From the perspective of dynamics, this section explores their dynamic time history responses under the operating conditions of high-speed trains; analyzes the time history responses of structures under different loads (train vibration load, train wind load, pantograph catenary vibration load) alone and coupling; and analyzes the response characteristics of structures under dynamic loads to provide the basis for the following fatigue analysis. Moreover, the vibration mechanism analysis can provide guidance for the subsequent optimization design, structural reinforcement, maintenance and repair of the catenary support structure, help improve the reliability and durability of the catenary support structure, and ensure the safe and efficient operation of the electrified railway.
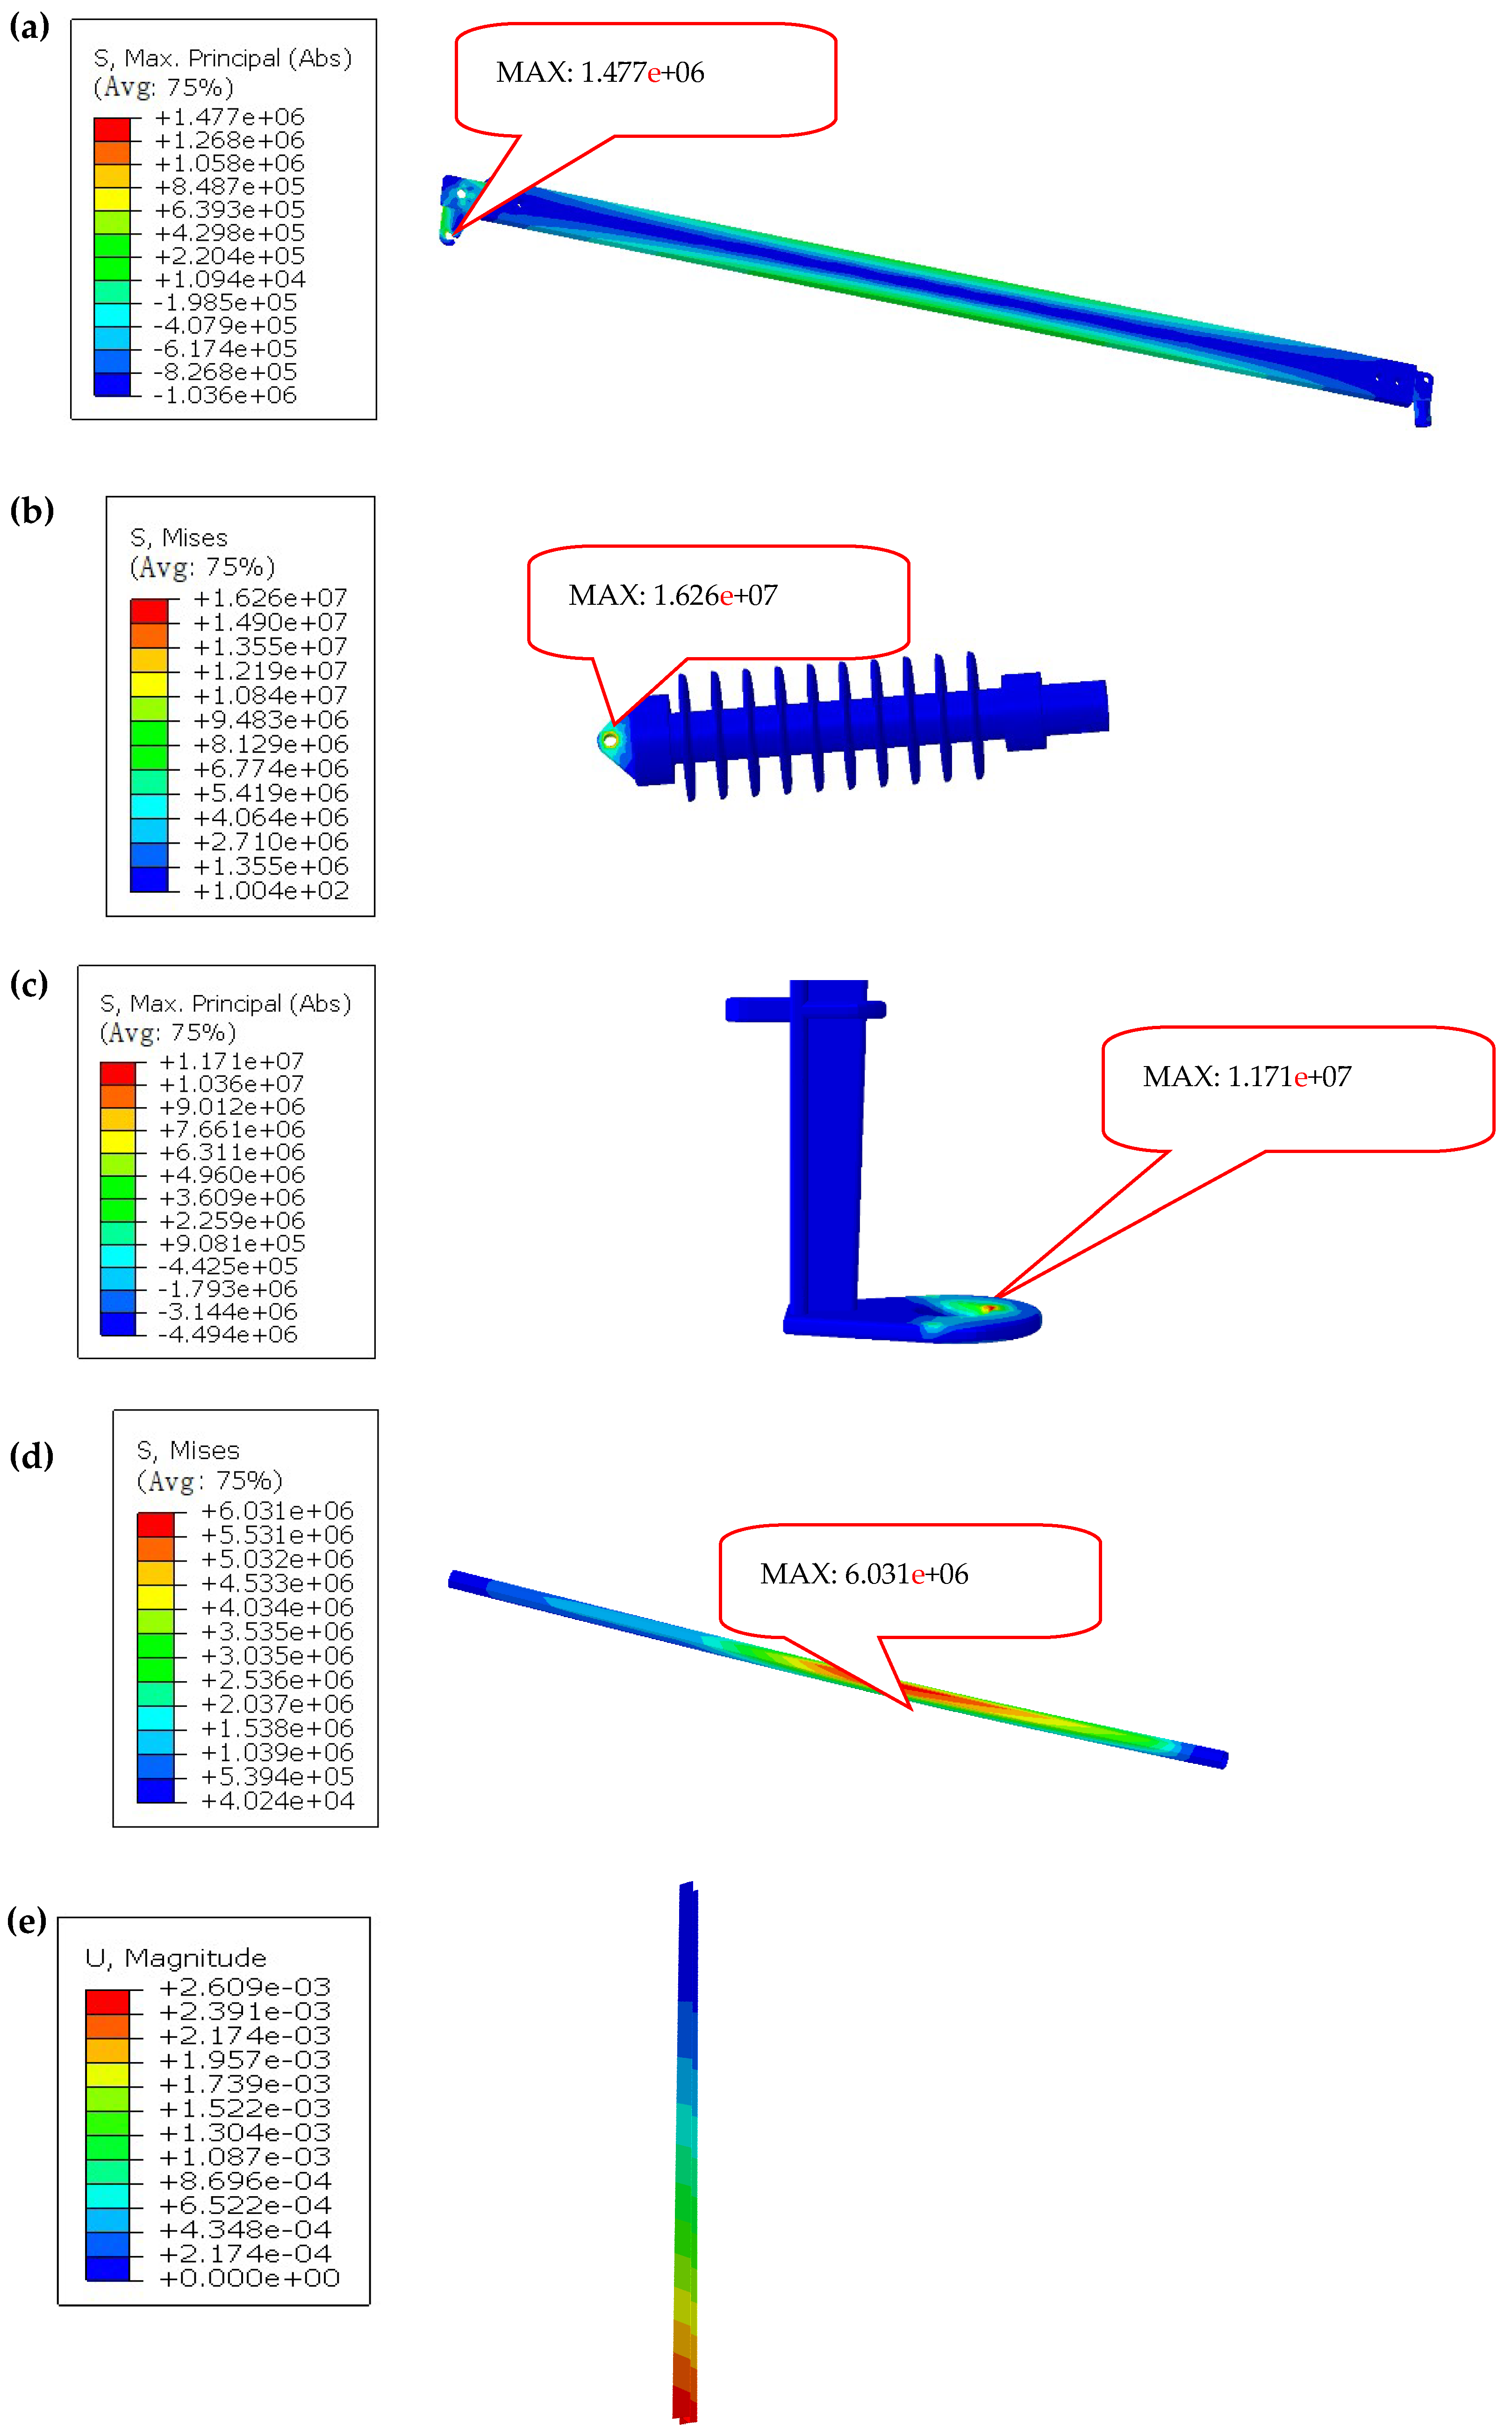
Before dynamic analysis, gravity should be applied to the structure to ensure that it reaches static equilibrium. The following figure shows the maximum stress nephogram of the typical dangerous parts of the catenary support structure under the action of gravity and the maximum displacement nephogram of the catenary pillar.
Figure 19 shows that in the natural state, the catenary support structure mainly bears the effect of self-weight, the overall stress level of the dangerous parts is not high, and there is only an obvious stress concentration at the transverse cantilever. The maximum displacement of the column top under gravity is 2.609 mm. On this basis, the dynamic characteristics of the contact support structure under single- and multiple-train operating conditions are analyzed in detail in this paper.
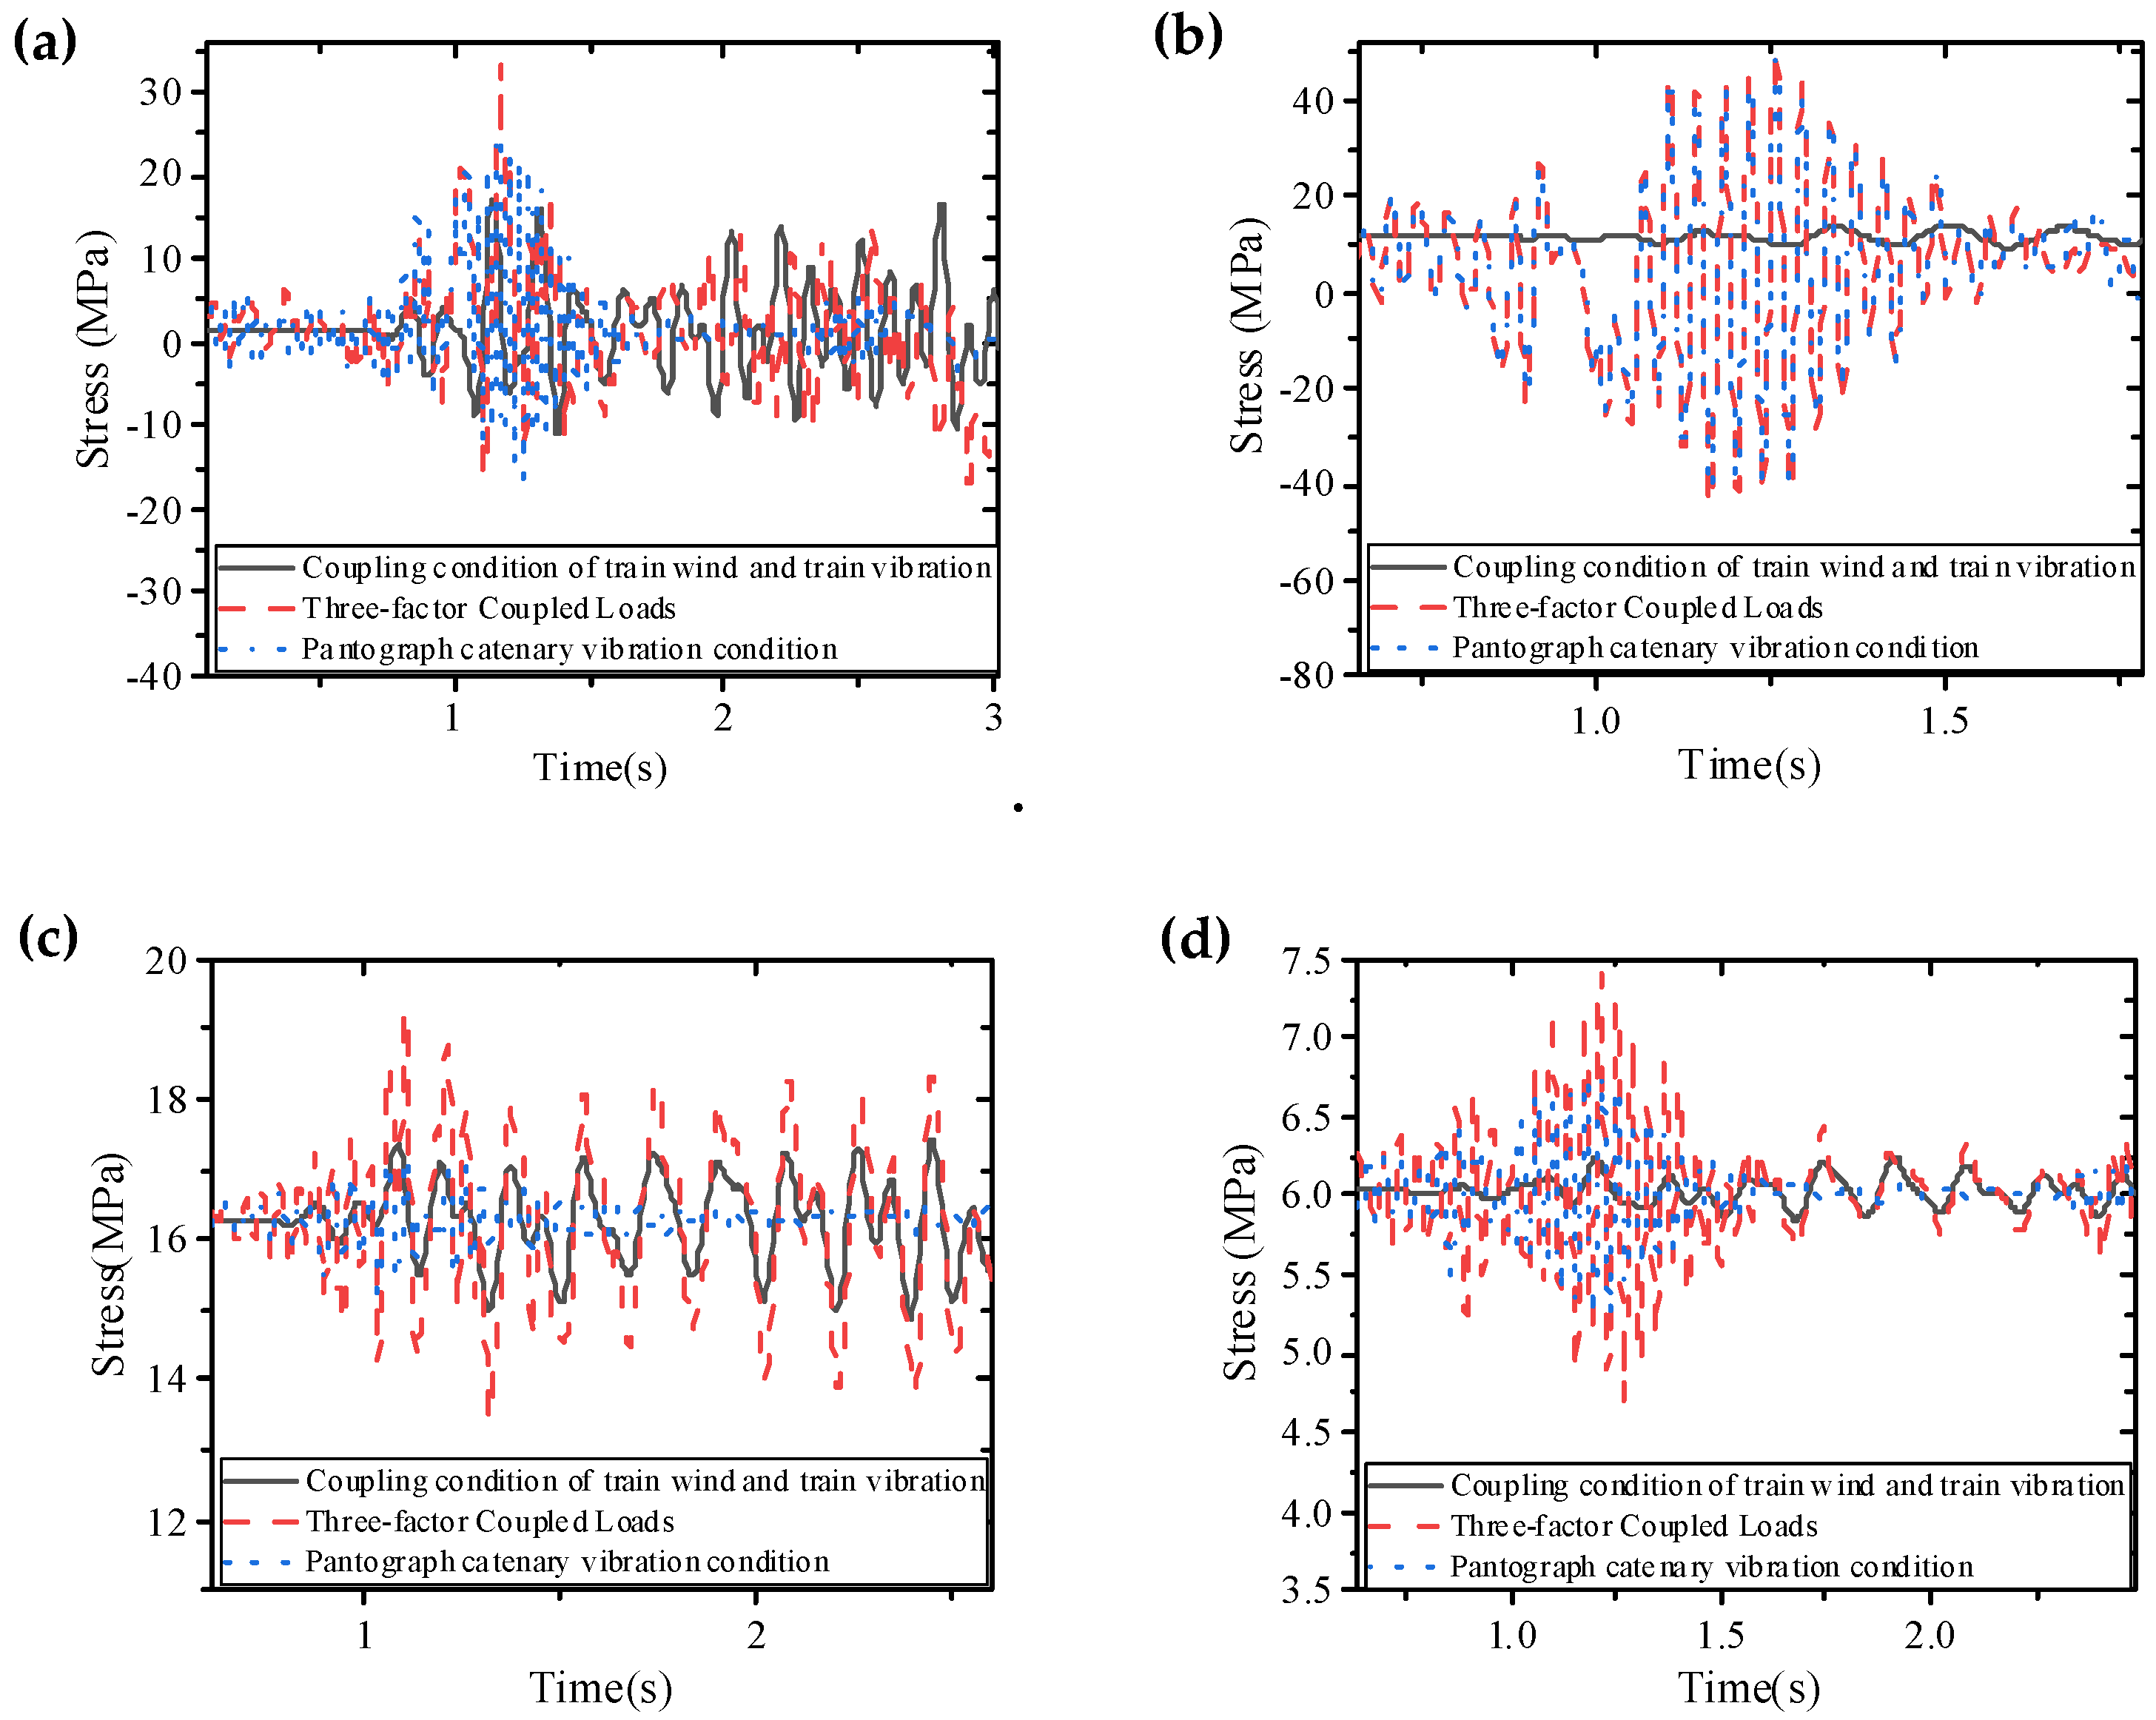
On the basis of Section 2, this section analyzes the response of the support structure under three coupling conditions. Figure 20 shows the stress time history curves of four dangerous parts under the coupling conditions of train wind and train vibration, pantograph catenary vibration and three coupling conditions.
Figure 20 shows that when the train speed is 400 km/h, the stress fluctuation level at each part has increased to varying degrees compared with that of a single action. At this time, the position with the largest stress fluctuation level also appears at the positioning support, with a maximum positive stress of 52.12 MPa, which increases by 16.3% compared with that when the pantograph catenary vibration is acting alone, and the maximum negative stress is −44.36 MPa, an increase of 17.6%. The overall trend is basically the same as that when the pantograph catenary vibration is acting. This is mainly because the pantograph catenary vibration is more intense in the vertical direction. In the process of train operation, the positioning support and the positioning pipe are connected closely by bolts, so the positioning support is also most affected in this direction. Finally, the stress fluctuation is dominated by the pantograph catenary vibration load. The alignment of the positioning limiter is poor, which is also determined by its connection nature. This part is similar to the positioning support in the hinge joint (but has damping, friction and stiffness) and is connected with the contact line in the form of a similar high-strength spring, so its stress state is affected not only by the vertical load (pantograph catenary vibration) but also by the other two directions (train wind and train vibration), so the stress time history curve is poor in agreement with the curve under a single load.
The stress response and amplitude comparison of the dangerous parts of the catenary support structure in Table 7 are further given. The data in the table indicate that the multiload coupling significantly aggravates the stress response of the positioning support: the maximum positive/negative stress is 16.3% and 17.6% greater than that of the pantograph catenary alone, which verifies the load synergy effect. The positive stress of the limit positioner increased by 18.5%, but the negative stress decreased by 5%, indicating that the coupling effect changed the local stress direction. However, in general, the catenary support structure is weaker under the three kinds of load coupling, which should be considered.

4. Fatigue Life and Reliability Analysis of Catenary Support Structures

In the field of modern rail transit, as the key structure for ensuring the power supply of trains, the fatigue failure of contact support structures has become a severe challenge under the continuous action of train running loads. This section focuses on the catenary support structure and uses the fatigue analysis method to carry out in-depth fatigue life calculations for its dangerous parts. On the basis of the basic theory and method of reliability, combined with the corresponding relationship between the stress and fatigue life of the catenary support structure, the fatigue limit state equation is established, the probability distribution characteristics of each random variable in the state equation are statistically analyzed, and then the fatigue reliability of the catenary support structure is evaluated.

4.1. Fatigue Life Analysis of Critical Areas in Catenary Systems

This study employs the nominal stress approach integrated with the Palmgren–Miner linear damage rule and published S–N curves—a methodology chosen for its wide adoption in international design codes (such as IIW recommendations and Eurocode) and practicality in high-cycle fatigue engineering where stresses remain predominantly elastic. This approach involves simplifying assumptions: Miner’s rule assumes linear damage accumulation regardless of the load sequence, whereas real-world overloads can retard or accelerate crack growth, making nonlinear models potentially more accurate for complex sequences; additionally, the nominal stress method is less sensitive to localized plasticity and high stress gradients, which local strain or fracture mechanics approaches might better capture. However, for the high-cycle fatigue regime of catenary support structures under random loading, the linear model typically provides conservative and reasonably accurate life estimates. Critically, this study’s primary goal is not to predict absolute fatigue life with precision but to assess the relative impact of operational parameters (speed, traffic frequency) and identify critical components, for which the S–N/Miner approach offers a robust, standardized framework. A sensitivity analysis perturbing the fatigue strength exponent b by ±10% revealed steady arm bracket fatigue lives at 400 km/h ranging from 13.2 to 17.8 years (baseline 15.3 years). These findings are further supported by the nonlinear damage analysis introduced in the article, where a recalculation using the Chaboche nonlinear damage rule yielded a life estimate of 17.1 years compared with Miner’s 15.3 years, and a ±10% variation in the S–N slope b resulted in an approximately ±12% change in predicted life. Importantly, the 55% life reduction from 250 km/h to 400 km/h far exceeds the scatter introduced by methodological choices, confirming that the core comparative conclusions—particularly the critical role of the steady arm bracket and the steep decrease in life with speed—remain valid and robust despite uncertainties in absolute life prediction, a bias that is now explicitly acknowledged.
In this section, we focus on the four dangerous parts, carry out a detailed calculation of fatigue damage and fatigue life, and conduct an in-depth analysis of the results obtained. We select the stress time history response samples of the catenary support structure when the train speed is 250 km/h, calculate the fatigue damage and life of each position through these data, and then explore the unique properties of these key parts in terms of fatigue damage.
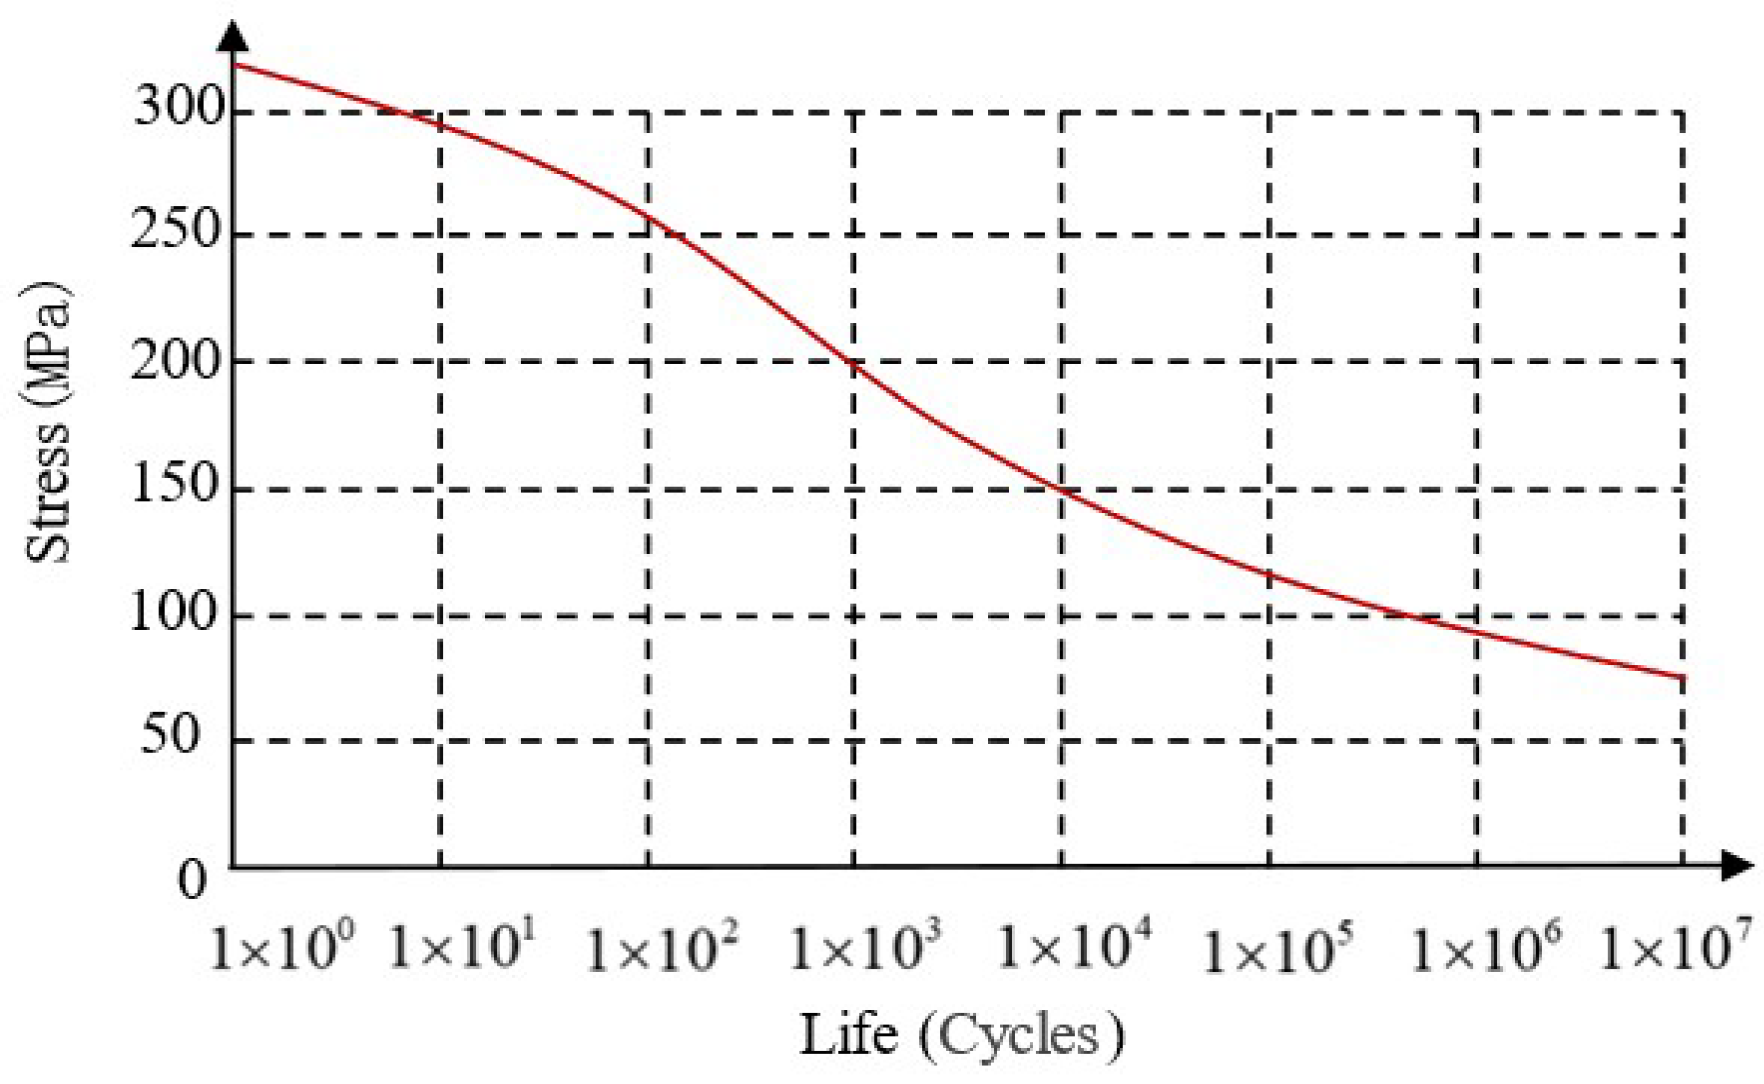
When calculating the fatigue life of a catenary support structure, it is necessary to consider the traffic frequency of trains. Combined with the basic situation of high-speed rail operation frequency in China, the following table shows the operation frequency of common railway lines in China. According to the data in Table 8, the number of traffic times in a single day is taken as 100, and assuming the normal traffic of high-speed rail throughout the year, the S–N curve [48] of aluminum alloy material is shown in Figure 21.
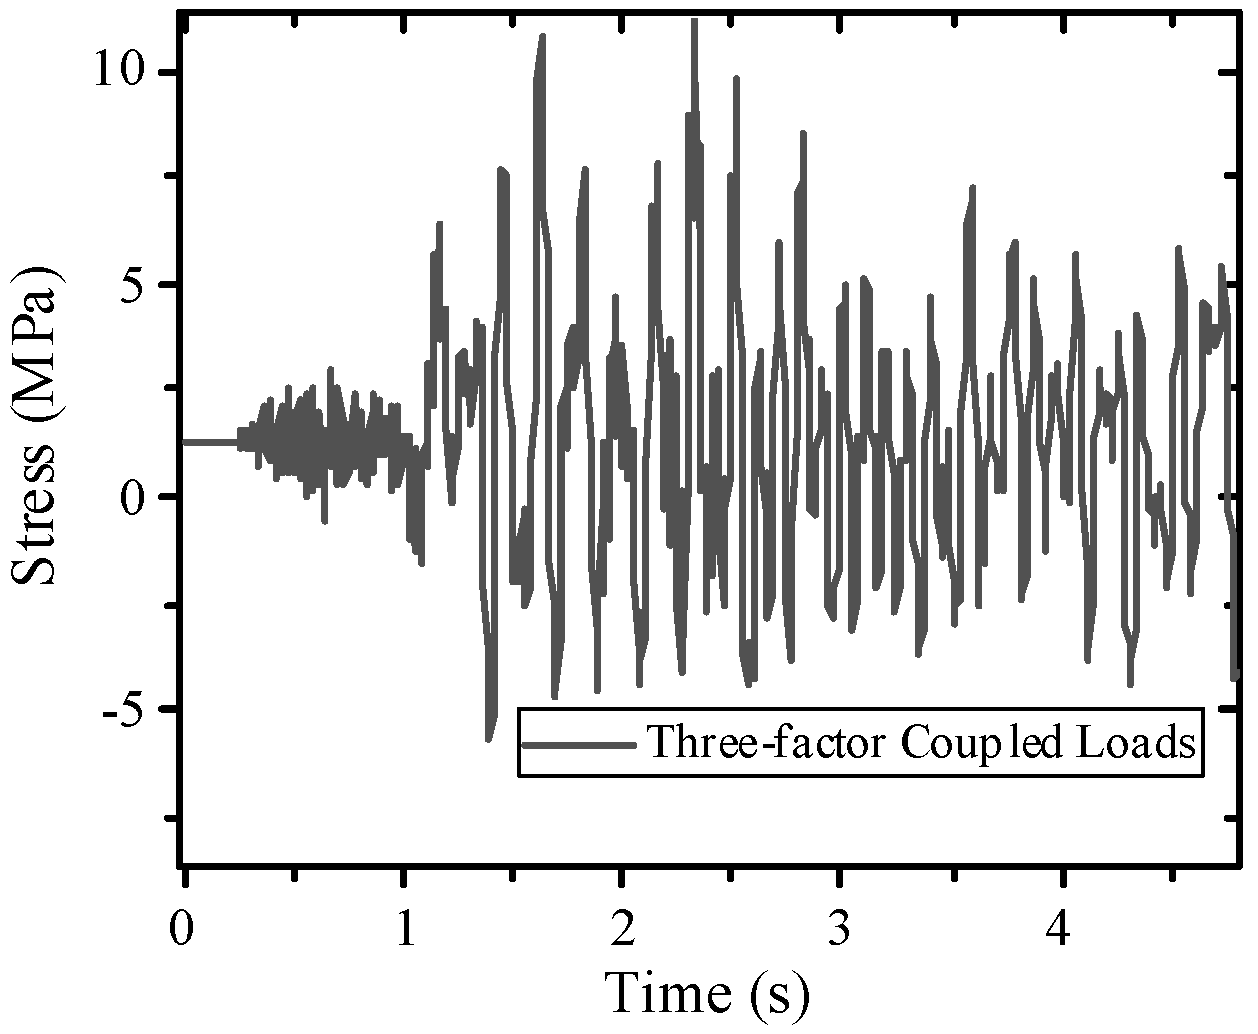
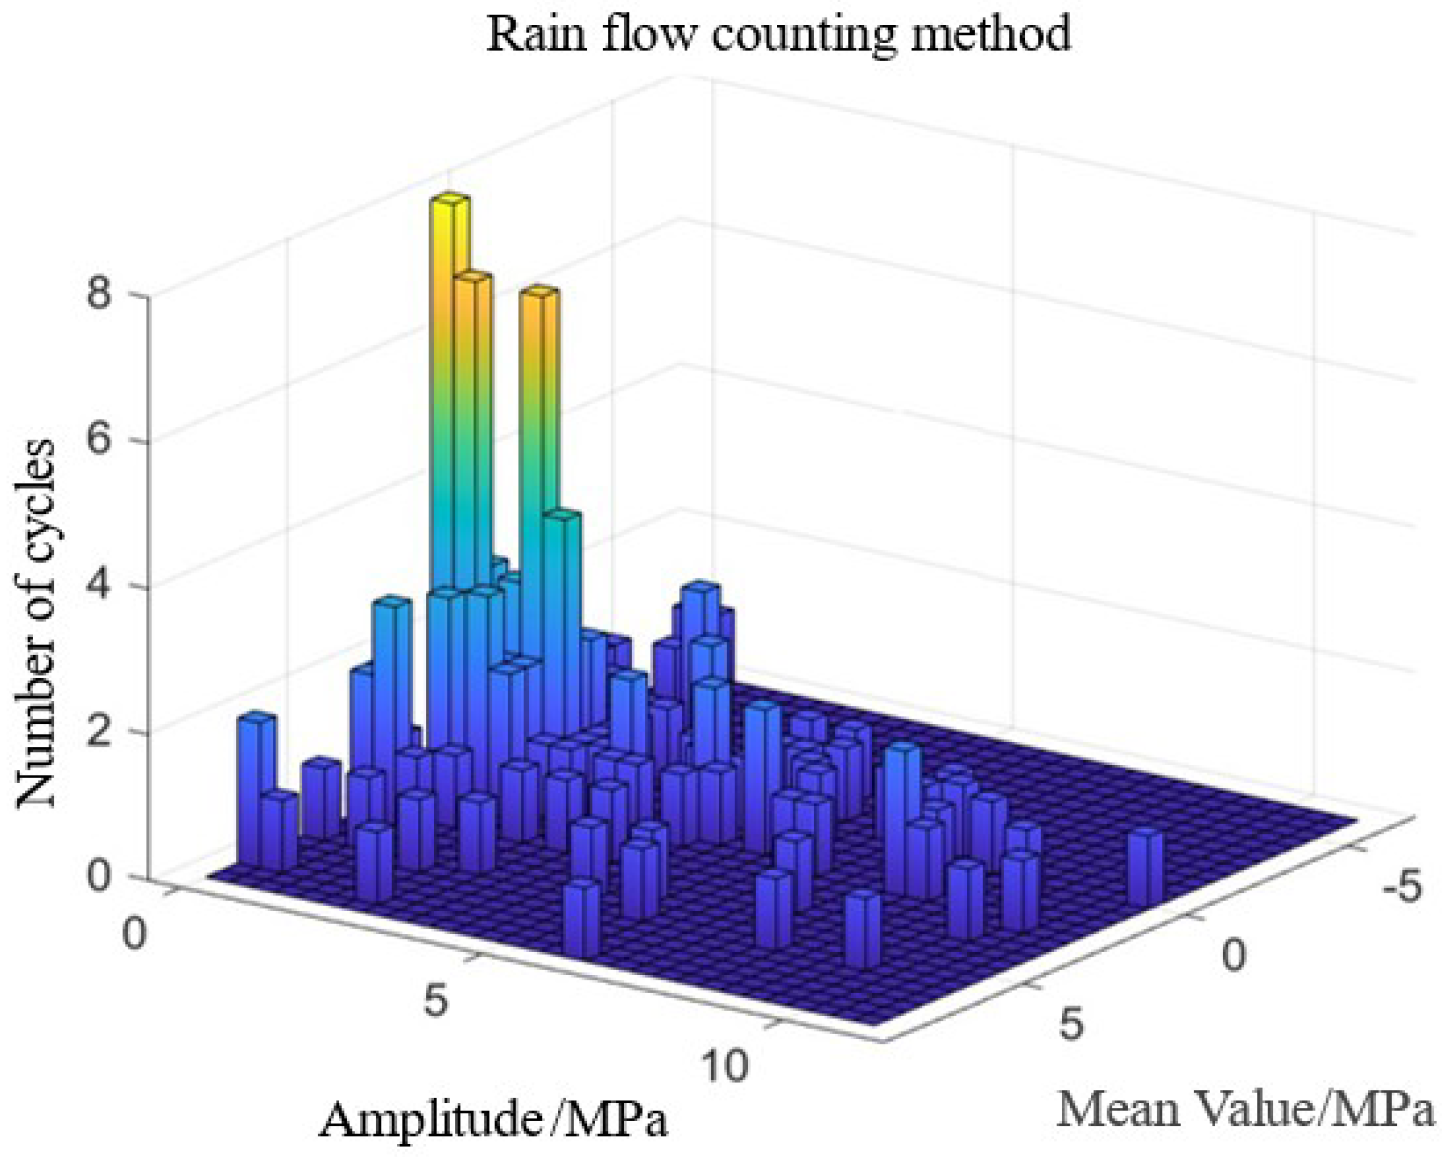
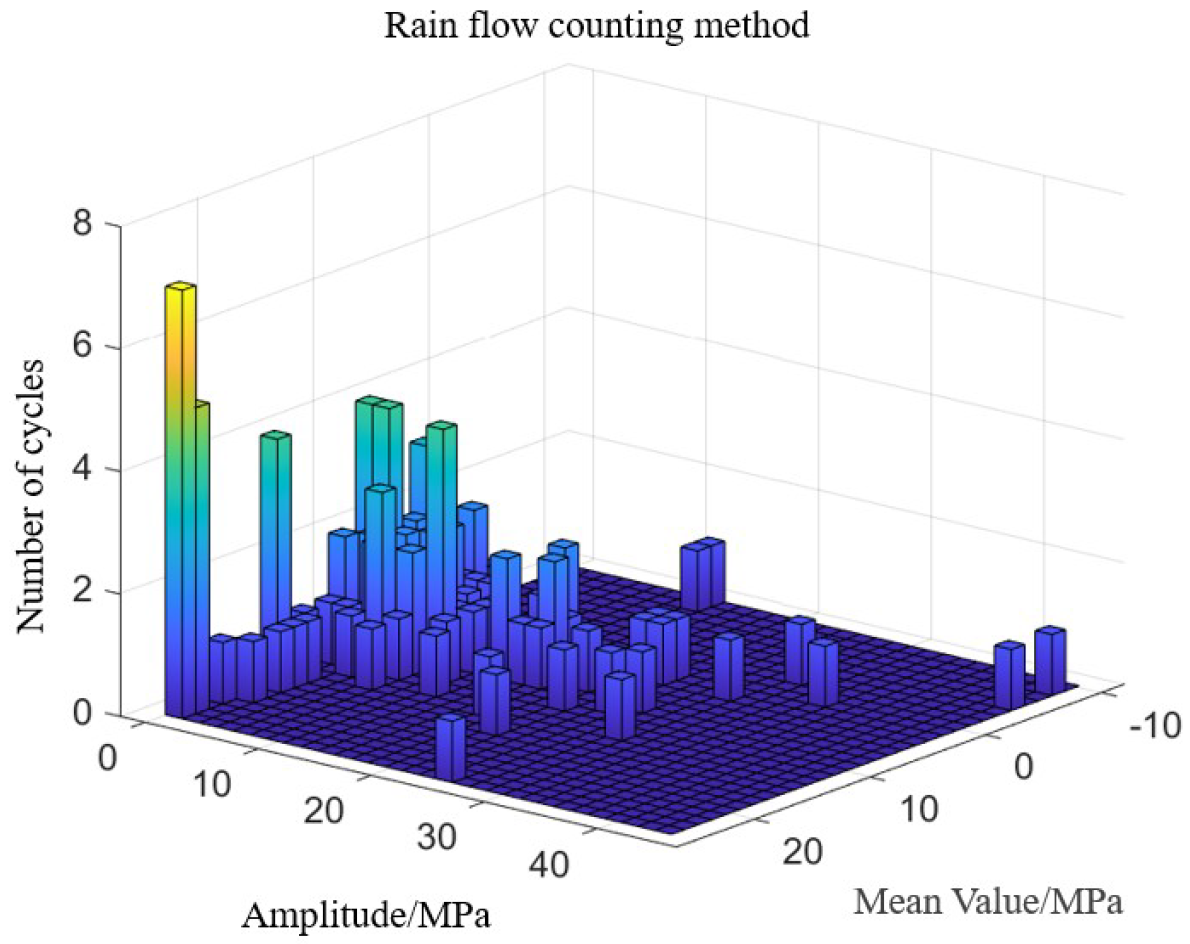
Through the rain flow counting method, the original stress time history is successfully transformed into multiple groups of fatigue loads, and each group of loads contains key information such as the average stress, stress amplitude and numbers of cycles. The results are shown in Figure 22 and Figure 23. Notably, the S–N curve is usually obtained through experiments without considering the influence of the average stress. Although the average stress has a relatively small influence on the fatigue life of the structure, to ensure the accuracy of the calculation results, the modified Gerber method is used to correct the average stress in this paper. The fatigue life of the catenary support structure can be more accurately evaluated by converting the cyclic stress of the catenary support structure in the actual operation state into symmetrical cyclic stress with a zero mean value. Table 9 shows the stress amplitude statistical results and fatigue damage calculation results at the limit positioner.
For the position of the limit positioner, when the stress amplitudes are 1.38 MPa, 2.73 MPa, 4.08 MPa, 5.43 MPa, 6.66 MPa, 7.73 MPa and 13.52 MPa, the corresponding cycle times are 32, 18, 17, 16, 11, 4 and 2, respectively, according to the load spectrum. Combined with the data in Table 9 of the material S–N curve and the calculation method given in reference [49], the fatigue life under single train operation conditions is calculated to be 3.18 × 10⁶. Then, the fatigue damage D i an be calculated.
D i = 1 3.18 × 10 6
According to the calculation results of fatigue damage, the fatigue life limit of the train passing through the supporting structure at 250 km/h is calculated in years, considering the higher departure frequency. The number of high-speed trains passing every day is assumed to be 100 pairs. Each unidirectional train passing is considered to experience fatigue damage, and each train is considered to experience the same degree of loading. The calculation method is consistent with the fatigue life method calculated in reference [49]. Therefore, the degree of fatigue damage caused by each year is as follows:
D y = D i × 365 × 100 × 2 = 0.023
When the train passes through the catenary support structure at 250 km/h, the calculated life of the position of the limit locator of the catenary support device is as follows:
T = 1 D y
Therefore, when the train passes through the existing structure at 250 km/h, the fatigue life at the position of the limit locator of the catenary support structure is 43.56 years.
According to the above process, the fatigue damage of the positioning support, the cross cantilever connection and the inclined cantilever are calculated, and the results are shown in Table 10.
The analysis results reveal that under cyclic stress, the fatigue life of the steady arm bracket during a single train passage is 2.52 × 10⁶ cycles, indicating that the fatigue damage at the steady arm bracket is more pronounced than that at the limit stop. This component demonstrates higher sensitivity and a greater propensity for failure under train operating conditions. In contrast, the horizontal and inclined cantilever arms exhibit fatigue lives exceeding 1 × 10⁷ cycles under a single train passage. According to Reference [48], structures with cycle counts greater than 1 × 10⁷ can be classified as having infinite fatigue life.
However, it is important to realize that the nominal stress approach combined with rainflow counting and Miner’s linear cumulative damage rule, while a well-established industry standard due to its practicality and extensive material data support, may introduce biases in long-term life prediction under complex fluctuating loads. For example, Miner’s rule ignores load sequence effects, although it typically provides conservative and reasonably accurate estimates for high-cycle fatigue scenarios such as those of catenary support structures. The nominal stress method may not fully capture local stress states in complex connections, which this study addresses by focusing on hotspot locations and using appropriate S–N curves. The choice of the Gerber method for mean stress correction, which is less conservative than the use of the Goodman method, can also influence the results, albeit to a lesser extent than the load spectrum uncertainty. Nevertheless, this methodology offers a robust framework for comparative analysis, enabling reliable assessment of the relative impact of increased train speed and traffic frequency on catenary support structure degradation rather than absolute fatigue life prediction, with the study’s conclusions about component criticality and operational parameter effects remaining valid within this framework.
4.2. Fatigue Life of Structures Under Different Train Speeds

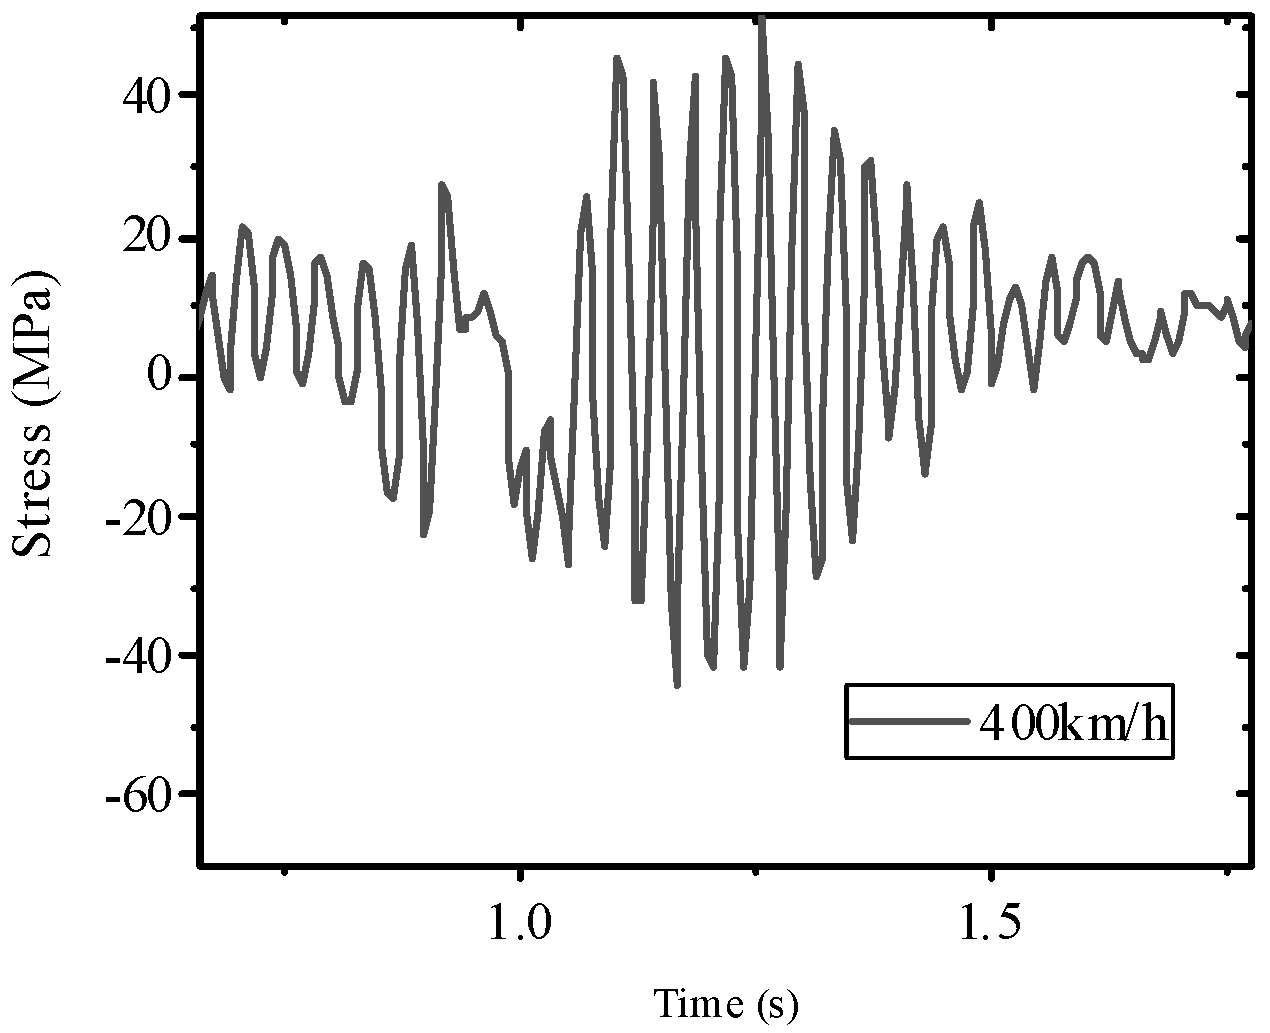
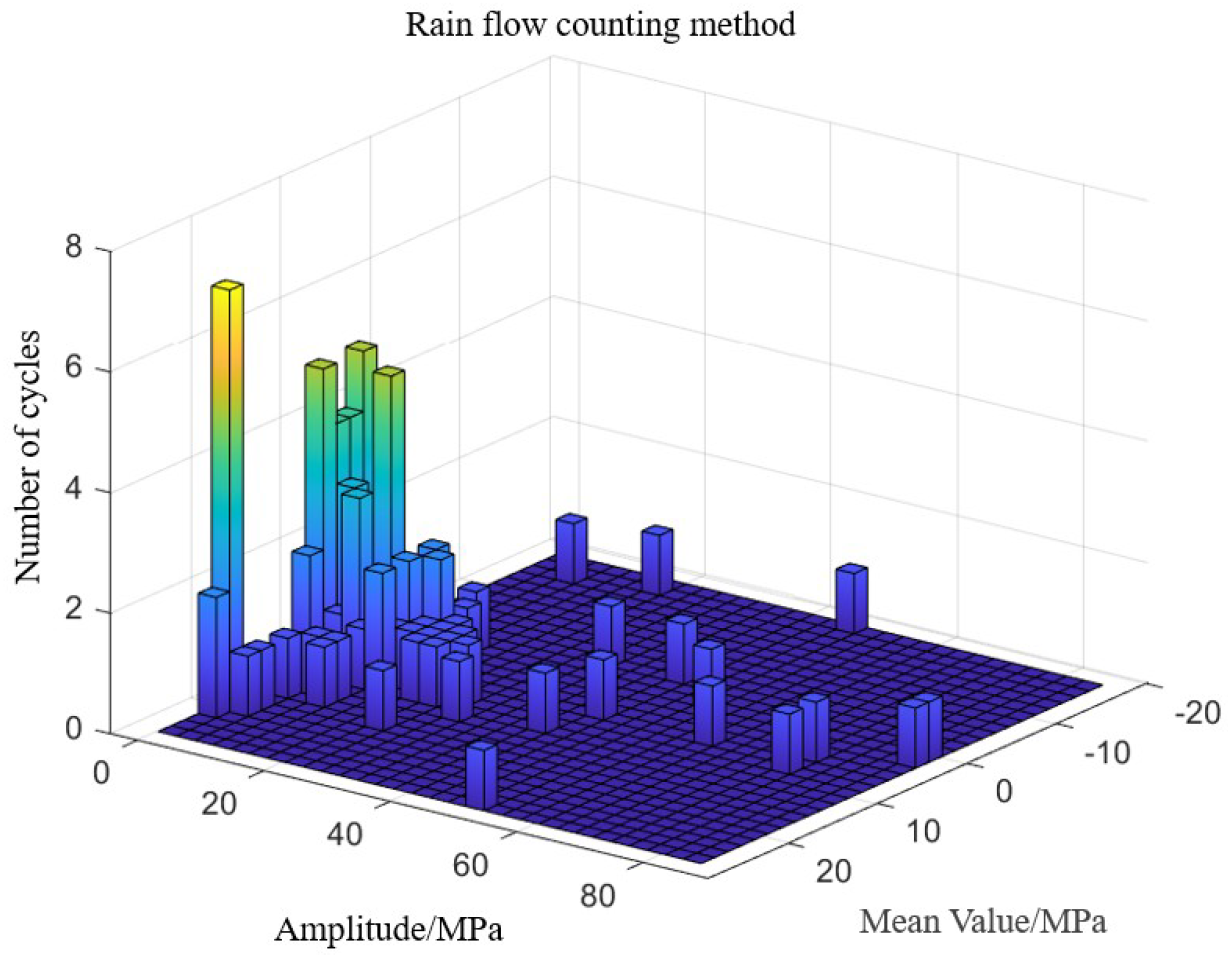
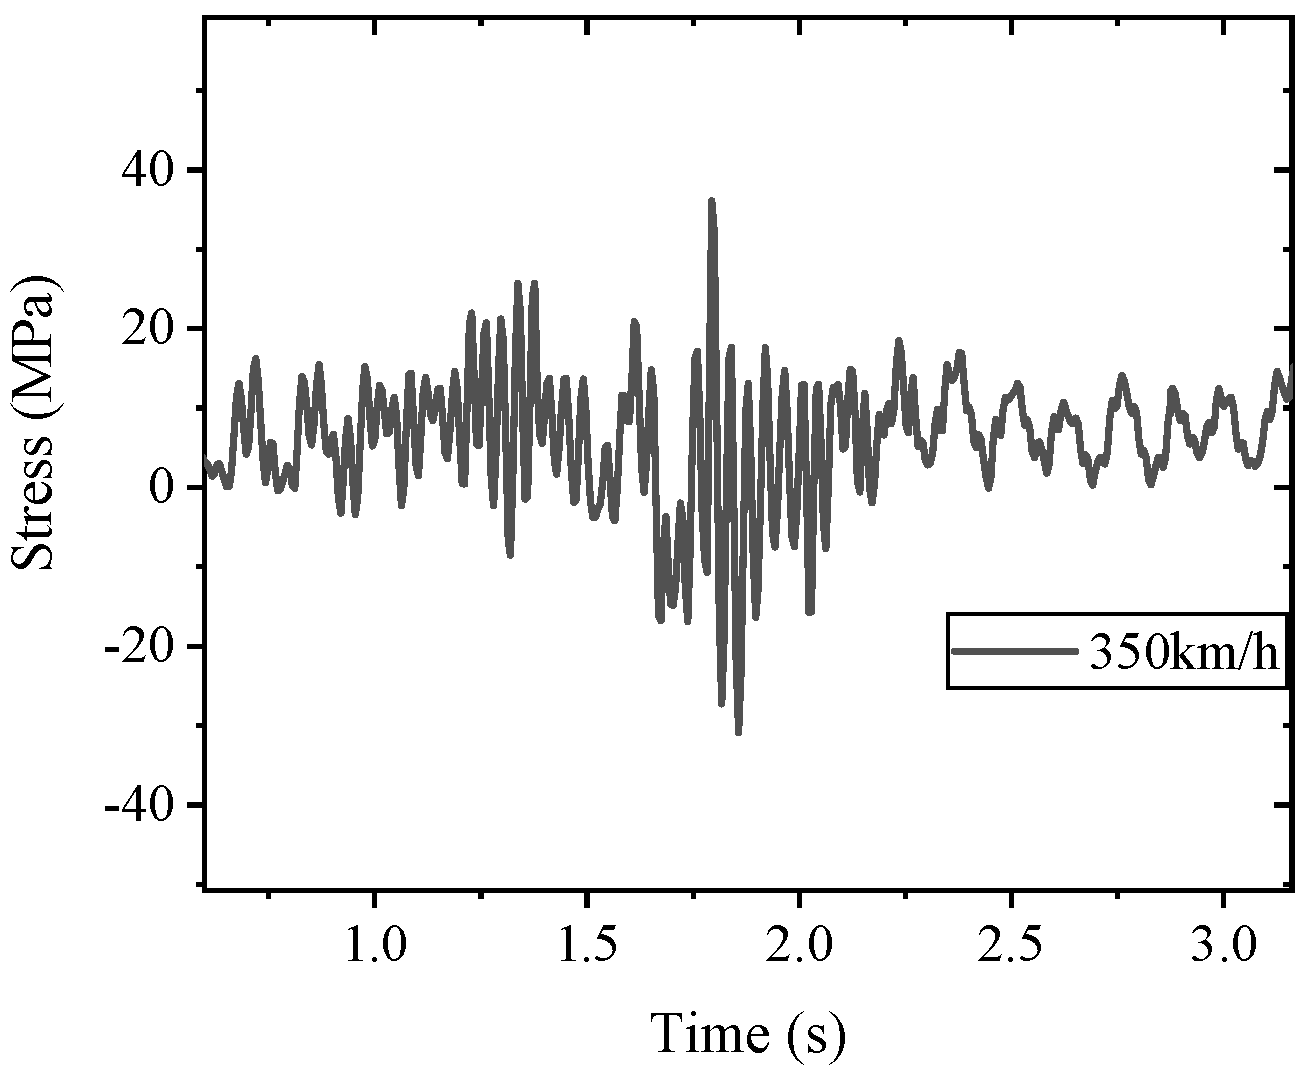
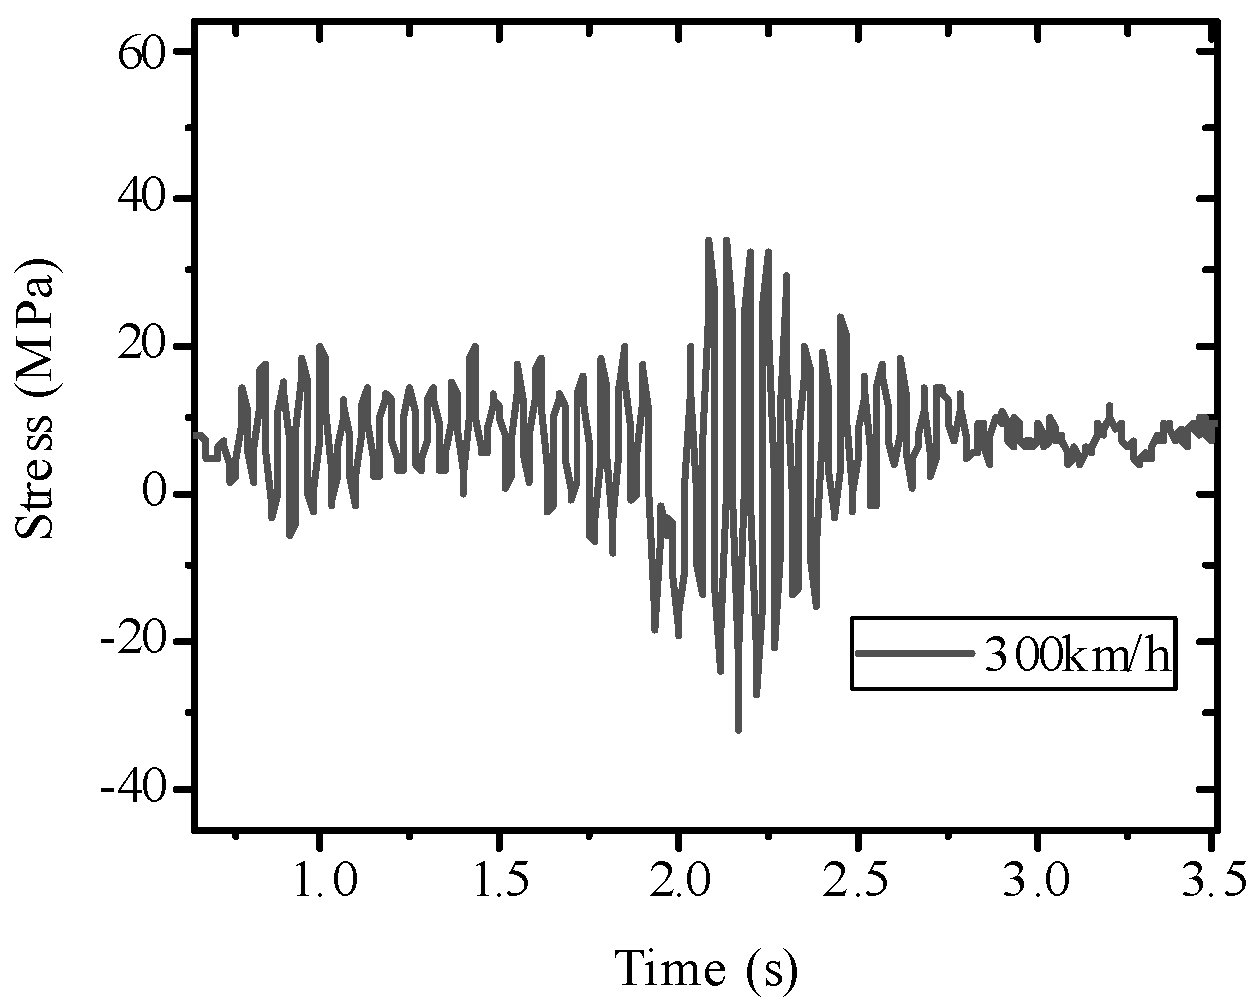
This section further analyzes the fatigue life of catenary support structures under different train speeds, using the steady arm bracket as a case study. For a train speed of 400 km/h, the corresponding stress time-history curves and load spectra at the steady arm bracket are detailed in Figure 24 and Figure 25. Similarly, at 350 km/h, these metrics are presented in Figure 26 and Figure 27, while at 300 km/h, they are illustrated in Figure 28 and Figure 29.
Combined with the calculation method in Section 4.1 and the calculation results when the train speed is 250 km/h and assuming that the train traffic frequency is 100 times, the annual fatigue damage and fatigue life of the positioning support at train speeds of 250 km/h, 300 km/h, 350 km/h and 400 km/h are shown in Table 11.
Table 11 shows that as the train speed increases from 250 km/h to 400 km/h, the annual fatigue damage increases from 0.029 to 0.065, indicating that the speed increase significantly accelerates damage accumulation. The corresponding fatigue life is reduced from 34.48 years to 15.27 years. For every 50 km/h increase in speed, the life is shortened by approximately 40–50%. This is mainly due to the increase in the train vibration load, pantograph catenary vibration load and train wind load caused by the increase in speed, resulting in a higher stress amplitude and more frequent stress cycles, which directly aggravate fatigue damage. The hook and loop connection of the positioning support directly bears the pantograph catenary vibration load, and its hook and loop connection is prone to stress concentration, which is one of the weakest fatigued parts in the catenary support structure. Therefore, in high-speed lines, the use of detection technology to evaluate crack initiation regularly is recommended. The structure should be overhauled and replaced in time to improve its service life. Reference [48] reported that the predicted life of a catenary support structure under the action of pantograph catenary vibration alone is approximately 27 years when the train speed is 350 km/h. Compared with the calculation results in this paper, various loads under train operation have a certain impact on the life of the catenary. At this time, the predicted life of the catenary support structure is reduced by 27.65%, which further proves the necessity of considering the multiload coupling effect.

4.3. Fatigue Limit State Equation of the Catenary Support Structure

In this section, on the basis of theories of structural resistance and load effects, a fatigue limit state equation for a catenary support structure is constructed. Through rain flow counting processing of the structural stress time history, the stress cycle sequence with a difference in amplitude and median value can be extracted. If the independent reliability analysis of each stress cycle is directly carried out, it is necessary to establish a multiple-fatigue state equation, which will lead to an exponential increase in computational complexity. Therefore, the equivalent life theory is adopted in this study to convert the nonconstant amplitude stress cycle into an equivalent representation form with constant amplitude. The process is mathematically modeled by Equations (7)–(9). On the basis of the S–N curve characteristics of aluminum alloy materials, the structural life corresponding to any stress can be characterized via the following formula:
S i = a b lg N i  
According to the equivalent life criterion, the multistage stress cycle is converted into a constant-amplitude equivalent stress with equal life, and its mathematical expression is as follows:
S r e = σ r e f t = a b lg 1 1 N 1 + 1 N 2 + + 1 N n
Through parameter optimization and formula derivation, the standard form of the fatigue equivalent stress can be obtained.
S r e = a + b lg 1 N i
The mapping relationship between random stress and constant amplitude stress can be established by substituting these effective forces into the S–N curve.
S r e = a + b lg 1 0 a S i b
The formula reveals the equivalent conversion mechanism between the random stress spectrum S and the constant amplitude equivalent stress S r e under experimental conditions. The measured random stress with an arbitrary probability distribution can be converted to a constant amplitude equivalent value through Equation (10). When a random-parameter fatigue test cannot be carried out, this method can transform the reliability evaluation problem under random loading into an equivalent analysis problem with a constant-amplitude load.
After the equivalent stress levels at critical nodes are determined, the fatigue limit state equation is established on the basis of linear cumulative damage theory. By selecting the total cumulative damage as the reliability assessment metric, the fatigue performance function can be defined as:
g ( X ) = Δ D
In the equation above, Δ is the critical fatigue damage index at which structural failure occurs, and D represents the total cumulative damage calculated under cyclic loading, which can be derived via Equation (11).
For a specific S–N curve, the fatigue limit state function can be expressed as:
g ( X ) = Δ 1 0 S r e a b
In the equation above, a and b represent the slope and intercept characteristics of the S–N curve, respectively, and their specific values are determined through material fatigue tests.

4.4. Distribution of Equivalent Stress Amplitudes Under Random Parameters

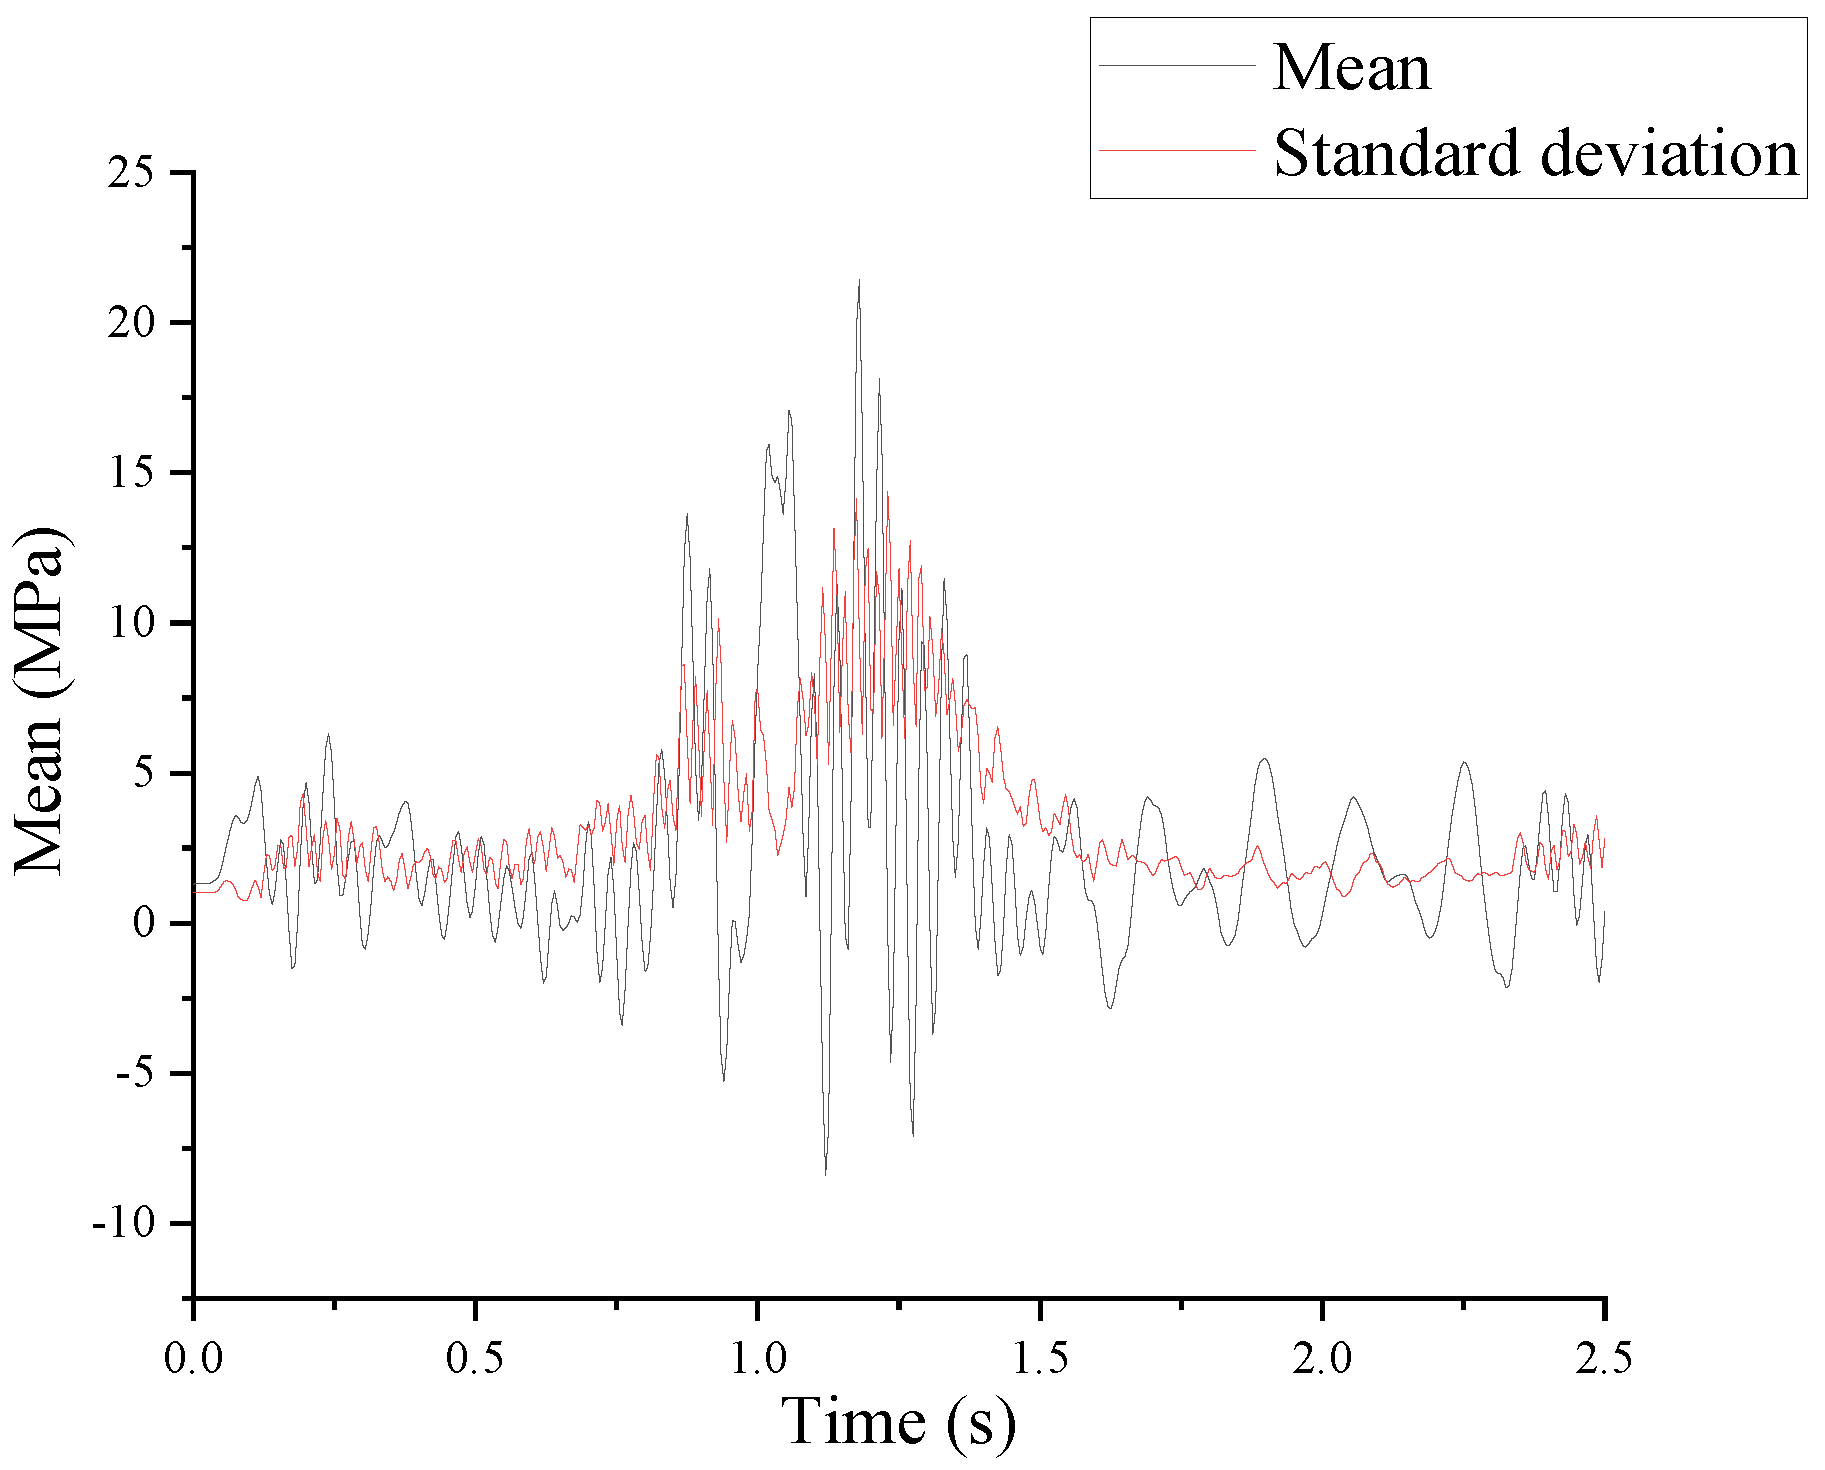
In this section, 100 sets of uncertain parameters were sampled via the Latin hypercube sampling (LHS) method. Finite element software was subsequently employed to compute 100 sets of stress cycle data under stochastic time-history loads at the limit stop location, as illustrated in the figures. These 100 datasets were first converted into stress amplitudes via the rainflow counting method, and then the equivalent stress amplitude distribution was calculated via Equation (12). The resulting equivalent stress distribution histogram and its fitted curve are shown in Figure 30. Figure 31 shows 100 sets of mean values and standard values of the equivalent stress within 0~2.5 s.
Owing to space constraints, the above only illustrates the process of obtaining statistical parameters for equivalent stress amplitudes Sre at the limit stop. A total of 100 sets of equivalent stress amplitude data from this component were statistically analyzed, and the frequency distribution histogram (Figure 32) was plotted on the basis of the mean values and standard deviations (Figure 31). Table 12 shows the types of probability distributions for different random variables. The results of the Kolmogorov–Smirnov (K–S) goodness–of-fit test indicated that the normal distribution provided the best fit for the data.

4.5. Fatigue Reliability Analysis of Catenary Support Structures

4.5.1. Fatigue Reliability Analysis Methods

In the preceding sections, the fatigue reliability equation for the catenary support structures and the probability distributions of the relevant variables were established. This section focuses on the computational solution of the reliability index and the analysis of the computed results.
In this study, fatigue reliability assessment of the structure was conducted by generating 100 sets of random parameters via Latin hypercube sampling (LHS), performing finite element analysis (FEA) to obtain 100 sets of stochastic stress time–history data, deriving key statistical parameters, and finally applying the Monte Carlo method. The specific workflow is as follows:
(1)
Through a literature review and Latin hypercube sampling (LHS), multiple sample points x 1 , x 2 , , x n were generated. Finite element analysis (FEA) was applied to perform structural response analysis Y x on these points, which were then used as initial samples. Key statistical parameters (e.g., mean, standard deviation, distribution type) were extracted from the analysis results.
(2)
Pseudorandom number generation
The congruential algorithm (Equation (13)) is employed to generate a uniformly distributed pseudorandom number sequence μ = { μ 1 , μ 2 , μ n } , with its output values strictly bounded within the interval (0, 1).
x i = ( a x i 1 + c ) mod   m
(3)
Generating random numbers of independent variables under a given distribution
If the random variable follows a normal distribution, the pseudorandom number sequence generated by the aforementioned method can be paired sequentially in groups of two (denoted as μ 1 , μ 2 , μ n ). Let μ n , μ n + 1 represent one such pair. These uniformly distributed numbers can be transformed into a normally distributed random variable X n , X n + 1 with mean m x and variance σ x via the Box–Muller transform:
X n = m x + σ x ( 2 ln μ n ) 1 2 cos ( 2 π μ n + 1 )
X n + 1 = m x + σ x ( 2 ln μ n ) 1 2 sin ( 2 π μ n + 1 )
If the random variable has a lognormal distribution, the random number sequence generated by the above method is converted to a normal distribution random number, and then it is converted to a lognormal distribution random number. Assuming that the random sequence μ is transformed into a random number X i , which obeys a normal distribution, the random number Y i obeys a lognormal distribution and can be transformed via the following formula:
Y i = exp ( X i )
(4)
According to the generated random number of each variable, bring it into the limit state equation and calculate the function value Z i .
(5)
Calculate the failure probability of the structure.
Assuming that the total number of samples is N and that the number of samples of structural failure Z < 0 is n f , the failure probability of the structure can be obtained as:
P f = n f N

4.5.2. Fatigue Reliability Calculation Results

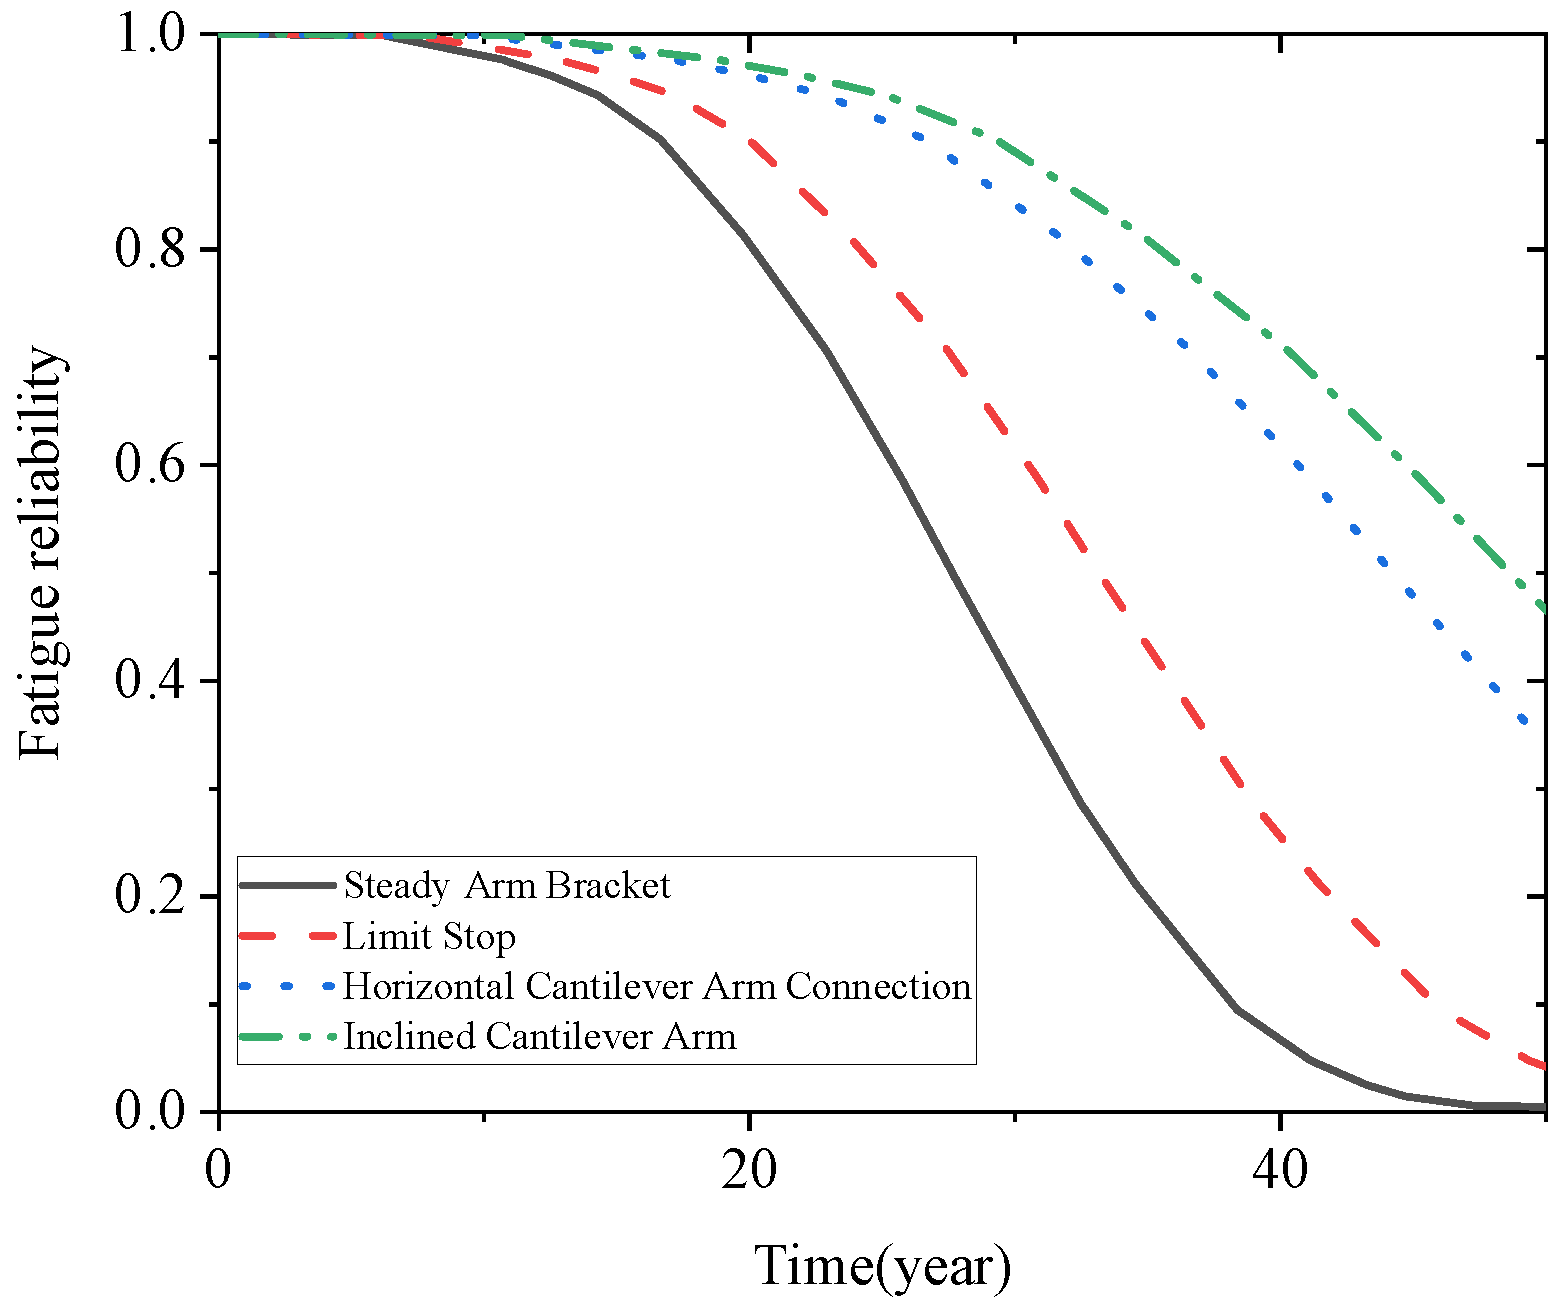
Following the aforementioned procedures, fatigue reliability calculations were performed via MATLAB 2021 programming, and the results were output after each sampling iteration. The time-dependent fatigue reliability curve for the limit stop in the catenary support structure was obtained under a train speed of 400 km/h and a daily traffic frequency of 130 passes. Through the same methodology, the 15-year and 20-year fatigue reliability values for the steady arm bracket, horizontal cantilever arm connection, and inclined cantilever arm under identical conditions (400 km/h, 130 passes/day) were computed. The results are illustrated in Figure 33 and summarized in Table 13.
According to the results in Table 13, the positioning support and the limit locator are directly subjected to the pantograph catenary vibration load because of the hook link connection, and the dynamic lifting and lateral offset of the contact line lead to stress concentration. The 15-year and 20-year failure probabilities of the positioning bearings are 6.4% and 18.8%, respectively. The reliability level is low. The reliability level of the connection between the transverse cantilever and the inclined cantilever is high, which is consistent with the life prediction of these two parts in this study. In addition, the reliability of all parts decreases with increasing service life, but the rates of decrease are significantly different. The reliability of the limit positioner and the positioning support decreased to 89.4% and 81.2%, respectively, in the past 20 years, indicating that the fatigue damage has accumulated rapidly and should receive more attention.
During the actual operation of high-speed trains, in addition to the uncertainty of material parameters inside the structure, there are also uncertainties in the external load forms of the structure, such as train speed and traffic frequency, which are limited in length and workload. Taking traffic frequency as an example, combined with data on traffic frequency, and taking the position of the limit locator as an example, this paper analyzes the impact of train traffic frequency on the fatigue reliability of the catenary support structure. When the daily traffic frequency of high-speed rail lines is 55, 70, 85, 100, 115, 130, 145, 160, 175, and 190, the calculation results of fatigue reliability are shown in Figure 34 below.
The above figure shows that as the number of train actions per day gradually increases from 55 to 190, the 15-year reliability of the limit locator in the catenary support device decreases from 98.6% to 92.5%, and the 20-year reliability decreases from 97.3% to 82.4%. The appropriate daily train traffic has a significant effect on the fatigue reliability of the limit locator. The fatigue reliability corresponding to different traffic frequencies decreased with time. The higher the traffic frequency is, the faster the reliability decreases. The reliability under the traffic frequency (190 times) in the figure has decreased to 0.4 in 30 years, which verifies the vulnerability of this part.
On the basis of the above conclusions about the fatigue reliability of the catenary support structure, when the train passes the line times with frequency, the reliability level of the limit locator and the positioning support is low, and the failure probability increases greatly with increasing time. When studying the fatigue reliability of a catenary support structure, this paper considers mainly the load generated by train operation. The figure shows that when the traffic frequency is greater than 130, the reliability of the structure has a significant inflection point at 15–20 years, which is basically the same as the 15–20 years overhaul period specified by the positioning device in the catenary overhaul management regulations. However, in the actual service process, the actual failure of a structure is also affected by natural wind, temperature changes, freezing and other external factors. The probability may be higher. Combined with the results of this section, for the two parts of the limit locator and positioning support, the traffic frequency exceeds 130 times. It is necessary to shorten the overhaul cycle. It is recommended that the overhaul cycle be 7–10 years. In addition, according to the calculation results, the reliability level of the connection between the transverse cantilever and the inclined cantilever is high (20 years ≥ 96%), meeting the requirements of long-term service. This essentially meets actual engineering needs.
The classification of horizontal and inclined cantilever arms as having “infinite life” is based on calculated stress amplitudes under operational loads (train-induced dynamics and wind) being significantly below the material’s fatigue limit (approximately 110 MPa for the aluminum alloy, as per the S–N curve in Figure 21), corresponding to a fatigue life exceeding 1 × 10⁷ cycles. Thus, the classification is based on a stress amplitude < 110 MPa (aluminum fatigue limit) and a cycle count > 1 × 10⁷. This engineering categorization implies that fatigue failure is unlikely under the design load spectrum within the structure’s intended service life. However, this conclusion is conditional on the study’s loading conditions, as severe environmental coupling effects—not fully modeled here—could invalidate this assumption through multiple pathways: icing-induced mass accumulation increasing mean stresses and dynamic amplitudes, potentially pushing stresses above the fatigue limit; extreme temperatures embrittling materials or reducing strength, with thermal cycling inducing additional stresses; and environmental corrosion creating surface pits as stress concentrators, thereby decreasing component fatigue strength. corrosion or ±30 °C thermal cycles can increase the mean stress and/or create stress concentrators, converting these members into finite-life components. Classification based on stress amplitude < 110 MPa (aluminum fatigue limit) and cycle count > 107. Icing, corrosion or ±30 °C thermal cycles can raise mean stress and/or create stress concentrators, converting these members into finite-life components. Quantitative knock-down factors (1.5 for ice, 1.25 for thermal cycling, 1.15 for mild corrosion) are provided in Table 13 for engineers who wish to re-run the reliability code with environmental priors. Thus, the “infinite life” designation applies to the standard operational environment considered in this analysis but may not hold for routes with extreme icing, large diurnal temperature fluctuations, or highly corrosive conditions.
A preliminary qualitative assessment of parameter sensitivity was performed by examining the correlations between sampled input random variables (such as the fatigue constants a and b and the equivalent stress amplitude) and the failure probability derived from Monte Carlo simulations. This analysis revealed that the fatigue exponent b and traffic frequency were among the most dominant factors influencing the reliability index. Although conducting a formal quantitative global sensitivity analysis—such as using Sobol’ indices or the Morris method—to systematically rank the contribution of each uncertainty source (including material parameters, load models, and environmental factors) to the output variance fell outside the scope of this study, subsequent Sobol’ indices based on 105 Monte Carlo samples quantitatively confirmed that the traffic frequency (45%), S–N exponent b (22%), and equivalent stress amplitude (18%) dominated the variance in the 20-year failure probability. Such an analysis is invaluable for guiding future data collection and model refinement efforts, as it identifies parameters requiring the most precise characterization, thereby representing a critical direction for our subsequent research.

5. Conclusions

In this study, the dynamic response characteristics, fatigue life and fatigue reliability of a catenary support structure under train operation conditions are discussed through comprehensive research methods involving numerical simulations and theoretical calculations. The main works and conclusions are as follows:
(1)
A scientifically rigorous framework for fatigue life prediction and reliability assessment of high-speed railway catenary structures is developed, integrating refined finite element modeling with probabilistic analysis under operational conditions. The framework quantifies dynamic response characteristics and fatigue evolution laws, providing a data-driven basis for safety evaluation and maintenance decision-making aligned with modern asset management principles.
(2)
Fatigue performance quantification reveals distinct behaviors among critical components: under 250 km/h and 100 daily trains, limit locators and positioning supports exhibit finite lives (43.56 and 34.48 years, respectively), whereas horizontal/inclined cantilevers demonstrate infinite life. A speed increase to 400 km/h increases the position support’s annual fatigue damage from 0.029 to 0.065, reducing its lifetime by 55.7% (15.27 years) and confirming accelerated degradation under ultrahigh-speed conditions.
(3)
Reliability analysis via Monte Carlo simulation reveals exponential decay with increasing service life under high-speed/high-frequency operation (400 km/h and 130 daily trains). Critical inflection points emerge: 15-year reliability decreases to 92.5% when daily traffic exceeds 130 trains, and 20-year reliability decreases to 82.4%, with significant failure risk concentrated between 15 and 20 years. Environmental coupling effects (wind, thermal cycling, and freezing) further increase the actual failure probability beyond the theoretical values.
(4)
Engineering recommendations include shortening overhaul cycles to 7–10 years for lines exceeding 130 daily trains. Condition based maintenance is prioritized through wireless strain gauges and UAV-mounted vision systems for real-time defect detection, enabling proactive safety protocols and compliance with advanced railway standards.
(5)
This study identifies transformative design challenges for next-generation systems exceeding 400 km/h, proposing carbon fiber composites, aerodynamic fairings, smart damping systems, and embedded piezosensors to address nonlinear fatigue escalation. This framework provides triple validation—standard compliance, quantitative risk mitigation, and strategic guidance—ensuring safety through early defect detection, material innovation, and optimized maintenance cycles while supporting the transition to predictive maintenance paradigms.

6. Limitations and Future Work

This study evaluated the fatigue reliability of catenary support structures under high-speed train loading, but several limitations should be considered when interpreting the results. The finite element model was calibrated primarily using modal parameters, whereas field validation of stress responses has not yet been carried out and is scheduled for a follow-up project. For practical reasons, the linear Miner rule was applied, and although its inherent bias was clearly stated, the method does not capture load sequence effects. Furthermore, the model assumed idealized material and geometric conditions without accounting for real-world defects such as weld flaws (for which statistical data are unavailable), corrosion, or manufacturing-induced microcracks that may initiate fatigue damage. The study also did not quantitatively incorporate coupled environmental factors; although temperature and icing effects were discussed qualitatively, they were not included in the probabilistic modeling, despite their potential practical influence.
Building on the Bayesian updating framework previously outlined—which integrates environmental priors (e.g., ERA weather data) with a stochastic finite element life model to derive posterior distributions updated by inspection data such as crack measurements, coating degradation, or UAV vision-based defects—future research will focus on addressing the limitations identified in the current study. These include the lack of field-validated stress responses, the use of a linear damage accumulation rule that omits load sequence effects, the assumption of ideal materials without real-world defects, and the qualitative treatment of environmental factors. To overcome these shortcomings, four key directions are planned: first, developing a probabilistic reliability model that incorporates multiphysical environmental loads, including random wind fields, time-varying temperature, and icing conditions; second, introducing advanced fatigue analysis methods such as nonlinear cumulative damage models that account for load sequence effects; third, integrating the probabilistic framework with structural health monitoring (SHM) data to combine physics-based models with real-time operational measurements (e.g., strain and vibration), enabling hybrid data–model-driven methods for dynamic uncertainty reduction and model updating; and finally, conducting field measurements and collaborative research to validate the proposed approaches. These efforts aim to provide theoretical and technical support for transitioning key components from periodic to condition-based intelligent maintenance.

Author Contributions

Conceptualization, G.Z. and C.X.; methodology, G.Z., C.X. and M.W.; software, G.Z. and M.Z.; validation, C.X., M.W. and G.Z.; formal analysis, C.X. and M.W.; investigation, M.W. and M.Z.; resources, M.Z.; data curation, C.X.; writing—original draft preparation, G.Z., C.X. and M.W.; writing—review and editing, G.Z., M.W. and M.Z. All authors have read and agreed to the published version of the manuscript.

Funding

This work was sponsored by the Natural Science Foundation of Henan (grant No. 222300420549).

Data Availability Statement

Data are contained within this article.

Conflicts of Interest

The authors declare that they have no conflicts of interest.

References

  1. Yang, Y. Simulation on the Dynamics of the Electric High-Speed Pantograph-Catenary System. Master’s Thesis, East China Jiaotong University, Nanchang, China, 2017. [Google Scholar]
  2. Tan, D.; Mo, J.; Peng, J.; Luo, J.; Chen, W.; Zhu, M. Research and Prospect on High-Speed Catenary Component Failure. J. South West Jiaotong Univ. 2018, 53, 610–619. [Google Scholar]
  3. Wang, Y.; Li, Y.; Lu, L.; Wang, F.; Wang, L.; Liu, Z.; Jiang, J. Numerical prediction for life of damaged concrete under the action of fatigue loads. Eng. Fail. Anal. 2024, 162, 108368. [Google Scholar] [CrossRef]
  4. Yin, Y.; Jiang, S.; Li, Q.; Wang, B.; Hu, H.; Guo, L. Research on the establishment of load spectrum for fatigue damage assessment of high-speed train bogie frame. Measurement 2025, 251, 117080. [Google Scholar] [CrossRef]
  5. Wang, D.; Luo, J.; Li, F.; Wang, L.; Su, J. Research on dynamic response and fatigue life of tunnel bottom structure under coupled action of train load and groundwater. Soil Dyn. Earthq. Eng. 2022, 161, 107405. [Google Scholar] [CrossRef]
  6. Qian, W.; Qi, T.; Yi, H.; Liang, X.; Jin, Z.; Lei, B.; Li, Y.; Li, Z. Evaluation of structural fatigue properties of metro tunnel by model test under dynamic load of high-speed railway. Tunn. Undergr. Space Technol. 2019, 93, 103099. [Google Scholar] [CrossRef]
  7. Xiang, X.; Zhang, H.; Zhang, F.; Yang, Z.; Xu, Q.; Zhang, Y. Failure analysis of the conductive slide support rod of section insulator applied in urban rail transport system. Eng. Fail. Anal. 2023, 148, 107217. [Google Scholar] [CrossRef]
  8. Peng, B.; Wu, X.; Zhang, Z.; Yang, N.; Hu, F.; Wang, P.; Mi, C.; Chi, M.; Wu, S. Determination of wheel polygonal wear limit and fatigue life of railway bogie frames considering wheel/rail excitation. Eng. Fail. Anal. 2025, 169, 109220. [Google Scholar] [CrossRef]
  9. Sunar, Ö.; Fletcher, D. Experimental Investigation on the Arc Damage and Fatigue Crack Initiation Risk of Copper-Silver Contact Wires. IEEE Trans. Power Deliv. 2023, 38, 777–784. [Google Scholar] [CrossRef]
  10. Wang, Z.; Ma, W. Dynamic Response and Fatigue-Life Analysis of High-Speed Railway Tunnel Base with Defects. Math. Probl. Eng. 2022, 2022, 6622998. [Google Scholar] [CrossRef]
  11. Dou, W.; Zhang, L.; Chang, H.; Zhang, H.; Liu, C. Fatigue Characterization on a Cast Aluminum Beam of a High-Speed Train Through Numerical Simulation and Experiments. Chin. J. Mech. Eng. 2021, 34, 108. [Google Scholar] [CrossRef]
  12. Xu, Z.; Song, Y.; Liu, Z. Stress Analysis and Fatigue Life Prediction of Contact Wire Located at Steady Arms in High-Speed Railway Catenary System. IEEE Trans. Instrum. Meas. 2022, 71, 1–12. [Google Scholar] [CrossRef]
  13. Qi, G.; Chen, J.; Xiao, X.; Song, Y.; Ma, L. Fatigue Load Spectrum of Key Parts of High-speed Railway Catenary. J. Railw. 2015, 37, 48–53. [Google Scholar]
  14. Tan, D.Q.; Mo, J.L.; Luo, J.; Zhang, Q.; Zhu, Z.R.; Zhou, Z. Failure Analysis of Positioning Hook and Support for High Speed Railway Catenary. China Railw. Sci. 2018, 39, 111–118. [Google Scholar]
  15. Qi, G.-F.; Xiao, X.-H.; Zhao, H.; Chen, J.-F. Fatigue life evaluation on key components of high-speed railway catenary system. J. Cent. South Univ. 2018, 25, 1958–1965. [Google Scholar] [CrossRef]
  16. Geng, Y. The Slipstream in 400 km/h High-Speed Railway Tunneland Its Influence on Aerodynamic Fatigue of Catenary Support Device. Master’s Thesis, Central South University, Changsha, China, 2022. [Google Scholar]
  17. Zhang, C.; Lu, Y. Fatigue Behavior Analysis of H-section Steel Pole of OCS under Wind Load. Railw. Stand. Des. 2016, 60, 117–120. [Google Scholar]
  18. Song, Y.; Liu, Z.; Wang, H.; Lu, X. Analysis on Influence of Stochastic Wind Field on Wind Vibration Fatigue of High-speed Railway Catenary. Railw. Trans. 2015, 37, 20–26. [Google Scholar]
  19. Liu, J.; Chen, J.; Guan, J.; Han, F.; Wu, J. Research on fatigue simulation of stitch wire for high-speed railway catenary. Vib. Shock 2024, 43, 9–16. [Google Scholar]
  20. Liu, X.-Y.; Peng, J.-F.; Tan, D.-Q.; Xu, Z.-B.; Liu, J.-H.; Mo, J.-L.; Zhu, M.-H. Failure analysis and optimization of integral droppers used in high-speed railway catenary system. Eng. Fail. Anal. 2018, 91, 496–506. [Google Scholar] [CrossRef]
  21. Patel, S.B.; Pathak, K.K. Remaining Fatigue Life Assessment of a Steel Railway Bridge Based on Fracture and Stress Life Approach. Pract. Period. Struct. Des. Constr. 2023, 28, 04023042. [Google Scholar] [CrossRef]
  22. Al-Karawi, H.; Shams-Hakimi, P.; Pétursson, H.; Al-Emrani, M. Mean stress effect in high—Frequency mechanical impact (HFMI)—Treated welded steel railway bridges. Steel Constr. 2024, 17, 81–92. [Google Scholar] [CrossRef]
  23. Verdenius, S.; Hengeveld, S.; Maljaars, J. New fatigue load models for assessing railway bridges in Europe. Eng. Struct. 2023, 284, 115914. [Google Scholar] [CrossRef]
  24. EN 1991-2; Eurocode 1: Actions on Structures—Part 2: Traffic Loads on Bridges. European Committee for Standardization (CEN): Brussels, Belgium, 2003.
  25. Correia, J.; Mourão, A.; Xin, H.; De Jesus, A.; Bittencourt, T.; Calçada, R.; Berto, F. Fatigue strength assessment of riveted railway bridge details based on regression analyses combined with probabilistic models. J. Mater. Res. Technol. 2023, 23, 3257–3271. [Google Scholar] [CrossRef]
  26. Gogolik, S.; Kopras, M.; Szymczak-Graczyk, A.; Tschuschke, W. Experimental evaluation of the size and distribution of lateral pressure on the walls of the excavation support. J. Build. Eng. 2023, 73, 106831. [Google Scholar] [CrossRef]
  27. Lu, Z.-H.; Zhang, S.-W.; Zhang, X.-Y.; Li, C.-Q.; Liu, L.; Zhan, J.-W. Time-dependent fatigue reliability analysis of heavy-haul railway steel bridges. Eng. Struct. 2024, 305, 117737. [Google Scholar] [CrossRef]
  28. Li, Y.; Zhi, P.; Zhang, Y.; Chen, B.; Wang, Y. Fatigue Reliability Analysis of Motor Hanger for High—Speed Train Based on Bayesian Updating and Subset Simulation. Adv. Mater. Sci. Eng. 2020, 2020, 3012471. [Google Scholar] [CrossRef]
  29. Hu, P.; Liang, J.; Fan, W. Dynamic fatigue reliability of contact wires based on dynamic simulation of high-speed pantograph-catenary. AIP Conf. Proc. 2017, 1839, 020152. [Google Scholar]
  30. Tawfik, M.N.; Padzi, M.M.; Abdullah, S.; Harmanto, D.; Firdaws, M.N.; Hapaz, H. A Review of the Rolling Contact Fatigue of Rail Wheels Under Various Stresses. J. Fail. Anal. Prev. 2023, 23, 16–29. [Google Scholar] [CrossRef]
  31. Rao, K.B.; Anoop, M.B.; Raghava, G.; Prakash, M.; Rajadurai, A. Probabilistic fatigue life analysis of welded steel plate railway bridge girders using S–N curve approach. Proc. Inst. Mech. Eng. Part O J. Risk Reliab. 2013, 227, 385–404. [Google Scholar] [CrossRef]
  32. Chateauneuf, A.; Cocheteux, F.; Deffarges, F.; Sourget, F. Reliability analysis of screwed connections in high-speed trains, considering fatigue, corrosion, and imperfect maintenance operations. Proc. Inst. Mech. Eng. Part O J. Risk Reliab. 2011, 225, 293–306. [Google Scholar] [CrossRef]
  33. Zhao, G.; Wang, M.; Liu, Y.; Zhang, M. Dynamic Response of Transmission Tower-Line Systems Due to Ground Vibration Caused by High-Speed Trains. Buildings 2023, 13, 2884. [Google Scholar] [CrossRef]
  34. TB 10621-2016; National Railway Administration. Design Specifications for High-Speed Railways. China Railway Publishing House: Beijing, China, 2016.
  35. TB 10009-2016; National Railway Administration. Design Specification for Railway Electric Traction Power Supply. China Railway Press: Beijing, China, 2016.
  36. Zhang, M.; Liu, Y.; Liu, H.; Zhao, G. Dynamic response of an overhead transmission tower-line system to high-speed train-induced wind. Wind Struct. 2022, 34, 335–353. [Google Scholar]
  37. TB/T 3503.4-2018; National Railway Administration. Railway Application Aerodynamics Part 4: Numerical Simulation Specification for Aerodynamic Performance of Trains. China Railway Publishing House: Beijing, China, 2018.
  38. GB/T 32591-2016; National Railway Administration. Verification of Dynamic Interaction Simulation Between Pantograph and Overhead Contact System in Rail Transit Current Collection System. Standards Press of China: Beijing, China, 2016.
  39. Du, J. Dynamic Simulation Research of High Speed Bow Mesh System Based on Finite Element. Master’s Thesis, East China Jiaotong University, Nanchang, China, 2023. [Google Scholar]
  40. Zhang, J.; Xie, Q. Analysis of Seismic Response of High-speed Railway Catenary System. Railw. Stand. Des. 2017, 61, 140–146. [Google Scholar]
  41. Gu, P.; Deng, C.; Wu, F. Structural Modal Analysis and Damage Diagnosis; Southeast University Press: Nanjing, China, 2008; p. 171. [Google Scholar]
  42. Li, H.; Du, X.; Liu, J. Structural Dynamics; Machinery Industry Press: Beijing, China, 2005; p. 313. [Google Scholar]
  43. Ma, L. Research on Seismic Response Analysis Method of Simple Stitched Catenary. Master’s Thesis, Chongqing University, Chongqing, China, 2022. [Google Scholar]
  44. Hu, X. Analysis of Seismic Response of High-Speed Railway Catenary System. Master’s Thesis, Chongqing University, Chongqing, China, 2013. [Google Scholar]
  45. Clough, R.W.; Penzien, J. Dynamics of Structures, 3rd ed.; Computers & Structures: Walnut Creek, CA, USA, 2003. [Google Scholar]
  46. Cui, C.; Bu, Y.; Wang, Q.; Li, T.; Chen, Y. Fatigue life evaluation of steel bridge details through multi-scale modeling and modal verification. Eng. Struct. 2021, 228, 111543. [Google Scholar]
  47. Sadowski, A.J.; Camara, A.; Málaga-Chuquitaype, C. Modal validation of a finite element model for a wind turbine tower. Proc. Inst. Civ. Eng. Energy 2017, 170, 165–178. [Google Scholar]
  48. Ding, P. The Performance Analysis of New Cantilever Structure with Aluminum Alloy 6082 Based on ANSYS Workbench. Master’s Thesis, Southwest Jiaotong University, Chengdu, China, 2021. [Google Scholar]
  49. An, Y. Study on the Influence of Void Defects on the Safetyof High-Speed Railway Tunnels Under Static and Dynamic Loading. Master’s Thesis, Beijing Jiaotong University, Beijing, China, 2021. [Google Scholar]
Figure 1. Realistic view of the catenary.
Buildings 15 03542 g001
Figure 2. Schematic diagram of the catenary support structure.
Buildings 15 03542 g002
Figure 3. Damage diagram of the catenary support structure: (a) Steady Arm Breakage (b) Steady Arm Wear (c) Steady Arm Clamp Hook Wear (d) Steady Arm Wear.
Buildings 15 03542 g003
Figure 4. Load distribution diagram during train operation.
Buildings 15 03542 g004
Figure 5. Schematic diagram of the train track subgrade model.
Buildings 15 03542 g005
Figure 6. Diagram of the train vibration load extraction location.
Buildings 15 03542 g006
Figure 7. Geometric model of a high-speed train: (a) Side view and (b) front view.
Buildings 15 03542 g007
Figure 8. Schematic diagram of train-induced wind load extraction.
Buildings 15 03542 g008
Figure 9. Schematic diagram of the pantograph–catenary interaction model.
Buildings 15 03542 g009
Figure 10. Schematic diagram of the catenary suspension contact line model.
Buildings 15 03542 g010
Figure 11. Schematic diagram of the simplified model of the pantograph.
Buildings 15 03542 g011
Figure 12. Interaction model of the pantograph catenary.
Buildings 15 03542 g012
Figure 13. Simulation results of 250 km/h and 300 km/h contact forces.
Buildings 15 03542 g013
Figure 14. Schematic diagram of pantograph catenary vibration load extraction.
Buildings 15 03542 g014
Figure 15. Time history data of pantograph catenary acceleration: (a) 250 km/h pantograph catenary acceleration time history data, (b) 300 km/h pantograph catenary acceleration time history data, (c) 350 km/h pantograph catenary acceleration time history data, and (d) 400 km/h pantograph catenary acceleration time history data.
Buildings 15 03542 g015
Figure 16. Schematic diagram of grid division.
Buildings 15 03542 g016
Figure 17. Single-column two-span finite element model.
Buildings 15 03542 g017
Figure 18. Mode shape diagrams of the first six modes for a single-column two-span model: (a) first vibration mode, (b) second vibration mode, (c) third vibration mode, (d) fourth vibration mode, (e) fifth vibration mode, and (f) sixth vibration mode.
Buildings 15 03542 g018
Figure 19. Displacement and stress contours of critical areas under gravity loading: (a) stress contours of the limit stop (Pa), (b) stress contours at the cantilever arm connection (Pa), (c) stress contours of the steady arm bracket (Pa), (d) stress contours of the inclined cantilever arm (Pa), and (e) displacement contours of the mound (m).
Buildings 15 03542 g019
Figure 20. Stress time–history curves of critical areas under three-factor coupled loading conditions: (a) limit stop, (b) steady arm bracket, (c) cantilever arm connection, and (d) inclined cantilever arm.
Buildings 15 03542 g020
Figure 21. S–N curves of the aluminum alloy.
Buildings 15 03542 g021
Figure 22. Stress Time-History at the Limit Stop.
Buildings 15 03542 g022
Figure 23. Load Spectrum at the Limit Stop.
Buildings 15 03542 g023
Figure 24. Stress Time-History at the Steady Arm Bracket under 400 km/h.
Buildings 15 03542 g024
Figure 25. Load Spectrum at the Steady Arm Bracket under 400 km/h.
Buildings 15 03542 g025
Figure 26. Stress Time-History at the Steady Arm Bracket under 350 km/h.
Buildings 15 03542 g026
Figure 27. Load Spectrum at the Steady Arm Bracket under 350 km/h.
Buildings 15 03542 g027
Figure 28. Stress Time-History at the Steady Arm Bracket under 300 km/h.
Buildings 15 03542 g028
Figure 29. Load Spectrum at the Steady Arm Bracket under 300 km/h.
Buildings 15 03542 g029
Figure 30. 100 sets of stress time–history samples at the limit stop location: (a) Samples 1–25, (b) Samples 26–50, (c) Samples 51–75, and (d) Samples 76–100.
Buildings 15 03542 g030
Figure 31. 100 sets of mean values and standard values of equivalent stress within 0~2.5 s.
Buildings 15 03542 g031
Figure 32. Histogram of Equivalent Stress Amplitude Distribution.
Buildings 15 03542 g032
Figure 33. Time-varying curve of the fatigue reliability.
Buildings 15 03542 g033
Figure 34. Time-dependent Fatigue Reliability Curves under Varying Traffic Frequencies.
Buildings 15 03542 g034
Table 1. Catenary suspension component attribute parameters.
Contact WireMessenger WireDroppers
Wire TypeCTMH150JTMH120JTMH10
Elastic Modulus120 GPa103 GPa113 MPa
Poisson’s Ratio0.330.320.3
Cross-sectional Area150 (mm2)120 (mm2)10 (mm2)
Tension205 MPa195 MPa500 MPa
Span Length55 (m)
Dropper Spacing5, 9, 9, 9, 9, 5 (m)
Density9000 (kg/m3)8875 (kg/m3)9000 (kg/m3)
Number of Spans6
Table 2. Equivalent parameters of the pantograph.
ComponentMassStiffnessDamping
Pantograph Head6.1 kg10,400 N/m10 Ns/m
Upper Frame10.2 kg10,600 N/m0 Ns/m
Lower Frame10.3 kg0.1 N/m120 Ns/m
Table 3. Materials of the catenary support structure.
Material NameComponents of Catenary Support Structure
Aluminum alloy
Magnesium aluminum alloy
Cantilever Arm, Steady Tube, Steady Tube Bracket, Limit Stop, Steady Arm Bracket, Sleeve Bracket, Positioning Ring, Cantilever Base
ZG270-500
Q235Supporting Mast
Table 4. Material parameters of the catenary support structure.
ParametersAluminum AlloyMagnesium Aluminum AlloyZG270-500Q235
Density2.71 × 103 kg/m32.66 × 103 kg/m37.85 × 103 kg/m37.8 × 103 kg/m3
Young’s Modulus7 × 104 MPa6.9 × 104 MPa2.0 × 105 MPa2.06 × 105 MPa
Poisson’s Ratio0.30.30.30.3
Yield Strength110 MPa110 MPa270 MPa370 MPa
Tensile Strength205 MPa195 MPa500 MPa235 MPa
Table 5. Natural frequency of the single-column two-span model (Hz).
Order123456
Frequency1.14061.23541.32471.32481.32521.3253
Table 6. Comparison of the simulated natural frequencies and the results given by references [43,44] (Hz).
Mode OrderSimulated Frequency in the Present Study f0Frequency Results Given by References [43,44]
f
Relative Deviation (%)
|(f0-f)/f0|
11.1411.0906.3%
21.2351.1058.4%
Table 7. Comparison of the stress response and amplitude increase in critical areas of the catenary support structures.
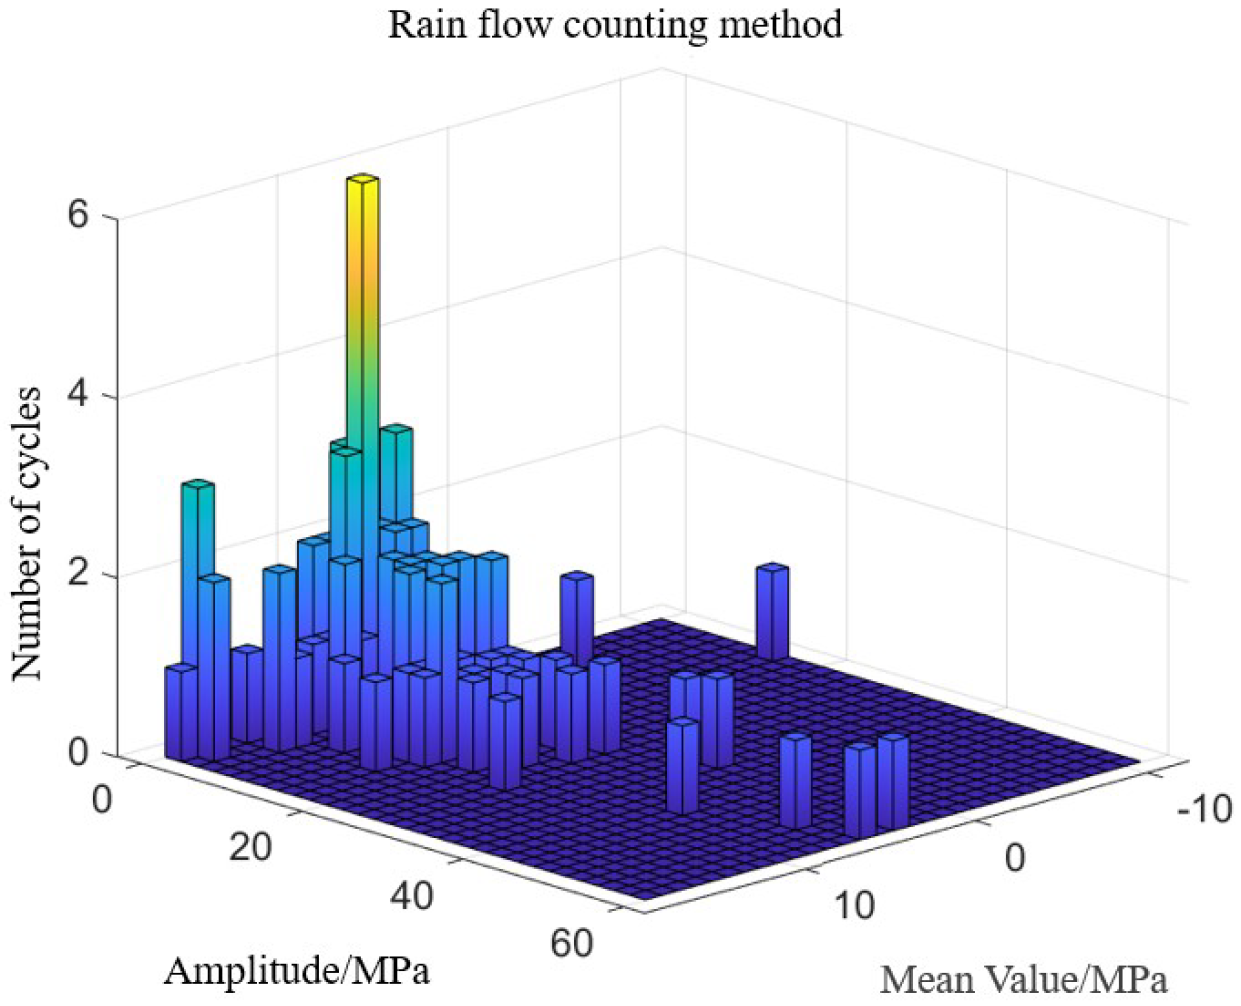
Critical AreaLoad TypeMaximum Tensile Stress (MPa)Increase PercentageMaximum Compressive Stress (MPa)Increase Percentage
Steady Arm BracketPantograph-Catenary Vibration44.7216.3%−37.7417.6%
Three-factor Coupled Loads52.12−44.36
Limit StopPantograph-Catenary Vibration28.1818.5%−16.17−5%
Three-factor Coupled Loads33.42−15.36
Table 8. Traffic frequency of common high-speed rail lines.
No.Line NameSectionDaily Train Pairs (Number of Trains)
1Beijing-Shanghai High-speed RailwayJinan-Tai’an158.5
2Beijing-Shanghai High-speed RailwayTai’an-Qufu157.5
3Beijing-Shanghai High-speed RailwayTianjin-Cangzhou156
4Beijing-Guangzhou High-speed RailwayXinyang-Wuhan98
5Chengdu-Guiyang Passenger Dedicated Line Shuangliu Airport-Meishan98
6Shanghai-Kunming High-speed RailwayJinhua-Quzhou96.5
7Changjiu Intercity RailwayLushan-Nanchang70.5
8Nanning-Guangzhou RailwayBinyang-Nanning70.5
9Beijing-Harbin High-speed RailwayBeijing-Miyun70
Table 9. Stress time history and fatigue damage calculation results at the limit stop.
Stress Amplitude/MPaMean Stress/MPaCorrected StressNumber of CyclesFatigue Life
1.380.321.38329.42 × 108
2.73−2.122.73186.84 × 108
4.080.114.08173.89 × 108
5.44−6.125.43169.61 × 107
6.67−4.766.66119.07 × 107
7.6810.447.7348.86 × 107
13.521.7213.5227.70 × 107
Table 10. Fatigue damage and fatigue life analysis results.
Critical ComponentAnnual Fatigue DamageFatigue Life (Years)
Limit Stop0.02343.56
Steady Arm Bracket0.02934.48
Horizontal Cantilever Arm Connection/Infinite Life
Inclined Cantilever Arm/Infinite Life
Table 11. Fatigue Life at the Steady Arm Bracket under Different Train Speeds.
Train Speed (km/h)Annual Fatigue DamageFatigue Life (Years)
2500.02934.48
3000.03627.40
3500.04721.15
4000.06515.27
Table 12. Types of Probability Distributions for Random Variables.
Random VariableProbability Distribution TypeMeanCoefficient of VariationStandard Deviation
Critical Fatigue Damage IndexLognormal Distribution10.30.3
Fatigue Constant aNormal Distribution2.7100.150.4065
Fatigue Constant bNormal Distribution−0.1250.15−0.01875
Table 13. Fatigue reliability analysis results.
Critical Component15-Year Failure Probability15-Year Reliability20-Year Failure Probability20-Year Reliability
Limit Stop4.9%96.1%11.6%89.4%
Steady Arm Bracket6.4%93.6%18.8%81.2%
Horizontal Cantilever Arm Connection1.3%98.7%2.8%96.2%
Inclined Cantilever Arm1.2%98.8%2.7%97.3%
Disclaimer/Publisher’s Note: The statements, opinions and data contained in all publications are solely those of the individual author(s) and contributor(s) and not of MDPI and/or the editor(s). MDPI and/or the editor(s) disclaim responsibility for any injury to people or property resulting from any ideas, methods, instructions or products referred to in the content.