Article

Analysis and Design of Anchored Sheet-Pile Walls: Theoretical Comparisons, Experimental Validation, and Practical Procedures

by
Eltayeb H. Onsa Elsadig
1,*,
Tareg Abdalla Abdalla
2,*,
Turki S. Alahmari
1,
Dafalla A. El Turabi
3 and
Ahmed H. A. Yassin
4
1
Department of Civil Engineering, Faculty of Engineering, University of Tabuk, P.O. Box 741, Tabuk 71491, Saudi Arabia
2
Department of Civil Engineering, Faculty of Engineering Sciences, Omdurman Islamic University, Omdurman P.O. Box 382, Sudan
3
Civil Engineering Department, Faculty of Engineering, University of Khartoum, Khartoum P.O. Box 321, Sudan
4
Department of Industrial Engineering, Faculty of Engineering, University of Tabuk, P.O. Box 741, Tabuk 71491, Saudi Arabia
*
Authors to whom correspondence should be addressed.
Buildings 2025, 15(19), 3527; https://doi.org/10.3390/buildings15193527
Submission received: 20 July 2025 / Revised: 23 September 2025 / Accepted: 28 September 2025 / Published: 1 October 2025

Abstract

Anchored sheet-pile walls (ASPWs) are widely used as earth-retaining structures in engineering practice. The difficulty in analyzing sheet piles arises because the loading on the wall is a function of the deformation of the soil and the sheet-pile configuration. This paper discusses the predictions of different theoretical solutions for ASPWs, and it briefly presents and discusses four main theories of ASPWs: the two distribution theories, the finite element method, and Rowe’s theory. The effect of different influencing factors on the behavior and design of ASPWs is also examined. The above theoretical solutions are evaluated experimentally through measurements of strains, deflections, tie-rod force, and tie-rod yield on a small-scale sheet-pile model tested in a sandbox. The four theories provide an acceptable analytical solution for the ASPW problem under the given conditions. However, no theory fully predicts the behavior of ASPWs over the entire range of the different design parameters: soil conditions, sheet-pile flexibility, dredge depth, anchor location, and anchor yield. This paper proposes simple charts and tables for SPW design based on extrapolation between distribution theories while accounting for sheet pile flexibility and other influencing parameters. Illustrating examples for the proposed design procedure are provided.

1. Introduction

The accelerating growth of the global population has intensified urbanization, making it one of the defining challenges of the 21st century. In densely populated metropolitan regions, the scarcity of available land severely limits opportunities for horizontal expansion, making this phenomenon particularly pronounced. As urban areas grow vertically and land use becomes increasingly intensive, development projects must accommodate highly integrated infrastructure networks, spanning transportation systems, utility corridors, and service facilities that extend both above and below ground. To meet these demands, deep excavations are frequently required for structures such as multi-level basements, underground parking facilities, subways, stations, tunnels, and buried utility networks. In such space-constrained urban environments, the stability and safety of excavations are critical, particularly when construction occurs near existing buildings and lifeline infrastructure. Conventional open-cut excavation methods are often impractical due to limited working space, strict property boundaries, and the need to minimize disruption to surrounding activities. As a result, engineers increasingly rely on advanced retaining systems, with anchored sheet-pile walls being among the most widely adopted solutions. Engineers can tailor these systems to various soil and loading conditions, offering high lateral earth support capacity and effective ground movement control. Their performance, however, hinges on rigorous geotechnical assessment, precise structural design, and meticulous construction practices, all of which must consider complex soil–structure interaction mechanisms. Consequently, anchored sheet-pile walls represent vital technology for enabling safe, efficient, and sustainable underground construction in modern urban settings [1,2,3,4,5].
Sheet-pile walls play a critical role in enabling deep excavations. Traditionally, cantilevered sheet-pile walls have been employed for moderate excavation depths, relying solely on soil–structure interaction to maintain stability. However, for greater excavation depths or when adjacent structures impose stricter deformation limits, anchored sheet-pile walls (ASPWs) are more suitable due to their enhanced resistance and reduced deflections [6,7,8,9,10]. ASPWs derive support from both the passive earth pressure in front of the embedded pile and the tension in the tie rods anchored near the top of the wall. The pressure distribution along the wall generates bending moments in the wall, and the structural profile of the wall must be selected to withstand these moments. This requires calculating the maximum bending stresses and comparing them with the allowable stresses of various structural profiles to ensure structural safety [11].
The stability of ASPWs in soft clay requires careful consideration, as it is affected by multiple factors, primarily excavation, and service loads. Excavation in front of the sheet-pile wall is frequently essential during the construction phase to attain the requisite depth for building or waterfront access [8]. Nonetheless, such excavation always causes stress relief and soil displacement, thereby jeopardizing the safety and stability of adjacent structural foundations. Additionally, service loads like the weight of freight, containers, automotive traffic, and pedestrian movement impose stress on the ground surface. The loads are conveyed via foundation soil to the anchored sheet-pile wall and must be meticulously considered in the structural design to guarantee overall safety. Under substantial service loads and extensive excavation, the foundation soil may experience plastic deformation, resulting in lateral soil displacement [12]. ASPWs, which function mostly through passive resistance, are susceptible to compression and may incline towards the excavation or waterside, thereby intensifying structural damage. These deformations are often irreversible and may compound over time, potentially leading to the breakdown of the ASPW’s structure [13].
Despite their widespread use, the analysis and design of ASPWs remain challenging due to the complex interaction between the wall and the surrounding soil. The lateral earth pressure acting on the wall is not fixed but instead depends on the wall’s deformation pattern, the soil stiffness, the flexibility of the pile, and other parameters such as dredge depth and anchor location. Numerous design codes exist, including ACI 318-19 [14] and EN 1997-1 [15]. Some approaches simplify this behavior by treating the wall as rigid, but this method does not reflect the actual performance of flexible ASPWs in the field. Based on the anchorage and construction method employed, the sheet-pile structure can be categorized into four types: fully driven and dredged, partly driven and backfilled, dredged, and sand-backfilled [16].
Various analytical approaches have been proposed to address this complexity, including classical methods, Rowe’s theory, distribution-based solutions, and finite element methods. However, no single theory has proven capable of fully predicting the behavior of ASPWs across the full range of practical design conditions. Moreover, limited experimental validation exists to assess the accuracy and applicability of these analytical methods under controlled, repeatable conditions. For instance, Hagerty et al. [17] investigated anchored bulkheads and concluded that existing methods do not permit easy optimization. To address this limitation, they developed generalized parameters and design aids in the form of graphs and tables to link key inputs with design outputs.
Recent advances in geotechnical engineering have introduced emerging approaches that could enhance the ASPW’s analysis. Explainable machine learning methods have been applied to the optimal dimensioning of retaining walls, increasing both interpretability and design efficiency [18]. Stochastic modeling of soil spatial variability using random field theory and probabilistic frameworks has expanded the understanding of retaining structures’ reliability under uncertainty [19,20]. Meanwhile, modern 3D numerical methods, such as a coupled DEM–FDM simulation, have accurately captured complex soil–structure interactions [21]. Surrogate-based Monte Carlo simulations have also been used to efficiently assess the probabilistic stability of reinforced soil systems [22]. These recent methodologies complement traditional analytical methods and enrich the design toolkit for deep excavations and waterfront structures.
Recent studies on helical piles have been carried out. For example, Asgari et al. [23] reported that helical-pile tests in dense sand showed higher compression than tensile capacities, with performance improving as the number of helices increased and pitches decreased. They concluded that single-helix piles with a 20 mm pitch and double-helix piles with a 13 mm pitch performed best, while theoretical methods slightly misestimated the capacities. Similarly, Ebadi-Jamkhaneh et al. [24] demonstrated that combining helical piles with geogrid reinforcement greatly improved pullout performance in dense sand, with single-helix piles achieving up to a 518% capacity increase. They concluded that optimal geogrid placement significantly enhances stiffness and load resistance, highlighting the synergy between pile geometry and reinforcement.
However, previous research has generally focused on applying a single theoretical or numerical method under limited conditions [9,10,12,25,26], with minimal direct experimental verification under controlled scenarios [6,13]. This leaves a gap in understanding how different analytical approaches perform across the full range of practical parameters, especially wall flexibility, dredging depth ratios, and tie-rod positions [9,10,25]. Furthermore, the existing literature lacks a unified, practically applicable procedure that integrates the strengths of multiple theories for reliable prediction across overall design ranges [6,10,26].
The present study addresses this gap by systematically comparing four established theoretical methods (two distribution theories, Rowe’s theory, and finite element analysis) against small-scale experimental results. By identifying each method’s strengths and limitations and by introducing an extrapolation-based approach that blends the 10-springs method with the distribution theory, this work advances beyond prior studies to deliver simplified design charts and tables suitable for diverse field conditions.

2. Significance of the Study

The results of this study offer practical tools for engineers designing ASPWs in diverse soil conditions and structural configurations. By combining analytical rigor with experimental verification, the proposed methodology enhances both the accuracy and practicality of current design practices, especially in urban construction projects where safety, cost, and deformation control are paramount.

3. Materials and Methods

This section briefly reviews some well-known solutions for the anchored sheet-pile walls (ASPWs) problem. This section also presents a description of the experimental tests conducted on small-scale ASPWs.

3.1. Classical Methods

These comprise the well-known free-earth support method and the fixed-earth support method. Neither the ASPW’s flexibility nor the soil stiffness is considered in the solution. Many references and textbooks [27,28,29] thoroughly cover the two theories.

3.2. Rowe’s Methods

Rowe [16] proposed a moment reduction technique for sheet-pile (SP) analysis. The analysis was derived from specific experimental data, taking the following factors into account:
  • The soil’s relative density, flexibility number, ρ, of the SP, is defined as ρ = H 4 E I , where H = total height of the sheet pile, E = modulus of elasticity, and I = moment of inertia of unit width of the wall.
  • The relative height of the free piling, η = H H , where H′ = height of the SP above the dredge level.
  • The relative depth of the tie-rod position, β, is expressed as the fraction of the total height H.
Later, Rowe [30] presented a theoretical solution considering SP flexibility and soil stiffness. The solution started with the fundamental equation governing the flexure of a beam on an elastic foundation and on a thirty-order deformation model defined as
E I d 4 y d x 4 = P a P p
where
  • x is the depth below the dredge level, and y is the horizontal deflection at x.
  • Pa and Pp = the resultant active and passive pressures below the dredge level. For more details of Rowe’s theoretical method, see the reference [30].
Figure 1 shows the loading setup suggested by Rowe [30].

3.3. Numerical Methods

Richart [31] conducted a numerical analysis of sheet piles (SPs), considering both free-earth-support and fixed-earth-support conditions, by making use of Newmark’s numerical technique. Neither of the numerical methods of SP analysis seem to have gained wide popularity due to the development of easier and more versatile analytical methods and FE solutions.

3.4. Distribution Theories

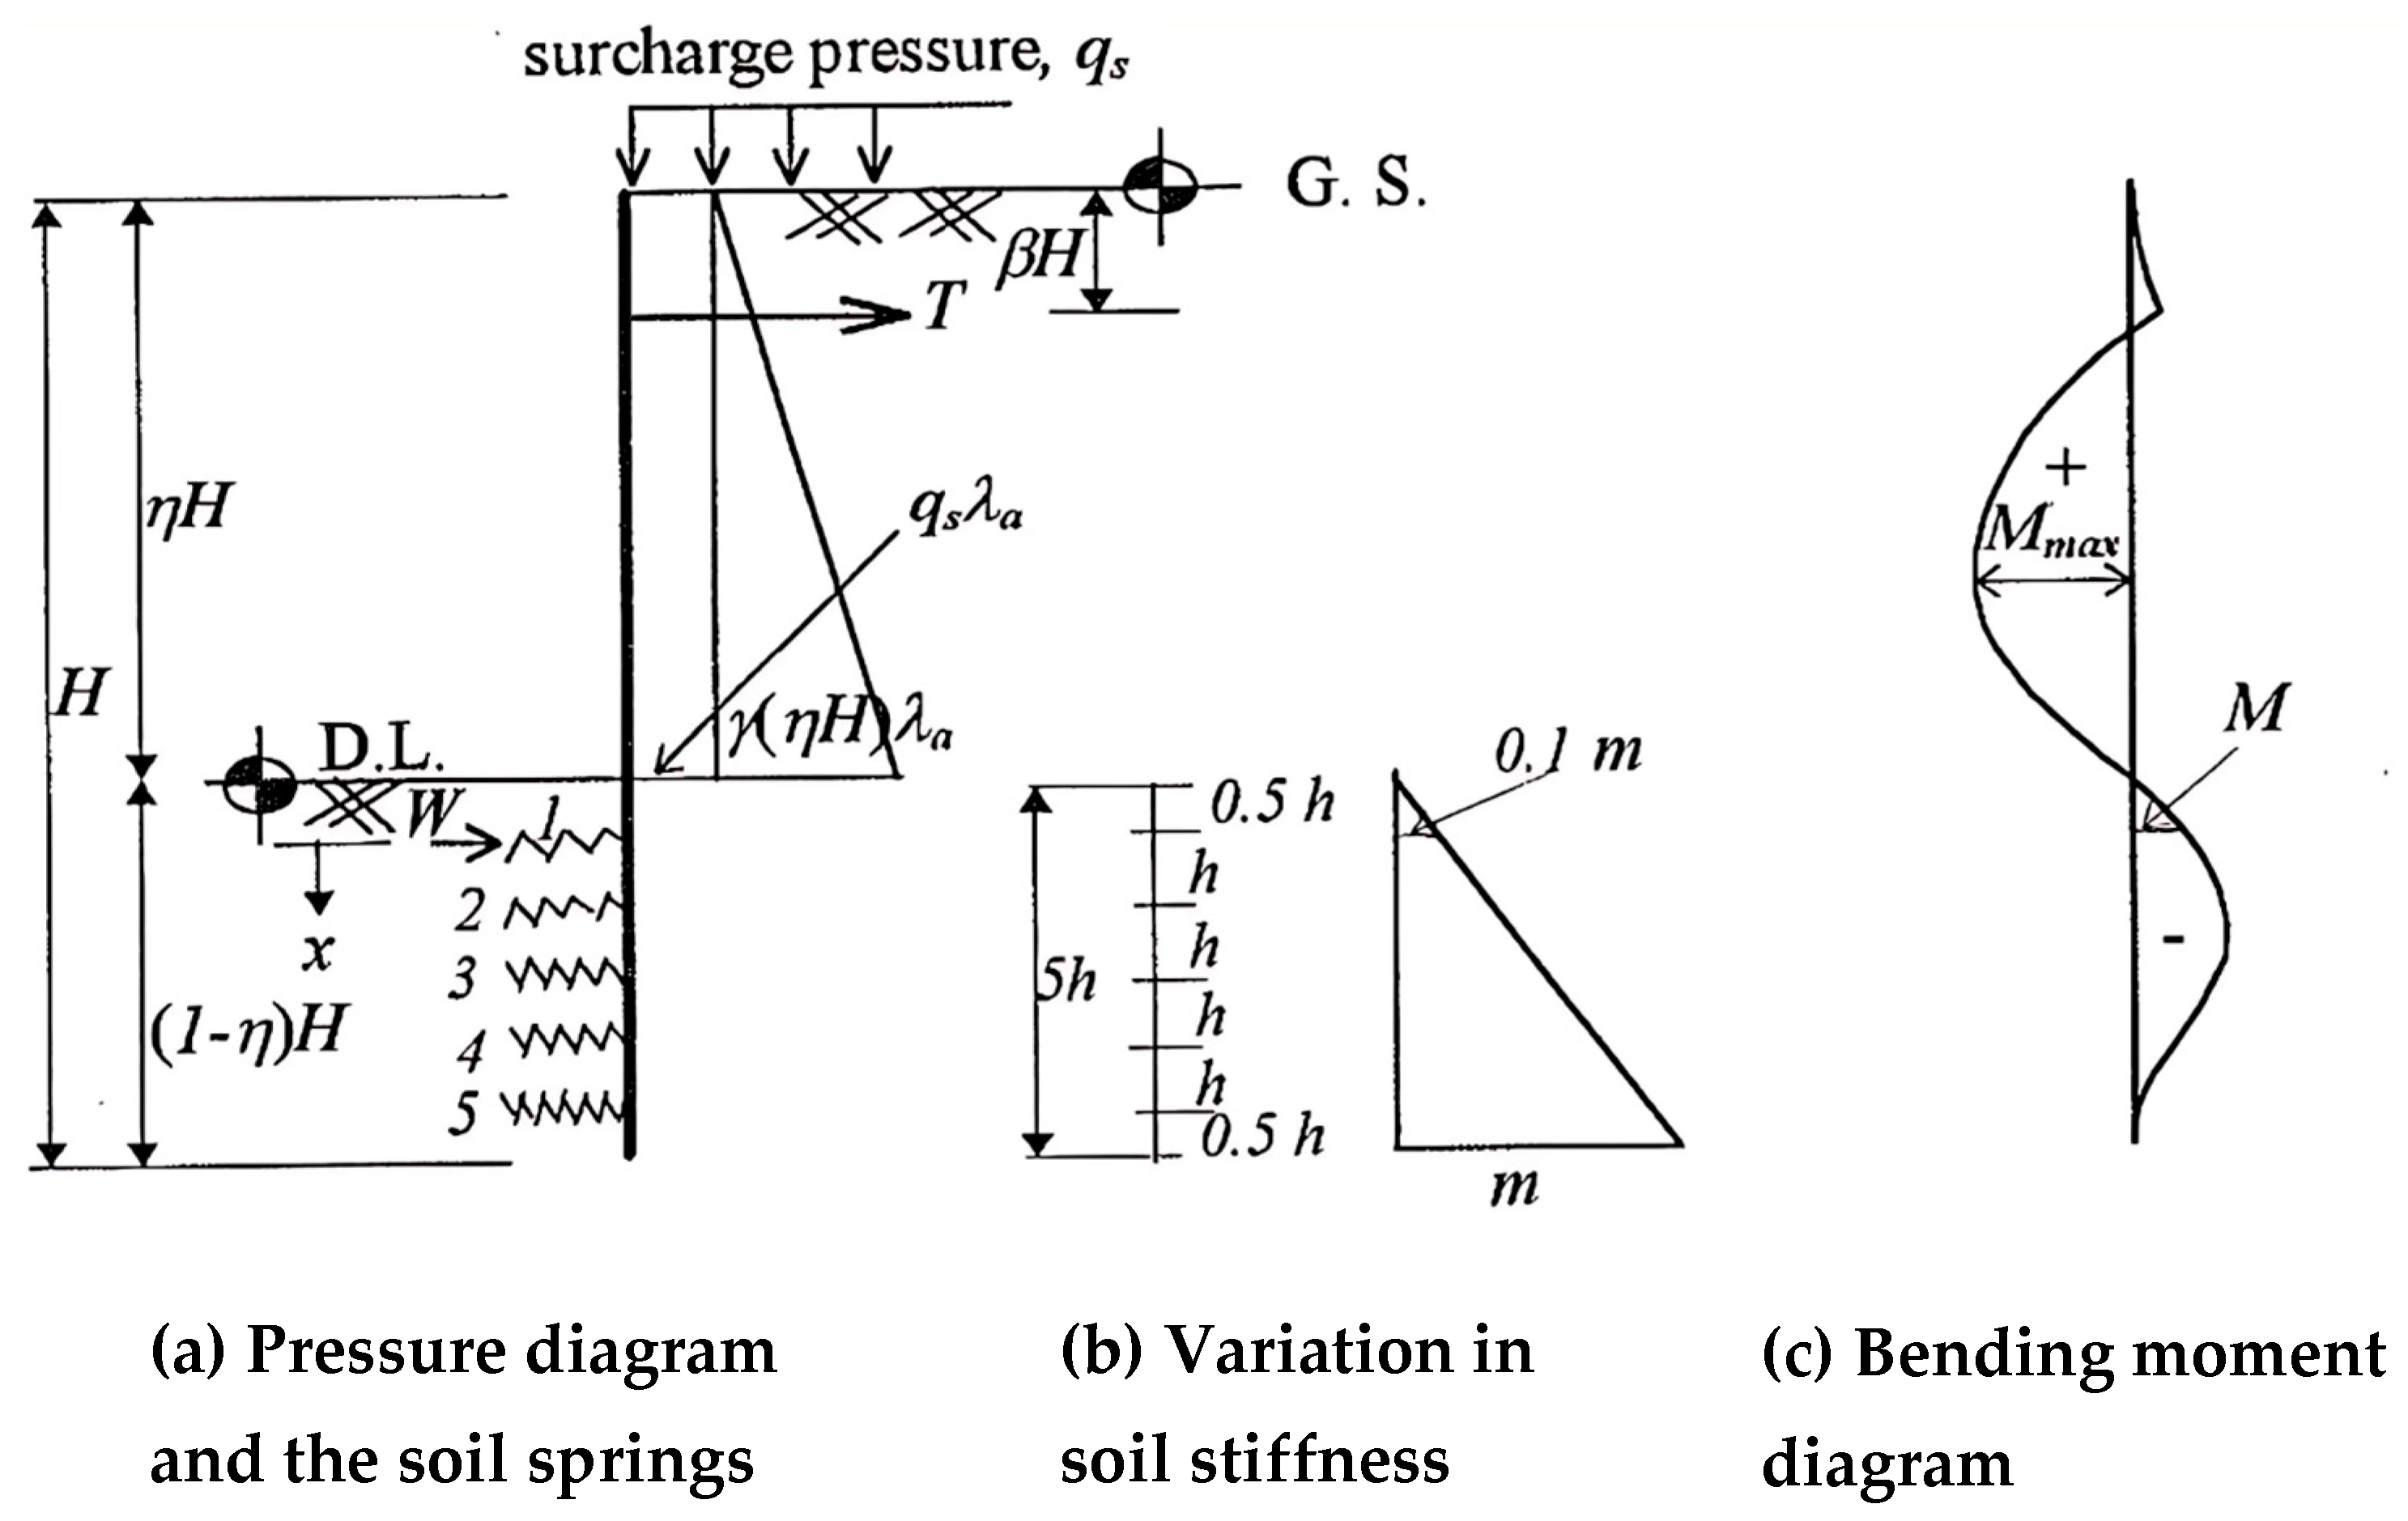
Turabi and Balla [32] presented an analytical distribution method for the analysis of ASPWs based on the analogy of a beam on an elastic foundation. The application of distribution theory utilized derived distribution coefficients for the case of linearly varying soil stiffness modulus below the dredge level. The soil pressure above the dredge level is considered to be linearly distributed, while the part below the dredge level is considered to be supported on 5 elastic springs that are equally spaced and having stiffness coefficients varying linearly with depth; see Figure 2. The bending moments and shear forces along the sheet pile are derived from the state of equilibrium and continuity at the dredge level.
In the derivation of the distribution theory equations, the flexibility of the sheet pile, related to the soil stiffness, is expressed in terms of a dimensionless flexibility number, α = E I m s H 4 ; for more details and derivations of the distribution factors and forces, refer to the reference [32,33,34]. Therein, ms = soil stiffness at the toe of the sheet pile, which is described in Section 3.6.
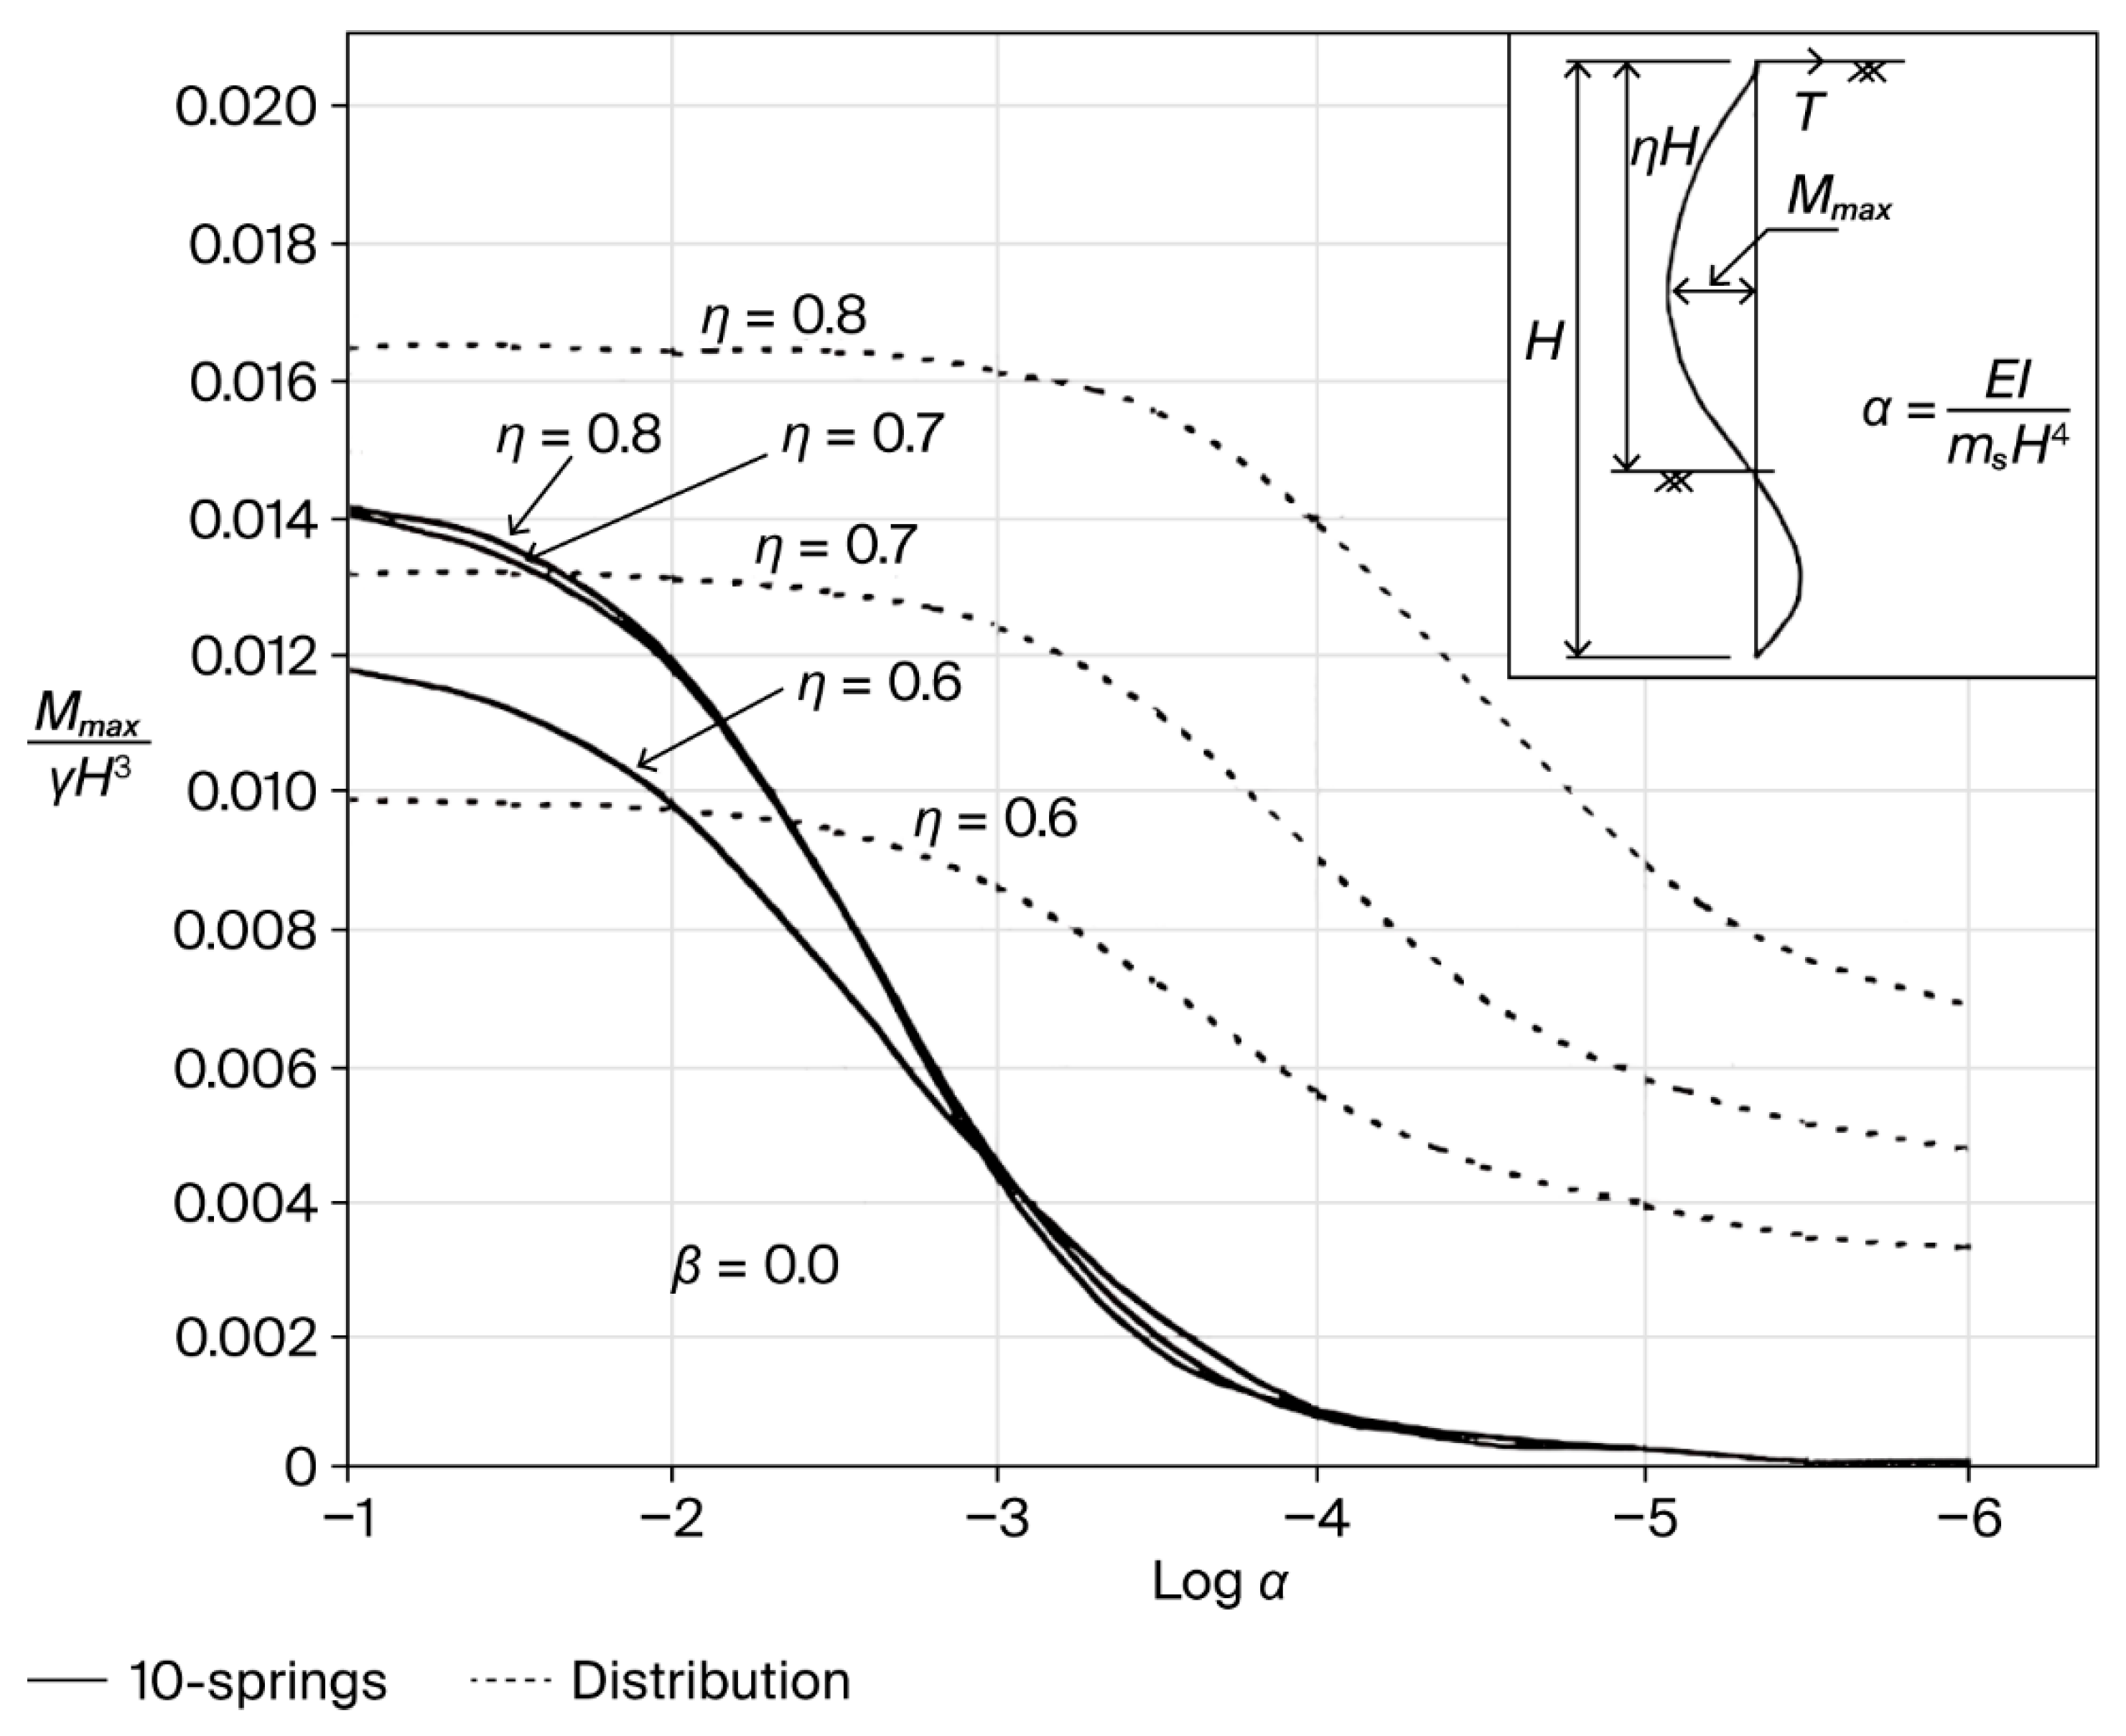
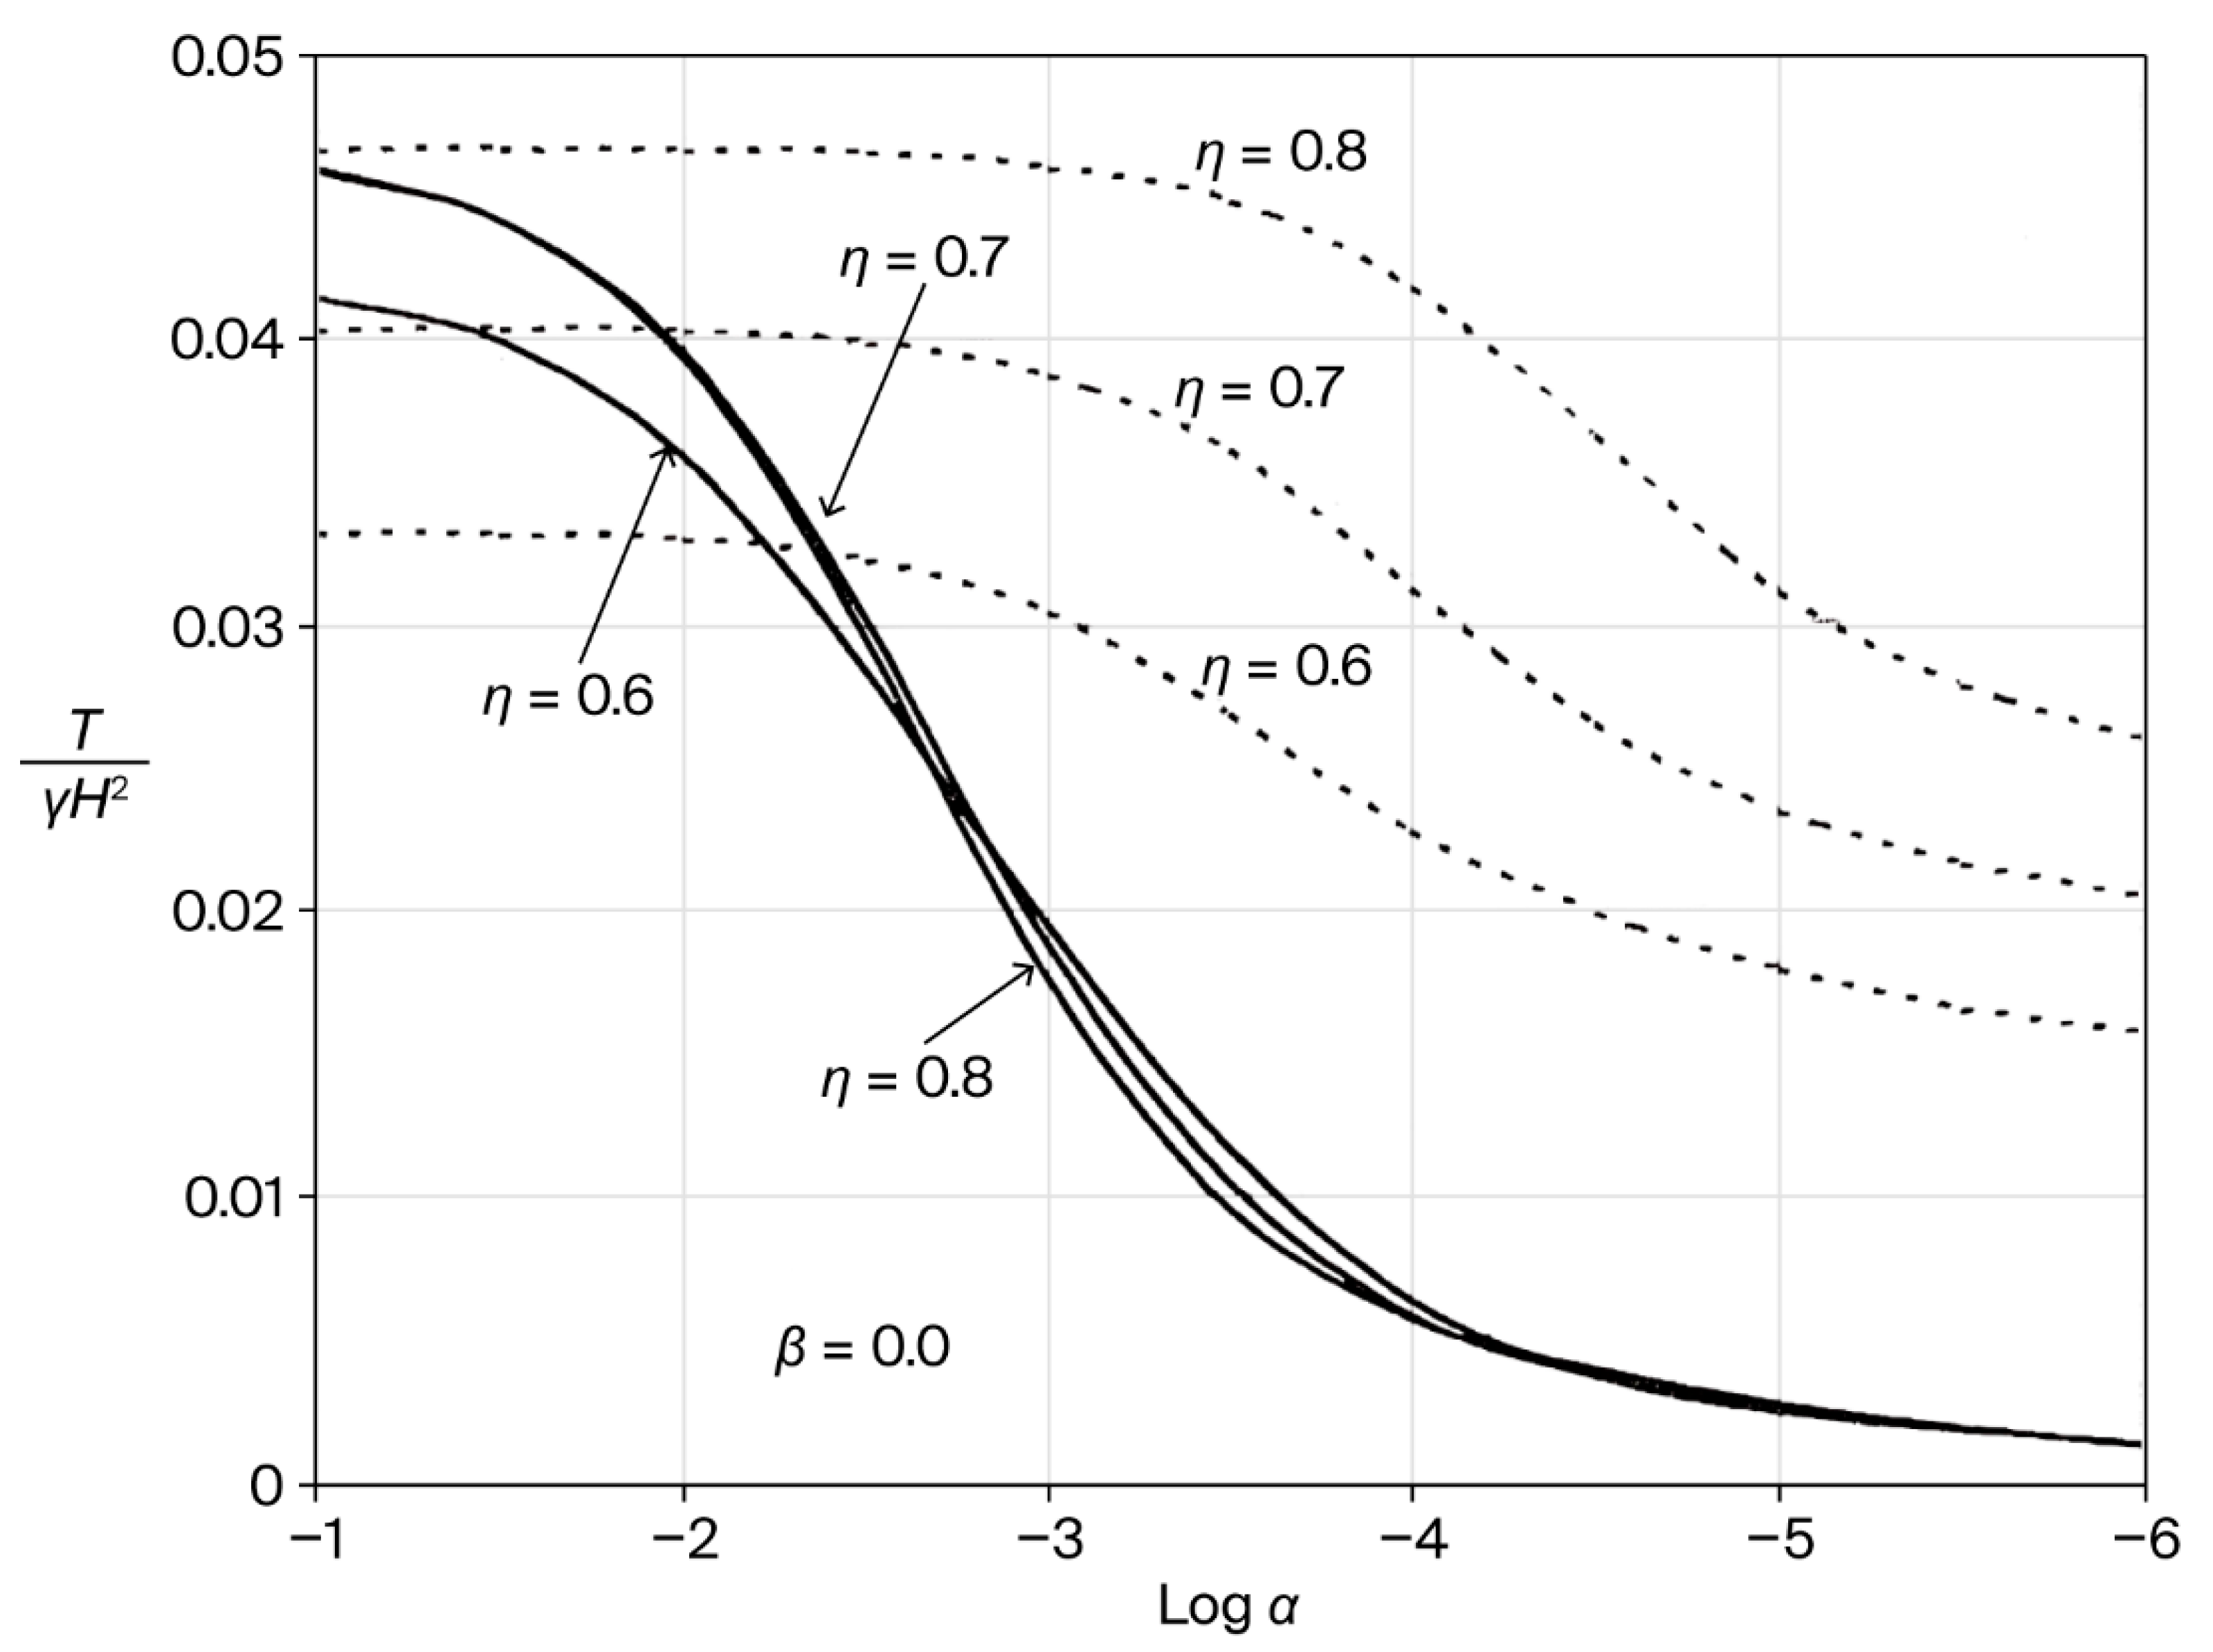
The results of this distribution theory for the maximum bending moment, Mmax, and tie-rod force, T, are expressed in dimensionless forms, M m a x γ H 3 and T γ H 2 , respectively, and plotted for different values of log (α), where γ is soil unit weight, as shown in Section 4.4 Figures 11 and 12.
Later, Turabi and Balla [34] introduced an alternative distribution method for analyzing anchored sheet-pile walls (ASPW). In this approach, the sheet pile is divided into two sections at the dredge level. Both the upper and lower sections are treated as elastic beams, with each supported by five equally spaced springs to simulate the continuous soil medium. This method is occasionally referred to as the “10-springs method” due to the ten springs used in the calculations. To maintain equilibrium of both parts, a pair of unknown forces, W, and a pair of unknown moments, M, are introduced at the section of separation (dredge level). Both the upper and the lower parts are considered as elastic beams, with each supported by five equivalent springs which are supposed to replace the continuous soil support. The upper part is anchored; thus, the anchor (tie-rod) load is another unknown external force. The three external unknown loads T, W, and M require three equations which can be obtained from the following deformation conditions:
  • The sheet pile deflection at the anchorage is equal to the tie-rod yield, ya.
  • At the dredge level, the deflection of the upper and lower beams is equal.
  • The slopes of the deflection line at the dredge level are the same for the upper and lower beams.
By defining the stiffness coefficients of the springs as ki = εik, (i = 1 to 5), any variation in stiffness can be modeled by adjusting the dimensionless factors εi, for example, ε1, (ε1 is assumed as unity; k1 = k, the stiffness coefficient of the first spring). Initially, the load on the springs is due to the at-rest pressure. In one instant, the load and springs are released from one side, and a surcharge pressure, qs, is applied on the ground surface of the backfill side. As the load changes, the beam will experience deformations, altering the spring reactions. After deformation, the spring reactions can be expressed as Ri = Roi + Rqi + Rdi due to the at-rest condition, surcharge pressure, and beam deformation, respectively. By applying varying soil stiffness along the whole sheet pile height, the results showed clearly the arching effect on the retained soil; see reference [32,33,34].
The lateral pressure on the sheet pile at the level of any spring above the dredge level is given by
Ri = Roi + ki yi
where
  • Ri = net lateral reaction on spring I;
  • Roi = reaction on spring i due to the at-rest pressure condition;
  • ki = stuffiness of spring, I;
  • yi = deflection of the ith spring, taken negative when the deflection is away from the backfill;
  • Rdi = reaction due to beam deformation = ki yi.
A benefit of the 10-spring method is that the arching effect on the SP loading is clearly noticed and incorporated in the results of the maximum bending moment and tie-rod force.

Effect of Surcharge Pressure

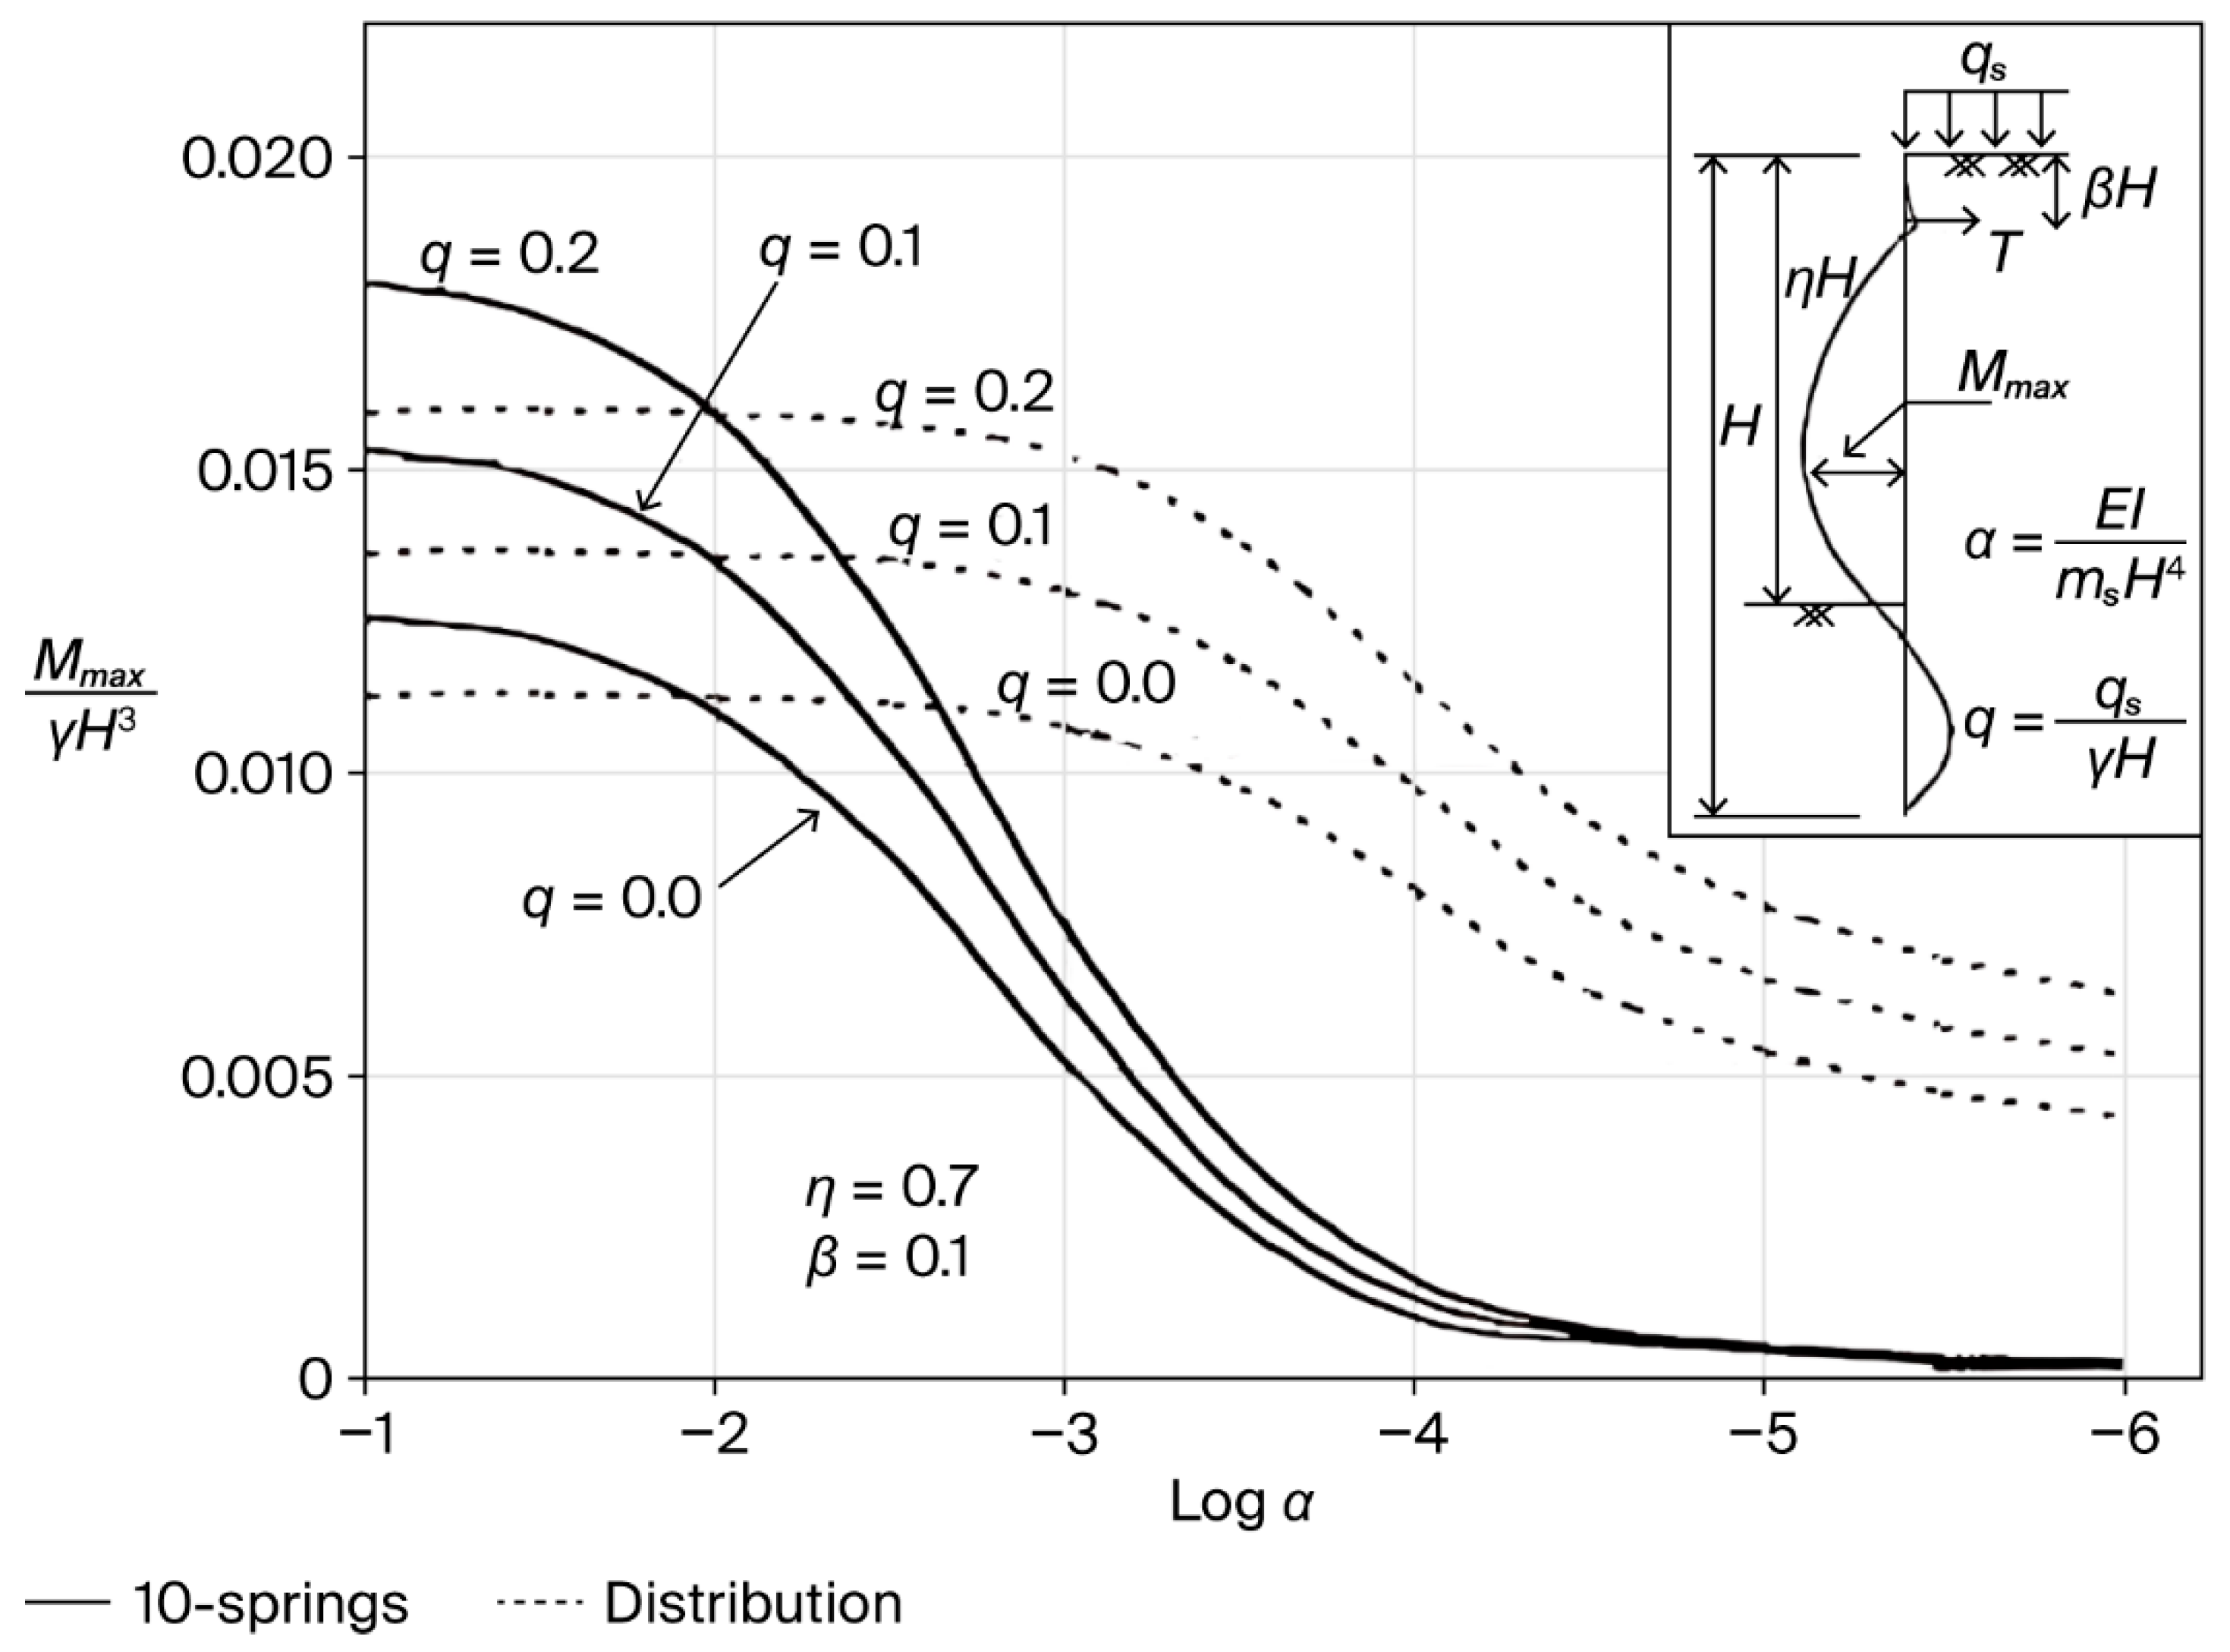
Figure 3 and Figure 4 show the effect of surcharge pressure on the values of maximum positive bending moment and tie-rod force as calculated according to the 10-springs method and the distribution theory for different values of α. In both Figures, the surcharge pressure, qs, is presented as a dimensionless surcharge factor, q = q s γ H .
The effect of the surcharge pressure is shown for the case when q = 0.0, i.e., no surcharge, and when q = 0.1 and q = 0.2, keeping η and β constant at η = 0.7 and β = 0.1

3.5. Finite Element Methods (FEMs)

The application of finite element methods (FEMs) to anchored sheet-pile walls (ASPWs) has received considerable attention. Potts and Fourie [35] presented a finite element (FE) approach using an elastic–plastic material model to simulate soil behavior, assuming a rigid anchor at the top of the wall. Their method is considered for construction processes, whether excavation or backfilling, and the pre-construction stress state in the soil. They assumed plane-strain conditions and employed 8-noded parametric elements to represent the soil medium. The results illustrate the impact of wall deformation on the distribution patterns of earth pressure exerted on the anchored sheet-pile wall (ASPW).
Rauhut, in his discussion [33], reported FE analysis results that showed strong agreement with the distribution theory results. Rauhut modeled the sheet pile as a series of beam elements while applying linear active earth pressure above the dredge level.
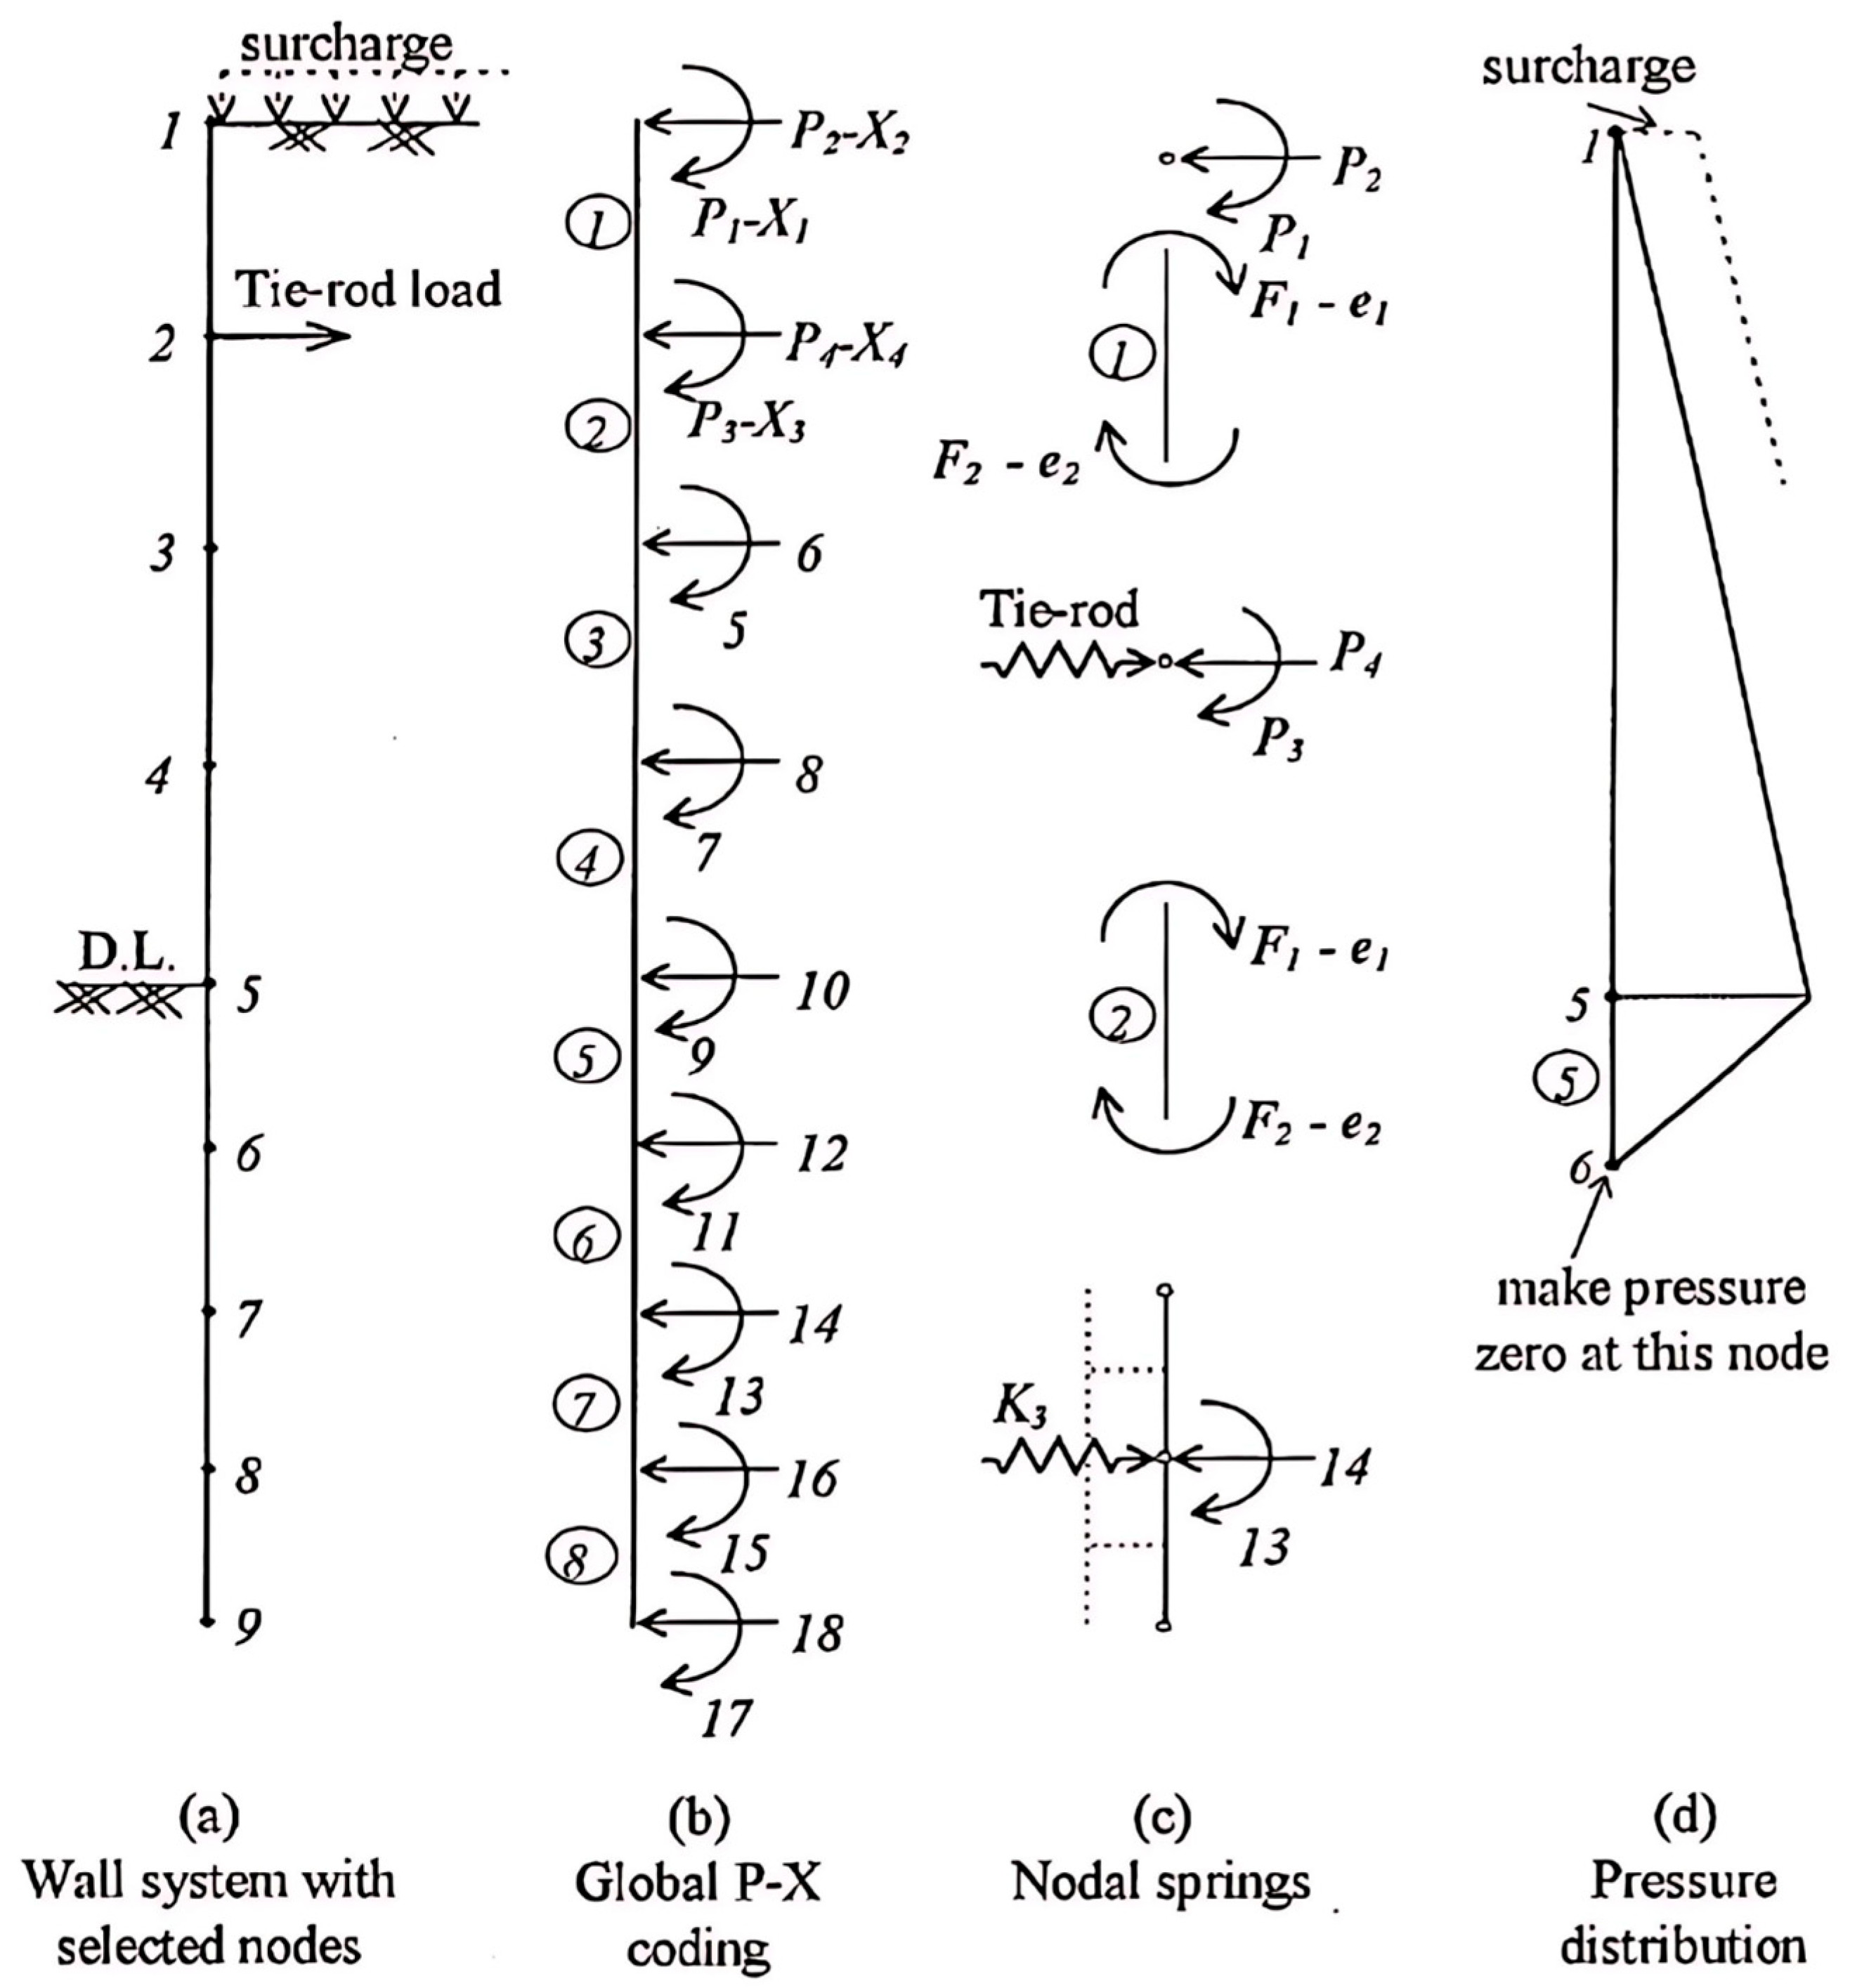
Similarly, Bowles [36] reported a successful FE program where the sheet pile was modeled as beam elements resting on an elastic foundation. In this approach, soil stiffness (modulus of subgrade reactions) was used to evaluate lateral soil reactions below the dredge level, while a linearly varying active earth pressure was assumed behind the wall above the dredge line. Figure 5 shows the Bowles FE model.
Iai et al. [37] employed an effective stress model in FE analysis of two adjacent anchored quay walls made of sheet piles during an earthquake. Their results demonstrated the model’s capability to explain why one wall suffered severe damage while the other remained stable, effectively distinguishing between large and negligible deformations. Bilgin [38] investigated the influence of construction methods on anchored sheet pile walls using FE modeling and concluded that walls constructed with the backfill method exhibit significantly higher bending moments and deformations than those constructed with excavation.

3.6. Estimation of Soil Stiffness

In the above comparisons and discussions, the modulus of the subgrade reaction was estimated according to Bowles’ method [29], since it seems to provide a rational and logical procedure for evaluating the soil stiffness. Details of Bowles’ method for determining the soil stiffness are outlined below. It is worthwhile mentioning that other constitutive soil models for subgrade reaction can similarly be adopted and incorporated in the flexural parameter α.
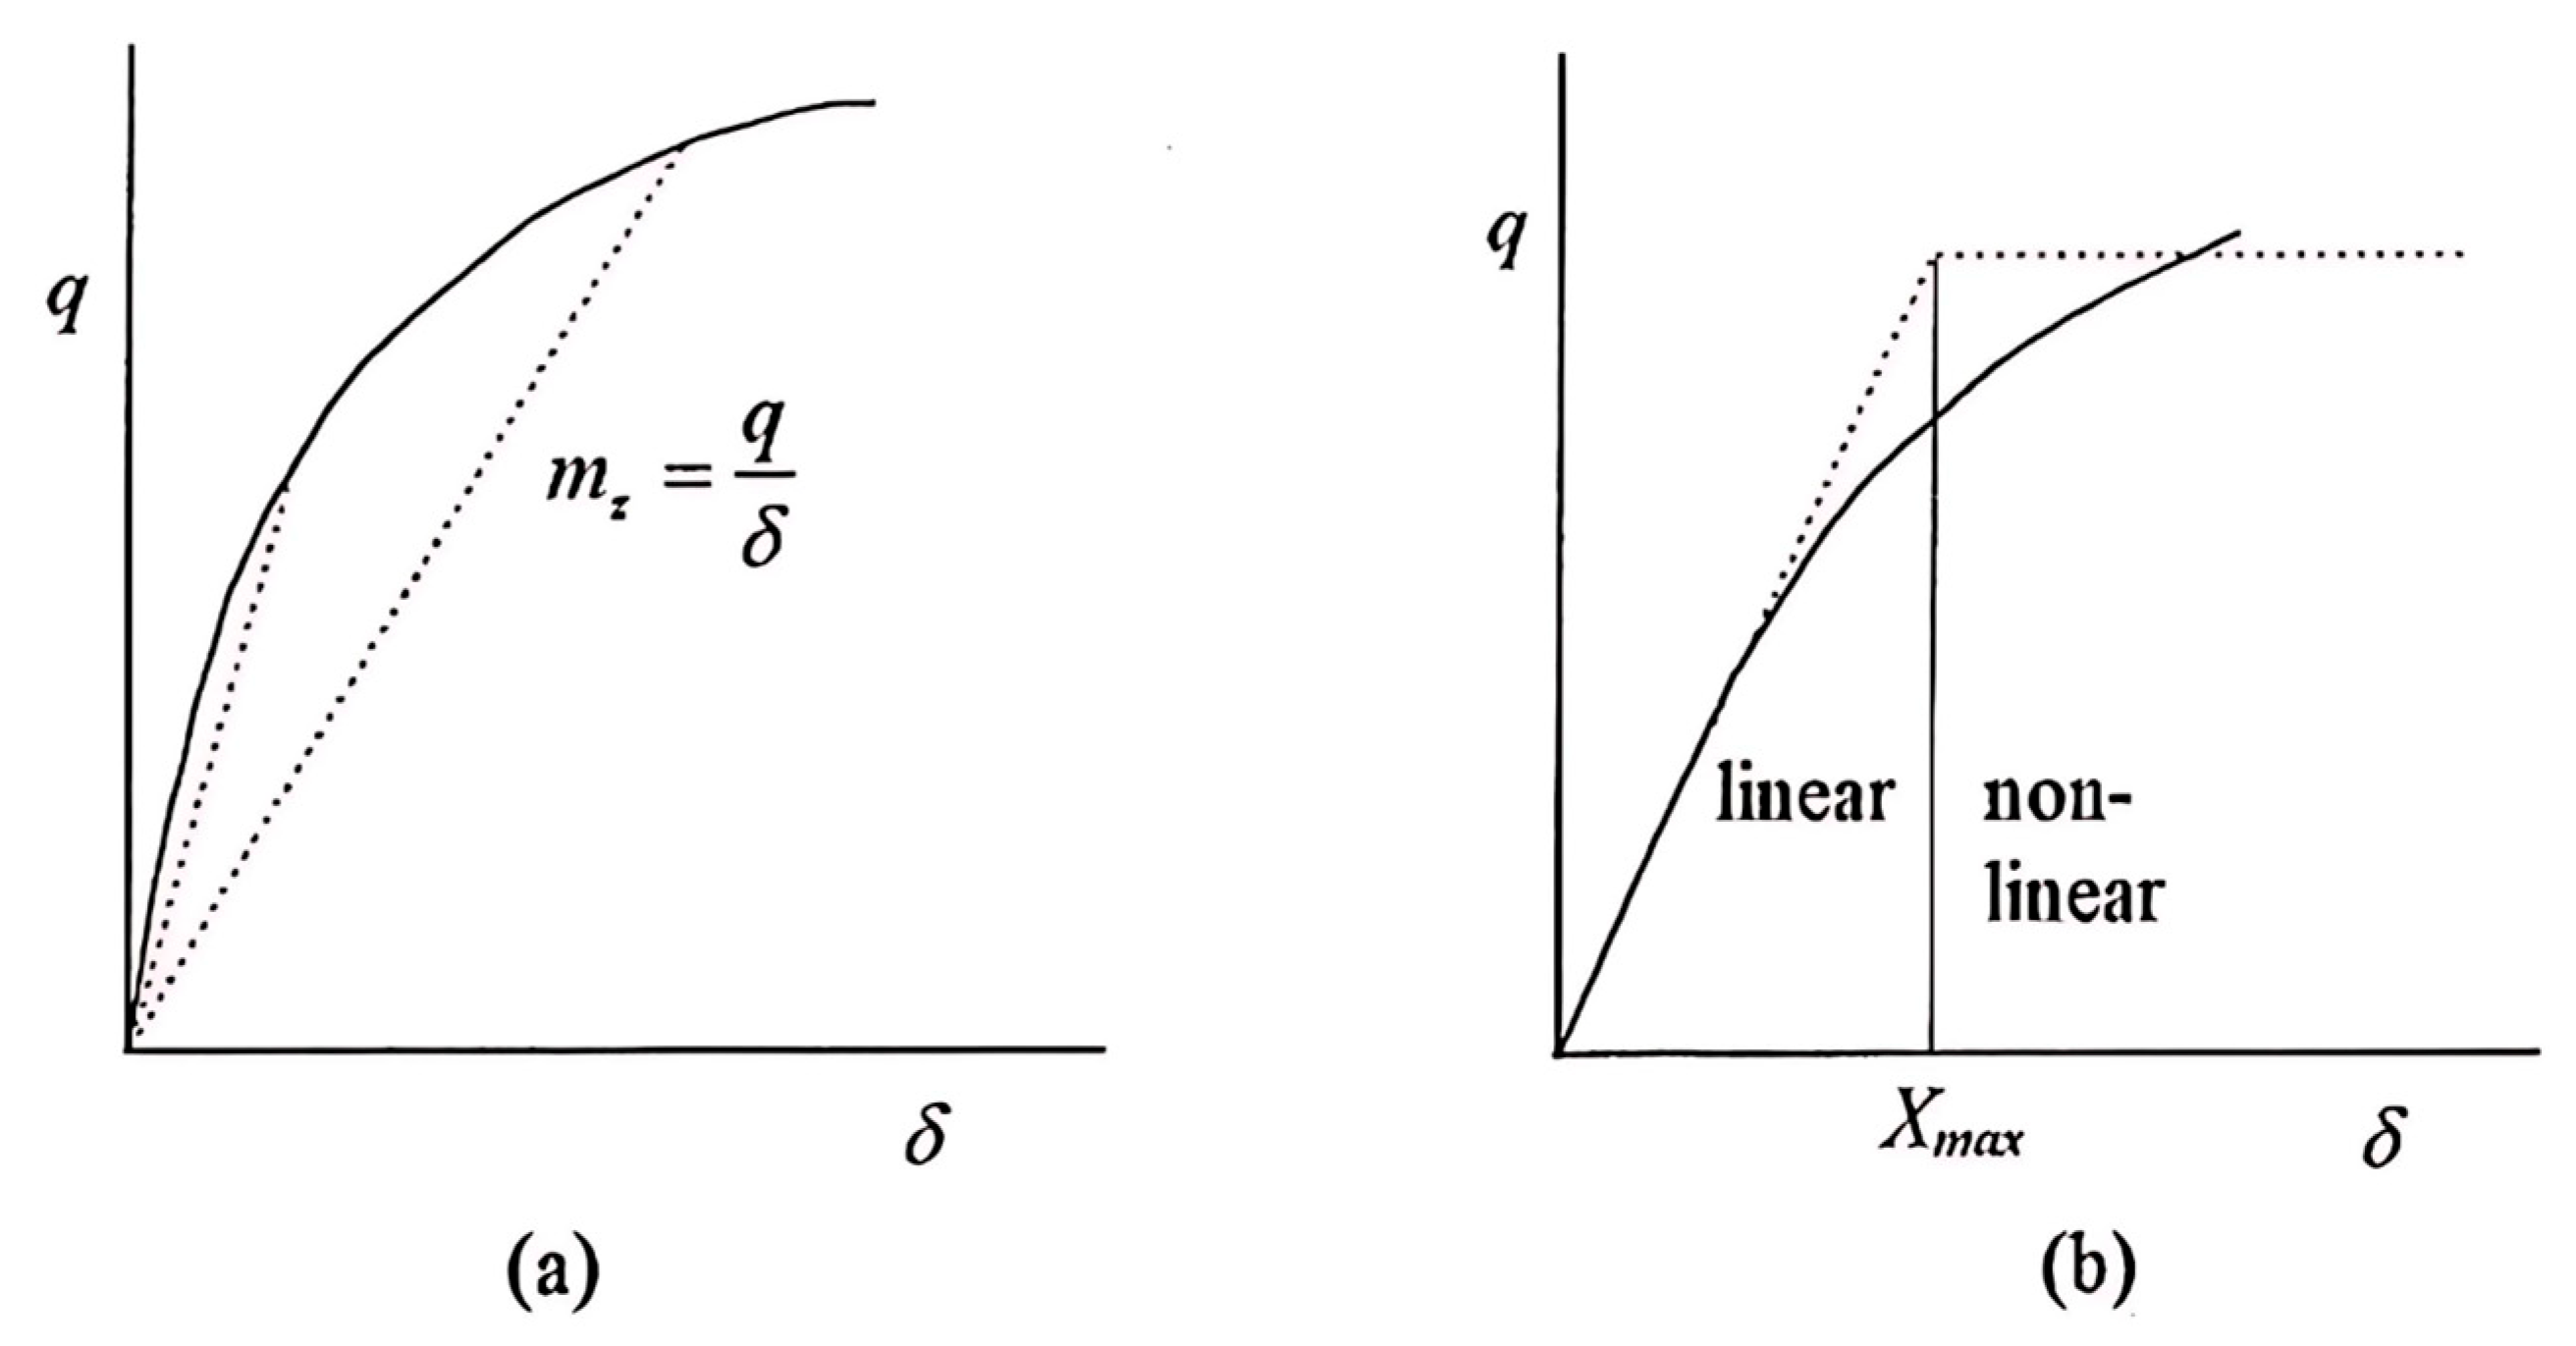
Soil stiffness, or modulus of subgrade reaction, is a ratio of soil pressure to deflection and is commonly used in the structural analysis of foundation members and earth-retaining structures, Bowles [29]. This ratio is defined in Figure 6. The basic equation relating soil pressure to deflection, based on plate-load test data, is as follows:
  • ms = soil stiffness, modulus of subgrade reaction;
  • q = soil pressure;
  • δ = deflection.
Then, plots of q versus δ from load tests produce curves like the one shown in Figure 6a. When using this type of curve to obtain ms in Equation (3), the value of ms will vary depending on whether a tangent or secant modulus is used and the specific coordinates of q and δ. However, Figure 6b presents the values of ms, which have been used by Bowles [29] so that ms is taken as constant up to a deflection Xmax. Beyond Xmax, the soil pressure will have a constant value defined by qu. The value Xmax can be directly estimated from a small, measured settlement, such as 0.012 to 0.025 m, or by inspecting the load–settlement curve [29]. One might use one of the simplified bearing capacity equations, which would be simplified (no depth, inclination, base, or ground factors) to read as
m s = q u X m a x = A s + B s z n = 1 0.025 c N c + q _ N q + 0.5 γ B N γ
Separating terms, we have
A s = 40 c N c + 0.5 γ N γ
B s = 40 γ N q
where
  • qu = the ultimate bearing capacity of the soil at a settlement of 1 inch (0.025 m);
  • As = constant for either horizontal or vertical members.;
  • Bs = coefficient for depth;
  • c = soil cohesion;
  • Bs = coefficient for depth;
  • q _   = overburden pressure = γ z;
  • z = depth below dredge level;
  • n = exponent to give ms the best fit (if load test or other data is available);
  • B = 1.0, taking the unit width of the wall;
  • Nc, Nq, and Nγ are the bearing capacity factors for cohesion, surcharge, and unit weight, respectively.
Table 1 shows the range of values of modulus of subgrade reaction ms.

3.7. Experimental Work

3.7.1. Description of the Apparatus

An apparatus for testing small-scale sheet-pile models was designed and constructed to evaluate the theoretical solutions investigated in the previous paragraphs. A brief description of the experimental work is outlined hereafter; more details are presented in a forthcoming article.
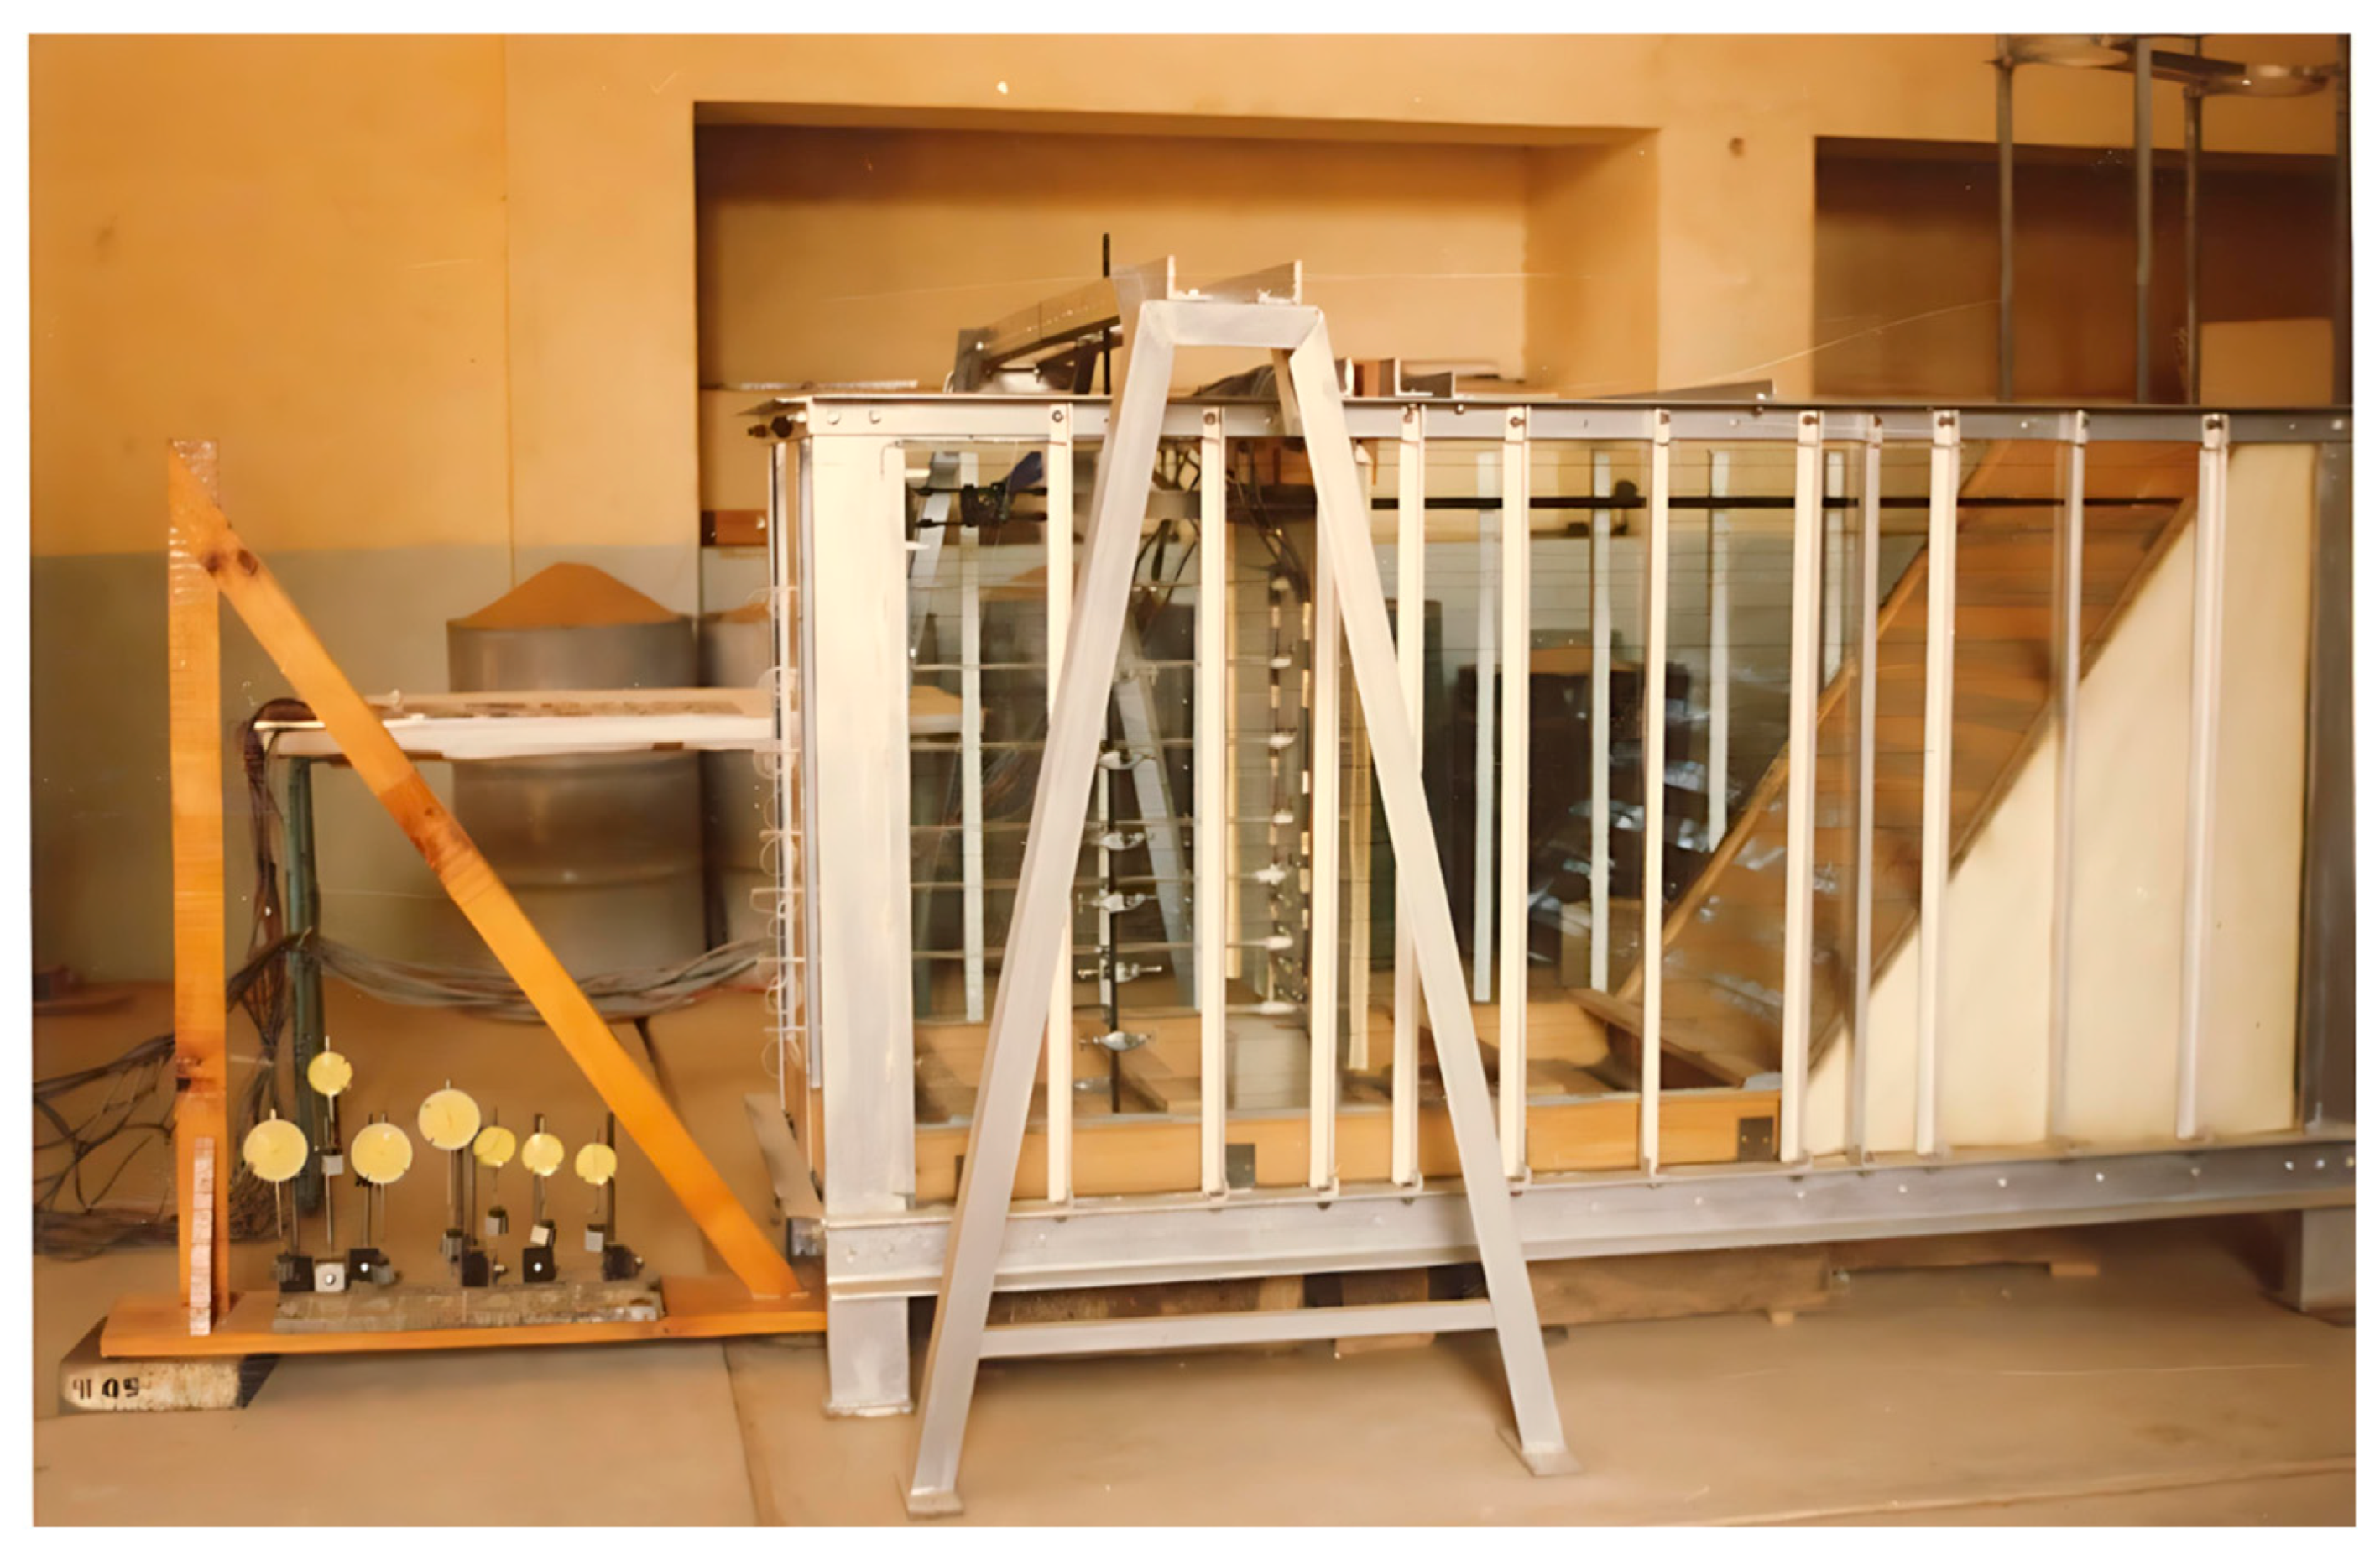
A steel-framed earth tank was designed to hold the minimum volume of sand needed in the tests without affecting the adequate simulation of the behavior of the sheet pile model. The earth tank was made approximately 2.0 m long, 0.8 m wide, and 1.0 m high, with its bottom raised 0.3 m above floor level. The two long vertical sides of the tank were made of thick transparent glass plates to facilitate viewing the behavior of the retained earth mass (Figure 7).

3.7.2. Control Tests

The model of flexible sheet-pile was made from an aluminum alloy sheet with a thickness of 2.5 mm. The material properties, namely the modulus of elasticity and Poisson’s ratio, were determined from simple bending tests. The modulus of elasticity E of the aluminum model material = 69.5 GPa, and the mean value of Poisson’s ratio v = 0.35.
The sheet-pile model was loaded by an ideal dry sand, with practically no cohesion, prepared by sieving from a carefully selected batch of natural sand that was taken from the quantity passed mesh number 14, 500 μm maximum particle size, and it was retained on mesh number 30, 1.18 mm maximum particle size, as per BS 410 test sieves.
The angle of internal friction, ϕ, as obtained by standard shear box tests, was found =31.8°.
The unit weight of the sand was obtained from several tests using a standard container of known volume in which the sand was poured under a given head and, in the same manner, was later adopted for filling the earth tank. The mean value of the unit weight, γ, of the sand was =14.6 kN/m3, with relative density Dr = 36.0.
The angle of friction between the test sand and the sheet-pile model was determined using an interface direct shear box with one half of the shear plane as an aluminum coupon, which was cut from the sheet used in the model. The test was repeated twice for each normal stress value, and the mean angle was adopted as the angle of friction between the aluminum material and the sand sample used for the tests. The mean angle was found to be δ = 21.7°.
To minimize the effects of friction between the earth and the tank sides, the sheet-pile model was made in three entirely separated vertical sections, each 250 mm wide by 790 mm high. All results were based on measurements taken on the center sheet pile. The joint between the three sheet piles and between the outer sheet piles and the tank side walls was sealed by flexible rubber loops so that no sand leakage or load transfer could occur through any of these joints.

3.7.3. Filling the Earth Tank

The earth tank was filled with the prepared sand simultaneously on each side of the sheet-pile model while maintaining even compaction. Even compaction was achieved by allowing the sand to flow freely under its own weight from a constant height into the earth tank. To ensure this, three funnels were positioned directly above the tank. The lower end of each funnel was connected to a rubber hose 25 mm in internal diameter. The funnels were carried on a steel beam supported by two stands, set apart from the tank walls, and adjustable in 50 mm increments to achieve different height levels. The filling sand was deposited in even layers with the aid of horizontal guidelines drawn at 50 mm intervals on the glass sides of the earth tank.
The authors aim to verify the credibility of the proposed analytical methods through experimental testing on a small-scale ASPW model, compare the methods, measure soil mass deflections, and visualize failure patterns in the retained soil. A forthcoming article will further elaborate on the latter.

3.7.4. Deflection Measurements

Measurements of deflections on the sheet-pile test model seem to present considerable difficulties in view of the presence of sand filling on either side of the sheet-pile wall prior to excavating to the dredge level, simulating the dredged construction method. Satisfactory measurements of the sheet-pile deflections were obtained through the sand mass. The deflection measurements were facilitated by a glass-tubing system embedded in the sand mass in front of the sheet-pile model and inextensible strings to dial gauges fixed at a triangular timber frame. The general arrangement of the testing apparatus is shown in Figure 7.

3.7.5. Strain Measurements

The bending strains were measured at ten points along the vertical center line of the front face of the center sheet pile.

3.7.6. Measurements of Anchor Force and Tie-Rod Yield

The anchor force was measured by a proving ring with a capacity of 2.8 kN. One end of the proving ring reacts on the central sheet-pile model through a T-section bar of steel whose length is equal to the width of the sheet-pile. The other end of the proving ring was fixed onto a screw jack welded to a steel channel section, which was bolted to the front end of the earth tank. The tie-rod yield was provided by relaxing the screw jack until the readings of the dial gauges at the anchor level corresponded to the desired yield value.

3.7.7. Test Runs

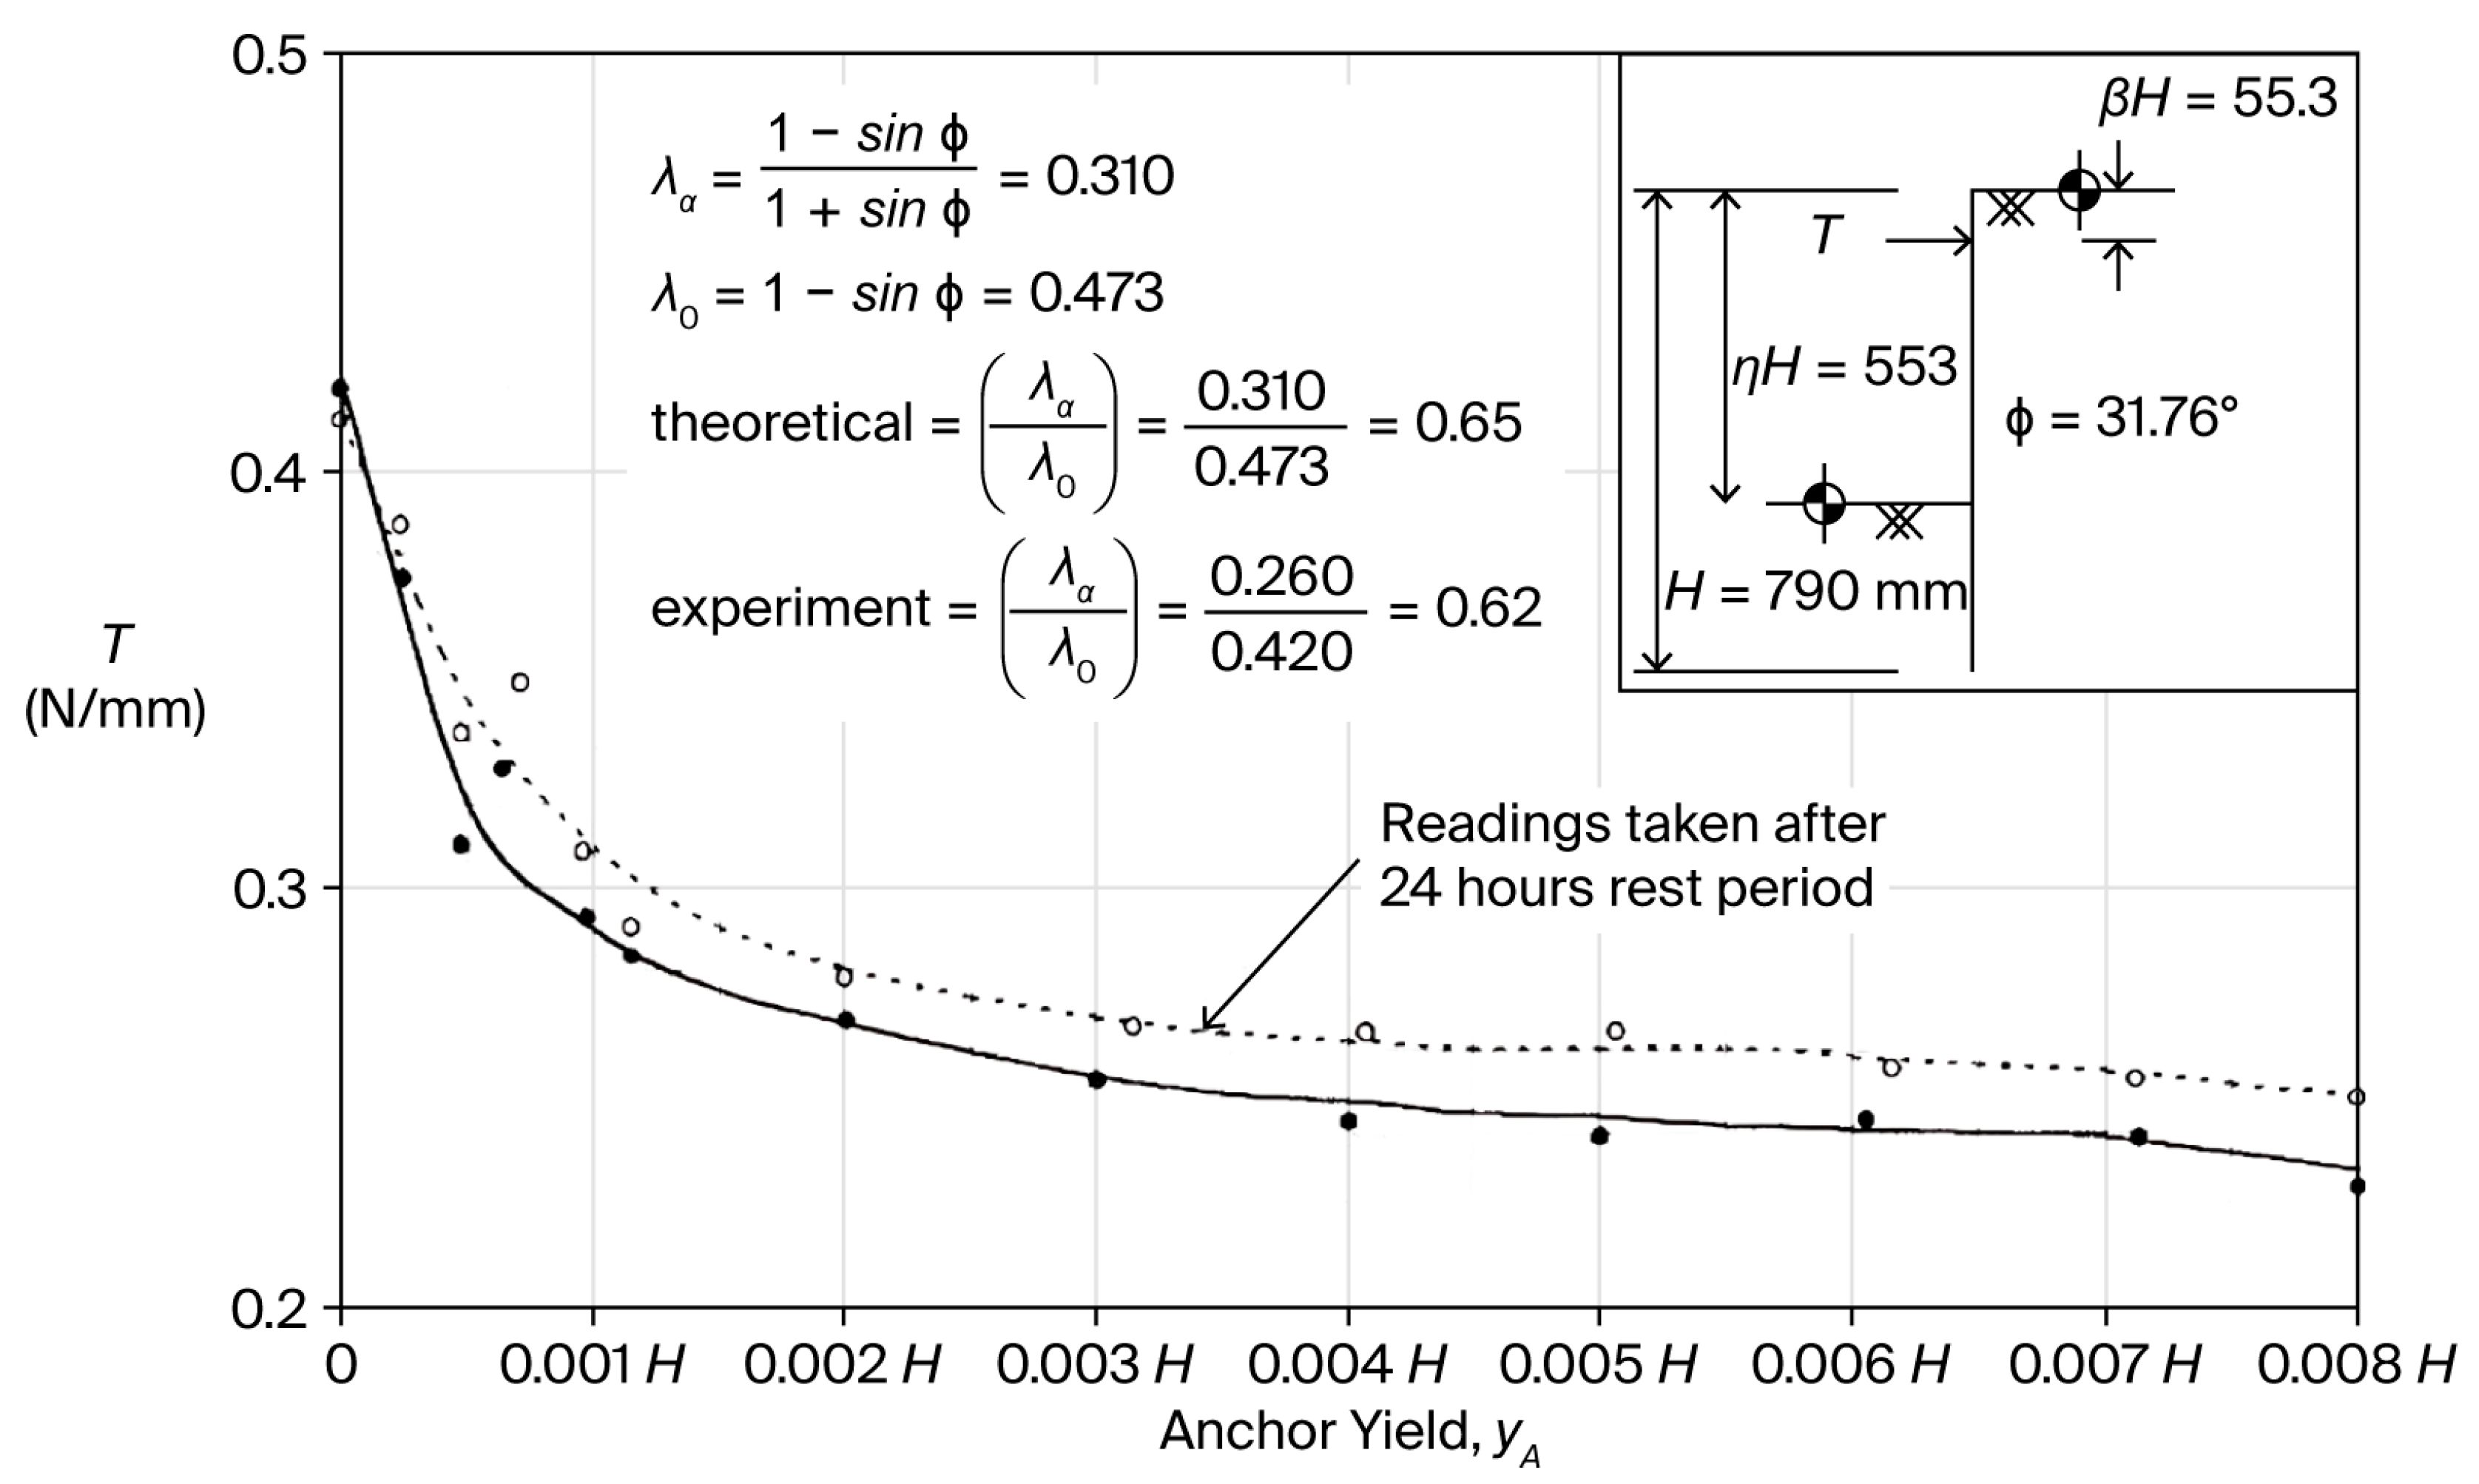
Two test runs were performed: In the first test run, readings of all gauges, deflection gauges, strain gauges, and anchor force were recorded at five selected dredge depths: ƞ = 0.3, 0.4, 0.5, 0.6, and 0.7. When the last dredge level was reached, i.e., η = 0.7, and after taking all the corresponding measurements, the entire apparatus was left standing for 24 h. Then, tie-rod relaxation was applied the following day. These anchor yields were controlled to progress evenly with the aid of the dial gauges situated at the anchor levels of all three sheet piles.
Readings of all gauges were recorded for anchor yields increments from 0.0002H to 0.008H, where H (=790 mm) is the total height of the sheet-pile model. A rest period of 24 h was allowed between each relaxation interval.
In the second test run, readings of all gauges were recorded at dredge depths having η values of 0.3, 0.4, 0.5, 0.6, 0.7, 0.75, and 0.8. Thus, seven tests were conducted on the same sheet pile using different values of η. The position of the anchor rods was also kept constant at β = 0.07 in both test runs.
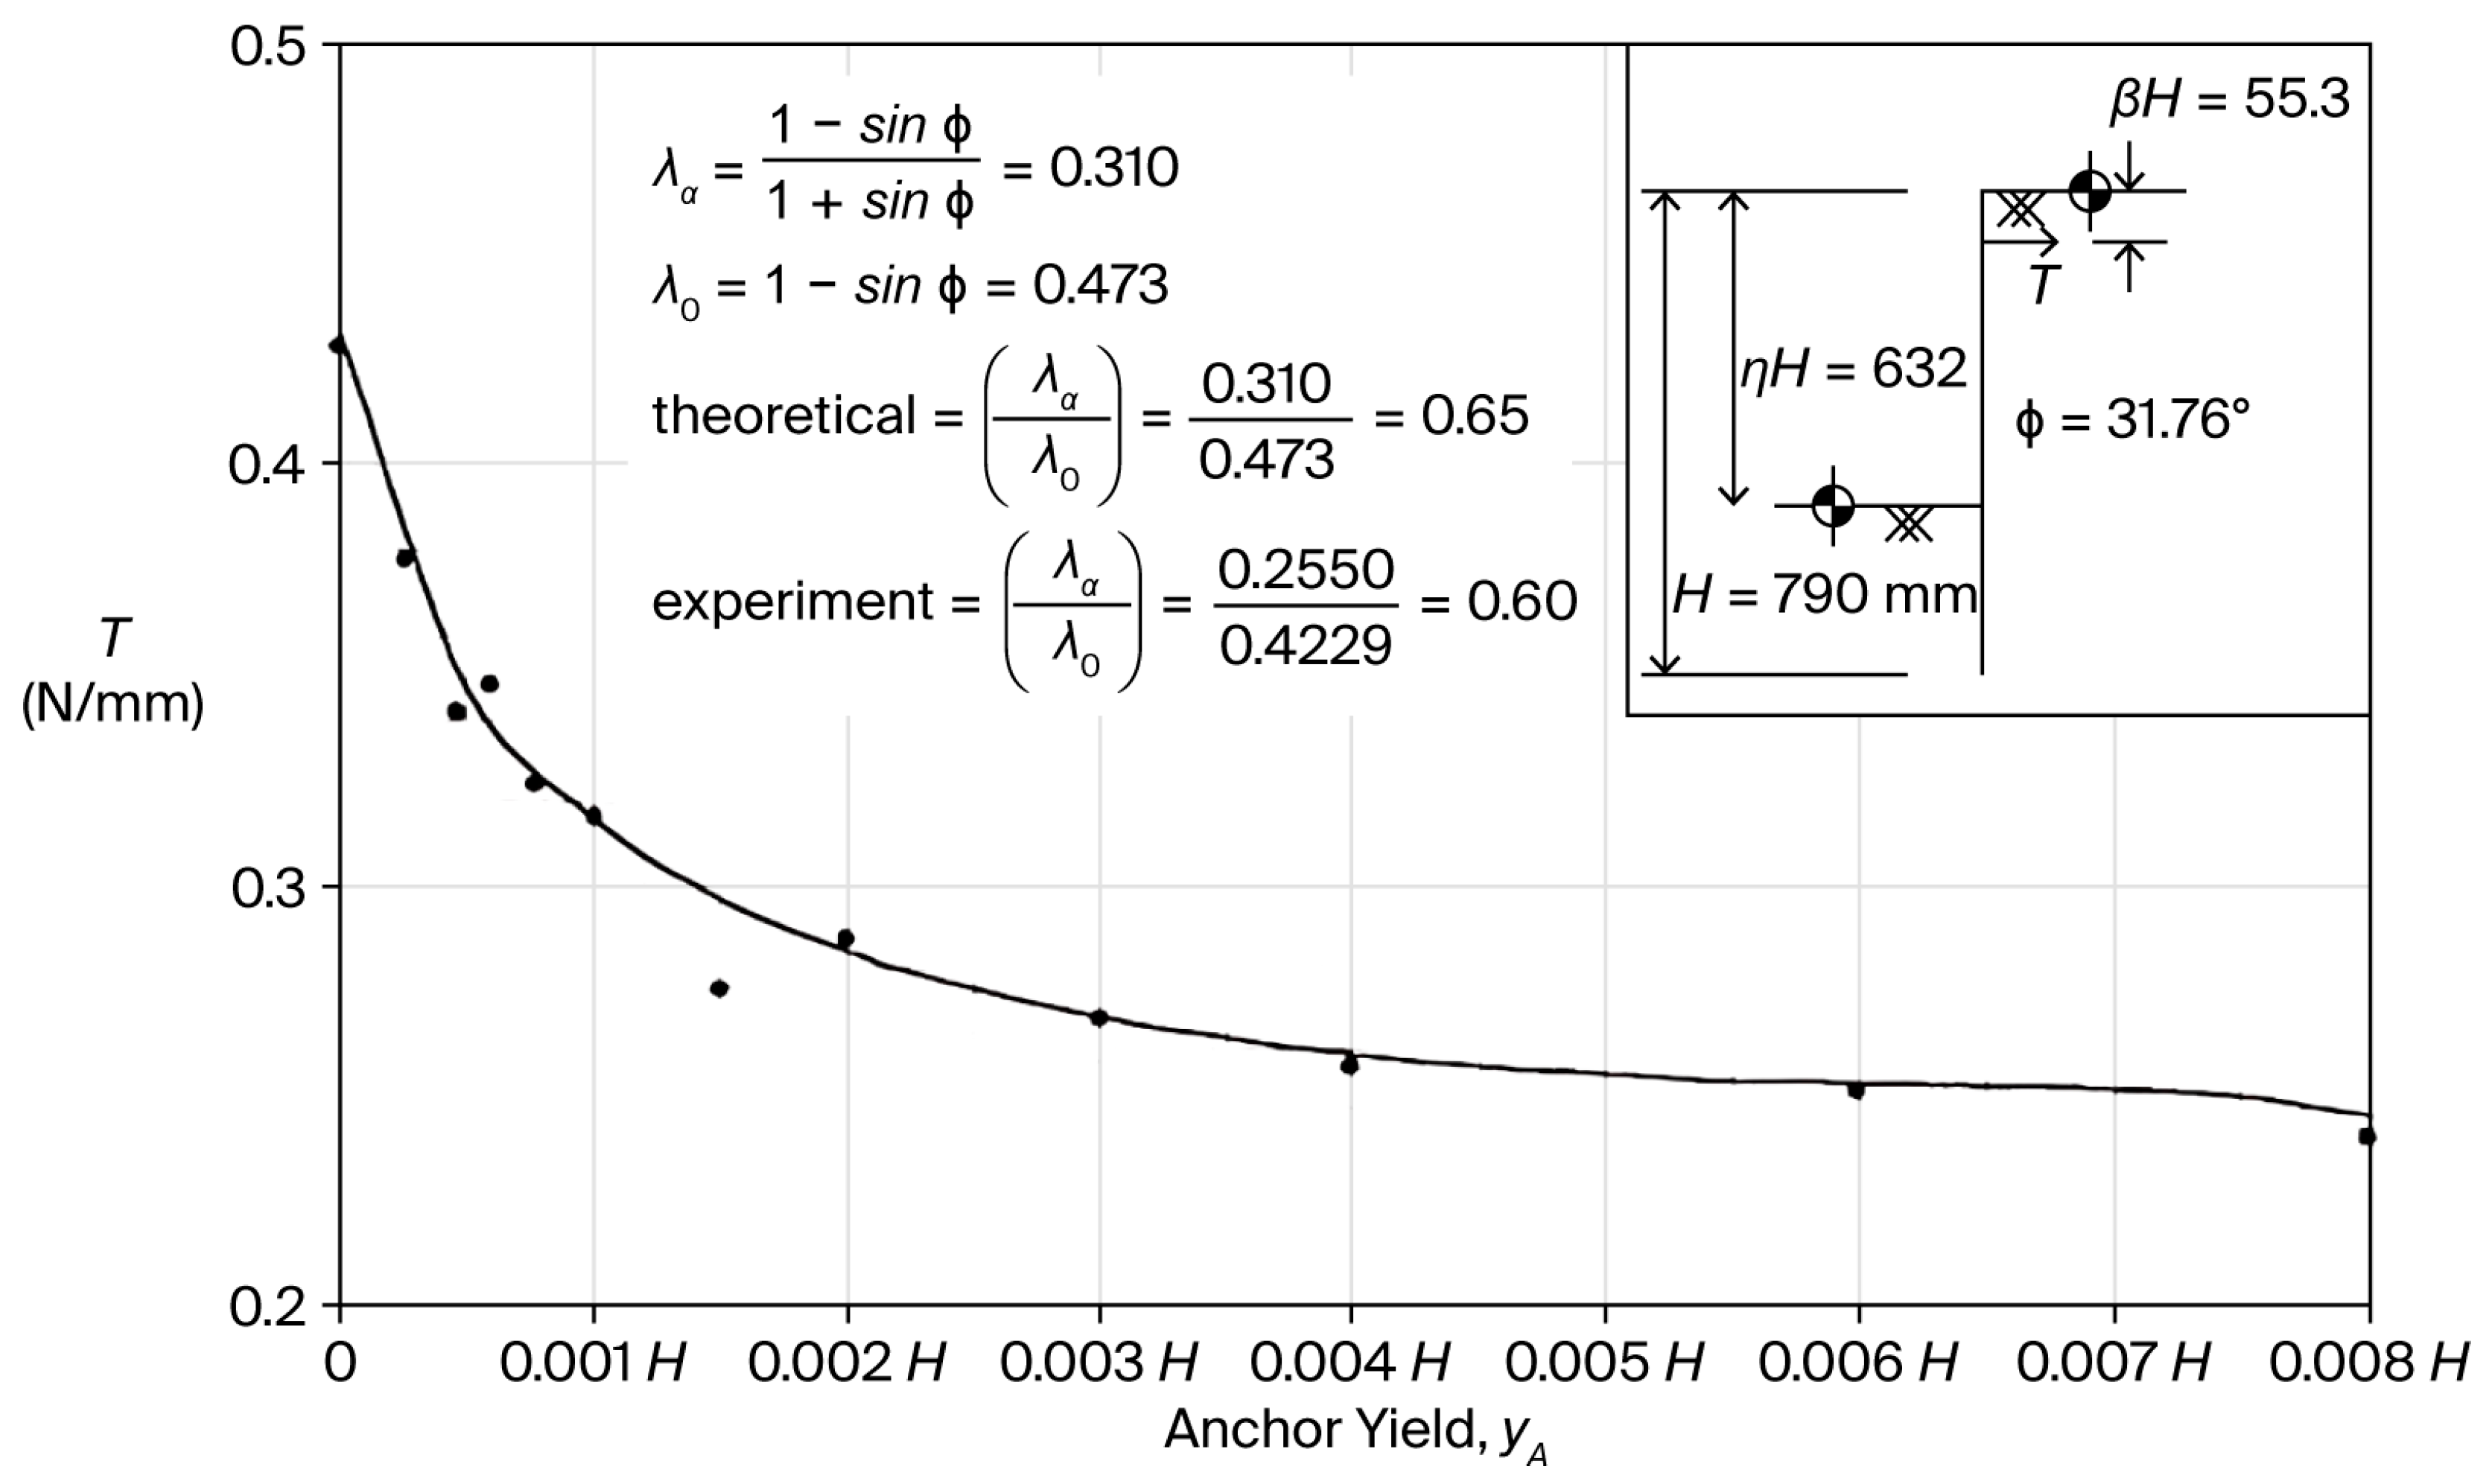
The effect of the anchor yield on the tie-rod force is shown in Figure 8 and Figure 9 for ƞ = 0.7 and 0.8, respectively.
Note that when estimating the experimental ratio λ a λ 0 shown in Figure 8 and Figure 9, the experimental at-rest coefficient value (λ0) corresponds to tie-rod force, T, at anchor yield yA = 0.0, and the experimental active coefficient value (λa) corresponds to tie-rod force, T, when the anchor yield ya = 0.005H.

4. Results and Discussions

4.1. Comparison Between Test Results and Theoretical Solutions

It should be observed that the value of the pile stiffness α, calculated for the sheet-pile model data, came out to α ≈ 10−4.6, whereas the parameter giving the depth of anchor rods, βH, was kept constant in the model at β = 0.07. The ensuing discussions and comparisons of the test results with the theoretical solutions, therefore, essentially pertain to the above-given values of α and β.
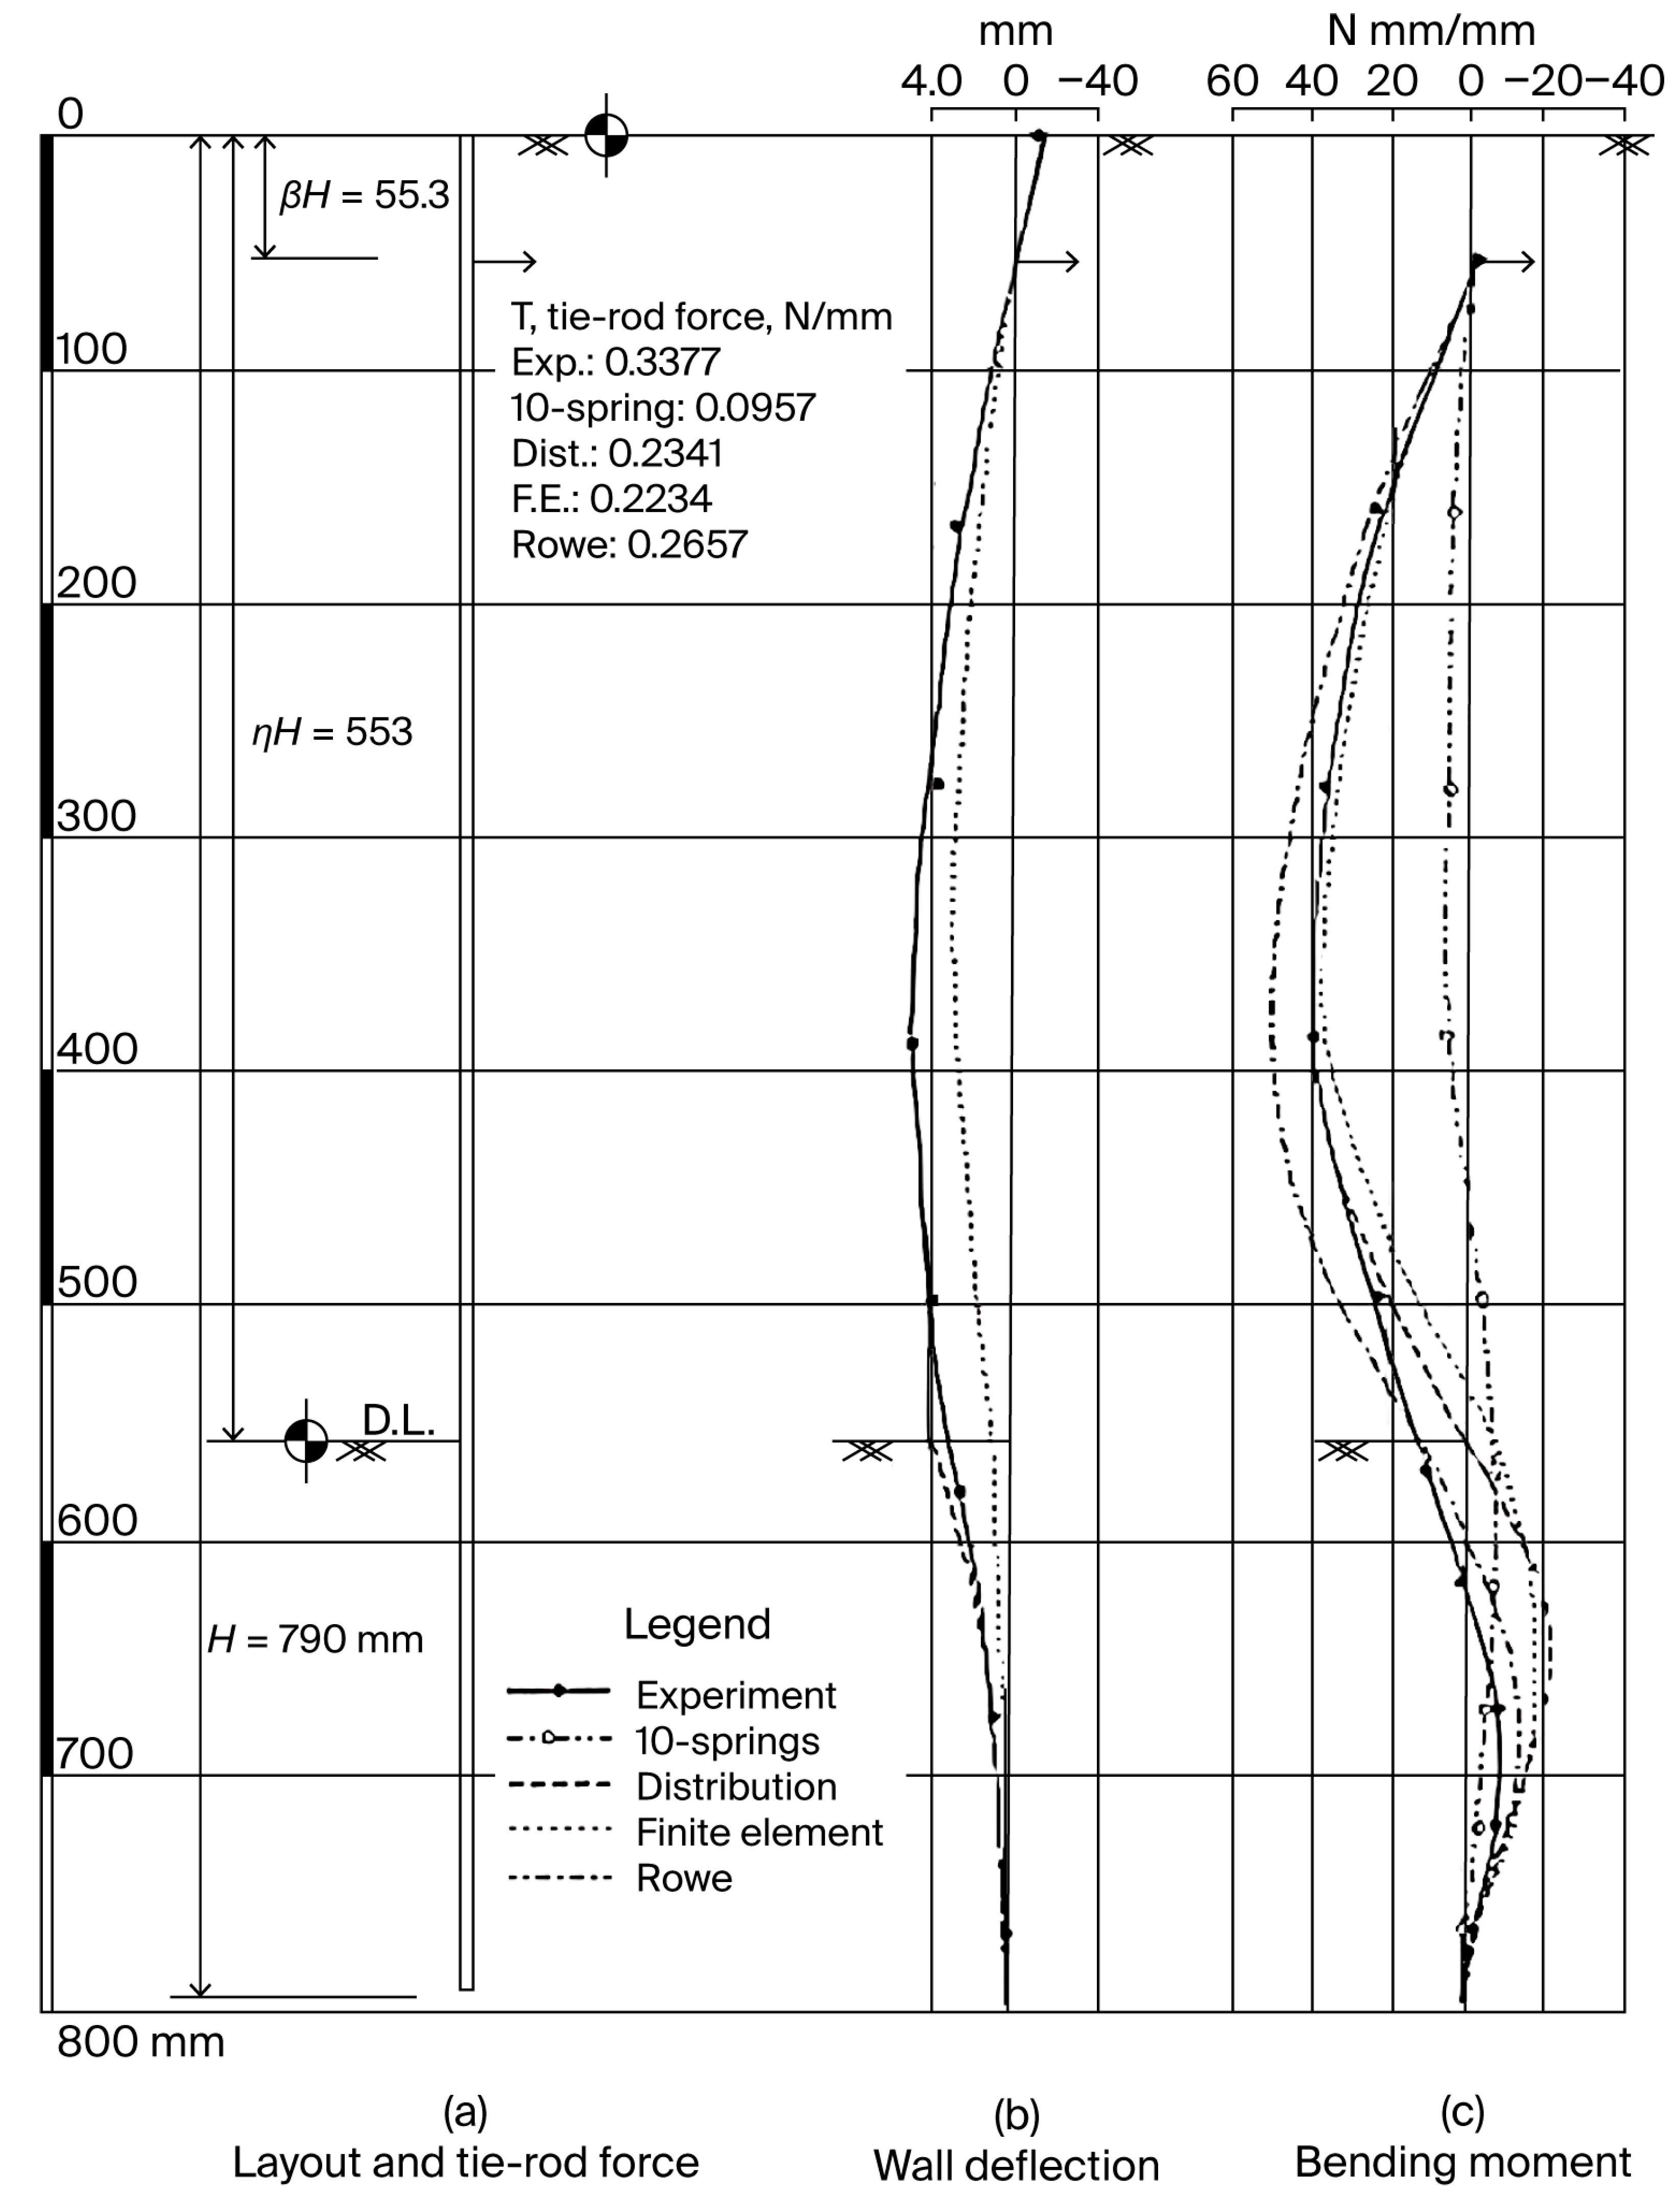
Figure 10 displays the values of the tie-rod force, bending moment distribution, and deflections, as obtained from the test pile model for values of the dredge depth ratio η = 0.7; also shown on the same figures are the corresponding results of the four main theoretical solutions, namely, the 10-springs method, the distribution theory, the finite element method, and Rowe’s theoretical method. For η > 0.4, the 10-springs method began to reveal lower values than the experimental results for both bending moment and tie-rod force. This deviation between the experimental results and the 10-springs method increased with increasing values of η above η = 0.4.
The values of the bending moment, as calculated by both the distribution theory and the finite element method, are in close agreement with the experiments for all values of η greater than 0.5. On the other hand, the tie-rod forces calculated by either of the above two methods were found to be some 70% of the corresponding test values.
To further facilitate the comparisons between the theoretical solutions and the test results, the theoretical values of the maximum positive bending moment and tie-rod force are expressed as fractions of the respective test value; the ensuing factors are summarized in Table 2.
It can be seen from Table 2 that Rowe’s theoretical method gave values for tie-rod force that are close to the test results for η ≤ 0.4. However, the maximum positive bending moment values given by Rowe’s method ended up being in the range of 25–40% higher than the test values for all values of η.
The values of the tie-rod force obtained from the distribution theory and the finite element method are close to each other and are about 30% lower than the test results for all values of η. On the other hand, the values of the maximum positive bending moment obtained by the finite element method and the distribution theory are almost identical to the test results for values of η ≥ 0.5. For η < 0.5, the above two methods underestimated the maximum positive bending moment of the sheet-pile by about 20~35% of the test results.
Both the distribution theory and the finite method underestimated the tie-rod force by about 25% to 30% of the measured results for all values of η.
It is observed that the measured high values of the tie-rod force, above those predicted by the distribution theory and the finite element method, are probably due to the earth pressure in the vicinity of the anchor level being closer to the at-rest condition than the active condition, assuming no anchor yield. Moreover, the part of the sheet-pile aboveanchor level is deflected towards the sand fill, whence passive pressure is expected to be developed in the sand mass above anchor level. This last effect would contribute significantly to the rise in the measured tie-rod force. In the derivations of both the distribution theory and the finite element method, no account is taken of this passive pressure zone above the tie-rod level; instead, only linearly varying active pressure is assumed to act throughout on the sheet-pile wall above dredge level; see Figure 2a,b, which show that suitable allowance for this increase in the tie-rod force would be necessary for design purposes.
As expected, the classical methods of ASPW analysis revealed much higher values, especially for the maximum bending moments; see the last column in Table 2. It is worthwhile mentioning that the fixed-earth support method was found to apply when η ≤ 0.6, while the free-earth support method was used for η = 0.70, 0.75, and 0.80.

4.2. Range of Applications of Each Theory

4.2.1. Rowe’s Theoretical Method

It can be seen from Table 2 that Rowe’s method of analysis gave consistently high values for the maximum positive bending moment, over 25% higher than the test values, for all values of η. It may, however, be observed that in the derivations of Rowe’s method, a rectangular active earth pressure block is assumed to act below the dredge level, as shown in Figure 1a. None of the other theoretical solutions has considered this extra loading. It is believed that such additional loading may have accounted for the increase in the maximum positive bending moment calculated by Rowe’s method. Rowe’s theory, however, yielded values for the tie-rod force in close agreement with the experimental results when η ≤ 0.4. For higher values of η, the tie-rod force, from Rowe’s theory, ended up being some 20% less than the test results.

4.2.2. The Distribution Theory

The solution by the distribution theory assumes active earth pressure to act on the sheet-pile wall above the dredge level, i.e., wall deformations above the dredge level are assumed sufficiently large to mobilize the active pressure state. Thus, for values of η ≥ 0.4 when the above assumption is generally satisfied, the results of the distribution theory were found to be in good agreement with the experimental values concerning the maximum bending moment and yielded about 70% of the experimental tie-rod force. Since, in design practice, the η values of sheet-pile walls are often that η ≥ 0.4, the distribution theory may be accepted as a practical method for anchored sheet-pile design and analysis.

4.2.3. The 10-Springs Method

It is observed that the 10-spring method gave acceptable (upper bound) results for the maximum bending moment and tie-rod force for values of η ≤ 0.4. For high values of η, i.e., where (η ≥ 0.5), the bending moments and tie-rod force predicted by the 10-springs method yielded values that were consistently lower than the corresponding experimental values. This reduction in the tie-rod force and the maximum bending moments becomes more pronounced as η increases.
These deviations (reductions) may be explained in terms of the basic assumptions of the 10-spring theory. It may be observed that large deformations of the sheet pile above dredge level (i.e., large value of yi), associated with η > 0.4, are necessarily accompanied by increasing reductions in the net wall pressure, Ri, as expressed by Equation (6). In fact, Ri may even drop below the values given by the active earth pressure. This is a very significant outcome from the formulation of the 10-springs method when η assumes values much greater than 0.4.
It is known that the wall pressure drops approximately linearly with wall deformation from the at-rest wall pressure down to the active earth pressure value. However, further wall deformations, beyond those mobilizing the active earth pressure, are not associated with reductions in the earth pressure. Thus, the active earth pressure is at a lower limit, which remains approximately constant over a wide range of subsequent deformation. Figure 8 and Figure 9 illustrate this condition.
Therefore, the reduction, kiyi, in the wall pressure at any spring will be limited because the lateral pressure cannot drop below the active state. This immediately limits the expressions representing the net lateral spring reactions in the formulations of the 10-spring theory.
Hence, Ri = Roi + kiyi must not be less than the active pressure, Rai, which is given by
Rai = λa γ h zi
where
  • Rai = spring reaction due to active pressure;
  • λa = coefficient of active pressure;
  • γ = soil unit weight;
  • h = distance between adjacent springs;
  • zi = depth to spring i measured from the ground surface.
Thus,
Roi + kiyiλa γ h zi
or
(λ0λa) h zi ≥ −kiyi
in which λ0 = coefficient of at-rest pressure.
The condition given by Equation (8) must, indeed, be satisfied at every spring level; otherwise, an unjustified reduction in the wall pressure is introduced at the spring level where the above relation does not hold. Thus, the loading behind the ASPW can be looked at as elastic–plastic pressure variation, in which the earth pressure drops linearly from the at-rest value, λ0 h zi, to the active pressure value, λa h zi. Thereafter, the pressure remains constant with further wall deformation, yi. This state of loading is like applying elastic–plastic springs which was suggested in Verruijt [11]
Thus, for values of η ≤ 0.4, when this condition is found to apply, good agreement was obtained between the results of the 10-springs method and the experimental values.
Moreover, the authors would like to pay attention to the active pressure below the dredge level assumed in both distribution theories. We note that active earth pressure below the dredge level is made rectangular in Rowe’s method and made triangular with a zero value at the first node below the dredge level in Bowles’ FEM; see Figure 8 and Figure 9.
Hence, regarding the distribution theories, the authors suggest the active pressure to continue varying from maximum value at the dredge level to have a zero value at the first spring below the dredge line. This state of loading, which is consistent with the approach proposed by Terzaghi [39], sounds more reliable for the design of ASPWs and the construction of the design charts.

4.2.4. The Finite Element Method

Like the distribution theory, the finite element method assumes active earth pressure to act behind the sheet-pile wall above the dredge level. However, an additional small triangular active pressure block is further assumed to act on the portion of the sheet pile lying between the dredge level and the first node below the dredge level, as depicted in Figure 5d. The selected length of the elements below the dredge level further limits the magnitude of this additional pressure, making its amount insignificant. The results of the bending moment and tie-rod force obtained by the finite element method were found to be close to those obtained by the distribution theory; the finite element results for a maximum bending moment are thus also close to the experimental values when η ≤ 0.4.

4.2.5. Classical Methods

Two of the early methods of ASPWs analysis include the free-earth support and the fixed-earth support methods, which use simplified assumptions of active pressure (from the filled side) and passive pressure on the free side below the dredge line. The design is based primarily on taking moments of the anchor rod, increasing the depth of embedment until horizontal equilibrium is satisfied, and then computing the resulting bending moments in the SP. A safety factor is incorporated by using a reduced λp, for passive pressure, or by increasing the embedment depth by an arbitrary amount, such as 20 or 30 percent. The above simplifications result in the following errors: 1. The tie-rod elongation should be sufficient to develop an active pressure state; otherwise, it results in too small a tie-rod force. 2. The center of pressure below the dredge level is closer to the dredge line than assumed using the passive pressure. The erroneous location of the center of pressure usually results in moments that are too large.

4.3. Behavior of the Sheet Pile for Varying η Values

It is clear from the foregoing discussions and comparisons between the four theories and the experimental work that no one theory fully predicts the behavior of anchored sheet-pile walls over the whole range of variation regarding the different parameters, such as dredge depth, pile wall stiffness, anchor force location, and tie-rod yielding. Whereas the 10-springs method has been shown to give acceptable results for values η ≤ 0.4, both the bending moment and tie-rod force values drop appreciably below the experimental results and below the corresponding results by the other theories when η ≤ 0.4. The values of the maximum bending moments, as given by the distribution theory and by the finite element method for η between 0.5 and 0.8, ended up being in good agreement with the measured test values. These two methods slightly underestimate the tie-rod force. However, the discrepancy in the evaluation of the tie-rod force is believed to relate to the depth of location of the tie rod, βH. The upper portion of the sheet pile above the anchor point would rotate in the opposite direction against the sand, thus developing passive pressure, with a consequent increase in the tie-rod force.
It may be inferred from the foregoing discussions that since the practical range of η values in normal sheet-pile design is such that η > 0.5, the distribution theory, because of its simplicity and elegance of this derivation, would seem to provide the most convenient method for sheet-pile design. In the range of η values (0.40 < η ≤ 0.75), the finite element method gives, more or less, identical results to the distribution theory. For η values ≤ 0.4, the 10-springs method gives reliable solutions with respect to both the maximum bending moment and tie-rod force.

4.4. Behavior of the Sheet Pile for Varying α Values

In the test model, the value of α was such that log α ranged from −4.6 to −4.8. However, the variation in the maximum positive bending moment in the sheet-pile wall above the dredge level is shown in Figure 11 for different η values, which are plotted against α values ranging from 10−1 to 10−6. The solid lines represent solutions using the 10-springs method, while the dotted lines represent solutions using the distribution theory’s corresponding solutions.
A similar plot of the tie-rod force variation is shown in Figure 12. Both plots for the bending moment and the tie-rod force in Figure 11 and Figure 12 are plots representing when β, the location of the tie rod, is at the very top of the sheet pile, i.e., β = 0.0; similar plots could be generated for β = 0.1 and β = 0.2, which were used to develop the design charts in Figures S1–S3.
It is clear from Table 2 and Figure 11 and Figure 12 that the 10-springs method gives reliable results for the sheet-pile problem for high values of α and low values of η, being generally less than η = 0.4. On the other hand, the distribution theory tends to give reliable results for more flexible sheet piles with lower α values and for η values greater than 0.4.
A method of design for ASPWs is outlined, which takes advantage of the 10-springs method (for η ≤ 0.4) and the distribution theory for η > 0.4. The revealed methodology of design is based on design tables and charts arrived at by combining the 10-springs method with the distribution theory in a way that would make the design moments and tie-rod force consistent with acceptable values for the value of η.

4.5. Extrapolation Between the 10-Springs Method and the Distribution Theory

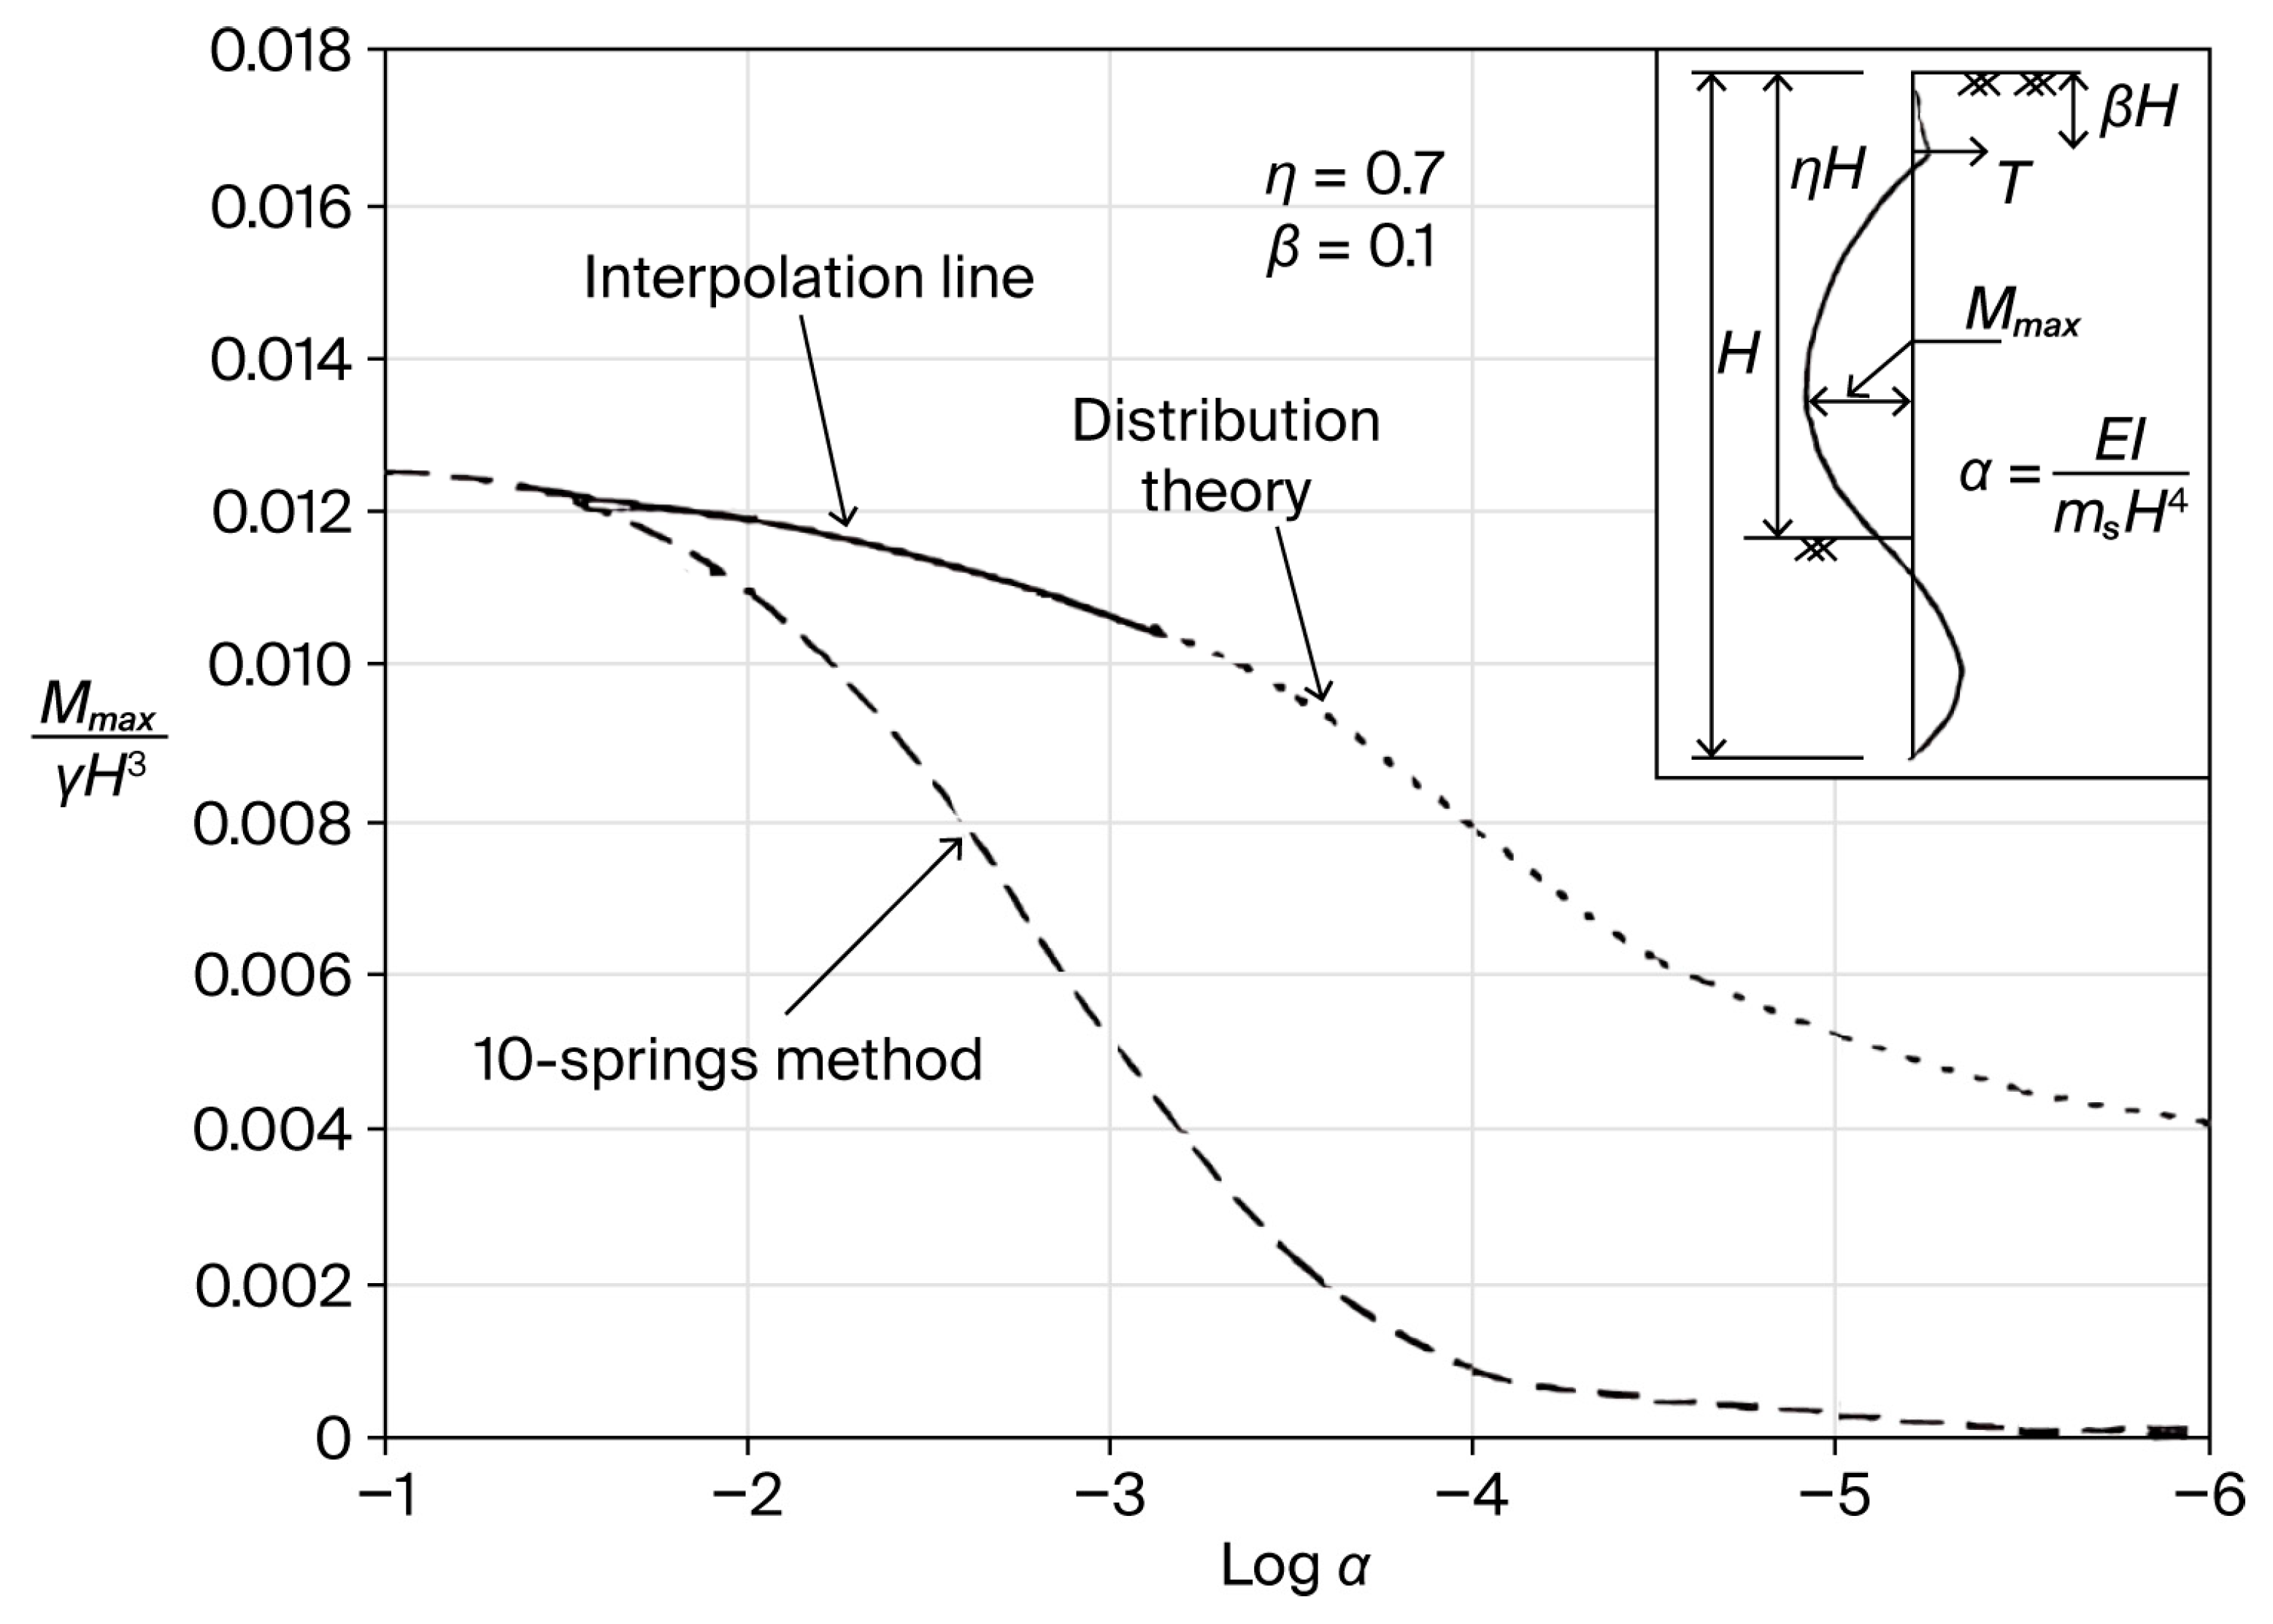
In the transition range of η values (i.e., 0.4 ≤ η ≤ 0.5) in Table 1, when α = 10−4 for the model, neither the 10-springs method nor the distribution method gave reliable estimates of the bending moment or tie-rod force of the anchored sheet-pile wall. To obtain reliable solutions in this range of η values, it is necessary to extrapolate between the results of the two above methods.
Reliable results of the maximum positive bending moment and tie-rod force can be obtained from the derived curves by extrapolation over the transition zone. Thus, continuous curves are arrived at for the bending moment and the tie-rod force, as shown in Figure 13 and Figure 14, respectively. The curves are believed to form upper-bound values of maximum bending moments and tie-rod forces for varying flexibility of the ASPW; hence, they seem sufficient for the design and analysis of ASPWs. The design charts developed hereafter are based on systematic application of combining the two distribution methods and validation against (FE) analyses. The charts allow direct read-off of both the maximum bending moment and anchor force as a function of normalized parameters such as depth of embedment, anchor level, and SP flexibility number.
Similar design charts were developed for Mmax and T for η = 0.6 and 0.8 and for β = 0, 0.1, and 0.2; see Figures S1–S3 in the Supplementary Materials.

4.6. Effect of Surcharge Pressure

It is clear from Figure 3 and Figure 4 that the maximum bending moment and tie-rod force are both increased by surcharge pressure. Such increases in the maximum bending moment and tie-rod force due to surcharge load can be allowed for in design by incrementing the calculated values of the bending moment and tie-rod force under no surcharge by a suitable amount, to be calculated, according to the applied surcharge pressure as follows:
M m a x γ H 3 q = M m a x γ H 3 q = 0 + ζ M × q
where ζM is a multiplying surcharge coefficient taken from Table 3. The values in Table 3 have been calculated from the general expressions for the maximum bending moment in the formulation of the 10-springs method and the distribution theory, extrapolating over transition ranges.
The tables give values of ζM for 10−2α ≤ 10−5, 0.6 ≤ η ≤ 0.8, and for 0.0 ≤ β ≤ 0.2, which values cover the practical ranges of α, η, and β.
It will be seen, also from Figure 3, that there is no significant change in the values of ζM for values of α > 10−2 or values of α < 10−5.5.
Similarly, Table 4 gives the corresponding values of ζT, which is the surcharge multiplier for the tie-rod force. The tie-rod Tq for surcharge q can thus be calculated from the value of the tie-rod force T, considering no surcharge load (q = 0), using the following expression:
T γ H 2 q = T γ H 2 q = 0 + ζ T × q

5. Design Procedure

The following design procedure is recommended for ASPWs:
Step 1: From topography, or otherwise, from the given requirements, assume a suitable value for the depth to dredge level, ηH.
Step 2: Find the value of H by assigning a value for η from the following practical ranges: For loose soils, the range can be 0.65 ≤ η ≤ 0.7; for medium-dense and dense soils, the range can be 0.7 ≤ η ≤ 0.75.
Step 3: From the assigned location of anchorage, assume the value of depth to the tie rod, βH, and from the known H, calculate β.
Step 4: From the given soil condition and values of ϕ and γ of the soil, estimate the modulus of subgrade reaction, ms, using Equations (6)–(8) or Table 1.
Step 5: Using the free-earth support method, outlined in various references, e.g., [27,28,40], and check the assumed value of depth to dredge level, ηH.
The free-earth support method gives the embedded depth ratio, η′, = 1 η from the following formula:
λ p 3 η 3 λ p 1 β η 2 + λ p 2 3 β = 0
Step 6: Select a trial sheet-pile section from the standard sheet-pile steel sections tables, e.g., see Appendix A in references [17,29].
Step 7: Calculate the value of α such that α = E I m s H 4 .
Step 8: From the design charts in Figures S1–S3 presented in the Supplementary Materials, with α, η, and β known, find values of the maximum positive bending moment, Mmax, and tie-rod force, T.
It is worthwhile reminding that in the proposed design charts, the maximum bending moment and tie-rod force are expressed in dimensionless forms as M m a x γ H 3 and T γ H 2 , respectively.
Step 9: If surcharge pressure is expected to act, on top of the retained soil, increase the above maximum bending moment and tie-rod force by corresponding amounts using the multiplier values in Table 3 and Table 4 and the expressions in Equations (9) and (10), respectively.
Step 10: Calculate the design bending moment, Md, and the design tie-rod force Td, as follows:
Md = λM × Mmax, in which λM = 1.2 is a factor of safety for the bending moment [29] and
Td = ζ × λT × T, where λT = 1.5 is a factor of safety for the tie-rod force. ζ = 1.0 + 1.25β is a factor to cater for the passive pressure zone above the tie-rods position; see Section 4.1 and references [29,41].
Step 11: Using the allowable bending stresses, σa, of the sheet-pile material, check the bending stress in the selected sheet-pile section, and, if necessary, adjust and repeat Steps 6 to 9.
Step 12: Using the allowable tensile stresses of the tie-rod material, calculate the required tie-rod size.
Step 13: Check the anchor yield, due to the elastic elongation of the tie rod, to be within satisfactory limits (usually ≤0.0008H).
Step 14: Give final summary details.

6. Inferences and Conclusions

The following inferences and conclusions are derived from this paper.

6.1. Inferences

6.1.1. Theoretical Solutions of Anchored Sheet-Pile Walls

An anchored sheet-pile wall must be considered as a flexible structure, irrespective of the type of material, steel, or concrete used for the sheet-pile and despite the type of anchorage.
It was clear from the discussions and comparisons of the four main theories of anchored sheet-pile walls, namely, the 10-springs method, the distribution theory, the finite element method, and Rowe’s theory, that each of the theories can give an acceptable analytical solution for the anchored sheet-pile problem under the given conditions. However, no theory fully predicts the behavior of anchored sheet-pile walls over the whole range of the different design parameters: soil conditions, sheet-pile flexibility, dredge depth, anchor location, and anchor yield.
The 10-spring method was shown to give excellent results for small values of η (where η ≤ 0.4) and for high α values where log α ≥ −2.0. Both the bending moment and tie-rod force were noticed to drop appreciably below the experimental results for very flexible sheet piles and for piles of high η values. This deviation in the 10-springs method was successfully adjusted by a process of interpolation over the transition zone between the range of application of the 10-springs method and the distribution theory, which is generally applicable for values of log α ≤ −2 and high η values (η > 0.4).
Rowe’s theory generally yields higher values for the maximum bending moment and tie-rod force of the sheet pile than corresponding results given by either the distribution theory or the finite element method. Rowe’s theory, however, yields values for the tie-rod force in close agreement with experimental results. When η ≤ 0.4, for higher values of η, the tie-rod force, from Rowe’s theory, is some 20% less than the test results.
The finite element method has generally given results very close to those obtained by the distribution theory with respect to both the maximum bending moment and tie-rod force.
The distribution method, the 10-springs method, and Bowles FEM were chosen in this study because they represent three distinct levels of analysis: classical analytical, semi-analytical with soil–structure interaction, and advanced numerical modeling. This spectrum reflects both common design practice and research applications for ASPWs while enabling direct comparison of accuracy and computational demand.

6.1.2. Tie-Rod Yield

The effect of the tie-rod yield from the elastic deformation in the tie rods will reduce the earth pressure on the sheet pile towards the active condition. Hence, this type of anchor yield is beneficial, since it reduces the earth loading on the sheet-pile walls, unless it exceeds the satisfactory limits. Both the values of the maximum bending moment and tie-rod force are reduced by the yielding of the tie rods.
It is found that an anchor yield of 0.005H (H = height of the sheet-pile wall) is sufficient to bring the earth pressure behind the sheet-pile wall from the at-rest conditions to the active state.

6.1.3. Time-Dependent Increase in Earth Pressure

A time-dependent increase in the active earth pressure behind the test sheet-pile was found to take place, as explained in Figure 8. This phenomenon has been encountered only briefly in the literature [29,41]. It is a fact that the understanding of its causes and mechanisms is limited. This study does not seek to quantify the extent of the increase in wall pressure loading and its impact on sheet-pile wall design, though future research in this area would be highly beneficial. Instead, our focus is to demonstrate how this phenomenon could influence experimental results, particularly if the tests are conducted over an extended period.
While awaiting the results of further research, it is wise to account for the potential increases in wall pressure by estimating the lateral earth pressure coefficient at λ0, a value higher than λa, the active state coefficient.

6.1.4. Limits of Practical Dimensions of Anchored Sheet-Pile Walls

Observing practical ranges of ASPW height, H, the soil modulus of subgrade reactions, and sections of concrete or steel ASPWs, it can be concluded that in engineering practice, the flexibility parameters, α, usually vary between 10−2.5 and 10−5; above this range, the sheet-pile walls are too rigid and are not recommended for economic reasons. Below α = 10−5, the sheet piles are too flexible and tend to deform excessively beyond the serviceability limits.
η values range between 0.6 and 0.75, while β is usually ≤ 0.2.

6.1.5. Design Methodology of ASPWs

The design methodology, suggested in Paragraph 4, is based on values of the maximum positive bending moment and tie-rod force, taken from design charts and tables, and arrived at by combining the 10-springs method of analysis and the distribution theory. The combined methodology takes into account the effect of all influencing factors on the design of sheet-pile walls. It also provides reliable solutions over the transition range where neither of the two methods is sufficiently accurate. The suggested design procedure seems to perform satisfactorily and provides an easy method to design safe and economical sheet-pile walls.
The proposed design charts are valid within the assumptions and boundary conditions adopted in their development. They are derived from ASPWs with a single level of anchorage, uniform backfill, and a horizontal dredge line. The soil is considered homogeneous, either purely cohesionless or cohesive, with constant strength parameters throughout the depth.

6.1.6. Modulus of Subgrade Reaction

A major problem in using the concept of the modulus of subgrade reaction is that most of the authors [29,30] give values of ms, soil stiffness, for soils somewhat loosely classified as loose sand, medium-dense sand, dense sand, etc. Such values, as can be seen from Table 1, indicate wide variation within each classification. This makes it difficult to select with much certainty an appropriate value of soil stiffness. The method suggested by Bowles [29] seems to present a more logical procedure for evaluating the soil stiffness modulus. This procedure has been explained in Section 4.6.

6.2. Conclusions and Future Research Directions

This study compared several established analytical methods for the analysis of anchored sheet-pile walls (ASPWs), including the 10-springs method, distribution theory, finite element approaches, and Rowe’s theory, against results from a small-scale laboratory model. The following conclusions may be drawn up within the limitations of the work:
(1)
Scope of applicability of classical methods: Each of the four theoretical approaches provided acceptable predictions under certain conditions, but none captured the full behavior of ASPWs across all ranges of design parameters. The 10-springs method aligned well with test results for shallow dredge depths (η ≤ 0.4), while the distribution theory and finite element method performed better for η > 0.4. Rowe’s method generally predicted higher bending moments, with tie-rod forces close to experimental values at lower η. These observations highlight the value of using multiple analytical perspectives when designing ASPWs.
(2)
Design aids and limitations: The combined use of the 10-springs method and distribution theory allowed for the development of design charts and tables that can serve as preliminary tools for estimating bending moments and tie-rod forces under varied conditions. However, given the limited scale and simplifications of the experimental validation, these charts should be regarded as indicative rather than definitive. They provide initial guidance but should not substitute detailed numerical analyses or full-scale validation in critical urban projects.
(3)
Experimental validation: The laboratory tests provided useful comparative data but were necessarily simplified, employing a dry sand backfill and controlled boundary conditions. As such, the findings cannot be directly generalized to complex urban construction settings, where soil heterogeneity, groundwater conditions, construction sequences, and load variability play critical roles.
(4)
Sensitivity to key parameters: Parameters such as soil modulus, pile stiffness, anchor depth, and surcharge loading are known to significantly influence ASPW performance. While some trends were highlighted through theoretical comparisons, this study did not conduct a full sensitivity analysis. Future work should systematically explore these parameters using advanced 3D finite element modeling and probabilistic or machine learning-based approaches to better quantify uncertainty and enhance design reliability.
(5)
Measurements of anchor rod force taken 24 h after each increment of anchor yield showed an average increase of 5% in the anchor force. This pressure increase led to additional tests aimed at assessing the time-dependent rise in earth loading. Tests conducted on rigid walls revealed a significant increase in lateral earth pressure over time, which was further accelerated by minor tapping behind the retaining wall. Given the potential for time-dependent increases in earth pressure behind retaining structures, it is advisable to use a higher coefficient of lateral earth pressure than that provided by the active pressure state. Based on the limited tests conducted in this study, it appears that the lateral pressure coefficient might need to approach the at-rest pressure coefficient for design purposes. This is particularly relevant for structures tapping behind the sheet pile, which is anticipated due to traffic and other loading conditions, such as in quay walls, wharves, bridge abutments, and other earth-retaining structures. Therefore, it may be prudent to use a coefficient of lateral earth pressure that is higher than the active coefficient.

Future Research Directions

Future research should extend validation to a wider range of soil conditions, incorporate systematic sensitivity and reliability assessments, and apply modern computational methods. These efforts will enhance confidence in the applicability of simplified design tools to real-world urban excavation and waterfront projects. In addition, future research should incorporate detailed economic assessment evaluations to strengthen and broaden the applicability of the method.

Supplementary Materials

The following supporting information can be downloaded at: https://www.mdpi.com/article/10.3390/buildings15193527/s1, Figure S1: Design charts for Mmax and T when β = 0.0. Figure S2: Design charts for Mmax and T when β = 0.1. Figure S3: Design charts for Mmax and T when β = 0.2. Figure S4: Sheet-pile layout for Design Example No. 1. Figure S5: Sheet-pile layout for Design Example No. 2.

Author Contributions

Conceptualization, E.H.O.E. and T.A.A.; Methodology, T.S.A.; Software, A.H.A.Y.; Formal analysis, E.H.O.E.; Writing—original draft, E.H.O.E., T.A.A. and D.A.E.T.; Writing—review & editing, T.A.A., T.S.A. and A.H.A.Y.; Supervision, D.A.E.T. Scientific information was gathered with the assistance of all authors, and all authors participated in the manuscript’s writing, editing, revision, concept design, and study proposal. All authors have read and agreed to the published version of the manuscript.

Funding

No funding was received for this research.

Data Availability Statement

The data that support the findings of this study are available from the corresponding author upon reasonable request.

Acknowledgments

The authors wish to acknowledge Dafalla A. El Turabi, for his continuous guidance and supervision throughout this research. The authors also wish to thank the Department of Civil Engineering, the Faculty of Engineering at the University of Khartoum, the University of Tabuk, and Omdurman Islamic University.

Conflicts of Interest

The authors confirm that no conflicts of interest are associated with this work.

References

  1. Wittekoek, B.; van Eekelen, S.J.M.; Terwindt, J.; Korff, M.; van Duijnen, P.G.; Detert, O.; Bezuijen, A. Geogrid-anchored sheet pile walls; a small-scale experimental and numerical study. Geosynth. Int. 2023, 30, 561–583. [Google Scholar] [CrossRef]
  2. Gil-Hernandez, J.A.; Suaza-Cortes, J.A.; Zapata-Medina, D.G. Parametric Analysis of a Retaining System Formed by Anchored Piles in Urban Excavations. Indian Geotech. J. 2025, 55, 1328–1337. [Google Scholar] [CrossRef]
  3. Fusco, A.; Viggiani, G.M.B.; Madabhushi, G.S.P.; Conti, R.; Prüm, C. Seismic Response of Anchored Steel Sheet Pile Walls in Dry and Saturated Sand. In Proceedings of the 4th International Conference on Performance Based Design in Earthquake Geotechnical Engineering, Beijing, China, 15–17 July 2022. [Google Scholar] [CrossRef]
  4. Tan, W.; Lei, Z.; Wang, Y.; Liu, J.; Lai, P.; Mei, Y.; Liu, W.; Zhou, D. Analyzing the Impact of Deep Excavation on Retaining Structure Deformation Based on Element Tracking. Buildings 2024, 14, 3069. [Google Scholar] [CrossRef]
  5. Li, S.; Wang, F.; Le, Y.; Que, Q.; Su, Y.; Lin, H. Design and deformation pattern simulation of deep excavation support structures. Front. Earth Sci. 2024, 12, 1416957. [Google Scholar] [CrossRef]
  6. Schoen, M.; Konig, D.; Lavasan, A.A.; Wichtmann, T.; Holter, R.; Wittekoek, B.; van Eekelen, S.J.M.; van Duijnen, P.G.; Detert, O. Numerical investigation of geogrid back-anchored sheet pile walls. In Geosynthetics: Leading the Way to a Resilient Planet; CRC Press: Boca Raton, FL, USA, 2023; pp. 954–959. [Google Scholar] [CrossRef]
  7. Qu, H.; Li, R.; Zhang, J.; Hu, H.; Zhang, D. A novel approach for seismic design of anchored sheet pile wall. Teh. Vjesn.-Tech. Gaz. 2016, 23, 455–463. [Google Scholar] [CrossRef]
  8. Sarshar, N.; Derakhshani, A. Stability analysis of anchored sheet pile wall considering soil spatial variability based on fuzzy logic. Ocean Eng. 2024, 308, 118351. [Google Scholar] [CrossRef]
  9. Kannaujiya, P.; Chauhan, V.B. Behavior of Anchored Sheet Pile Wall. In Sustainable Civil Infrastructures; Springer: Cham, Switzerland, 2020; pp. 184–195. [Google Scholar] [CrossRef]
  10. Debnath, A.; Pal, S.K. A numerical analysis on anchored sheet pile wall subjected to surcharge strip loading. J. Eng. Res. 2023, 11, 62–74. [Google Scholar] [CrossRef]
  11. Verruijt, A. Sheet Pile Walls. In Computational Geomechanics; Springer: Dordrecht, The Netherlands, 1995; pp. 67–77. [Google Scholar] [CrossRef]
  12. Qu, H.-L.; Luo, H.; Hu, H.-G.; Jia, H.-Y.; Zhang, D.-Y. Dynamic response of anchored sheet pile wall under ground motion: Analytical model with experimental validation. Soil Dyn. Earthq. Eng. 2018, 115, 896–906. [Google Scholar] [CrossRef]
  13. Chen, S.; Guan, Y.; Dai, J.; Han, X. Behavior of an anchored sheet pile quay in soft clay reinforced by various structural types of cemented soil. Can. Geotech. J. 2024, 61, 1886–1901. [Google Scholar] [CrossRef]
  14. ACI Committee 318. 318-19 Building Code Requirements for Structural Concrete and Commentary; American Concrete Institute: Farmington Hills, MI, USA, 2019. [Google Scholar] [CrossRef]
  15. EN 1997-1; Eurocode 7: Geotechnical Design—Part 1: General Rules. The European Committee for Standardization: Brussels, Belgium, 2004.
  16. Rowe, P.W. Anchored sheet-pile walls. Proc. Inst. Civ. Eng. 1952, 1, 27–70. [Google Scholar] [CrossRef]
  17. Hagerty, D.J.; Nofal, M.M. Design aids: Anchored bulkheads in sand. Can. Geotech. J. 1992, 29, 789–795. [Google Scholar] [CrossRef]
  18. Bekdaş, G.; Aydın, Y.; Cakiroglu, C.; Işıkdağ, U. Leveraging Neural Networks and Explainable AI for Cost-Effective Retaining Wall Design. Comput. Model. Eng. Sci. 2025, 143, 1763–1787. [Google Scholar] [CrossRef]
  19. Zhang, L.; Wang, L. Reliability Assessment of Pile-Founded T-Walls Considering Soil Spatial Variability in the Face of Flooding Hazards. In ASCE Inspire 2023; American Society of Civil Engineers: Reston, VA, USA, 2023; pp. 388–395. [Google Scholar] [CrossRef]
  20. Hong, H.K.; Tanaka, Y.; Sahare, A.; Ueda, K. Effects of soil spatial variability on dynamic behavior of sheet-pile supported ground. J. Jpn. Soc. Civ. Eng. Ser. A1 Struct. Eng. Earthq. Eng. SE/EE 2022, 78, I_334–I_343. [Google Scholar] [CrossRef] [PubMed]
  21. Xiao, T.; Guo, N.; Yang, Z.X.; Jardine, R.J. Two-Dimensional Numerical Simulation of Displacement Pile-Wall Penetration Using a Coupled Discrete Element-Finite Difference Method. In Proceedings of the 9th International SUT Offshore Site Investigation Geotechnics Conference Proceedings “Innovative Geotechnologies for Energy Transition”, London, UK, 12–14 September 2023; Society for Underwater Technology: London, UK, 2023. [Google Scholar] [CrossRef]
  22. Agarwal, E.; Pain, A.; Sarkar, S. Probabilistic Analysis of Reinforced Soil Retaining Structures Using FORM and Surrogate-Based Monte Carlo Simulation. In Ground Improvement and Reinforced Soil Structures: Proceedings of Indian Geotechnical Conference 2020 Volume 2; Springer: Singapore, 2022; pp. 733–742. [Google Scholar] [CrossRef]
  23. Asgari, A.; Arjomand, M.A.; Bagheri, M.; Ebadi-Jamkhaneh, M.; Mostafaei, Y. Assessment of Experimental Data and Analytical Method of Helical Pile Capacity Under Tension and Compressive Loading in Dense Sand. Buildings 2025, 15, 2683. [Google Scholar] [CrossRef]
  24. Ebadi-Jamkhaneh, M.; Arjomand, M.A.; Bagheri, M.; Asgari, A.; Hefzabad, P.N.; Salahi, S.; Mostafaei, Y. Experimental Study on the Pullout Behavior of Helical Piles in Geogrid-Reinforced Dense Shahriyar Sand. Buildings 2025, 15, 2963. [Google Scholar] [CrossRef]
  25. Qu, H.L.; Li, R.; Zhang, J.J.; Hu, H.; Zhang, D. Novi pristup seizmičkom projektiranju ukotvljenog priboja. Teh. Vjesn. 2016, 23, 445–463. [Google Scholar] [CrossRef]
  26. Kulesh, D.A.; Anderson, L.H.; Wilson, B.; Otis, E.J.; Mehm, W.J.; Elgin, D.M.; Barker, M.J.; Kearney, G.P. Space shuttle flight (STS-45) of L8 myoblast cells results in the isolation of a nonfusing cell line variant. J. Cell. Biochem. 1994, 55, 530–544. [Google Scholar] [CrossRef]
  27. Terzaghi, K.; Peck, R.B.; Mesri, G. Soil Mechanics In Engineering Practice; Wiley-Interscience: Hoboken, NJ, USA, 1996. [Google Scholar]
  28. Das, B.M.; Sivakugan, N. Principles of Foundation Engineering; Cengage Learning: Boston, MA, USA, 2019. [Google Scholar]
  29. Bowles, J.E. Foundation Analysis and Design; McGraw-Hill: New York, NY, USA, 1988. [Google Scholar]
  30. Rowe, P.W. A theoretical and experimental analysis of sheet-pile walls. Proc. Inst. Civ. Eng. 1955, 4, 32–69. [Google Scholar] [CrossRef]
  31. Richart, F.E. Anchored Bulkhead Design by Numerical Method. J. Soil Mech. Found. Div. ASCE 1960, 86, 29–45. [Google Scholar]
  32. Turabi, D.A.; Balla, A. Sheet-Pile Analysis by Distribution Theory. J. Soil Mech. Found. Div. 1968, 94, 291–322. [Google Scholar] [CrossRef]
  33. Turabi, D.A.; Balla, A. Closure to “Sheet-Pile Analysis by Distribution Theory”. J. Soil Mech. Found. Div. 1970, 96, 295–297. [Google Scholar] [CrossRef]
  34. Turabi, D.A.; Balla, A. Distribution of Earth Pressure on Sheet-Pile Walls. J. Soil Mech. Found. Div. 1968, 94, 1271–1301. [Google Scholar] [CrossRef]
  35. Potts, D.M.; Fourie, A.B. Behaviour of a Propped Retaining Wall: Results of a Numerical Experiment. Géotechnique 1984, 34, 383–404. [Google Scholar] [CrossRef]
  36. Bowles, J.E. Analytical and Computer Methods in Foundation Engineering; McGraw-Hill Book Company: New York, NY, USA, 1974. [Google Scholar]
  37. Iai, S.; Kameoka, T. Finite Element Analysis of Earthquake Induced Damage to Anchored Sheet Pile Quay Walls. Soils Found. 1993, 33, 71–91. [Google Scholar] [CrossRef]
  38. Bilgin, Ö. Numerical studies of anchored sheet pile wall behavior constructed in cut and fill conditions. Comput. Geotech. 2010, 37, 399–407. [Google Scholar] [CrossRef]
  39. Karl, T. Theoretical Soil Mechanics; John Wiley & Sons, Inc.: Hoboken, NJ, USA, 2017. [Google Scholar]
  40. Coduto, D.P. Foundation Design: Principles and Practices; Pearson College Div: Victoria, BC, Canada, 2000. [Google Scholar]
  41. Tsinker, G.P. Anchored Sheet Pile Bulkheads: Design Practice. J. Geotech. Eng. 1983, 109, 1021–1038. [Google Scholar] [CrossRef]
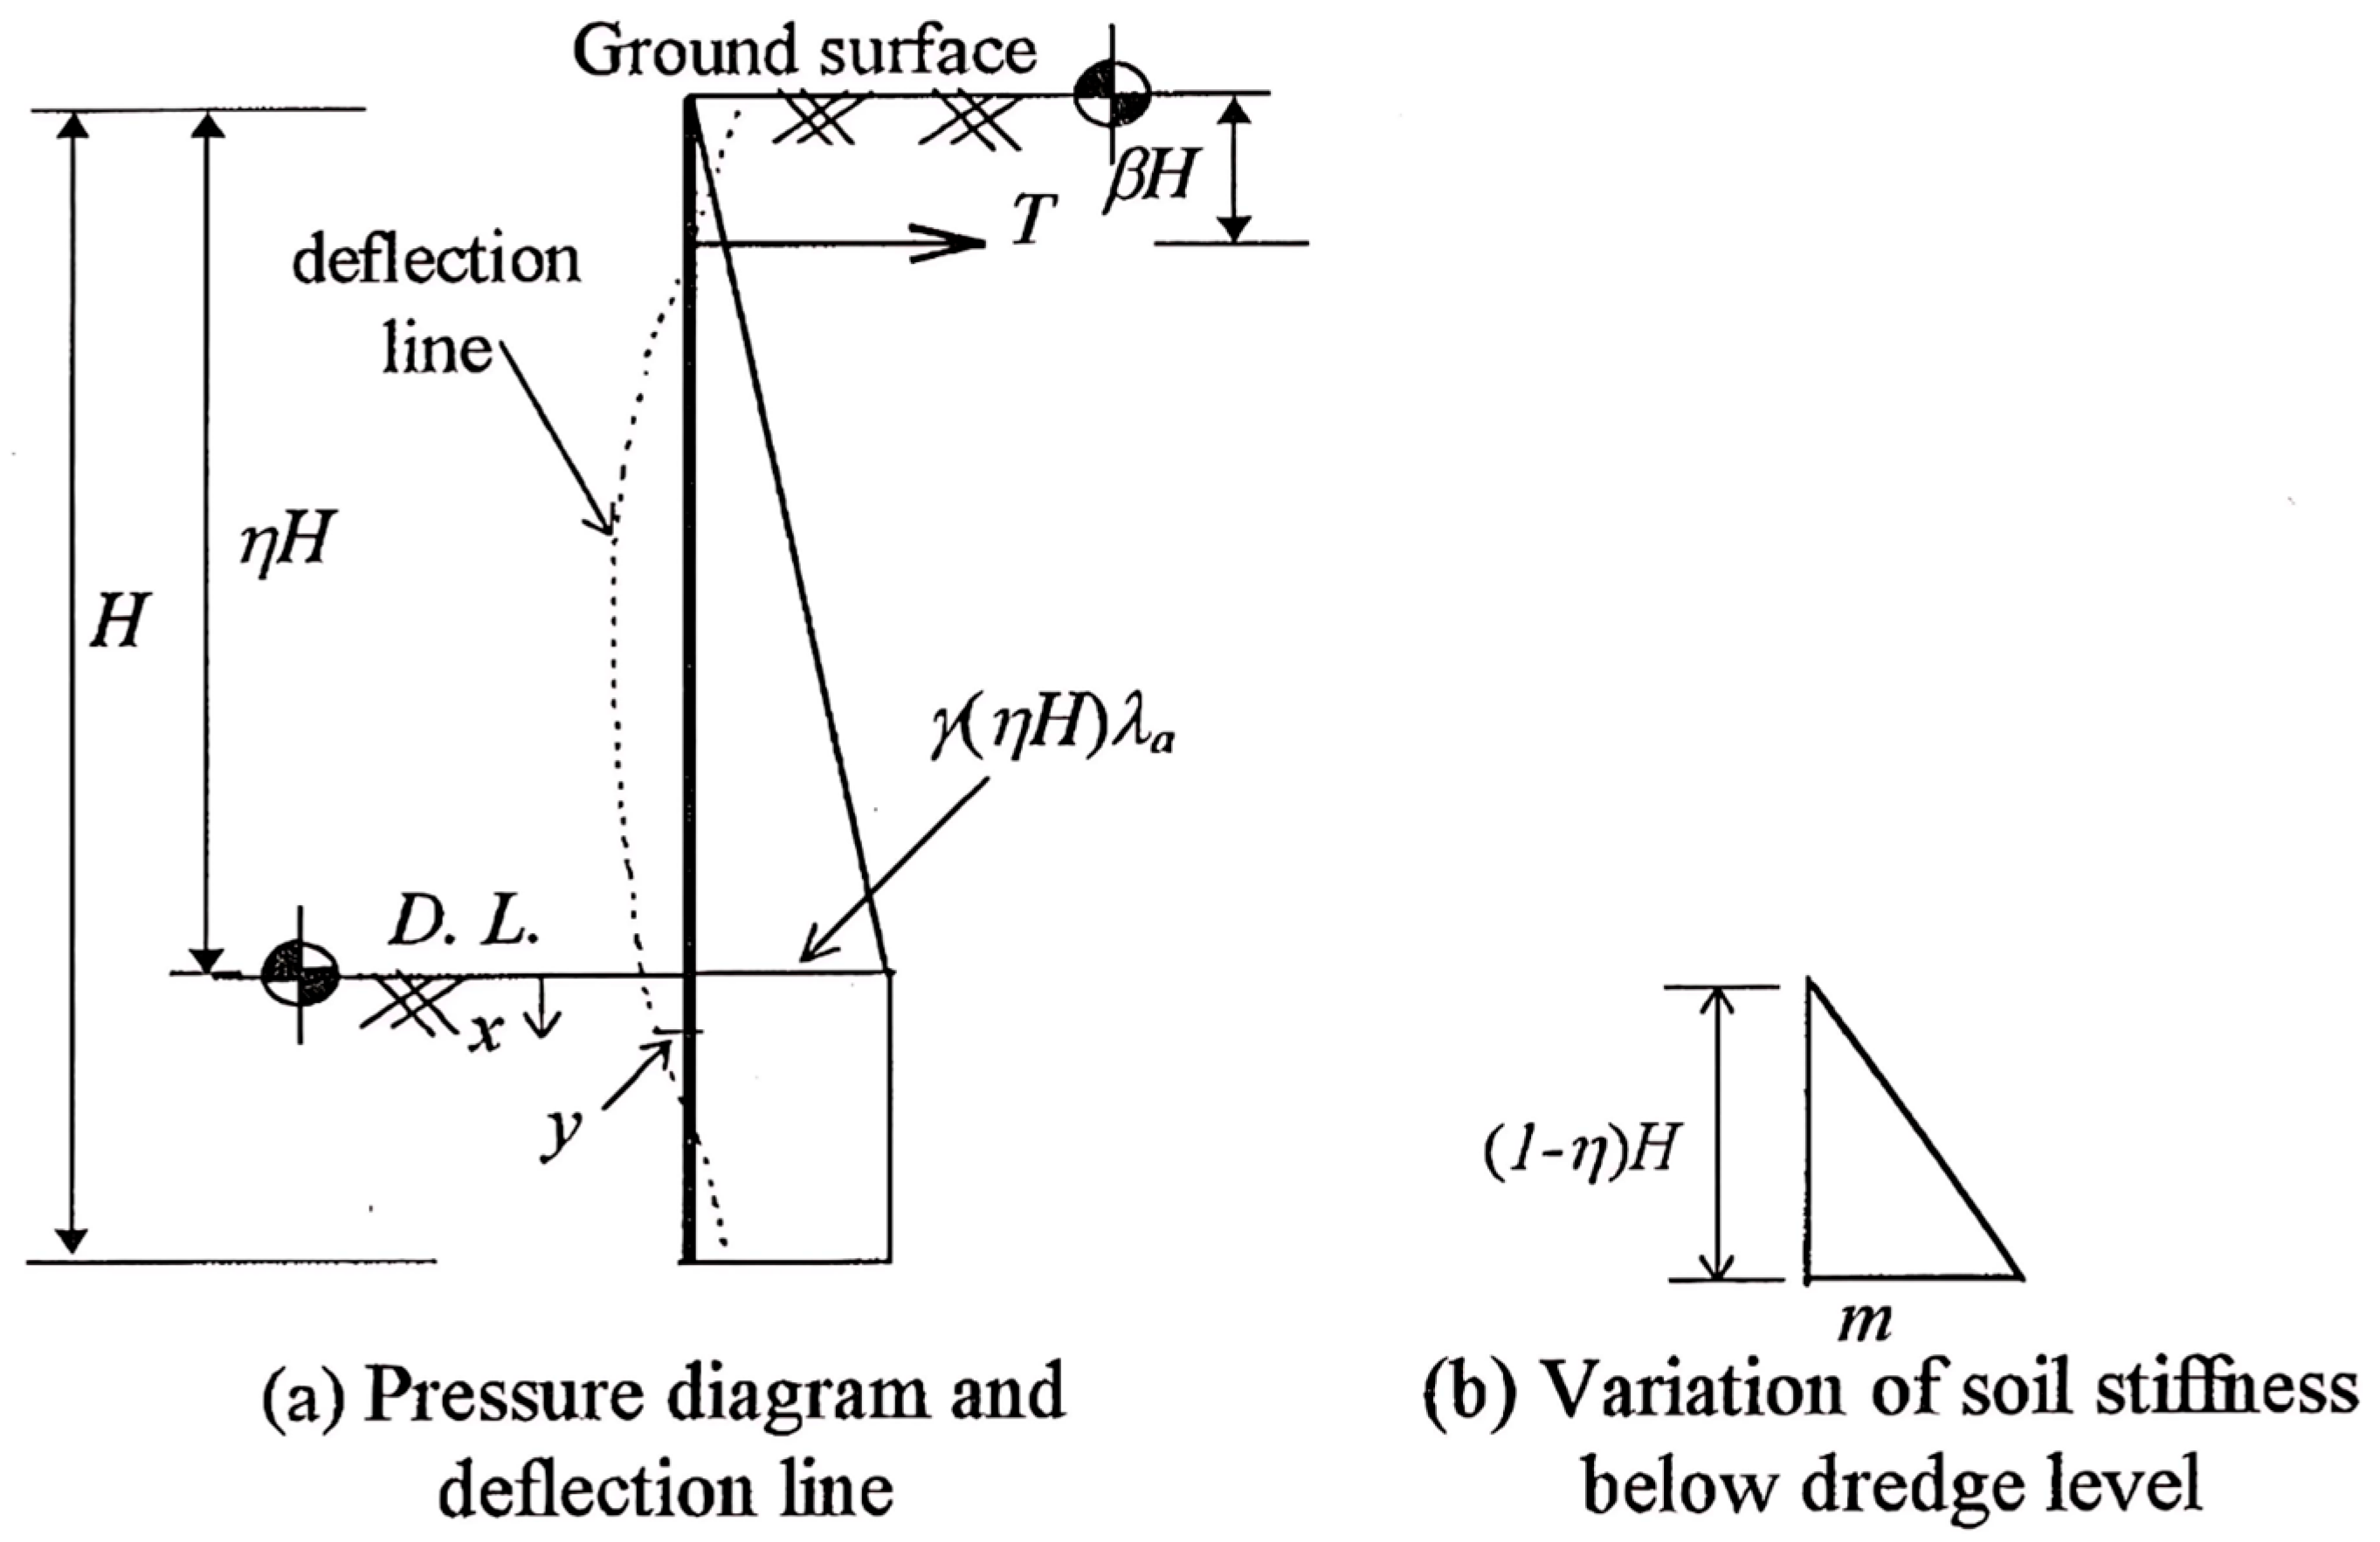
Figure 1. Arrangement for Rowe’s method of analysis [30].
Buildings 15 03527 g001
Figure 2. Arrangement for analysis according to distribution theory [32].
Buildings 15 03527 g002
Figure 3. Effect of surcharge pressure on the maximum bending moment: results of the 10-springs method and distribution theory, with η = 0.7 and β = 0.1 .
Buildings 15 03527 g003
Figure 4. Effect of surcharge pressure on the tie rod force: result of the 10-springs methods and distribution theory, where η = 0.7 and β = 0.1 .
Buildings 15 03527 g004
Figure 5. Finite element model for anchored sheet-pile wall [36].
Buildings 15 03527 g005
Figure 6. Determination of modulus of subgrade reaction. (a) Secant modulus, (b) Tangent modulus [29].
Buildings 15 03527 g006
Figure 7. General arrangement of the testing apparatus.
Buildings 15 03527 g007
Figure 8. Test results of tie-rod force: effect of anchor yield when η = 0.7.
Buildings 15 03527 g008
Figure 9. The test result of the tie-rod force: effect of anchor yield when η = 0.8.
Buildings 15 03527 g009
Figure 10. Comparison between test results and theoretical solutions: η = 0.7.
Buildings 15 03527 g010
Figure 11. Results of a maximum bending moment from the 10-springs and the distribution theory: β = 0.0 .
Buildings 15 03527 g011
Figure 12. Results of the tie-rod force from the 10-springs method and distribution theory: β = 0.0 .
Buildings 15 03527 g012
Figure 13. Method of extrapolating between the 10-springs method and distribution theory; value of the maximum bending moment.
Buildings 15 03527 g013
Figure 14. Method of extrapolating between the 10-springs method and distribution theory; values of the tie-rod force.
Buildings 15 03527 g014
Table 1. Range of values of modulus of subgrade reaction ms [29].
Type of Soilms (kN/m3)
Loose sand4800–16,000
Medium-dense sand9600–80,000
Dense sand64,000–128,000
Clayey medium-dense sand32,000–80,000
Silty medium-dense sand24,000–48,000
Clayey soil: qu ≤ 200 kN/m212,000–24,000
200 < qu ≤ 400 kN/m224,000–48,000
qu > 800 kN/m2>48,000
Table 2. Ratios of theoretical values to the experimental values of maximum bending moment and tie-rod force for varying ƞ of the sheet-pile test model, with constant β = 0.07.
ƞForce10-Springs MethodDistribution TheoryFEMRowe’s MethodClassical Methods
0.3Max. positive B.M. 1.000.630.801.401.47
tie-rod force1.200.670.711.041.19
0.4Max. positive B.M. 0.920.730.821.362.00
tie-rod force0.850.680.710.921.27
0.5Max. positive B.M. 0.600.930.951.302.56
tie-rod force0.560.680.690.851.30
0.6Max. positive B.M. 0.320.960.931.312.67
tie-rod force0.390.690.680.821.28
0.7Max. positive B.M. 0.161.000.921.252.29
tie-rod force0.280.690.660.791.19
0.75Max. positive B.M. 0.131.111.001.302.68
tie-rod force0.240.690.650.761.27
0.8Max. positive B.M. 0.121.231.101.385.57
tie-rod force0.210.740.680.791.47
Table 3. Values of ζM.
η = 0.6η = 0.7η = 0.8
α10−210−310−410−510−210−310−410−510−210−310−410−5
β = 0.00.0260.0240.0160.0120.0310.0290.0220.0170.0350.0350.0310.021
β = 0.10.0180.0160.0120.0090.0230.0220.0170.0120.0270.0270.0230.017
β = 0.20.0100.0090.0050.0040.0140.0130.0100.0070.0190.0180.0160.011
Table 4. Values of ζT.
η = 0.6η = 0.7η = 0.8
α10−210−310−410−510−210−310−410−510−210−310−410−5
β = 0.00.1320.1250.1050.0920.1440.1410.1230.1050.1540.1530.1440.121
β = 0.10.1490.1440.1280.1160.1626.1590.1450.1290.1720.1720.1640.144
β = 0.20.1710.1680.1580.1510.1840.1830.1730.1620.1950.1950.1890.175
Disclaimer/Publisher’s Note: The statements, opinions and data contained in all publications are solely those of the individual author(s) and contributor(s) and not of MDPI and/or the editor(s). MDPI and/or the editor(s) disclaim responsibility for any injury to people or property resulting from any ideas, methods, instructions or products referred to in the content.