Article

One Hundred Years of V(λ): Predicting Spatial Brightness Using Vertical Illuminance Derived from Photopic Luminous Efficiency Functions

Department of Architectural Engineering, Pennsylvania State University, State College, PA 16802, USA
*
Authors to whom correspondence should be addressed.
Buildings 2025, 15(19), 3510; https://doi.org/10.3390/buildings15193510
Submission received: 13 August 2025 / Revised: 14 September 2025 / Accepted: 21 September 2025 / Published: 28 September 2025
(This article belongs to the Special Issue Lighting in Buildings—2nd Edition)

Abstract

Many years later, as it faced the firing squad, the photopic luminous efficiency function was to remember that distant afternoon when its fathers developed it to quantify light. Drawing parallels from Gabriel García Márquez’s complex and multi-layered novel, this article details the cyclical nature of a recurring topic and the repetition of events across generations. About 100 years ago, the CIE 2° standard observer (V(λ)) was developed to enable a reliable, reproducible photometric system. V(λ)-derived photometric units (e.g., illuminance) were envisioned to predict a generic “visibility” response, but today they are widely used to quantify one of the most fundamental responses to light: brightness. Despite its limitations and several proposed alternatives, the lighting industry still uses V(λ) to calculate photometric measures. This study examines the predictive capacity of V(λ) and its three alternatives (CIE V10(λ), VF(λ), VF,10(λ)) across three CCTs (2700 K, 4000 K, 6000 K) and three illuminance (50 lx, 100 lx, 300 lx) levels in predicting spatial brightness. Alternatives outperformed V(λ) under 2700 K and 50 lx, but overall photopic luminous efficiency functions (including V(λ)) could not predict spatial brightness consistently. Future studies should investigate the performance of specialized spatial brightness metrics.

1. Introduction

Lighting is a key part of indoor environmental quality and a source of energy consumption in the built environment. Electric lighting enables occupants to perform tasks, while providing safety and visual comfort. Lighting standards and recommendations, such as the European Committee for Standardization (CEN) European Standards (EN), and the American National Standards Institute and Illuminating Engineering Society (ANSI/IES) Recommended Practices (RPs), require quantitative and repeatable measures to ensure adequate lighting is provided in different applications. Therefore, quantifying the amount of light (visible optical radiation) is critical for illumination engineering, and it requires weighting the radiometric quantity of electromagnetic radiation with a human visual sensitivity function (i.e., converting radiometric quantities to photometric quantities) [1]. The human visual spectral sensitivity to light is modeled by the Commission International de l’Éclairage (CIE) photopic luminous efficiency function (V(λ), also known as the CIE 2° standard observer), representing the “average human observer” [2].
The CIE photopic luminous efficiency function V(λ) was developed based on data from psychophysical studies conducted in the late 1910s and early 1920s [3,4,5,6]. Since its conception, several studies have suggested that the CIE standard observer may be conditional and limited due to the experimental protocols used to collect the data, such as small field of view (FOV), low luminance levels, and variation in tasks participants completed [7,8,9,10,11], which propelled researchers to propose new models for human visual response to visibility [12,13,14]. The newer versions utilize a wider FOV (i.e., CIE 10° observer (V10(λ)), or retinal physiology rather than psychophysics (e.g., physiological axes of a 2° FOV VF(λ) and 10° FOV VF,10(λ), also known as cone fundamentals [14]). Although the discrepancies between the alternatives and the CIE standard observer have been reported and the implications have been discussed [7,9,15,16,17], the lighting industry still utilizes the CIE standard observer to calculate photometric quantities.
A century after its introduction, the adequacy of the CIE current standard observer is still questioned. Besides the aforementioned color and vision research studies, architectural lighting research studies highlighted the inadequacy of using V(λ)-derived photometric measures (horizontal illuminance) in predicting brightness perception [18]. While V(λ)-derived photometric measures may have never intended to predict brightness per se, its wide (mis)use indicates a need to quantify, arguably, one of the most important characteristics of the human visual system: brightness perception. To that extent, a term called spatial brightness (also called scene or room brightness) has gained attention among researchers. Spatial brightness represents the overall brightness of a visual scene instead of a stimulus of a small visual angle (e.g., an object or limited view) [19]. Despite the limitations, V(λ)-derived photometric measures (i.e., luminance [20,21,22,23] and vertical illuminance [24]) have been linked to spatial brightness in the past. This study investigates the accuracy of the current standard observer V(λ) and three alternative photopic luminous efficiency functions in predicting spatial brightness.

2. Background

2.1. Photopic Luminous Efficiency Functions

In 1924, the CIE published the photopic luminous efficiency function V(λ) by combining and smoothing data derived from experiments using 2° stimuli, serving as a relative visibility function for an average observer [12]. Therefore, V(λ) is inherently a synthetic function derived from a series of independent experiments involving the determination of luminous efficiencies for monochromatic stimuli. These experiments encompassed various methodologies, such as minimum flicker, step-by-step comparisons, and direct brightness matching. In the minimum flicker method, two geometrically similar light patches rapidly alternate on the same retinal area, and observers are asked to adjust the light until flicker is minimized. The matching method involves a white stimulus as a reference, and the reciprocal of the radiance needed for minimum flicker is plotted against the wavelength of the test stimulus, commonly normalized to unity at its maximum value. The method of direct brightness matching, also known as direct heterochromatic brightness matching, involves using two light patches with different chromatic appearances. In this method, the reference patch (stimulus) is monochromatic, set at a fixed wavelength, and covers half of the visual field. Participants adjust the amount of the test stimulus until it is perceived as having equal brightness to the reference stimulus (also known as adjustment or matching procedure [25]). However, it is essential for the observer to mentally isolate brightness from color in the appearance of the two stimuli, considering potential differences in hue and saturation. The step-by-step brightness method is a specific instance of heterochromatic brightness matching where both the reference and test stimuli are monochromatic, and the color difference between them is minimal.
Several researchers raised questions about the accuracy of the standard observer V(λ) in the past. Judd argued that the standard observer underestimated sensitivity in short wavelengths [7], while Vos recalculated Judd’s work and concluded that Judd overestimated the human sensitivity to short wavelength energy, while still noting the inaccuracy of the standard observer [9]. In 1964, the CIE published a luminous efficiency function for 10° FOV (V10(λ)), acknowledging the limitations of the previously established CIE 2° standard observer [26]. Meanwhile, other researchers proposed alternatives based on their experimental data [27,28,29,30]. More recently, Sharpe and colleagues developed 2° and 10° luminous efficiency functions based on cone fundamentals [11,14,15], which were later adopted by the CIE with the notations VF(λ) and VF,10(λ).
While there have been several variations of the photopic luminous efficiency function, most of these versions aim to predict “visibility” or “luminosity” rather than out-and-out “brightness.” A notable exception is CIE’s 1978 luminous efficiency function for brightness Vb(λ) utilizing the heterochromatic brightness matching method [31]. However, the non-additivity of heterochromatic brightness matching [32,33,34] has limited the usefulness of Vb(λ). The failure to meet Abney’s law of additivity [35,36] (or Grassmann’s fourth law [37,38]) poses a serious question for the development of a luminous efficiency function to quantify brightness perception. Despite studies proposing solutions for additivity failure [39,40,41,42], a luminous efficiency function for brightness has not gained widespread acceptance. The lack of a robust brightness function might indicate the need for complex non-linear models, or the underlying fundamental problem of non-additivity for brightness perception.

2.2. Spatial Brightness

The term spatial brightness first appeared in the literature in 1968 [43], but later took off as an alternative to differentiate traditional brightness (often a small visual angle) from scene brightness (a large visual angle) [44,45]. More specifically, it has been defined as the “visual sensation to the magnitude of the ambient lighting within an environment, such as a room or lighted street [25,44].” According to this definition, spatial brightness does not necessarily relate to the brightness of any individual objects or surfaces in the environment but may be influenced by the brightness of these individual items.
Despite growing efforts, modeling spatial brightness has been challenging. Harrington found that a white light with higher correlated color temperature (CCT) (i.e., 6260 K) was perceived as brighter compared to a slightly lower CCT source (i.e., 5380 K) at similar illuminance [46]. Subsequent discoveries reported lighting conditions of the same luminance but differing colorimetric purity was perceived as different in brightness, unveiling a non-linear correlation between colorimetric purity and brightness perception [47]. Berman and his colleagues performed brightness perception experiments under different photopic luminance levels and concluded that brightness judgements cannot consistently be predicted by photopic luminance [48].
The recent discovery of melanopsin, a photopigment sensitive to short wavelength energy in the retina, has opened new venues for lighting research. Melanopsin has slower temporal response and negligible spatial resolution compared to cone cells [49]. Before the discovery of melanopsin, rod cells were hypothesized to contribute to spatial brightness [50,51]. However, given that melanopsin-expressing intrinsically photosensitive retinal ganglion cell (ipRGC) sensitivity peaks around 480 nm [52] (close to the peak spectral sensitivity of rod cells at 497.6 ± 3.3 nm [53]), it is more reasonable to assume that the effect of the light spectrum on brightness is affected by melanopsin [54]. Recent physiological studies support the hypothesis that melanopsin may be contributing to brightness perception [55,56,57,58,59,60,61]. Others also argued that rod cells can contribute to visual responses above scotopic lighting conditions [62,63,64], despite the widely held assumption that rods are saturated in photopic light levels. In addition to the spectrum, Royer and Houser investigated the effect of age on spatial brightness while maintaining CCT and illuminance, and demonstrated that age can impact the perceived brightness of stimuli with peak wavelengths shorter than 450 nm [65]. They also found that the brightness of lighting conditions at the same CCT and illuminance can differ.
In summary, the literature review encompasses two distinct areas of investigation: the accuracy of the photopic luminous efficiency function and the perception of spatial brightness. The former has been the subject of extensive research starting from the inception of V(λ), often employing highly specialized experimental apparatus and measurements confined to a narrow field of view (typically 2°). In contrast, studies of spatial brightness emphasize the perception of brightness in rooms or larger spaces rather than in restricted visual fields. Given that the present study examines spatial brightness as the dependent variable, a summary of the experimental protocols employed in prior spatial brightness research is presented in Table 1. The summary clearly indicates the lack of testing the performance of alterative photopic luminous efficiency function (see the column “V(λ) compared”). The only study that tested the accuracy of V(λ) ([46]) was conducted in 1950s before the CIE introduced alternatives and used a rather smaller FOV (15° × 20°). In addition, most studies did not provide participants with a training session to overcome learning effects, or rarely controlled CCT and illuminance at the same time (see the columns “CCT Matched” and “Ev Matched”).
The literature clearly reveals the necessity of investigating the performance of V(λ)-derived photometric measures in predicting spatial brightness perception. While the standard observer was not necessarily developed to predict brightness, many practitioners and researchers think that photometric measures should and naturally will, predict brightness. While spatial brightness is a relatively new, but a more relevant, concept for architectural lighting, there is a reason to believe that using simple and well-established photometric measures to predict spatial brightness can assist lighting practice (à la Occam’s razor). Testing this hypothesis would also add scientific value to the literature. Therefore, this study aims to systematically investigate the performance of the standard and alternative luminous efficiency functions through two research questions: (1) Does V(λ)-derived vertical illuminance predict spatial brightness? (2) Do alternative luminous efficiency functions help vertical illuminance predict brightness more accurately?

3. Methods

A within-subjects experiment was conducted to test the accuracy of the current CIE standard observer and three CIE-approved alternatives (V10(λ), VF(λ), VF,10(λ)) in predicting spatial brightness. Ethical approval was obtained from the Pennsylvania State University Institutional Review Board (IRB) to conduct this study (STUDY00017315).

3.1. Apparatus

The experiment was conducted in a 3.66 m × 3.05 m (12 ft × 10 ft) bay in the lab that has recessed multi-channel tunable LED lighting systems (LEDCube by Thouslite, Changzhou, China) in a 0.61 m × 0.61 m (2 ft × 2 ft) ceiling grid. The LEDCube in the middle of the ceiling had 11 LED channels and was not used in this study, while the other three LEDCubes with 15 LED channels were utilized to generate the stimuli, as shown in Figure 1a and Figure 2. The walls were painted with Munsell N8 neutral grey paint, and were not textured, which reduced their influence on brightness perception [78]. Figure 1 shows the layout of the light sources in the ceiling plan and participants’ distance from the wall (2.13 m or 7 ft).
Participants placed their head on a chinrest to stabilize their visual field and reduce the effects of attention or head movement [79,80]. Participants’ eye-sight level was maintained at 1.22 m (4 ft) off the floor by using a height-adjustable chair, as shown in Figure 2. The maintained height enabled removing the direct sight of light sources from participants’ FOV during the experiment to prevent the negative impact of glare [81]. Participants made their choices using a wireless number pad placed on the wooden semi-table.

3.2. Stimuli

Vertical illuminance at eye-sight level was used as an indicator to predict spatial brightness. Photometric values were calculated by integrating radiometric values with luminous efficiency functions:
E v , x = K m 380 780 E e λ V x λ d λ ,
where Ev,x is the vertical illuminance (unit: lx), Ee(λ) is irradiance (unit: W/m2/nm) entering the eye measured using a calibrated spectroradiometer, Vx(λ) represent different versions of spectral luminous efficiency functions (i.e., V(λ), V10(λ), VF(λ), VF,10(λ)), and Km is a constant (683 lm/W) and defines the maximum spectral luminous efficacy of radiation for photopic vision.
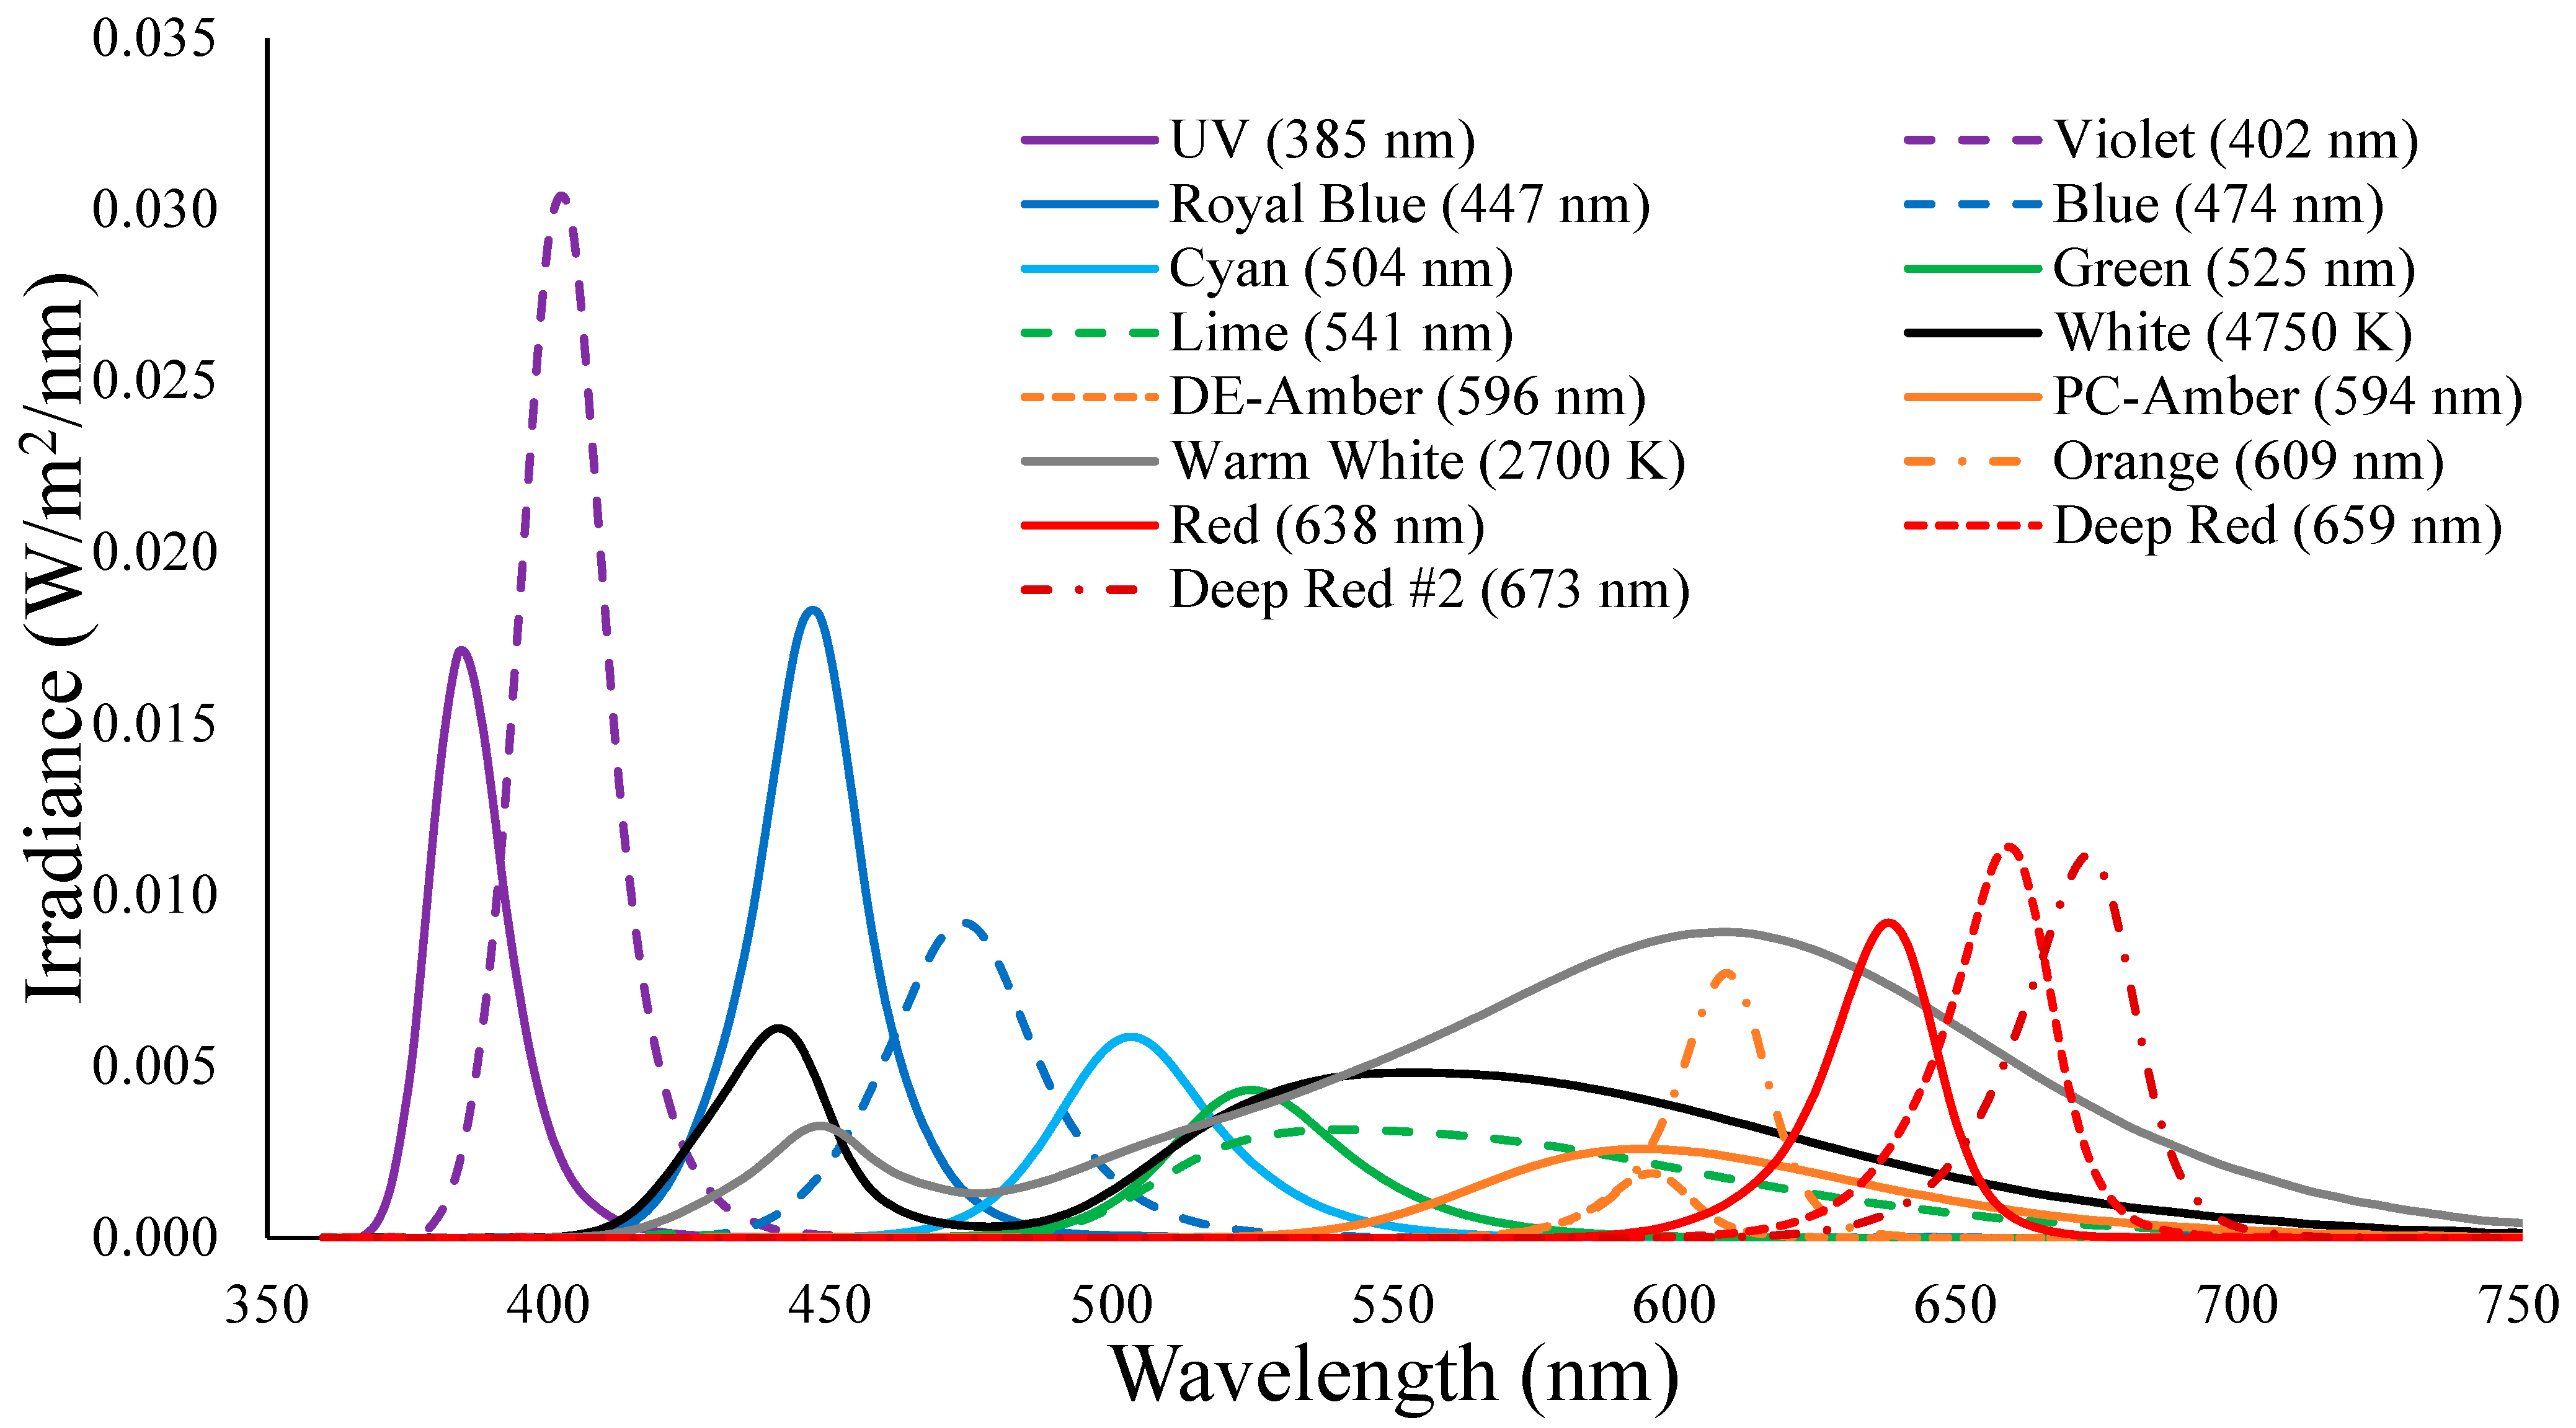
Figure 3 shows the spectral power distributions (SPDs) of the 15 channels of the tunable LED lighting system that were used to generate the stimuli. The CCT, CIE 1976 (u′,v′) chromaticity coordinates, and irradiance were measured using a calibrated spectroradiometer BTS256-EF (Gigahertz-Optik®, Amesbury, MA, USA). Each individual LED channel was controlled remotely by MATLAB® R2022b and were dimmable between 0 and 100% at 0.1 steps. The experimental lighting conditions consisted of three nominal CCTs (2700 K, 4000 K, 6000 K) at three vertical illuminance levels (50 lx, 100 lx, 300 lx), resulting in nine combinations in total. The CCTs and illuminance levels were selected to reflect a range of lighting conditions commonly encountered in daily life (e.g., residential spaces, offices) and lighting standards (e.g., IES RPs [82,83]). However, the maximum illuminance level was limited by the luminous flux output of the tunable LED lighting system.
To determine whether the vertical illuminance derived from luminous efficiency functions (V(λ), V10(λ), VF(λ), VF,10(λ)) can predict spatial brightness, a pair of lighting conditions (scenes) were generated for each combination. Scenes in each pair were generated to be close in terms of color appearance (chromaticity) and vertical illuminance calculated by V(λ). The chromaticity distance from the Planckian locus was quantified using Duv [84] to account for the limitations of CCT [85]. While each scene in a pair has the same vertical illuminance (Ev ± 0.5 lx) and chromaticity (CCT ± 20 K, Duv ± 0.0005), the vertical illuminances calculated by alternative luminous efficiency function were different (>2 lx).
The illuminance difference (Egap) denotes the difference between illuminance derived by the standard observer and alternative luminous efficiency functions. The illuminance difference Egap between Ev and Ev,alternative (based on V10(λ), VF(λ), or VF,10(λ)) for each scene was calculated as follows:
E g a p = | E v   E v , F | = | K m 380 780 E e λ V λ d λ   K m 380 780 E e λ V F λ d λ | ,
and the illuminance difference between the scenes in a pair ΔEgap according to the alternative luminous efficiency functions were calculated as follows:
E g a p = | E g a p , s c e n e A   E g a p , s c e n e B |
The goal in stimuli generation was to maximize the illuminance difference ΔEgap in each scene using the optimization algorithm in Microsoft® Excel Solver. Table 2 shows the stimuli for 4000 K and VF(λ) as an example. There are three pairs, and each pair has a different scene A and scene B, and therefore different Egap. For example, Egap was 7.07 lx for Pair 2 scene A (107.06 lx–99.99 lx), while it was 4.37 lx for Pair 2 scene B (104.31 lx–99.94 lx). The illuminances calculated from alternative luminous efficiency functions (Ev,10, Ev,F, Ev,F,10) tend to be higher than the standard illuminance (Ev) since the standard observer underestimates the short wavelength sensitivity of human vision. In addition, Egap values were higher when the V(λ)-derived illuminance Ev was compared to illuminance derived by the 10° observers V10(λ) with VF,10(λ). For example, the mean Egap in the V10(λ) and VF,10(λ) comparisons were 11.4 lx and 13.5 lx, respectively, compared to the mean Egap in VF(λ) comparisons, which was 8.4 lx.
In addition to the pairs of different lighting conditions, a null condition in each CCT was generated where scenes A and B were identical to account for order bias [86]. As a result, there was a total of 30 pairs (including 3 pairs of null conditions) in the experiment. The lighting conditions grouped into sections by CCT are summarized below.
Section 1: 2700 K
  • Three pairs of V10(λ) vs. V(λ): Pair 1 at 50 lx, Pair 2 at 100 lx, Pair 3 at 300 lx.
  • Three pairs of VF(λ) vs. V(λ): Pair 1 at 50 lx, Pair 2 at 100 lx, Pair 3 at 300 lx.
  • Three pairs of VF,10(λ) vs. V(λ): Pair 1 at 50 lx, Pair 2 at 100 lx, Pair 3 at 300 lx.
  • One pair of null conditions.
Section 2: 4000 K
  • Three pairs of V10(λ) vs. V(λ): Pair 1 at 50 lx, Pair 2 at 100 lx, Pair 3 at 300 lx.
  • Three pairs of VF(λ) vs. V(λ): Pair 1 at 50 lx, Pair 2 at 100 lx, Pair 3 at 300 lx.
  • Three pairs of VF,10(λ) vs. V(λ): Pair 1 at 50 lx, Pair 2 at 100 lx, Pair 3 at 300 lx.
  • One pair of null conditions.
Section 3: 6000 K
  • Three pairs of V10(λ) vs. V(λ): Pair 1 at 50 lx, Pair 2 at 100 lx, Pair 3 at 300 lx.
  • Three pairs of VF(λ) vs. V(λ): Pair 1 at 50 lx, Pair 2 at 100 lx, Pair 3 at 300 lx.
  • Three pairs of VF,10(λ) vs. V(λ): Pair 1 at 50 lx, Pair 2 at 100 lx, Pair 3 at 300 lx.
  • One pair of null conditions.

3.3. Participants

A power analysis completed using G-power software (release 3.1.9.6) [87] indicated a sample size of 42 participants (24 male and 18 female), which is in line with previous spatial brightness studies (see Table 1). Most of the participants were students, and their ages ranged from 19 to 56 with a median of 25.6. Three different iris colors were recorded, but they were mostly dark (26 black, 14 brown, and only 2 blue). All participants passed the Ishihara color vision test. All the experiments were conducted in the afternoon to account for variations in visual field size [88].

3.4. Experimental Protocol

The experiment lasted approximately 40 min in total and was divided into three sections with breaks between sessions to reduce visual fatigue [89]. Each section contained stimuli of only one CCT to prevent the disruption of full chromatic adaptation. Within each section, 10 pairs of light scenes (as detailed in 3.2 Stimuli) were presented, with each pair repeated six times. The presentation sequence of 60 pairs was randomized for every participant. In each pair, scene A and scene B were shown sequentially [90], and the order of the first and second condition was counterbalanced to address order bias [86].
Upon arrival, participants gave verbal consent and completed a demographic survey. Subsequently, the Ishihara color vision test and Keystone visual skills test were administered. Following the vision test, participants were instructed to take a seat on a height-adjustable chair as depicted in Figure 2. Participants were instructed to adjust the seat height until they felt comfortable in the head chinrest. Meanwhile, subjects were briefed about the experimental sessions and breaks. After addressing any questions, the experiment proceeded with the presentation of three sessions, with breaks in between. Each pair lasted 1 s followed by a 1 s dark transition between them to reduce confusion [91], which was followed by a 3 s blackout to reduce afterimages, as shown in Figure 4.
A sequential two-alternative forced choice (2AFC) method (also known as two-interval forced choice) was used to collect participants’ brightness perception responses. After viewing lighting scene 2, participants were prompted to make a judgment using a number pad. Participants pressed 1 to answer that they perceived scene 1 to be brighter, and vice versa. Participants were asked to make a choice between the two options even if they were unsure (per 2AFC protocol).

3.5. Statistical Methods

A QQ plot was employed to verify the normal distribution of the mean differences among the results obtained from various luminous efficiency functions. The assumption of homoscedasticity was tested and found not to be violated. This indicates that the variance of the residuals is approximately constant across all levels of the independent variables. The experiment had three comparison groups: V(λ) vs. V10(λ), V(λ) vs. VF(λ), and V(λ) vs. VF,10(λ). The null hypothesis Ho asserts that there is no significant difference among spatial brightness responses under illuminance conditions derived from the standard observer or alternative luminous efficiency functions. One-way ANOVA was performed since there was only one independent variable (alternative luminous efficiency functions) within the three groups. The level of significance was set to 0.05. Student’s t-test was additionally employed to assess the results of each group derived from various versions of luminous efficiency functions. Finally, the visual inspection of the residuals plot revealed a random scatter pattern around zero, supporting the assumption of homogeneity of variances. Consequently, the assumption of homoscedasticity was not violated, providing assurance of the robustness of the ANOVA results.

4. Results

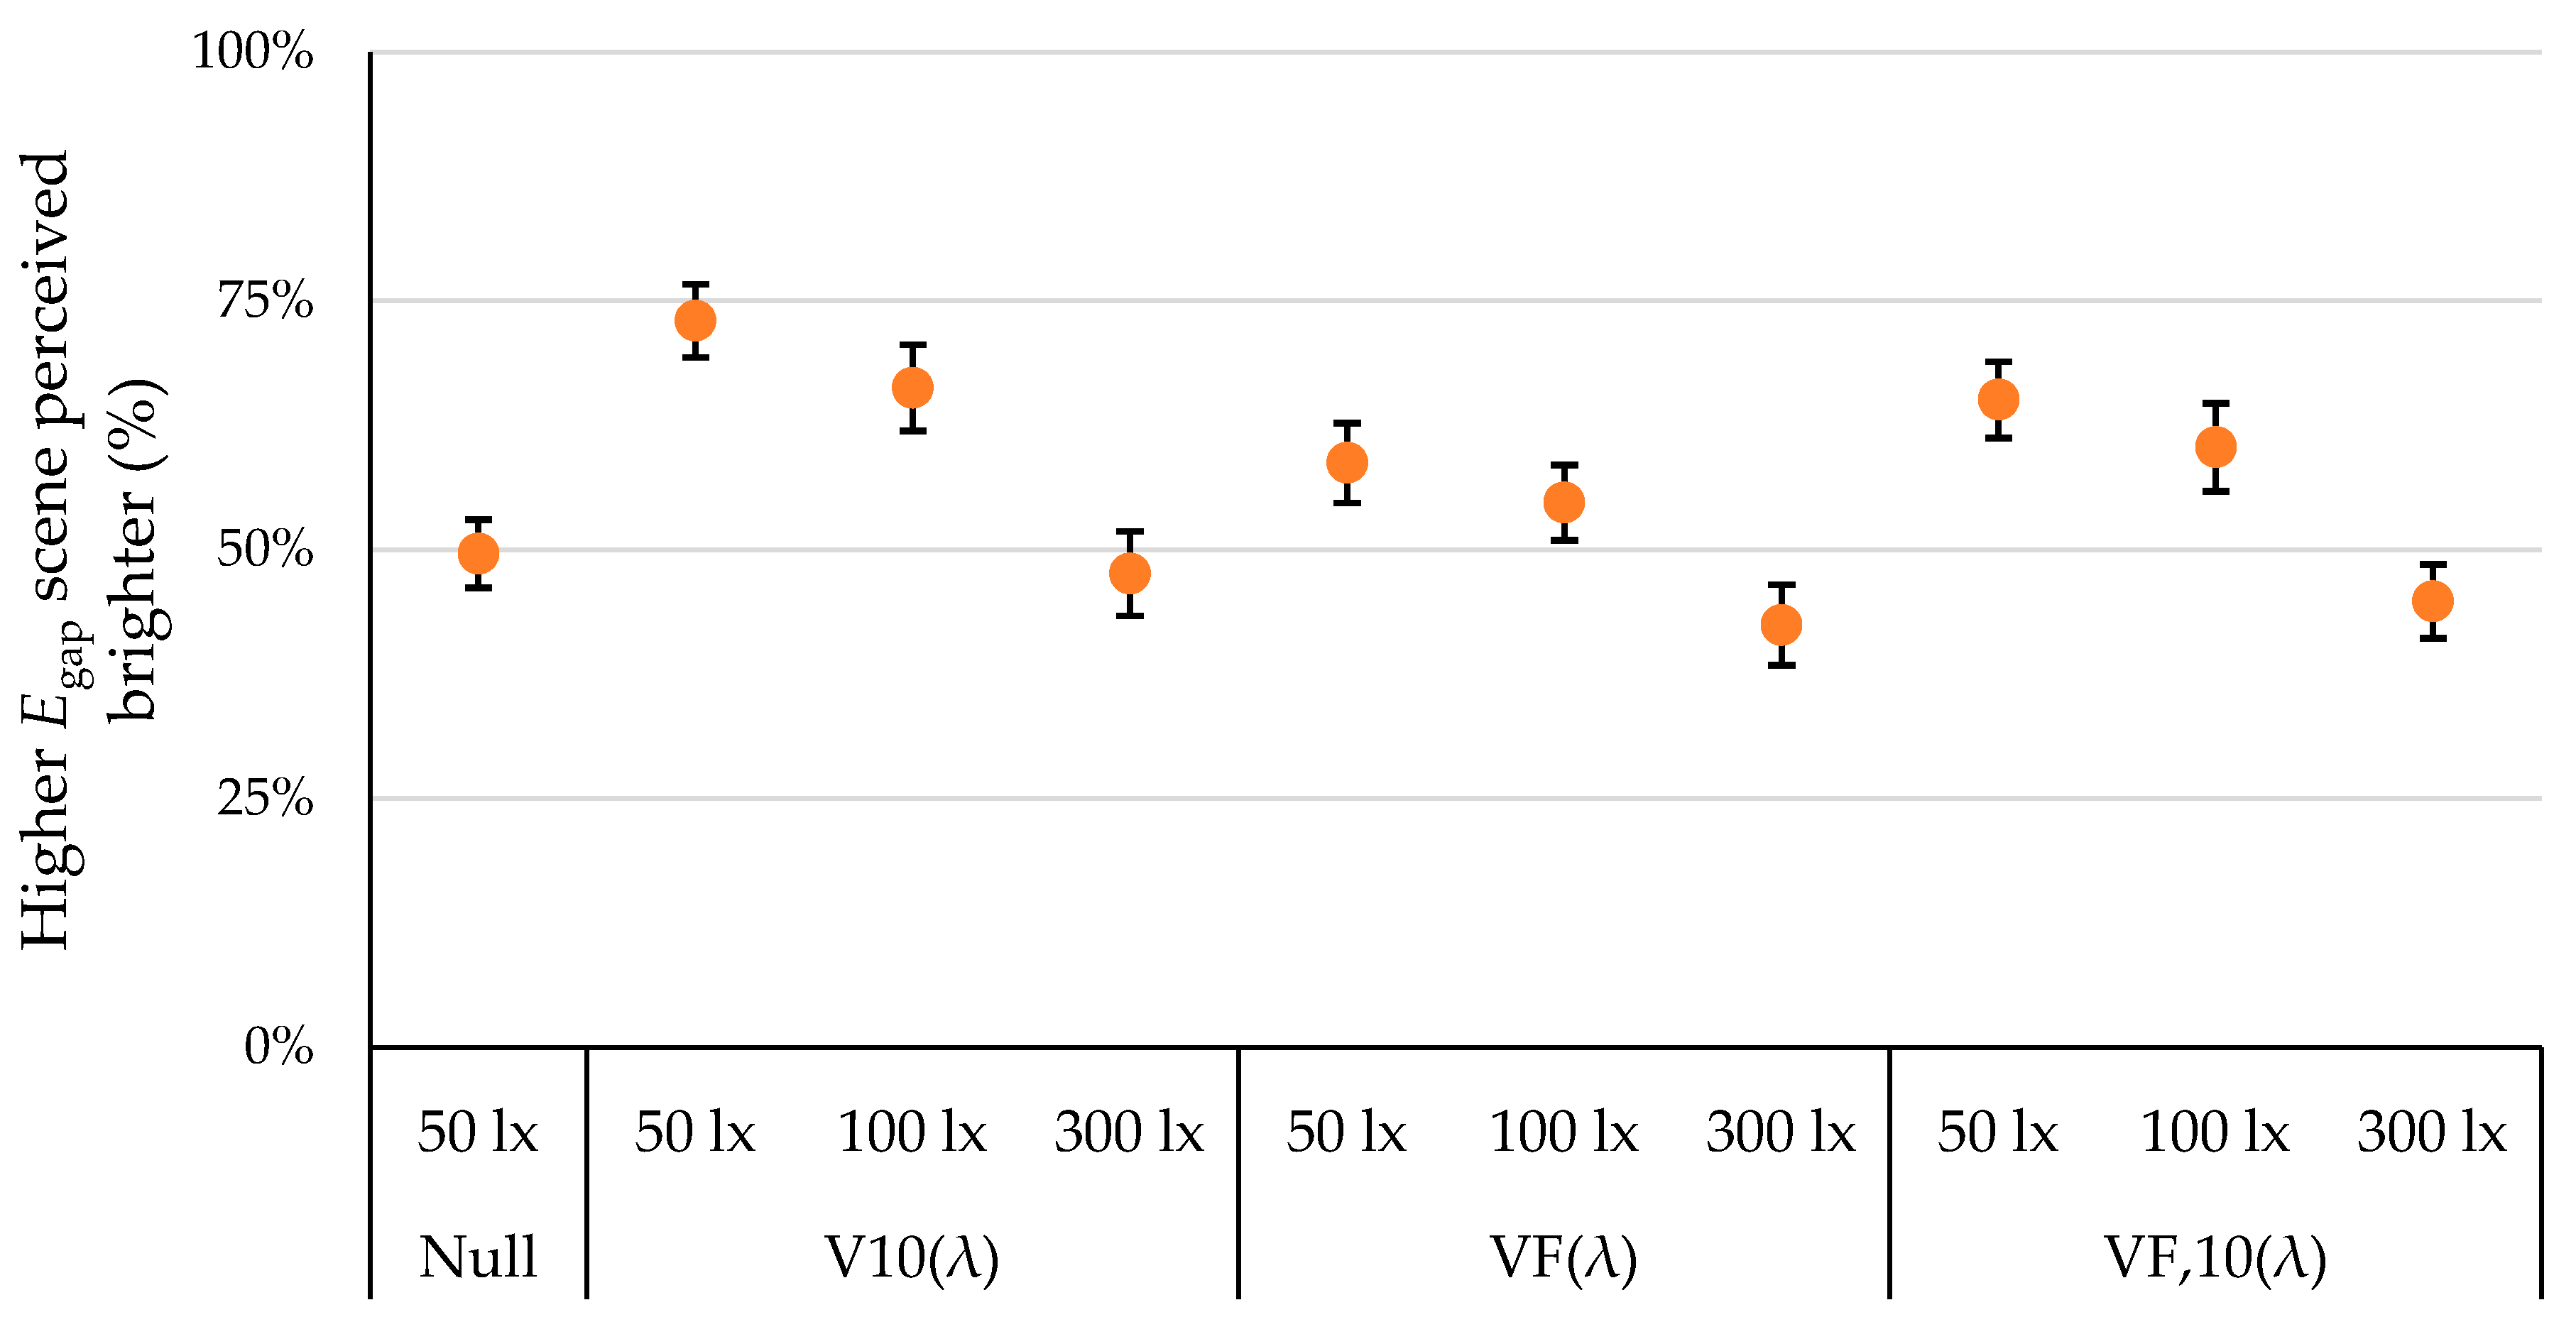
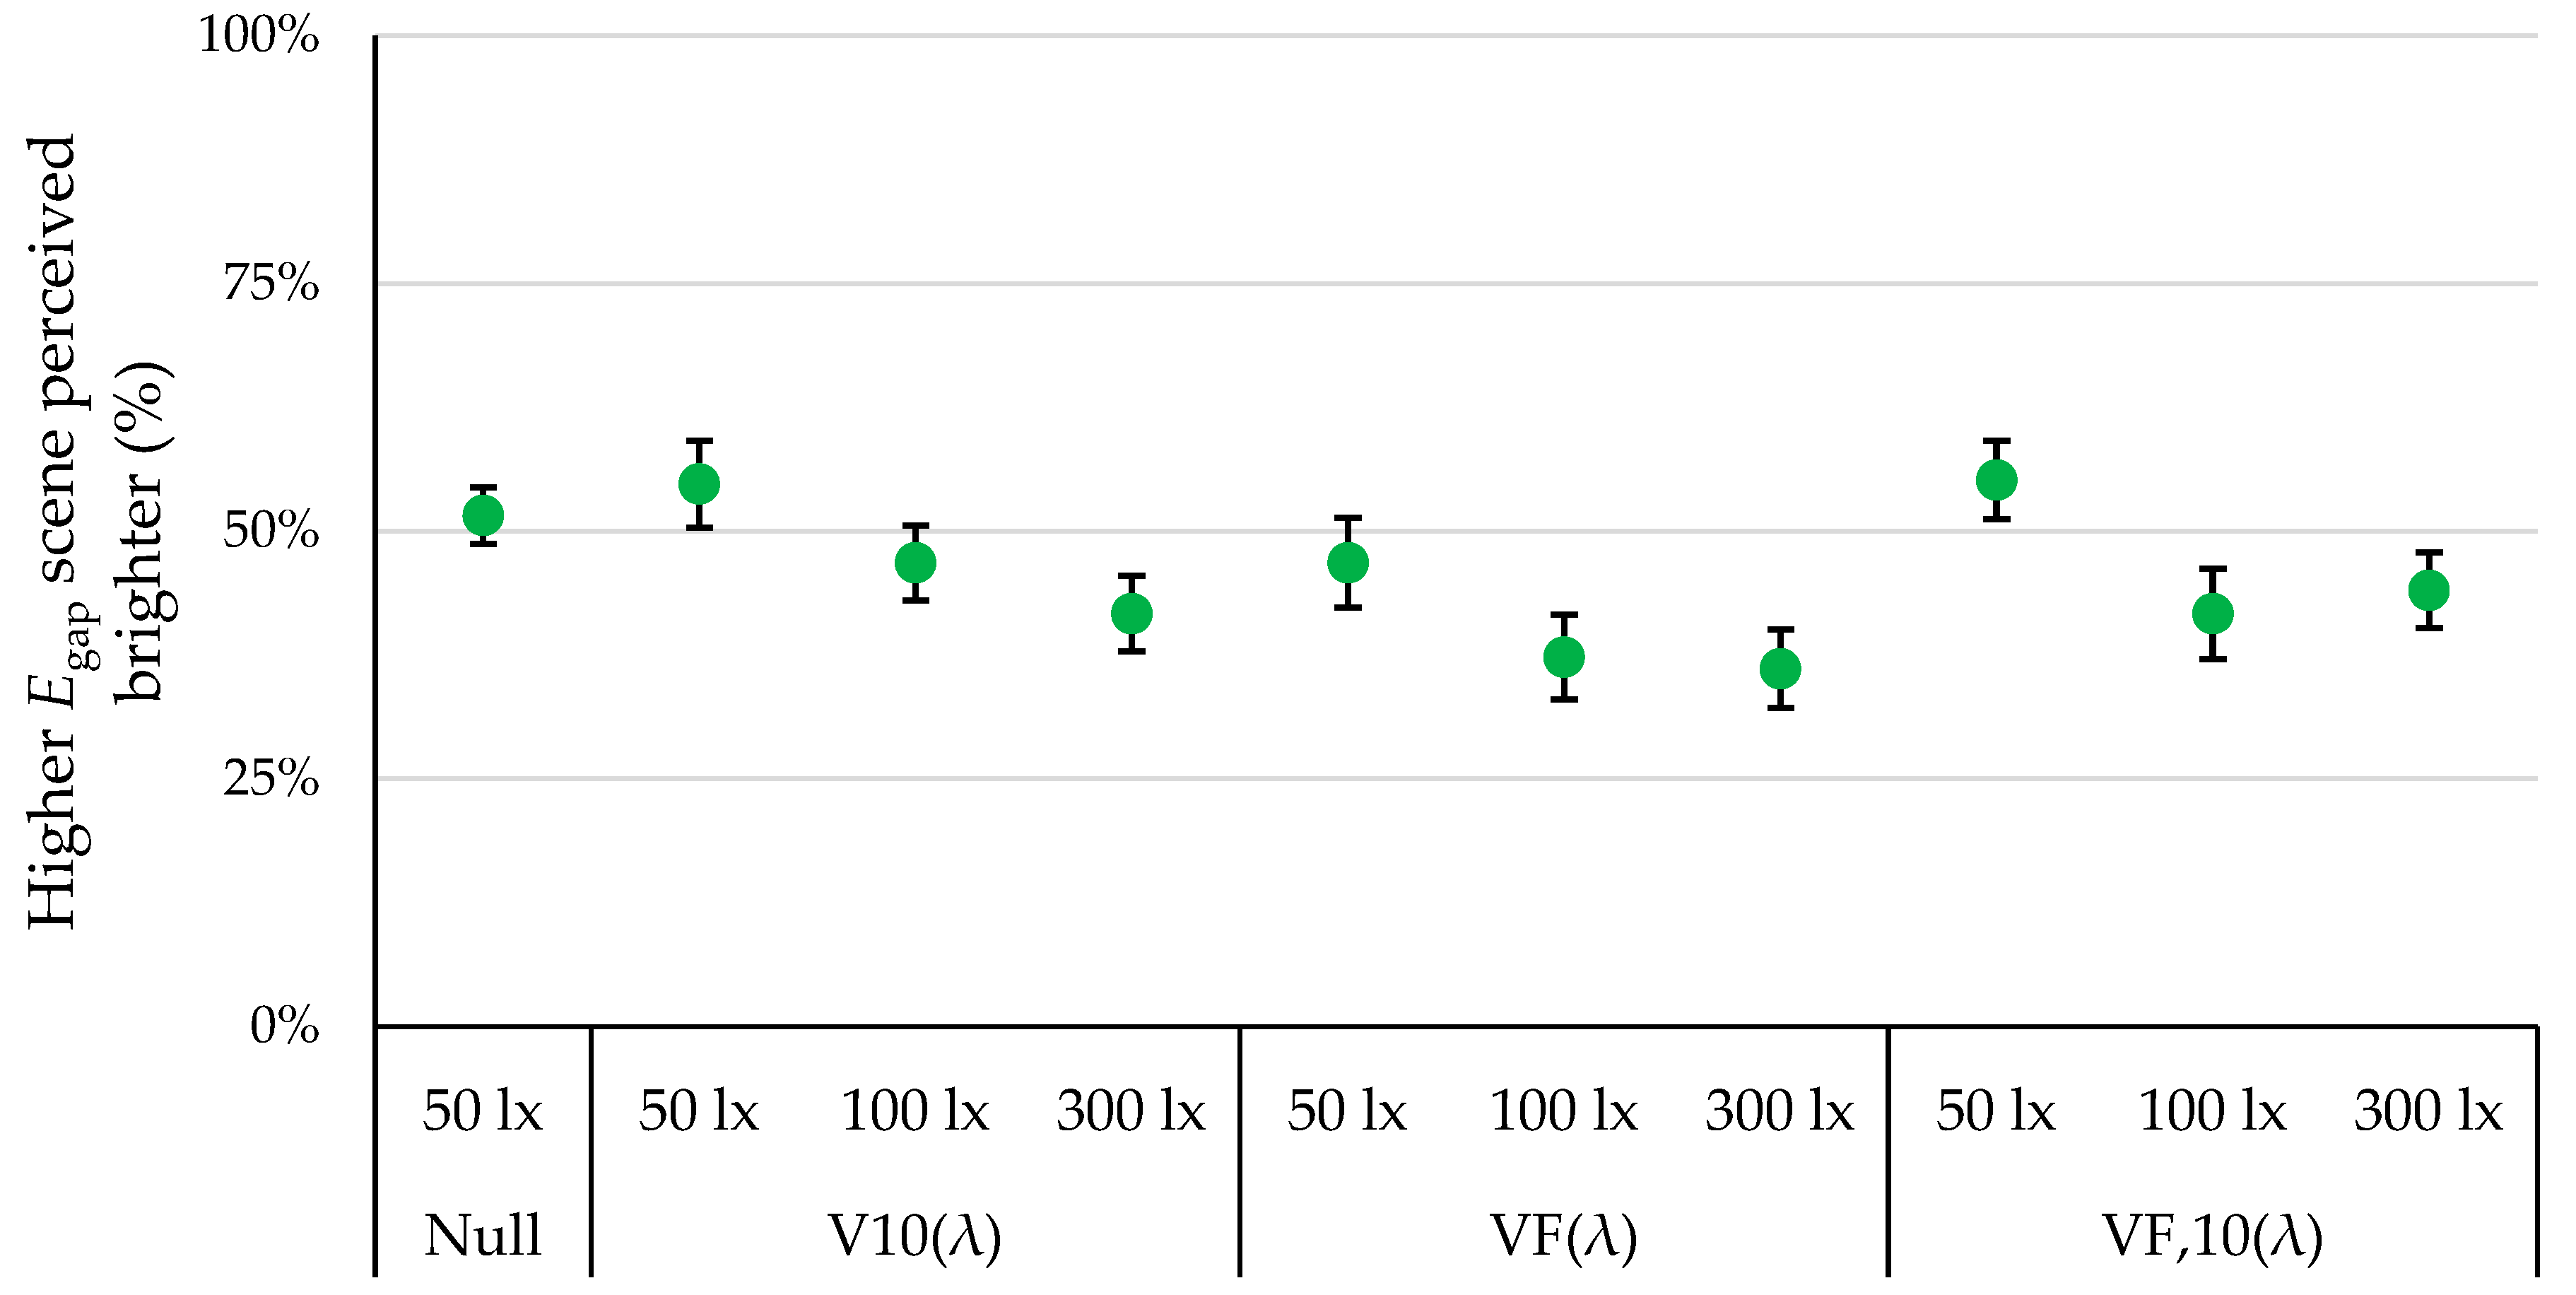
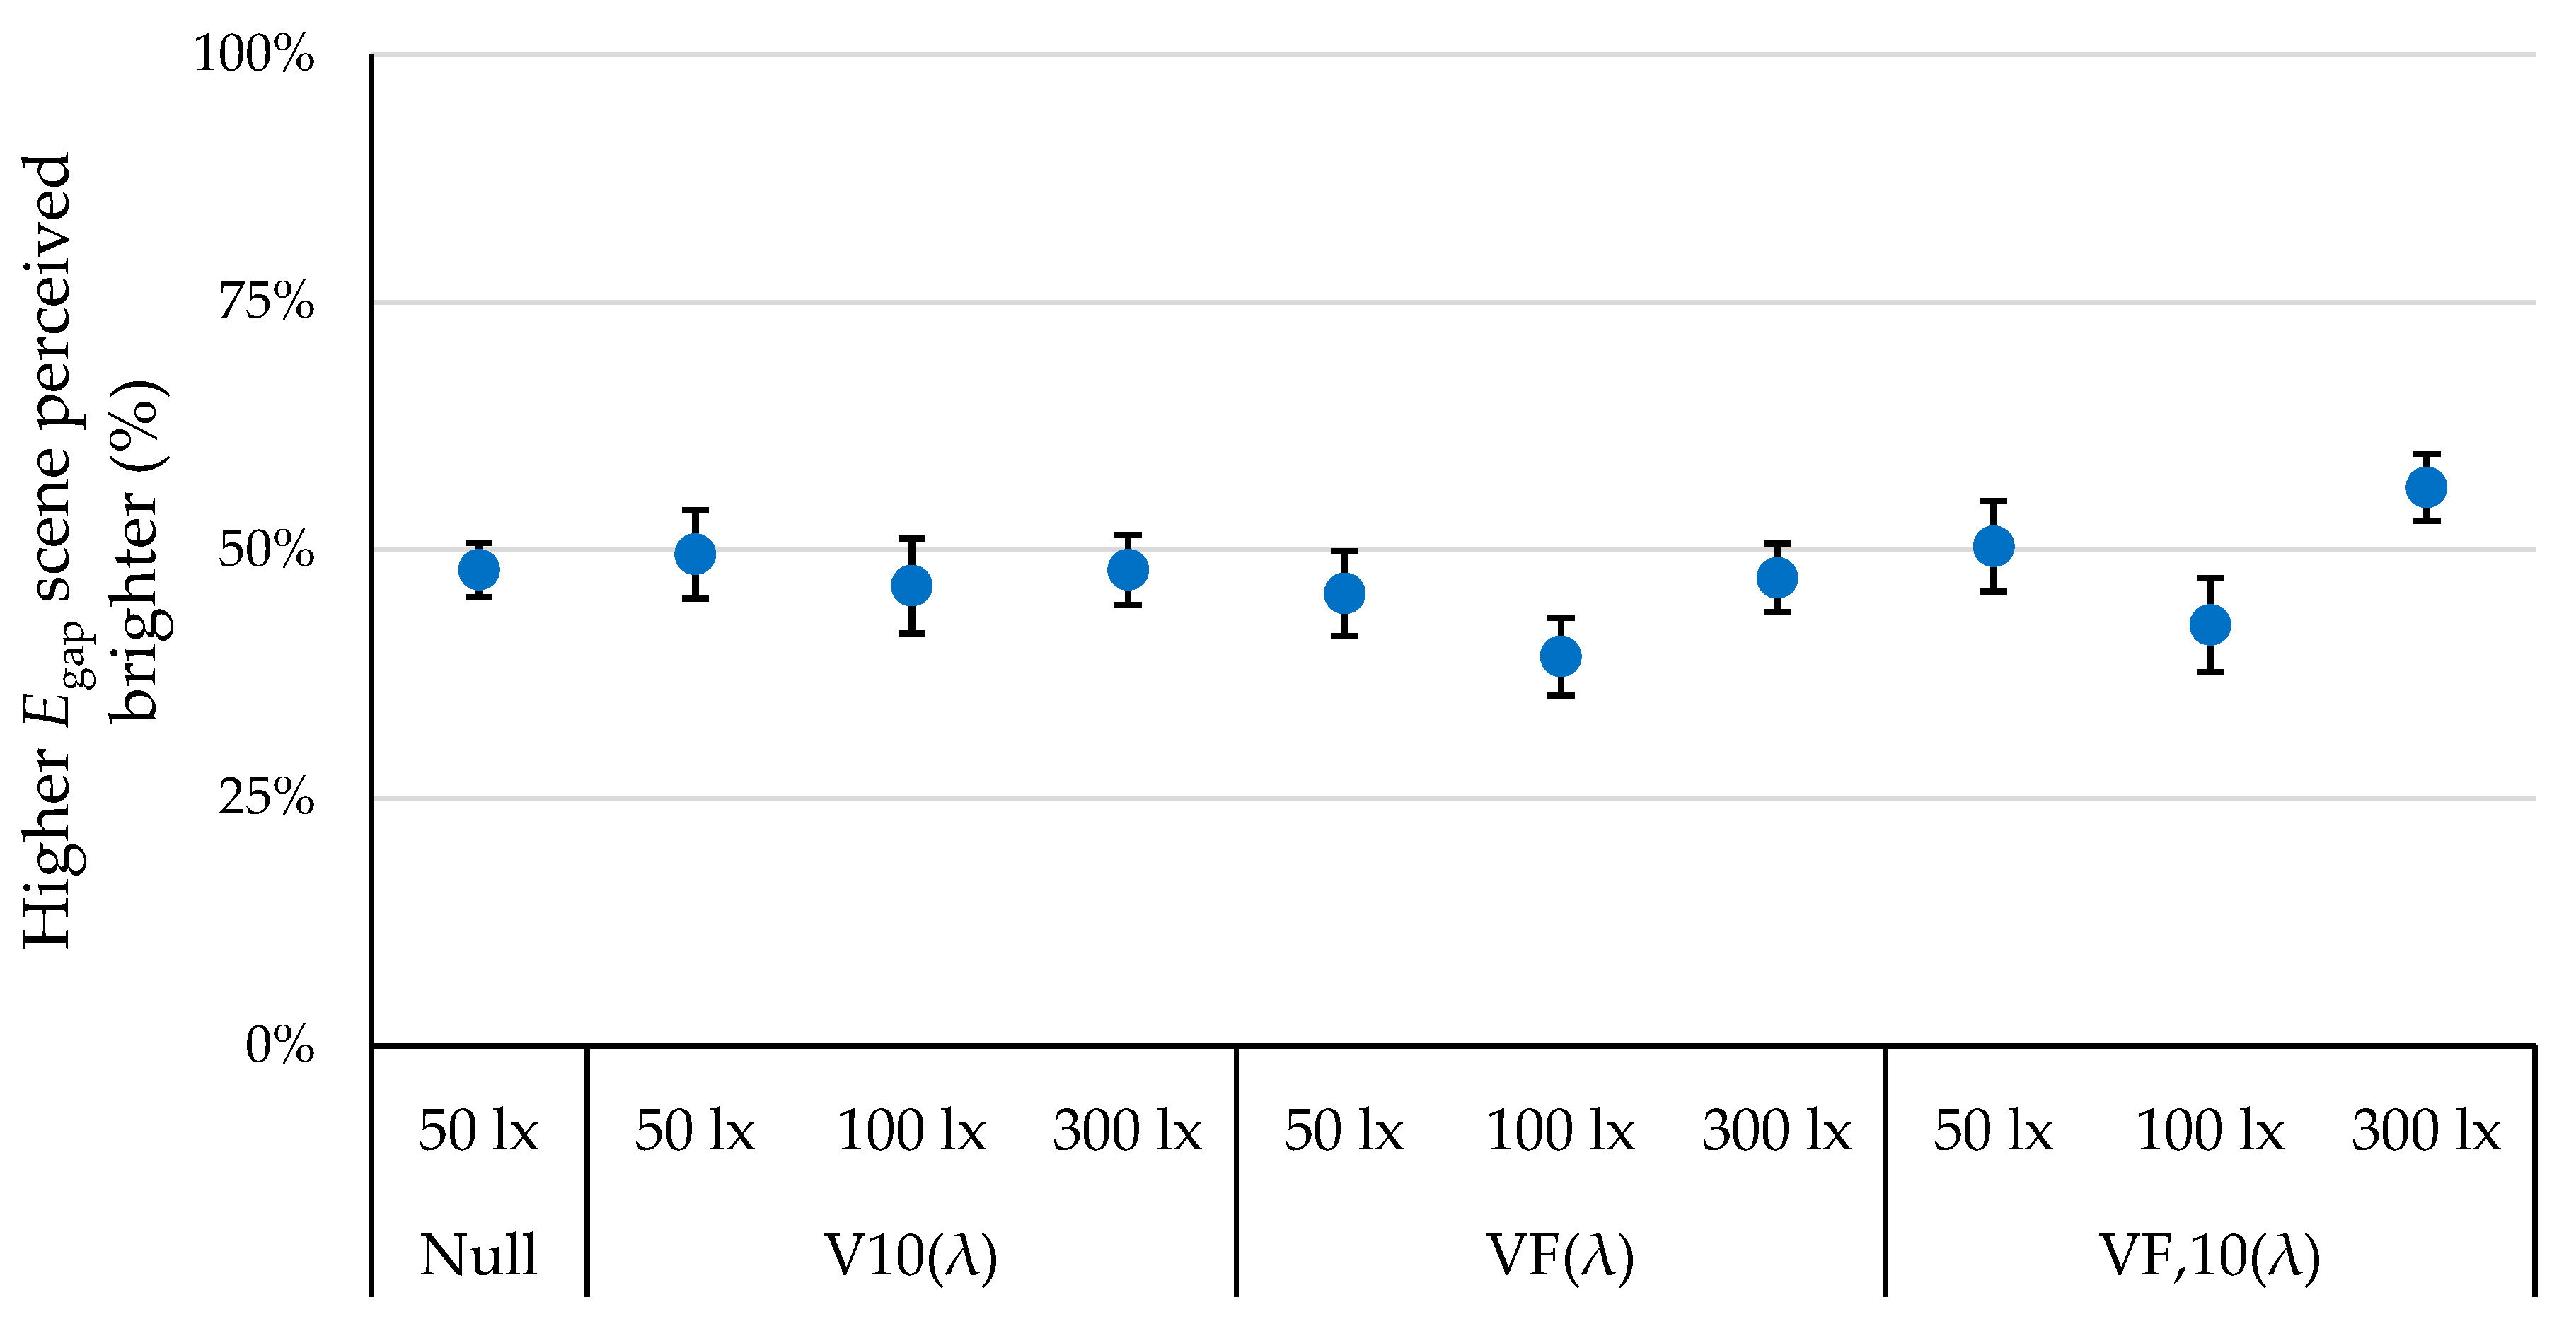
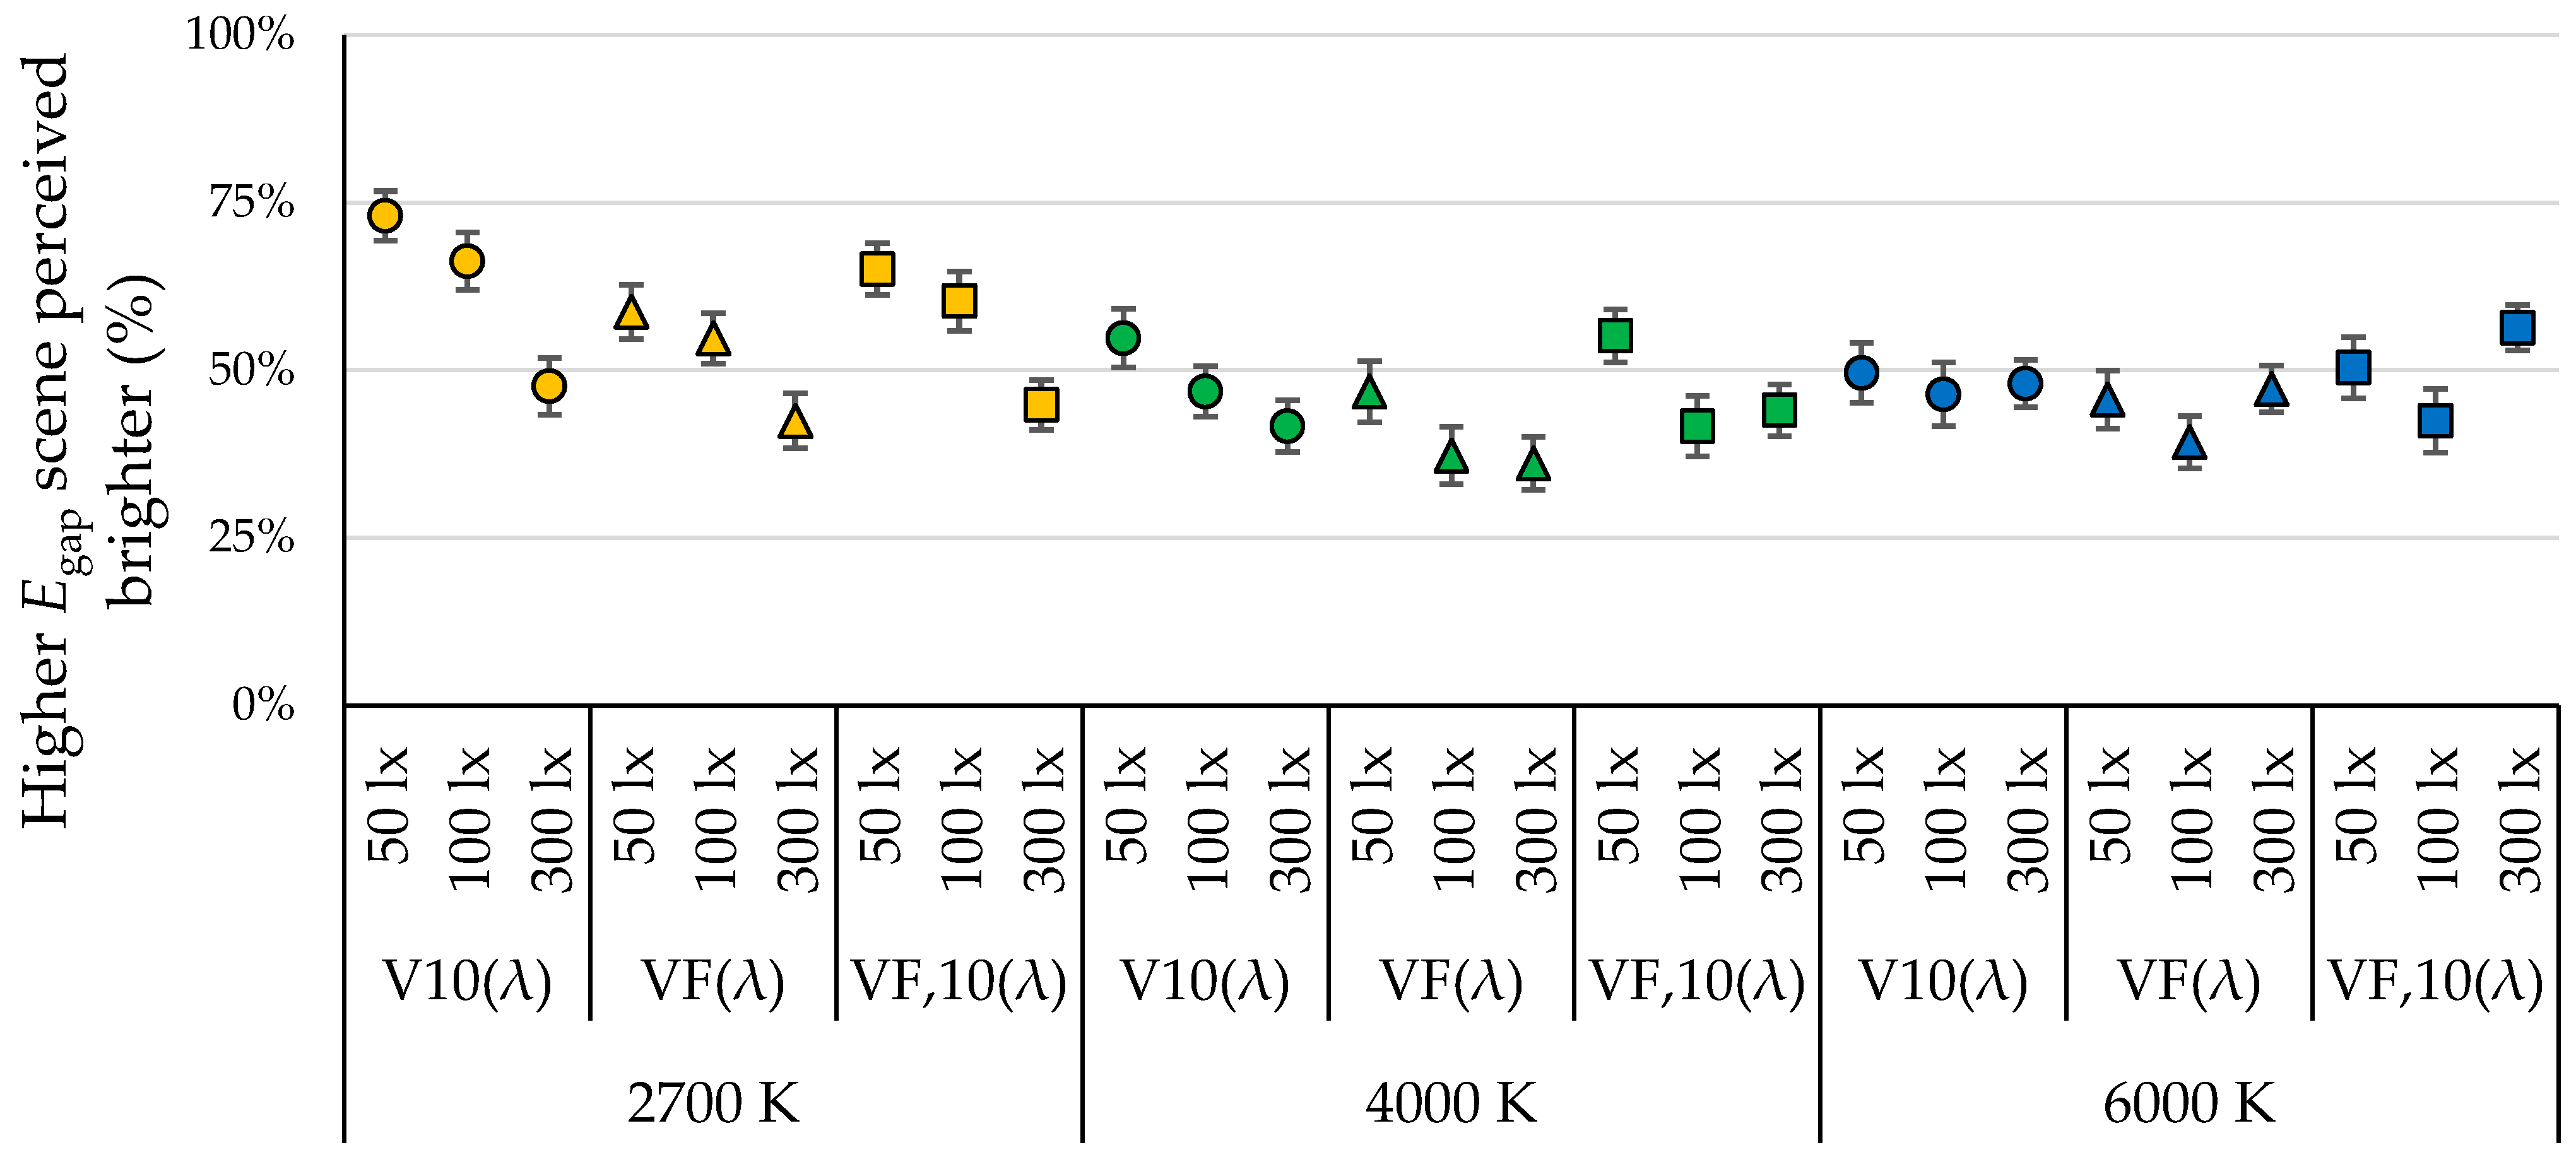
The mean brightness responses are shown in Figure 5, Figure 6, Figure 7 and Figure 8. The y axes state the percentage of choices when participants perceived the higher Egap scene as brighter. A value of 50% indicates that participants were uncertain about which scene appear brighter (i.e., the standard observer V(λ) performed better than the alternative in predicting spatial brightness). A value over 50% denotes that the higher alternative illuminance scene was judged to be brighter. In other words, a value above 50% indicates that the alternative luminous efficiency function-derived illuminance predicted spatial brightness better than V(λ)-derived illuminance. Finally, a value lower than 50% indicates that none of the vertical illuminance values predicted spatial brightness.
Figure 5 shows the mean brightness responses under 2700 K when higher Egap scenes were perceived as brighter. The null condition response of 49.6% (participants were uncertain about the brightness of the two identical scenes) indicates there was no order bias. The highest percentage among the responses was 73.02%, where Ev was 50 lx and V10(λ) was compared with the standard observer. Within the same luminous efficiency function, the percentage of responses decreased with the increase in target illuminance (Ev). Furthermore, the percentage of responses from the 10° luminous efficiency functions (V10(λ), VF,10(λ)) were slightly higher than that of the 2° luminous efficiency function (VF(λ)). Overall, higher Egap scenes were perceived as brighter (except 300 lx), suggesting that alternatives generally outperformed V(λ) at 2700 K.
Figure 6 illustrates the mean spatial brightness responses under 4000 K when scenes with higher Egap were perceived as brighter. The null condition response of 51.59% indicated a lack of order bias. Similar to the conditions at 2700 K, participants perceived higher Egap scenes to be brighter at the lower illuminance level (50 lx) but overall responses were lower. The spatial brightness perception of illuminance derived by the 10° luminous efficiency functions (V10(λ), VF,10(λ)) was slightly greater than that of the 2° luminous efficiency function (VF(λ)). In general, half of responses were below 50%, where scenes with lower Egap were perceived as brighter, indicating that none of the luminous efficiency functions (including the standard observer V(λ)) performed well.
Figure 7 shows the mean spatial brightness responses under 6000 K when higher Egap scenes were perceived as brighter. The results indicate that under identical stimulus conditions, the null condition was correctly identified at an approximate rate of 50%, indicating no order bias was present in this section as well. Overall, the responses were close to the 50% line with some exceptions, suggesting V(λ) outperformed V10(λ) but not necessarily other luminous efficiency functions. The highest brightness response mean was 56.35%, and it occurred at 300 lx under VF,10(λ), while the lowest mean was 39.29% at 100 lx and VF(λ). The percentage of responses from the 10° luminous efficiency functions were slightly higher than that from the 2° luminous efficiency function.
Figure 8 shows the mean spatial brightness responses under all nine CCTs and illuminance conditions except null conditions. As previously mentioned, the 50% line is where V(λ) outperforms the alternative in predicting spatial brightness. Such examples include the comparison against V10(λ)-derived illuminance at 2700 K 300 lx, 4000 K 100 lx, 6000 K all illuminance levels. For VF(λ), these conditions were 4000 K at 50 lx, and 6000 K at 50 lx and 300 lx. Compared to VF,10(λ), V(λ) predicted spatial brightness more accurately under 6000 K at 50 lx. With the exception of 6000 K at 300 lx, lower CCTs yielded a higher percentage of responses. Overall, the results show trend of alternatives outperforming V(λ) in lower CCTs (2700 K) and illuminance levels (50 lx). At higher illuminance levels, none of the photopic luminous efficiency functions (including V(λ)) could predict spatial brightness consistently.
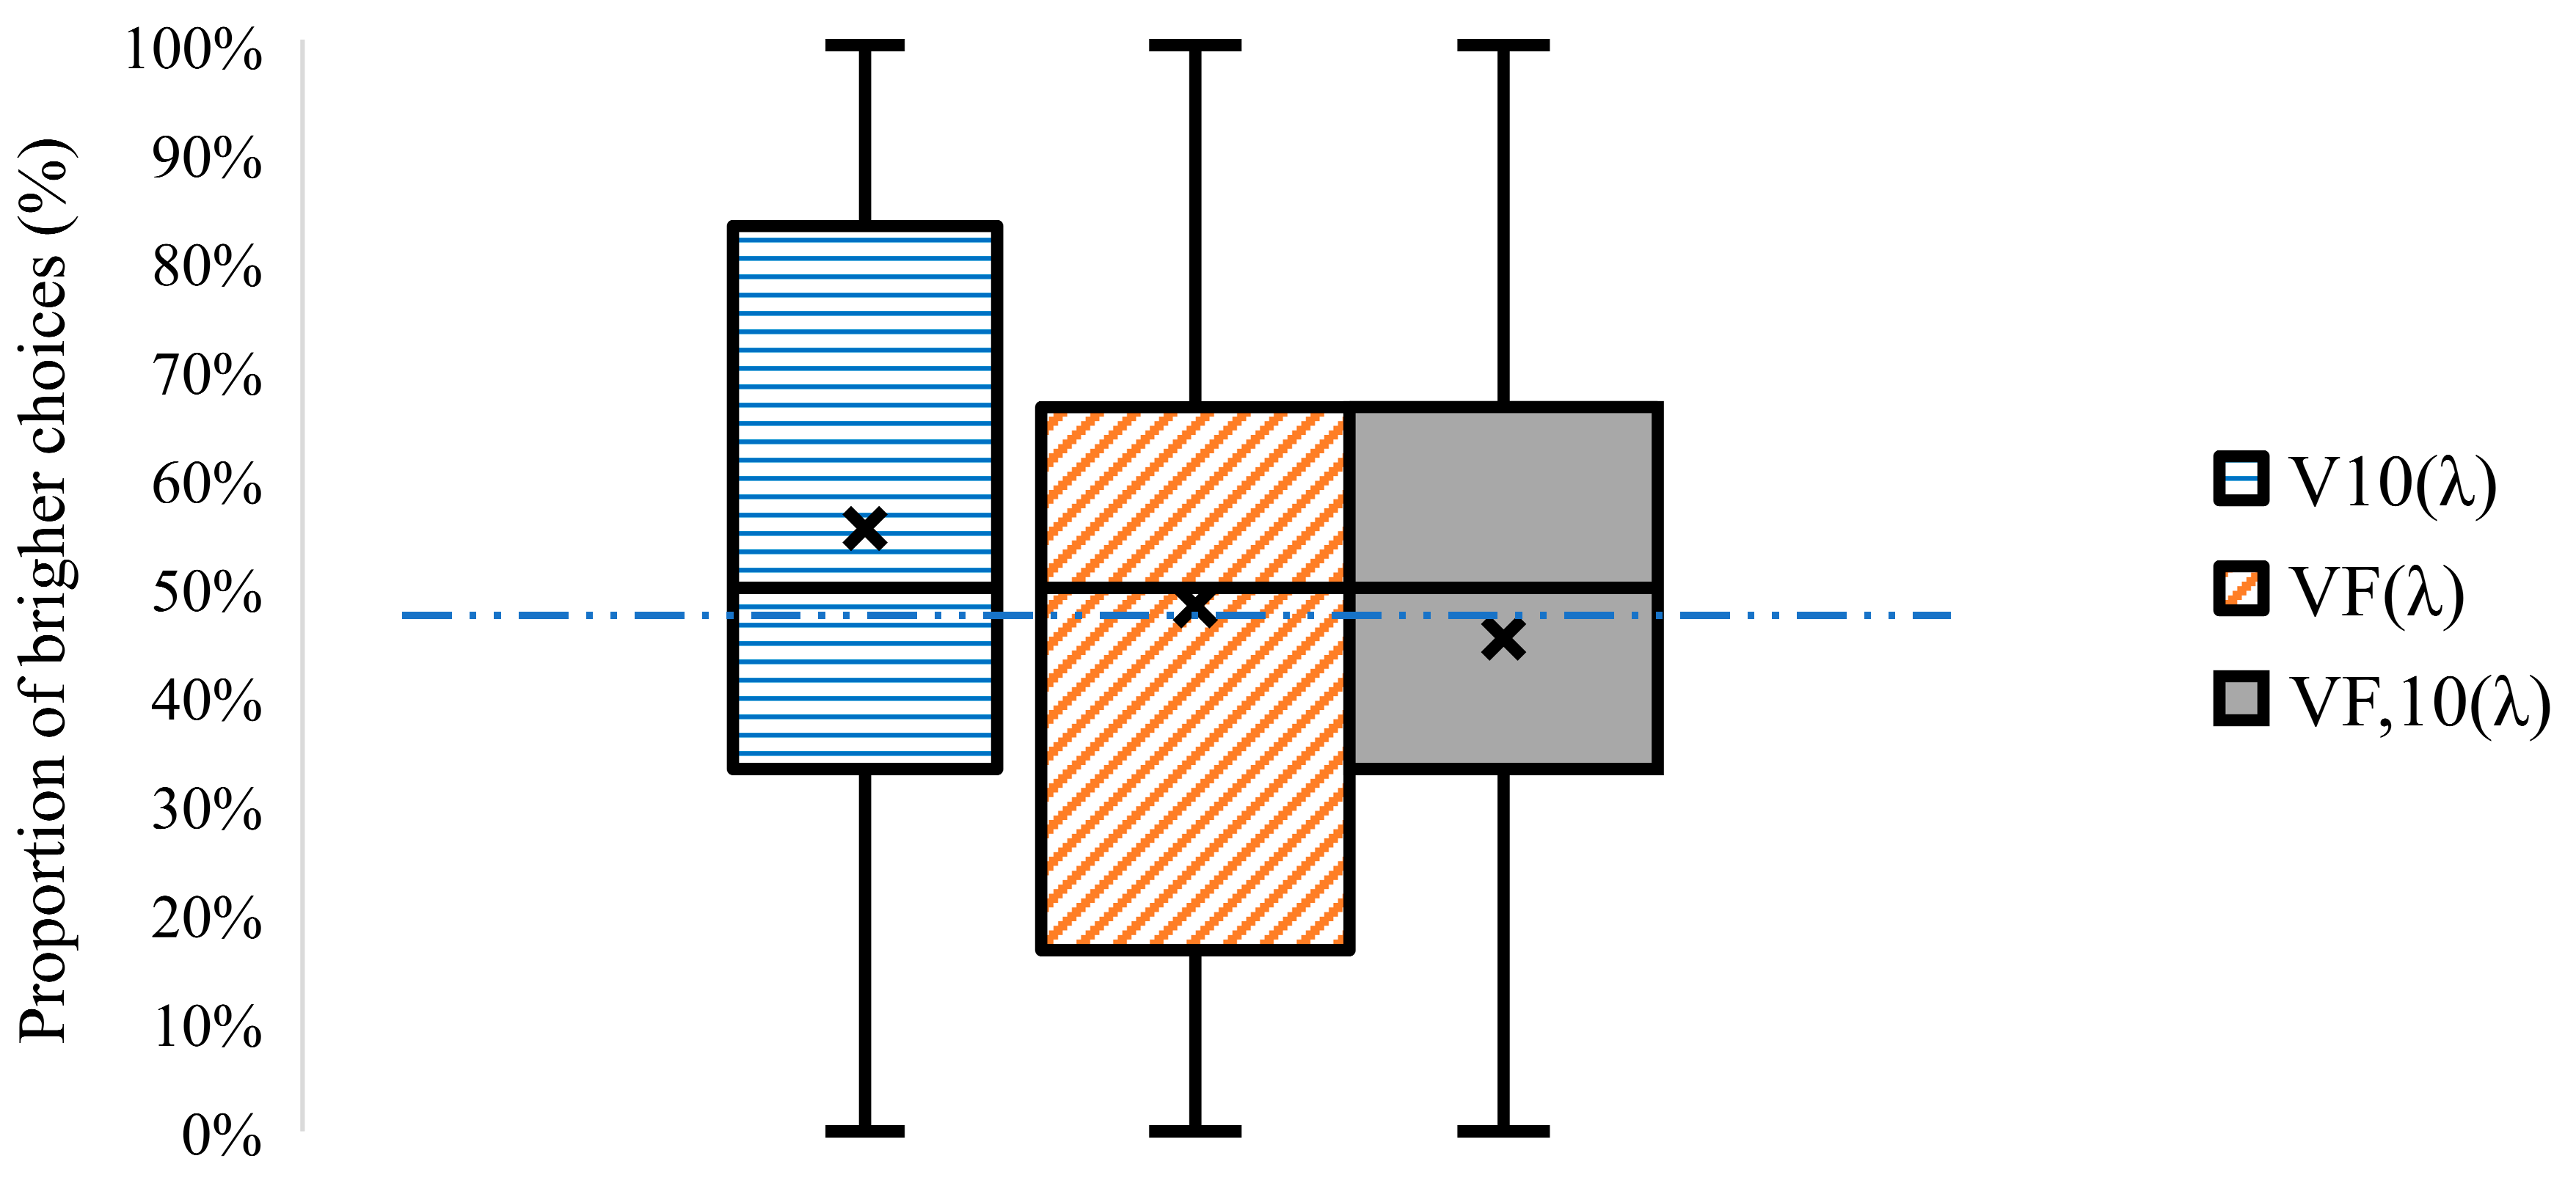
While the CCT-based analysis might tell a complex story of the spatial brightness responses, the aggregated data analysis provides a high-level explanation, as shown in Figure 9. The repeated-measures ANOVA with post hoc comparisons revealed a significant difference between the standard V(λ) and the VF,10(λ) function (adjusted p = 0.025), with the confidence interval excluding zero. In contrast, comparisons between V(λ) and V10(λ) as well as between V(λ) and VF(λ) did not reach statistical significance (adjusted p = 0.115 and p = 0.204, respectively), as their confidence intervals spanned zero, as shown in Table 3. These results suggest that only the VF,10(λ) function diverged systematically from the standard V(λ) in perceived brightness judgments.
Overall, the results indicate a significant impact of the FOV, where 10° luminous efficiency functions had higher responses than 2° luminous efficiency functions. This may not be surprising, given participants made spatial brightness judgments over a larger FOV compared to the 2° FOV where visual acuity is primarily concerned. On the other hand, CCT did not have a consistent effect on the brightness results. One could have expected for higher-CCT conditions to result in higher brightness due to the effect of increased short wavelength energy (blue light) on pupil dilation. It is suggested that the ipRGCs play a role in controlling the pupil size, and hence brightness perception [92]. Considering the ipRGC peak spectral sensitivity (480 nm) greatly aligns with the primary spectral difference between the photopic luminous efficiency functions (450 nm–500 nm), one can hypothesize that melanopsin-based metrics should predict spatial brightness more accurately than photometric measures.

5. Discussion

This study investigated whether vertical illuminance derived from several luminous efficiency functions can predict spatial brightness. Spatial brightness perception is inherently related to the FOV due to the spatial distribution of photoreceptors in the retina [93]. The experimental setting utilized a large FOV since the participants were asked to evaluate the spatial brightness of the whole experimental space (not just the foveal vision). Under several conditions, the brightness responses for 10° luminous efficiency functions were higher than those from the 2° versions. This result may be interpreted as superiority of 10° luminous efficiency functions in predicting spatial brightness, which is in line with other studies [94,95,96,97], and for some, it is just common sense. However, since both 2° and 10° versions failed in predicting spatial brightness under all circumstances, their overall utility is still debatable. A novel luminous efficiency function developed for a larger FOV (>10°) might perform better than the tested luminous efficiency functions. For example, Palmer proposed new standard observers for large field photometry subtending 15°, 45°, and 50° [98]. On the other hand, experiments conducted on displays indicated that retinal size and FOV might not be enough to explain brightness perception [99,100]. Parameters, such as edge blur and contrast polarity, can also impact spatial brightness perception [66], which were beyond the scope of this study.
Brightness has been long known to change with physical stimulus (luminance) following a power or logarithmic curve—also known as Steven’s power law [101] and the “Weber–Fechner” law [102], respectively. As luminance increases, the perceptible difference in brightness diminishes, making it increasingly challenging to discern luminance variations in bright lighting conditions [103,104]. This phenomenon, strongly related to adaptation, can help explain some of the results of the present study, where luminous efficiency functions had a higher accuracy in predicting spatial brightness under lower light levels (50 lx). The poor performance of luminous efficiency functions at higher light levels (300 lx) could be caused by the need for an even larger Egap for participants to identify differences between conditions (e.g., Egap = 4 lx was 1.3% of Ev,target = 300 lx while Egap = 3 lx was 6% of Ev,target = 50 lx). The only exception to the poor performance at the higher illuminance level condition was at 6000 K, which hints at the complex interrelationship between illuminance and CCT.
This study’s impact may well spill over from niche research applications to worldwide practical implications. Updating V(λ) with an alternative function would require not only updating all photometric laboratory software in the world that measures luminaire light output, but also void existing illuminance and luminance meters used by engineers, designers, and compliance professionals. This would likely cause a mismatch between old and new devices and would require all manufacturers to send their products to photometric labs again, which would be costly in terms of time and money. In summary, updating V(λ) is not just a curious scientific pursuit, but also a momentous business and financial decision.
In June 2024, while celebrating its 100th year, the CIE discussed the potential replacement of V(λ) in the Bureau International des Poids et Mesures (BIPM) headquarters in Sèvres, France. The results of this study directly feed into this critical discussion on the worldwide standardization of light metrology. However, major scientific, financial, and business decisions such as this should not be based on the results of a single experiment, and one should remember that updating V(λ) has advantages and disadvantages for various reasons.
The main advantage of updating V(λ) would be to increase its predictive ability, especially considering the spectral differences between V(λ) and its alternatives (425 nm to 500 nm) strongly align with the blue peak of the current industry standard white phosphor-converted LEDs (pcLEDs). Any small change in this region will likely have a sizable impact on measured illuminance and luminous efficacy values. For example, luminous efficacy of radiation (LER) differences up to 36 lm/W are possible for yttrium aluminum garnet (YAG) pcLEDs [16]. These are not small differences, considering that the luminous efficacy of an LED is one of its primary selling points and contributes to reducing energy consumption, and therefore, reducing carbon emissions. At the end of the day, science not only enhances our understanding of the physical world, but also improves our lives.
On the other hand, the disadvantages of updating V(λ) are multifaceted—namely practical, financial, and scientific. The practical and financial issues of updating V(λ) lie in the money, time, and human resources needed to update all existing and future equipment, software, and processes. There are also scientific challenges in replacing V(λ). For example, updating V(λ) would require updating the constant Km (currently 683 lm/W) to maintain the SI unit candela as one of the main seven base units adopted by the General Conference on Weights and Measures (abbreviated as CGPM from the French: Conférence générale des poids et mesures). The scientific argument against updating V(λ) also leans on the size and importance of the real-world impact. For example, photometers have in-built filters to accurately mimic V(λ) that range in quality, and the spectral mismatch errors of a photometer can reach up to 36% [105], which are seemingly above the changes introduced by updating V(λ) itself. Neither photometers nor V(λ) itself can accurately predict illuminance at low light levels due to the shift from photopic to mesopic and scotopic vision. Finally, one can argue that neither V(λ) nor its alternatives were developed to predict spatial brightness in the first place. Instead, V(λ)-based photometry was developed to be consistent (additive, hence repeatable) instead of precise in measuring light.
If updating V(λ) is not feasible or worthwhile, what can be done to quantify spatial brightness? One idea is to use specialized measures to predict spatial brightness and incorporate them into spectroradiometers and other measurement equipment. In recent years, several specialized spatial brightness metrics have been developed with varying parameters. Horizontal photopic illuminance was initially assumed to predict spatial brightness, while later studies suggested other metrics could be used instead [24,69,106]. For example, Duff et al. investigated the correlation between perceived spatial brightness and mean room surface exitance (MRSE), suggesting that MRSE might serve as a more reliable metric than horizontal illuminance [18]. Inspired by Wooten’s findings [107], Rea et al. added S-cone contribution in addition to the standard observer and formed a dynamic model of spectral sensitivity denoted as B(λ) [70]. The updated provisional brightness metric B2 incorporates the spectral luminance function B(λ), with notable adjustments that decrease the influence of S-cone contributions and introduce a more nuanced consideration of melanopsin contribution [71]. Although different spatial brightness metrics have been published in the past, the experimental settings (observer age, FOV, sample size, and spectral reflectance of surfaces) varied across studies. To the authors’ knowledge, no study had systematically examined spatial brightness metrics to independently validate their accuracy. Examining the spatial brightness metrics collectively can provide crucial insights, which will be addressed in future studies.
Like all studies, this experiment inherently focuses on investigating one part of a bigger research problem. One limitation of the study is the participants’ age (median age of 25.6). Older individuals typically exhibit age-related ocular changes—such as reduced pupil size (senile miosis), increased lens yellowing, and diminished retinal sensitivity [108] —which can significantly affect spatial [65] and chromatic brightness [109]. Consequently, the results of this study, based mainly on young adults, may not be generalizable to older populations who may perceive brightness differently under identical lighting conditions. While age-related visual deficiencies are well-documented [65,110,111], there have been proposals to develop categorical spectral sensitivity functions for different age groups [112,113]. A similar approach can be developed for luminous efficiency functions if more data is collected with participants of different age groups. It is also reasonable to speculate that using the photon system of units (that accounts for the particle nature of light) instead of the radiometric system might produce different results [114], especially considering the nuance in generating highly controlled stimuli.
Additionally, the experiment was conducted in a room with no furniture to avoid confounding variables that can be caused by variations in the surface optical properties (spectral reflectance, texture, specularity) of objects. While furnishings can create a more realistic environment since most architectural environments have objects in them, they can also pose as a confounding variable since it is not possible to present every object in real-world environments in one single experiment. Future work should replicate this study using furniture with different spectral properties (achromatic vs. chromatic) [115], texture (glossy vs. matte) [116], and origin (human-made vs. natural) [117], as these properties can impact light reflected to the observers.

6. Conclusions

It has been a century since the development of the CIE photopic luminous efficiency function V(λ) to model human spectral sensitivity to light. Over the years, numerous alternatives have been proposed, and many studies have highlighted the limitations of the standard observer. Researchers and professionals still use V(λ)-derived photometric measures to predict brightness with varying levels of success. Recently, an alternative concept, spatial brightness, has gained more attention but its quantification has been challenging. Building upon prior research, which highlighted substantial differences between the standard observer and alternative luminous efficiency functions, this study investigated the accuracy of V(λ)-derived vertical illuminance in predicting spatial brightness. The results revealed inconsistent performance among luminous efficiency functions in predicting spatial brightness. None of the luminous efficiency functions were able to accurately predict spatial brightness under all conditions. In addition, the accuracy of luminous efficiency functions in predicting spatial brightness was found to be affected by CCT and illuminance levels.
In summary, data from this study indicates that vertical illuminance derived using various luminous efficiency functions does not consistently predict spatial brightness at different CCTs and illuminance levels. Future studies should systematically evaluate the effect of melanopsin and color gamut on spatial brightness, as well as the predictive performance of tailored spatial brightness metrics.

Author Contributions

Conceptualization, D.D.; methodology, W.S. and D.D.; software, W.S.; formal analysis, W.S.; investigation, W.S.; resources, W.S. and D.D.; data curation, D.D.; writing—original draft preparation, W.S.; writing—review and editing, D.D.; visualization, W.S.; supervision, D.D.; project administration, D.D.; funding acquisition, D.D. All authors have read and agreed to the published version of the manuscript.

Funding

This research was funded by Penn State Institutes of Energy and the Environment.

Data Availability Statement

The spectral power distribution for the lighting conditions can be found here: https://doi.org/10.5281/zenodo.11179829 (accessed on 10 August 2025).

Acknowledgments

The authors would like to thank Jeffery Mundinger for his assistance in generating the stimuli and the anonymous reviewers for their invaluable comments and feedback.

Conflicts of Interest

The authors declare no conflicts of interest.

References

  1. Ohno, Y. Photometry. In Handbook of Visual Optics, Volume One; Taylor & Francis: Abingdon, UK, 2017. [Google Scholar]
  2. CIE. CIE Proceedings. In Proceedings of the Commission Internationale de l’Eclairage Compte Rendu des Séances, Sixiéme Sessio; Cambridge University Press: Cambridge, UK, 1924. [Google Scholar]
  3. Coblentz, W.W.; Emerson, W.B. Relative Sensibility of the Average Eye to Light of Different Colors and Some Practical Applications to Radiation Problems; Bulletin of the Bureau of Standards; U.S. Department of Commerce, Bureau of Standards: Washington, DC, USA, 1918; Volume 14. [Google Scholar]
  4. Hartman, L. The Visibility of Radiation in the Blue End of the Visible Spectrum. Astrophys. J. 1918, 47, 83. [Google Scholar] [CrossRef]
  5. Hyde, E.; Forsythe, W.; Cady, F. The Visibility of Radiation. Astrophys. J. 1918, 48, 65. [Google Scholar] [CrossRef]
  6. Gibson, K.S.; Tyndall, E.P.T. Visibility of Radiant Energy; US Government Printing Office: Washington, DC, USA, 1923; Volume 19. [Google Scholar]
  7. Judd, D.B. Color in Business, Science and Industry; Wiley: New York, NY, USA, 1952. [Google Scholar]
  8. Comerford, J.P.; Kaiser, P.K. Luminous-Efficiency Functions Determined by Heterochromatic Brightness Matching. J. Opt. Soc. Am. 1975, 65, 466–468. [Google Scholar] [CrossRef]
  9. Vos, J.J. Colorimetric and Photometric Properties of a 2° Fundamental Observer. Color Res. Appl. 1978, 3, 125–128. [Google Scholar] [CrossRef]
  10. Sagawa, K.; Takahashi, Y. Spectral Luminous Efficiency as a Function of Age. J. Opt. Soc. Am. A 2001, 18, 2659–2667. [Google Scholar] [CrossRef]
  11. Sharpe, L.T.; Stockman, A.; Jagla, W.; Jägle, H. A Luminous Efficiency Function, VD65* (λ), for Daylight Adaptation: A Correction. Color Res. Appl. 2011, 36, 42–46. [Google Scholar] [CrossRef]
  12. Wyszecki, G.; Stiles, W.S. Color Science: Concepts and Methods, Quantitative Data, and Formulae; Wiley Classics Library; Wiley Classics Library, Ed.; John Wiley & Sons: New York, NY, USA, 2000; ISBN 978-0-471-39918-6. [Google Scholar]
  13. Schanda, J. Colorimetry: Understanding the CIE System; John Wiley & Sons: Hoboken, NJ, USA, 2007; ISBN 0-470-17562-1. [Google Scholar]
  14. Stockman, A. Cone Fundamentals and CIE Standards. Curr. Opin. Behav. Sci. 2019, 30, 87–93. [Google Scholar] [CrossRef]
  15. Sharpe, L.T.; Stockman, A.; Jagla, W.; Jägle, H. A Luminous Efficiency Function, V*(λ), for Daylight Adaptation. J. Vis. 2005, 5, 3. [Google Scholar] [CrossRef]
  16. Song, W.; Durmus, D. Evaluating Energy Efficiency and Colorimetric Quality of Electric Light Sources Using Alternative Spectral Sensitivity Functions. Buildings 2022, 12, 2220. [Google Scholar] [CrossRef]
  17. Song, W.; Durmus, D. Evaluating Energy Efficiency and Color Quality of LEDs Using Alternative Spectral Sensitivity Functions. In Proceedings of the Optica Advanced Photonics Congress 2022, Maastricht, The Netherlands, 24–28 July 2022; Optica Publishing Group: Washington, DC, USA, 2022; p. PvM3H.2. [Google Scholar]
  18. Duff, J.; Kelly, K.; Cuttle, C. Spatial Brightness, Horizontal Illuminance and Mean Room Surface Exitance in a Lighting Booth. Light. Res. Technol. 2017, 49, 5–15. [Google Scholar] [CrossRef]
  19. Fotios, S.A. Lamp Colour Properties and Apparent Brightness: A Review. Light. Res. Technol. 2001, 33, 163–178. [Google Scholar] [CrossRef]
  20. Stevens, S.S. Duration, Luminance, and the Brightness Exponent. Percept. Psychophys. 1966, 1, 96–100. [Google Scholar] [CrossRef]
  21. Bernecker, C.A.; Mier, J.M. The Effect of Source Luminance on the Perception of Environment Brightness. J. Illum. Eng. Soc. 1985, 15, 253–271. [Google Scholar] [CrossRef]
  22. Arend, L.E.; Spehar, B. Lightness, Brightness, and Brightness Contrast: 1. Illuminance Variation. Percept. Psychophys. 1993, 54, 446–456. [Google Scholar] [CrossRef]
  23. Hermans, S.; Smet, K.A.G.; Hanselaer, P. Brightness Model for Neutral Self-Luminous Stimuli and Backgrounds. Leukos 2018, 14, 231–244. [Google Scholar] [CrossRef]
  24. Yu, H.; Ko, B.; Koga, T.; Hirate, K.; Suzuki, N. Validation of the Predictive Equation for Spatial Brightness in an Experimental Space. Archit. Sci. Rev. 2019, 62, 493–506. [Google Scholar] [CrossRef]
  25. CIE 212:2014; Guidance Towards Best Practice in Psychophysical Procedures Used When Measuring Relative Spatial Brightness. Commission Internationale de l’Eclairage: Vienna, Austria, 2014.
  26. CIE 165:2005; CIE 10 Degree Photopic Photometric Observer. Publication/CIE; CIE Central Bureau: Vienna, Austria, 2005; ISBN 978-3-901906-39-8.
  27. Ishak, I.G.H. The Photopic Luminosity Curve for a Group of Fifteen Egyptian Trichromats. J. Opt. Soc. Am. 1952, 42, 529. [Google Scholar] [CrossRef]
  28. Adams, C.K.; Dawson, W.W. Fast Retinal Potential Luminosity Functions. Vis. Res. 1971, 11, 1135–1146. [Google Scholar] [CrossRef]
  29. Bornstein, M.H.; Marks, L.E. Photopic Luminosity Measured by the Method of Critical Frequency. Vis. Res. 1972, 12, 2023–2033. [Google Scholar] [CrossRef]
  30. Rovamo, J.; Koljonen, T.; Näsänen, R. A New Psychophysical Method for Determining the Photopic Spectral-Luminosity Function of the Human Eye. Vis. Res. 1996, 36, 2675–2680. [Google Scholar] [CrossRef]
  31. CIE 075-1988; Spectral Luminous Efficiency Functions Based upon Heterochromatic Brightness Matching for Monochromatic Point Sources, 2° and 10° Fields. Commission Internationale de l’Eclairage: Vienna, Austria, 1988.
  32. Dresler, A. The Non-Additivity of Heterochromatic Brightnesses. Trans. Illum. Eng. Soc. 1953, 18, 141–165. [Google Scholar] [CrossRef]
  33. Guth, S.L.; Lodge, H.R. Heterochromatic Additivity, Foveal Spectral Sensitivity, and a New Color Model. J. Opt. Soc. Am. 1973, 63, 450. [Google Scholar] [CrossRef]
  34. Kaiser, P.K.; Wyszecki, G. Additivity Failures in Heterochromatic Brightness Matching. Color Res. Appl. 1978, 3, 177–182. [Google Scholar] [CrossRef]
  35. Abney, W.D.W. VII. The Sensitiveness of the Retina to Light and Colour. Phil. Trans. R. Soc. Lond. A 1897, 190, 155–195. [Google Scholar] [CrossRef]
  36. Boynton, R.M.; Kaiser, P.K. Vision: The Additivity Law Made to Work for Heterochromatic Photometry with Bipartite Fields. Science 1968, 161, 366–368. [Google Scholar] [CrossRef] [PubMed]
  37. Nimeroff, I. Colorimetry in Parafoveal Fields* I Color-Matching Functions. J. Opt. Soc. Am. 1964, 54, 824. [Google Scholar] [CrossRef]
  38. Pokorny, J.; Smith, V.C.; Xu, J. Quantal and Non-Quantal Color Matches: Failure of Grassmann’s Laws at Short Wavelengths. J. Opt. Soc. Am. A 2012, 29, A324. [Google Scholar] [CrossRef] [PubMed]
  39. Yaguchi, H.; Ikeda, M. Subadditivity and Superadditivity in Heterochromatic Brightness Matching. Vis. Res. 1983, 23, 1711–1718. [Google Scholar] [CrossRef]
  40. Nakano, Y.; Ikeda, M.; Kaiser, P.K. Contributions of the Opponent Mechanisms to Brightness and Nonlinear Models. Vis. Res. 1988, 28, 799–810. [Google Scholar] [CrossRef] [PubMed]
  41. Nayatani, Y.; Sobagaki, H. Prediction of Experimental Results on Additivity-Law Failure. Color Res. Appl. 2000, 25, 32–42. [Google Scholar] [CrossRef]
  42. Nayatani, Y.; Sobagaki, H. Relationship between Brightness/Luminance Ratio and Additivity-law Failure. Color Res. Appl. 2002, 27, 185–190. [Google Scholar] [CrossRef]
  43. Davidson, M. Perturbation Approach to Spatial Brightness Interaction in Human Vision. J. Opt. Soc. Am. 1968, 58, 1300. [Google Scholar] [CrossRef]
  44. Fotios, S.; Atli, D. Comparing Judgments of Visual Clarity and Spatial Brightness through an Analysis of Studies Using the Category Rating Procedure. Leukos 2012, 8, 261–281. [Google Scholar]
  45. Ju, J.; Chen, D.; Lin, Y. Effects of Correlated Color Temperature on Spatial Brightness Perception. Color Res. Appl. 2012, 37, 450–454. [Google Scholar] [CrossRef]
  46. Harrington, R.E. Effect of Color Temperature on Apparent Brightness. J. Opt. Soc. Am. 1954, 44, 113. [Google Scholar] [CrossRef]
  47. Burns, S.A.; Smith, V.C.; Pokorny, J.; Elsner, A.E. Brightness of Equal-Luminance Lights. J. Opt. Soc. Am. 1982, 72, 1225. [Google Scholar] [CrossRef]
  48. Berman, S.M.; Jewett, D.L.; Fein, G.; Saika, G.; Ashford, F. Photopic Luminance Does Not Always Predict Perceived Room Brightness. Light. Res. Technol. 1990, 22, 37–41. [Google Scholar] [CrossRef]
  49. Gooley, J.J.; Lu, J.; Chou, T.C.; Scammell, T.E.; Saper, C.B. Melanopsin in Cells of Origin of the Retinohypothalamic Tract. Nat. Neurosci. 2001, 4, 1165. [Google Scholar] [CrossRef]
  50. Berman, S.M. Energy Efficiency Consequences of Scotopic Sensitivity. J. Illum. Eng. Soc. 1992, 21, 3–14. [Google Scholar] [CrossRef]
  51. Berman, S.M.; Jewett, D.L.; Benson, B.R.; Law, T.M. Despite Different Wall Colors, Vertical Scotopic Illuminance Predicts Pupil Size. J. Illum. Eng. Soc. 1997, 26, 59–68. [Google Scholar] [CrossRef]
  52. Berson, D.M.; Dunn, F.A.; Takao, M. Phototransduction by Retinal Ganglion Cells That Set the Circadian Clock. Science 2002, 295, 1070–1073. [Google Scholar] [CrossRef]
  53. Bowmaker, J.K.; Dartnall, H.J. Visual Pigments of Rods and Cones in a Human Retina. J. Physiol. 1980, 298, 501–511. [Google Scholar] [CrossRef]
  54. Berman, S.M. A New Retinal Photoreceptor Should Affect Lighting Practice. Light. Res. Technol. 2008, 40, 373–376. [Google Scholar] [CrossRef]
  55. Brown, T.M.; Tsujimura, S.; Allen, A.E.; Wynne, J.; Bedford, R.; Vickery, G.; Vugler, A.; Lucas, R.J. Melanopsin-Based Brightness Discrimination in Mice and Humans. Curr. Biol. 2012, 22, 1134–1141. [Google Scholar] [CrossRef]
  56. Zele, A.J.; Adhikari, P.; Feigl, B.; Cao, D. Cone and Melanopsin Contributions to Human Brightness Estimation. J. Opt. Soc. Am. A 2018, 35, B19–B25. [Google Scholar] [CrossRef]
  57. Spitschan, M. Melanopsin Contributions to Non-Visual and Visual Function. Curr. Opin. Behav. Sci. 2019, 30, 67–72. [Google Scholar] [CrossRef]
  58. Yamakawa, M.; Tsujimura, S.; Okajima, K. A Quantitative Analysis of the Contribution of Melanopsin to Brightness Perception. Sci. Rep. 2019, 9, 7568. [Google Scholar] [CrossRef]
  59. DeLawyer, T.; Tsujimura, S.; Shinomori, K. Relative Contributions of Melanopsin to Brightness Discrimination When Hue and Luminance Also Vary. J. Opt. Soc. Am. A 2020, 37, A81. [Google Scholar] [CrossRef]
  60. Hu, Z.; Zhang, P.; Huang, Y.; Li, M.; Dai, Q. The Impact of Melanopic Illuminance and CCT on Spatial Brightness Perception of Illuminated Interiors and Energy-Saving Implications. Build. Environ. 2022, 223, 109524. [Google Scholar] [CrossRef]
  61. Khanh, T.Q.; Bodrogi, P.; Zandi, B.; Vinh, T.Q. Brightness Perception under Photopic Conditions: Experiments and Modeling with Contributions of S-Cone and IpRGC. Sci. Rep. 2023, 13, 14542. [Google Scholar] [CrossRef]
  62. Tikidji-Hamburyan, A.; Reinhard, K.; Storchi, R.; Dietter, J.; Seitter, H.; Davis, K.E.; Idrees, S.; Mutter, M.; Walmsley, L.; Bedford, R.A.; et al. Rods Progressively Escape Saturation to Drive Visual Responses in Daylight Conditions. Nat. Commun. 2017, 8, 1813. [Google Scholar] [CrossRef]
  63. Zele, A.J.; Dey, A.; Adhikari, P.; Feigl, B. Rhodopsin and Melanopsin Contributions to Human Brightness Estimation. J. Opt. Soc. Am. A 2020, 37, A145. [Google Scholar] [CrossRef]
  64. Frederiksen, R.; Morshedian, A.; Tripathy, S.A.; Xu, T.; Travis, G.H.; Fain, G.L.; Sampath, A.P. Rod Photoreceptors Avoid Saturation in Bright Light by the Movement of the G Protein Transducin. J. Neurosci. 2021, 41, 3320–3330. [Google Scholar] [CrossRef]
  65. Royer, M.P.; Houser, K.W. Spatial Brightness Perception of Trichromatic Stimuli. Leukos 2012, 9, 89–108. [Google Scholar] [CrossRef]
  66. Mahmoudzadeh, P.; Hu, W.; Davis, W.; Durmus, D. The Effect of Center and Surround Luminance, Visual Angle, Edge Blur, and Contrast Polarity on Overall Brightness Perception. Build. Environ. 2025, 271, 112582. [Google Scholar] [CrossRef]
  67. Besenecker, U.; Bullough, J.; Radetsky, L. Spectral Sensitivity and Scene Brightness at Low to Moderate Photopic Light Levels. Light. Res. Technol. 2016, 48, 676–688. [Google Scholar] [CrossRef]
  68. Bullough, J.D.; Radetsky, L.C.; Besenecker, U.C.; Rea, M.S. Influence of Spectral Power Distribution on Scene Brightness at Different Light Levels. Leukos 2014, 10, 3–9. [Google Scholar] [CrossRef]
  69. Rea, M.; Mou, X.; Bullough, J. Scene Brightness of Illuminated Interiors. Light. Res. Technol. 2016, 48, 823–831. [Google Scholar] [CrossRef]
  70. Rea, M.; Radetsky, L.; Bullough, J. Toward a Model of Outdoor Lighting Scene Brightness. Light. Res. Technol. 2011, 43, 7–30. [Google Scholar] [CrossRef]
  71. Besenecker, U.; Bullough, J. Investigating Visual Mechanisms Underlying Scene Brightness. Light. Res. Technol. 2017, 49, 16–32. [Google Scholar] [CrossRef]
  72. DeLaney, W.B.; Hughes, P.C.; McNelis, J.F.; Sarver, J.F.; Soules, T.F. An Examination of Visual Clarity with High Color Rendering Fluorescent Light Sources. J. Illum. Eng. Soc. 1978, 7, 74–84. [Google Scholar] [CrossRef]
  73. Flynn, J.E.; Spencer, T.J. The Effects of Light Source Color on User Impression and Satisfaction. J. Illum. Eng. Soc. 1977, 6, 167–179. [Google Scholar] [CrossRef]
  74. Boyce, P.R.; Cuttle, C. Effect of Correlated Colour Temperature on the Perception of Interiors and Colour Discrimination Performance. Light. Res. Technol. 1990, 22, 19–36. [Google Scholar] [CrossRef]
  75. Vrabel, P.L.; Bernecker, C.A.; Mistrick, R.G. Visual Performance and Visual Clarity under Electric Light Sources: Part II—Visual Clarity. J. Illum. Eng. Soc. 1998, 27, 29–41. [Google Scholar] [CrossRef]
  76. Manav, B. An Experimental Study on the Appraisal of the Visual Environment at Offices in Relation to Colour Temperature and Illuminance. Build. Environ. 2007, 42, 979–983. [Google Scholar] [CrossRef]
  77. Vienot, F.; Durand, M.-L.; Mahler, E. Kruithof’s Rule Revisited Using LED Illumination. J. Mod. Opt. 2009, 56, 1433–1446. [Google Scholar] [CrossRef]
  78. Barraza, J.F.; Martín, A. The Effect of Texture on Brightness Perception in Simulated Scenes. Leukos 2020, 16, 279–287. [Google Scholar] [CrossRef]
  79. Festinger, L.; Coren, S.; Rivers, G. The Effect of Attention on Brightness Contrast and Assimilation. Am. J. Psychol. 1970, 83, 189. [Google Scholar] [CrossRef]
  80. Komatsu, H.; Murakami, I.; Kinoshita, M. Surface Representation in the Visual System. Cogn. Brain Res. 1996, 5, 97–104. [Google Scholar] [CrossRef]
  81. Issolio, L.; Colombo, E.M. Brightness for Different Surround Conditions: The Effect of Transient Glare. Percept. Psychophys. 2006, 68, 702–709. [Google Scholar] [CrossRef]
  82. ANSI/IES RP-11-20; Recommended Practice: Lighting for Interior and Exterior Residential Environments. IES: New York, NY, USA, 2020.
  83. ANSI/IES RP-10-20; Recommended Practice: Lighting Common Applications. IES: New York, NY, USA, 2020.
  84. Ohno, Y. Practical Use and Calculation of CCT and Duv. Leukos 2014, 10, 47–55. [Google Scholar] [CrossRef]
  85. Durmus, D. Correlated Color Temperature: Use and Limitations. Light. Res. Technol. 2022, 54, 363–375. [Google Scholar] [CrossRef]
  86. Fotios, S.; Houser, K.; Cheal, C. Counterbalancing Needed to Avoid Bias in Side-by-Side Brightness Matching Tasks. Leukos 2008, 4, 207–223. [Google Scholar] [CrossRef]
  87. Faul, F.; Erdfelder, E.; Lang, A.-G.; Buchner, A. G*Power 3: A Flexible Statistical Power Analysis Program for the Social, Behavioral, and Biomedical Sciences. Behav. Res. Methods 2007, 39, 175–191. [Google Scholar] [CrossRef]
  88. Zihl, J.; Pöppel, E.; Von Cramon, D. Diurnal Variation of Visual Field Size in Patients with Postretinal Lesions. Exp. Brain Res. 1977, 27, 245–249. [Google Scholar] [CrossRef]
  89. Zhang, Y.; Tu, Y.; Wang, L.; Shi, Y. Effects of Blue-Enriched White Light with Same Correlated Colour Temperature on Visual Fatigue. Light. Res. Technol. 2024, 56, 381–402. [Google Scholar] [CrossRef]
  90. Fotios, S.A.; Houser, K.W. Using Forced Choice Discrimination to Measure the Perceptual Response to Light of Different Characteristics. Leukos 2013, 9, 245–259. [Google Scholar] [CrossRef]
  91. Royer, M.; Houser, K.; Durmus, D.; Esposito, T.; Wei, M. Recommended Methods for Conducting Human Factors Experiments on the Subjective Evaluation of Colour Rendition. Light. Res. Technol. 2022, 54, 199–236. [Google Scholar] [CrossRef]
  92. Spitschan, M. Photoreceptor Inputs to Pupil Control. J. Vis. 2019, 19, 5. [Google Scholar] [CrossRef]
  93. Legras, R.; Gaudric, A.; Woog, K. Distribution of Cone Density, Spacing and Arrangement in Adult Healthy Retinas with Adaptive Optics Flood Illumination. PLoS ONE 2018, 13, e0191141. [Google Scholar] [CrossRef]
  94. Sagawa, K.; Takeichi, K. Spectral Luminous Efficiency Functions for a Ten-Degree Field in the Mesopic Range. J. Light Vis. Environ. 1983, 7, 37–44. [Google Scholar] [CrossRef]
  95. Schanda, J.; Morren, L.; Rea, M.; Rositani-Ronchi, L.; Walraven, P. Does Lighting Need More Photopic Luminous Efficiency Functions? Light. Res. Technol. 2002, 34, 69–76. [Google Scholar] [CrossRef]
  96. Fan, S.; Zhang, X.; Gu, X.; Shen, H.; Liu, M. Influence of Pulse Width on Luminous Efficiency for a Two-Degree Field. Light. Res. Technol. 2017, 49, 357–369. [Google Scholar] [CrossRef]
  97. Li, J.; Ohno, Y. Characterizing the Accuracy of the Current CIE-Standard and Cone-Fundamental-Based Spectral Luminous Efficiency Functions Based on Achromatic Brightness Matches. In Proceedings of the 2024 IEEE Sustainable Smart Lighting World Conference & Expo (LS24), Eindhoven, The Netherlands, 12 November 2024; pp. 1–4. [Google Scholar]
  98. Palmer, D.A. Standard Observer for Large-Field Photometry at Any Level. J. Opt. Soc. Am. 1968, 58, 1296. [Google Scholar] [CrossRef] [PubMed]
  99. Chapiro, A.; Kunkel, T.; Atkins, R.; Daly, S. Influence of Screen Size and Field of View on Perceived Brightness. ACM Trans. Appl. Percept. 2018, 15, 1–13. [Google Scholar] [CrossRef]
  100. Lim, K.; Li, X.; Tu, Y. Dependence of Perceived Display Brightness on Peripheral Vision Luminance and Field of View: A Comparison Study. J. Soc. Inf. Disp. 2019, 27, 715–722. [Google Scholar] [CrossRef]
  101. Stevens, S.S. On the Psychophysical Law. Psychol. Rev. 1957, 64, 153. [Google Scholar] [CrossRef]
  102. Seim, T.; Valberg, A. A Neurophysiologically-based Analysis of Lightness and Brightness Perception. Color Res. Appl. 2016, 41, 339–351. [Google Scholar] [CrossRef]
  103. Arend, L.E.; Goldstein, R. Simultaneous Constancy, Lightness, and Brightness. J. Opt. Soc. Am. A 1987, 4, 2281–2285. [Google Scholar] [CrossRef]
  104. Purves, D.; Williams, S.M.; Nundy, S.; Lotto, R.B. Perceiving the Intensity of Light. Psychol. Rev. 2004, 111, 142–158. [Google Scholar] [CrossRef]
  105. Rosas, E.; Estrada-Hernández, A. Effect of Photometric Detector Spectral Response Quality on White LED Spectral Mismatch Correction Factors. Appl. Opt. 2016, 55, 5267. [Google Scholar] [CrossRef]
  106. de Vries, A.; Heynderickx, I.; de Kort, Y. From Luminance to Brightness: A Data-Driven Approach to Support Brightness Assessments in Open Plan Offices. Light. Res. Technol. 2022, 54, 798–818. [Google Scholar] [CrossRef]
  107. Wooten, B.R.; Fuld, K.; Spillmann, L. Photopic Spectral Sensitivity of the Peripheral Retina. J. Opt. Soc. Am. 1975, 65, 334–342. [Google Scholar] [CrossRef]
  108. Owsley, C.; Ghate, D.; Kedar, S. Vision and Aging. In The Wiley Handbook on the Aging Mind and Brain; Rizzo, M., Anderson, S., Fritzsch, B., Eds.; Wiley: Hoboken, NJ, USA, 2018; pp. 296–314. ISBN 978-1-118-77177-8. [Google Scholar]
  109. Preciado, O.U.; Martin, A.; Manzano, E.; Smet, K.A.G.; Hanselaer, P. CAM18sl Brightness Prediction for Unrelated Saturated Stimuli Including Age Effects. Opt. Express 2021, 29, 29257. [Google Scholar] [CrossRef]
  110. McCourt, M.E.; Leone, L.M.; Blakeslee, B. Brightness Induction and Suprathreshold Vision: Effects of Age and Visual Field. Vis. Res. 2015, 106, 36–46. [Google Scholar] [CrossRef]
  111. Huang, M.; Wang, Y.; Wei, M.; Li, Y.; Gao, X.; Li, X. Effect of Observer Age and Stimulus Size on the Performance of CIE Color Matching Functions. Opt. Express 2022, 30, 16973–16986. [Google Scholar] [CrossRef]
  112. Sarkar, A.; Autrusseau, F.; Viénot, F.; Le Callet, P.; Blondé, L. From CIE 2006 Physiological Model to Improved Age-Dependent and Average Colorimetric Observers. J. Opt. Soc. Am. A 2011, 28, 2033–2048. [Google Scholar] [CrossRef]
  113. Asano, Y.; Fairchild, M.D.; Blondé, L. Individual Colorimetric Observer Model. PLoS ONE 2016, 11, e0145671. [Google Scholar] [CrossRef]
  114. Martinsons, C.; Behar-Cohen, F.; Bergen, T.; Blattner, P.; Herf, M.; Gronfier, C.; Houser, K.; Jost, S.; Nilsson Tengelin, M.; Obein, G. Reconsidering the Spectral Distribution of Light: Do People Perceive Watts or Photons? Light. Res. Technol. 2024, 56, 886–899. [Google Scholar] [CrossRef]
  115. Morimoto, T.; Smithson, H.E. Discrimination of Spectral Reflectance under Environmental Illumination. J. Opt. Soc. Am. A 2018, 35, B244. [Google Scholar] [CrossRef]
  116. Lasauskaite Schüpbach, R.; Reisinger, M.; Schrader, B. Influence of Lighting Conditions on the Appearance of Typical Interior Materials. Color Res. Appl. 2015, 40, 50–61. [Google Scholar] [CrossRef]
  117. Durmus, D. Differences in Spectral Reflectance Functions of Natural and Artificial Surfaces. In Proceedings of the Optica Advanced Photonics Congress 2022, Maastricht, The Netherlands, 24–28 July 2022; Optica Publishing Group: Washington, DC, USA, 2022; p. JW3A.24. [Google Scholar]
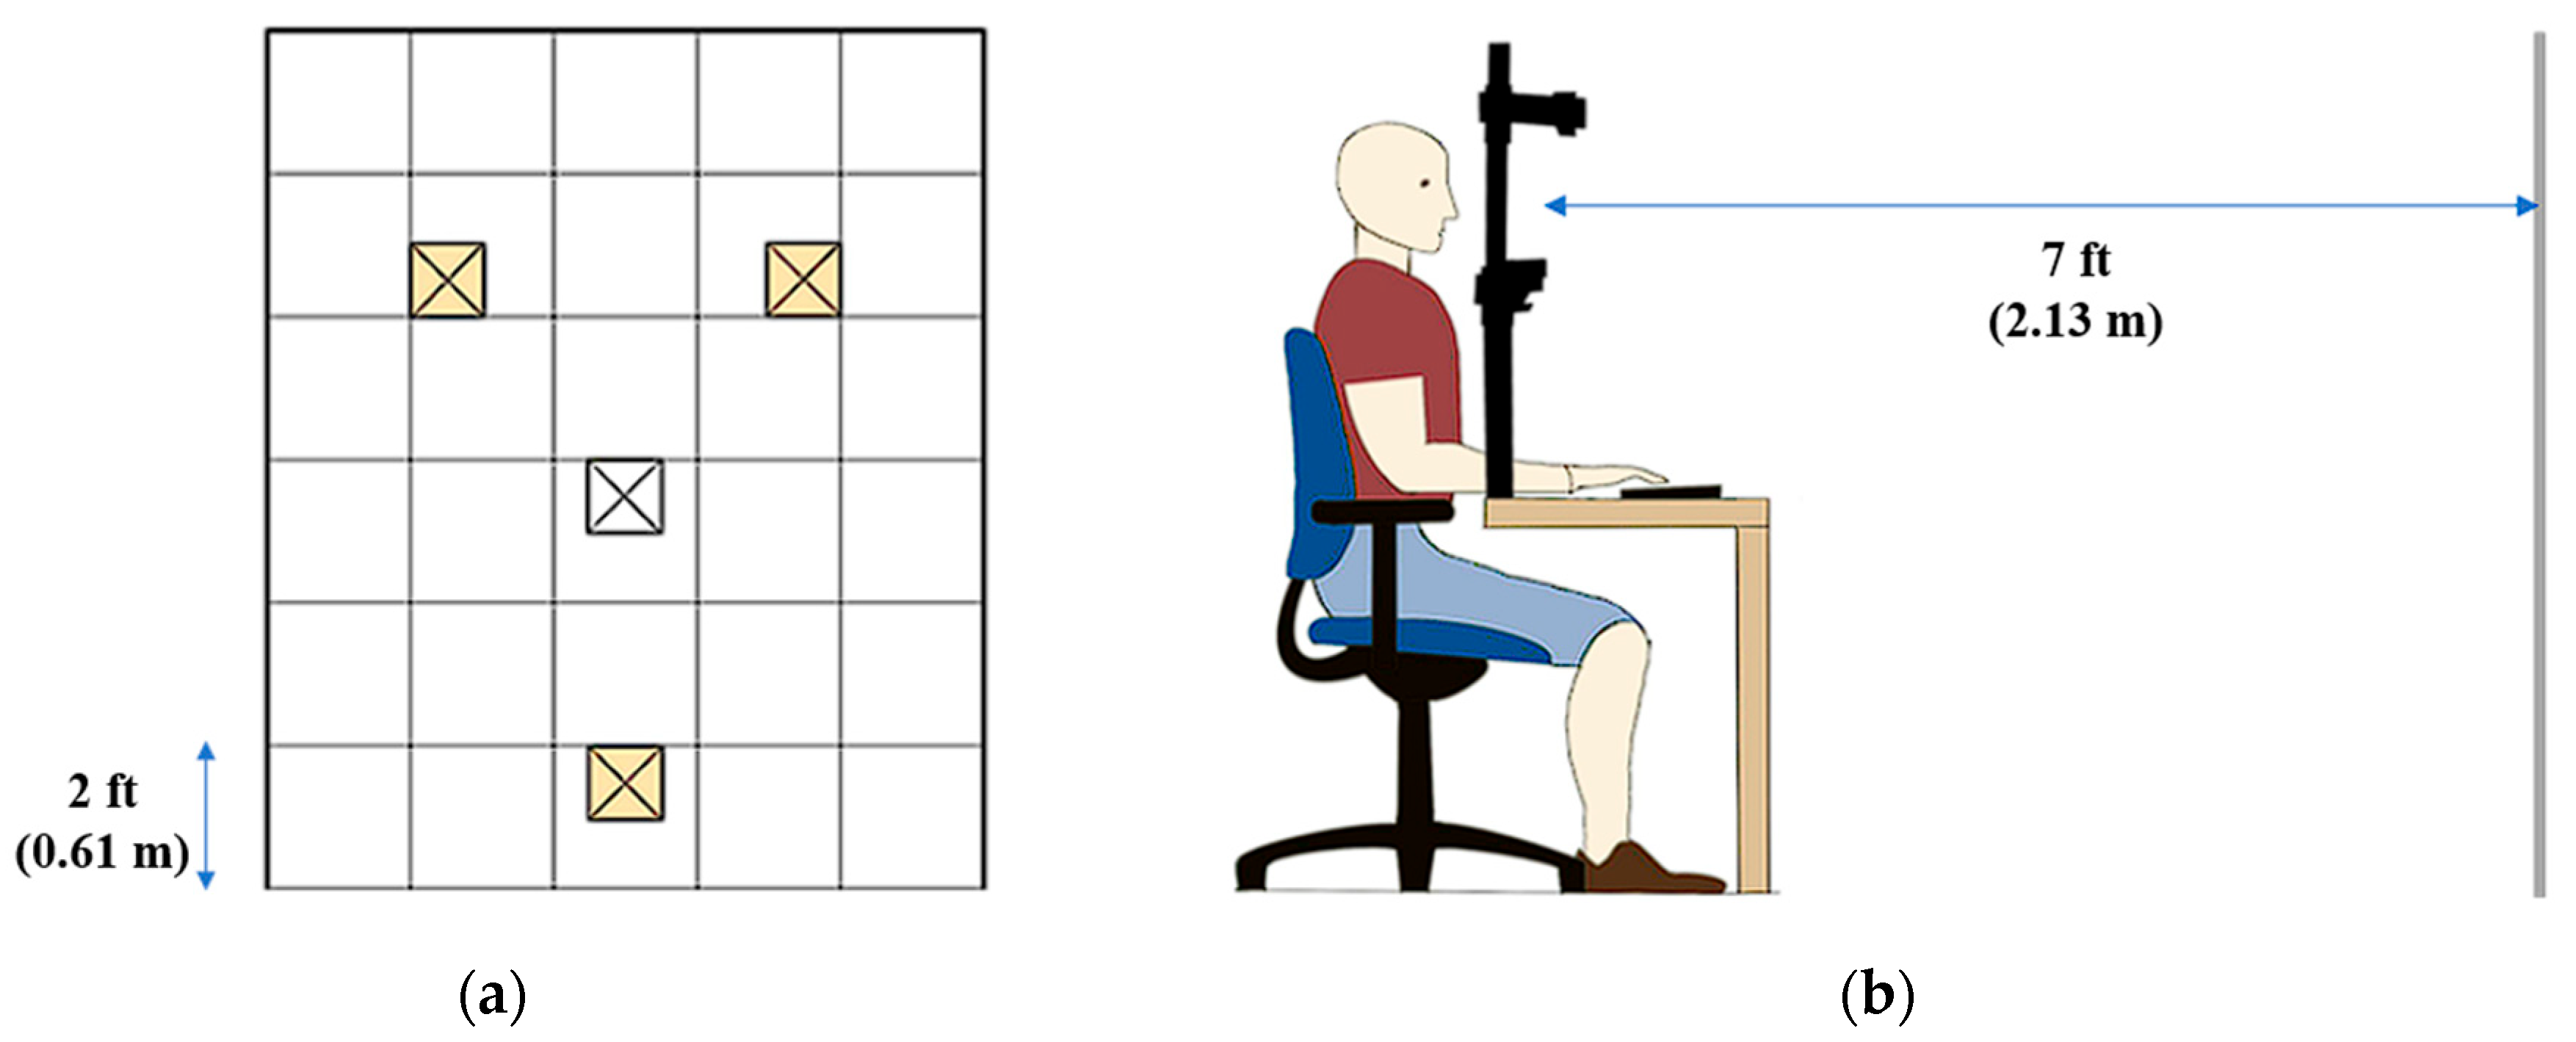
Figure 1. (a) The reflected ceiling plan shows luminaire locations that were used to generate the stimuli (yellow squares) and unused luminaire (white square); (b) elevation view of participants’ seating arrangement.
Buildings 15 03510 g001
Figure 2. Participants’ field of view was stabilized using a chinrest.
Buildings 15 03510 g002
Figure 3. The spectral power distribution of the tunable LED light source used to generate the stimuli. The legend shows the nominal LED names and peak wavelengths or CCT in parenthesis. DE = direct emitting. PC = phosphor converted.
Buildings 15 03510 g003
Figure 4. Experimental procedure showing the order of stimuli exposure and transition durations.
Buildings 15 03510 g004
Figure 5. Mean percentage of “brighter” choices at 2700 K for alternative luminous efficiency functions (V10(λ), VF(λ), VF,10(λ)) at each illuminance level. A value of 50% indicates random guessing (i.e., V(λ) predicts spatial brightness). Values below 50% imply no functions predict spatial brightness, whereas values above 50% indicate the alternative function performs better. The error bars represent the standard error of the mean (SEM).
Buildings 15 03510 g005
Figure 6. Mean percentage of “brighter” choices at 4000 K for alternative luminous efficiency functions (V10(λ), VF(λ), VF,10(λ)) at each illuminance level. A value of 50% indicates random guessing (i.e., V(λ) predicts spatial brightness). Values below 50% imply no function predicts spatial brightness, whereas values above 50% indicate the alternative function performs better. The error bars represent the standard error of the mean (SEM).
Buildings 15 03510 g006
Figure 7. Mean percentage of “brighter” choices at 6000 K for alternative luminous efficiency functions (V10(λ), VF(λ), VF,10(λ)) at each illuminance level. A value of 50% indicates random guessing (i.e., V(λ) predicts spatial brightness). Values below 50% imply no function predicts spatial brightness, whereas values above 50% indicate the alternative function performs better. The error bars represent the standard error of the mean (SEM).
Buildings 15 03510 g007
Figure 8. Mean brightness responses for all CCTs excluding null conditions. The error bars represent the standard error of the mean (SEM). Yellow represents 2700 K. Green represents 4000 K. Blue represents 6000 K. Round represents V10(λ). Triangle represents VF(λ). Rectangle represents VF,10(λ).
Buildings 15 03510 g008
Figure 9. The combined brightness response distribution excluding null conditions for all CCTs and illuminance levels. Horizontal blue dashed line indicates 50% chance level (random guess) in brightness responses, where V(λ) predicts brightness. The x represents the mean and the horizontal black line within each boxplot represents the median.
Buildings 15 03510 g009
Table 1. Summary of the experimental protocols of studies investigating spatial brightness.
StudyParticipantProtocolExperimental Conditions
nAgeTrainingNullCCT MatchedEv MatchedV(λ) ComparedMethodApparatusFOVObjects
[45]1018–25- 1N/A 2N/AN/ANoRatingRoomFullNo
[46]7320–50-NoNoN/AYesMatchingScreen15° × 20°No
[48]1217–25-NoNoNoNo2AFC 3RoomFullNo
[60]3318–30-YesYesYesNo2AFCRoomFullNo
[61]28-YesN/AN/AN/ANoRatingRoomFullYes
[65]4020–63-YesYesYesNo2AFCBooth-No
[66]4219–56YesN/ANoN/ANo2AFCRoomFullNo
[67]1222–53-NoNoNoNo2AFCBooth100°No
[68]12--NoNoNoNo2AFCBooth-No
[69]1218–36-NoYesYesNoRatingBooth34°Yes
[70]10--NoNoNoNo2AFCBooth18°Yes
[71]1022–33-NoNoYesNo2AFCBooth100°No
[72]---NoNoNoNoRatingBooth-Yes
[73]4820–25-N/ANoYesNoRatingRoomFullYes
[74]1519–55-N/ANoYesNoRatingRoomFullYes
[75]29--N/ANoYesNo2AFCRoomFullYes
[76]56--N/AYesYesNoRatingRoomFullYes
[77]3018–36-N/AYesYesNoRatingBooth80°Yes
1 not reported; 2 not applicable (N/A); 3 two-alternative forced choice (2AFC). For a summary of the brightness judgment methods, see [25].
Table 2. Stimuli generated to compare the standard observer V(λ) with VF(λ) at 4000 K.
Target Tcp (K)Target Ev,1924 (lx)Scene (Pair)Ev (lx)Ev,F (lx)Egap (lx)ΔEgap (lx)Measured Tcp (K)uv
4000 K50A (1)49.9753.943.971.694003.50.22510.5014
B (1)49.9752.252.284003.50.22530.5011
100A (2)99.99107.067.072.703998.80.22510.5017
B (2)99.94104.314.373999.50.22510.5016
300A (3)299.94317.6817.744.664005.80.22480.5019
B (3)300.07313.8713.084004.90.22500.5015
Table 3. Repeated-measures ANOVA results comparing the aggregated brightness responses.
ComparisonMean Dif.95% CI of Diff.Below ThresholdSummaryAdjusted p Value
V(λ) vs. V10(λ)34.88−6.140 to 75.90NoNs0.115
V(λ) vs. VF(λ)26.18−9.388 to 61.75NoNs0.204
V(λ) vs. VF,10(λ)−0.0216−0.0411 to −0.0021Yes*0.025
* Represents statistical significance at p ≤ 0.05.
Disclaimer/Publisher’s Note: The statements, opinions and data contained in all publications are solely those of the individual author(s) and contributor(s) and not of MDPI and/or the editor(s). MDPI and/or the editor(s) disclaim responsibility for any injury to people or property resulting from any ideas, methods, instructions or products referred to in the content.