Article

Computational Fluid Dynamics Approach to Aeroelastic Stability in Cable-Stayed Bridges

1
Civil Engineering and Environmental Laboratory, Djilllali Liabes University, Sidi Bel Abbès 22000, Algeria
2
Laboratoire des Structures et Matériaux Avancées dans le Génie Civil et Travaux Publics, Djilllali Liabes University, Sidi Bel Abbès 22000, Algeria
3
Institute of Structural Mechanics (ISM), Bauhaus-Universität Weimar, 99423 Weimar, Germany
4
Guangdong Provincial Key Lab. of Durability for Marine Civil Engineering, Shenzhen University, Shenzhen 518060, China
5
Civil Engineering Department, Faculty of Engineering, Kafrelsheikh University, Kafr El Sheikh 33516, Egypt
*
Author to whom correspondence should be addressed.
Buildings 2025, 15(19), 3509; https://doi.org/10.3390/buildings15193509
Submission received: 2 September 2025 / Revised: 23 September 2025 / Accepted: 26 September 2025 / Published: 28 September 2025
(This article belongs to the Section Building Structures)

Abstract

Long-span cable-supported bridges, such as cable-stayed and suspension bridges, are highly sensitive to wind-induced effects due to their flexibility, low damping, and relatively light weight. Aerodynamic analysis is therefore essential in their design and safety assessment. This study examines the aeroelastic stability of the Oued Dib cable-stayed bridge in Mila, Algeria, with emphasis on vortex shedding, galloping, torsional divergence, and classical flutter. A finite element modal analysis was carried out on a three-dimensional model to identify natural frequencies and mode shapes. A two-dimensional deck section was then analyzed using Computational Fluid Dynamics (CFD) under a steady wind flow of U = 20 m/s and varying angles of attack (AoA) from −10° to +10°. The simulations employed a RANS k-ω SST turbulence model with a wall function of Y+ = 30. The results provided detailed airflow patterns around the deck and enabled the evaluation of static aerodynamic coefficients—drag (CD), lift (CL), and moment (CM)—as functions of AoA. Finally, the bridge’s aeroelastic performance was assessed against the four instabilities. The findings indicate that the Oued Dib Bridge remains stable under the design wind conditions, although fatigue due to vortex shedding requires further consideration.

1. Introduction

Long-span cable-supported bridges, such as cable-stayed and suspension bridges, are essential components of modern transportation networks. However, their inherent flexibility, low damping, and relatively light weight make them highly susceptible to wind-induced instabilities [1,2,3]. Among these, vortex shedding, galloping, torsional divergence, and flutter are the most critical, as they can lead to severe serviceability problems or even catastrophic failures [4,5,6]. For this reason, aerodynamic and aeroelastic analyses play a pivotal role in the design and safety evaluation of such bridges.
The vulnerability of long-span bridges to wind has been tragically demonstrated throughout history. One of the earliest recorded failures was the Dryburgh Abbey Bridge in Scotland (1818), where the cables gave way during a storm. This was not an isolated case: the Brighton Chain Pier in England (1836) and the Tay Bridge in Scotland (1879) both collapsed under wind loads, with the latter disaster claiming the lives of 80 people. The most dramatic failure, however, was the Tacoma Narrows Bridge in the United States (1940), whose violent oscillations and spectacular collapse were captured on film, shocking engineers and the public alike [7].
The catastrophic collapse of the Tacoma Narrows Bridge in 1940 [8,9,10,11,12] dramatically exposed the destructive potential of aerodynamic instabilities and marked the beginning of bridge wind engineering as a distinct research discipline. In the 1970s, Scanlan advanced the field with his hybrid time–frequency self-excited force theory for flutter analysis [13,14,15,16,17], which provided a rigorous framework for quantitative research. While this theory greatly improved predictive capability, it relied on small-amplitude and linearity assumptions, limiting its accuracy for real-world nonlinear behavior. Subsequent studies revealed a distinct nonlinear flutter mechanism termed soft flutter [18,19,20,21,22,23], characterized by non-catastrophic limit cycle oscillations (LCOs) that appear once the critical flutter speed is exceeded. In this regime, vibrations stabilize into oscillations whose amplitudes gradually increase with wind speed, rather than diverging catastrophically. Associated Hopf bifurcation phenomena were also documented [24], providing deeper insight into the nonlinear dynamics of aeroelastic instabilities. Building on these findings, several nonlinear self-excited force models were proposed to capture both soft flutter and bifurcation behavior. To address limitations such as spurious numerical modes in certain frequency-domain formulations, researchers later developed time-domain self-excited force models [25,26,27]. These advanced formulations demonstrated high fidelity in reproducing experimental vibration histories, confirming their effectiveness for simulating complex nonlinear aeroelastic responses in long-span bridges.
Prior to the Tacoma failure, aeroelastic studies had been largely confined to aeronautics. Unlike streamlined aircraft wings, however, bridge decks are bluff bodies, generating separated flows and vortex shedding that cannot be described by classical aerodynamic theories. This realization motivated pioneering works by Bleich [28], Bisplinghoff and Ashley [29], and Scanlan and Tomko [30], who laid the foundations of modern bridge aerodynamics. Complementing these theoretical advances, wind tunnel testing and, more recently, Computational Fluid Dynamics (CFD) have become indispensable tools for investigating flow–structure interactions and for deriving static and dynamic aerodynamic coefficients of bridge decks with greater accuracy.
In Algeria, the demand for modern transportation infrastructure has led to the construction of landmark cable-stayed bridges. The Oued Dib Bridge, inaugurated in 2001, was the country’s first of its kind, spanning 502 m across the Béni-Haroun reservoir with a main span of 280 m. A second example, the Salah Bey Bridge in Constantine (2014), further illustrates the growing national reliance on this bridge type. Among these, the Oued Dib Bridge stands out as an ideal case study: its relatively non-streamlined deck geometry and exposure to strong regional winds make it particularly relevant for aeroelastic investigations.
This research aims to assess the aeroelastic stability of the Oued Dib Bridge under representative wind conditions. The study proceeds in three stages:
  • Modal analysis of a finite element (FE) model to determine natural frequencies and mode shapes.
  • CFD simulations of a two-dimensional deck section, subjected to a steady wind speed U = 20 m/s and varying angles of attack (AoA) from −10° to +10°, using the RANS k-ω SST turbulence model with a wall function Y+ = 30.
  • Aeroelastic assessment of the structure against the four principal instability mechanisms—vortex shedding, galloping, torsional divergence, and classical flutter—using the static aerodynamic coefficients (CD, CL, CM) derived from CFD.
The overall framework of this research is illustrated in the flowchart presented in Figure 1.
The novelty of this work lies in providing the first comprehensive aeroelastic study of Algeria’s inaugural cable-stayed bridge, combining structural modal analysis and CFD to evaluate stability limits of a bluff-body deck geometry. Unlike most studies that focus on streamlined bridge sections, this research addresses the specific challenges posed by non-profiled decks and offers new insights into the applicability of CFD for predicting their aeroelastic performance. The findings not only deepen the understanding of wind resistance in the Oued Dib Bridge but also contribute to the broader field of long-span bridge aerodynamics, where computational approaches are progressively complementing and extending traditional experimental methods.

2. Bridge Description

The Oued Dib cable-stayed bridge, located near Mila in Algeria, was built to connect the cities of Constantine and Jijel. In service since 2001, the bridge crosses Lake Béni-Haroun, the largest dam in the country. It has a total length of 502 m, comprising three spans: a main span of 280 m and two side spans of 111 m each (Figure 2).
The prestressed concrete deck measures 13.3 m in width and 2.04 m in depth (Figure 3). It carries a two-lane roadway with a width of 10.50 m, flanked by two sidewalks of 1.05 m each, and finished with two edge strips of 0.35 m. The bridge is supported by two H-frame reinforced concrete pylons, with heights of 110 m (west pylon) and 140 m (east pylon), of which 60 m rise above the deck level (Figure 4). The free clearance between the deck and the maximum water level is 25 m.
The deck is supported by a system of stay cables arranged in a semi-fan configuration, anchored at the tops of the towers. A total of 88 stay cables were installed: 44 supporting the main span and 22 for each side span. In addition, three pairs of back stays connect each pylon head to the adjacent abutments for stability. The cables are composed of steel bars with a diameter of 7 mm, with cross-sectional areas varying between 22.5 cm2 and 55.5 cm2.

3. Modal Analysis

The modal analysis is very important for the study of aerodynamic stability of the bridge. It was conducted using a finite element model. A linear model is able to reproduce the dynamic complex behavior of the bridge with a very good precision [31,32]. The material properties adopted for the bridge structure are presented in Table 1.
The deck was modeled using beam elements with offset rigid links to represent the cable anchor points (Figure 5). The mass of the deck was calculated as the sum of its self-weight and the superimposed dead load, yielding m = 21,540 Kg/m.
The cable-stay elements were modeled as straight chord members, with an equivalent modulus of elasticity (Eeq) determined using Ernst’s formula [33]:
E e q = E 1 + γ L x 2 E 12 T / A 3
where Eeq = 190 GPa, E is the elastic modulus of the cable material (E = 210 GPa), γ is the specific weight of the cable material, Lx is the horizontal length of the chord, T is the cable tension force, and A is its cross-sectional area.
The towers were modeled using frame elements with varying cross-sections, as illustrated in Figure 4. The concrete pipe-section piers were assumed to be fully fixed at their bases in all degrees of freedom. At the deck–tower connections, elastomeric bearings were represented by link elements. Their stiffness values—Kx in the longitudinal direction, Kz in the vertical direction, and Kθ in rotation about the y-axis—were defined in accordance with European Standard EN 1337 [34], yielding Kx = 18 MN/m, Kz = 11,084 MN/m, and Kθ = 123 MN·m/rad. The deck rotation about the vertical axis was left free, while its lateral displacement and torsional rotation were restrained.
At the deck–abutment connections, rotation was allowed about the y- and z-axes but restrained about the x-axis. In terms of translation, the west abutment bearings were modeled as fixed, whereas the east abutment bearings were modeled as movable in the longitudinal direction.

3.1. Modal Frequencies

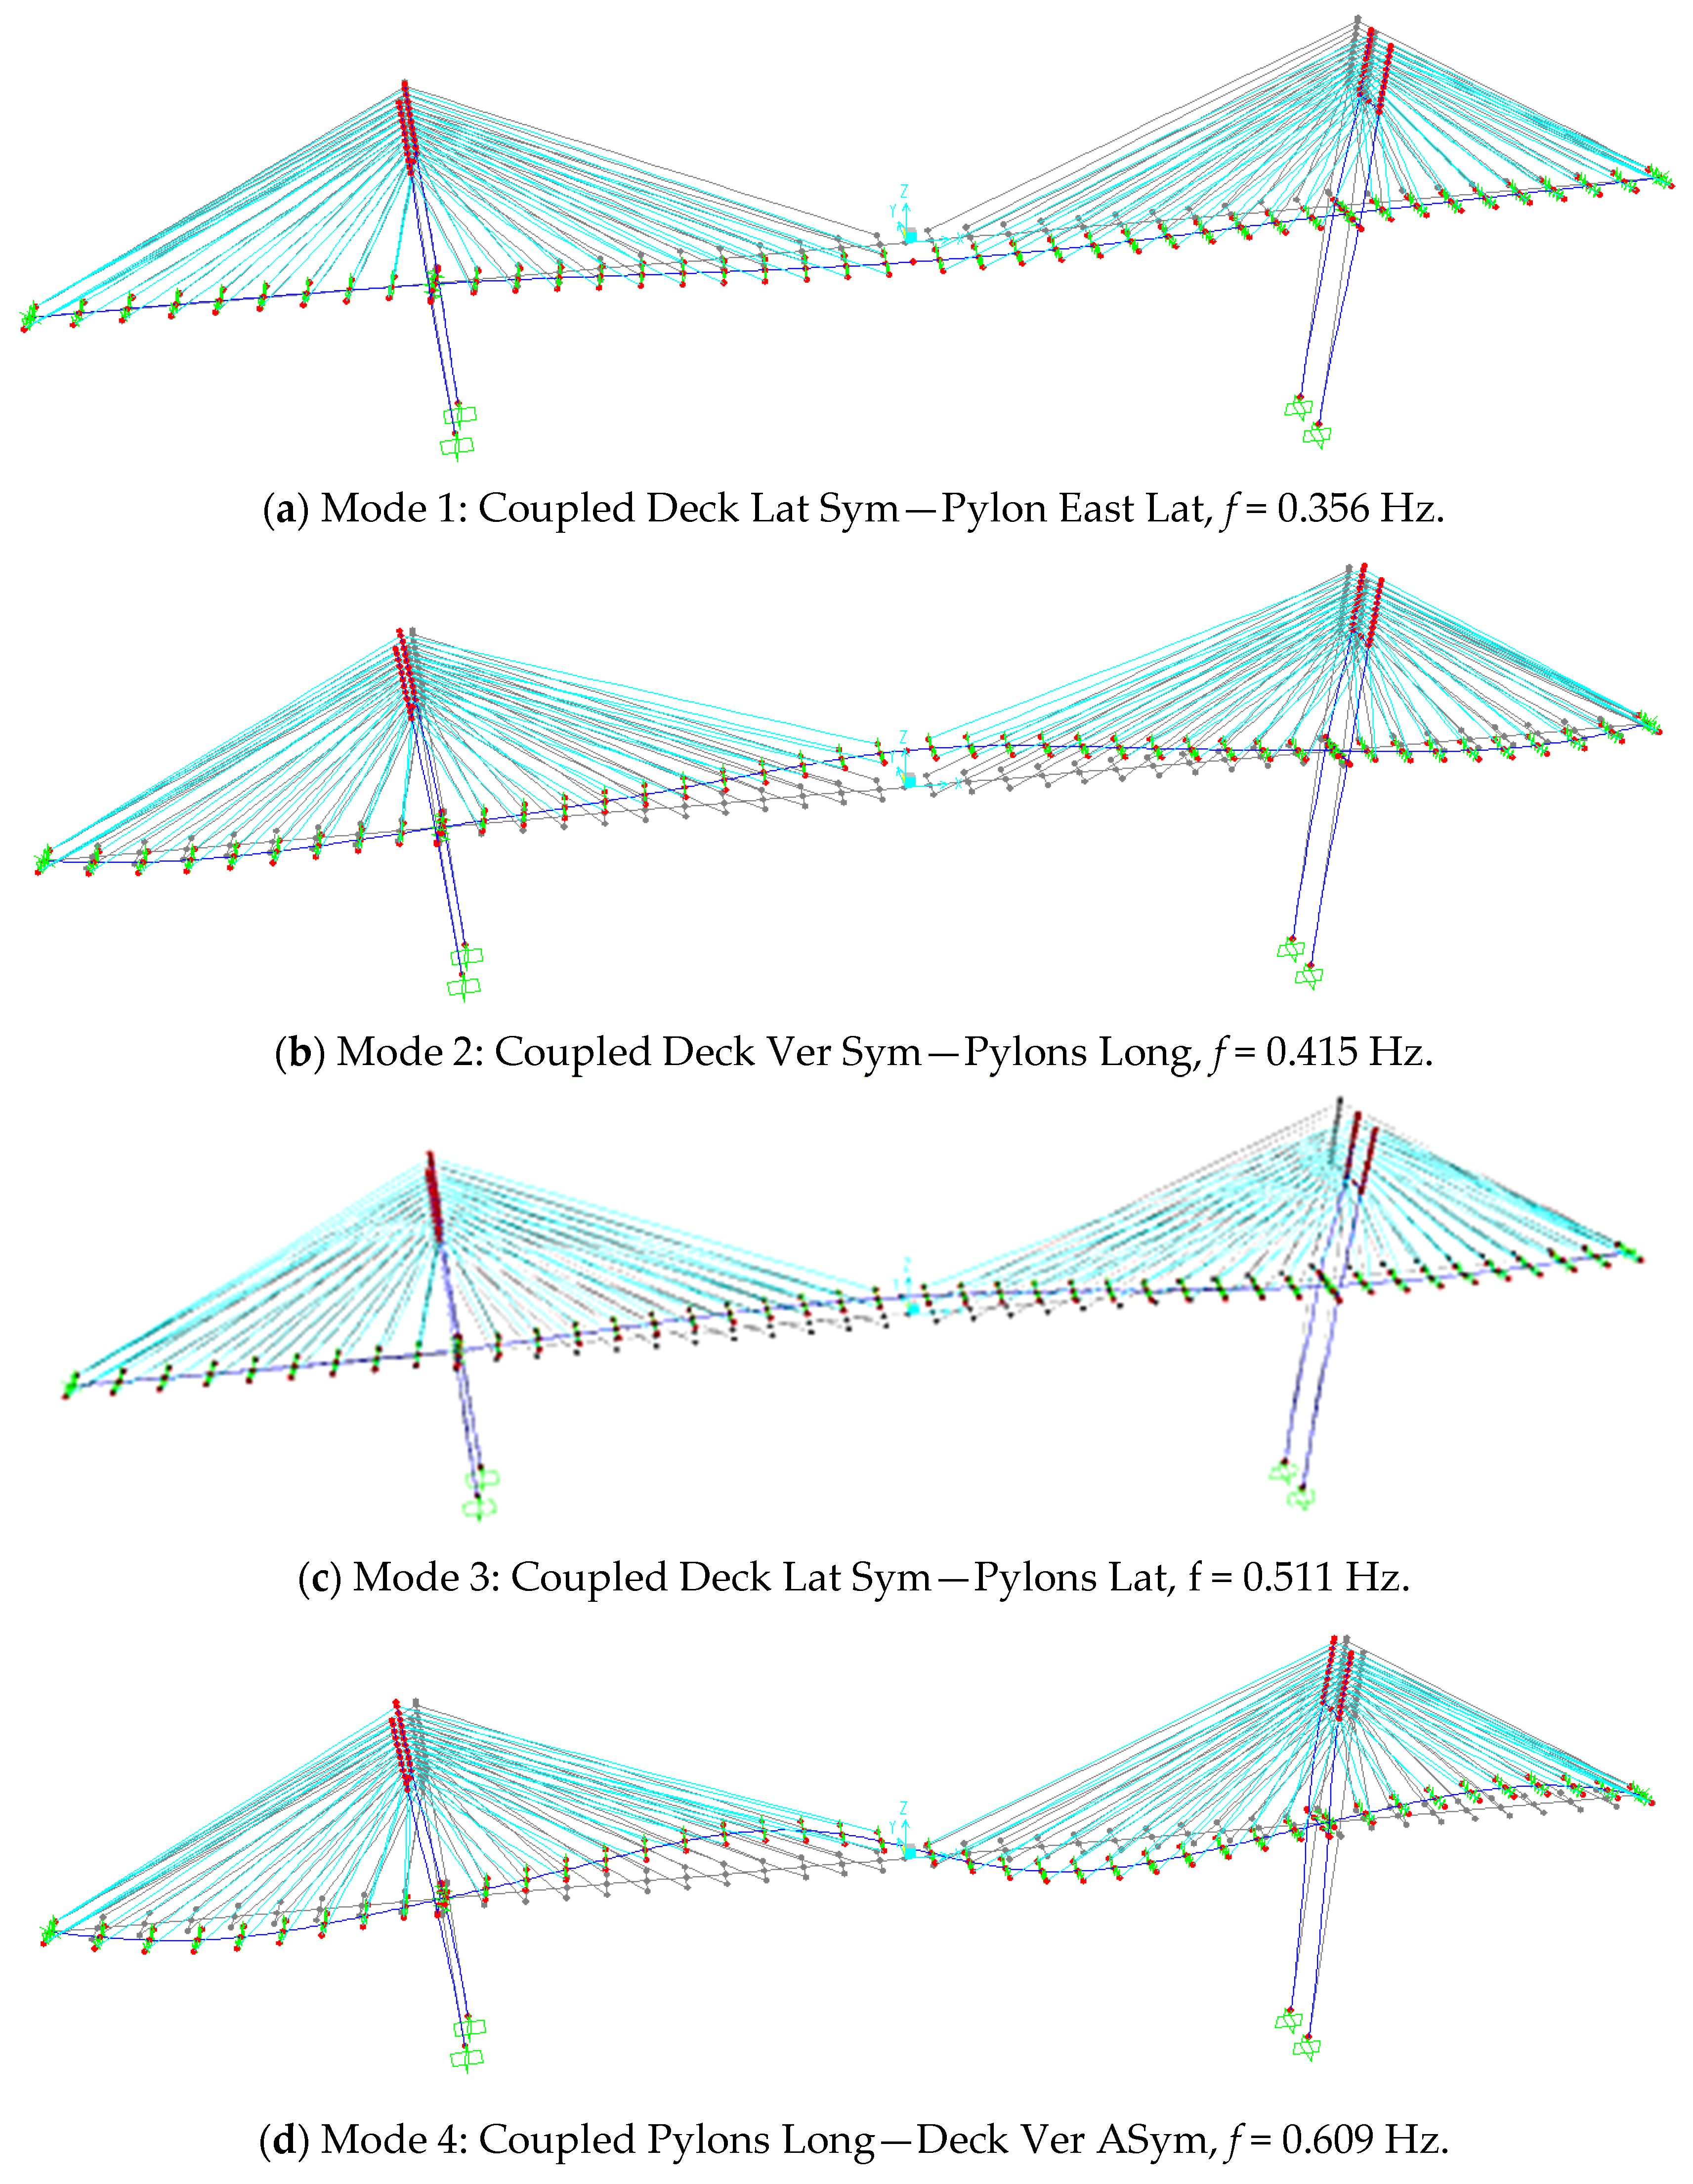
Table 2 presents the first twelve vibration modes, including their components, directions, and corresponding frequencies. Figure 6 illustrates the shapes of the first six modes, along with the twelfth mode, which represents the first torsional mode of the deck. As in most cable-stayed bridges, the Oued Dib bridge exhibits a strong coupling between the vibration modes of the deck and the motion of the tower–cable system [35].
The modal frequencies obtained in this study were compared with the results of ambient vibration tests conducted by Kibboua et al. [36]. A summary of this comparison is presented in Table 3, while Figure 7 provides a graphical illustration. The analytical model shows good agreement with the experimental results in the vertical direction, particularly for the first two modes. However, the finite element model exhibits greater flexibility in the lateral direction and increased rigidity in the longitudinal direction. This discrepancy can most plausibly be attributed to changes in the boundary conditions of the deck supports over the structure’s lifetime, likely caused by pathologies affecting one or more bearings.
The first three modal frequencies in the vertical, lateral, and torsional directions of the Oued Dib Bridge are compared with those of four other cable-stayed bridges (Table 4 and Figure 8): (1) Quincy Bayview Bridge [37], (2) Guanhe Bridge [38], (3) Vasco da Gama Bridge [39], and (4) the Second Severn Crossing [40]. These bridges were selected primarily for their similarity in deck material (concrete or composite concrete–steel) and their span length, which is comparable to that of the studied bridge.
Although the bridges are not identical, the comparison reveals a consistent modal behavior across the cases, with the notable exception of the Quincy Bayview Bridge, which exhibits greater lateral flexibility. Another key observation is that, for all five bridges, the torsional modes remain reasonably separated from the flexural modes. This aligns with general design recommendations for cable-stayed bridges, aimed at reducing the risk of coupled flutter involving two degrees of freedom. Such instabilities typically arise when the two modes are too closely spaced. For the bridges considered, the ratio between the torsional and flexural modes ranges from 1.4 to 1.7, with the Oued Dib Bridge exhibiting a ratio of 1.6. These values exceed the minimum recommended threshold of 1.4, as specified in the technical guidelines [41].

3.2. Vibration Mode Shapes

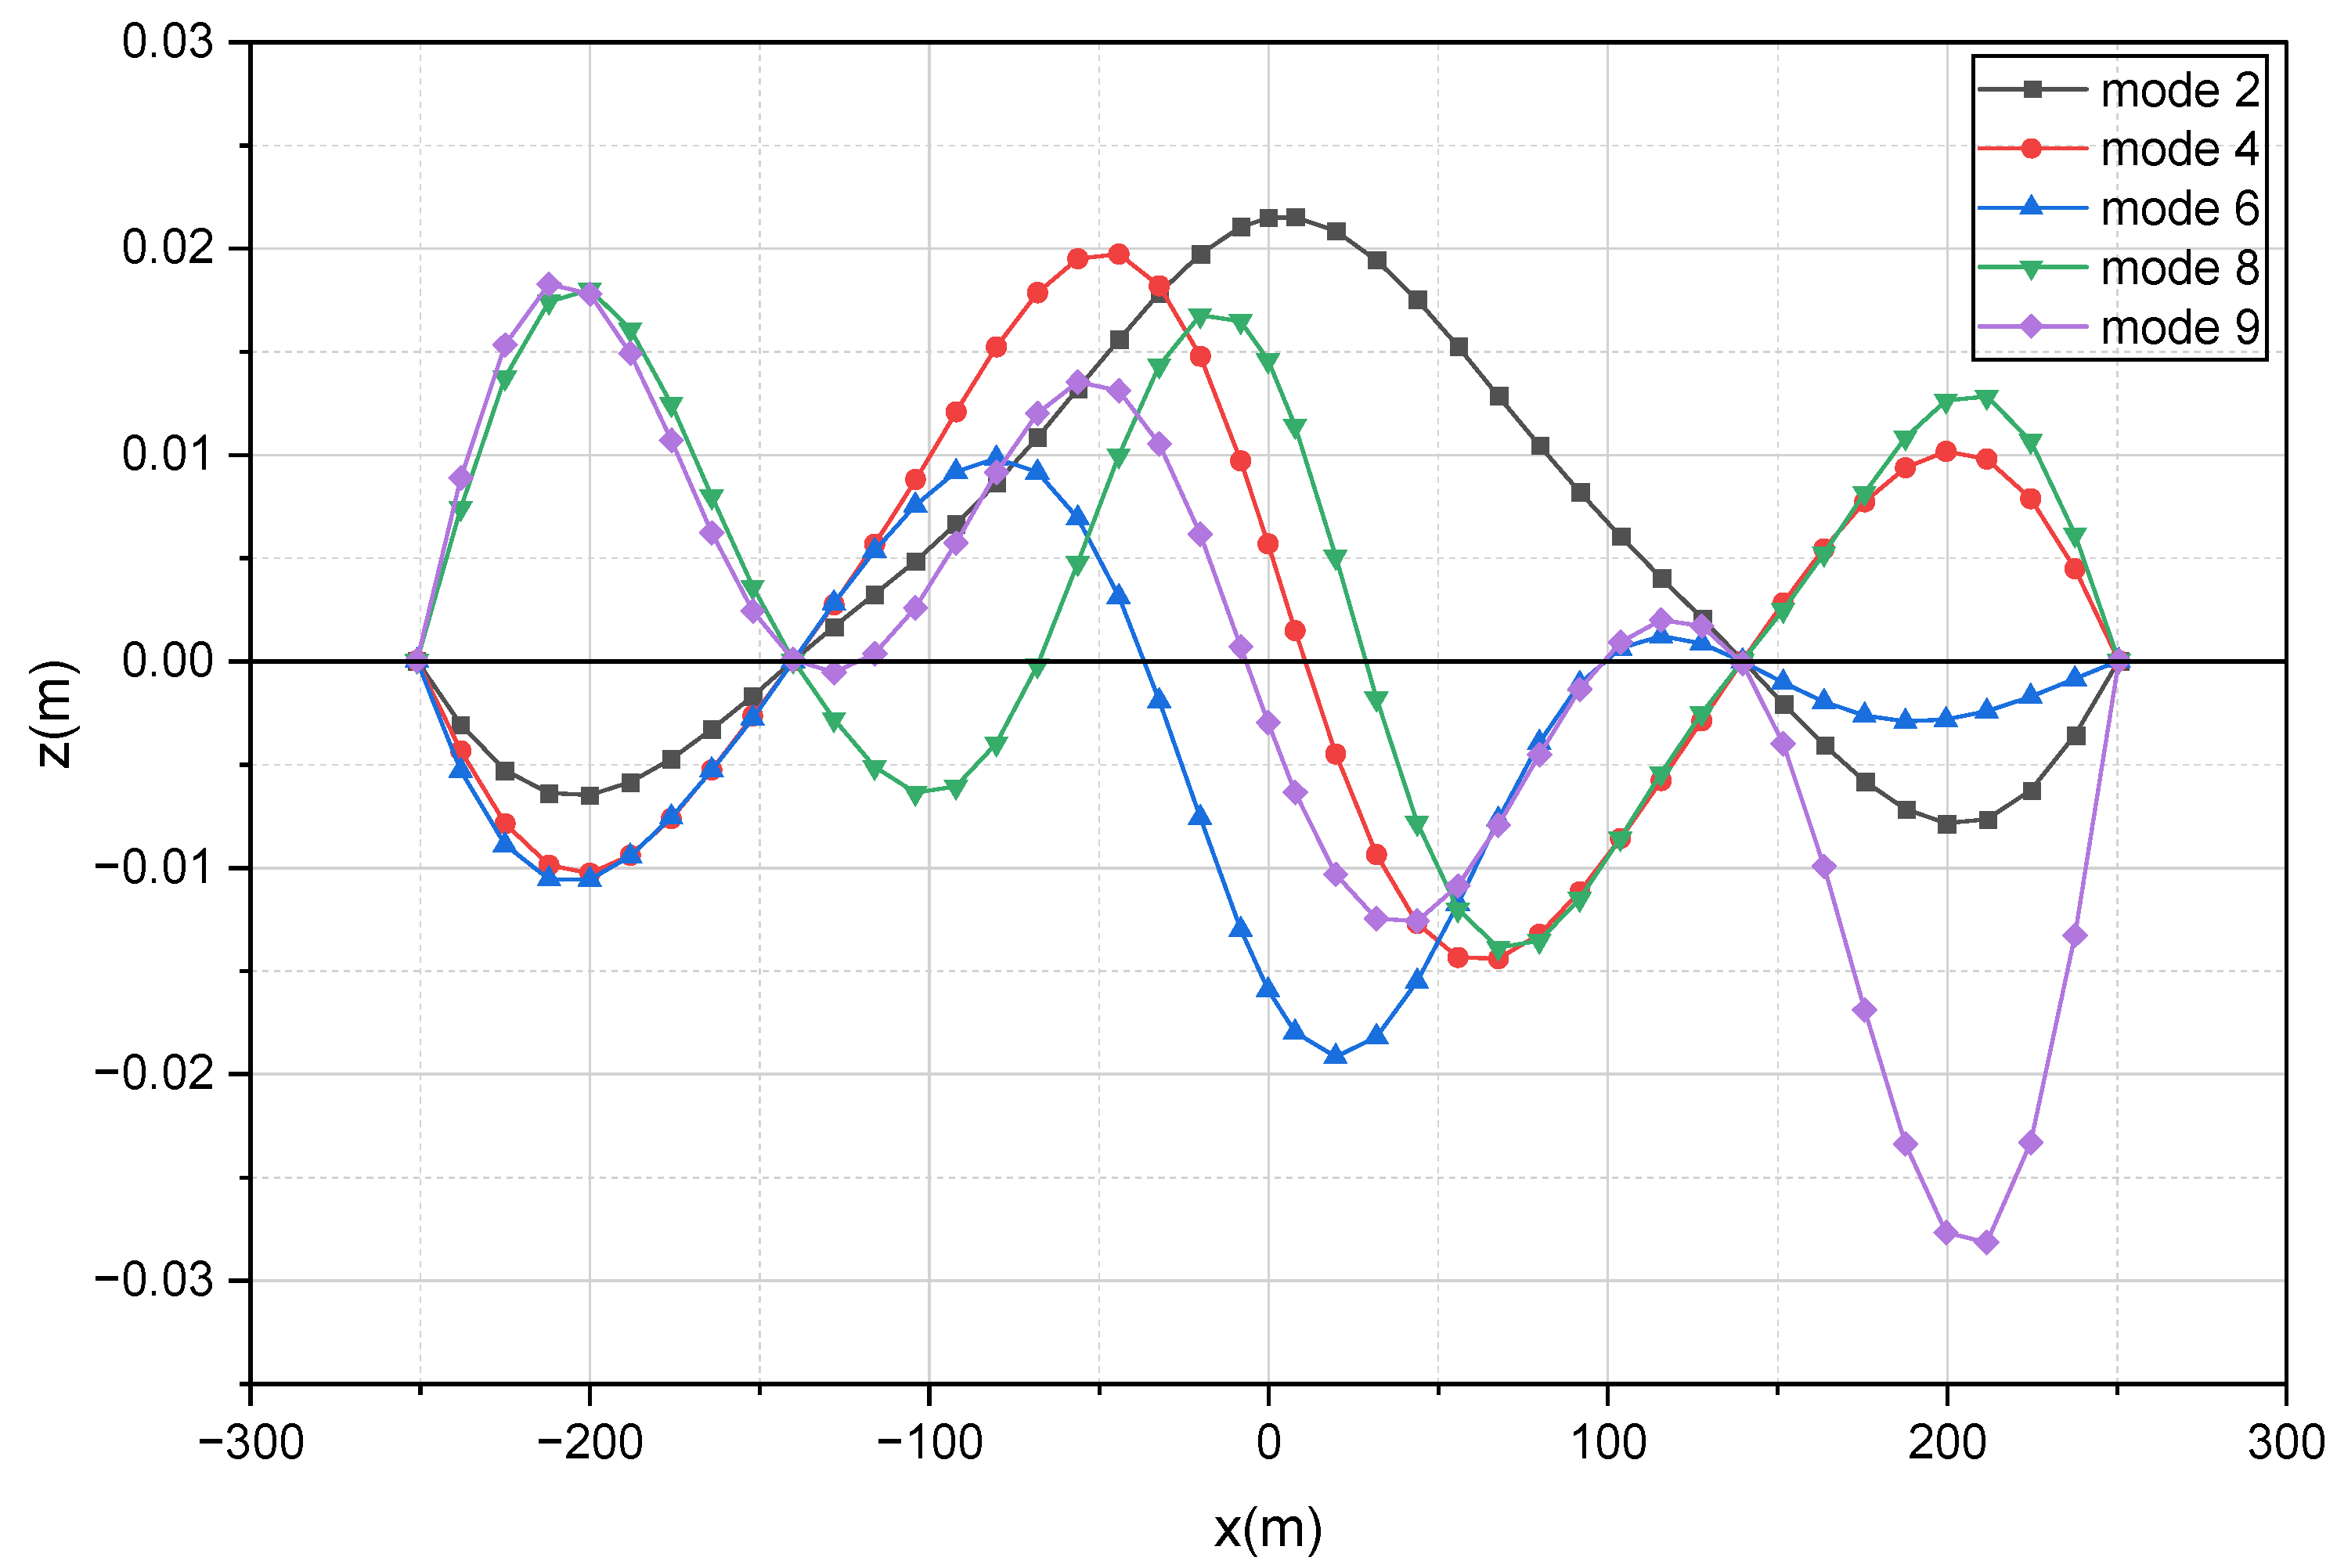
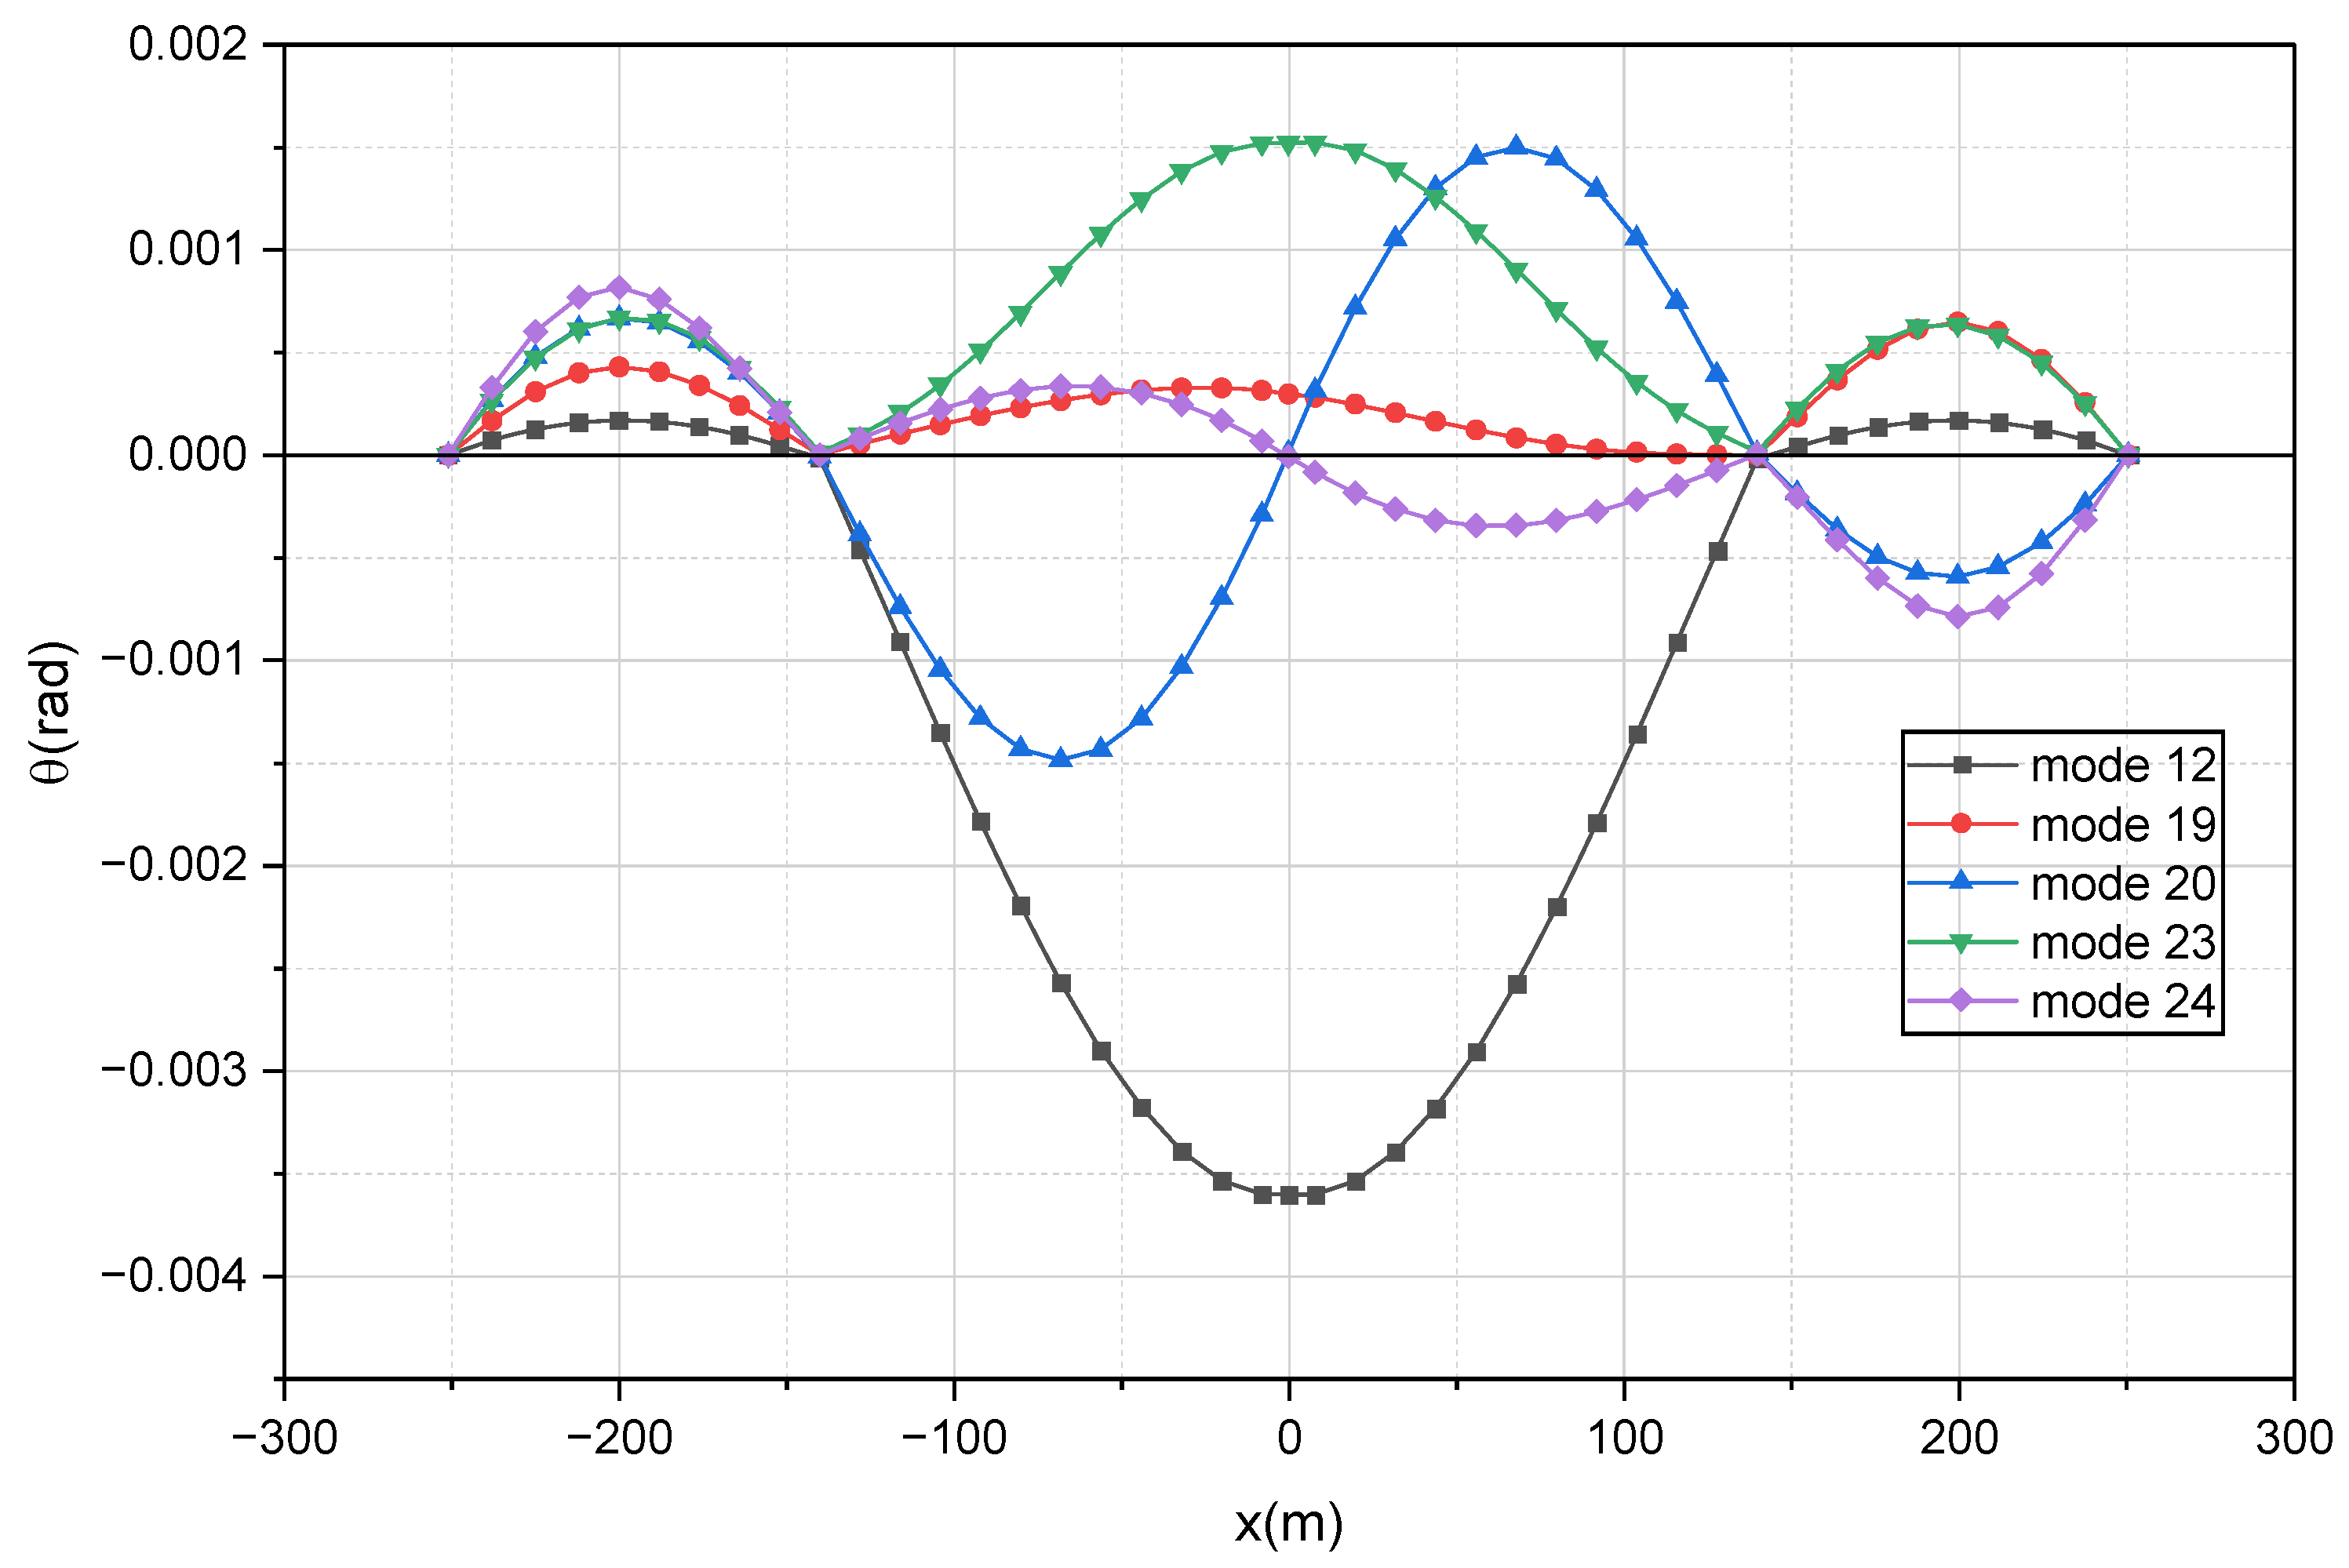
The normalized shapes of the first five vertical and torsional modes are presented in Figure 9 and Figure 10, respectively, based on 43 nodes distributed along the deck. Mode 12 (1.309 Hz), the most dominant in torsion, is symmetrical, unlike the anti-symmetrical torsional mode of the Tacoma Narrows Bridge (0.2 Hz), which is comparable to mode 20 of the Oued Dib Bridge.

3.3. Estimation of the Modal Damping

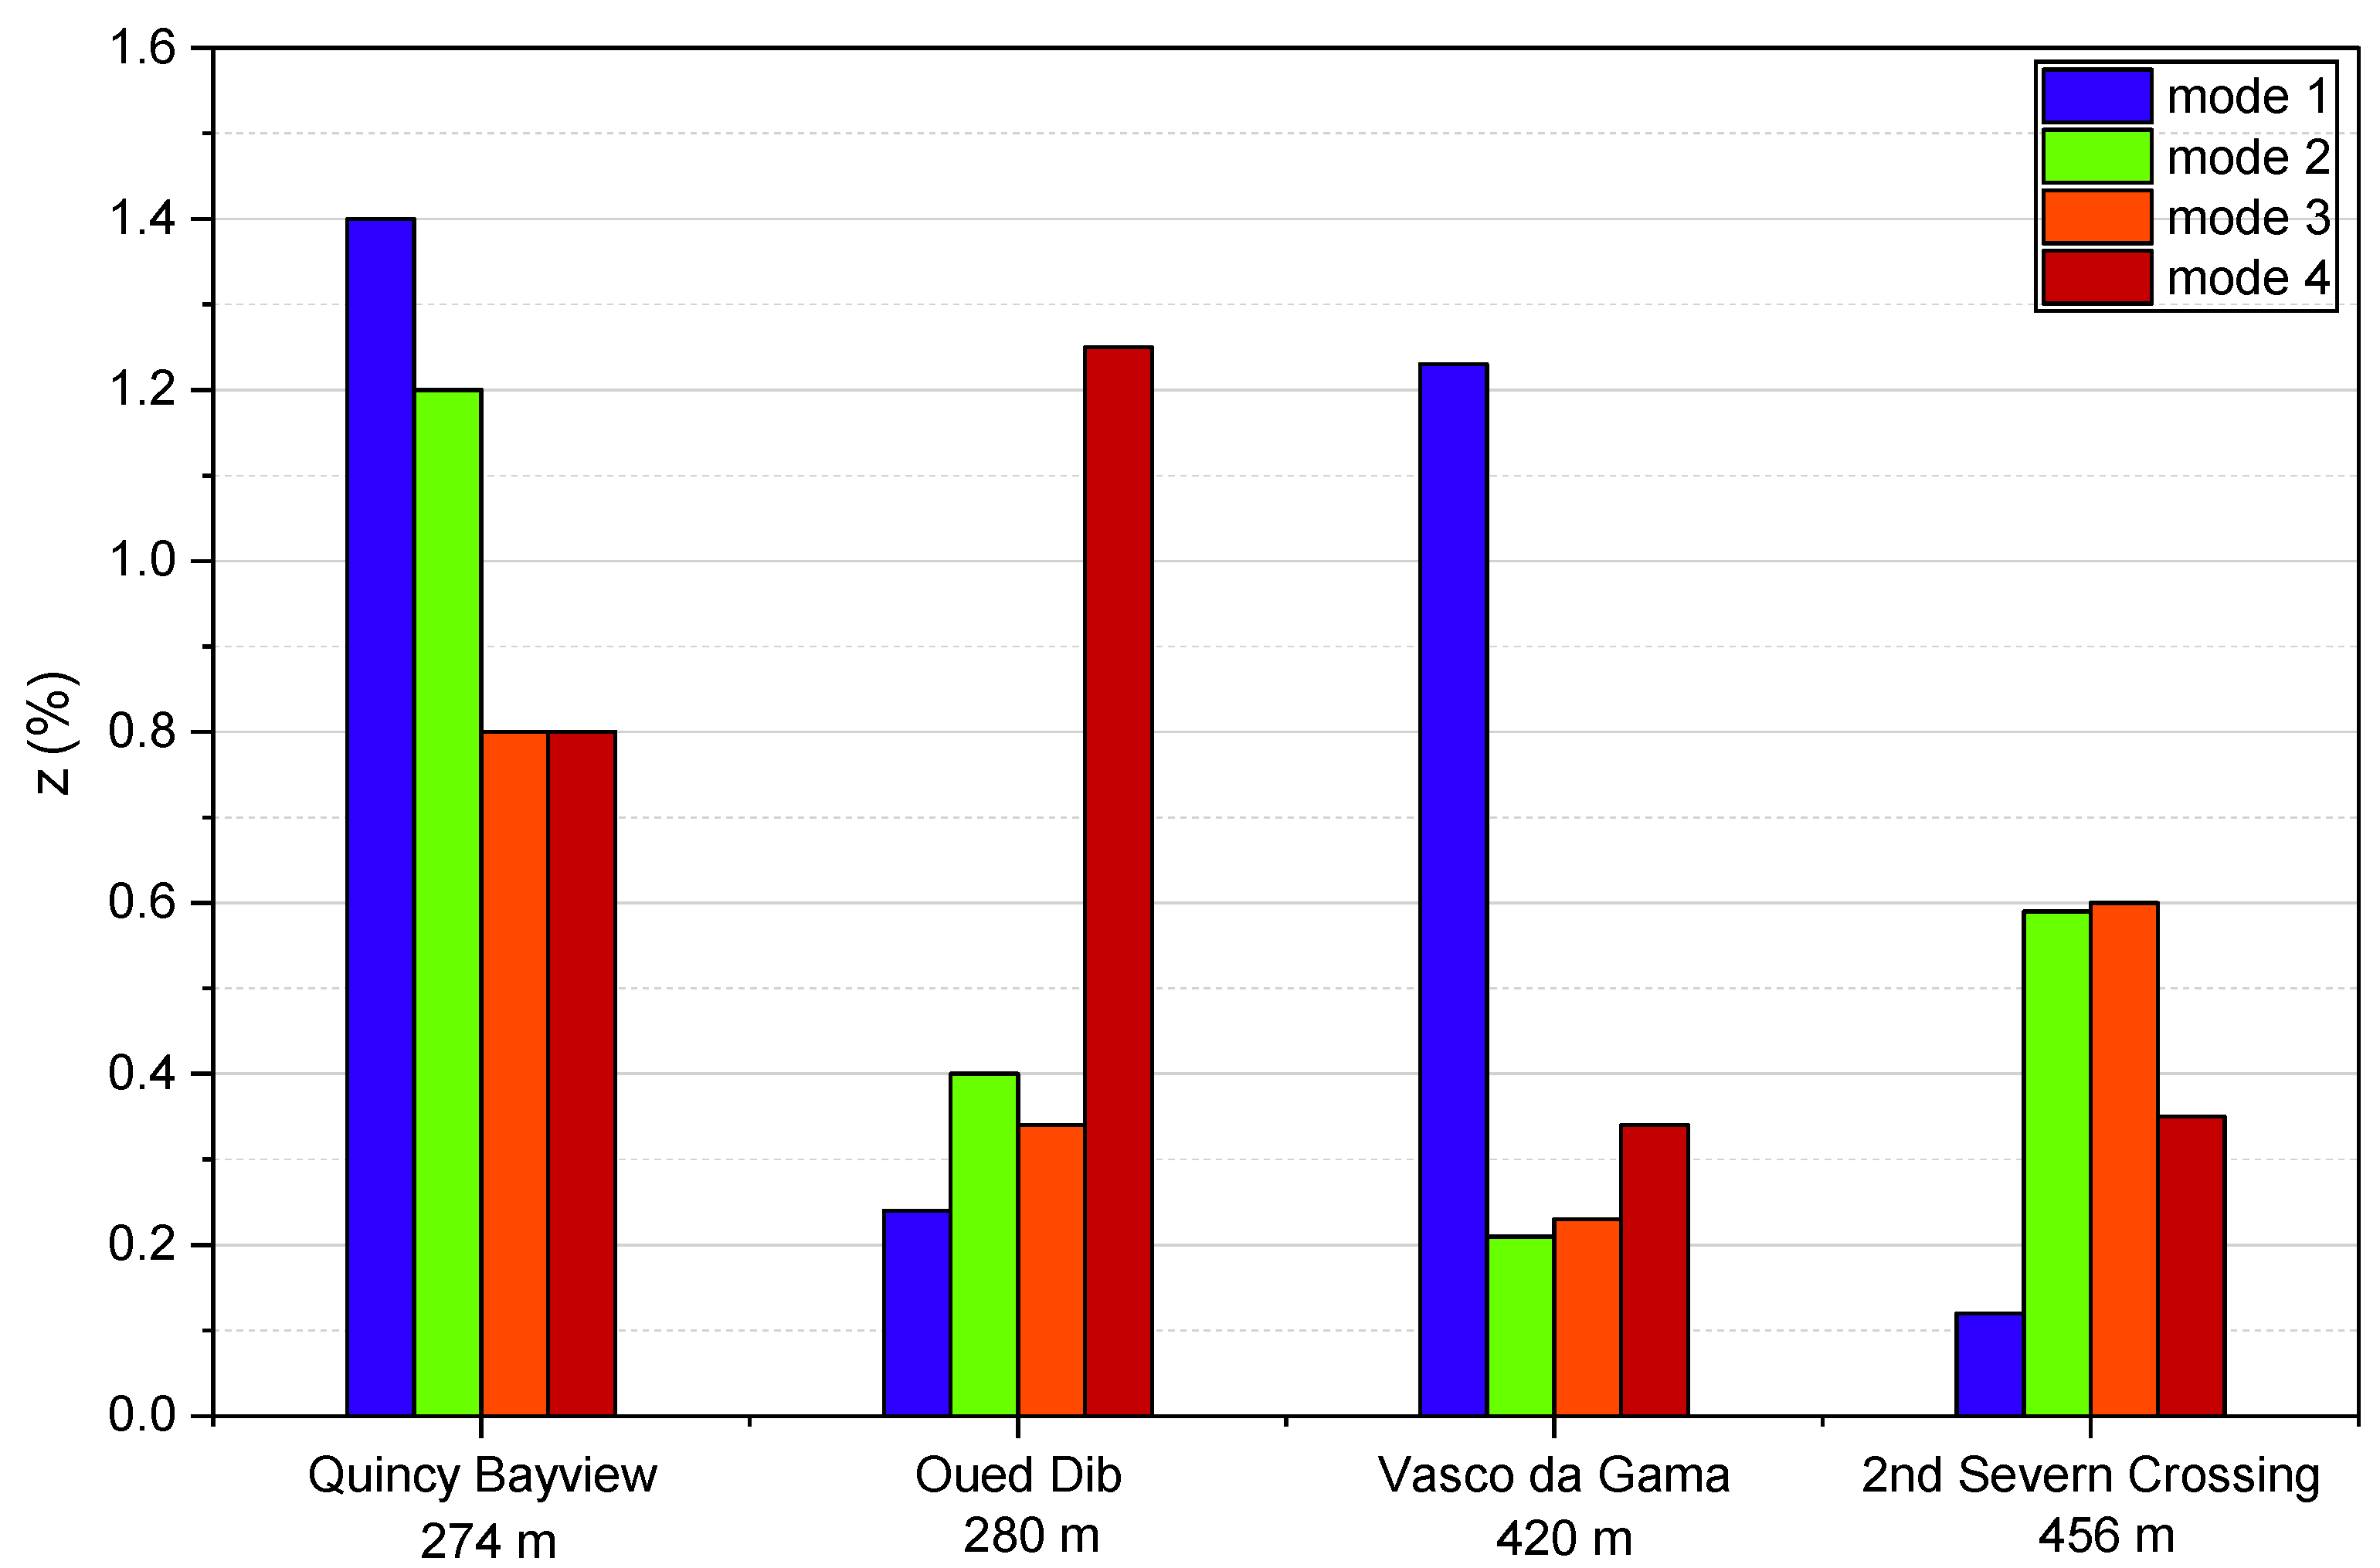
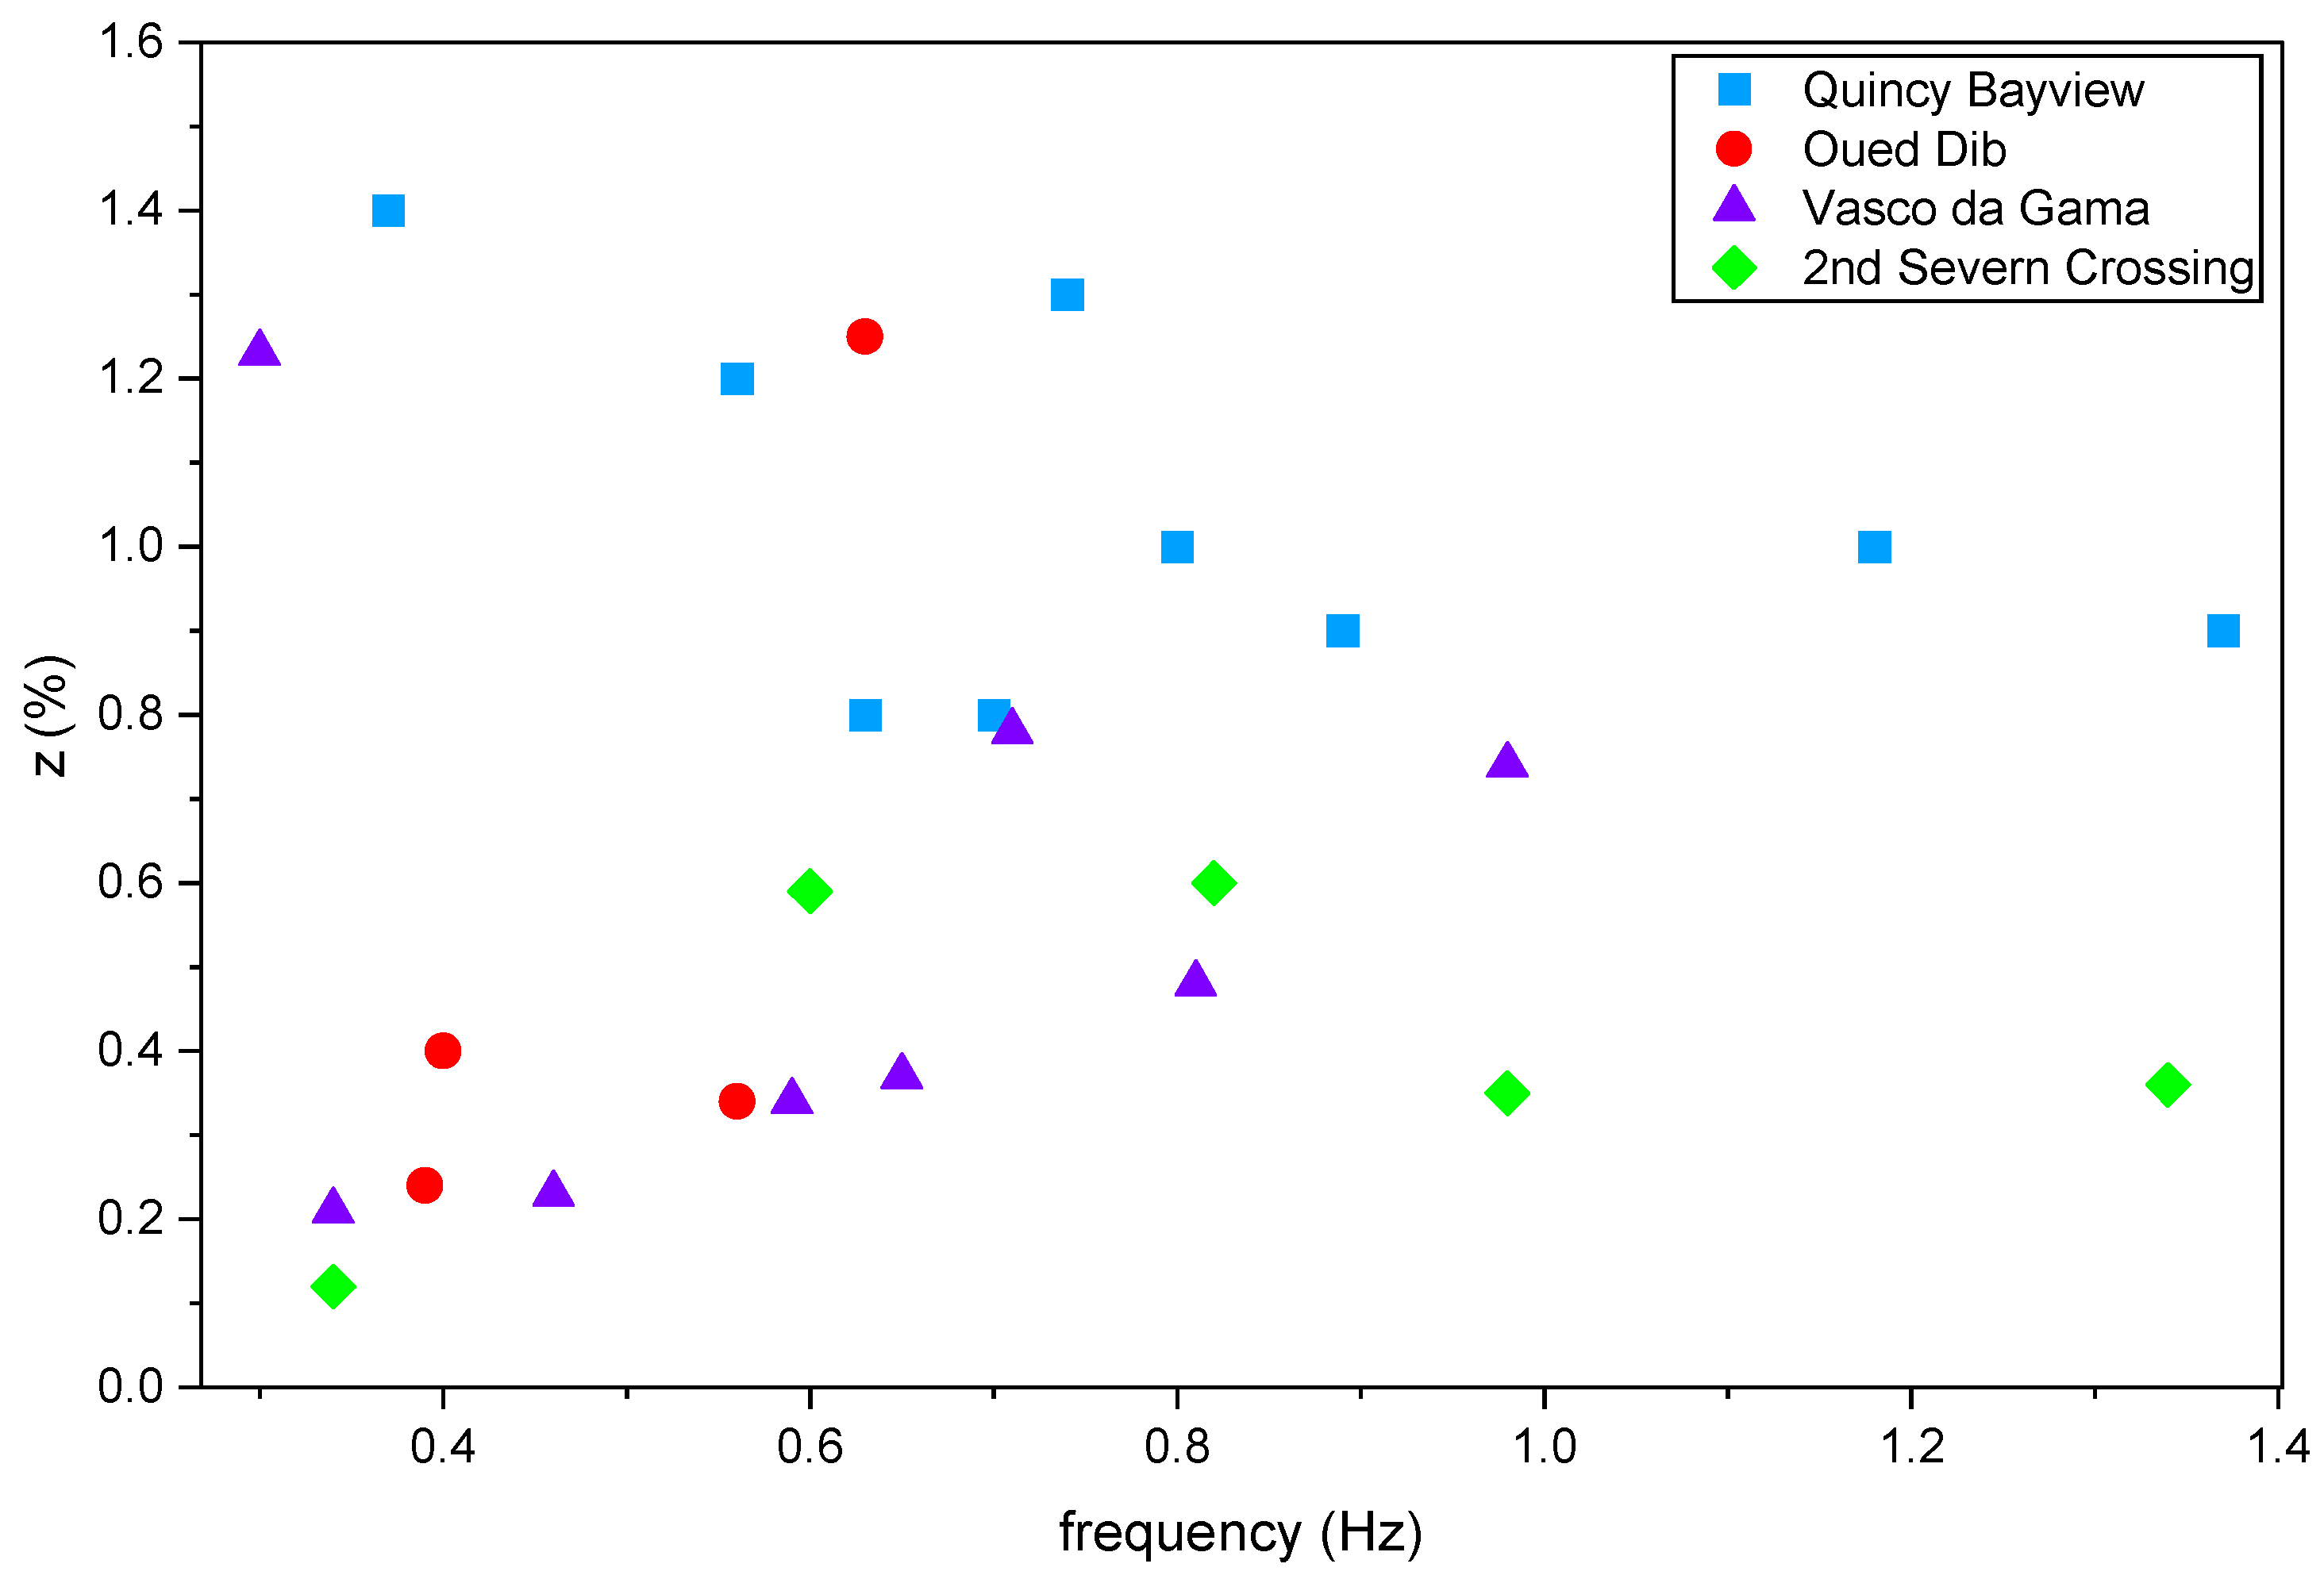
The modal damping ratios measured on the Oued Dib Bridge are presented in Figure 11, alongside results from ambient vibration tests conducted on other bridges. Table 5 summarizes the damping ratio values for each case. These values are generally low, ranging from 0.12% to 1.4%, which makes this type of cable-stayed bridge particularly vulnerable to wind effects.
Figure 12 illustrates the relationship between the measured damping ratios and the natural frequencies for the different cable-stayed bridges. This comparison highlights the complex nature of the damping–frequency relationship in such structures. Unlike buildings, where damping behavior can often be represented by simple or extended Rayleigh models, no straightforward law appears to adequately describe damping in cable-stayed bridges.
The modal damping ratio measured on the Oued Dib bridge by Kibboua et al. [36] is ξ = 0.40% for the first vertical bending mode. To avoid overestimating damping in the aeroelastic analysis of the deck, this same value was adopted for all other modes.

4. CFD Modeling

4.1. CFD Set-Up

According to Algerian snow and wind regulations (RNV 2013) [42] and Eurocode 1 (ENV 1991-1-4) [43], the maximum wind speed at the bridge site is estimated as Umax = 33.3 m/s (120 km/h), corresponding to a 50-year return period. The turbulence intensity is Iv = 12.8% [44]. For the CFD simulations, a mean wind velocity of U = 20 m/s was applied, with angles of attack (AoA) ranging from −10° to +10° in increments of 2°. Given the air density ρ = 1.225 kg/m3, the dynamic viscosity μ = 1.837 × 10⁻⁵ kg/(m·s), and the deck width B = 13.3 m, the Reynolds number (Re) is obtained from the relation
R e = ρ U B μ
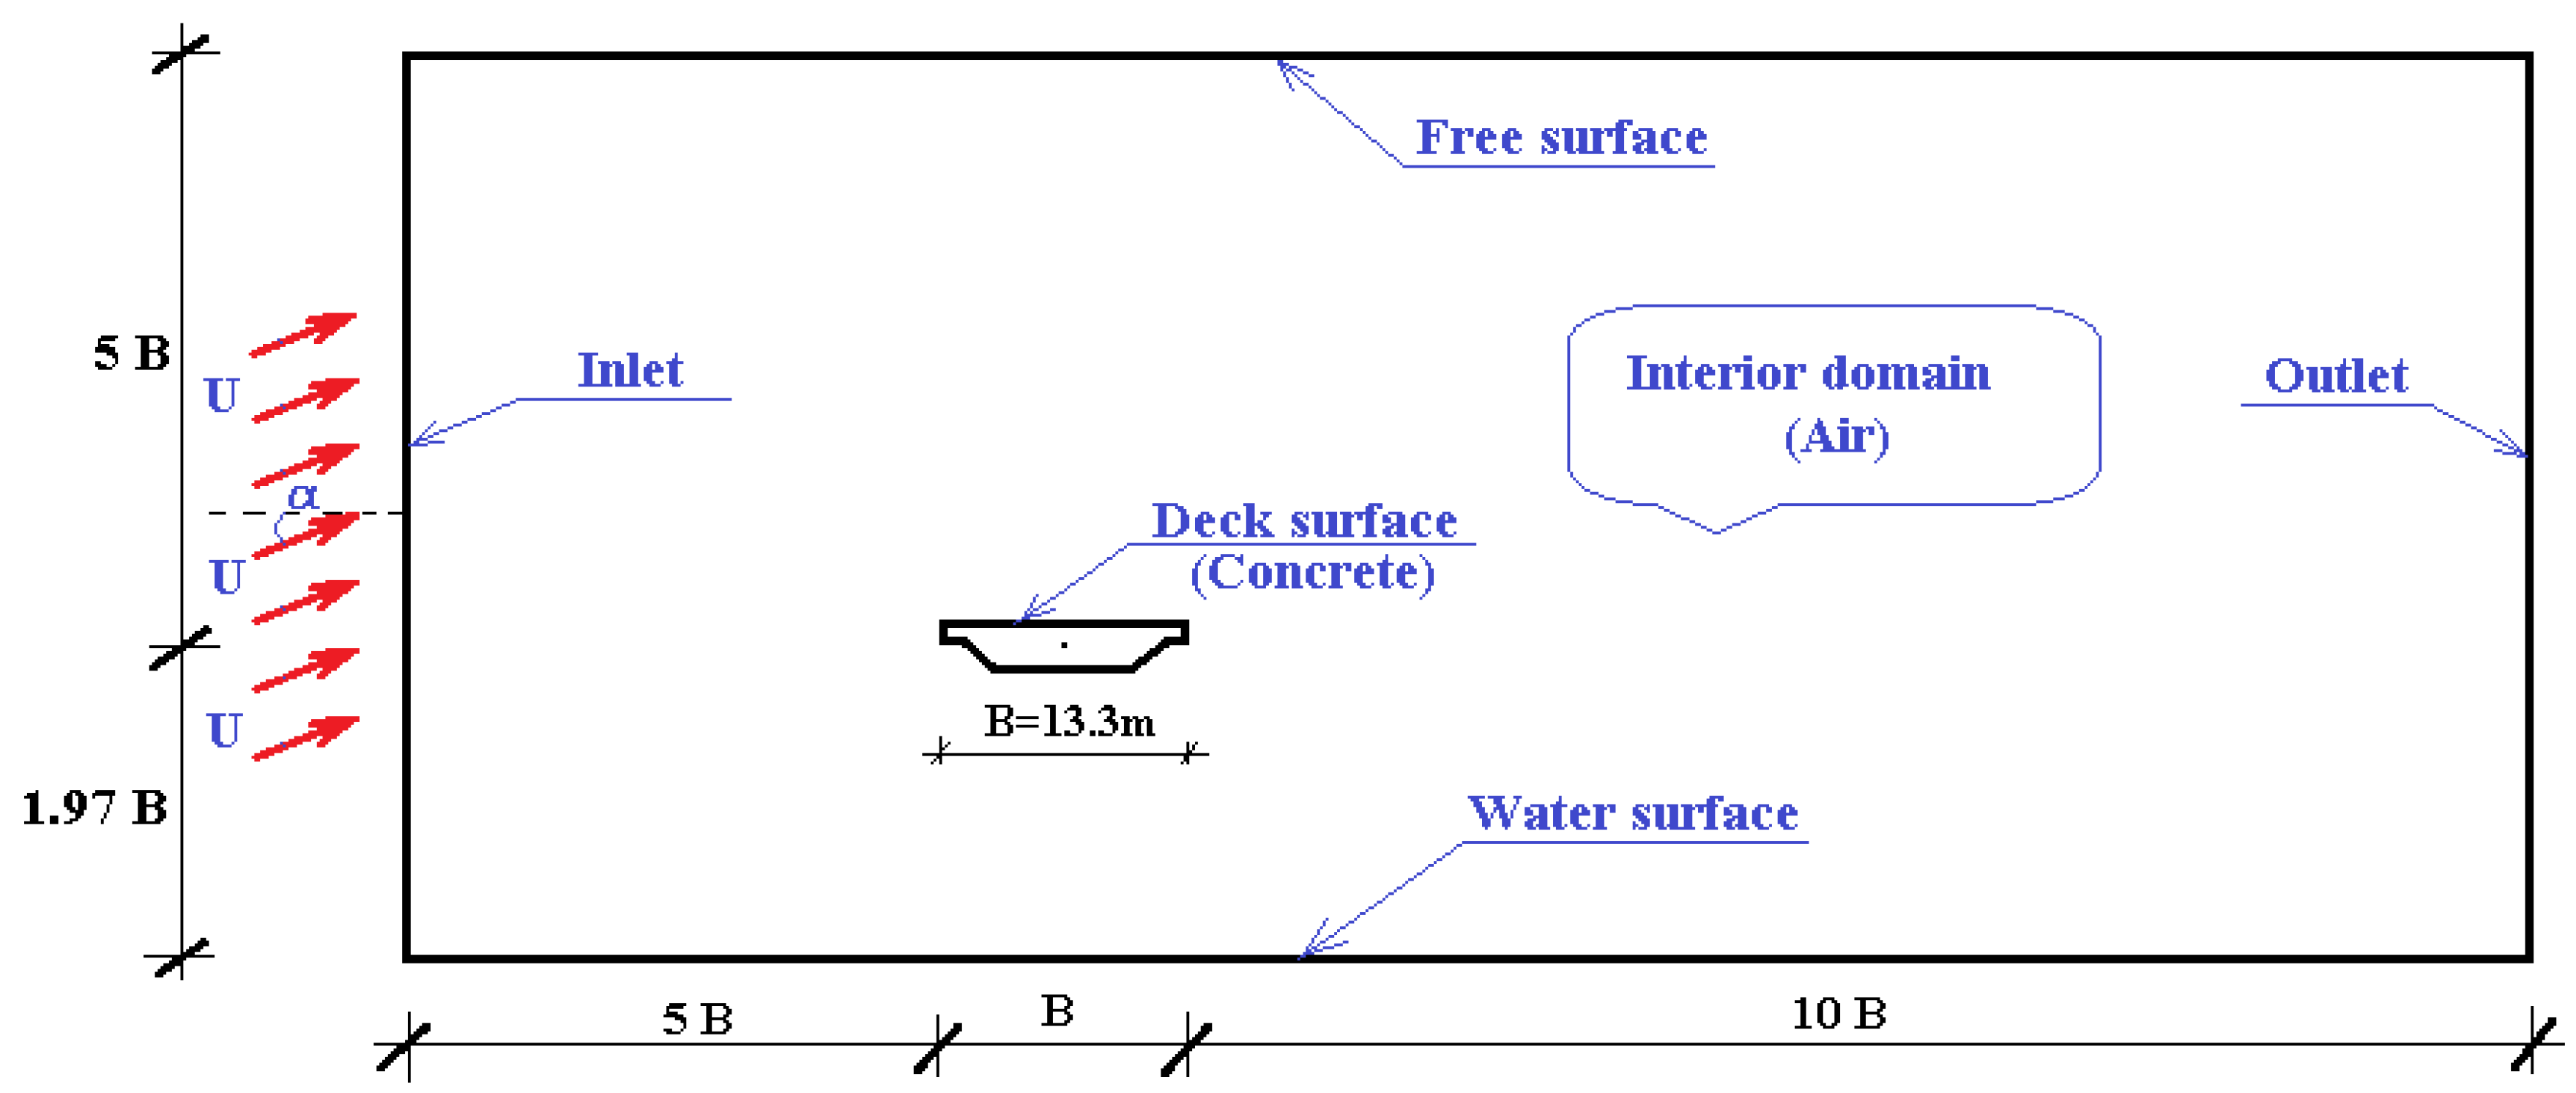
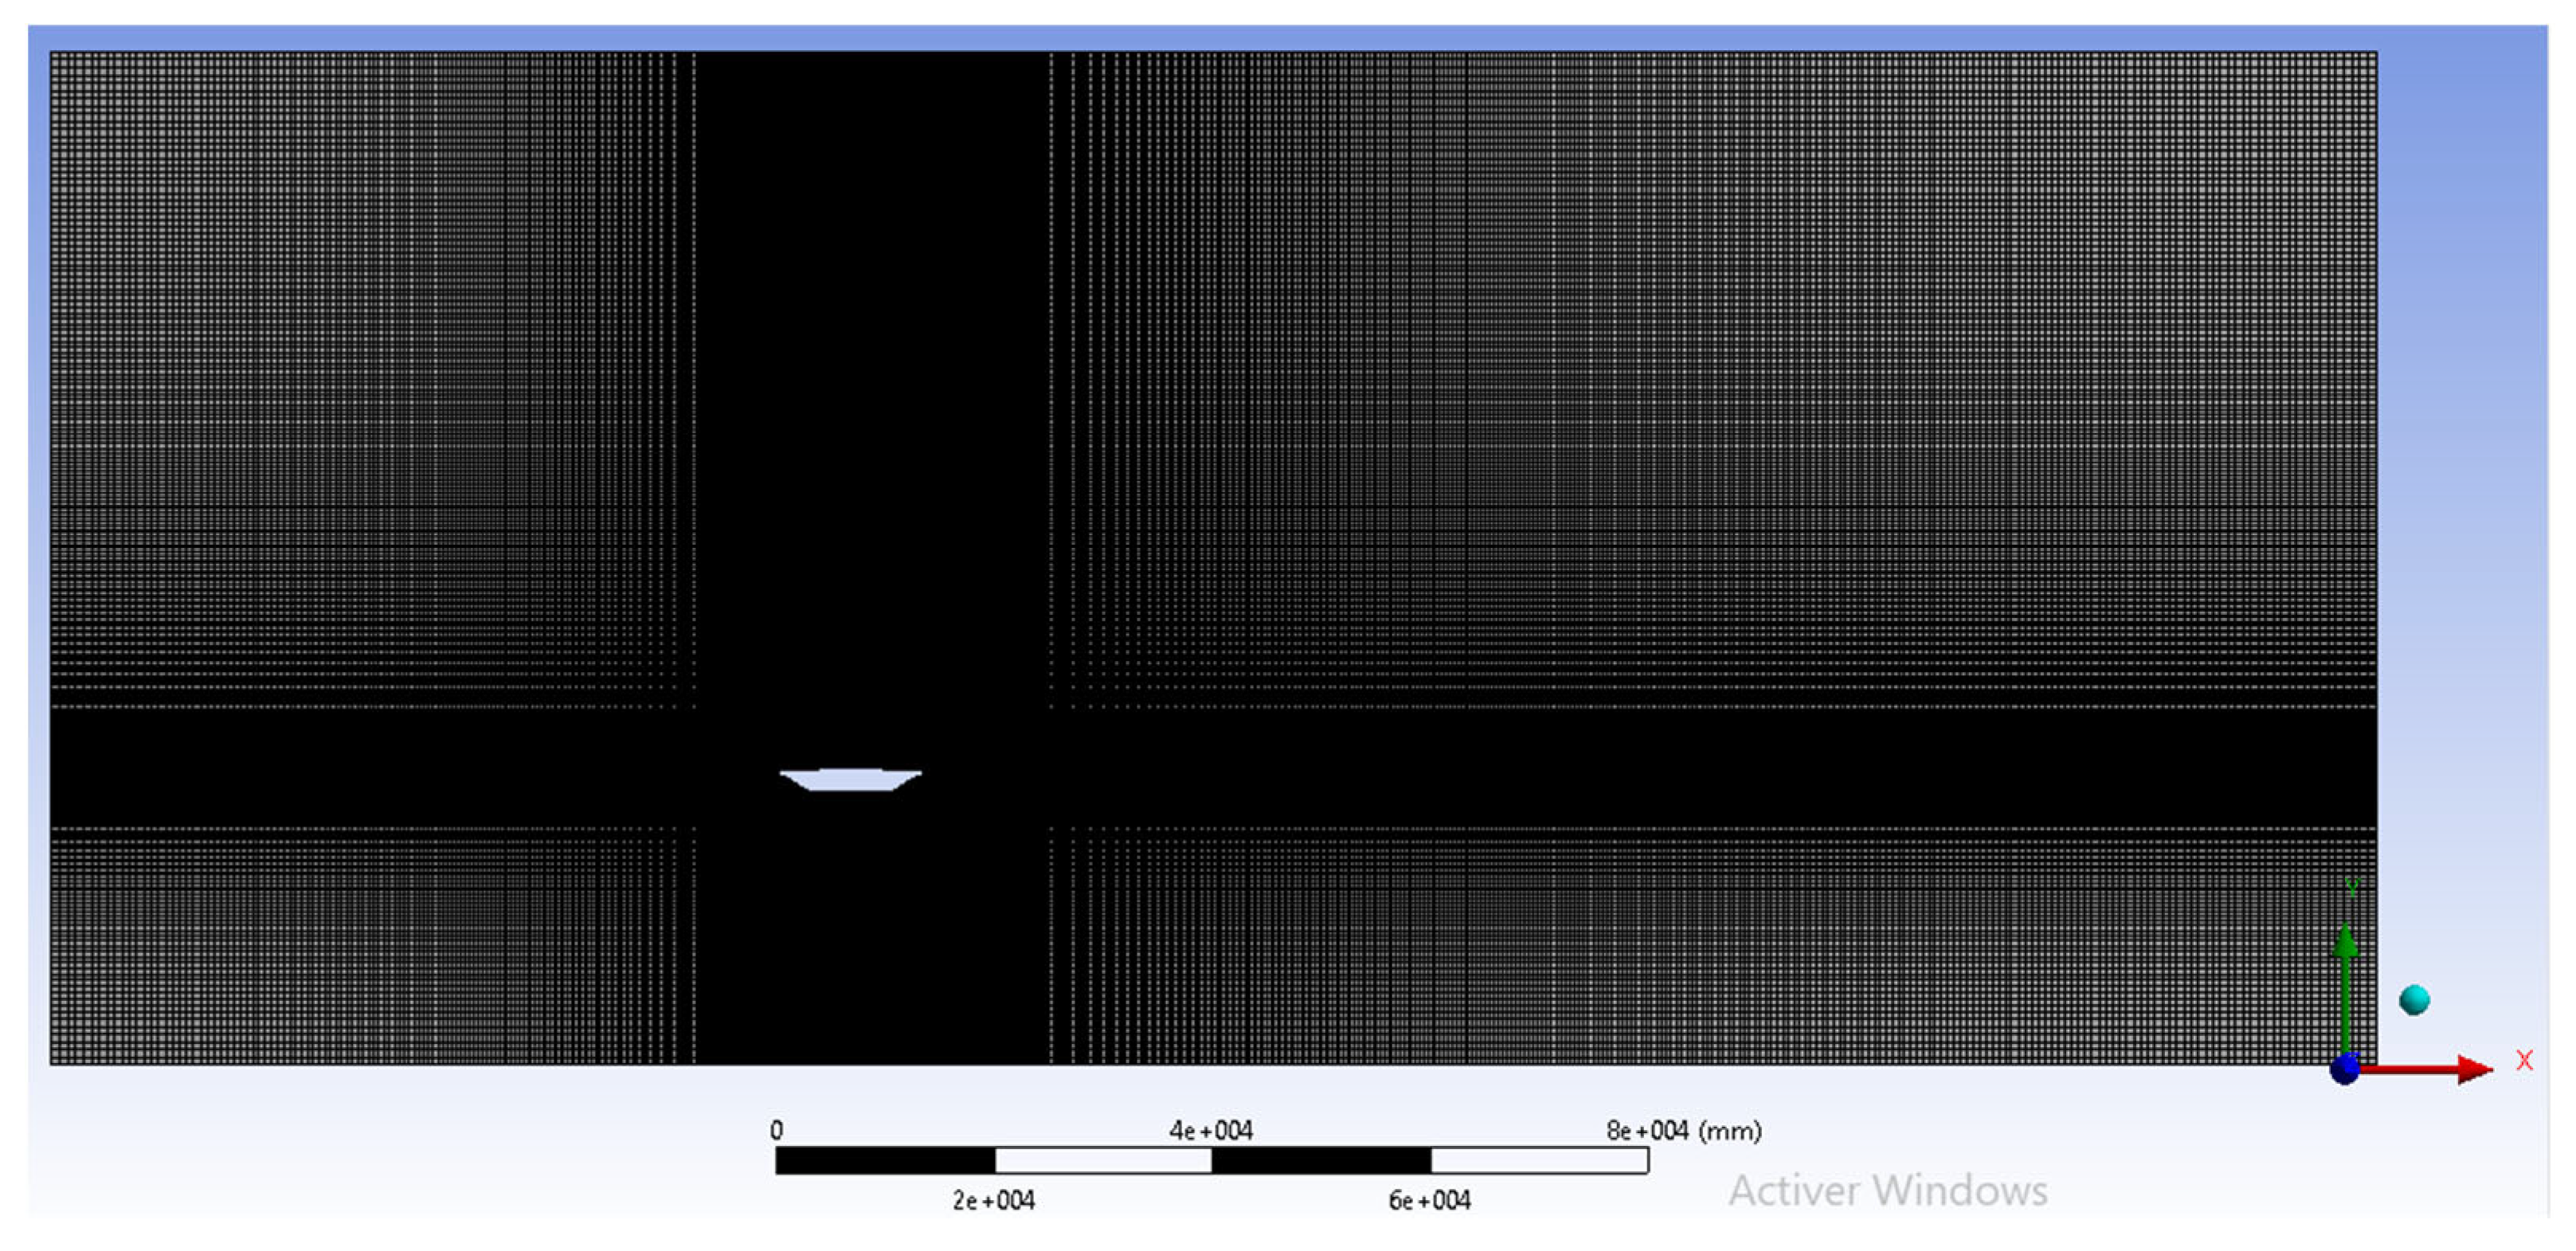
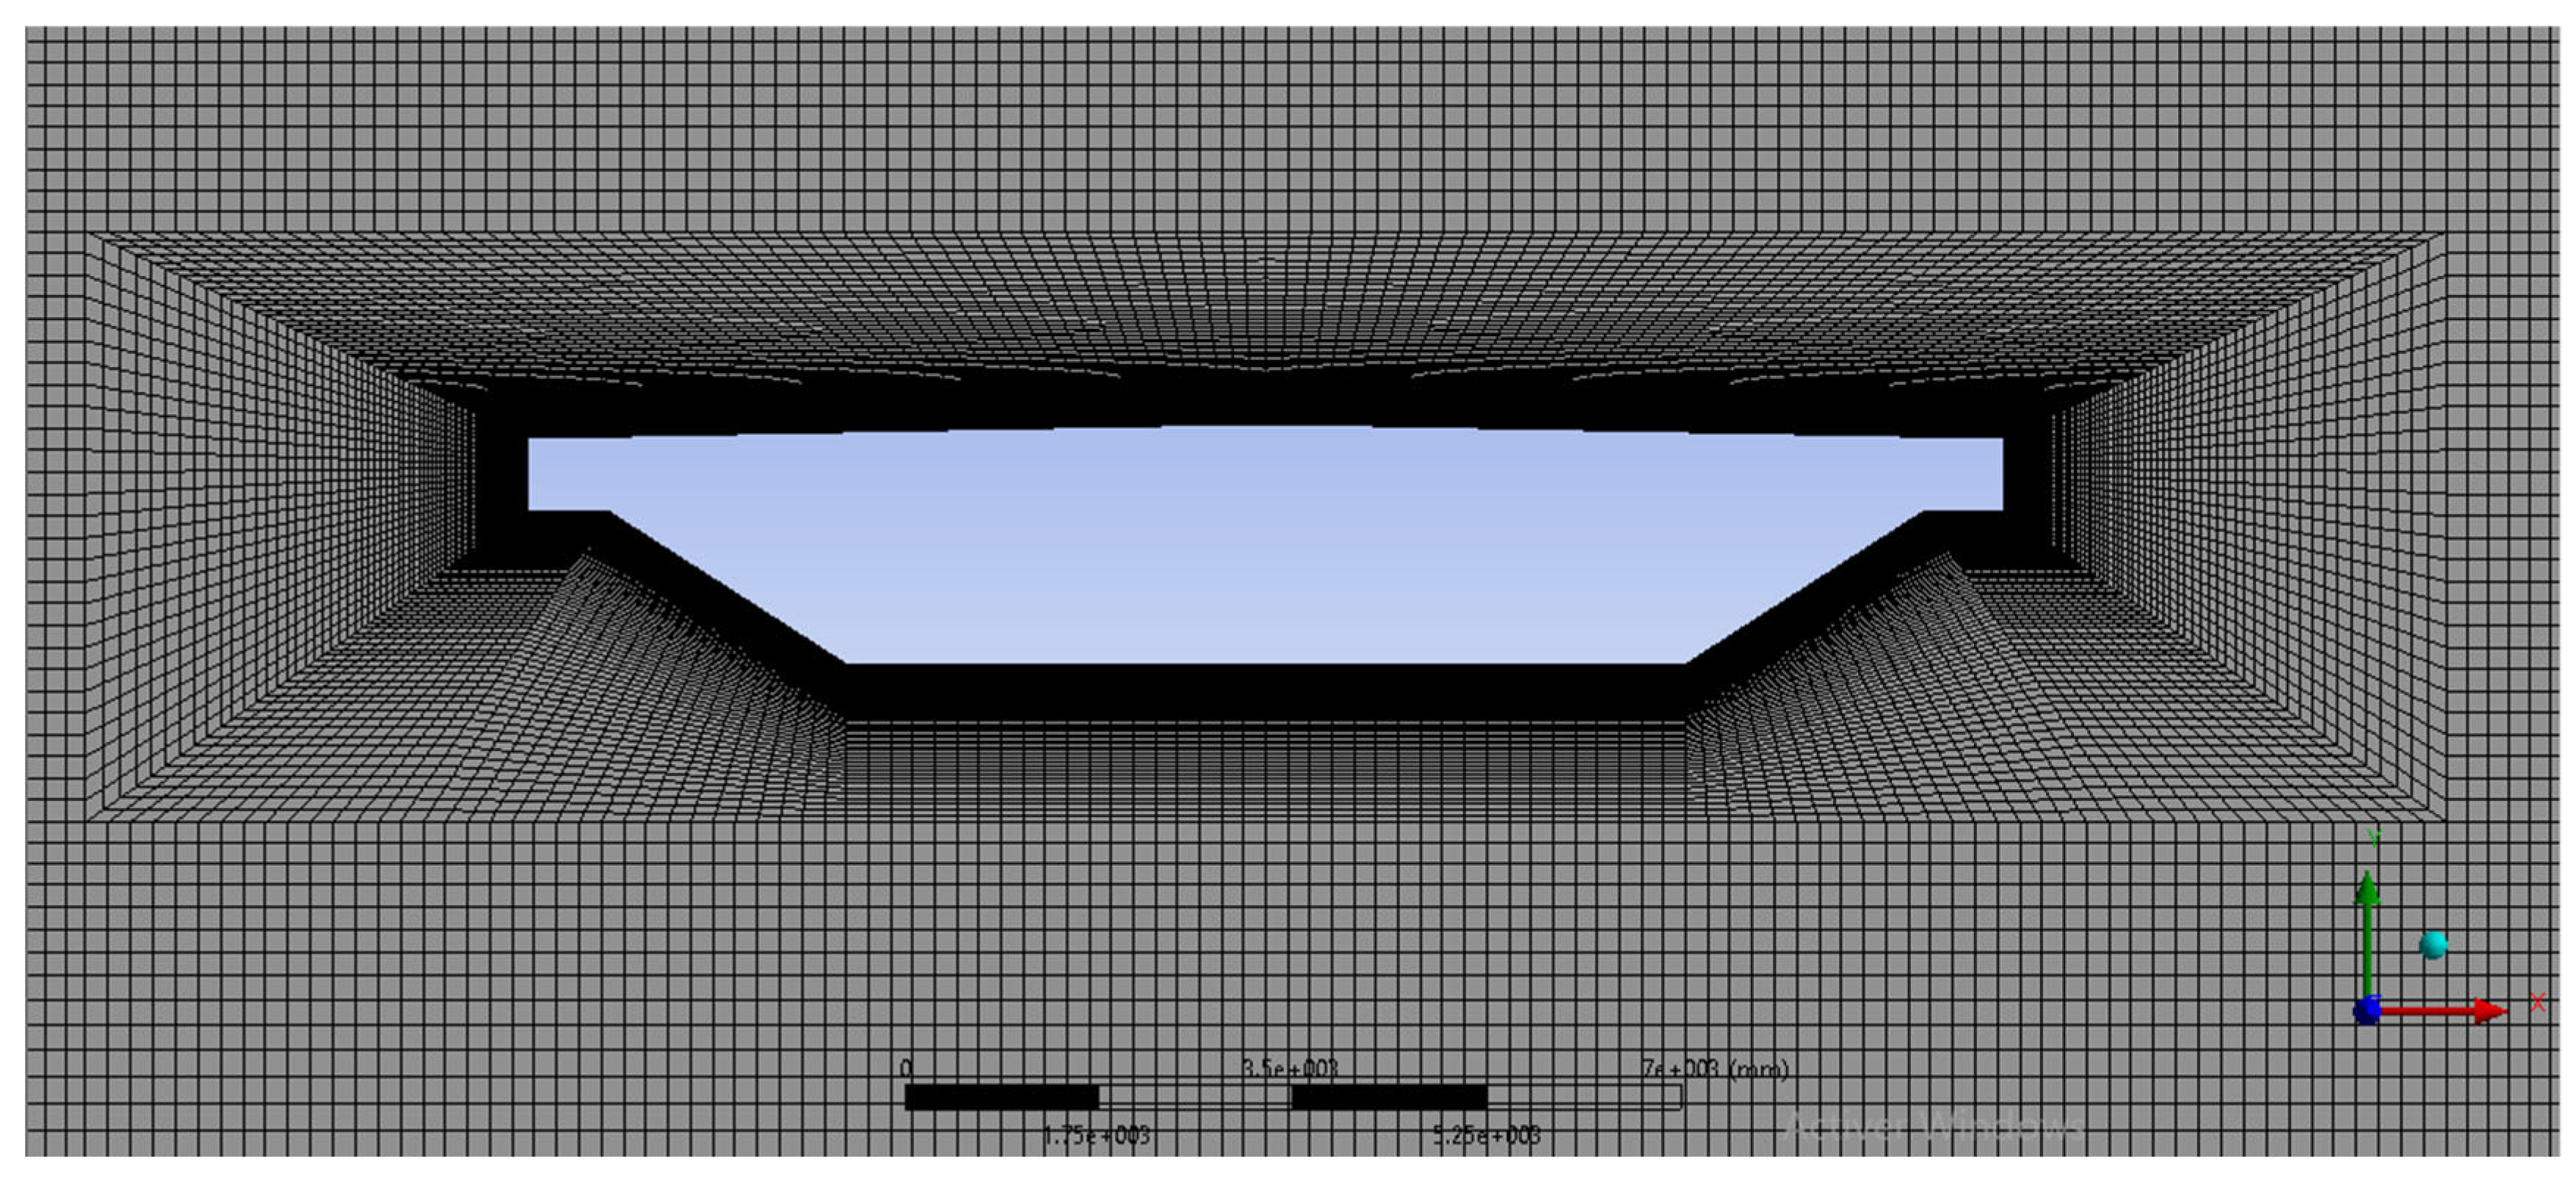
The resulting Reynolds number is Re = 1.77 × 10⁷, indicating a fully turbulent flow regime. The fluid domain around the deck was defined according to the recommendations of [45], as shown in Figure 13, with the corresponding boundary conditions summarized in Table 6. The deck surface was assigned a concrete roughness of 0.3 mm. The computational mesh was structured, consisting of 166,604 cells and 167,567 nodes (Figure 14 and Figure 15).
To achieve accurate resolution of the boundary layer at high Reynolds numbers, it is recommended to apply a wall function in the range 30 < Y+ < 200. In this study, a value of Y+ = 30 was adopted, corresponding to a minimum cell height of 1.3 mm at the air–deck interface. A steady-state approach was employed using the turbulent RANS k–ω SST model [46,47]. This model ensures reliable prediction of the flow field, as it applies the k–ω formulation near the air–deck interface and transitions to the k–ε formulation in regions farther from the wall.

4.2. CFD Results

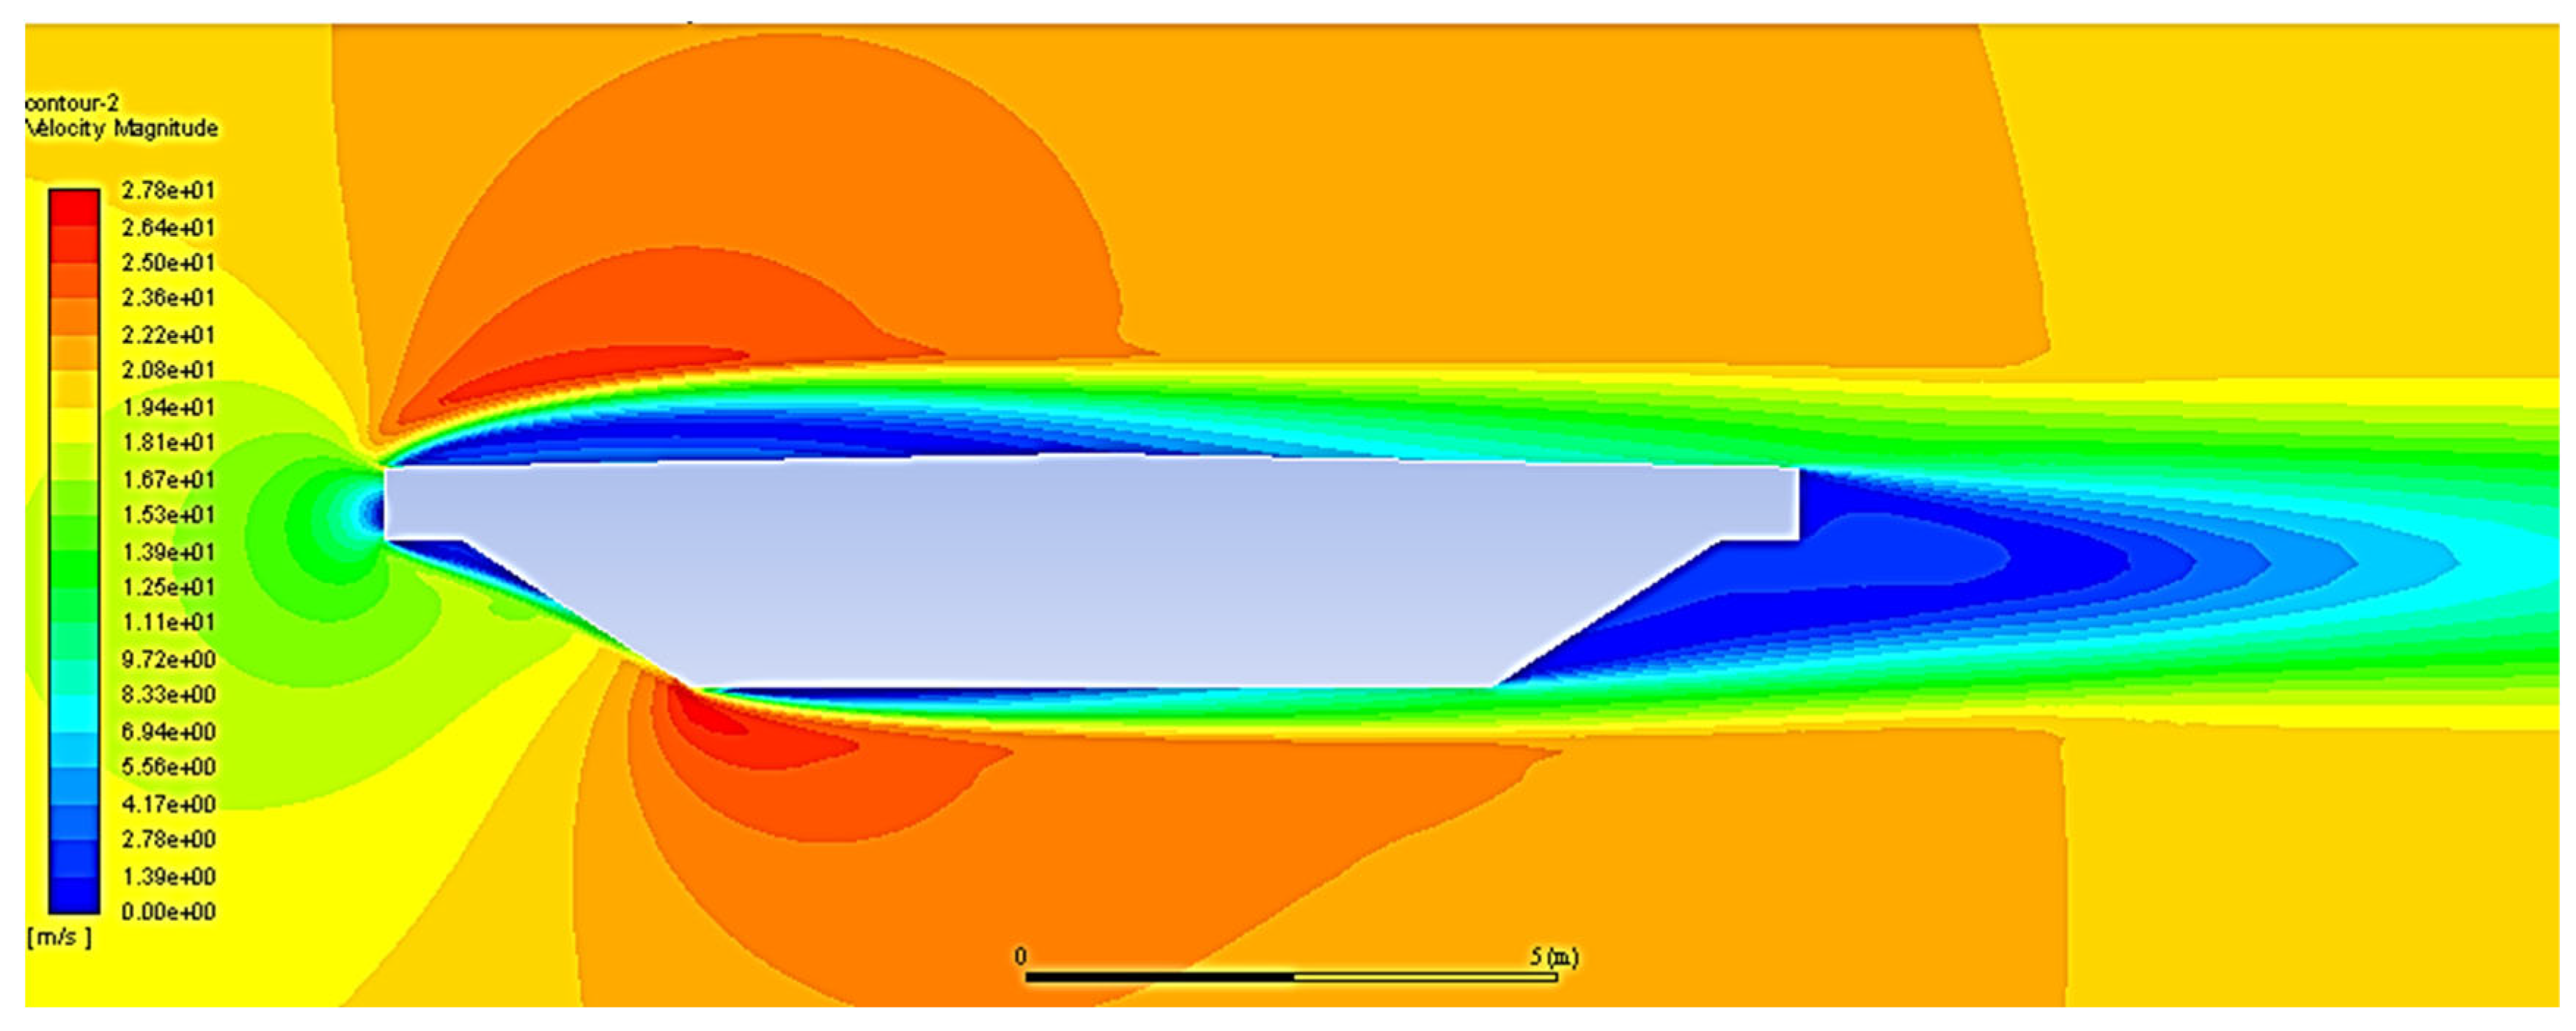
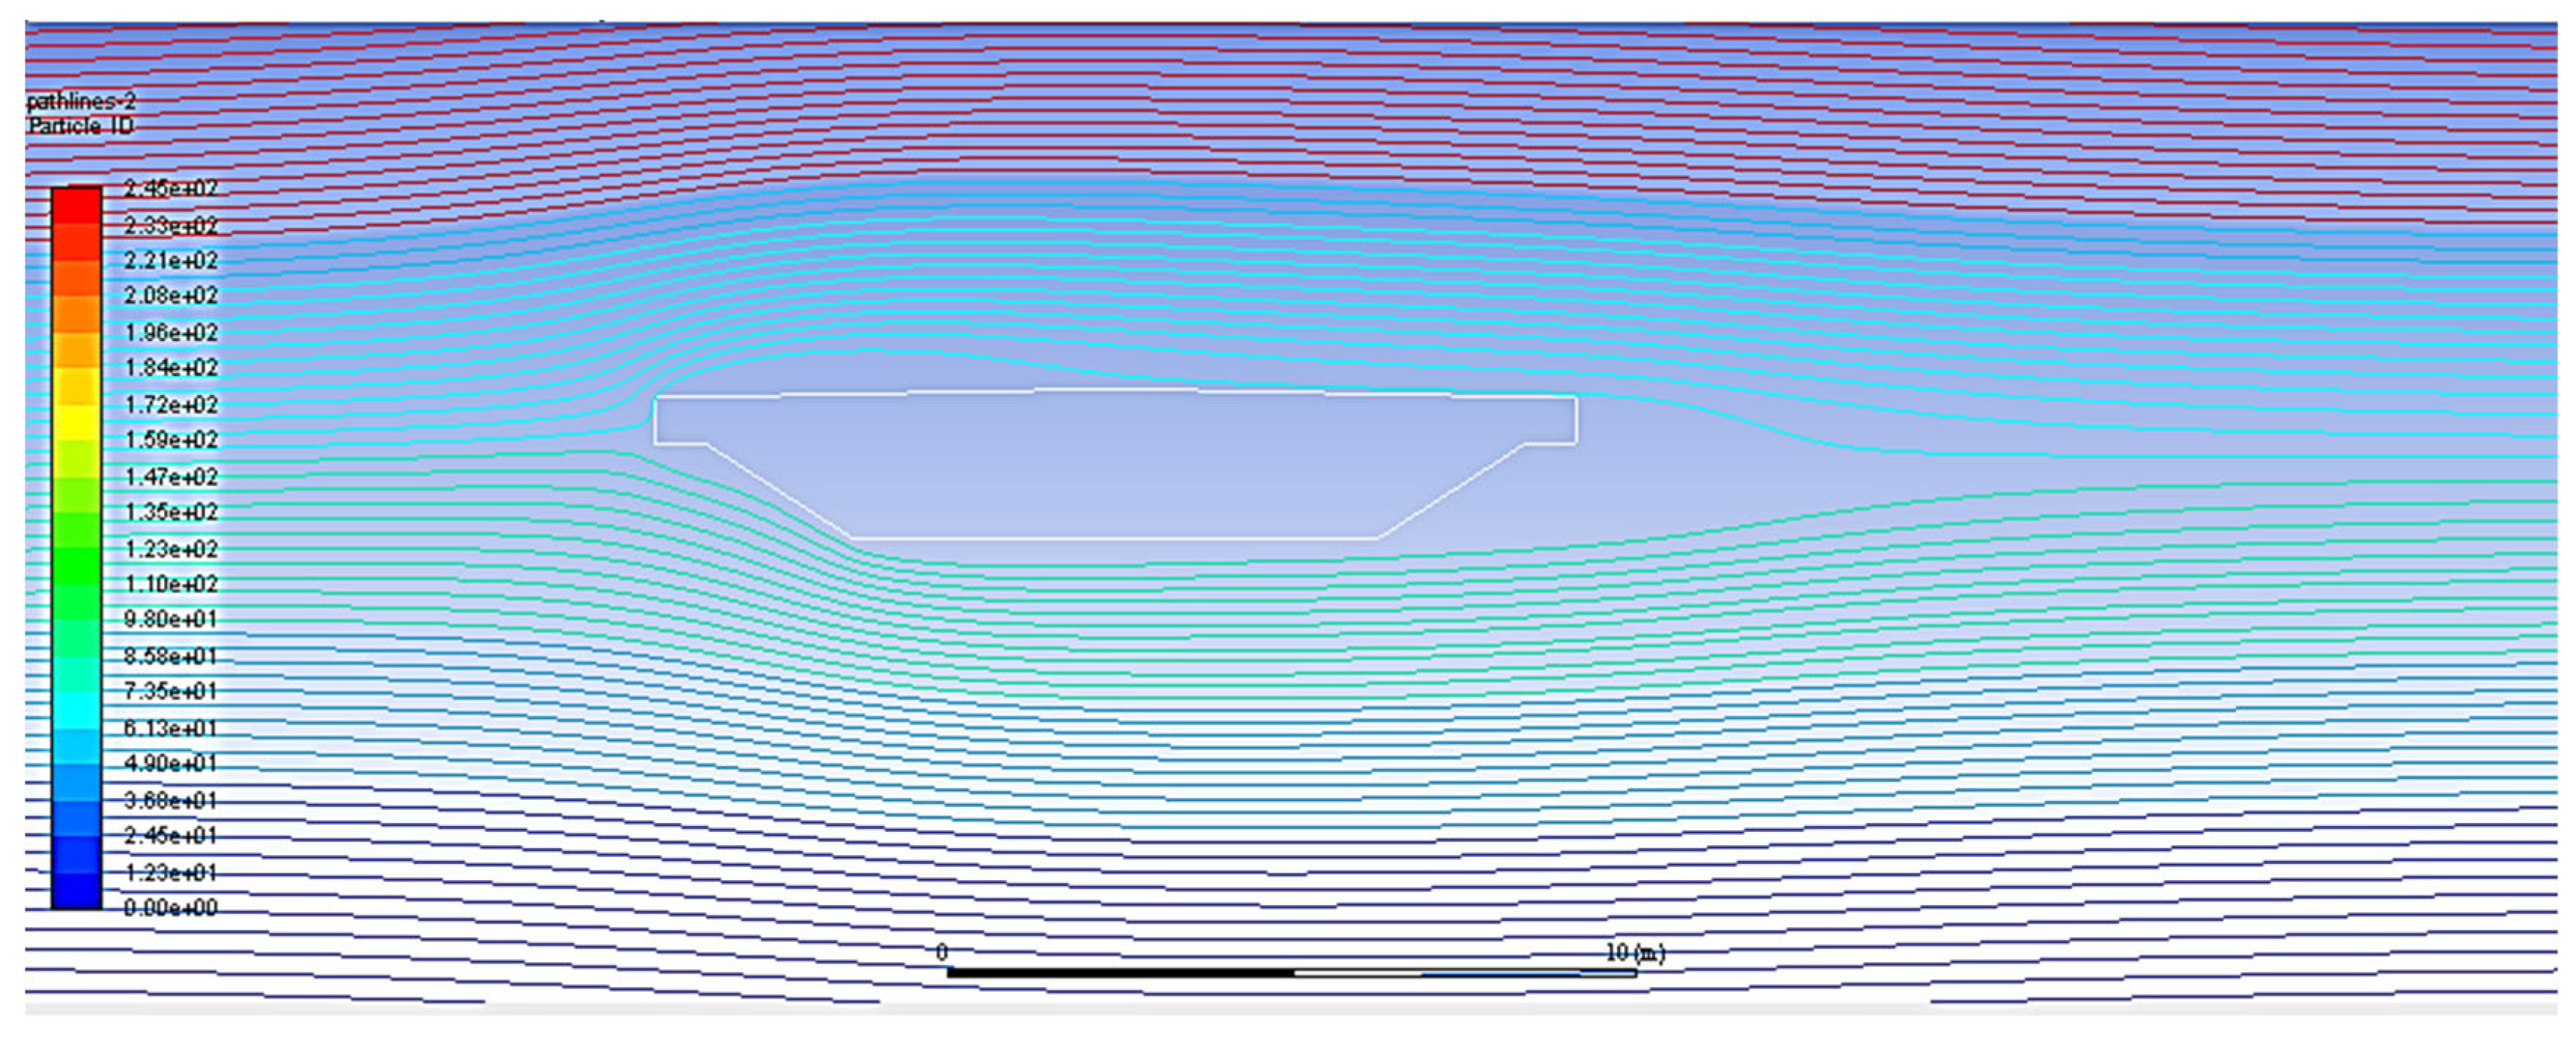
The pressure contour in Figure 16 reveals the presence of overpressure at the left edge of the deck, which obstructs airflow and induces backflow in the opposite direction. Since the deck is a bluff body rather than a streamlined profile, a significant portion of its surface is subjected to under pressure, leading to boundary layer separation. This behavior is further confirmed by the velocity contour (Figure 17) and the velocity vectors (Figure 18), both of which clearly highlight the separation zones. These flow characteristics give rise to the vortex-shedding phenomenon [48,49], as illustrated in Figure 19.
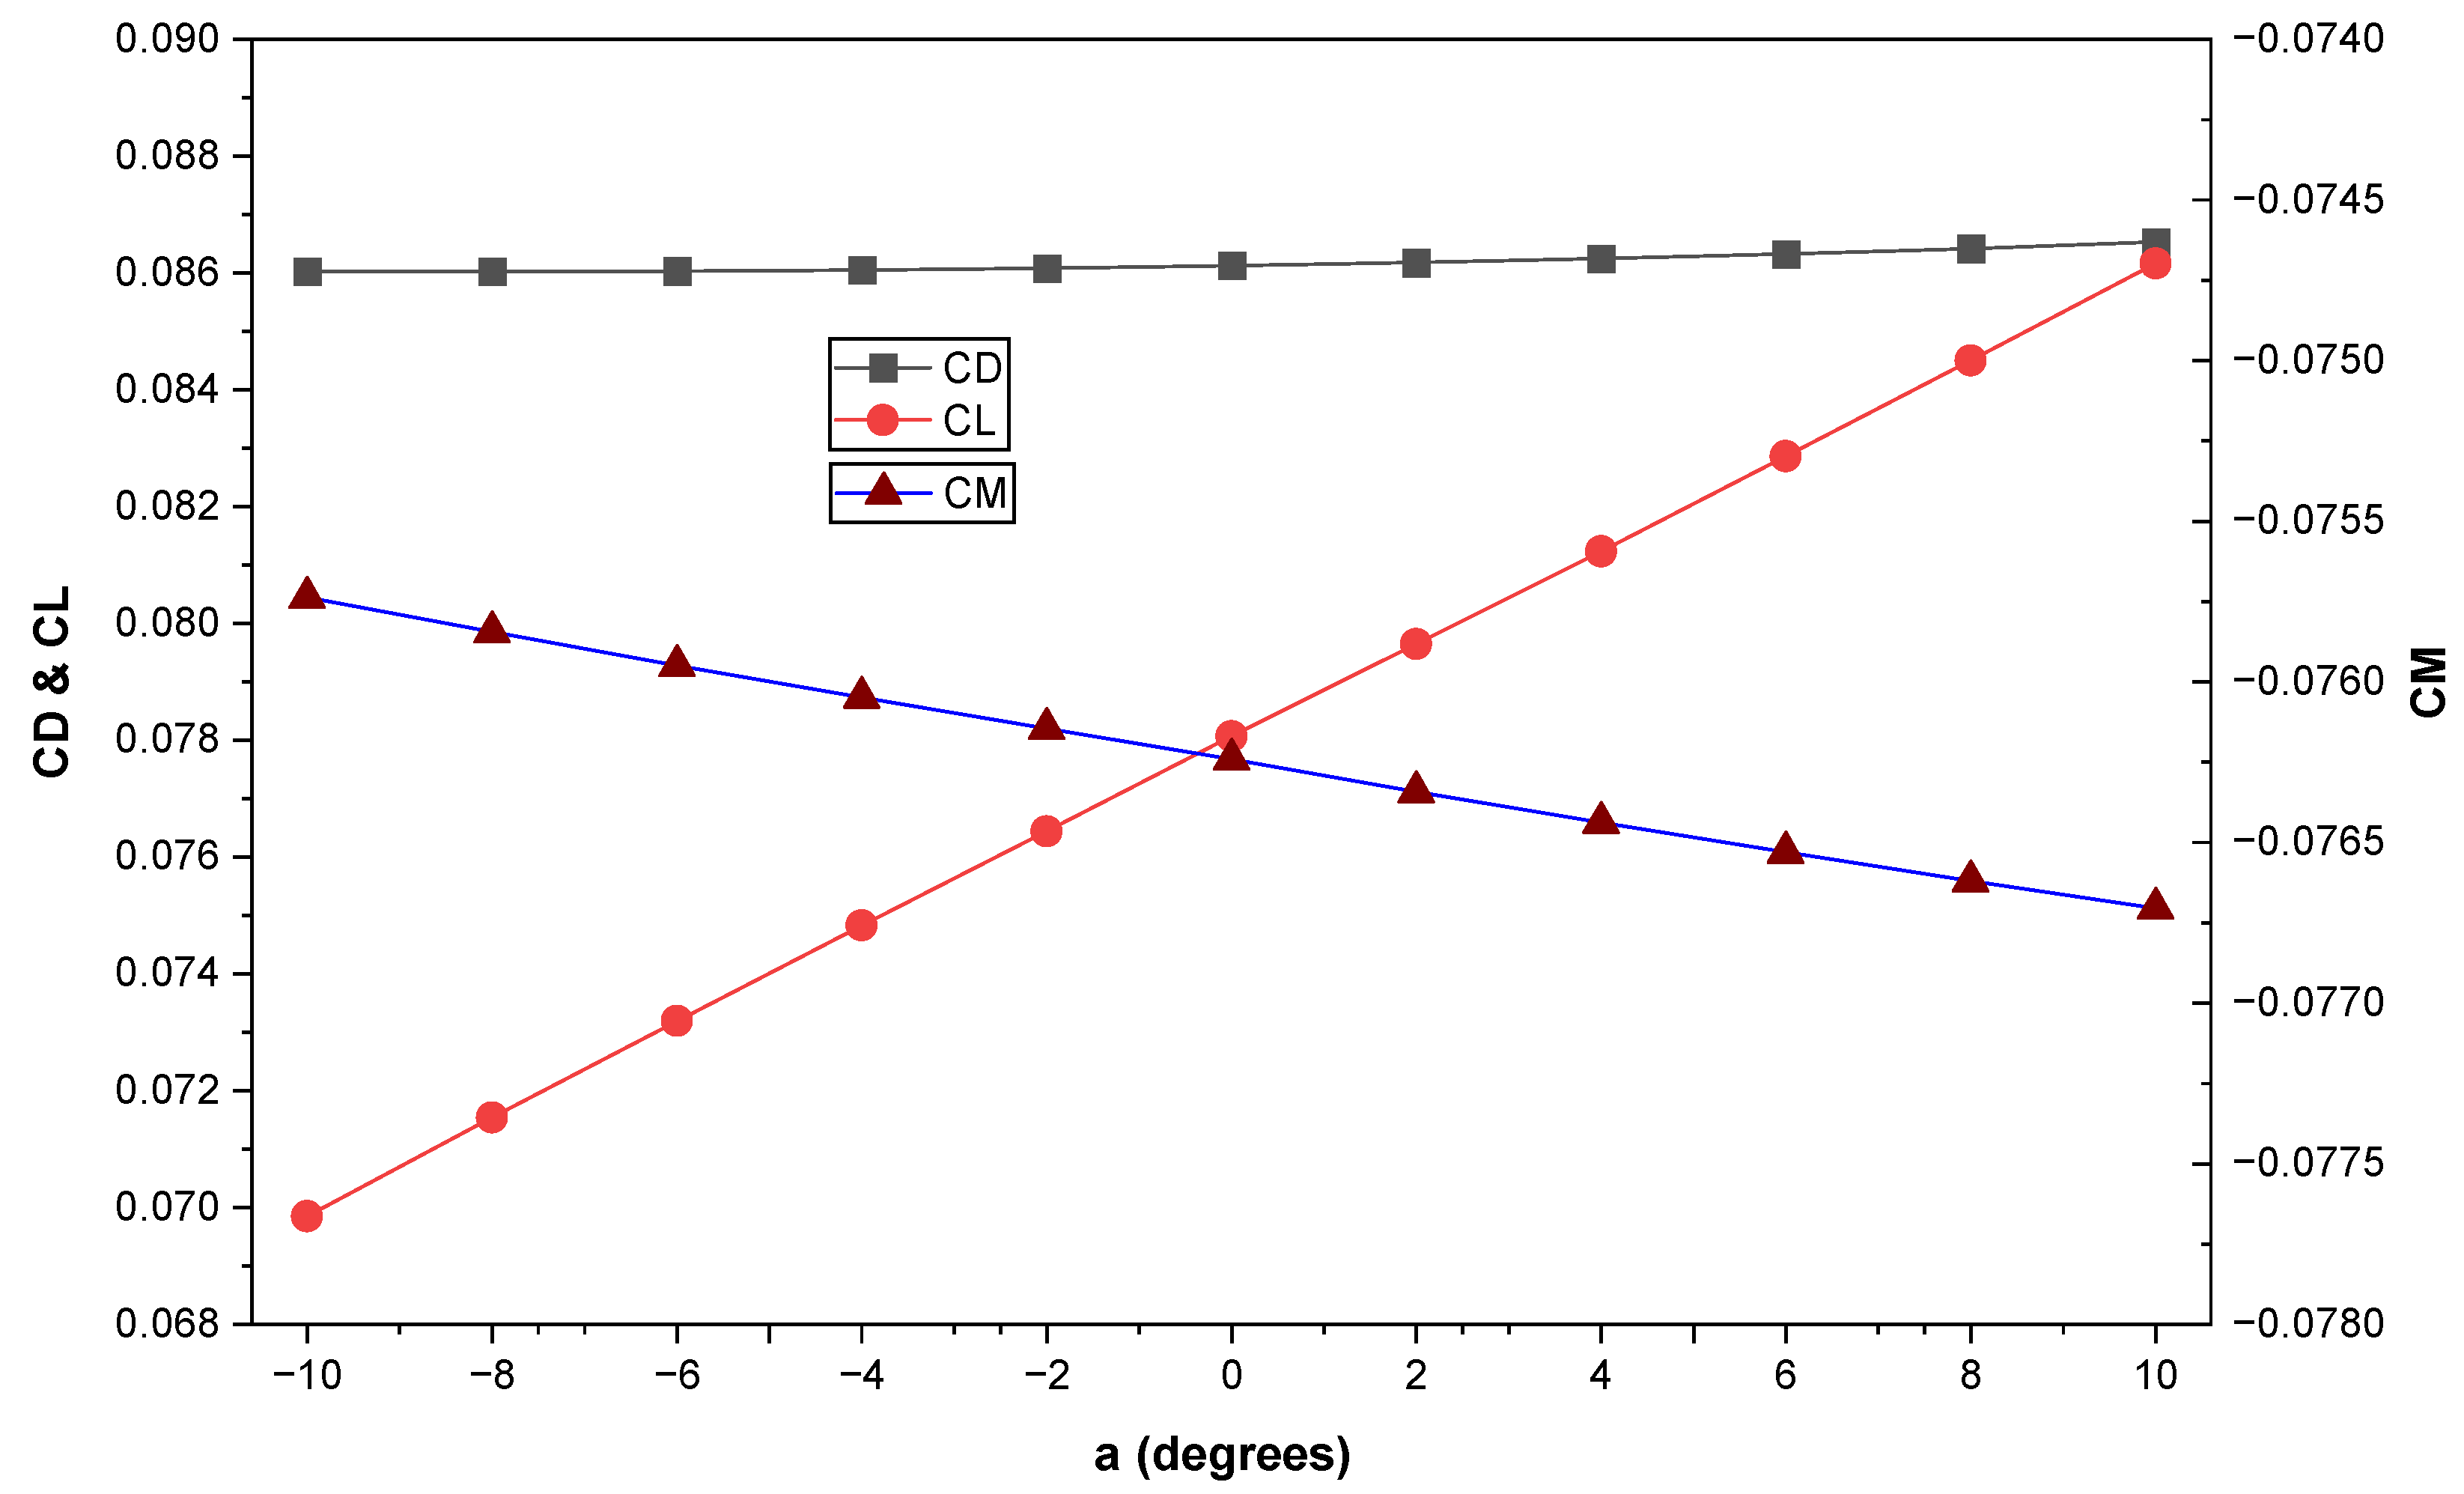
The CFD analysis also enabled the calculation of the static aerodynamic coefficients for each angle of attack (α), ranging from −10° to +10° in 2° increments. These coefficients—CD for drag, CL for lift, and CM for moment—are illustrated in Figure 20, with their numerical values summarized in Table 7. The CM curve decreases with increasing α, reflecting the fact that the deck is a bluff body; in contrast, profiled decks typically exhibit increasing CM curves.
Instead of expressing the static coefficients in the wind coordinate system (D, L), they can also be represented in the deck coordinate system (x, z). From Figure 21, it follows that
C x = C D cos α C L sin α C z = C D sin α + C L cos α
The CM coefficient remains unchanged in both coordinate systems.
Using these coefficients, the aerodynamic forces exerted on the bridge for a unit length (1 m) can be calculated according to the following formulas:
D = 1 2 ρ U 2 B C D α
L = 1 2 ρ U 2 B C L α
M = 1 2 ρ U 2 B 2 C M α
where D, L, and M denote the drag force, lift force and pitching moment, respectively.

5. Aeroelastic Instabilities and Bridge Performance

5.1. Vortex Shedding

Like any other bluff body, the bridge deck experiences boundary layer separation when subjected to airflow (Figure 19). This separation leads to the formation of vortices along both the right and left edges of the deck (Figure 22). These vortices are shed at a characteristic frequency [50]:
f V o r = S t U D
where St is the Strouhal number which depends on the geometric shape of the deck.
If the vortex-shedding frequency fv is close to the vertical vibration frequency fvs of the deck in flexural mode, a resonance phenomenon may occur, amplifying the vertical displacements of the deck and potentially leading to instability. The corresponding critical wind speed is determined using Equation (6) as follows:
U c r , v = f v s D S t
This instability is further aggravated by the lock-in phenomenon, which has been observed experimentally. Even when the wind speed exceeds the critical value by a small margin, the resonance persists (Figure 23) [51].
EN 1991-1-4 [43] provides Strouhal number values based on the geometry of the obstacle. For the bridge deck, the value is estimated as St = 0.1. With a deck thickness of D = 2.04 m, and by substituting the frequencies of the first five bending modes into Equation (6), the corresponding critical wind speeds are obtained, as presented in Table 8.
The critical speeds in Table 8 are lower than the maximum wind speed Umax = 33.3 m/s. In this case, the sensitivity of the deck to vortex shedding must be verified. This sensitivity is governed by the Scruton number, expressed as
S c = 2 δ S m ρ D 2
where δs is the logarithmic decrement of structural damping, expressed by the equation
δ S = 2 π ξ 1 ξ 2
The calculation of the Scruton number is shown in Table 9.
Experience has shown that no risk of excessive vibrations occurs when the Scruton number exceeds 20, whereas the risk becomes significant for values below 10 [52]. In the present case, since Sc = 211.26, the bridge deck is not susceptible to instability due to vortex shedding.

5.2. Flutter in a Single Vibration Mode

5.2.1. Galloping

Galloping is a form of vertical vibration of the bridge deck, occurring in the bending mode along the z-axis. The non-profiled (bluff body) sections of the deck are particularly susceptible to this type of instability.
As shown in Figure 24, the analysis focuses exclusively on the galloping motion along the z-axis, since no drag divergence is observed along the x-axis [53]. The corresponding equation of motion in the z-direction can be expressed as follows:
m z ¨ + 2 m ξ ω z z ˙ + m ω z 2 z = F z = 1 2 ρ U 2 D C z α
where z ¨ , z ˙ and z represent the vertical acceleration, velocity, and displacement of the deck, respectively.
The linearization of the aerodynamic force Fz as a function of speed z ˙ , for an angle of attack α = 0, is written as
F z = 1 2 ρ U D C z 0 z ˙
Equation (9) of motion becomes
m z ¨ + 2 m ξ ω z + 1 2 ρ U D C z 0 z ˙ + m ω z 2 z = 0
The motion becomes unstable if the damping term is zero or negative. The corresponding critical speed is
U C , G = 4 m ξ ω z ρ D C z 0
The condition for UC,G to be positive is Cz′(0) < 0. According to Equation (3), this gives
C z 0 = C D + C L < 0
This corresponds to Den Hartog’s criterion for gallop instability [54]. In this study, the values are CD(0) = 0.086 and CL(0) = 0.045, which yield Cz′(0) = 0.131 > 0. Therefore, there is no risk of galloping.
Eurocode 1 [43] also provides a formula for calculating the critical wind speed that may induce galloping:
U C , G = 2 S c a G f 1 , z D
where f1,z is the first natural frequency of the deck in vertical displacement, and aG is the instability coefficient defined in EN 1991-1-4 [43], with aG =4.7. The condition to be satisfied is:
U C , G > 1.25 U max
According to the calculations in Table 10, we have UC,G = 76.11 m/s > 1.25 Umax = 41.63 m/s. So, there is no risk of galloping.

5.2.2. Torsional Divergence

The analysis is limited to the linear behavior of the bridge deck with respect to torsional vibration. Under the action of the aerodynamic moment, and neglecting the effect of damping, the deck oscillates around the center of torsion C with an angle θ (Figure 25).
The corresponding equation of motion is expressed as
J θ ¨ + K θ θ = M = 1 2 ρ B 2 U 2 C M α
where J is the torsional constant of the deck around the center C. Kθ is the torsional stiffness, which is expressed as a function of the natural frequency ωθ in the form
K θ = J ω θ 2
After linearizing the aerodynamic moment M as a function of rotation θ, for an angle of attack α = 0, one obtains
M = 1 2 ρ B 2 U 2 C M 0 θ
Substituting Equations (17) and (18) into Equation (16), the equation of motion becomes
θ ¨ + ω θ 2 ρ B 2 U 2 C M 0 2 J θ = 0
For aerodynamic instability to occur, the stiffness term in Equation (19) must be equal to or less than zero. This gives a critical speed
U c r , t o r = ω θ B 2 J ρ C M 0
EN 1991-1-4 [43] sets the condition
U c r , t o r > 2 U max
The term under the square root in Equation (19) must be positive. Accordingly, CM(0) must also be positive. For the present case, where the deck is non-profiled, the value is CM(0) = −0.00286 < 0, indicating that there is no risk of torsional divergence.
However, recent research [55] has shown that, in the case of cable-stayed bridges where structural non-linearity is significant and in the presence of wind turbulence, these two parameters can cause torsional divergence.

5.3. Flutter with Two Degrees of Freedom

This type of flutter caused the collapse of the Tacoma Narrows Bridge in the United States in 1940 [10]. Under the action of the wind, the deck oscillates simultaneously in vertical translation along the z-axis and in torsion about point C (Figure 26).
Neglecting the effects of damping, the equation of motion can be written as
m z ¨ + m ω z 2 z = F z = 1 2 ρ B U 2 C z α J θ ¨ + K θ θ = M = 1 2 ρ B 2 U 2 C M α
After linearizing the force Fz and the moment M as a function of the rotation θ, for an angle of attack α = 0, one obtains
m z ¨ + m ω z 2 z = F z = 1 2 ρ B U 2 θ C z 0 J θ ¨ + J ω θ 2 θ = M = 1 2 ρ B 2 U 2 θ C M 0
By developing the system of Equation (23) which is coupled in terms of rotation θ, the critical velocity is obtained:
U c r , f l = 2 π B 2 J f z 2 f θ 2 ρ C M 0
From Equation (24), since CM(0) < 0, the term under the square root is positive only if fz > . As mode 12 is the first torsional mode ( = 1.309 Hz), the first bending mode with an order greater than 12 must be considered. Mode 13 is a symmetrical flexural mode of the deck, coupled with the longitudinal displacement of the west pylon. Therefore, this mode is selected, with a frequency of fz = 1.402 Hz.
The calculation of the critical speed is presented in Table 11. Note that Ucr,fl = 1143 m/s is much higher than Umax = 33.3 m/s. Therefore, there is no risk of flutter at 2DoF.

5.4. Study Limitations

While the study provides valuable insights, several limitations must be acknowledged:
  • Potential fatigue due to nearly continuous vortex shedding vibrations remains a concern and should be carefully monitored.
  • The CFD simulations were conducted in steady-state conditions, which may not capture unsteady flow phenomena such as buffeting or transient gust effects.
  • Only the deck section was modeled in CFD, without explicitly considering the influence of pylons, cables, and traffic loading.
  • Aeroelastic checks were performed using linear assumptions; nonlinear effects, especially under extreme wind events, were not fully addressed.
  • The analysis was limited to a single wind speed (U = 20 m/s) for static coefficient extraction, whereas variable wind intensities and turbulence spectra could affect stability margins.

6. Conclusions and Outlook

This study investigated the aeroelastic stability of the Oued Dib Bridge, Algeria’s first cable-stayed bridge, through a combined modal analysis, CFD simulations, and N aeroelastic assessment. The key findings can be summarized as follows:
  • The modal analysis in the vertical direction gave results in very good agreement with ambient vibration measurements, with a maximum deviation of 3.7% of the natural frequencies.
  • The Oued Dib Bridge, when compared with four other bridges, exhibits good consistency in its modal behavior. The separation between its torsional and bending natural frequencies, with a ratio of 1.6, places it outside the risk associated with two-degree-of-freedom flutter. This demonstrates the good structural design of this bridge.
  • Cable-stayed bridges exhibit low structural damping, which makes them vulnerable to wind effects. In addition, this type of structure shows strong coupling between vibration modes, which makes it impossible to use Rayleigh’s law to calculate modal damping.
  • CFD analysis highlighted flow separation, vortex initiation, and backflow regions around the bluff deck section, confirming its susceptibility to vortex-induced phenomena.
  • The adopted wall function value of Y+ = 30 proved appropriate for capturing boundary-layer behavior at high Reynolds numbers (Re = 1.77 × 10⁷).
  • The coefficient curve CM(α) decreased with AoA, consistent with typical bluff-body decks, unlike streamlined profiles where it increases. The negative sign of the derivative CM’(α) places the structure outside the risk of torsional divergence and two-degree-of-freedom flutter.
  • Aeroelastic checks confirmed no risk of vortex shedding resonance, galloping, torsional divergence, or classical flutter under the design wind speed (Umax = 33.3 m/s).
Building upon the current research, future studies should aim to
  • Extend CFD simulations to unsteady (URANS or LES) approaches to better capture vortex shedding dynamics and buffeting responses.
  • Investigate the combined aeroelastic behavior of the deck and stay cables, particularly under rain–wind excitation, which can accelerate cable fatigue.
  • Explore aerodynamic countermeasures, such as deck edge modifications or fairings, to mitigate vortex-induced vibrations.
  • Perform aeroelastic studies under traffic loading, as moving vehicles can significantly alter the aerodynamic response of the bridge.
  • Validate CFD results with wind tunnel experiments to further confirm accuracy and reliability.

Author Contributions

Conceptualization, Z.S.M.L. and S.M.D.; methodology, S.M.D., Z.R.H. and E.H.; software, Z.S.M.L. and N.C.; validation, N.C., S.M.D. and W.M.; formal analysis, Z.R.H., E.H. and W.M.; investigation, Z.S.M.L. and S.M.D.; resources, N.C., Z.R.H. and W.M.; writing—original draft preparation, Z.S.M.L., S.M.D. and Z.R.H.; writing—review and editing, E.H. and W.M.; visualization, Z.S.M.L. and N.C.; supervision, N.C.; project administration, Z.R.H. and E.H. All authors have read and agreed to the published version of the manuscript.

Funding

This research received no external funding.

Data Availability Statement

The data presented in this study are available on request from the corresponding author.

Conflicts of Interest

The authors declare no conflicts of interest.

Nomenclature

Uwind speed [m/s]
αwind angle of attack [°]
ρair density [Kg/m3]
μdynamic viscosity of air [Kg/m.s]
Bbridge deck width [m]
Dbridge deck thickness [m]
mmass of the deck per unit length [Kg/m]
Jtorsional constant of the deck per unit length [Kg.m2/m]
fz, fθordinary frequencies in the vertical and rotational directions, respectively [Hz]
ωz, ωθcircular frequencies in the vertical and rotational directions, respectively [rad/s]
ξdamping ratio

Abbreviations

The following abbreviations are used in this manuscript:
SymSymmetric mode
AsymAsymmetric mode
LatLateral mode shape
LongLongitudinal mode shape
VerVertical mode shape
TorTorsional mode shape

References

  1. Zhang, B.; Zhu, L. Experimental and Computational Analysis of Large-Amplitude Flutter in the Tacoma Narrows Bridge: Wind Tunnel Testing and Finite Element Time-Domain Simulation. Buildings 2025, 15, 2800. [Google Scholar] [CrossRef]
  2. Wang, D.; Sun, M.; Ma, R.; Shen, X. Numerical Modeling of Ice Accumulation on Three-Dimensional Bridge Cables under Freezing Rain and Natural Wind Conditions. Symmetry 2022, 14, 396. [Google Scholar] [CrossRef]
  3. Deng, Y.; Li, L.; Li, S.; Hu, W. Experimental study on features and control of wind-induced instability of parallel dual main cables of ultra-long-span suspension bridge in construction phases. Eng. Struct. 2025, 333, 120141. [Google Scholar] [CrossRef]
  4. Li, S.; Wang, P.; Wu, Y.; Zou, Y.; Yang, Q.; Tian, J.; Zhou, Y. Experiment study on vortex-induced vibration of variable cross-section bridge tower considering alongwind and acrosswind coupling effect. Eng. Struct. 2025, 327, 119678. [Google Scholar] [CrossRef]
  5. Guo, H.; Tian, S.; Li, J. The Vortex-Induced Vibration Characteristics of the Water-Conveying Truss Pipeline Cable-Stayed Bridge. Appl. Sci. 2025, 15, 9437. [Google Scholar] [CrossRef]
  6. Chen, X.; Yu, H.; Yu, H.; Zhao, P.; Li, M. Aerodynamic Loading and Wind-Induced Vibration Characteristics of Bridge Girders with Typical Asymmetric Configurations. Buildings 2025, 15, 2824. [Google Scholar] [CrossRef]
  7. Holmes, J.D. Wind Loading of Structures, 3rd ed.; CRC Press: Boca Raton, FL, USA, 2018. [Google Scholar]
  8. Larsen, A. Aerodynamics of the Tacoma Narrows Bridge-60 years later. Struct. Eng. Int. 2000, 10, 243–248. [Google Scholar] [CrossRef]
  9. Green, D.; Unruh, W.G. The failure of the Tacoma Bridge: A physical model. Am. J. Phys. 2006, 74, 706–716. [Google Scholar] [CrossRef]
  10. Song, D.; Kim, W.; Kwon, O.K.; Choi, H. Vertical and torsional vibrations before the collapse of the Tacoma Narrows Bridge in 1940. J. Fluid Mech. 2022, 949, A11. [Google Scholar] [CrossRef]
  11. Hu, C.; Zhao, L.; Ge, Y. Wind-induced instability mechanism of Old Tacoma Narrows Bridge from aerodynamic work perspective. J. Bridge Eng. 2022, 27, 04022029. [Google Scholar] [CrossRef]
  12. Ammann, O.H.; Woodruff, G.B. The Failure of the Tacoma Narrows Bridge; Federal Works Agency: Washington, DC, USA, 1941. [Google Scholar]
  13. Scanlan, R.H. The Action of Flexible Bridges under Wind, I: Flutter Theory. J. Sound Vib. 1978, 60, 187–199. [Google Scholar] [CrossRef]
  14. Scanlan, R.H. Motion-related body-force functions in two-dimensional low-speed flow. J. Fluids Struct. 2000, 14, 49–63. [Google Scholar] [CrossRef]
  15. Scanlan, R. Problematic in Formulation of Wind-Force Model for Bridge Decks. J. Struct. Eng. Asce 1993, 119, 1433–1446. [Google Scholar] [CrossRef]
  16. Scanlan, R.H.; Beliveau, J.G.; Budlong, K.S. Indicial Aerodynamic Functions for Bridge Decks. J. Eng. Mech. Div. 1974, 100, 657–672. [Google Scholar] [CrossRef]
  17. Huston, D.R.; Bosch, H.R.; Scanlan, R.H. The Effects of Fairings and of Turbulence on the Flutter Derivatives of a Notably Unstable Bridge Deck. J. Wind. Eng. Ind. Aerodyn. 1988, 29, 339–349. [Google Scholar] [CrossRef]
  18. Diana, G.; Resta, F.; Rocchi, D. A New Numerical Approach to Reproduce Bridge Aerodynamic Non-Linearities in Time Domain. J. Wind. Eng. Ind. Aerodyn. 2008, 96, 1871–1884. [Google Scholar] [CrossRef]
  19. Diana, G.; Rocchi, D.; Argentini, T.; Muggiasca, S. Aerodynamic Instability of a Bridge Deck Section Model: Linear and Nonlinear Approach to Force Modeling. J. Wind. Eng. Ind. Aerodyn. 2010, 98, 363–374. [Google Scholar] [CrossRef]
  20. Diana, G.; Rocchi, D.; Argentini, T. An Experimental Validation of a Band Superposition Model of the Aerodynamic Forces Acting on Multi-Box Deck Sections. J. Wind. Eng. Ind. Aerodyn. 2013, 113, 40–58. [Google Scholar] [CrossRef]
  21. Gao, G.; Zhu, L.; Han, W.; Li, J. Nonlinear Post-Flutter Behavior and Self-Excited Force Model of a Twin-Side-Girder Bridge Deck. J. Wind. Eng. Ind. Aerodyn. 2018, 177, 227–241. [Google Scholar] [CrossRef]
  22. Diana, G.; Resta, F.; Zasso, A.; Belloli, M.; Rocchi, D. Forced Motion and Free Motion Aeroelastic Tests on a New Concept Dynamometric Section Model of the Messina Suspension Bridge. J. Wind. Eng. Ind. Aerodyn. 2004, 92, 441–462. [Google Scholar] [CrossRef]
  23. Náprstek, J.; Pospíšil, S.; Hračov, S. Analytical and Experimental Modelling of Non-Linear Aeroelastic Effects on Prismatic Bodies. J. Wind. Eng. Ind. Aerodyn. 2007, 95, 1315–1328. [Google Scholar] [CrossRef]
  24. Gao, G.; Zhu, L.; Wang, F.; Bai, H.; Hao, J. Experimental Investigation on the Nonlinear Coupled Flutter Motion of a Typical Flat Closed-Box Bridge Deck. Sensors 2020, 20, 568. [Google Scholar] [CrossRef]
  25. Bucher, C.G.; Lin, Y.K. Stochastic Stability of Bridges Considering Coupled Modes. J. Eng. Mech. 1988, 114, 384–400. [Google Scholar] [CrossRef]
  26. Bucher, C.G.; Lin, Y.K. Stochastic Stability of Bridges Considering Coupled Modes: II. J. Eng. Mech. 1989, 115, 384–400. [Google Scholar] [CrossRef]
  27. Wu, T.; Kareem, A. Modeling Hysteretic Nonlinear Behavior of Bridge Aerodynamics via Cellular Automata nested neural network. J. Wind. Eng. Ind. Aerodyn. 2011, 99, 378–388. [Google Scholar] [CrossRef]
  28. Bleich, F. Dynamic instability of truss-stiffened suspension bridges under wind action. Trans. Am. Soc. Civ. Eng. 1949, 114, 1177–1222. [Google Scholar] [CrossRef]
  29. Bisplinghoff, R.L.; Ashley, H. Principles of Aeroelasticity; Courier Corporation: North Chelmsford, MA, USA, 2013. [Google Scholar]
  30. Scanlan, R.H.; Tomko, J.J. Airfoil and bridge deck flutter derivatives. J. Eng. Mech. Div. 1971, 97, 1717–1737. [Google Scholar] [CrossRef]
  31. Wilson, J.C.; Gravelle, W. Modelling of a cable-stayed bridge for dynamic analysis. Earthq. Eng. Struct. Dyn. 1991, 20, 707–721. [Google Scholar] [CrossRef]
  32. Kumar, S.; Nallasivam, K. Modal analysis of natural dynamic frequency for a double deck cable-stayed steel bridge by using finite element method. Discov. Civ. Eng. 2024, 1, 115. [Google Scholar] [CrossRef]
  33. Wen, Y.; Zhou, Z. Qualification of the Ernst formula for modeling the sag effect of super-long stay cables in the long-span railway cable-stayed bridges. Structures 2022, 45, 99–109. [Google Scholar] [CrossRef]
  34. EN 1337; Structural Bearings. European Committee for Standardization: Brussels, Belgium, 2004.
  35. Yamaguchi, H.; Ito, M. Mode-dependence of structural damping in cable-stayed bridges. J. Wind Eng. Ind. Aerodyn. 1997, 72, 289–300. [Google Scholar] [CrossRef]
  36. Kibboua, A.; Farsi, M.N.; Chatelain, J.L.; Guillier, B.; Bechtoula, H.; Mehani, Y. Modal analysis and ambient vibration measurements on Mila-Algeria cable stayed bridge. Struct. Eng. Mech. 2008, 29, 171–186. [Google Scholar] [CrossRef]
  37. Pridham, B.A.; Wilson, J.C. A reassessment of dynamic characteristics of the Quincy Bayview Bridge using output-only identification techniques. Earthq. Engng. Struct. Dyn. 2005, 34, 787–805. [Google Scholar] [CrossRef]
  38. Zhong, R.; Zong, Z.; Niu, J.; Liu, Q.; Zheng, P. A multiscale finite element model validation method of composite cable-stayed bridge based on Probability Box theory. J. Sound Vib. 2016, 370, 111–131. [Google Scholar] [CrossRef]
  39. Cunha, A.; Caetano, E.; Delgado, R. Dynamic Tests on Large Cable-Stayed Bridge. J. Bridge Eng. 2001, 6, 54–62. [Google Scholar] [CrossRef]
  40. Macdonald, J.H.G.; Daniell, W.E. Variation of modal parameters of a cable-stayed bridge identified from ambient vibration measurements and FE modelling. Eng. Struct. 2005, 27, 1916–1930. [Google Scholar] [CrossRef]
  41. Lefaucheur, D.; Bouchon, E. Conception des Ponts à Haubans, Un Savoir Faire Français; Cerema: Bron, France, 2016. [Google Scholar]
  42. RNV. Snow and Wind Regulation; National Center of Integrated Studies and Research of Building: Algiers, Algeria, 2013. [Google Scholar]
  43. EN 1991-1-4; Eurocode 1: Actions on Structures—Part 1–4: General Actions—Wind Actions. European Committee for Standardization: Brussels, Belgium, 2005.
  44. Gulich, D.; Tebaldi, M.; Sierra-Sosa, D. Automatic Quantification of Atmospheric Turbulence Intensity in Space-Time Domain. Sensors 2025, 25, 1483. [Google Scholar] [CrossRef]
  45. Franke, J.; Hellsten, A.; Schlunzen, K.H.; Carissimo, B. The COST 732 Best Practice Guideline for CFD simulation of flows in the urban environment: A summary. Int. J. Environ. Pollut. 2011, 44, 419–427. [Google Scholar] [CrossRef]
  46. Menter, F.R. Two-equation eddy-viscosity turbulence models for engineering applications. AIAA J. 1994, 32, 1598–1605. [Google Scholar] [CrossRef]
  47. Jeong, W.; Liu, S.; Bogunovic Jakobsen, J.; Ong, M.C. Unsteady RANS simulations of flow around a twin-box bridge girder cross section. Energies 2019, 12, 2670. [Google Scholar] [CrossRef]
  48. Hernández, S.; Nieto, F.; Jurado, J.A.; Pérez, I. Bluff body aerodynamics of simplified bridge decks for aeroelastic optimization. In Proceedings of the 7th International Colloquium on Bluff Body Aerodynamics and Applications, Shanghai, China, 2–6 September 2012. [Google Scholar]
  49. Dong, X.; Zhao, L.; Cui, W.; Peng, Y.; Ge, Y. Aerodynamics and aeroelastic performance of a rigid-frame bridge with a bluff body girder subjected to short-rise-time gusts. Eng. Struct. 2022, 263, 114376. [Google Scholar] [CrossRef]
  50. Potts, D.A.; Marcollo, H.; Jayasinghe, K. Strouhal number for vortex-induced vibration excitation of long slender structures. J. Offshore Mech. Arct. Eng. 2022, 144, 041906. [Google Scholar] [CrossRef]
  51. Pan, T.; Li, T.; Li, C.; Yan, Z.; Li, Q. Frequency lock-in mechanism in the presence of blockage effects. Phys. Fluids 2024, 36, 077132. [Google Scholar] [CrossRef]
  52. Cremona, C. Comportement au Vent des Ponts; Presses de l’Ecole Nationale des Ponts et Chaussées: Paris, France, 2002. [Google Scholar]
  53. Chen, C.; Mannini, C.; Bartoli, G.; Thiele, K. Experimental study and mathematical modeling on the unsteady galloping of a bridge deck with open cross section. J. Wind Eng. Ind. Aerodyn. 2020, 203, 104170. [Google Scholar] [CrossRef]
  54. Ma, Z.; Li, J.; Liu, S.; Li, H.; Wang, F. Research on an Improved Method for Galloping Stability Analysis Considering Large Angles of Attack. Appl. Sci. 2023, 13, 5390. [Google Scholar] [CrossRef]
  55. Wang, Z.; Zhu, J.; Zeng, J.; Zhang, Z. Wind-induced asymmetry torsional divergence of long-span bridges: Mechanism, three-dimensional and turbulence effects. Int. J. Struct. Stab. Dyn. 2023, 23, 2350042. [Google Scholar] [CrossRef]
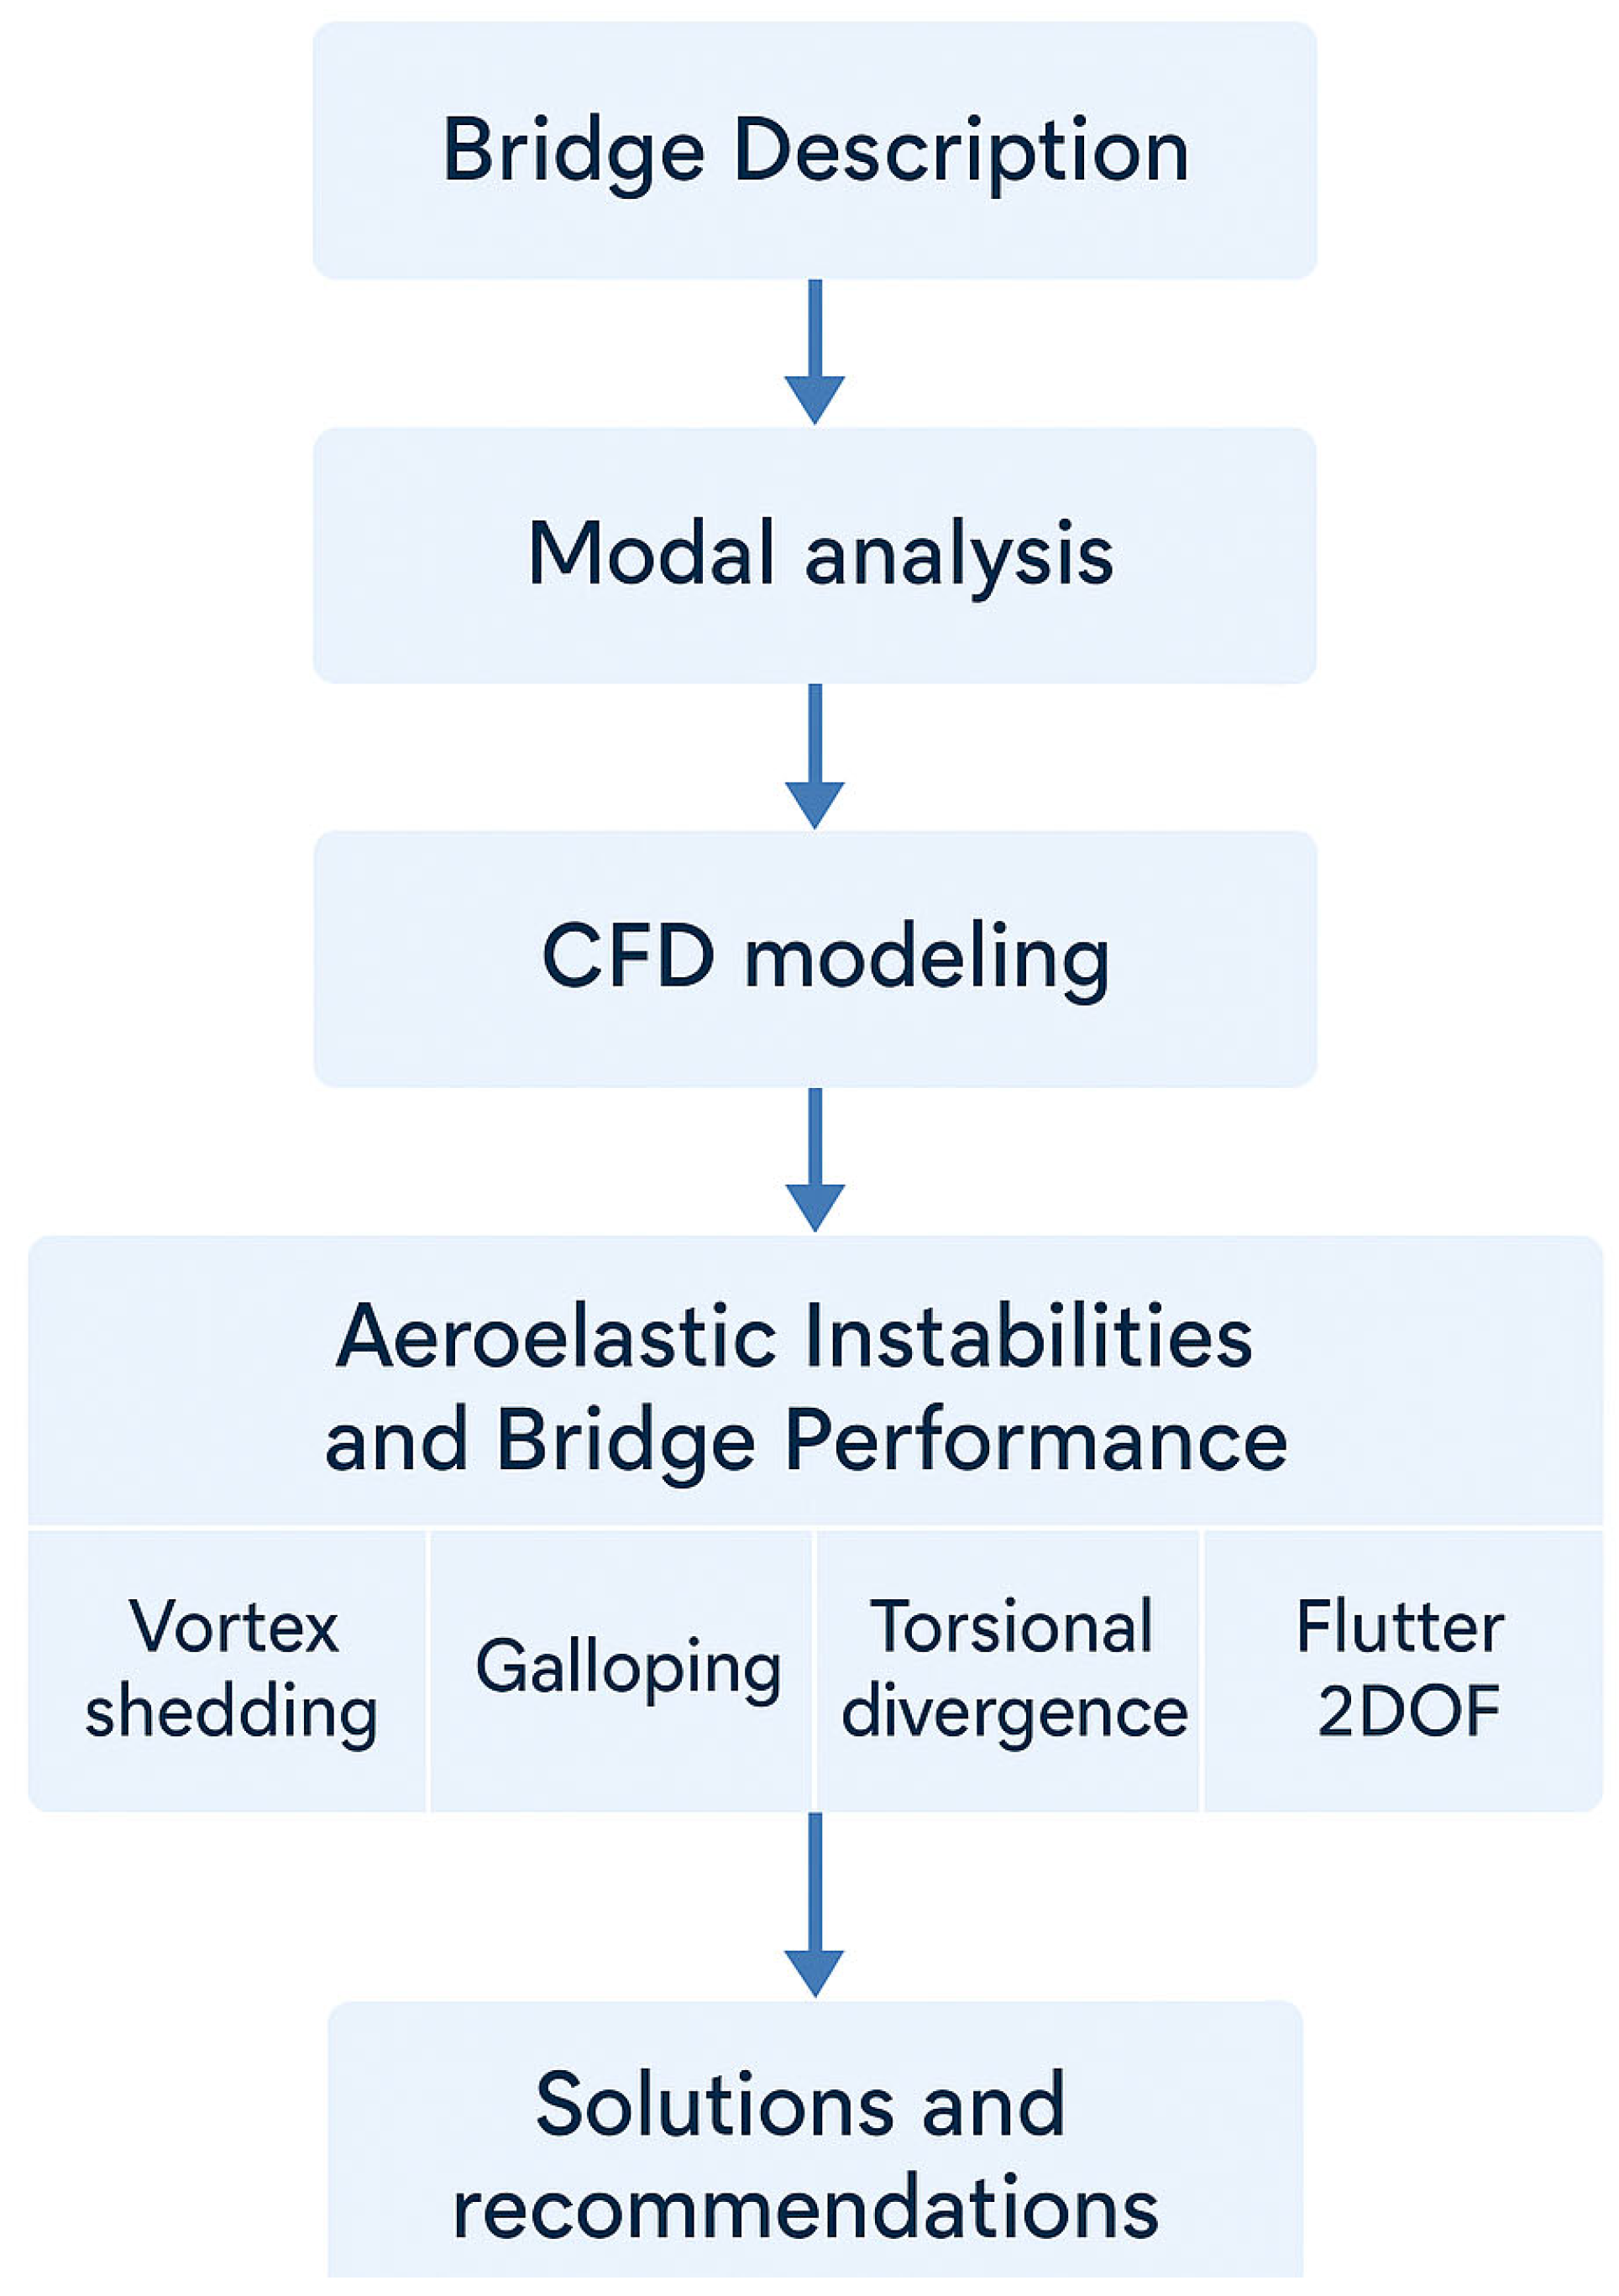
Figure 1. Research methodology flowchart.
Buildings 15 03509 g001
Figure 2. Elevation view of the Oued Dib Bridge.
Buildings 15 03509 g002
Figure 3. Cross section of the deck (units in meter).
Buildings 15 03509 g003
Figure 4. Description of the H-pylon: (a) Elevation view; (b) Cross sections.
Buildings 15 03509 g004
Figure 5. Finite Element Model of the Oued Dib Cable-Stayed Bridge.
Buildings 15 03509 g005
Figure 6. The 3D shapes of the first 6 modes plus the 12th mode.
Buildings 15 03509 g006aBuildings 15 03509 g006b
Figure 7. Measurement versus FE model of the first six modal frequencies of the Oued Dib bridge.
Buildings 15 03509 g007
Figure 8. A comparison of measured natural frequencies: Oued Dib bridge vs. other bridges.
Buildings 15 03509 g008
Figure 9. Normalized shapes of the first 5 vertical modes of the Oued Dib Bridge.
Buildings 15 03509 g009
Figure 10. Normalized shapes of the first 5 torsional modes of the Oued Dib Bridge.
Buildings 15 03509 g010
Figure 11. A comparison of the damping ratio measured for the first four modes: Oued Dib bridge vs. other bridges.
Buildings 15 03509 g011
Figure 12. Measured damping ratios versus natural frequencies across various cable-stayed bridges.
Buildings 15 03509 g012
Figure 13. Domain regions and dimensions.
Buildings 15 03509 g013
Figure 14. Mesh for the entire flow domain.
Buildings 15 03509 g014
Figure 15. Mesh for the bridge section.
Buildings 15 03509 g015
Figure 16. Contour of static pressure (α = 0).
Buildings 15 03509 g016
Figure 17. Contour of velocity magnitude (α = 0).
Buildings 15 03509 g017
Figure 18. Vectors of velocity, direction and magnitude (α = 0).
Buildings 15 03509 g018
Figure 19. Streamlines around the deck (α = 0).
Buildings 15 03509 g019
Figure 20. CD, CL and CM versus angle of attack α.
Buildings 15 03509 g020
Figure 21. Static coefficients in both the wind and deck reference frames.
Buildings 15 03509 g021
Figure 22. Vortex generation behind the bridge deck.
Buildings 15 03509 g022
Figure 23. The lock-in phenomenon in vortex shedding.
Buildings 15 03509 g023
Figure 24. Schematic representation of the galloping.
Buildings 15 03509 g024
Figure 25. Torsion motion of the bridge deck.
Buildings 15 03509 g025
Figure 26. 2DOF floating bridge deck.
Buildings 15 03509 g026
Table 1. Material properties of the bridge.
Mechanical CharacteristicsDeckPylonsCables
Young’s modulus (GPa)39.039.0210.0
Poisson’s ratio0.20.20.3
Weight density (kN/m3)252580
Table 2. Modal characteristics of first 12 modes.
Mode IndexFrequency (Hz)Principal ComponentOther Components
10.356Deck Lat SymPylon East Lat
20.415Deck Vert SymPylons Long
30.511Deck Lat SymPylons Lat
40.609Pylons LongDeck Vert ASym
50.634Pylon West LatDeck Lat Sym
60.824Pylon East LongDeck Vert ASym
70.960Pylon East LatDeck Lat ASym
81.064Pylons LongDeck Vert Sym
91.171Pylons LongDeck Vert ASym
101.210Pylons LatDeck Lat ASym
111.286Deck Vert SymPylons Long
121.309Deck Tor Sym---
Sym: Symmetric mode; Asym: Asymmetric mode; Lat: Lateral mode shape; Long: Longitudinal mode shape; Ver: Vertical mode shape; Tor: Torsional mode shape.
Table 3. A comparison of the first six mode frequencies between the measurement and the FE model in the Oued Dib bridge.
DirectionMeasurement (Hz)FE Model (Hz)Error (%)
Lat10.3900.3568.7
Lat20.5500.5117.1
Ver10.4000.4153.7
Ver20.6300.6093.3
Long10.3800.4159.2
Long20.5600.6098.7
Table 4. A comparison of measured natural frequencies: Oued Dib bridge vs. other bridges.
NameCountryDeck
Material
Main
Span
L (m)
Side
Spans L′ (m)
Deck Wide
B (m)
1st Vert
Mode
(Hz)
1st Lat
Mode
(Hz)
1st Tor
Mode
(Hz)
1Quincy BayviewUSAcomposite2742 × 13414.20.370.560.56
2Oued Dib Algeriaconcrete2802 × 11113.30.400.390.64
3GuanheChinacomposite3402 × 15034.00.380.390.63
4Vasco da GamaPortugalconcrete4202 × 204.631.00.340.300.47
52nd Severn CrossingUKcomposite4562 × 245.334.60.350.340.56
Table 5. Modal damping ratios measured across four distinct cable-stayed bridges.
Quincy Bayview
L = 274 m
Oued Dib
L = 280 m
Vasco da Gama
L = 420 m
2nd Severn Crossing
L = 456 m
f [Hz]ξ [%]f [Hz]ξ [%]f [Hz]ξ [%]f [Hz]ξ [%]
0.371.40.390.240.301.230.340.12
0.561.20.40.40.340.210.60.59
0.630.80.560.340.460.230.820.60
0.70.80.631.250.590.340.980.35
0.741.3--0.650.371.340.36
0.81.0--0.710.78--
0.890.9--0.810.48--
1.181.0--0.980.74--
1.370.9------
Table 6. Boundary conditions.
BoundaryVelocity (U)Pressure (P)
InletU = 20 m/s; α = variableZero gradient
OutletZero gradientP = 0
Deck surfaceUx = 0; Uy = 0;
roughness= 0.3 mm
Zero gradient
Water surfaceUx = 0; Uy = 0;
roughness = 0
Zero gradient
Free surfaceZero gradientZero gradient
Table 7. CD, CL and CM vs. angle of attack α.
α (°)CDCLCM
−10.00.0860310.069853−0.075736
−8.00.0860310.071542−0.075845
−6.00.0860360.073197−0.075949
−4.00.0860520.074833−0.076048
−2.00.0860880.076442−0.076145
0.00.0861280.078070−0.076241
2.00.0861810.079649−0.076342
4.00.0862530.081237−0.076438
6.00.0863290.082864−0.076530
8.00.0864190.084508−0.076619
10.00.0865290.086167−0.076705
Table 8. Critical wind speeds for vortex shedding.
Mode Indexfvs (Hz) Ucr,v (m/s)
mode 20.4158.47
mode 40.60912.42
mode 60.82416.81
mode 81.06421.71
mode 91.17123.89
Table 9. Scruton number calculation.
ξ = 0.4%δs = 0.025m = 21,540 Kg/mL
Sc = 211.26
ρ = 1.225 Kg/m3D = 2.04 m
Table 10. UC,G calculation.
Sc = 211.26aG = 4.7f1,z = 0.415 Hz UC,G = 76.11 m/sD = 2.04 mUmax = 33.3 m/s
Table 11. Ucr,fl Calculation.
B = 13.3 mJ = 40,694 Kg.mρ = 1.225 Kg/m3C’M(0) = −0.00286
Ucr,fl = 1143 m/s
fθ = 1.309 Hzfz = 1.402 Hz
Disclaimer/Publisher’s Note: The statements, opinions and data contained in all publications are solely those of the individual author(s) and contributor(s) and not of MDPI and/or the editor(s). MDPI and/or the editor(s) disclaim responsibility for any injury to people or property resulting from any ideas, methods, instructions or products referred to in the content.