1. Introduction
The increasing demand for sustainable building solutions has intensified research into energy-efficient roofing technologies, particularly cool roofs and photovoltaic (PV) systems. These technologies offer significant potential to reduce building energy consumption and mitigate urban heat island effects, yet their comprehensive environmental and economic viability remains underexplored. While prior studies have evaluated cool roofs and PV roofs separately using life cycle assessment (LCA) [
1] or cost–benefit analysis [
2], a unified framework that integrates economic, energy, and environmental payback periods has not been sufficiently developed.
Cool roofs, designed to reflect more sunlight and absorb less heat than conventional roofs, have been widely studied for their energy-saving benefits in cooling-dominated climates [
3,
4]. Similarly, PV roofs contribute to renewable energy generation, reducing reliance on fossil fuels [
5,
6]. However, existing evaluations often focus on single dimensions—either energy savings, economic feasibility, or environmental impact—without considering their interdependencies. For instance, while a cool roof may reduce cooling loads, its manufacturing process may involve materials with high embodied carbon [
4]. Conversely, PV roofs require significant upfront investments but offer long-term energy and emissions savings [
7]. A holistic assessment is therefore necessary to guide decision-making in building design and policy.
The evaluation of sustainable roofing technologies has undergone significant advancements in recent years, with increasing emphasis on life cycle assessment (LCA) methodologies to quantify environmental impacts [
8,
9]. Previous studies have predominantly focused on comparing conventional roofing systems with emerging alternatives, such as green roofs, cool roofs, and photovoltaic (PV) integrated systems. However, these assessments often employ fragmented methodologies, addressing energy efficiency, economic feasibility, or environmental benefits in isolation, rather than adopting a holistic, integrated approach [
10,
11]. This segmented focus limits the ability to comprehensively evaluate the multi-dimensional performance of sustainable roofing technologies, highlighting the need for more unified analytical frameworks that simultaneously consider energy, economic, and environmental dimensions.
The adoption of cool roofs has emerged as a promising strategy to mitigate urban heat island effects and reduce building energy consumption [
4]. Recent studies have extensively evaluated the environmental and economic performance of cool roofs through life cycle assessment (LCA) methodologies. For instance, Scolaro and Ghisi [
8] conducted a comprehensive review of green roof systems, highlighting the critical role of material selection in optimizing energy efficiency and environmental impacts. While their focus was on green roofs, their findings underscore the importance of material innovation for sustainable roofing technologies, including cool roofs.
Building on this, Pirvaram et al. [
10] systematically analyzed radiative cooling technologies for buildings, integrating techno-enviro-economic assessments with LCA frameworks. Their research demonstrated that cool roofs significantly reduce cooling energy demand, achieving reductions of 20–40%, while simultaneously lowering greenhouse gas emissions over their lifecycle. However, they emphasized that performance is highly contingent on climatic conditions—a finding further substantiated by the work of Pique et al. This variability underscores the importance of contextual factors in assessing the effectiveness of cool roofs, highlighting the need for region-specific evaluations to optimize their implementation and benefits [
12], who compared the global warming potential (GWP) of green and conventional roofs in cold climates. Although their results indicated limited benefits of green roofs in such regions, cool roofs exhibited superior adaptability due to their simpler design and lower maintenance requirements.
From an economic perspective, Katebi et al. [
1] evaluated multiple roof systems and found that cool roofs achieved the highest cost–benefit ratio among sustainable options, reducing annual energy costs by 15–30% while maintaining minimal environmental footprints. This aligns with the technical analysis by Ma et al. [
13], who tested a novel cool roof prototype on low-rise prefabricated buildings in China. Their field measurements confirmed a 25% reduction in peak cooling loads, emphasizing the technology’s scalability for rapidly urbanizing regions.
LCA has become a standard tool for assessing the environmental footprint of building materials and systems across their entire life cycle, from raw material extraction to disposal [
14,
15]. Several studies have applied LCA to compare traditional gravel-ballasted roofs with green roofs and reflective cool roofs. For instance, Rasul et al. demonstrated that extensive green roofs exhibit lower global warming potential (GWP) over their lifespan compared to conventional roofs, primarily due to reduced urban heat island effects and stormwater management benefits [
16]. Similarly, Koroxenidis et al. highlighted that intensive green roofs, while offering greater ecological benefits, often incur higher initial embodied energy due to complex substrate layers and irrigation requirements [
17].
Cool roofs have been primarily evaluated for their operational energy savings in cooling-dominated climates. Research by Aggarwal demonstrated that reflective roofing membranes can reduce cooling energy demand by up to 20%; however, their manufacturing processes often involve polymer-based materials with significant carbon footprints [
18]. In contrast, Cubi’s findings revealed that in cold climates, the heating penalty associated with cool roofs may offset their cooling benefits, highlighting the necessity for region-specific adjustments in life cycle assessment (LCA) methodologies [
19]. These contrasting outcomes emphasize the importance of tailoring cool roof evaluations to specific climatic conditions to ensure their effectiveness and sustainability across diverse geographic contexts.
Photovoltaic roofs represent another sustainable alternative, with studies like [
20] quantifying their energy payback periods (typically 2–4 years) and carbon offset potential. However, the integration of PV with roofing systems introduces additional complexity in LCA due to material compatibility, maintenance requirements, and end-of-life recycling challenges.
Beyond environmental impacts, the economic feasibility of roofing technologies has been assessed through life cycle costing (LCC) and static/dynamic payback period analyses. The conventional static payback period, which calculates the time required to recover initial investments through energy savings, has been widely used for its simplicity. For example, Ref. [
21] compared radiative cooling roofs and PV systems, showing that radiative cooling achieves faster economic payback in hot climates due to lower installation costs.
Energy payback period (EPP) analysis extends this concept by evaluating the time needed for a system to generate energy equivalent to its embodied energy. Studies such as [
12] have applied EPP to green roofs, revealing that their long lifespan (40+ years) compensates for higher initial energy inputs. However, these analyses often neglect the interplay between energy savings and environmental impacts, leading to incomplete sustainability assessments.
To address this gap, we propose a novel 3-E static payback period framework that evaluates roofing technologies across three dimensions: Economic, Energy, and Environmental payback periods. This approach extends the conventional static payback period [
22] by incorporating environmental impact metrics derived from Life Cycle Assessment (LCA). Specifically, the economic payback period assesses the time required to recover initial costs, the energy payback period quantifies the duration needed to offset energy inputs, and the environmental payback period measures the time required to neutralize lifecycle environmental impacts. By integrating these metrics, our framework enables a more holistic and balanced comparison of roofing alternatives, accounting for both short-term financial considerations and long-term sustainability benefits.
The novelty of this work lies in its multi-dimensional payback analysis, which synthesizes LCA results with financial and energy performance metrics into a unified evaluation framework. Unlike prior research that often examines these dimensions in isolation, this paper offers a consolidated approach designed to serve the diverse needs of stakeholders, including architects, policymakers, and building owners. Furthermore, we apply this framework to a comparative case study of cool roofs and PV roofs, investigating how material choices, regional climate conditions, and energy mixes influence payback timelines. Our findings reveal critical trade-offs between initial investments and long-term gains, providing actionable insights for advancing sustainable building practices and informing decision-making processes.
2. Target Selection and Scope Definition
From the perspective of energy utilization, roof energy-saving technologies can be divided into two categories: active and passive. Active roof technologies, such as photovoltaic roofs and solar thermal systems, convert solar energy into electricity or heat for human use. The generated electricity can power lighting, sockets, and air conditioning systems, while the collected thermal energy can be used for cooling, heating, and domestic hot water, thereby reducing building energy consumption. Passive roof technologies, such as green roofs, cool reflective roofs, and ventilated roofs, modify the building envelope to reduce heat transfer from the external environment into the interior, thereby lowering air conditioning energy demand and conserving building energy [
23].
These two approaches differ fundamentally: one directly reduces the building’s cooling load at the source, while the other compensates for the existing load by utilizing solar energy on the demand side. The former achieves direct energy savings at the source, whereas the latter relies on additional energy compensation. To determine which technology holds greater promise in energy efficiency, a quantitative analysis is necessary.
From a societal perspective, energy savings during the operational phase of any system or technology may not represent true energy conservation. In reality, operational-phase savings often merely shift energy consumption from the usage stage to the production stage. Thus, from a holistic societal viewpoint, energy is still being consumed. This necessitates the introduction of a life cycle assessment (LCA) framework. Additionally, the question of whether the energy consumed in manufacturing solar photovoltaic panels and thermal collectors outweighs the energy they generate during operation must also be analyzed from a full life cycle perspective.
Given the uncertainties and knowledge gaps in assessing the life cycle impacts of green vegetation, this study focuses on comparing cool reflective roofs and photovoltaic roofs. A comprehensive life cycle assessment is conducted from economic, energy, and environmental (3-E) perspectives, establishing a 3-E payback period framework for evaluating roof energy-saving technologies.
A complete life cycle consists of five stages: raw material extraction, equipment manufacturing, system installation, operation and maintenance, and end-of-life disposal [
24]. In this study, due to the impracticality of recycling roof coatings and the challenges in recycling photovoltaic components, the final waste disposal stage is omitted.
For this experiment, a pure titanium dioxide-epoxy resin coating was chosen as the cool roof reflective coating, with the mass ratio of water-epoxy resin-titanium dioxide approximately set at 2:2:1. The life cycle assessment (LCA) input and output parameters for both epoxy resin and titanium dioxide were sourced from Simapro (version 9.5), a widely used LCA software tool. The energy input for the manufacturing process was electricity, which was accounted for in the LCA to evaluate the environmental impacts associated with the production and application of the coating. This approach ensures a comprehensive assessment of the coating’s lifecycle, from raw material extraction to its functional use as a cool roof solution.
3. Energy Consumption Analysis
To compare the energy-saving performance between photovoltaic roofs and cool reflective roofs, it is necessary to simulate the energy consumption of both roof types. To simplify the model, a 10 m × 10 m building model was constructed in EnergyPlus (version 9.4.0). For the cool roof, the reflectance was set at 0.85 and emissivity at 0.9, covering the entire 100 m2 roof surface. For the photovoltaic roof, photovoltaic panels with a total area of 73.8 m2 were installed on the roof of the aforementioned model. Considering efficient utilization of electricity to avoid waste, a 10 kW grid-tied inverter was incorporated—drawing power from the grid when photovoltaic production is insufficient and feeding excess power back to the grid when production exceeds demand.
The energy performance of the building, including the reflective effect of the BIPV roof, was modeled using EnergyPlus. Key material properties of the PV panels, such as reflectivity, absorptivity, and emissivity, were input into the simulation to accurately capture their impact on the building’s thermal performance. The PV panels were treated as an integral part of the roof, ensuring that their reflective effect on solar radiation was fully accounted for in the energy calculations. The building thermal performance and operating parameters can be seen in
Table 1.
The climate profile data for Jiangsu Province were obtained from the EnergyPlus website, specifically the EPW (EnergyPlus Weather) file for Nanjing, which is representative of the region. This file includes hourly weather data for temperature, solar radiation, humidity, and wind speed, essential for accurate energy modeling.
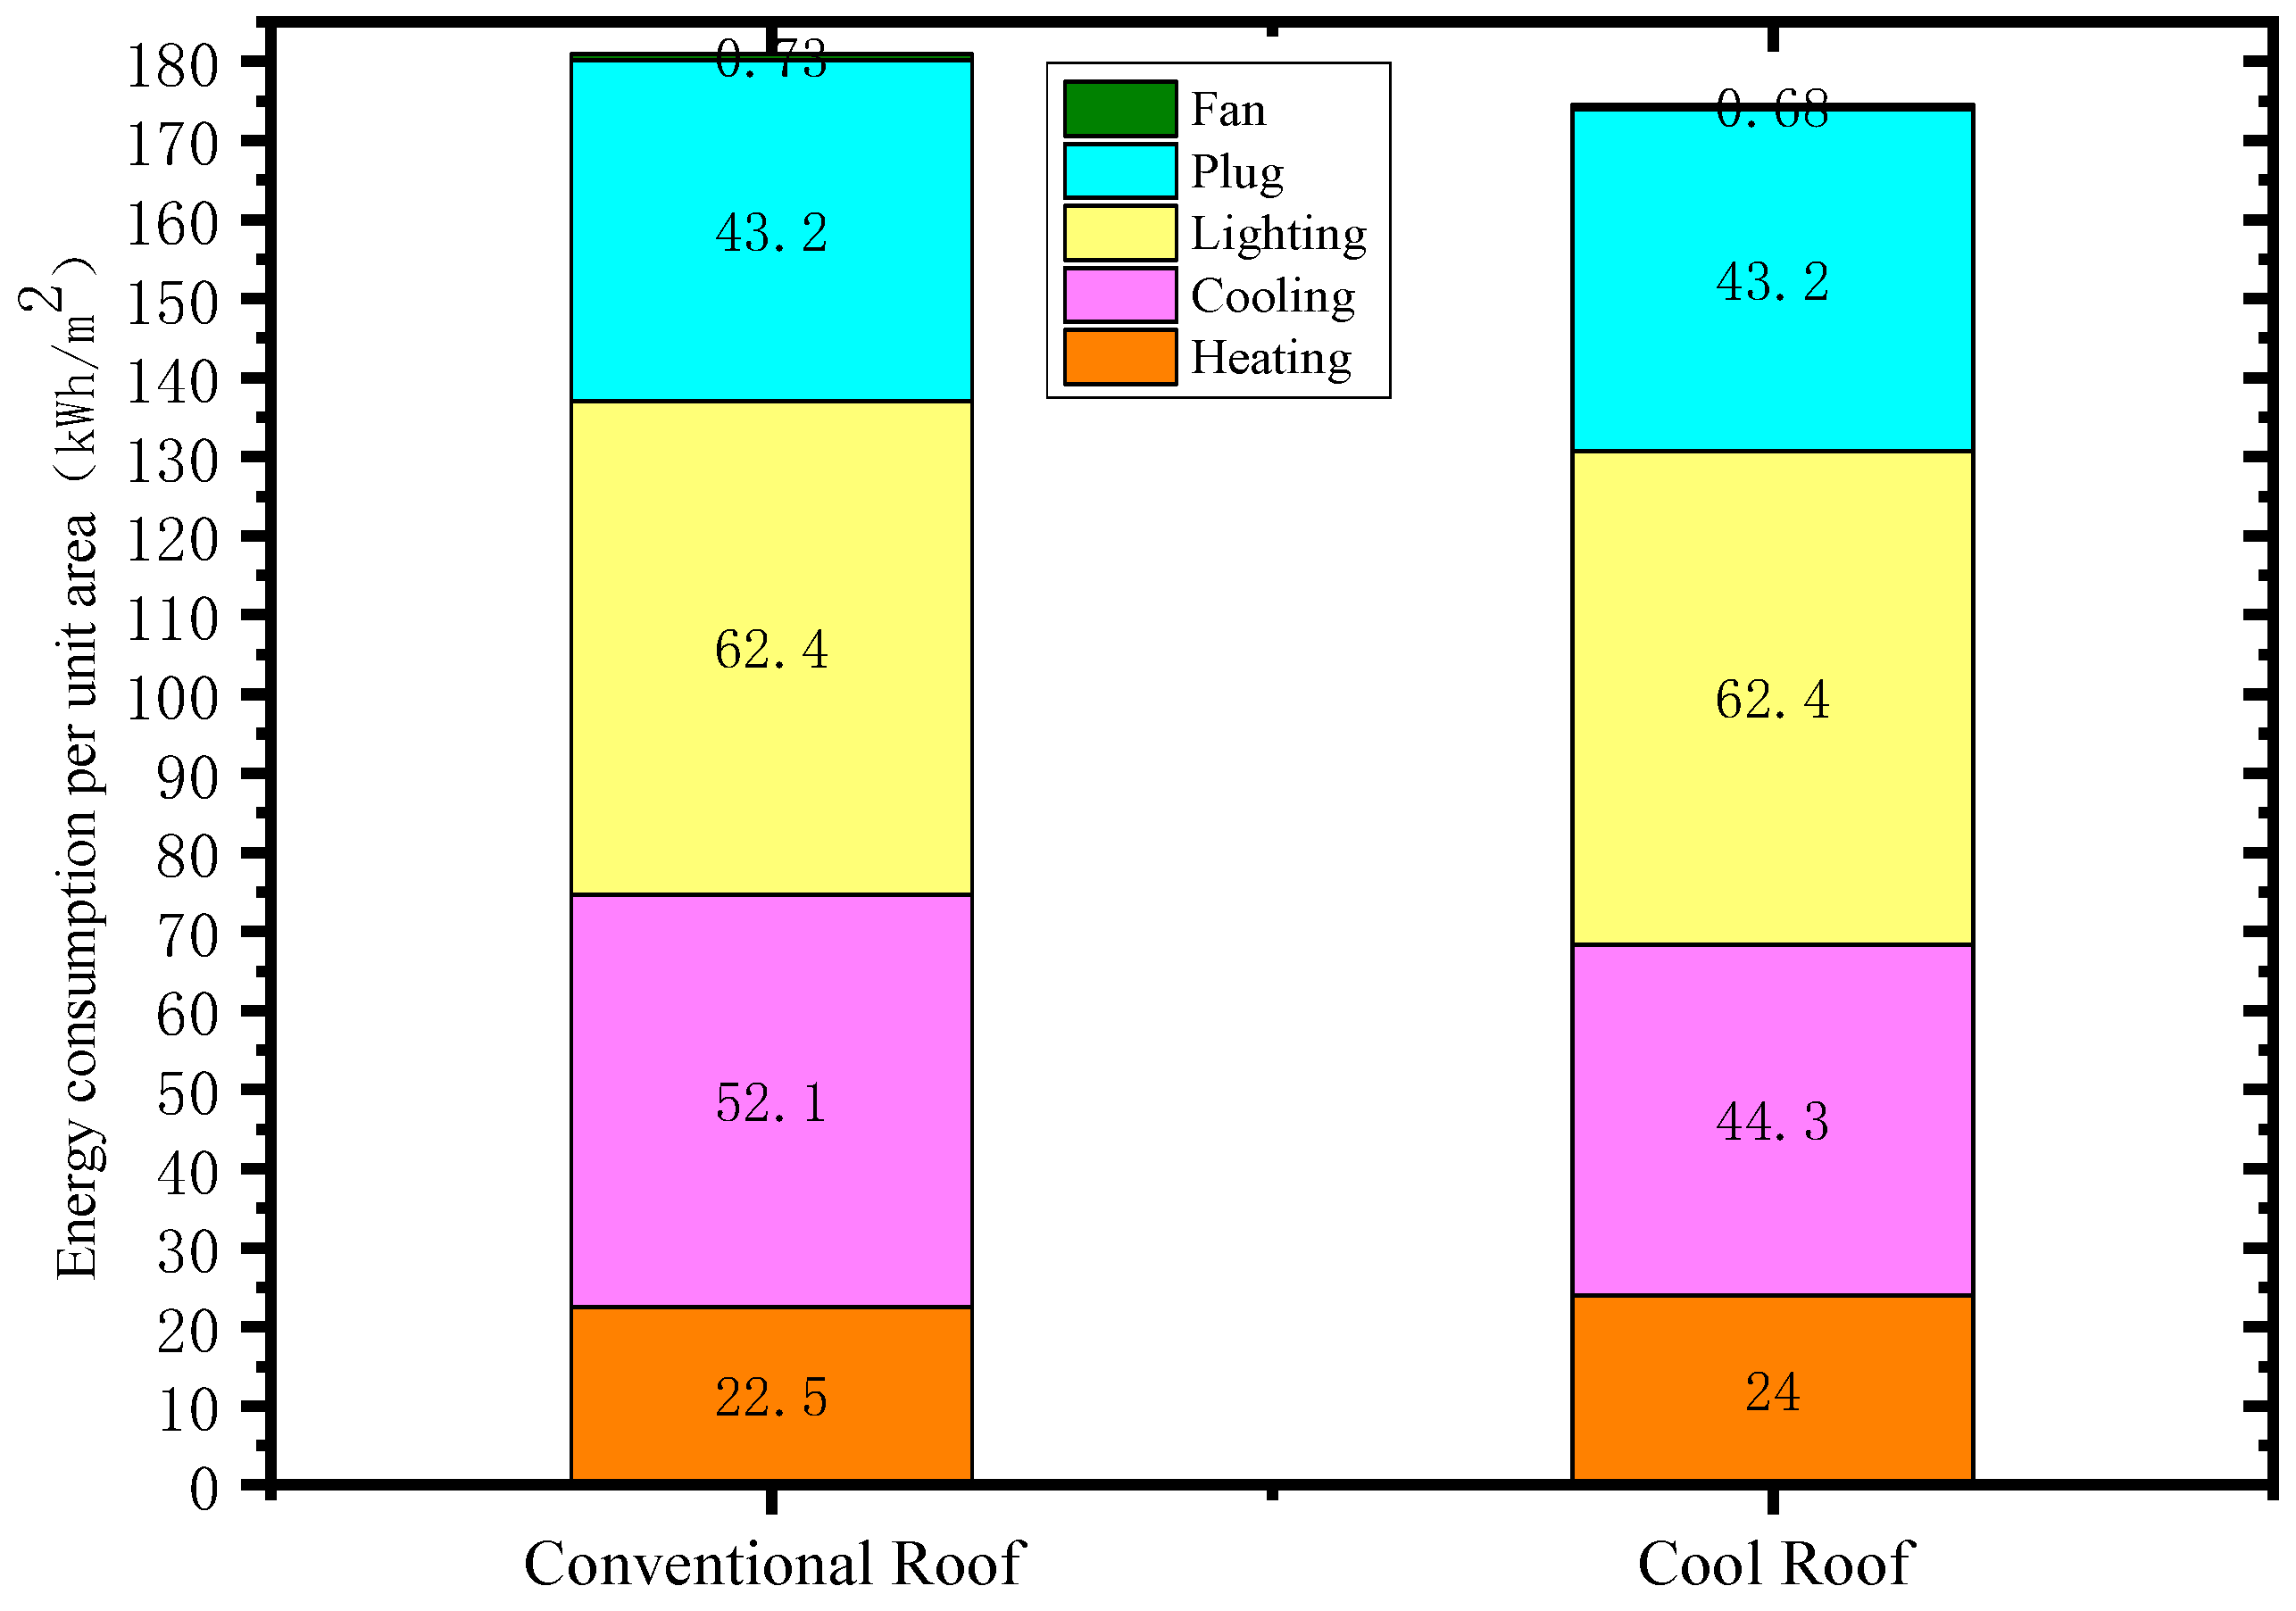
Annual building energy consumption simulations were conducted, with the comparative energy performance between the cool roof and conventional roof illustrated in
Figure 1.
As shown in
Figure 2, the implementation of the cool roof resulted in an annual electricity savings of 6.5 kWh/m
2, representing an 8.6% reduction in total energy consumption. Specifically, heating energy consumption increased by 6.3%, while cooling energy consumption decreased by 15.0%.
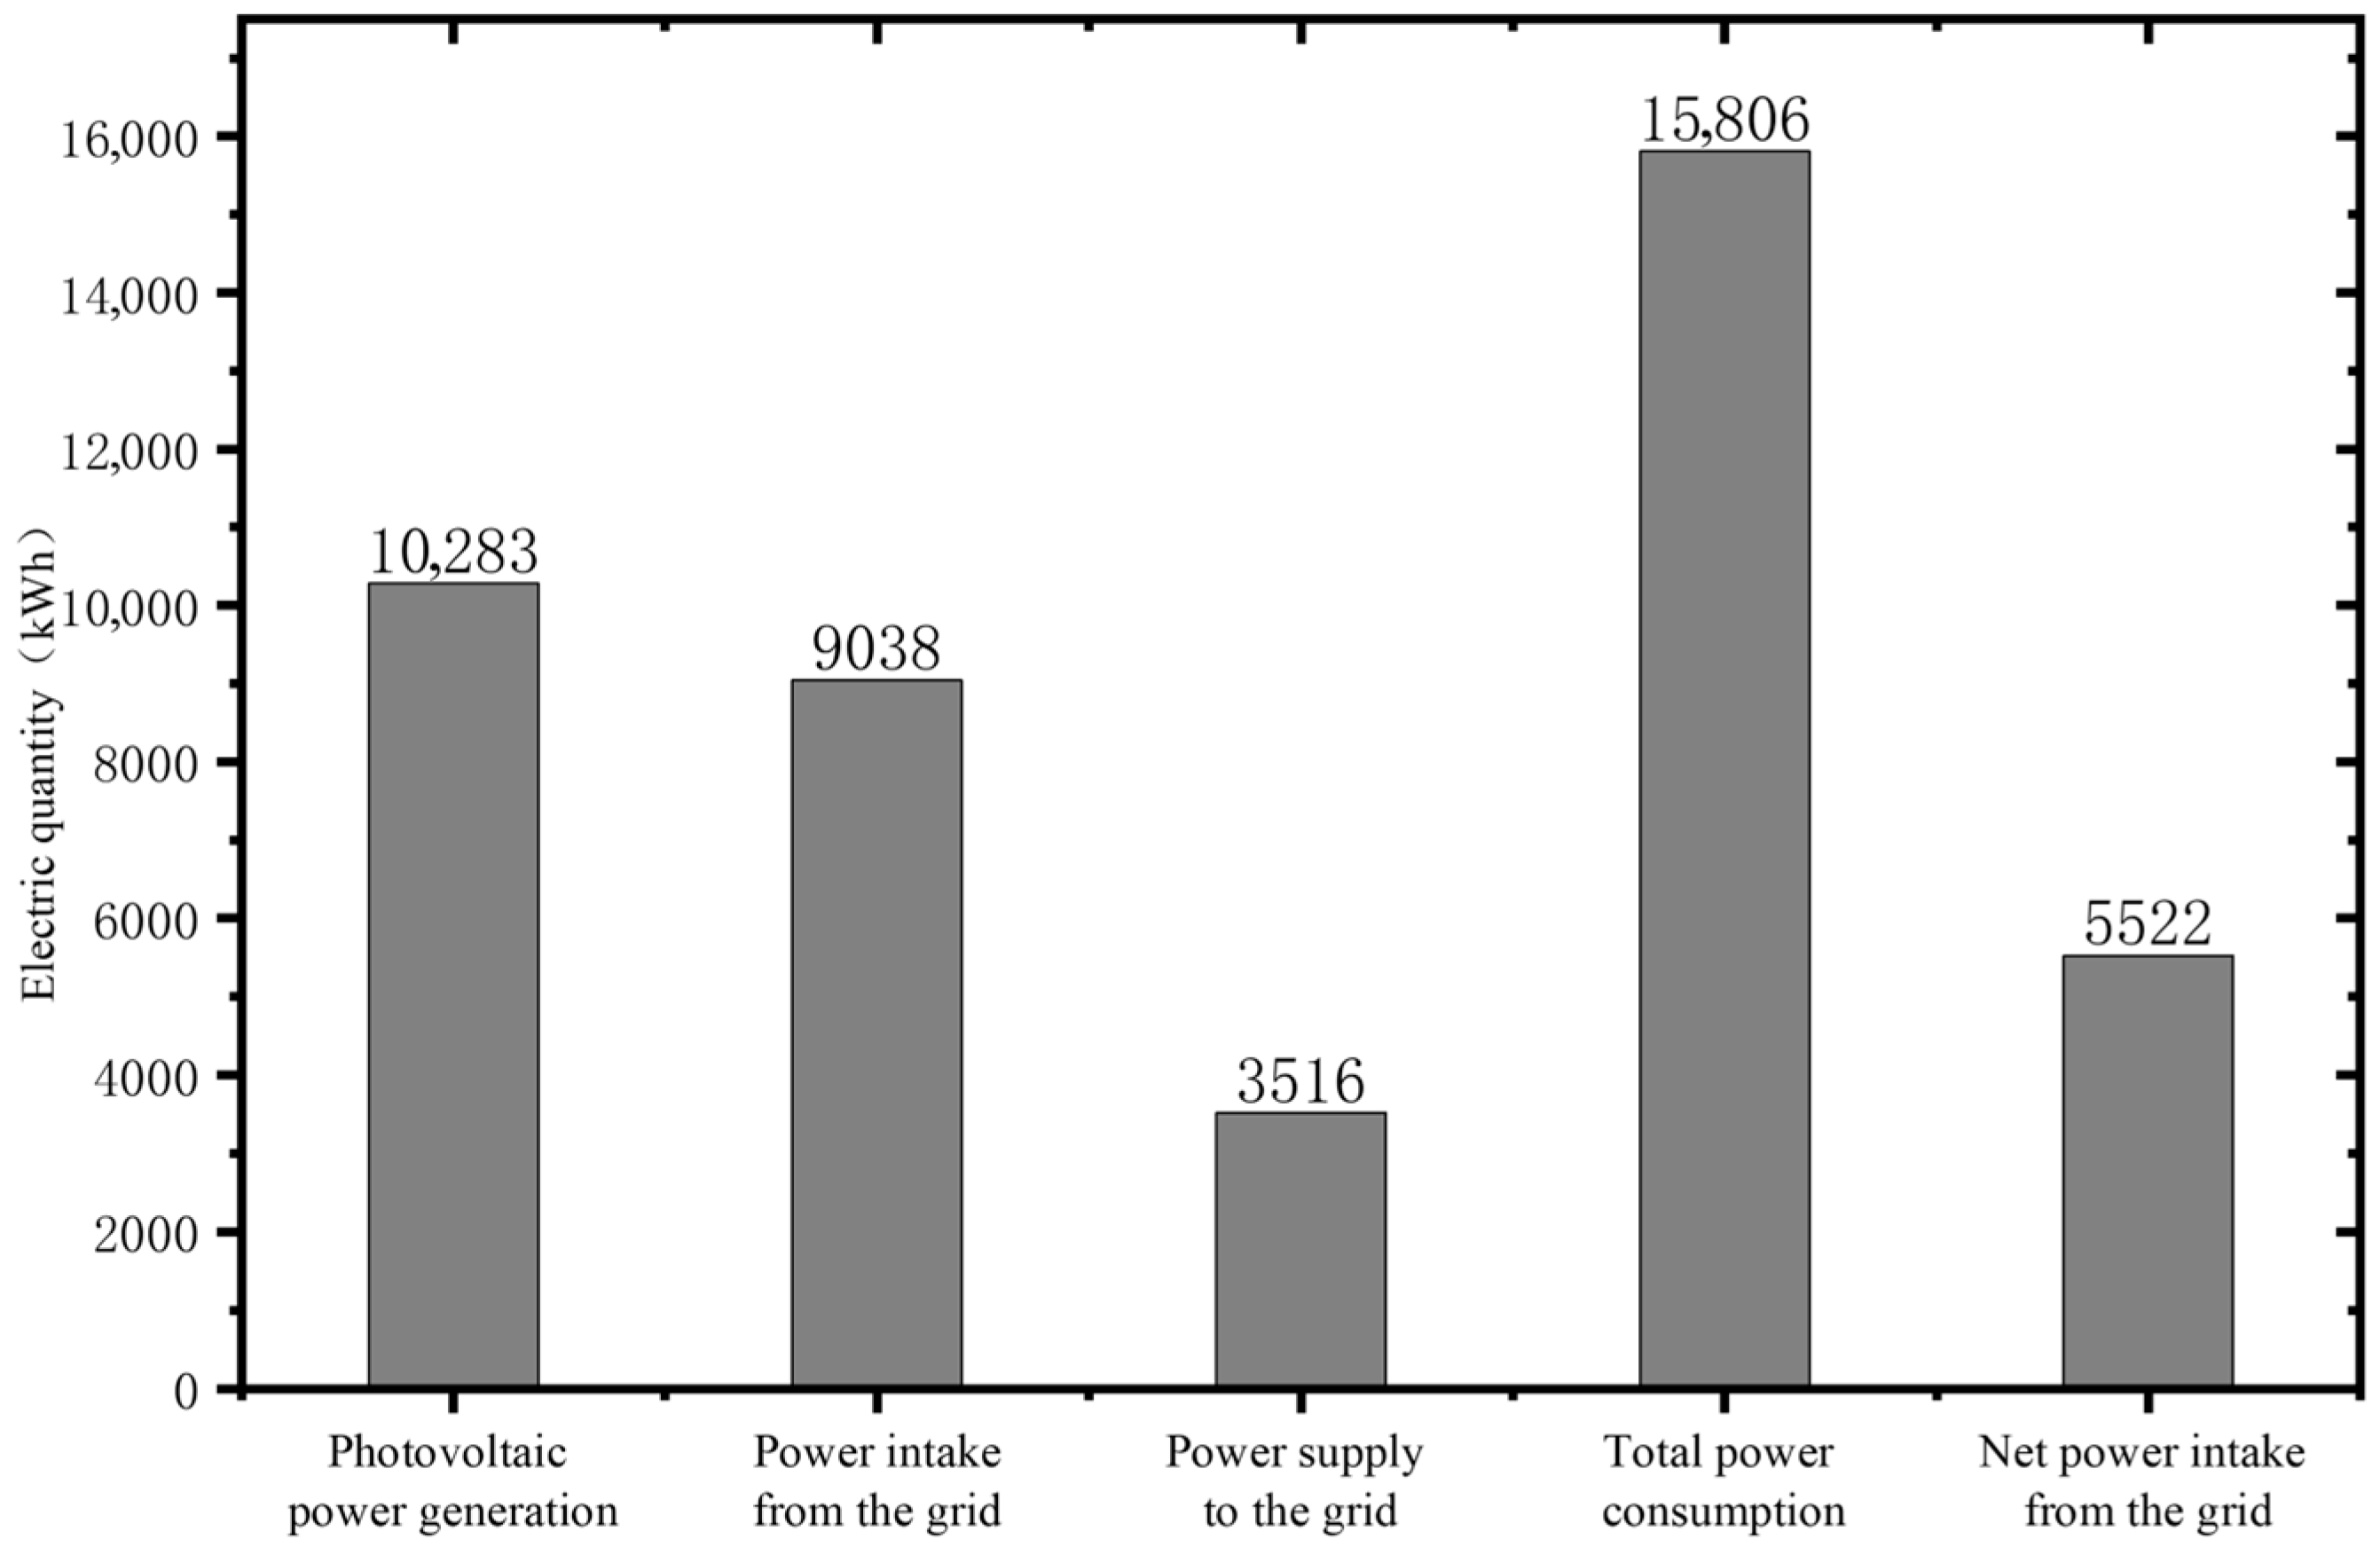
The power generation/supply profile of the photovoltaic panels on the PV roof is presented in
Figure 3.
The data reveals that the photovoltaic (PV) panels generated a total annual electricity output of 10,283 kWh. Of this amount, 3516 kWh (34.2% of total generation) was exported to the grid during periods of low building demand, while the remaining 6767 kWh (65.8%) was consumed on-site to meet the building’s electrical load. The building’s total annual electricity consumption reached 15,806 kWh, with 9038 kWh (57.2% of total consumption) sourced from grid purchases and the balance supplied by the PV system’s self-generation.
4. Life Cycle Assessment of Roof Energy Efficiency
From the above analysis, it can be observed that for annual building energy consumption, the cool roof achieves an annual energy saving of 6.5 kWh/m2, while a 73.8 m2 photovoltaic roof generates 10,283 kWh annually. This translates to an energy saving of 10,283/73.8 = 139 kWh/m2 for the photovoltaic roof. Therefore, in terms of annual energy savings alone, photovoltaic roofs are significantly superior to cool roofs.
For the heat-reflective cool roof, actual tests show that 20 kg of coating can cover 40 m2 of roof area, meaning the required coating mass per square meter is 0.5 kg. Based on the approximate ratio of 2:2:1 for water–epoxy resin–titanium dioxide in the titanium dioxide–epoxy resin coating, it can be deduced that 1 m2 of roof area requires about 0.2 kg of water, 0.2 kg of epoxy resin, and 0.1 kg of TiO2 crystals. The energy consumption during coating production mainly comes from the mechanical work consumed during the grinding and mixing of solids and the electricity consumed during the high-temperature calcination stage. Calculations show that producing 1 kg of coating consumes approximately 1.6 kWh of electricity, based on the average energy consumption observed during the preparation process in our laboratory.
For the photovoltaic roof, its main components include photovoltaic panels, inverters, connectors, and support structures. On average, 1 m2 of polycrystalline silicon photovoltaic panels requires about 3.35 kg of aluminum and 3.21 kg of steel. The input–output parameters for titanium dioxide (sulfate method), epoxy resin, and photovoltaic panels can be found in the Simapro database and imported into the life cycle assessment model for calculation.
The environmental factors in this study are quantified through a series of normalization and weighting operations performed using SimaPro software. While the detailed LCA calculation process is not the focus of this paper, the results are incorporated into the 3-E framework to assess environmental payback
The data presented in
Figure 4,
Figure 5,
Figure 6 and
Figure 7 were calculated using Simapro software, which incorporates an extensive built-in database for life cycle assessment. The database is an integral component of the software and provides the necessary datasets for modeling the environmental impacts of cool roofs and photovoltaic roofs. The calculations were conducted based on the specific input parameters and assumptions detailed in the study.
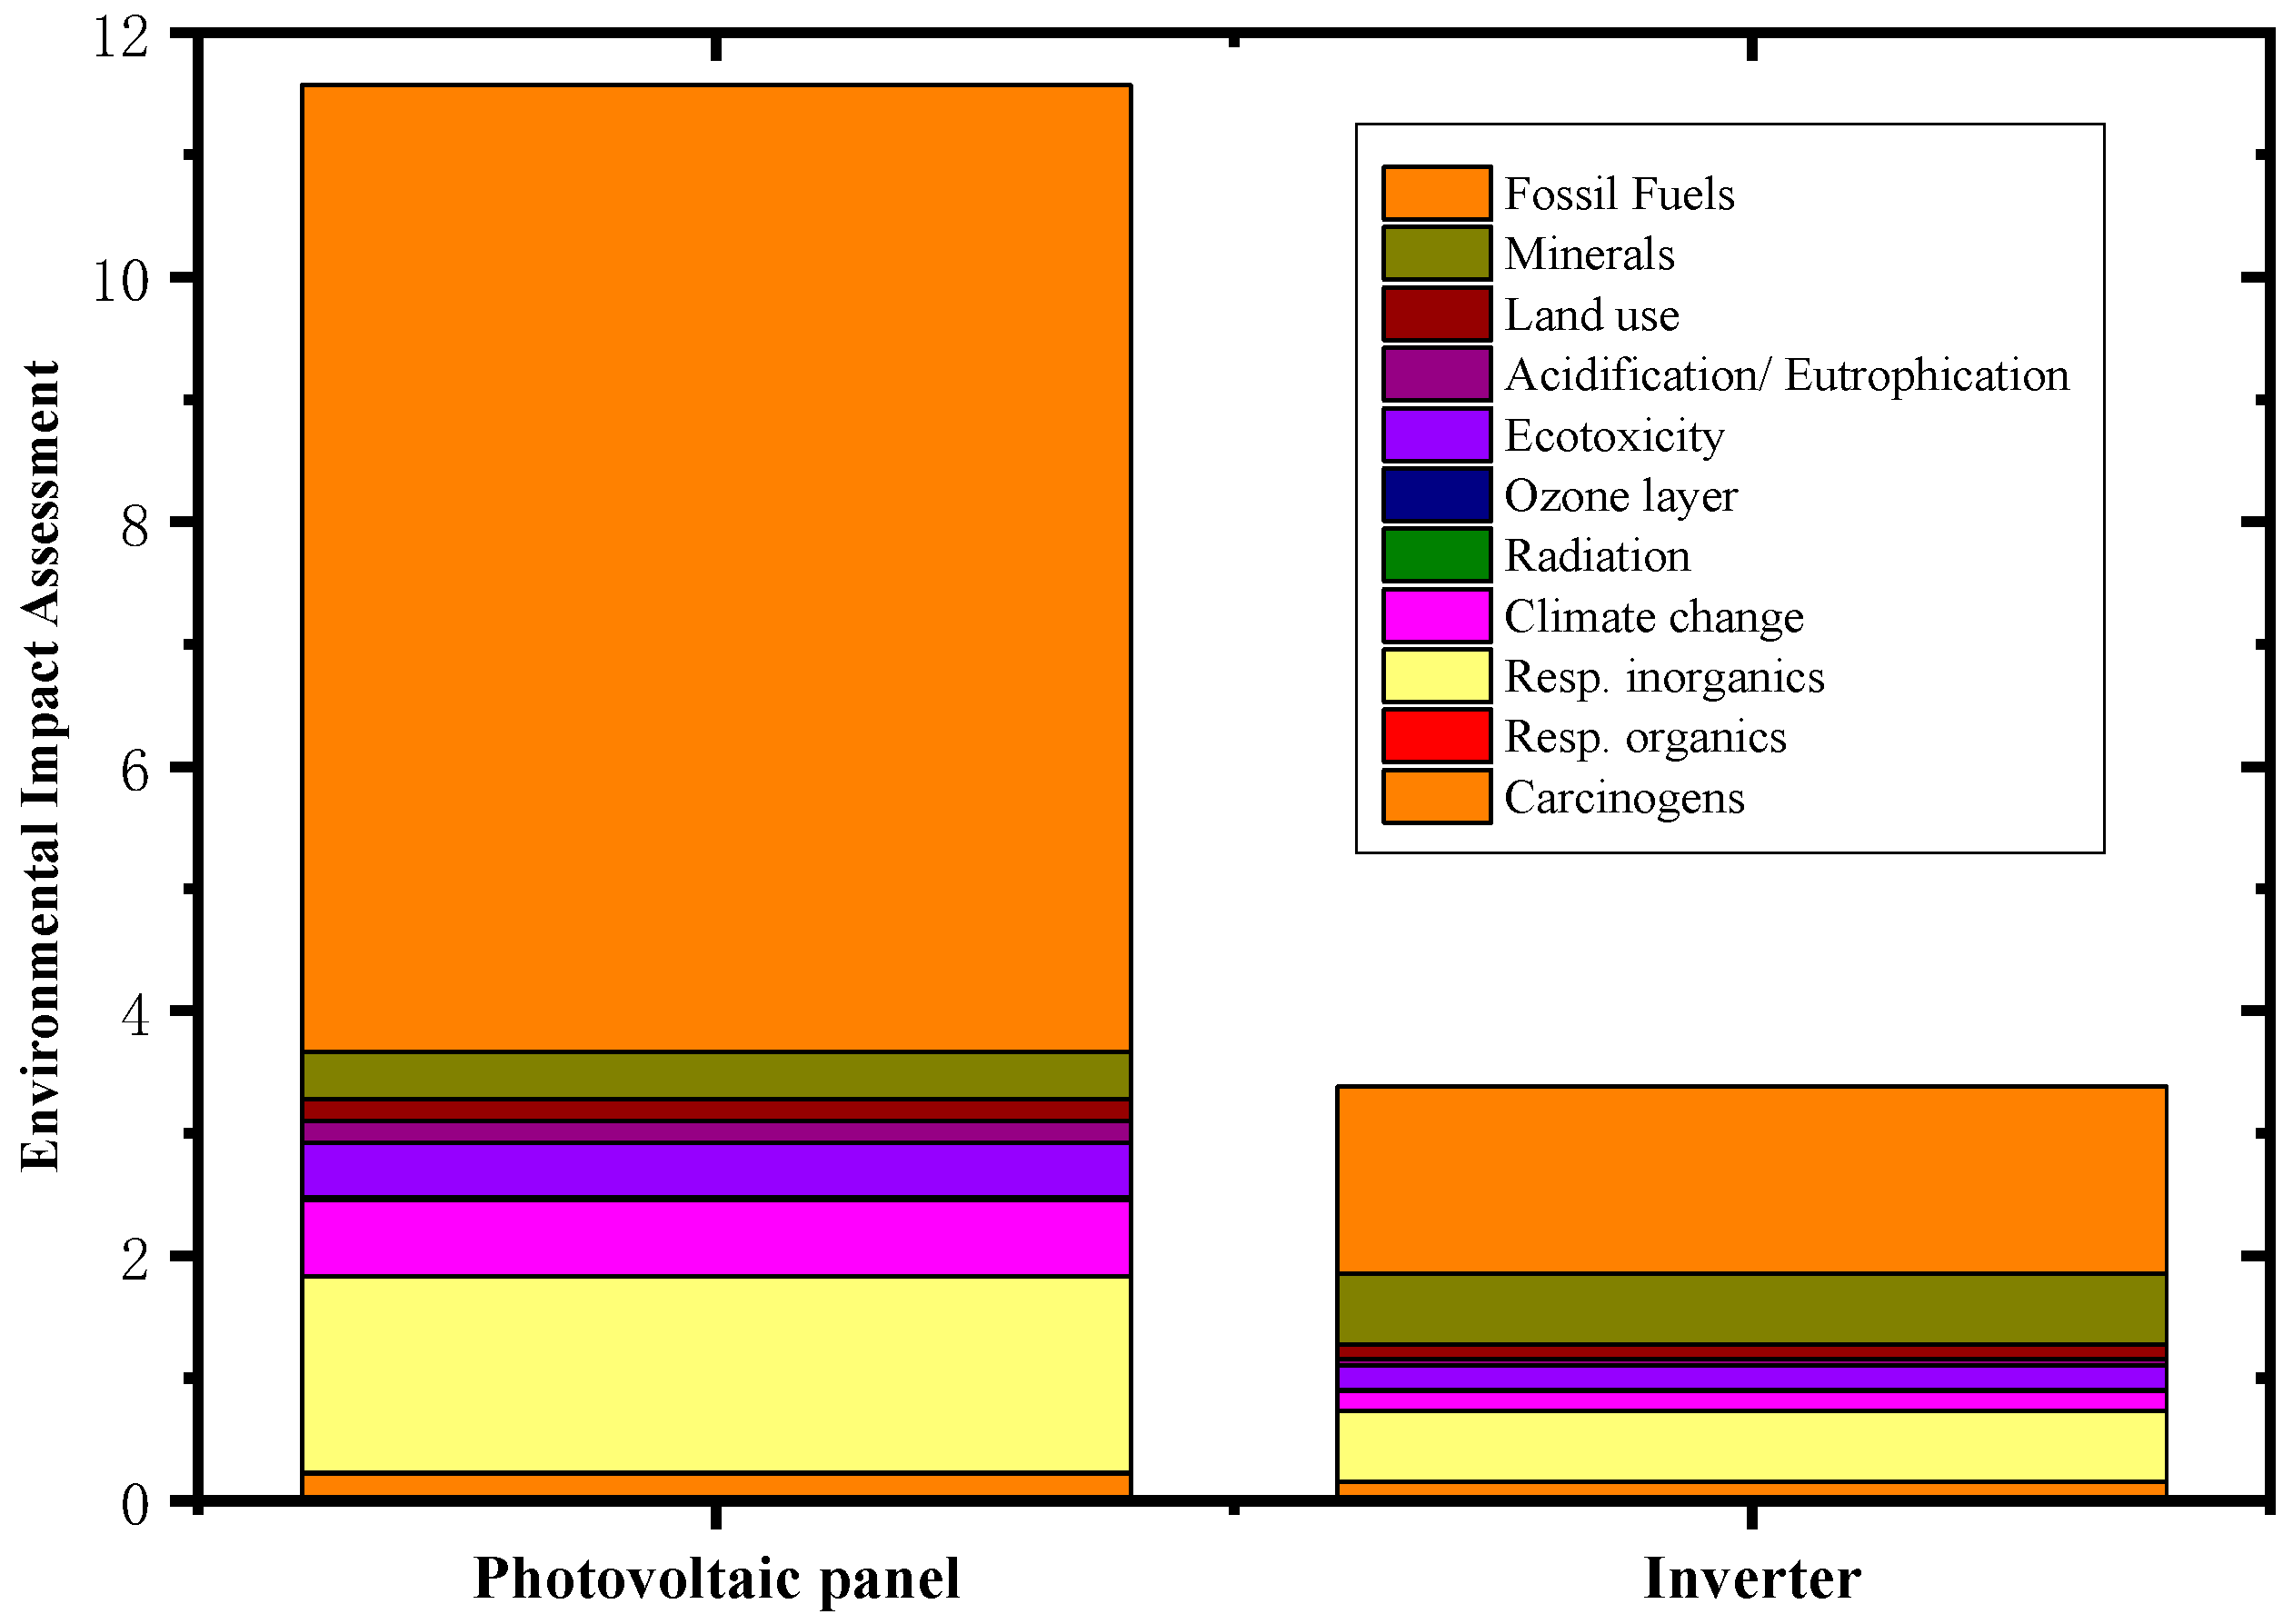
First, the life cycle assessment models for titanium dioxide & epoxy resin and solar photovoltaic panels & inverters were calculated in Simapro. Based on the input-output parameters in Simapro, the full life cycle impact indicators for 1 m
2 of polycrystalline silicon solar photovoltaic panels and one 500 W inverter are presented in
Figure 4. Pt represents “points,” a dimensionless unit commonly used in SimaPro software for life cycle assessment (LCA). This unit quantifies the relative contributions of different environmental impact categories (e.g., global warming potential, acidification potential, eutrophication potential) and allows for easier comparison and aggregation of overall environmental impacts.
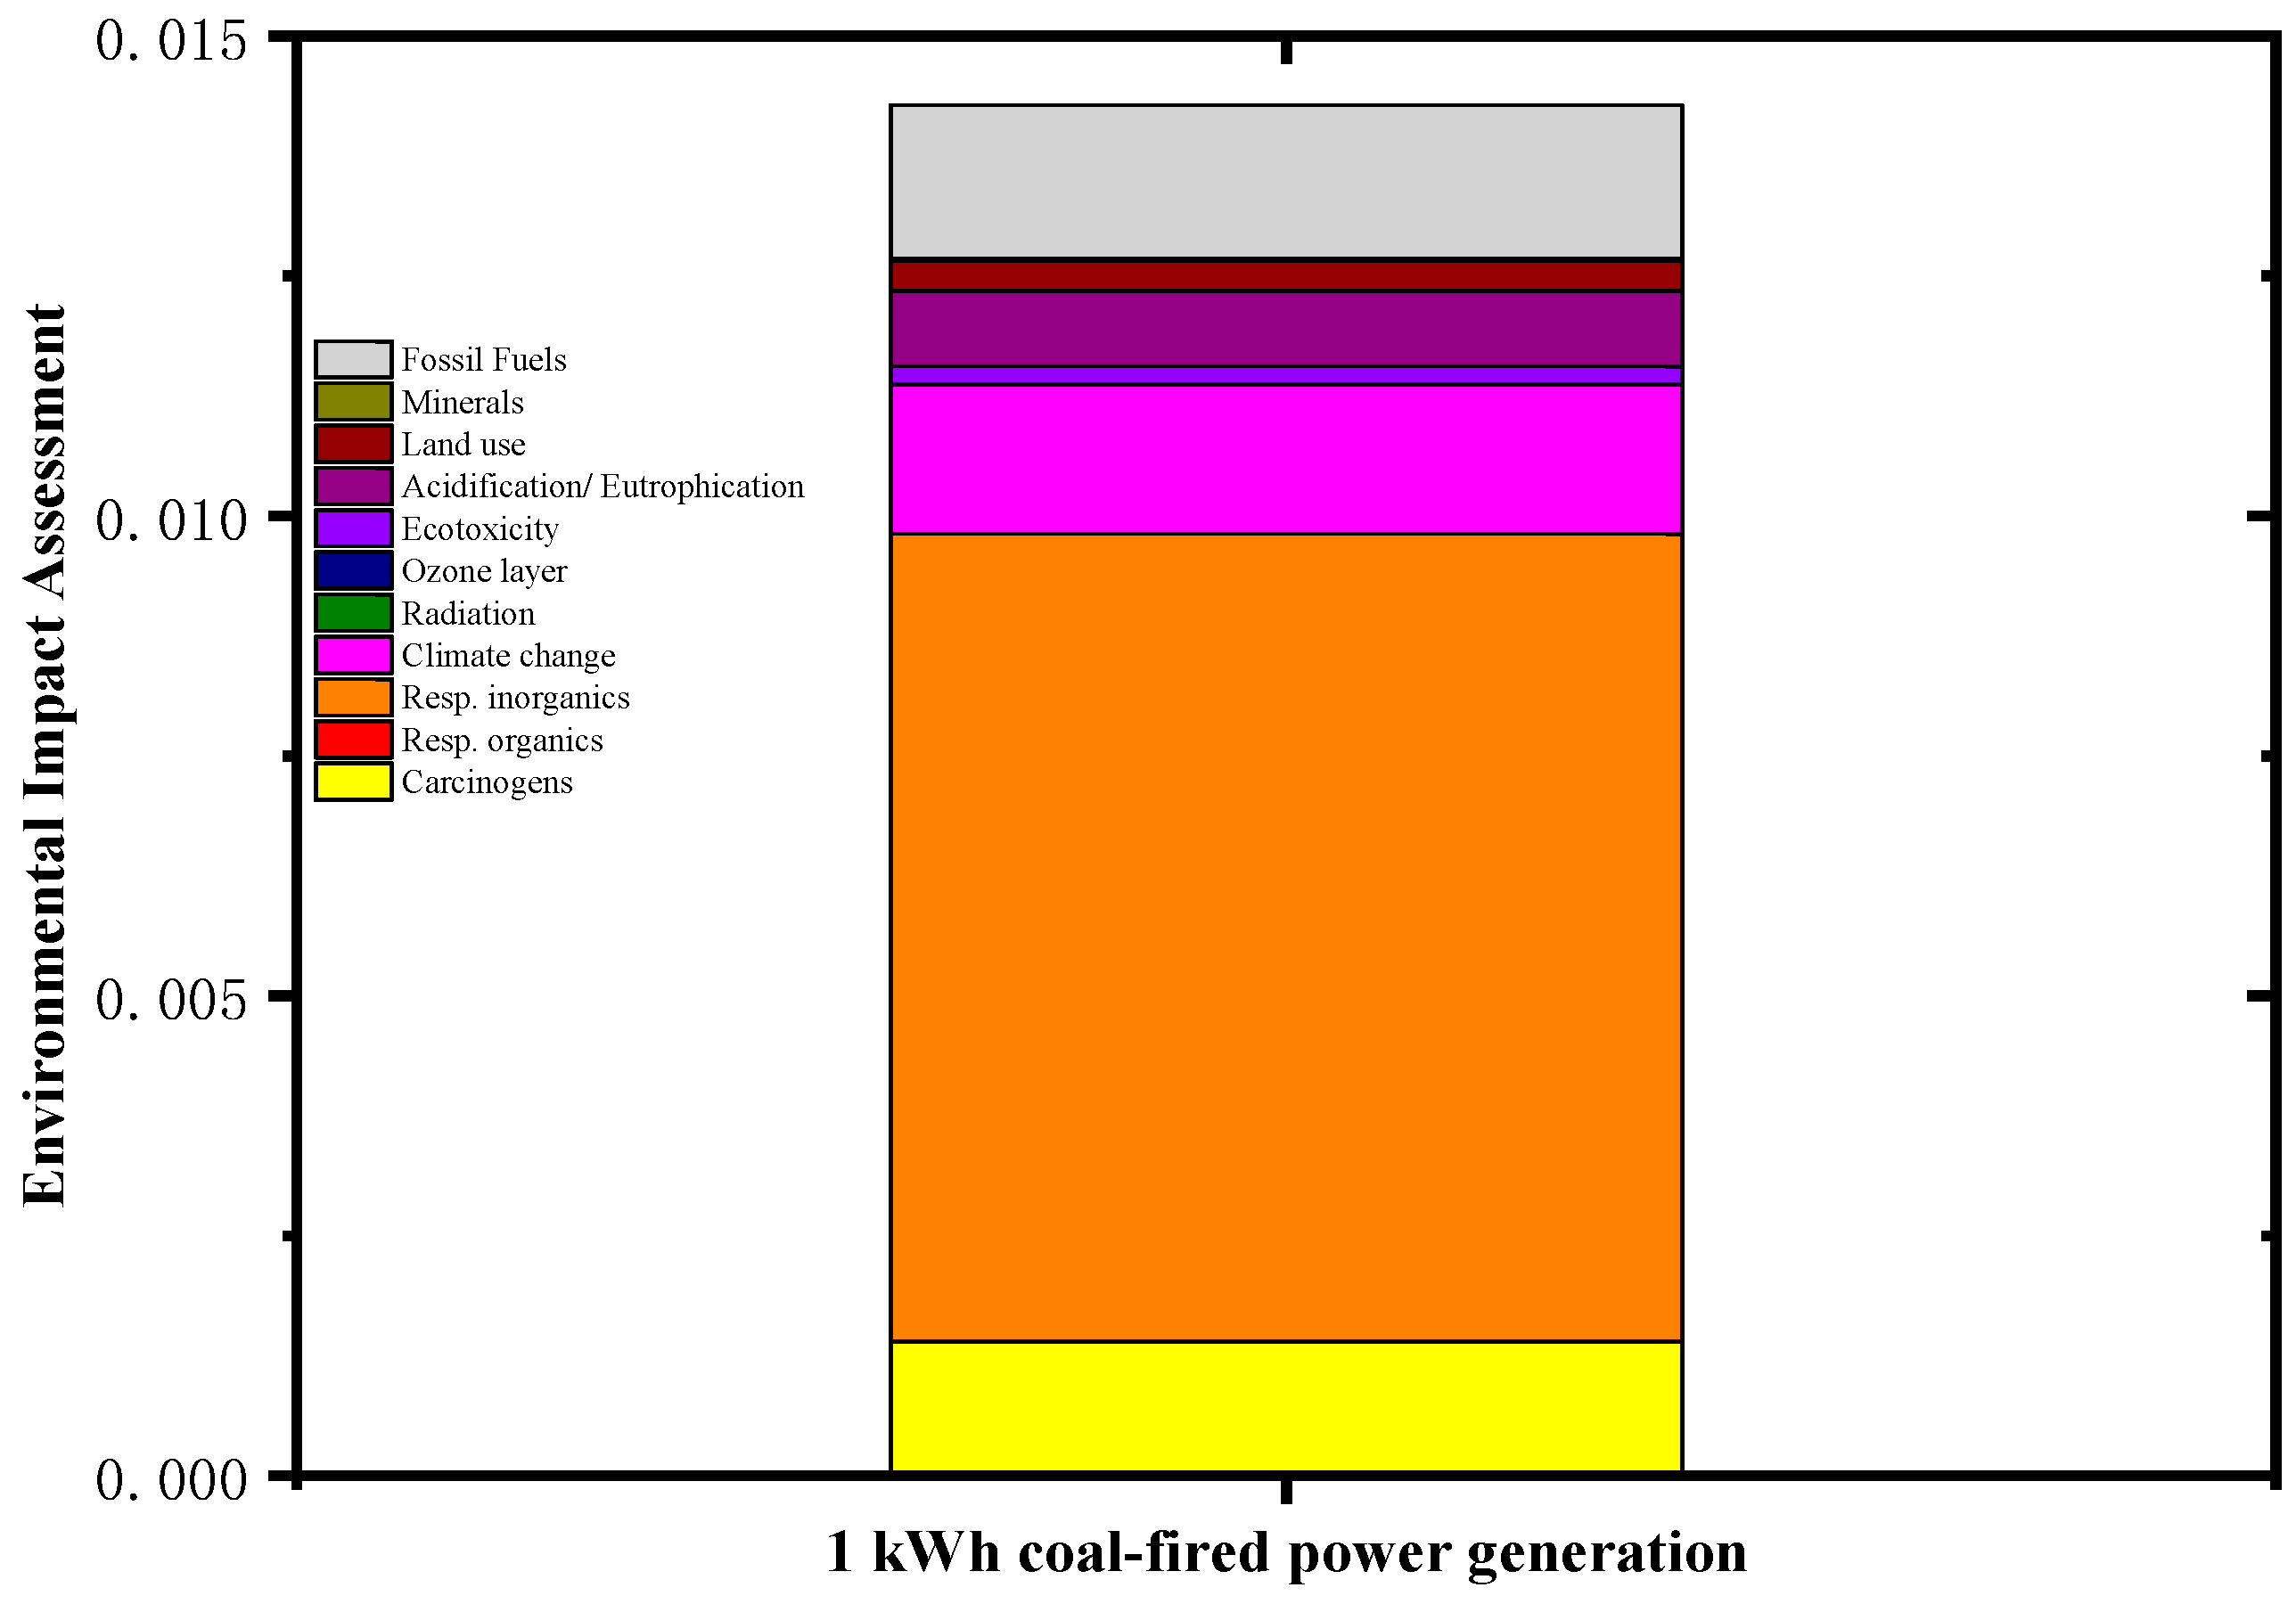
The development of raw materials for products, as well as the production, assembly, and transportation during the manufacturing phase, all require electricity input. At the same time, the operation of photovoltaic roofs also generates and exports electricity. Currently, coal-fired power plants remain the primary source of electricity generation in China. In SimaPro, the full life cycle environmental impact indicators for 1 kWh of coal-fired power generation were calculated based on the corresponding input-output parameters, as shown in
Figure 5.
The above data indicate that titanium dioxide and epoxy resin contribute most significantly to fossil fuel consumption and inhalable inorganic particulate matter emissions. This is primarily due to the substantial energy demands and pollutant releases during raw material extraction processes.
For photovoltaic (PV) panels, fossil fuel consumption constitutes the dominant environmental impact category. This stems from the intensive energy requirements for silicon purification and wafer production in the PV manufacturing chain.
Regarding coal-fired power generation, inhalable inorganic particulates represent the most severe impact, followed by climate change effects. This pattern occurs because both coal mining operations and combustion processes in thermal power plants emit substantial quantities of hazardous substances, while the released CO
2 and other greenhouse gases contribute to global warming and climate change, as shown in
Figure 6.
The data above demonstrates that titanium dioxide and epoxy resin have the most significant impact on fossil fuel consumption and inhalable inorganic substances in the air, primarily due to the substantial energy requirements and emissions of harmful substances during raw material extraction. For photovoltaic panels, fossil fuel consumption accounts for the vast majority of the impact, as the silicon purification and silicon wafer production processes in the photovoltaic industry consume enormous amounts of energy. In coal-fired power generation, inhalable inorganic substances in the air have the greatest impact, followed by climate change, because both coal mining and the combustion process in thermal power plants emit large quantities of harmful substances, while CO2 and other gases contribute to the greenhouse effect and global climate change.
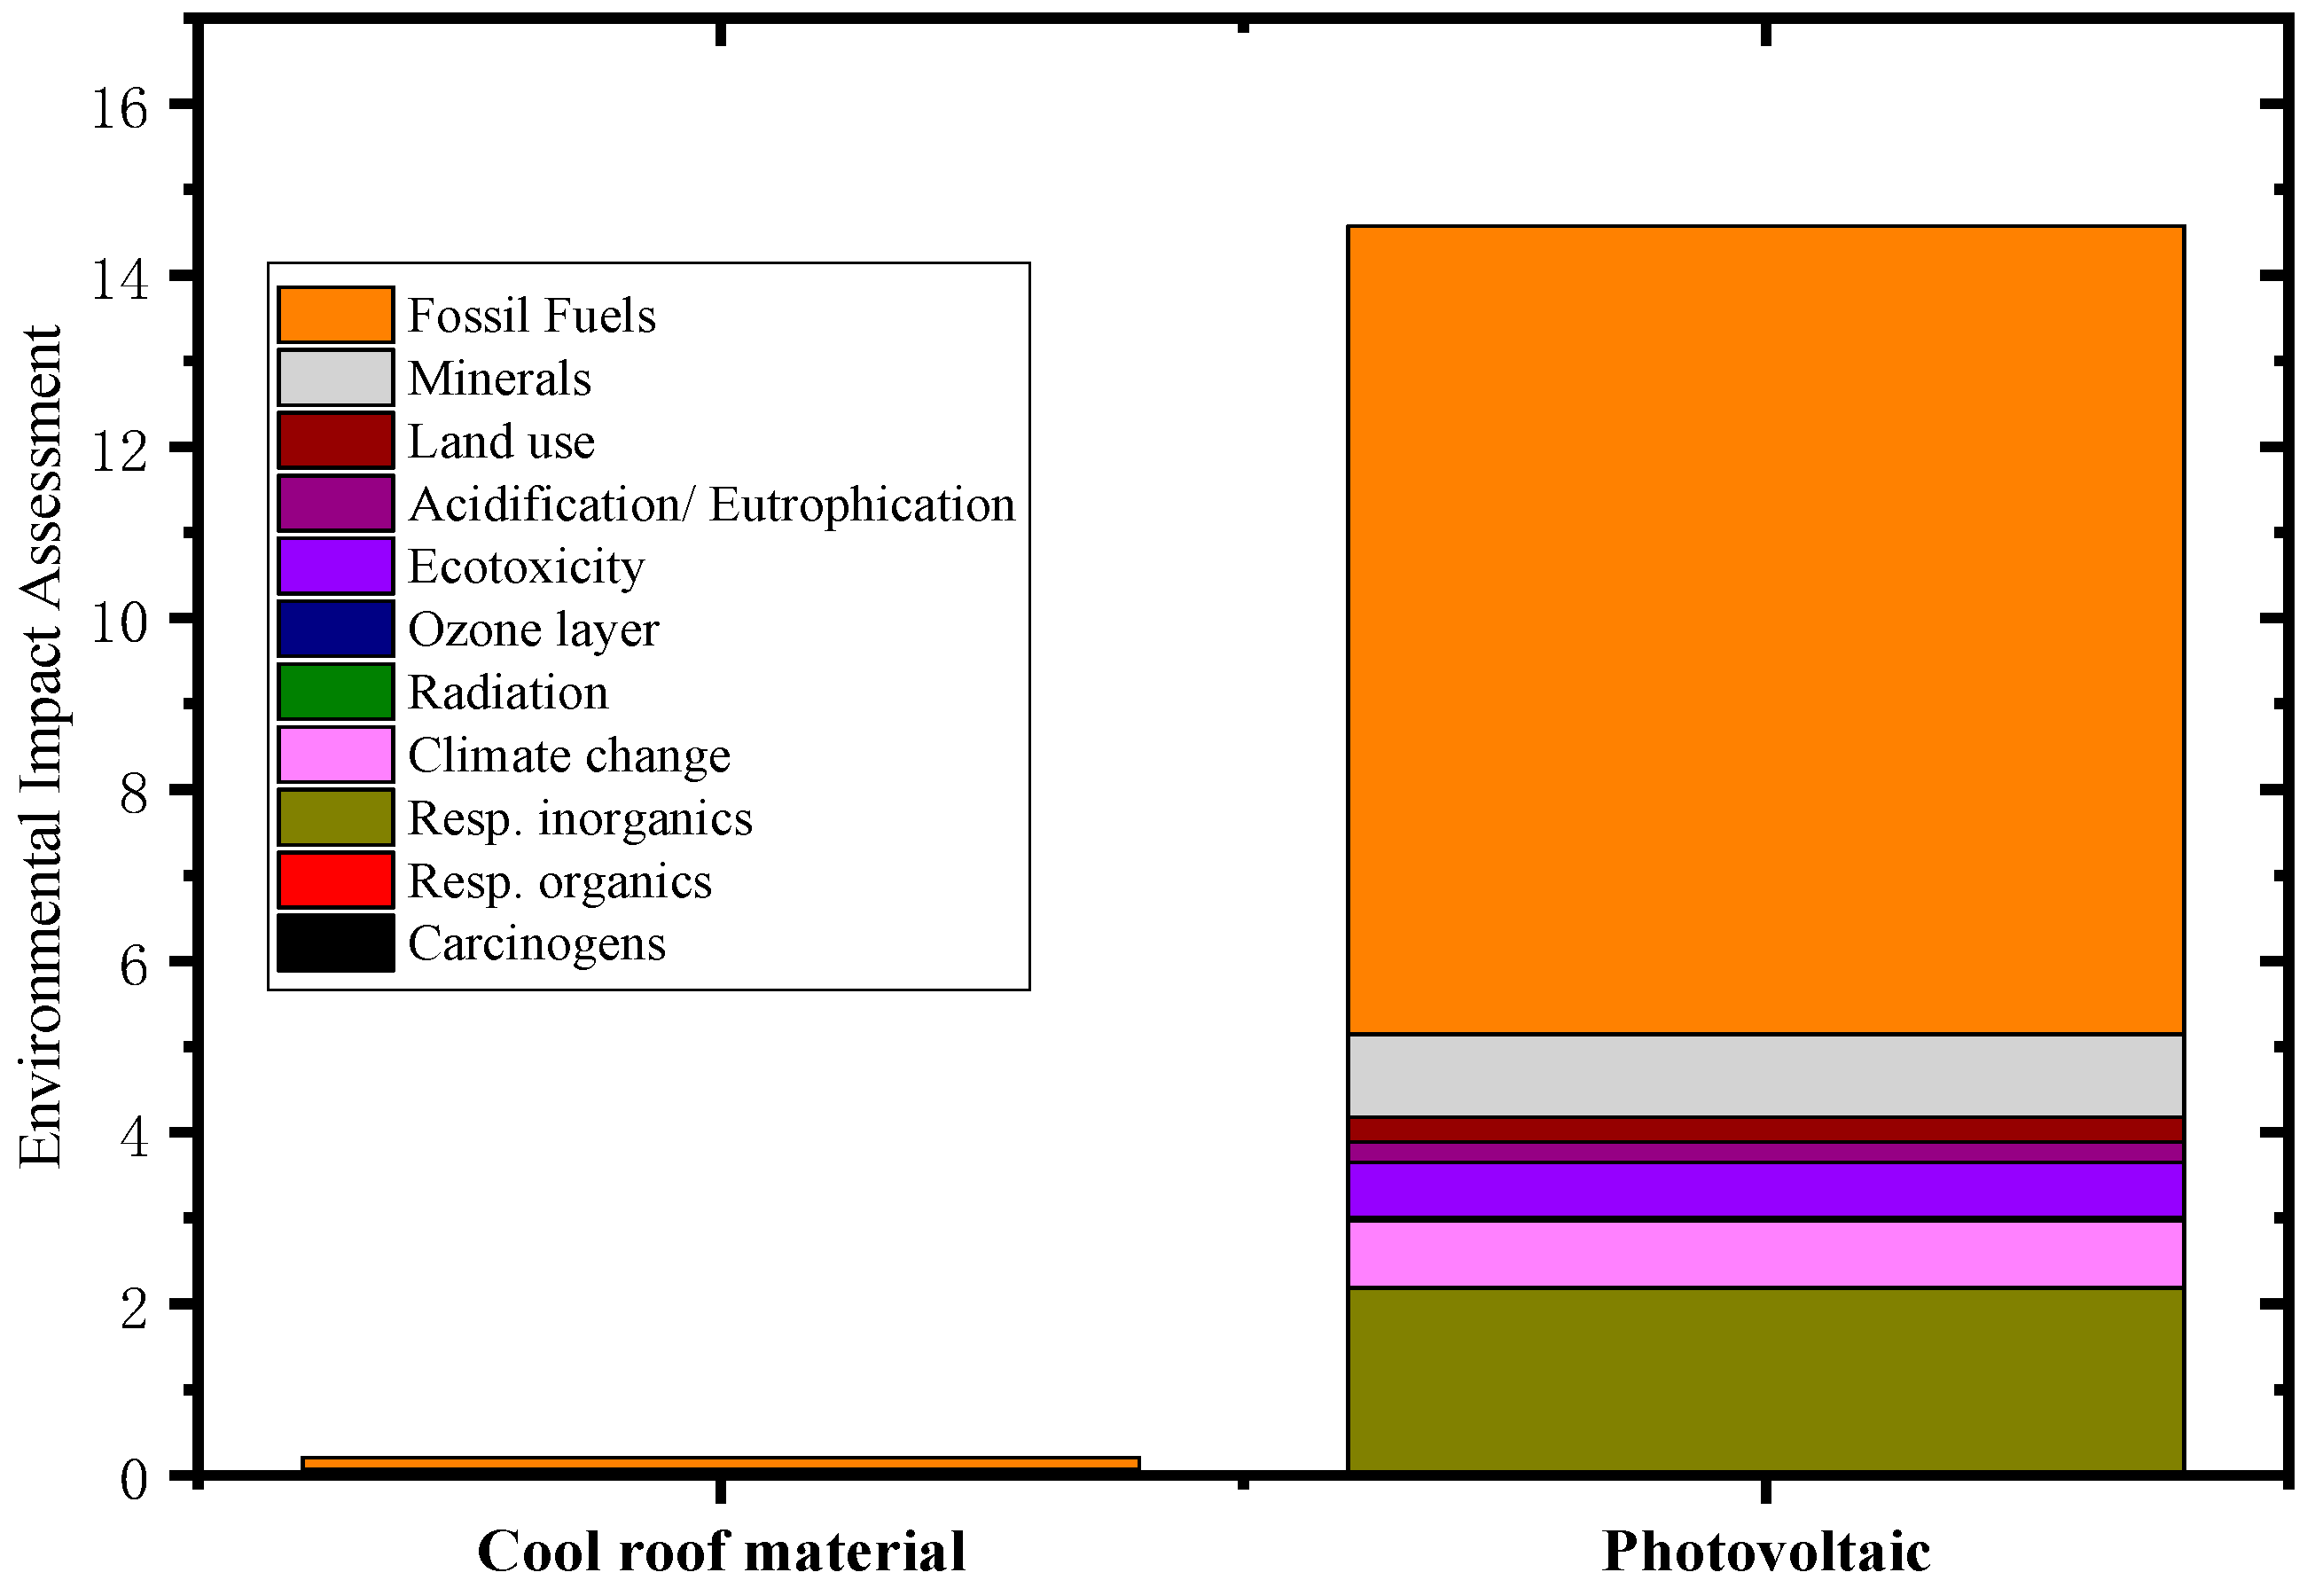
Based on the above data, the corresponding full life cycle environmental impact indicators for 1 m
2 of cool roofing material and 1 m
2 of photovoltaic roofing components were calculated in Simapro, as shown in
Figure 7.
The above data shows that although the annual energy savings per square meter of photovoltaic roofs are greater than those of cool roofs, their energy consumption and environmental impact over the entire life cycle far exceed those of cool roofing materials. Therefore, a thorough analysis and quantitative calculation are still needed to determine which roofing system—cool or photovoltaic—consumes more energy and which has a better or worse environmental impact across its full life cycle.
From a product-centric perspective, economic viability and energy efficiency may be prioritized by producers, while energy savings and environmental friendliness may appeal to consumers. However, when examined through the lens of societal and planetary well-being, the issues of energy efficiency and environmental sustainability are far more complex. This complexity arises because both producers and consumers are confined to specific stages of the product’s life cycle, and the benefits they perceive are inherently limited to their respective phases. Typically, neither party considers the upstream (e.g., raw material extraction, manufacturing) or downstream (e.g., disposal, recycling) impacts of the product. Whether at the individual, national, or regional level, a comprehensive understanding of the entire life cycle impact of a product is essential to make meaningful contributions to energy conservation and environmental protection on a societal scale. Only by adopting a holistic life cycle assessment (LCA) approach can we address these interconnected challenges effectively and ensure sustainable outcomes for the planet as a whole.
To fully assess the role of cool roofs and photovoltaic roofs in building energy efficiency within society, this study introduces the concept of “payback period” from economics. Based on life cycle assessment (LCA) theory, a 3-E (Energy, Economy, Environment) static payback period theoretical framework for roofing energy-saving technologies is established. Using the cool roof and photovoltaic roof cases discussed in this paper as examples, an empirical analysis is conducted to reveal whether these technologies are genuinely energy-efficient and environmentally sustainable over their entire life cycles.
5. Results and Discussion
The 3-E static payback period refers to the Economic Static Payback Time (ECSPT), Energy Static Payback Time (ENSPT), and Environmental Static Payback Time (EVSPT) of roofing systems.
5.1. Economic Static Payback Period
The concept of the payback period originates from economics, referring to the time required for the cumulative cash inflows generated by an investment to equal the initial investment amount. It represents the number of years needed to recoup the investment. A shorter payback period indicates a more favorable project. The payback period includes both static and dynamic payback periods, and this study focuses exclusively on the static payback period.
The static payback period does not account for the time value of money. Instead, it directly uses the time taken for the cumulative net future cash flows to equal the original investment amount as the payback period. Generally, investors prefer to recover their investments as quickly as possible, meaning the shorter the payback period, the better.
For roof energy-saving technologies, the economic static payback period can be defined as: the total cost of roof construction/retrofitting technology divided by the annual electricity cost savings achieved through the roof’s energy efficiency.
where
ECSPT represents the Economic Static Payback Period (years);
denotes the initial investment cost of the roof technology (RMB);
indicates the annual electricity savings of the roof technology (kWh/year);
is the equivalent electricity price (RMB/kWh).
For the cool roof discussed in this paper a cost of approximately RMB 240 for 20 kg can cover 40 m
2, resulting in a unit cost of RMB 6 per square meter. The annual electricity savings amount to 6.5 kWh/m
2. Taking Nanjing as an example, where the first-tier electricity price is 0.528 RMB/kWh, the economic static payback period of the cool roof in Nanjing can be calculated as follows:
For photovoltaic roofs, specifically flat roofs, the price per square meter of photovoltaic modules is approximately RMB 800, based on current market research and average pricing in China. With an average annual electricity savings of 139 kWh/m
2, the static payback period for photovoltaic roofs in the Nanjing region can be calculated as follows:
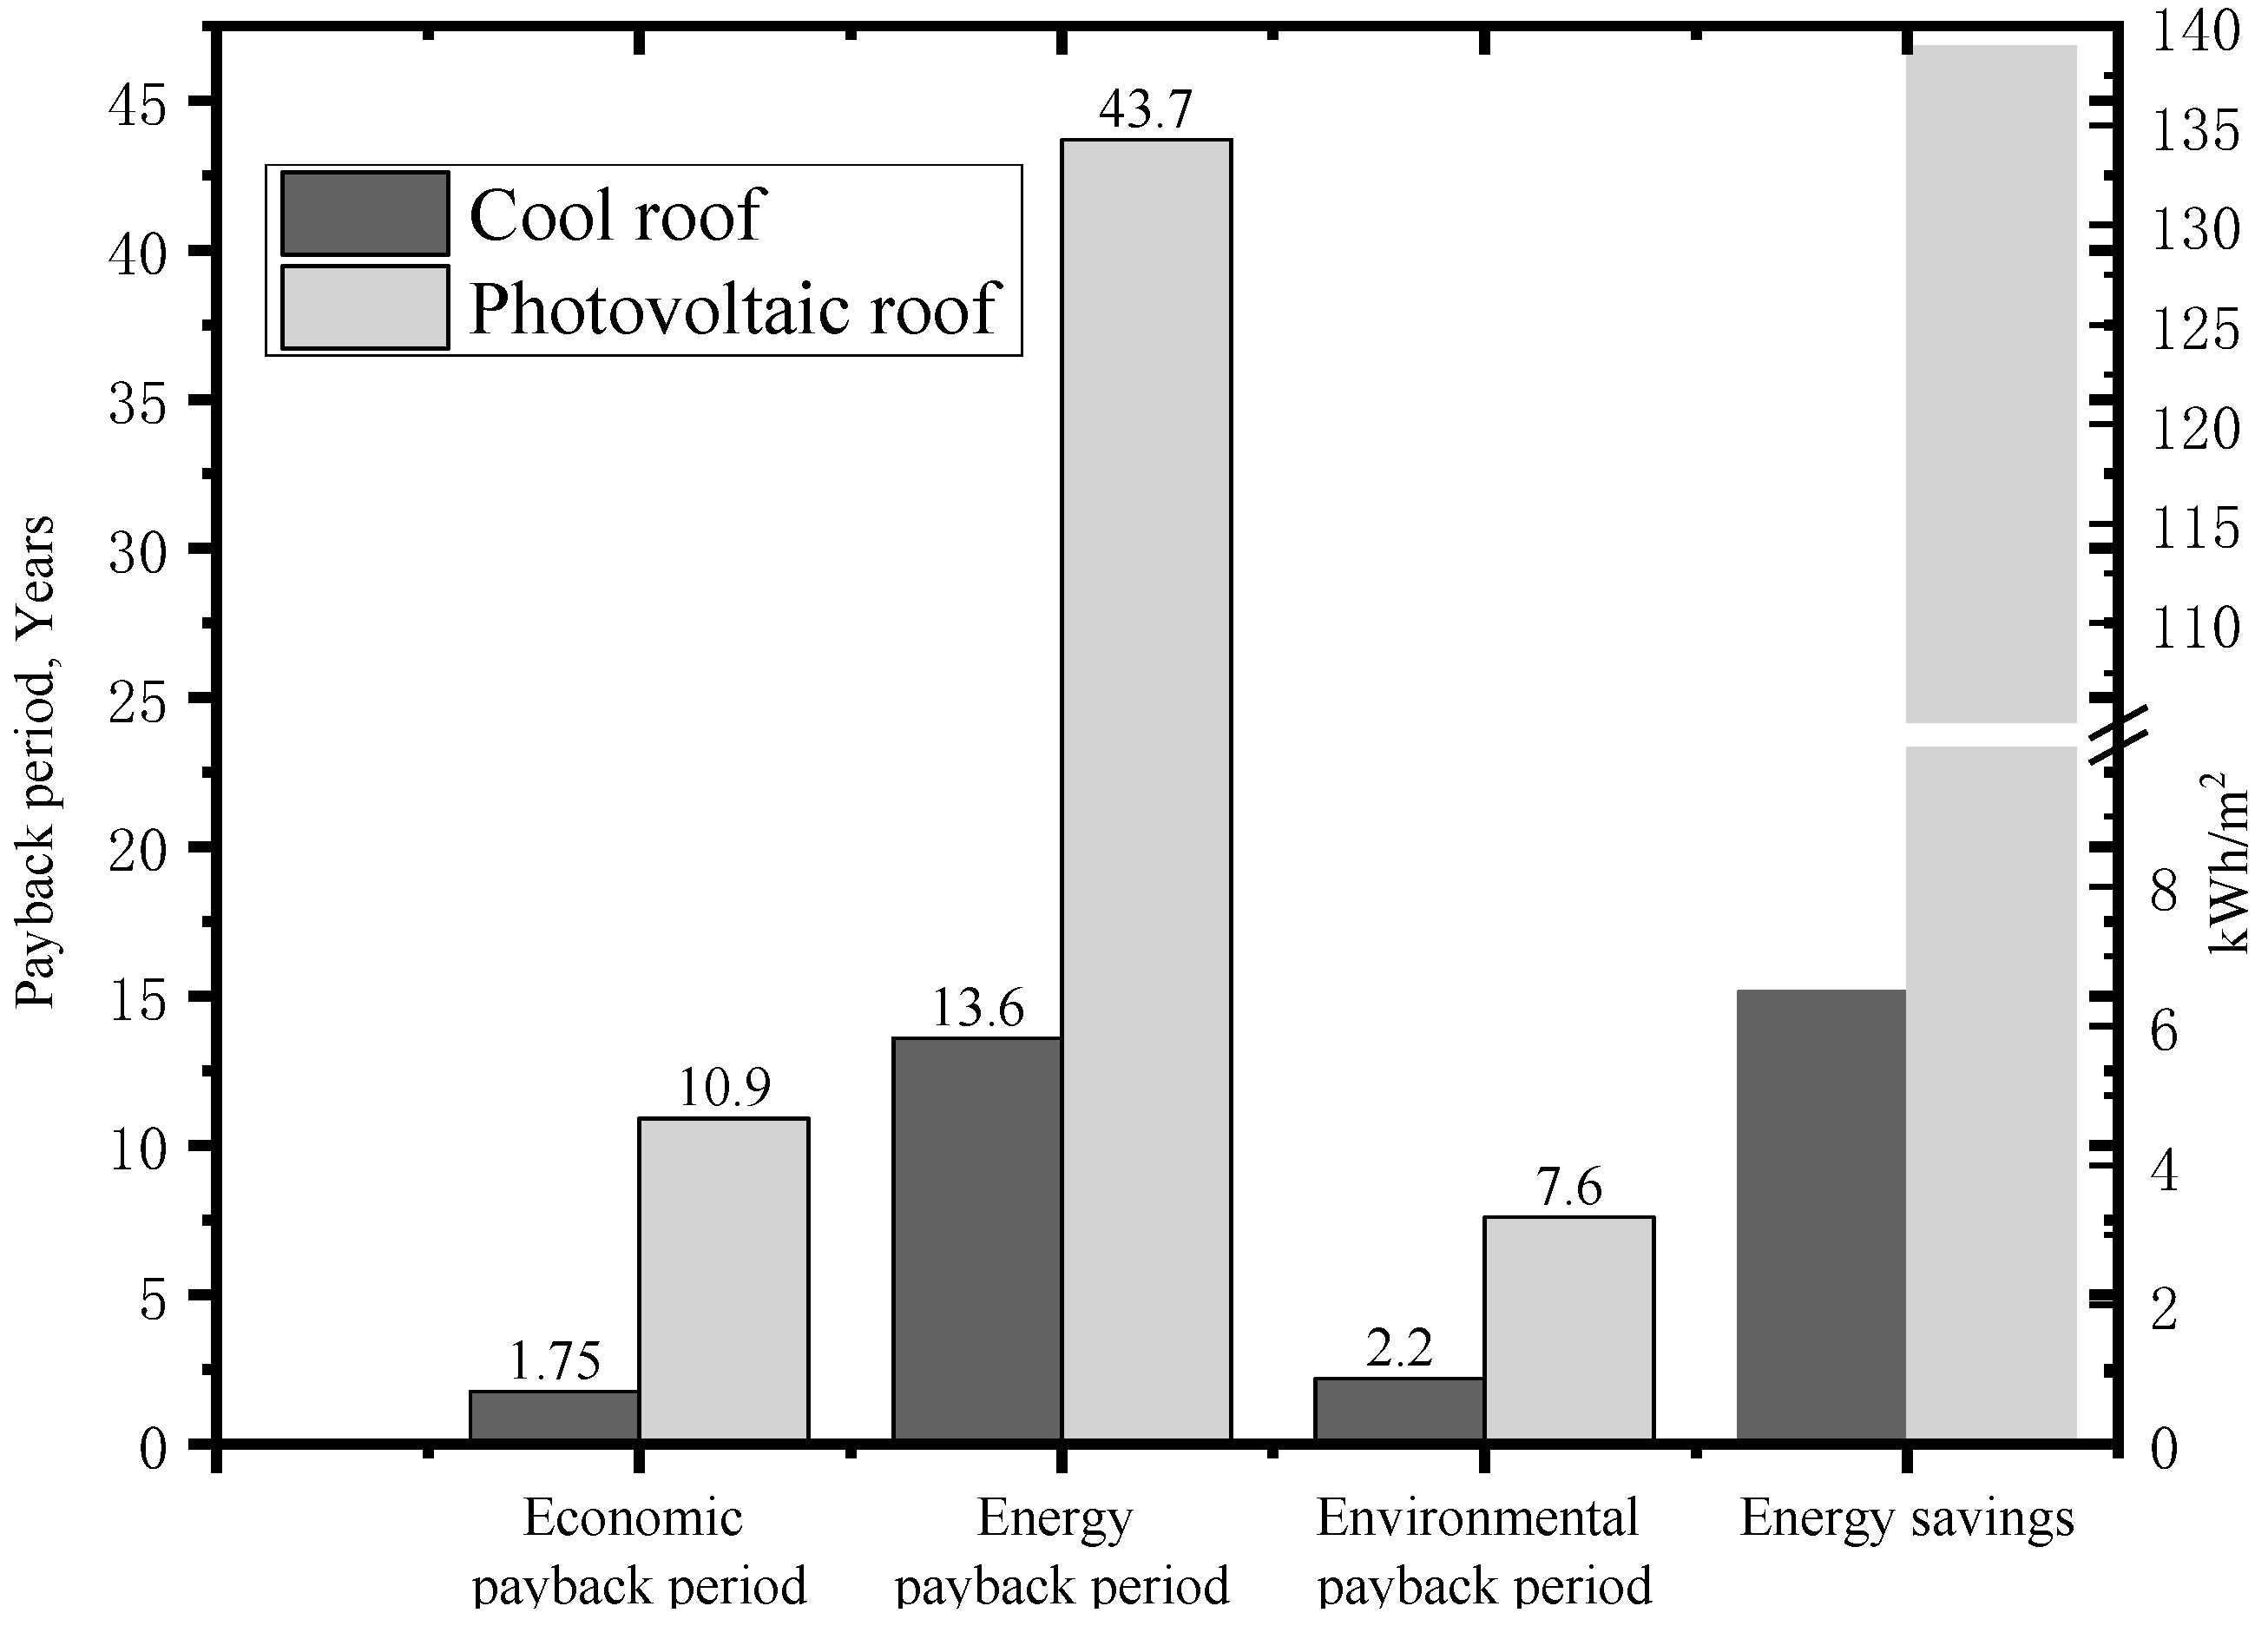
It can be observed that in Nanjing, the static payback period for cool roofs is 1.75 years, while that for photovoltaic roofs is 10.9 years. In terms of economic payback period, cool roofs hold a clear advantage.
5.2. Energy Static Payback Period
The energy payback period refers to the total energy consumed over the entire life cycle of a photovoltaic (PV) power generation system divided by its average annual energy output, with the unit being years. In other words, it indicates how many years a PV system takes to recover the energy consumed during its life cycle. Clearly, a shorter payback period is preferable. The energy payback period is one of the indicators used to evaluate renewable energy sources. It can be said that the concept of the energy payback period emerged alongside PV technology, but the full life cycle energy payback period differs from the conventional energy payback period.
In the conventional concept of the energy payback period, the energy consumption of a PV power station is calculated primarily from three aspects: equipment, component auxiliary materials, and power station auxiliary materials. Taking silicon-based components as an example, the conventional energy payback period only accounts for the energy consumption in the aforementioned processes, i.e., the energy consumption directly involved by the producer. However, processes prior to silicon material production, such as the exploration, mining, grinding, beneficiation, and transportation of silicon ore, are not considered by the producer. Similarly, for auxiliary materials like aluminum in components, only the energy consumption during aluminum smelting is counted, while the energy consumed in earlier processes such as aluminum ore mining and transportation is excluded. Therefore, the energy input in the conventional energy payback period is inaccurate and does not represent a true full life cycle assessment.
This paper redefines the concept of the energy static payback period based on life cycle assessment (LCA) theory. In LCA, the indicator for resource consumption is based on the depletion of fossil fuels and mineral resources. That is, all types of energy and natural resource consumption throughout the entire life cycle are converted into equivalent impacts on fossil fuel consumption and mineral resource depletion using corresponding impact factors. Among the 11 impact indicators in the LCA system, fossil fuel consumption reflects the total energy consumption across the entire life cycle, including extraction, transportation, manufacturing, assembly, usage, and recycling. Based on this theory, the energy static payback period is defined as follows:
where
is the Energy Static Payback Period (years);
is the Fossil Fuels (Fossil Fuels) impact score in the initial environmental impact assessment of the rooftop technology (Pt);
is the Fossil Fuels (Fossil Fuels) impact score per kilowatt-hour (kWh) of electricity generated, derived from previous data as 1.6 × 10⁻³ Pt.
For the cool roof discussed in this paper, based on the calculations presented earlier, it can be determined that in the environmental impact assessment of 1 m
2 of heat-reflective coating, the fossil fuel resource consumption indicator scores 0.141 Pt, with an annual electricity savings of 6.5 kWh/m
2. Therefore, the energy static payback period for cool roofs in Nanjing can be calculated as:
For the photovoltaic roof discussed in this paper, according to the previous calculations, it can be determined that in the environmental impact assessment of 1 m
2 of photovoltaic modules, the fossil fuel resource consumption indicator scores 9.43 Pt, with an annual electricity savings of 139 kWh/m
2. Therefore, the energy static payback period for photovoltaic roofs in Nanjing can be calculated as:
It can be observed that in Nanjing, the energy static payback period for cool roofs is 13.6 years, while that for photovoltaic roofs is 43.7 years, which essentially exceeds the entire service life of photovoltaic systems.
5.3. Environmental Static Payback Period
The concept of Environmental Static Payback Period is newly proposed in this paper. It refers to the ratio of the negative environmental impact indicators caused by all resource consumption throughout a product’s life cycle to the positive environmental impact indicators converted from its annual energy savings. This concept can be understood similarly to the energy payback period.
The development and deployment of energy-efficient products necessitate an initial energy investment, which is irrecoverable once expended. However, the integration of energy-saving technologies can significantly reduce annual energy consumption. While energy consumption persists in absolute terms, the adoption of such technologies effectively lowers the annual consumption rate. In the absence of these technologies, energy consumption would escalate more rapidly each year. Consequently, the reduction in energy consumption facilitated by energy-efficient products can be conceptualized as a form of “energy recovery.” The time required to achieve this recovery, often referred to as the energy payback period, can be quantified by dividing the initial energy investment by the annual energy savings.
The environmental payback period follows a similar logic. For an energy-efficient product, the initial resource consumption (from processes such as production, transportation, and installation) inevitably has adverse environmental effects. The implementation of energy-saving technologies (e.g., roof insulation) can reduce annual energy consumption (e.g., building air conditioning loads). These energy savings can be viewed as having a positive environmental impact in two ways:
Avoidance of Additional Environmental Damage: Without energy-saving measures, more energy would be consumed, leading to greater environmental harm. The adoption of energy-efficient technology prevents this additional damage, analogous to how economic payback avoids extra costs and energy payback avoids additional energy consumption.
Hypothetical “Environmental Purifier”: One can imagine an “environmental purifier” that continuously generates positive environmental effects as long as energy is supplied. The energy savings from efficient technologies can be conceptualized as input to this purifier, thereby producing beneficial environmental outcomes. This perspective helps clarify why energy savings can be considered environmentally “favorable.”
This dual interpretation provides a comprehensive framework for understanding the environmental payback period and its significance in evaluating sustainable technologies.
Based on the above perspectives, the calculation of environmental static payback period is defined as:
where
represents the environmental payback period (years);
denotes the total environmental impact indicator of the initial investment under life cycle assessment (Pt);
signifies the total environmental impact indicator per kilowatt-hour under life cycle assessment (Pt). From previous calculations, E = 0.0142 Pt.
For the cool roof discussed in this paper, based on the previous calculations, the total environmental impact score of 1 m
2 of heat-reflective coating under life cycle assessment is 0.206 Pt, with an annual electricity savings of 6.5 kWh/m
2. Thus, the environmental static payback period of the cool roof in Nanjing can be calculated as:
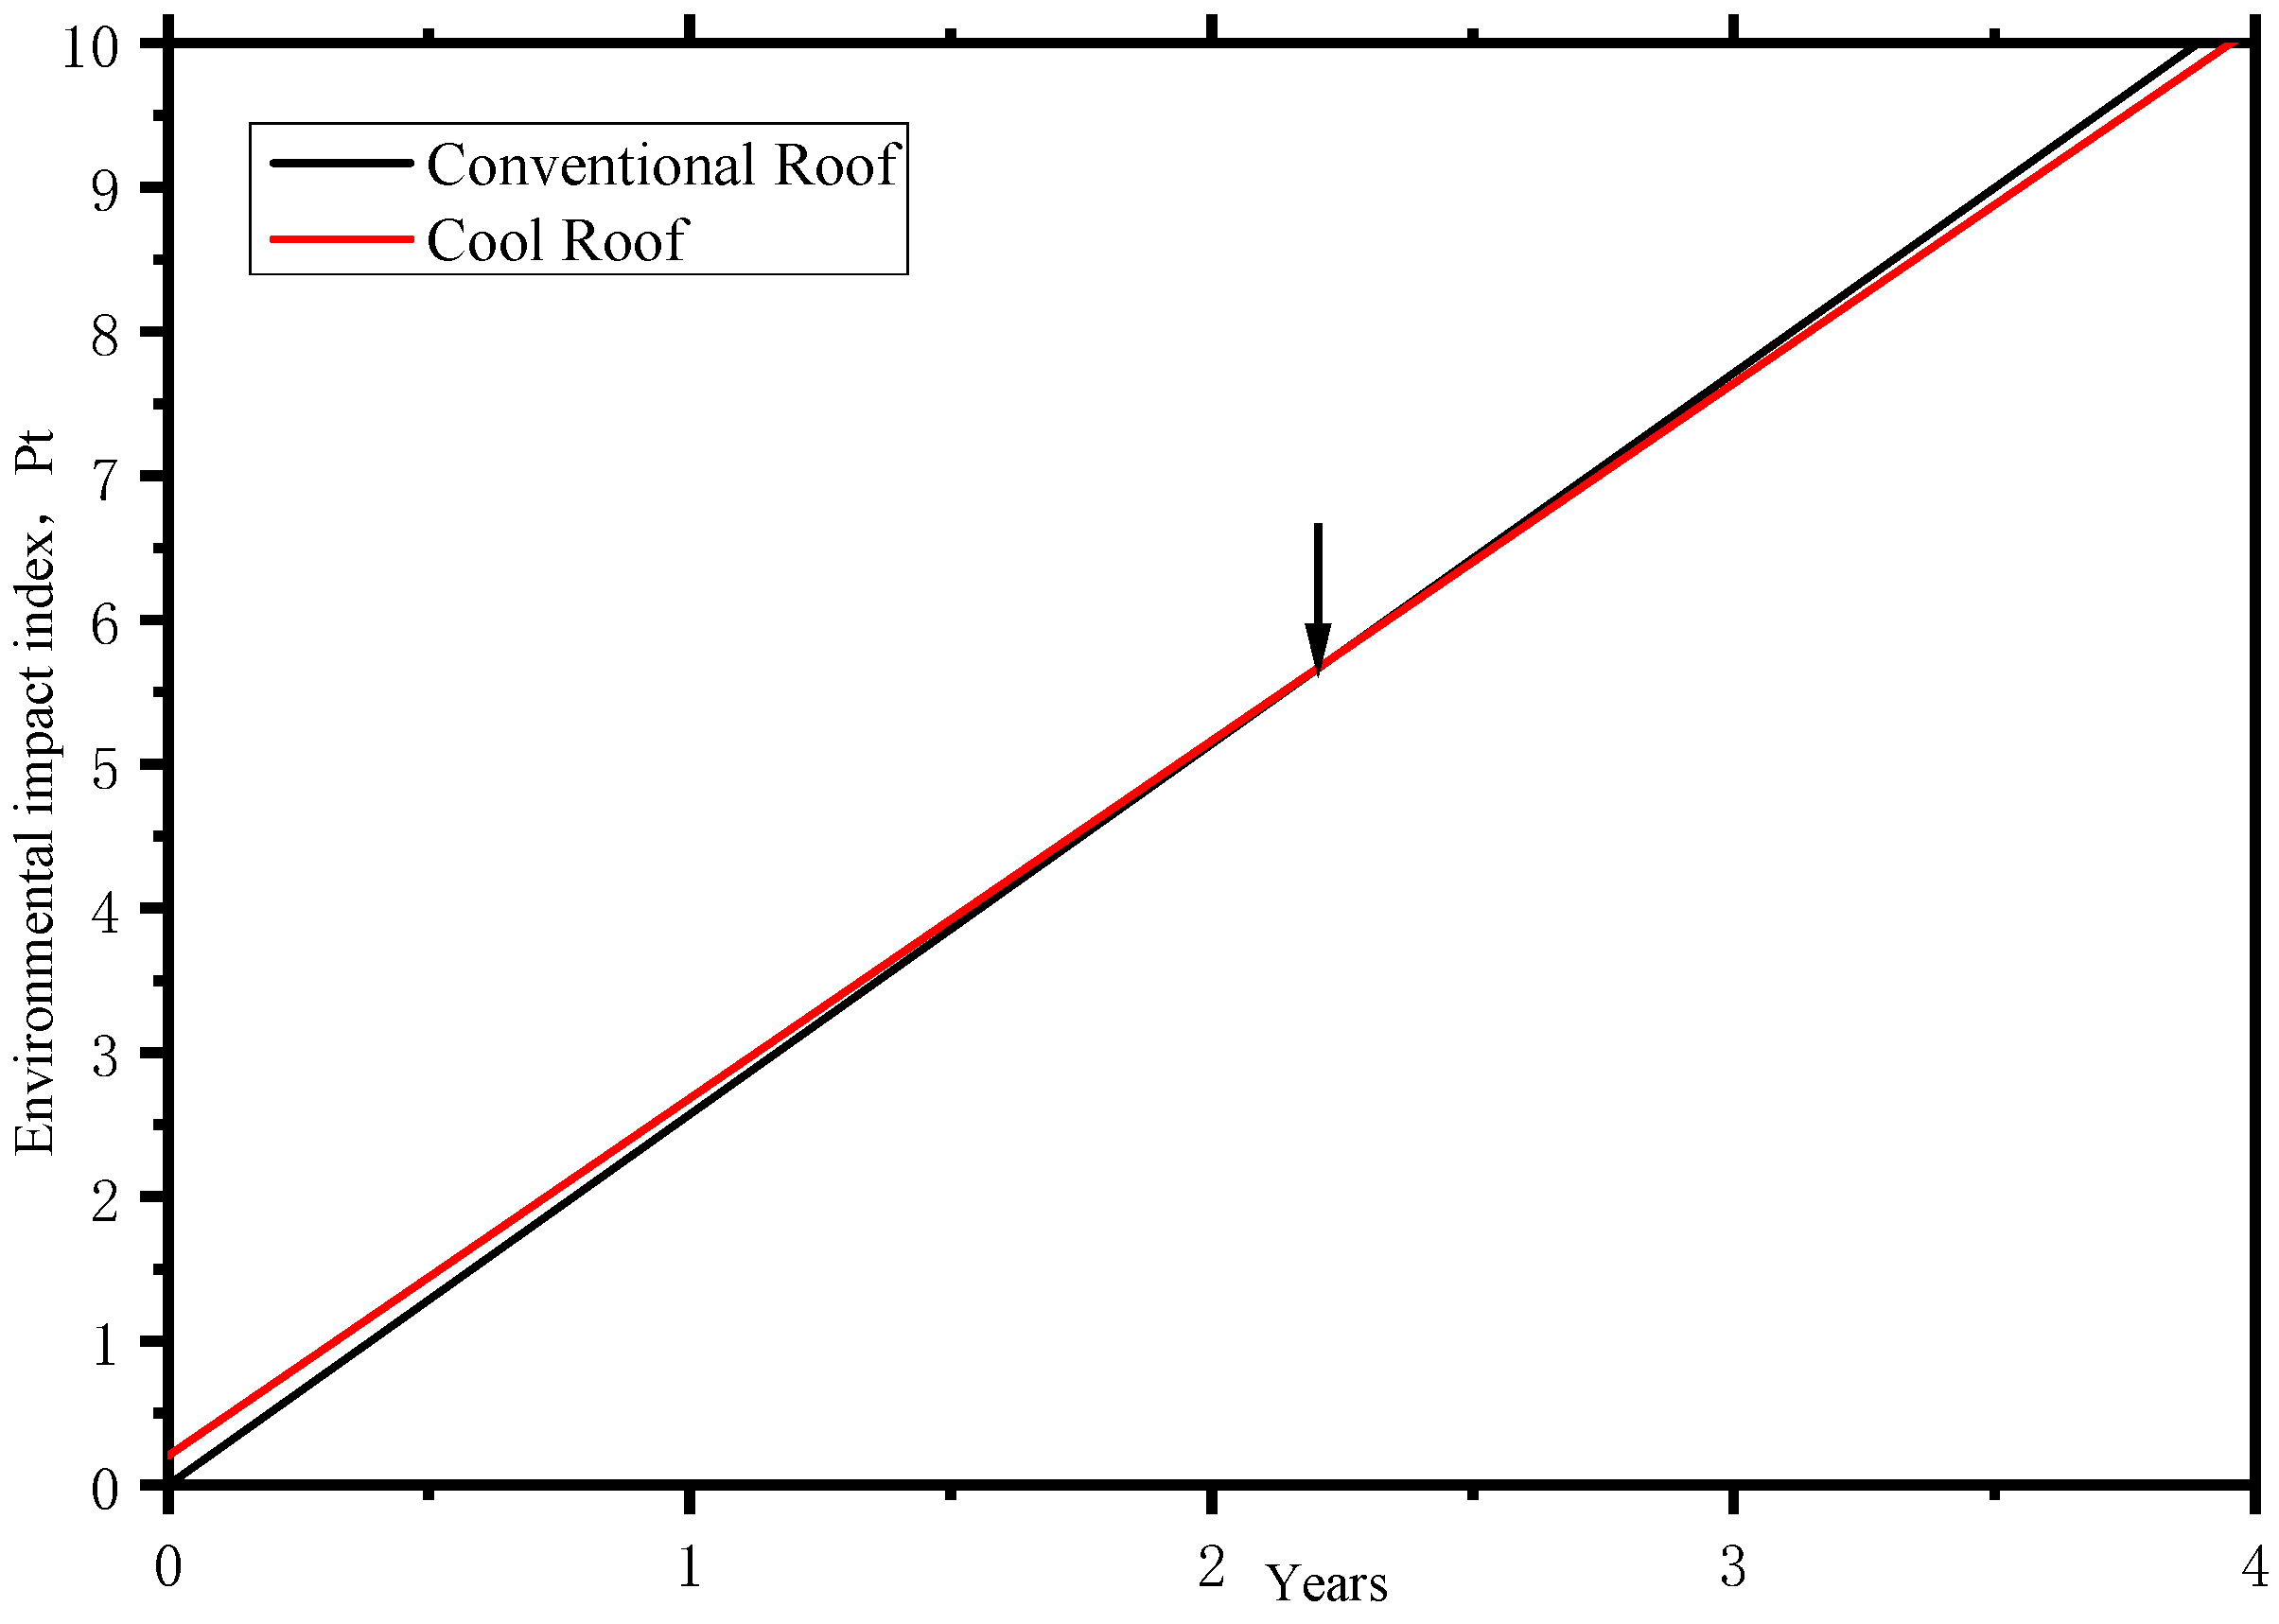
Figure 8 illustrates the environmental payback period diagram for cool roofs. For conventional roofs, the annual electricity consumption per square meter is 181 kWh. Thus, on the environmental impact index versus years diagram, it is represented by a straight line passing through the origin with a slope corresponding to the environmental impact index of 2.57 Pt (associated with the annual consumption of 181 kWh). For cool roofs, the annual electricity consumption per square meter is 174.5 kWh. Due to the initial investment in cool roof materials, the initial environmental impact index is 0.206 Pt per square meter (as derived earlier). Consequently, its representation on the diagram is a straight line with an intercept of 0.206 Pt and a slope corresponding to the environmental impact index of 2.478 Pt (associated with the annual consumption of 174.5 kWh). The intersection point of these two lines indicates the environmental payback period for cool roofs, which is calculated to be 2.2 years.
For the photovoltaic roof discussed in this paper, based on the previous calculations, we know that the total environmental impact score for 1 m
2 of PV modules over their entire life cycle is 14.950 Pt, with an annual electricity savings of 139 kWh/m
2. Therefore, the static environmental payback period for the cool roof in Nanjing can be calculated as:
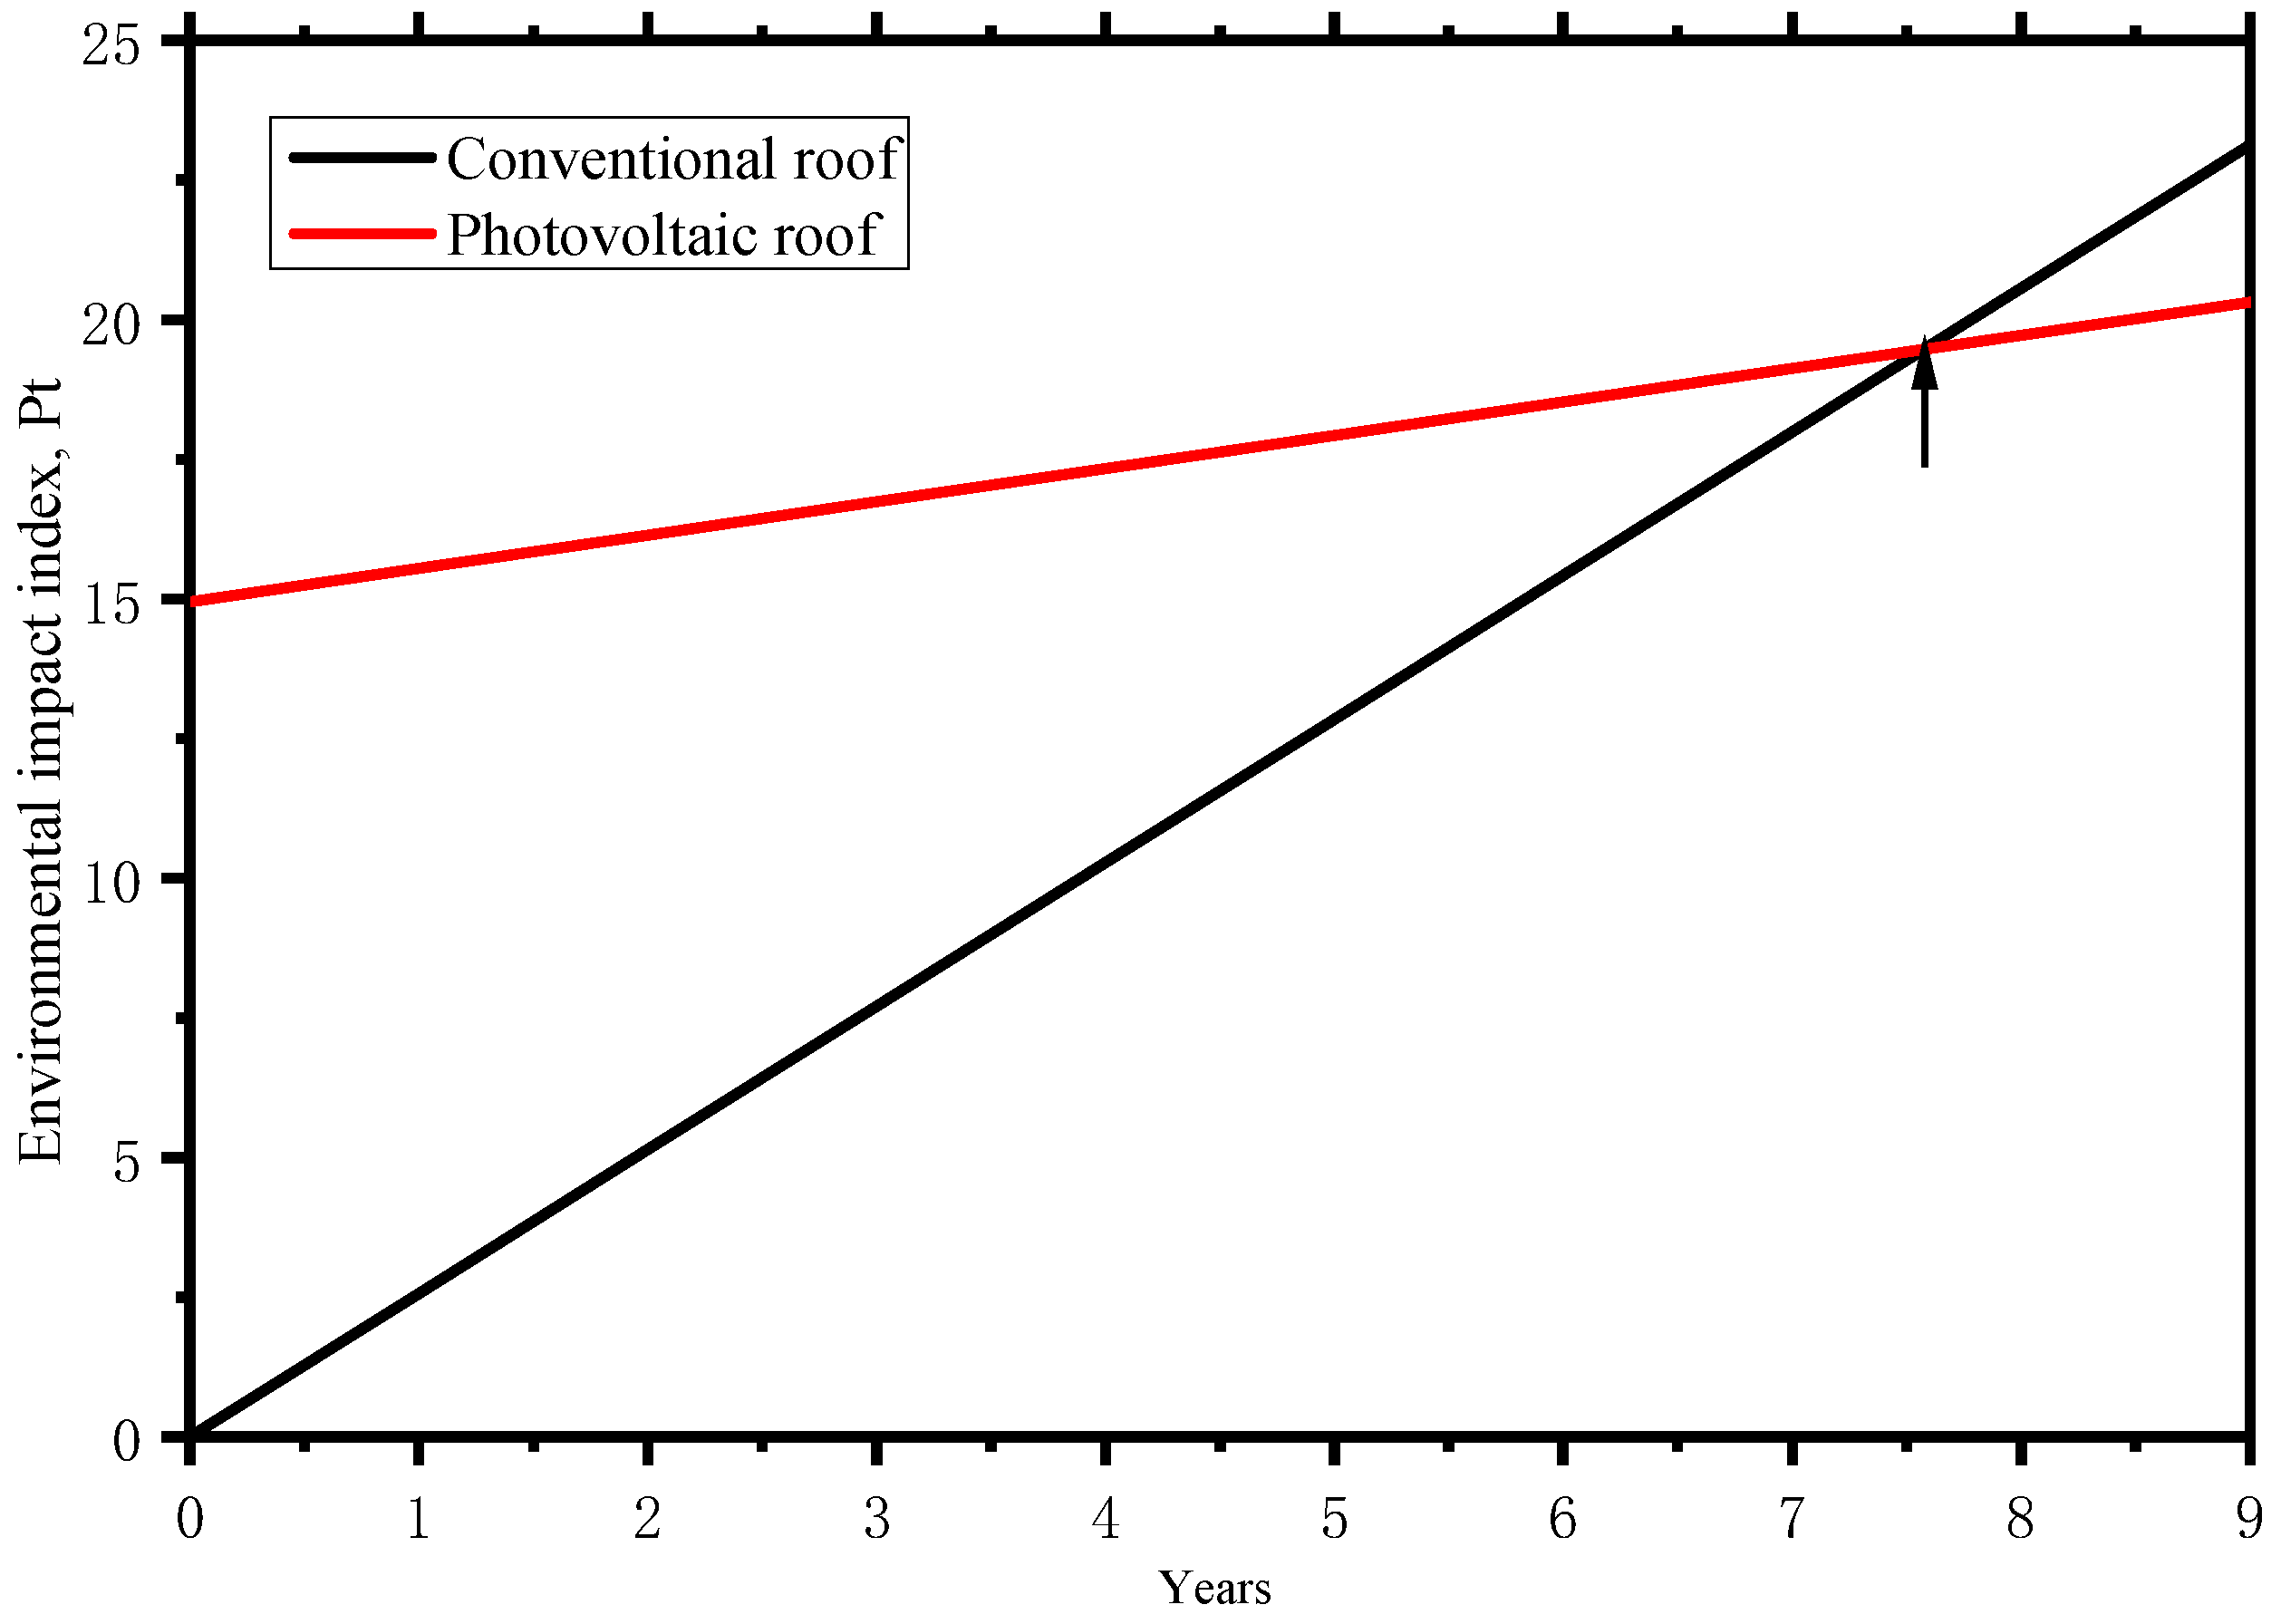
Figure 9 illustrates the environmental payback period diagram for photovoltaic roofs. For conventional roofs, the annual electricity consumption per square meter is 181 kWh, resulting in a straight line on the environmental impact index versus years diagram that passes through the origin with a slope corresponding to the environmental impact index of 2.57 Pt (associated with the annual consumption of 181 kWh). For photovoltaic roofs, the annual electricity consumption per square meter is 42 Wh. Due to the initial investment in cool roof materials, the corresponding initial environmental impact index is 14.95 Pt per square meter (as derived earlier). Thus, its representation on the diagram is a straight line with an intercept of 14.95 Pt and a slope corresponding to the environmental impact index of 0.596 Pt (associated with the annual consumption of 42 kWh). The intersection point of these two lines represents the environmental payback period of the cool roof, calculated to be 7.6 years.
From the *roof environmental impact index versus years* diagram, the environmental payback period is defined as the intersection point where the cumulative environmental impact of the energy-saving technology—comprising its initial environmental impact and its operational impact over the years—equals the environmental impact of conventional roofs over the same duration. Beyond this payback point, the environmental impact index of conventional roofs exceeds the total environmental impact (including the initial investment) of energy-saving roofs over an equivalent time frame. For society as a whole, if the operational duration of the energy-saving technology surpasses the environmental payback period, adopting such measures—compared to conventional roofs—can significantly reduce environmental impact. This constitutes the practical significance of the environmental payback period.
Figure 9 presents a comparative analysis of the payback periods (economic, energy, and environmental) and annual energy savings between cool roofs and photovoltaic roofs. The data clearly indicate that cool roofs outperform photovoltaic roofs across all three payback metrics. However, it is important to note that photovoltaic roofs exhibit far superior energy-saving and power-generation intensities compared to cool roofs. The 3-E (economic, energy, and environmental) static payback period model proposed in this study is not limited to roof applications but can also be extended to other energy-saving technologies. The introduction of this theoretical framework provides valuable guidance for the implementation of various energy efficiency initiatives, offering a robust analytical tool for evaluating the long-term sustainability and feasibility of such technologies.
It can be seen that, whether it is the economic payback period, energy payback period or environmental payback period, the performance of cool roofs is better than that of photovoltaic roofs. However, the energy-saving and energy-production intensity of photovoltaic roofs cannot be matched by cool roofs. The 3-E static payback period model proposed in this paper can be applied not only to roofs but also to other energy-saving technologies. The proposal of this theory can play a guiding role in the implementation of many activities.
6. Conclusions
This paper analyzes and elaborates on the fundamental concepts and operational procedures of Life Cycle Assessment (LCA). Using cool roofs and photovoltaic roofs as comparative subjects, the study conducts a comprehensive comparison from economic, energy, and environmental perspectives through energy consumption simulation and LCA software. The conclusions are as follows:
(1) The energy savings per square meter of cool roofs are 6.5 kWh, representing an annual energy reduction of 8.6%. Photovoltaic roofs generate 10,283 kWh annually, with 65.8% used to meet their own energy demands and the remainder supplied to the grid. In terms of energy savings, photovoltaic roofs significantly outperform cool roofs.
(2) The life cycle environmental impact indicators for 1 m2 of cool roof materials and 1 m2 of photovoltaic roof components are 0.206 Pt and 14.950 Pt, respectively. Therefore, from an environmental perspective, photovoltaic roofs cause substantially greater environmental damage compared to cool roofs.
(3) To comprehensively compare the energy-saving effects of cool roofs and photovoltaic roofs, a 3-E static payback period theoretical framework based on life cycle assessment was established. This framework includes calculation formulas for economic, energy, and environmental static payback periods. The calculated results show that the economic payback periods for cool roofs and photovoltaic roofs are 1.75 years and 10.90 years, respectively; the energy payback periods are 13.6 years and 43.7 years, respectively; and the environmental payback periods are 2.2 years and 7.6 years, respectively. In terms of payback periods, cool roofs demonstrate significant advantages.
Beyond technical performance, the study highlights broader implications for policy and practice. The divergence between economic and environmental payback periods suggests that market forces alone may not always drive optimal sustainable choices, particularly in heating-dominated climates where cool roofs incur heating penalties. Targeted incentives, such as carbon pricing or reflectance-based building codes, could accelerate adoption where energy savings alone are insufficient. Additionally, the framework’s adaptability to hybrid systems and emerging materials, such as thermochromic coatings, opens avenues for future innovation in building envelope design.
While the current model focuses on static assessments, its foundational principles can be extended to dynamic analyses, incorporating evolving grid decarbonization and material efficiency trends. Future work should also explore urban-scale microclimate effects and human-centric metrics, such as thermal comfort, to further refine the framework’s applicability. By bridging technical performance with real-world feasibility, this research contributes to the growing emphasis on whole-building sustainability, offering a transparent and scalable tool for architects, policymakers, and building owners. Ultimately, the 3-E framework advances the prioritization of energy-efficient solutions in urban planning, supporting the transition toward climate-responsive building strategies.
The proposed 3-E static payback period framework provides a robust foundation for evaluating roofing technologies, yet several avenues remain for refinement and expansion. Addressing these opportunities will enhance the framework’s applicability across diverse building contexts and emerging technologies.
(1) Dynamic Life Cycle Assessment Integration. The current model employs static emission factors and energy prices, which may not accurately reflect future decarbonization trends or market fluctuations. Incorporating dynamic life cycle assessment (DLCA) methodologies would enable time-dependent adjustments to grid carbon intensity, material efficiency improvements, and policy-driven cost variations. For instance, as renewable energy penetration increases, the environmental payback period of PV roofs could shorten significantly, altering their comparative advantage over cool roofs. Similarly, integrating probabilistic forecasting for electricity prices would improve the economic payback period’s reliability in volatile energy markets.
(2) Urban-Scale Microclimate Modeling. While the framework evaluates roofing systems at the building level, their aggregate impact on urban heat islands (UHI) remains unquantified. Future work should expand the system boundary to include neighborhood-scale effects, such as reduced ambient temperatures from widespread cool roof adoption. Coupling the 3-E framework with computational fluid dynamics (CFD) or urban canopy models could quantify secondary energy savings for surrounding buildings, potentially revising payback periods upward in densely populated areas. This expansion would align the analysis with municipal sustainability goals, where UHI mitigation often takes precedence over individual building performance.
