Article

A Multi-Objective Optimization Method for Enhancing Outdoor Environmental Quality in University Courtyards in Hot Arid Climates

by
Amr Sayed Hassan Abdallah
1,*,
Randa Mohamed Ahmed Mahmoud
2,
Ayman Ragab
3 and
Mohammed M. Gomaa
3,4
1
Department of Architectural Engineering, Imam Mohammad Ibn Saud Islamic University (IMSIU), Riyadh 11432, Saudi Arabia
2
Department of Architecture, Faculty of Engineering, Assiut University, Assiut 71516, Egypt
3
Department of Architectural Engineering, Faculty of Engineering, Aswan University, Aswan 81542, Egypt
4
Department of Architecture, School of Engineering, Computing& Design, Dar Al-Hekma University, Jeddah 22246, Saudi Arabia
*
Author to whom correspondence should be addressed.
Buildings 2025, 15(17), 3140; https://doi.org/10.3390/buildings15173140
Submission received: 18 June 2025 / Revised: 20 August 2025 / Accepted: 24 August 2025 / Published: 2 September 2025
(This article belongs to the Special Issue Research on Indoor Air Environment and Energy Conservation)

Abstract

Enhancing urban air quality and thermal comfort involves addressing multifaceted environmental and design challenges. Investigating the effects of urban morphological and building geometrical parameters on enhancing air quality and thermal comfort is a multifaceted problem, influenced by different parameters. This study aims to develop optimized design solutions for university buildings and courtyards to enhance outdoor thermal comfort and reduce CO2 concentration levels as an indicator of air quality. Consequently, the methodology involved a combination of field monitoring at two university faculties in Egypt and a computational parametric methodology using Rhino 3D+Grasshopper(V8) for enhancing thermal comfort, reducing CO2 concentration levels, and improving wind velocity. The in situ measurements revealed significantly high CO2 levels (780 ppm) and wind speed (3.8 m/s). The parametric methodology’s findings revealed a substantial reduction in the Universal Thermal Climate Index (UTCI) by 2.04 to 10.3 °C, a decrease in CO2 concentration by 57 to 197 ppm, and an increase in wind speed by 0.4 to 4.07 m/s. The most suitable vegetation ratio for trees within narrow courtyard designs was found to be 30%. This ratio effectively enhances thermal comfort (UTCI) and reduces CO2 concentrations, while also maintaining adequate airflow and avoiding excessive obstruction of natural ventilation within the courtyard. These findings provide valuable guidance for optimizing courtyard designs in hot arid climates.

1. Introduction

In recent decades, outdoor air quality has become a significant global issue due to rapid urbanization. Improving outdoor air quality offers numerous benefits, including enhanced occupant health and productivity, reduced environmental harm, and lower energy consumption costs. In hot arid climates, such as those found in Egypt, courtyards have historically played an essential role in architectural design. Their enclosed yet open form allows for better shading, passive cooling, and improved ventilation, making them highly effective in mitigating harsh outdoor conditions. Courtyards promote air circulation, reduce heat buildup, and create comfortable microclimates that enhance outdoor thermal comfort and air quality. These features make courtyards a practical and necessary design element in educational buildings within such regions [1,2]. In Egyptian universities, integrating courtyards into building designs is crucial due to their effectiveness in enhancing wind velocity and air temperature, as well as the positive impact of courtyard orientation on airflow rates [1,2,3,4,5]. Several studies have investigated the role of courtyard configurations (trees, shading, water fountains, etc.) in improving the outdoor thermal comfort and air quality in universities’ courtyards, thereby improving student health and performance [5,6,7,8,9,10,11]. Hence, previous studies have indicated that the inner courtyard is the most suitable design for university buildings in hot, dry regions. Additionally, courtyards can lower CO2 concentrations in adjacent indoor spaces, thereby contributing to a healthier and more comfortable environment for occupants [12,13]. Accordingly, investigating the synergistic effects of urban morphology and building geometry (e.g., courtyard design, vegetation, building height) collectively on the outdoor air quality in universities’ courtyards constitutes a significant knowledge gap. Consequently, the relevant literature is categorized into three main areas: (1) studies on improving outdoor thermal comfort and air quality, (2) studies on enhancing indoor thermal comfort and air quality, and (3) vegetation strategies for optimizing indoor and outdoor thermal performance and air quality.

1.1. Background and Literature

University buildings require a high level of outdoor and indoor environmental quality [14]. The environmental quality depends on several factors: air quality, thermal comfort, acoustic comfort, and visual comfort. The three main areas of the literature review are detailed below.

1.1.1. Role of Geometry Parameters in Enhancing Outdoor Environmental Quality

Firstly, there is a set of studies that have illustrated strategies for improving outdoor thermal comfort in the urban spaces of educational buildings. Abdallah et al. [15] studied the thermal performance of courtyards in university buildings at Sohag University during the hot period. They found that courtyards with a height-to-width (H/W) ratio of 1.2 provided better thermal comfort and performance compared to those with a ratio of 0.7. Also, Eid et al. [16] conducted simulations of eight urban canyon configurations with varying aspect ratios to assess their impact on outdoor thermal comfort and CO2 concentrations. The study revealed that these configurations led to a reduction in CO2 concentration ranging from 0.34 to 12.33 ppm. Additionally, Li et al. [17] have studied the thermal comfort and air quality in five frontal area densities according to the CO2 concentration and physiologically equivalent temperature (PET). It was found that when the frontal area density was increased, the PET value fell below 38 °C, and the CO2 concentration was lower than 30,000 μg/m3. Moreover, Su et al. [18] developed a multi-objective methodology using Rhino and Grasshopper to assess the impact of dynamic urban variables, such as building orientation, height, spacing width, and layout, on the life-cycle carbon emissions of outdoor spaces between buildings. Their results indicated a reduction in carbon emissions by 15%. Similarly, Bedra et al. [19] introduced a parametric-simulation framework that explores the impact of three urban form variables—street aspect ratio, building density, and street orientation—on UTCI decreasing. The results indicate that each 10% increase in building density lowers the UTCI by about 1.02 °C. Finally, Abdallah et al. [20] have developed a multi-objective urban optimization framework to optimize the outdoor thermal comfort in outdoor recreational areas. The results indicated that the hybrid solutions between shadings and trees (with diameters between 10 and 15 m) could reduce UTCI by 11.6 °C. Several studies have illustrated strategies for enhancing indoor thermal comfort, air quality, y, and CO2 concentration inside the classrooms of educational buildings, such as [21,22,23]. Also, van der Walt et al. [21] have conducted field measurements of air temperature and CO2 concentration in three types of classrooms—brick, container, and prefabricated—in Stellenbosch, South Africa. It was found that the brick classroom has the best ventilation and thermal performance in contrast with the container classroom. In conclusion, while previous studies have effectively demonstrated the influence of outdoor improvement strategies to enhance outdoor thermal comfort and air quality, their application across diverse urban and building parameters in university buildings remains insufficiently explored and needs deep investigation.
Secondly, there is a set of studies that have illustrated strategies for improving air quality and wind effects in educational buildings. For example, Wu et al. [24] investigated the impact of varying air temperature and wind speed on air quality, and the findings showed that the most influential variables on air quality in suburban and urban areas were wind speed and air temperature, respectively. Also, Mahyuddin and Essah [22] have used Computational Fluid Dynamics (CFD) in investigating the internal and external airflow in two different classrooms. The results indicated that the external wind direction, speed, and pressure played the main role in improving internal ventilation, as well as the upward convergence between CO2 concentration inside the classrooms and thermal performance. Further, Maiques et al. [25] have investigated the impact of four different ventilation strategies in four classrooms inside two building orientations. The results indicated that natural ventilation assisted in improving indoor thermal comfort and air quality by 5% and 2%, respectively. Li et al. [26] have integrated Green Design Studio with Rhino+Grasshopper (V8) to establish a multi-objective modular platform to analyze building and urban parameters to improve indoor environment quality, indoor energy efficiency, and outdoor air quality. In addition, Moghadam et al. [27] have assessed the impact of a novel integration ventilation system (transpired solar collectors and mechanical ventilation heat recovery) on indoor wind flow rate, air temperature, and CO2 concentration in a university classroom in Ireland. The results proved the efficiency of the novel ventilation system in reducing air temperature and CO2 concentration, in addition to reducing heating energy demand by 20%. Eventually, Yao et al. [28] proposed a multi-objective optimization and low-carbon framework to improve indoor air quality, thermal comfort, and daylight illuminance based on changing five design parameters: layout dimension, building orientation, building envelope, WWR, and openable window area ratio. The results revealed that the CO2 concentration decreased by 14%. In conclusion, while numerous studies have examined the impact of indoor strategies on enhancing thermal comfort and air quality, there is a notable gap in research focusing on the effects of outdoor strategies on the indoor environment. This area warrants further investigation to better understand how outdoor environmental factors influence indoor conditions.

1.1.2. Role of Vegetation in Enhancing Outdoor Environmental Quality

Thirdly, a set of previous studies have explained vegetation strategies for optimizing indoor and outdoor thermal performance and air quality. For instance, Gebreyesus et al. [29] used the i-Tree Eco model to investigate the impact of green infrastructure on enhancing air quality. The results indicated that the annual removal reached 274.2 t of pollutants, a percentage of 37.4%. Furthermore, Abdeen and Rafaat [30] conducted a study at the Canadian University in Egypt, utilizing DesignBuilder (V.5.0.3.007) software to assess the impact of vertical green walls on CO2 emissions, heat gain, and energy consumption. Their findings indicated that the CO2 emissions in the inner courtyard decreased by 13% to 28.43%. Additionally, Gustafsson et al. [31] have integrated two specific models, called PALM and VIDA, to study the impact of different tree types on reducing NO2 and particulate matter PM concentration. It was found that the tree species of sparse crowns with sparse tree arrangements achieved the highest results in providing natural ventilation and reducing NO2 concentration and PM levels. Also, i-Tree Eco was used to assess the impact of different tree diversity and spatial distribution on reducing PM10 to improve air quality in Geneva, Switzerland [32]. It was found that the tree density was playing the main role in reducing PM10 from 45 to 19%. Kaveh et al. [33] have investigated the influence of building height and diversity of greenery positions as a novel ventilation pattern on improving air quality (PM2.5, PM10, NO2) by the simulation process. It was found that stepped buildings with green walls caused the highest air temperature of 18.0 °C and high air quality, but two rows of deciduous trees caused the lowest air temperature of 17.5 °C and low air quality. An assessment of the impact of green space percentage on enhancing air quality was conducted by [34]. The results indicated that a vegetation percentage of 27% has a significant influence in reducing air pollutants (PM2.5, PM10), and that impact would increase by increasing the green space percentage. In conclusion, while existing studies have separately examined the roles of vegetation and green infrastructure in reducing air temperature and air pollution, there is a notable gap in research investigating how varying vegetation ratios simultaneously influence reduction in UTCI and CO2 concentrations, besides increasing wind velocity.

1.2. Research Objectives

Recently, the improvement process for air quality has become a dilemma that needs creative solutions from urban and building designers. The ratio of air pollution is rising daily because of rapid urbanization, the population is increasing, and there is an increase in polluted resources such as industrial areas [24,30,35]. While recent studies emphasize innovative strategies to mitigate air pollution in urban public spaces [15,25,27], there is limited research that focuses on outdoor spaces of educational buildings in hot arid climates [21,30], which represents a significant research gap. Furthermore, research on improving the outdoor spaces of educational buildings to mitigate air pollution in hot arid climates remains limited [21,30]. Therefore, the problem is the complexity of modeling and evaluating a diverse number of urban morphological and building geometrical parameters together under varying meteorological conditions and investigating their effect on improving air quality in the outer spaces of educational buildings [18,26,28]. Hence, the main aim of this study is to develop optimized design solutions for university buildings and courtyards to enhance outdoor thermal comfort and reduce CO2 concentration levels as an indicator of air quality. Consequently, the methodology involved a combination of field monitoring at two university faculties in Egypt and a computational parametric methodology using Rhino 3D+Grasshopper(V8), which contributes to the following aims:
  • Investigating the dynamic influence of a set of urban morphological and building geometrical parameters on optimizing air quality in university buildings.
  • Improving configurations for university buildings with outdoor courtyards to enhance the students’ experience in the outdoor spaces.
  • Improving the students’ progress and scientific performance, besides boosting social activities.
Nevertheless, the key novelty lies in evaluating the combined influence of urban morphology and building geometry on enhancing air quality in university buildings within hot arid climates. Ultimately, this study equips designers with evidence-based guidelines to optimize university buildings in hot arid climates, particularly in Upper Egypt, by identifying key parameters (e.g., vegetation density, building height, courtyard openings) that collectively enhance thermal comfort, air quality, and wind velocity.

2. Research Methodology

2.1. Case Study and Weather Climate Description

The case study selected for monitoring and calibration is two educational buildings in Sohag University, Sohag, Egypt. The location coordinates of Sohag are 26.56° N and 31.69° E. The city is located in the southern part of Upper Egypt, according to the Egyptian Code of Improving Energy Use [36]. In winter, outdoor temperatures were between 7.3 °C and 22 °C. In the summer, the average was 39.6 °C during the day and 23.1 °C at night. Relative humidity was 30% in May and 57% in January [37]. Winter wind direction is north and northwest, and northwest/north in summer [38]. Due to a clear sky all year long, Sohag has strong, direct solar radiation [38]. Over an area of 750 acres, the New Sohag University is located in New Sohag City. The educational buildings selected contained passive strategies. They were selected during the post-occupancy stage. Others were excluded as they were not yet in full operational capacity, and did not have passive features. As a result, the Faculty of Agriculture and the Faculty of Education were selected. Figure 1 shows the Faculty of Education, near the main entrance of New Sohag University. A 4711 m2 ground floor and four upper floors make up the building. It has two courtyards totaling 1531 m2. Some openings overlook the courtyards. Figure 1 also shows the Faculty of Agriculture, near the main entrance of the university. Five upper floors and a ground floor make up the building, with a total area of 7492 m2. The building has three courtyards, totaling an area of 3147 m2. Some openings in classes, offices, and labs overlook the courtyards.
During the hot period (March–May 2018), CO2 and wind speed were monitored. This period was selected due to its position at the beginning of the hot period and before the end of the second semester. Measurements were taken over six days per month, from 9 a.m. to 3 p.m., due to the schedule of the sessions and lectures and the presence of students. This study is part of detailed evaluations of the two buildings in past research for a one-year evaluation and monitoring [15]. The two buildings were selected because their design and included passive strategies (cross ventilation, inner courtyards, and vegetation therein). Several parameters were measured with a variety of datalogger devices depicted in Table 1. Calibration was carried out by the author in the Environmental Laboratory at Assiut University prior to the commencement of measurements, using reference devices to ensure accuracy. Measurement devices were installed in both classrooms and courtyards at heights of 1.7 m (to represent standing occupants) and 1.1 m (for seated occupants), in accordance with ASHRAE Standard [39]. All devices were mounted on tripods to achieve the required heights and maintain stability. To minimize the influence of human presence—particularly for wind-speed sensors—devices were positioned away from students, ensuring that occupancy conditions did not affect the measurements. Monitoring was conducted in several locations in three courtyards with an aspect ratio (H/W) of 0.7 in the Faculty of Agriculture and 1.2 in the Faculty of Education. The measurements were conducted to evaluate the current situation and develop a parametric method based on measurement results to achieve indoor air quality. Secondly, when investigating the impact of dynamic variable parameters on enhancing the air quality in university buildings, a parametric method should be relied on, using the simulation Rhinoceros software Version 8, the Grasshopper plug-in, and the Ladybug plug-in. Calibration of the simulation software was conducted based on real measurements of CO2 and wind speed in the Faculty of Agriculture.

2.2. The Proposed Parametric Methodology

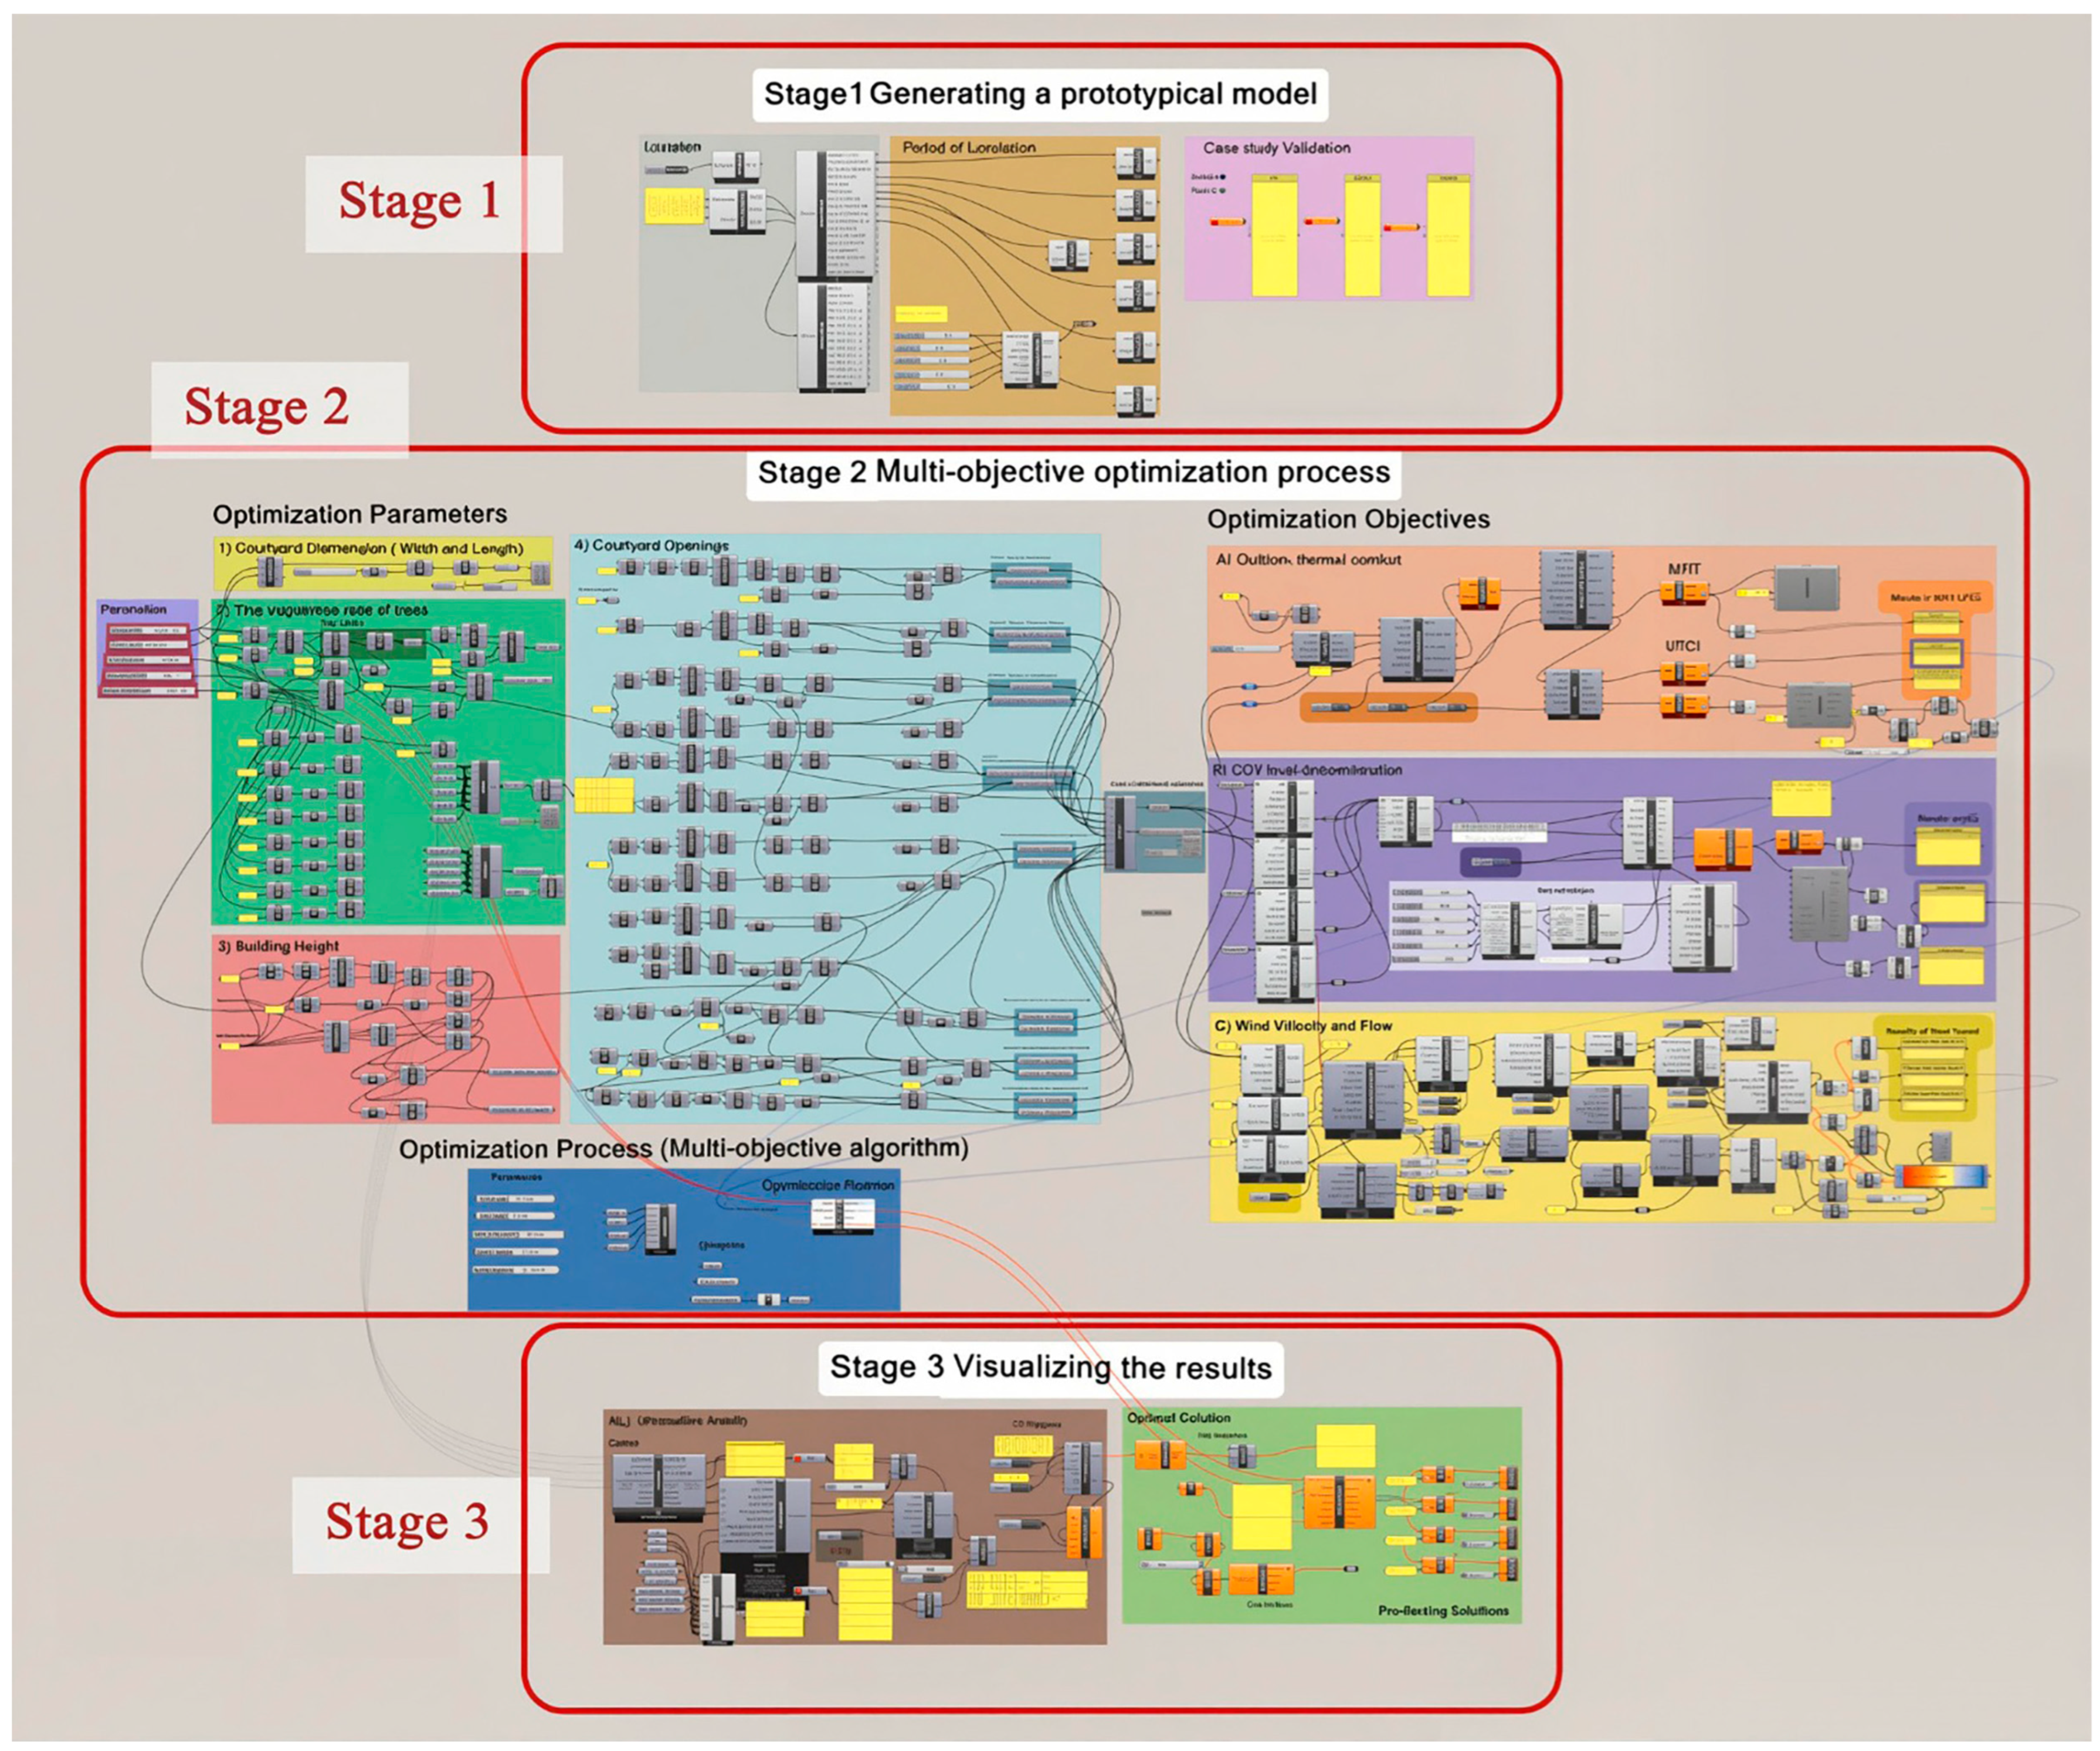
In light of the above considerations, this paper assumed a parametric methodology based on a multi-objective algorithm to achieve the high fitness of objectives. The proposed parametric methodology consisted of 3 main stages as shown in Figure 2. For implementing the methodology computationally, Rhinoceros + Grasshopper as a parametric platform was chosen due to its flexibility and efficiency in establishing parametric models [26,28,40]. The first stage was generating a prototypical model of the base case and using the weather data file of the location. In this stage, Rhinoceros software Version 8 and the Grasshopper plug-in were used with the Ladybug plug-in for inserting the weather data file. Then, a set of 32 design solutions varying between urban morphological and building geometrical parameters was established using Grasshopper to act as optimization parameters in the next stage. In addition, the three optimization objectives were defined as improving thermal performance, reducing the CO2 concentration, and improving wind velocity using the Ladybug plug-in, Honeybee plug-in, and Butterfly plug-in, respectively. In the second stage, a multi-objective optimization process took place based on the optimization parameters to achieve the optimization objectives using the Wallacei plug-in to obtain the optimal solutions and the Colibri plug-in to collect all the results. Thus, the third stage was the visualization of the results of the optimal solutions, in addition to exporting the results of all design solutions in an Excel sheet by the TT Toolbox plug-in for analyzing the correlation determination. As a result, the workflow of the proposed parametric methodology was established and elaborated in Figure 3 to achieve the desired objectives:
  • Improving the thermal comfort in the courtyard by reducing the UTCI.
  • Improving the air quality in the courtyard by reducing CO2 concentration levels. The concentration of CO2 was selected as a key indicator due to its relevance to ventilation effectiveness and its frequent use as a proxy for air stagnation in urban outdoor environments.
  • Improving the air quality in the courtyard by increasing wind velocity.

2.2.1. Generating a Prototypical Model: Stage 1

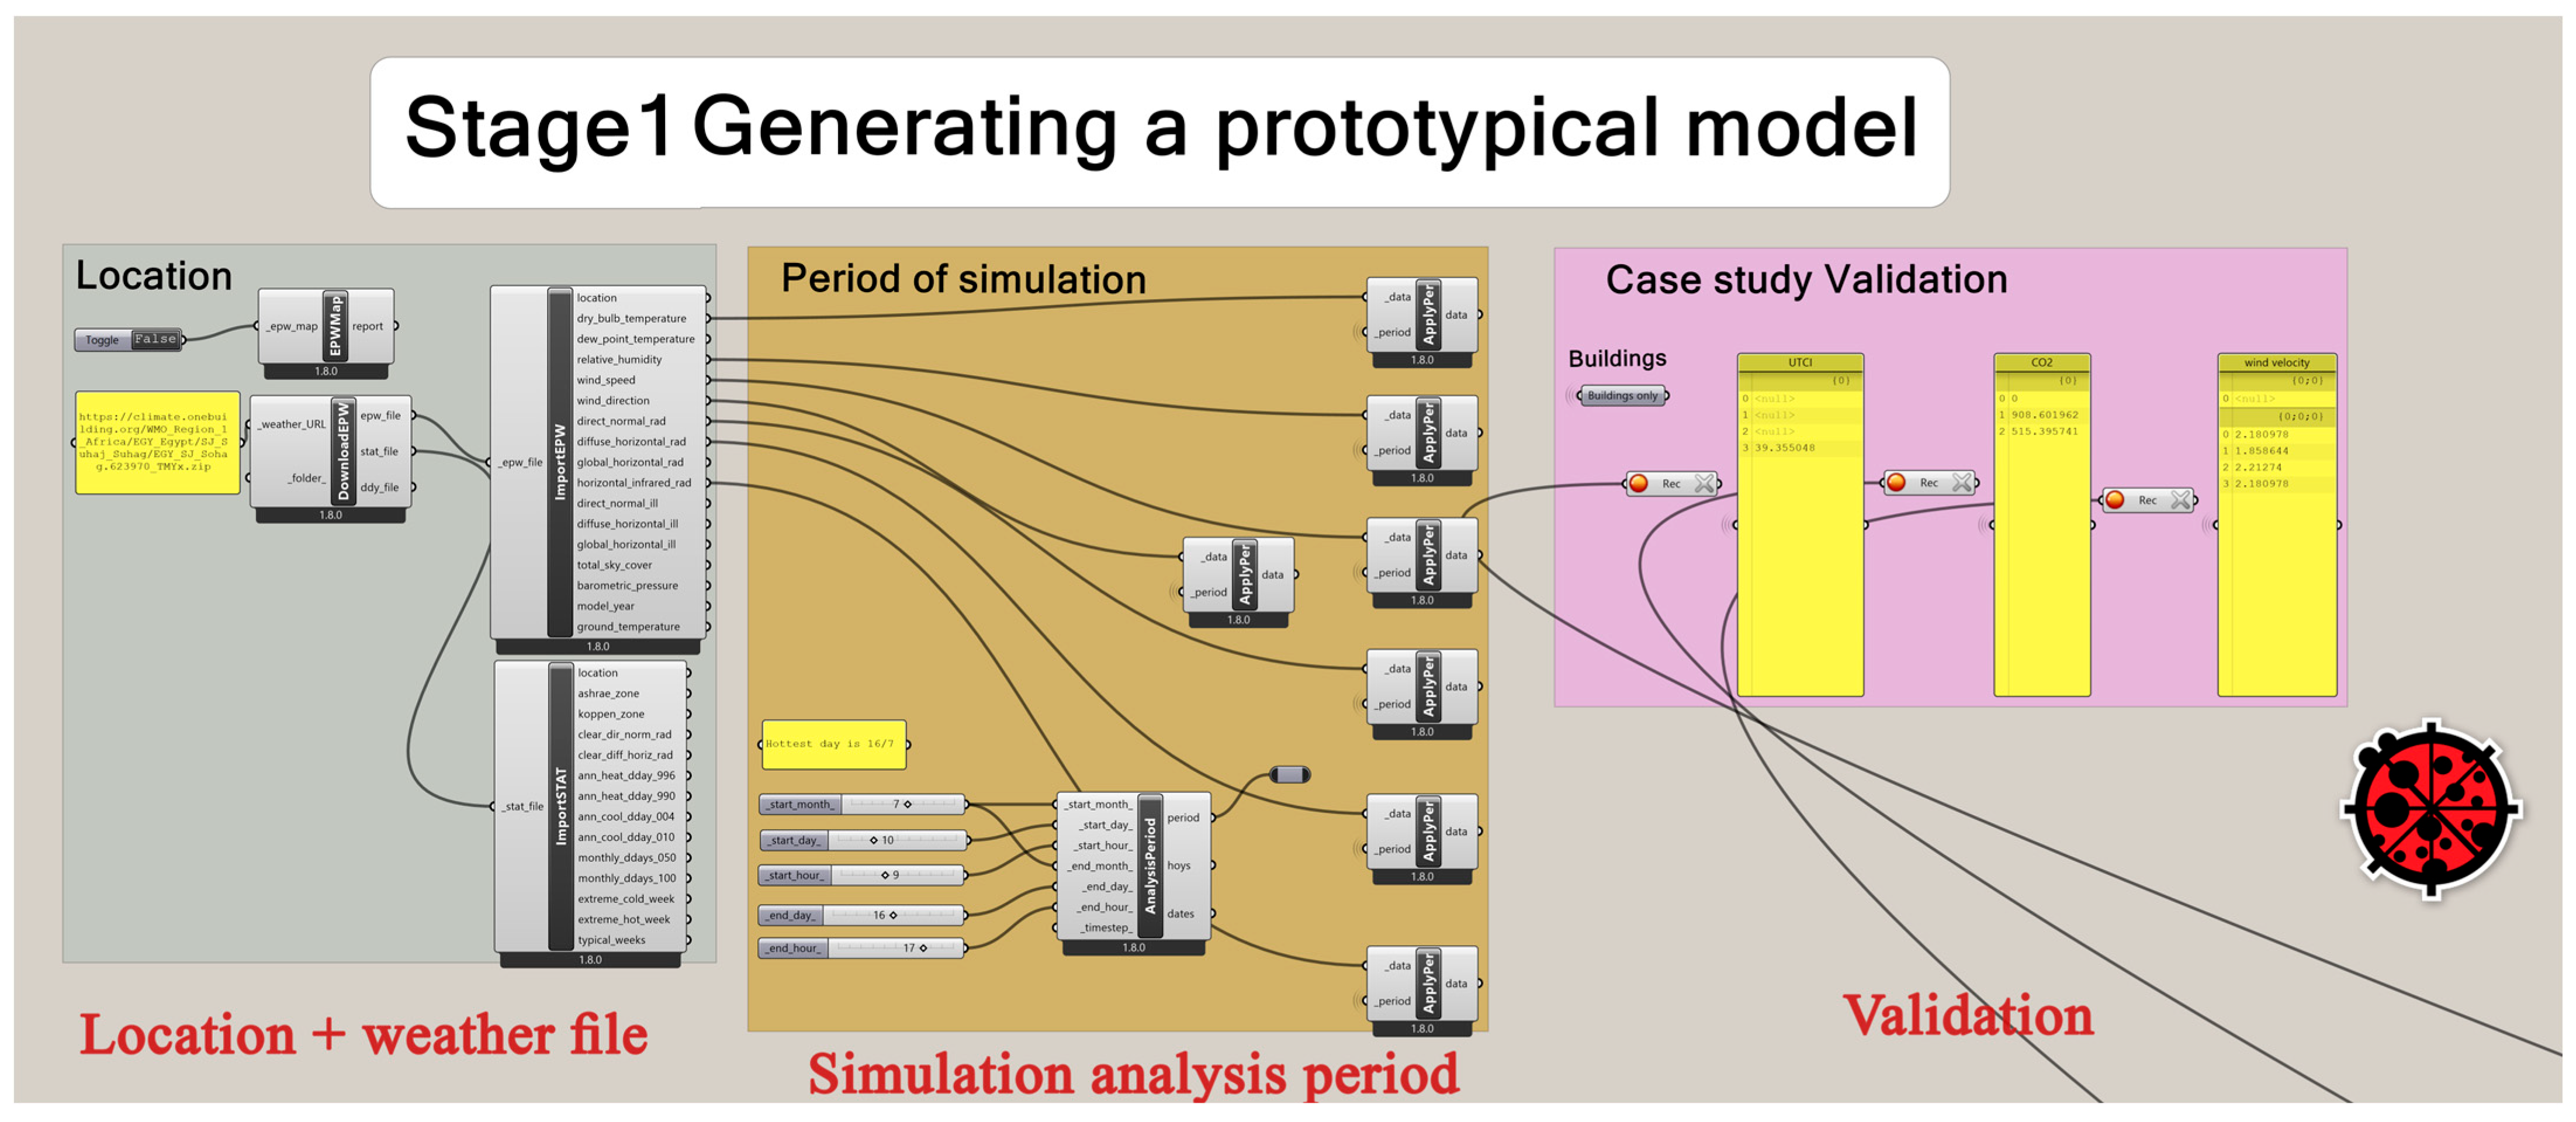
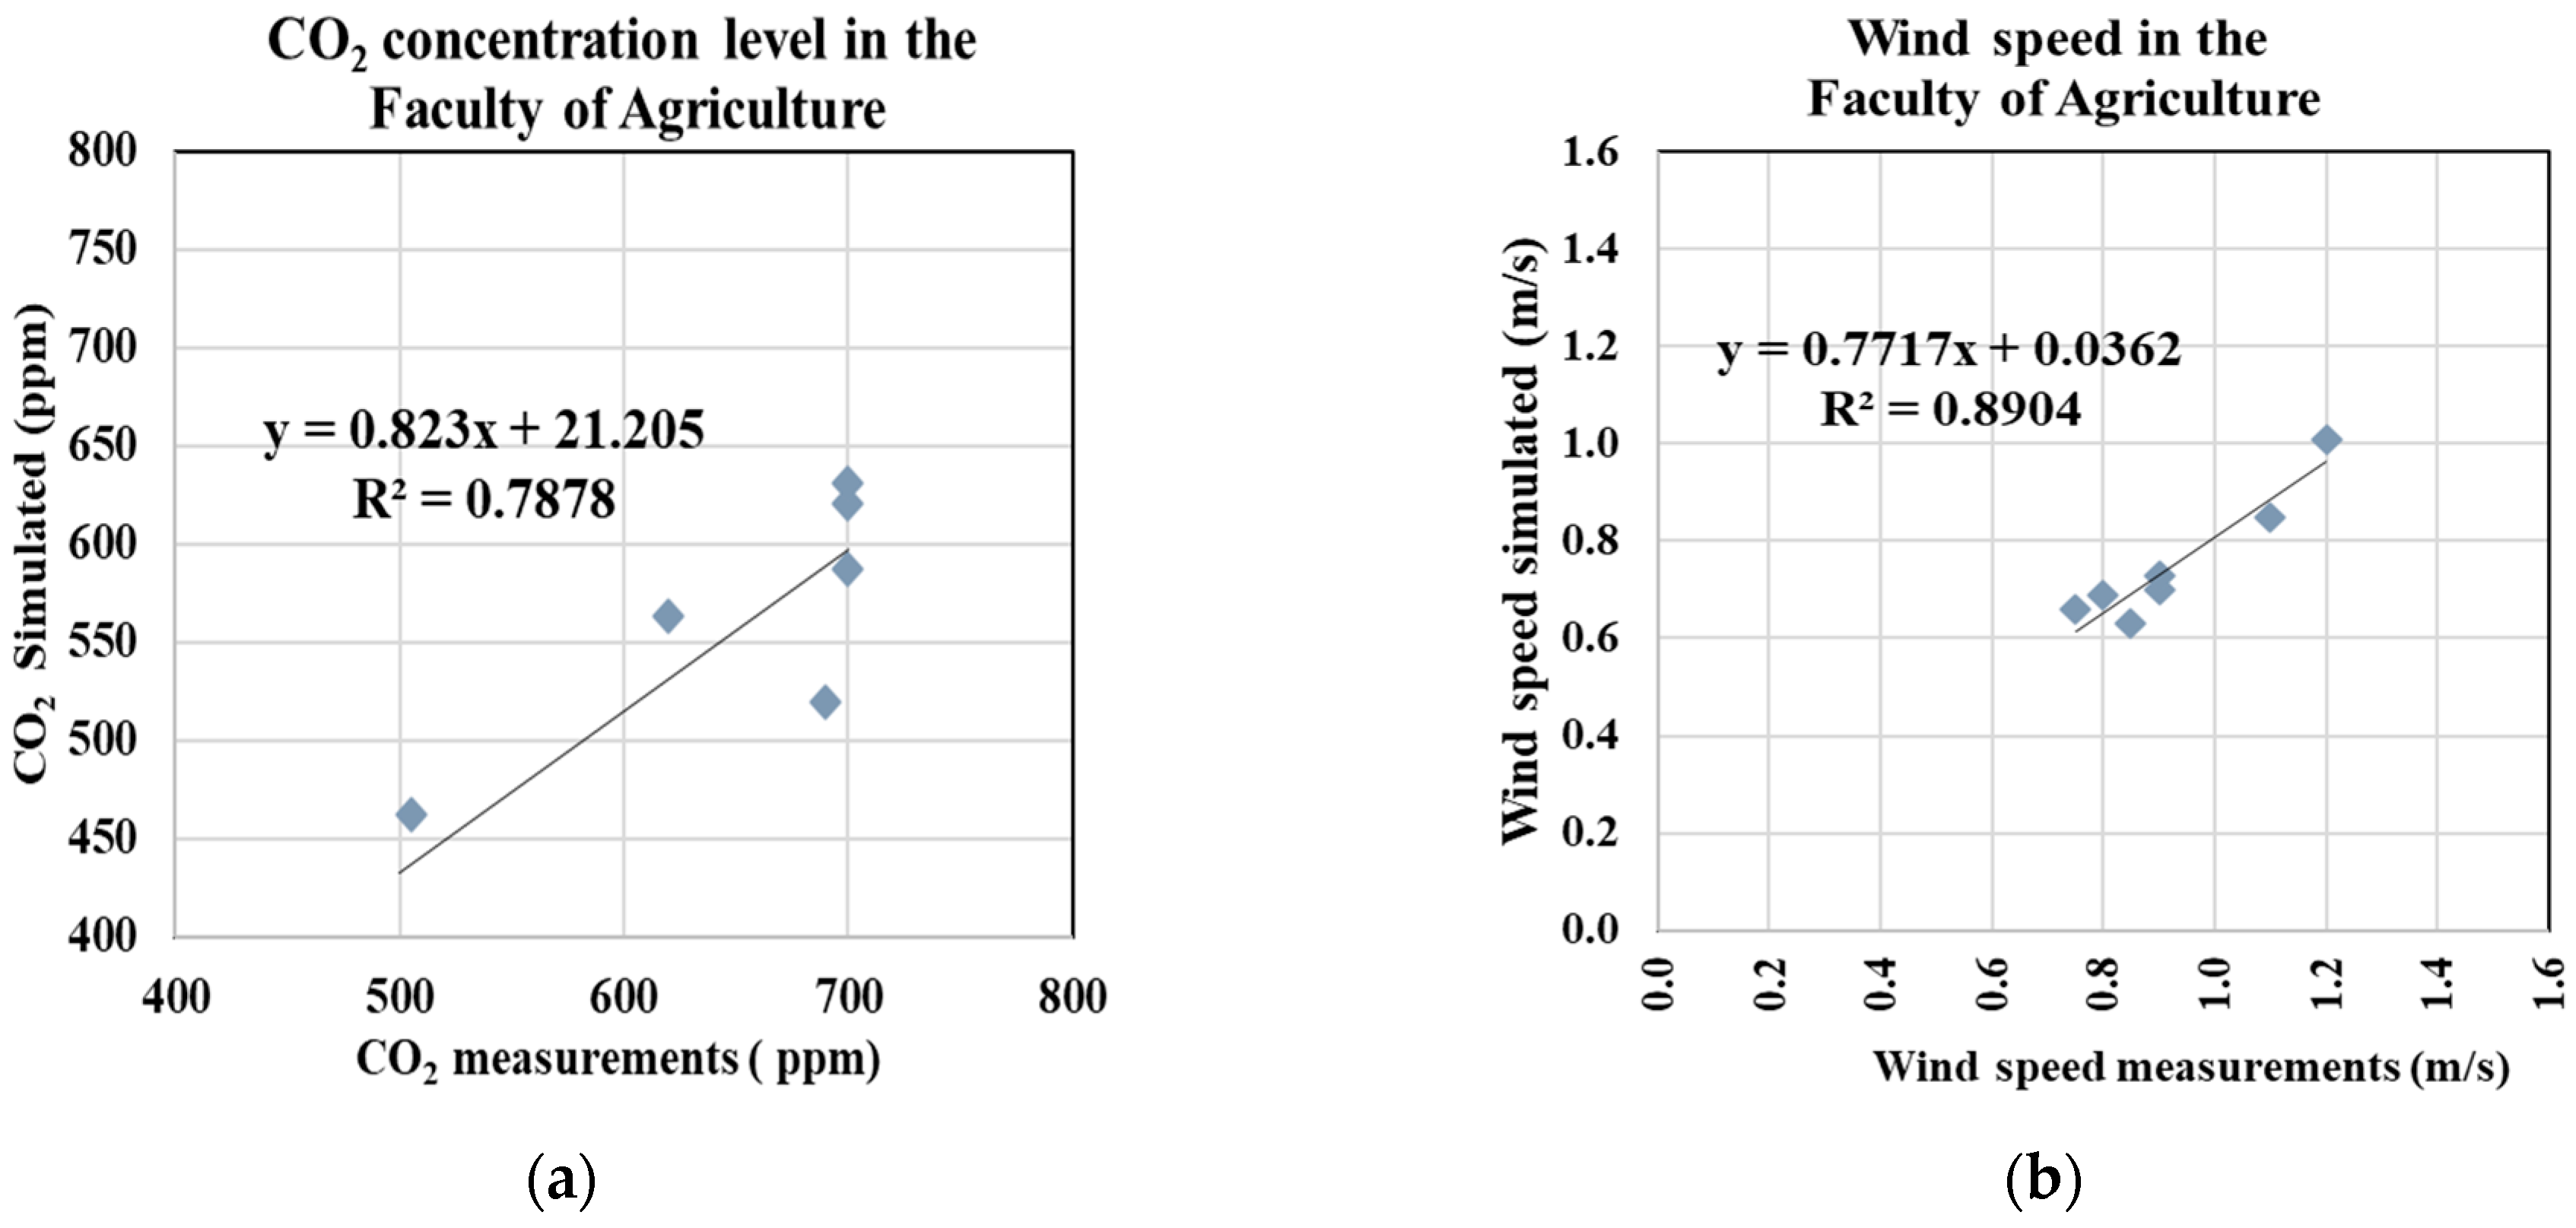
In the first stage, the previous base cases of the courtyards in the university buildings were utilized for two purposes. The first purpose was to computationally generate the prototypical model of the university’s building and its courtyard as shown in Figure 4. Hence, Rhino+Grasshopper(V8) as a parametric platform and the Ladybug plug-in were used to define the location of the model in Sohag City, Egypt, as well as inserting the weather data file. Ladybug is an analysis tool that is used to allow the extraction of EnergyPlus Weather data from a wide range of locations and produce analysis about microclimate conditions in outdoor spaces, such as UTCI and PET thermal comfort indexes. The validation Ladybug plug-in was calculated and found to be 0.83 [20], despite its limitations in the simulation of indoor environments. In addition, the hottest week was determined as the analysis period of the simulation: from 10 July to 16 July, especially in the scheduled hours from 8:00 to 17:00. The second purpose was to validate the accuracy of the prototypical model by comparing the in situ measurements of the wind speed and CO2 concentration level in the Faculty of Agriculture with the simulation results with the same parameters of the real faculty and on the same day. Thus, the Honeybee plug-in was used to determine the CO2 concentration level based on the EnergyPlus engine. Honeybee is a Grasshopper plug-in that provides data regarding CO2 emission, daylight, and energy performance inside spaces. As shown in Figure 5, the Coefficient of Determination (R2) of CO2 concentration was 0.78. In addition, Butterfly, which is a Grasshopper/Dynamo plug-in and object-oriented Python (V7) library that creates and runs computational fluid dynamics (CFD) simulations using OpenFOAM, was used to measure the wind velocity in the courtyard. As shown in Figure 5, the Coefficient of Determination (R2) of wind speed was 0.89. Furthermore, the Root Mean Squared Error (RMSE) values for CO2 concentration and wind speed were 0.986 and 0.18, respectively, indicating a relatively low level of error. This suggests that the model provides accurate predictions, thereby validating the numerical prototypical model.

2.2.2. Multi-Objective Optimization Process: Stage 2

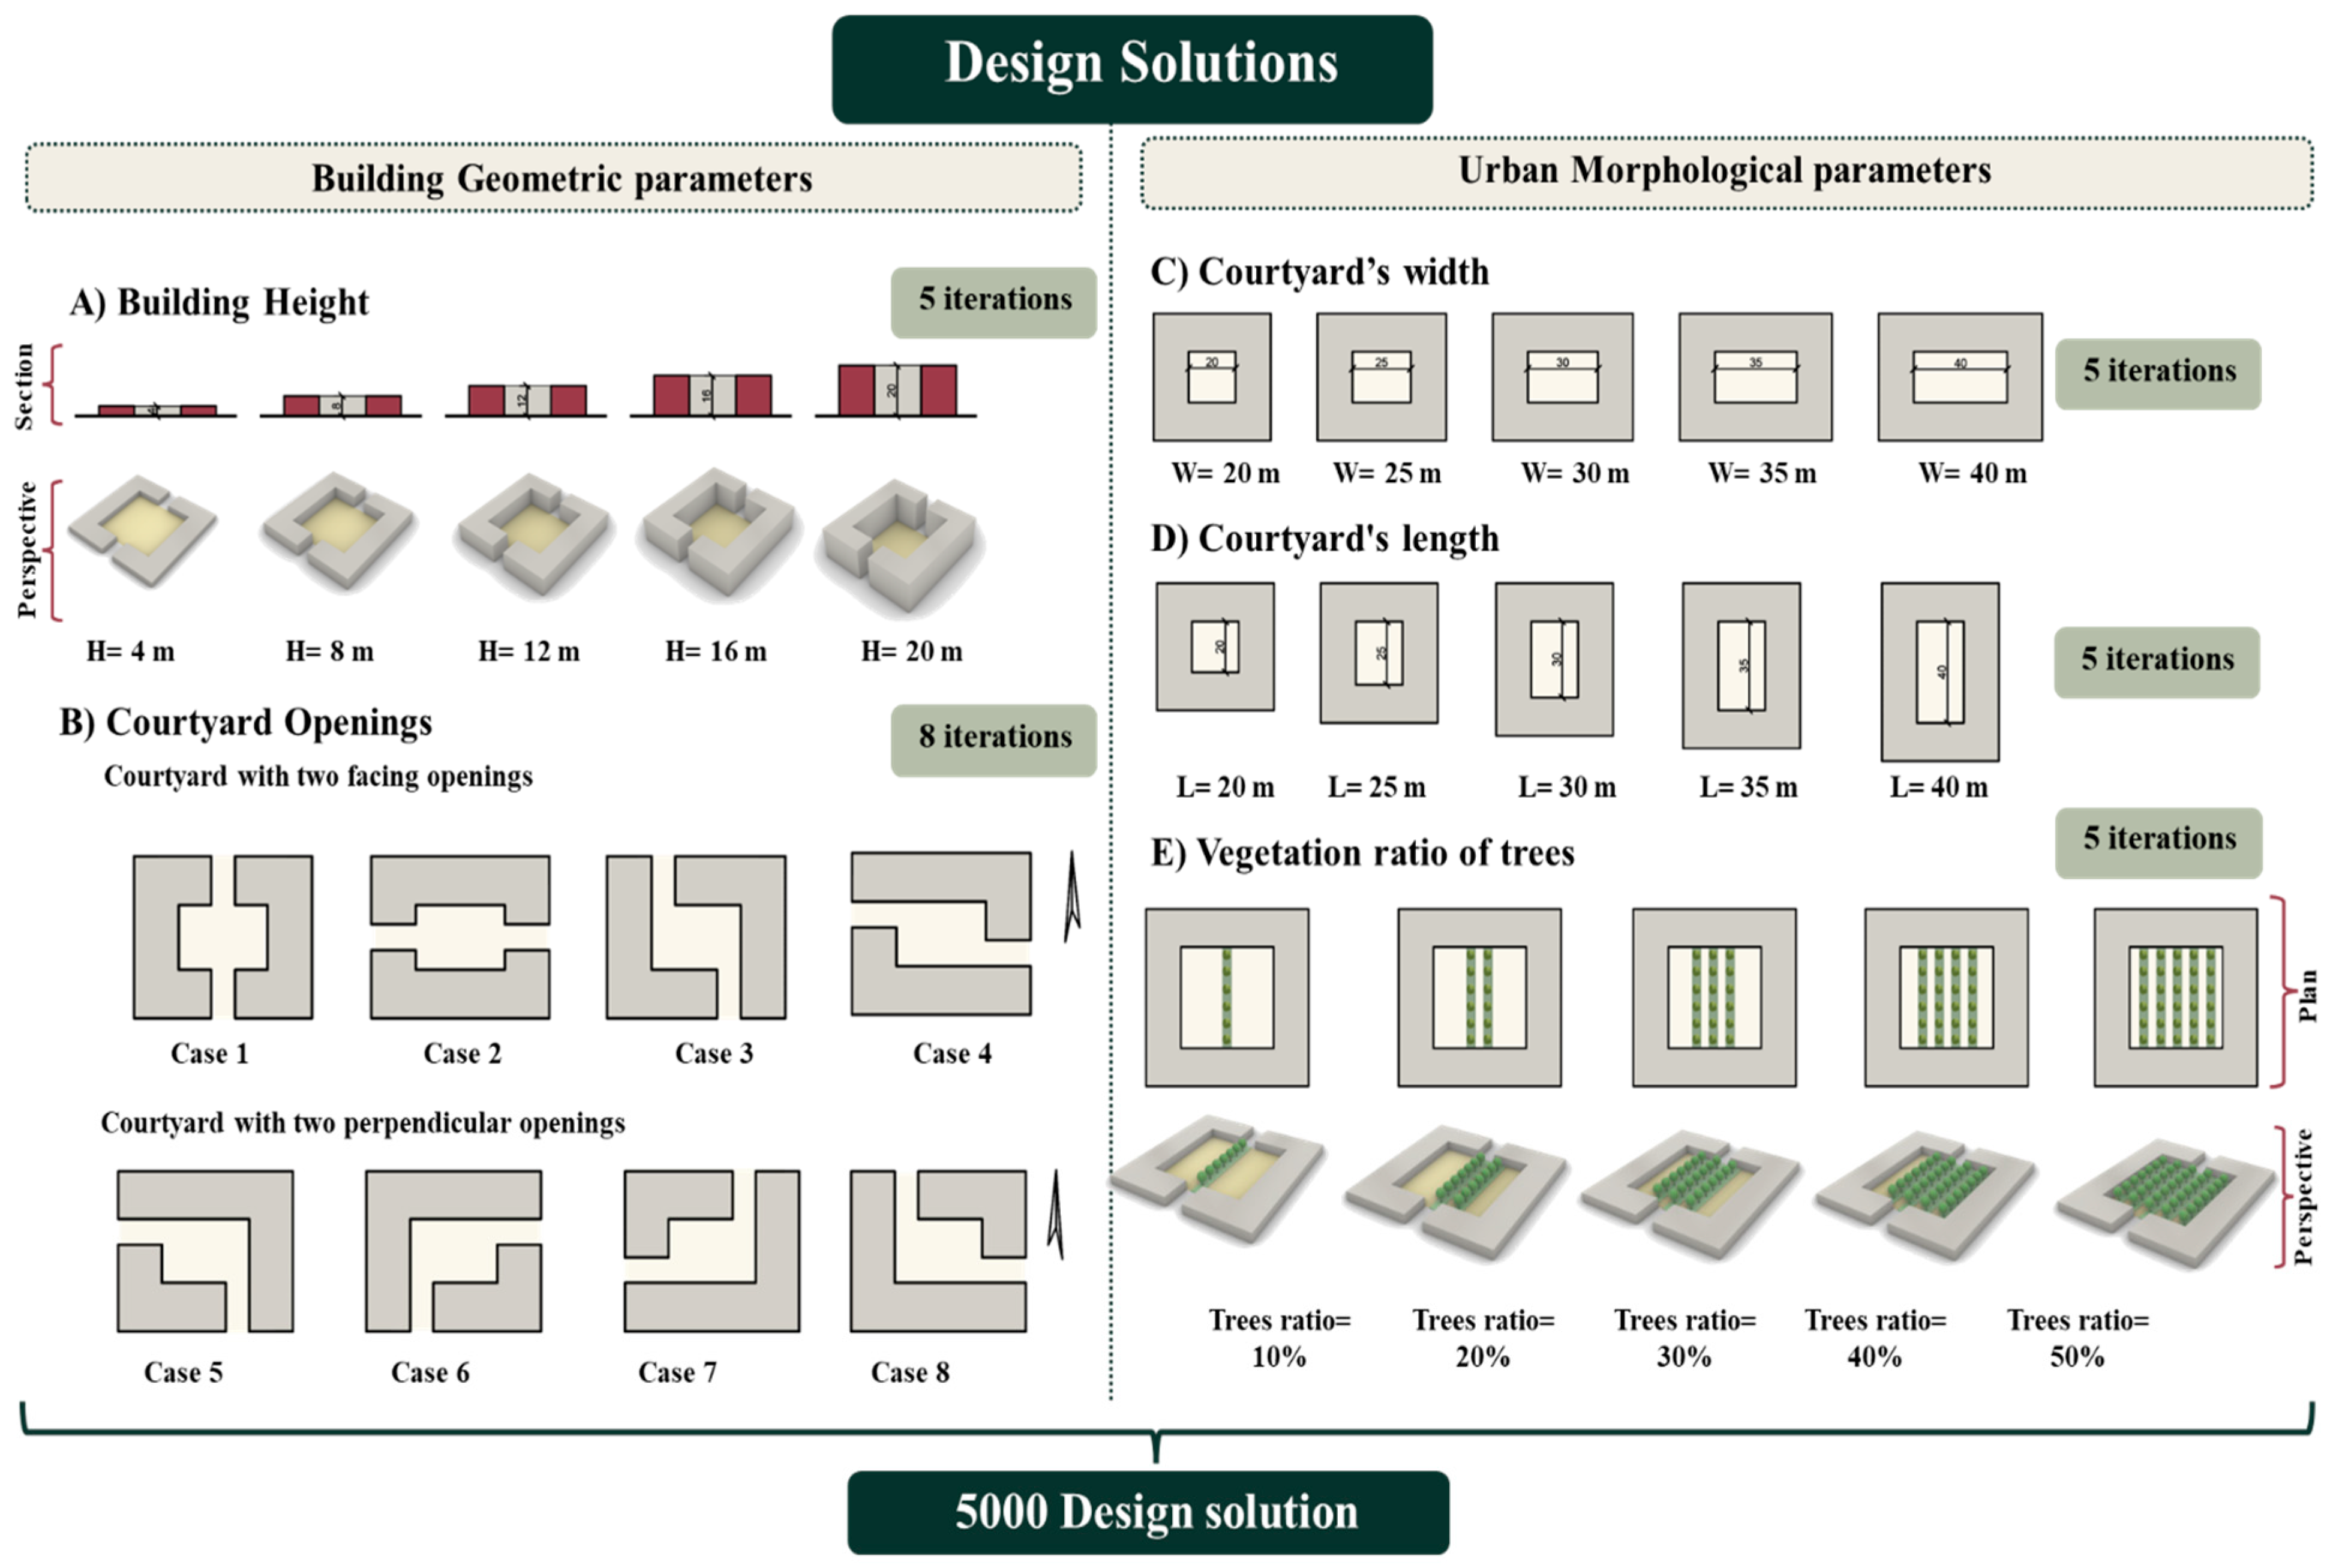
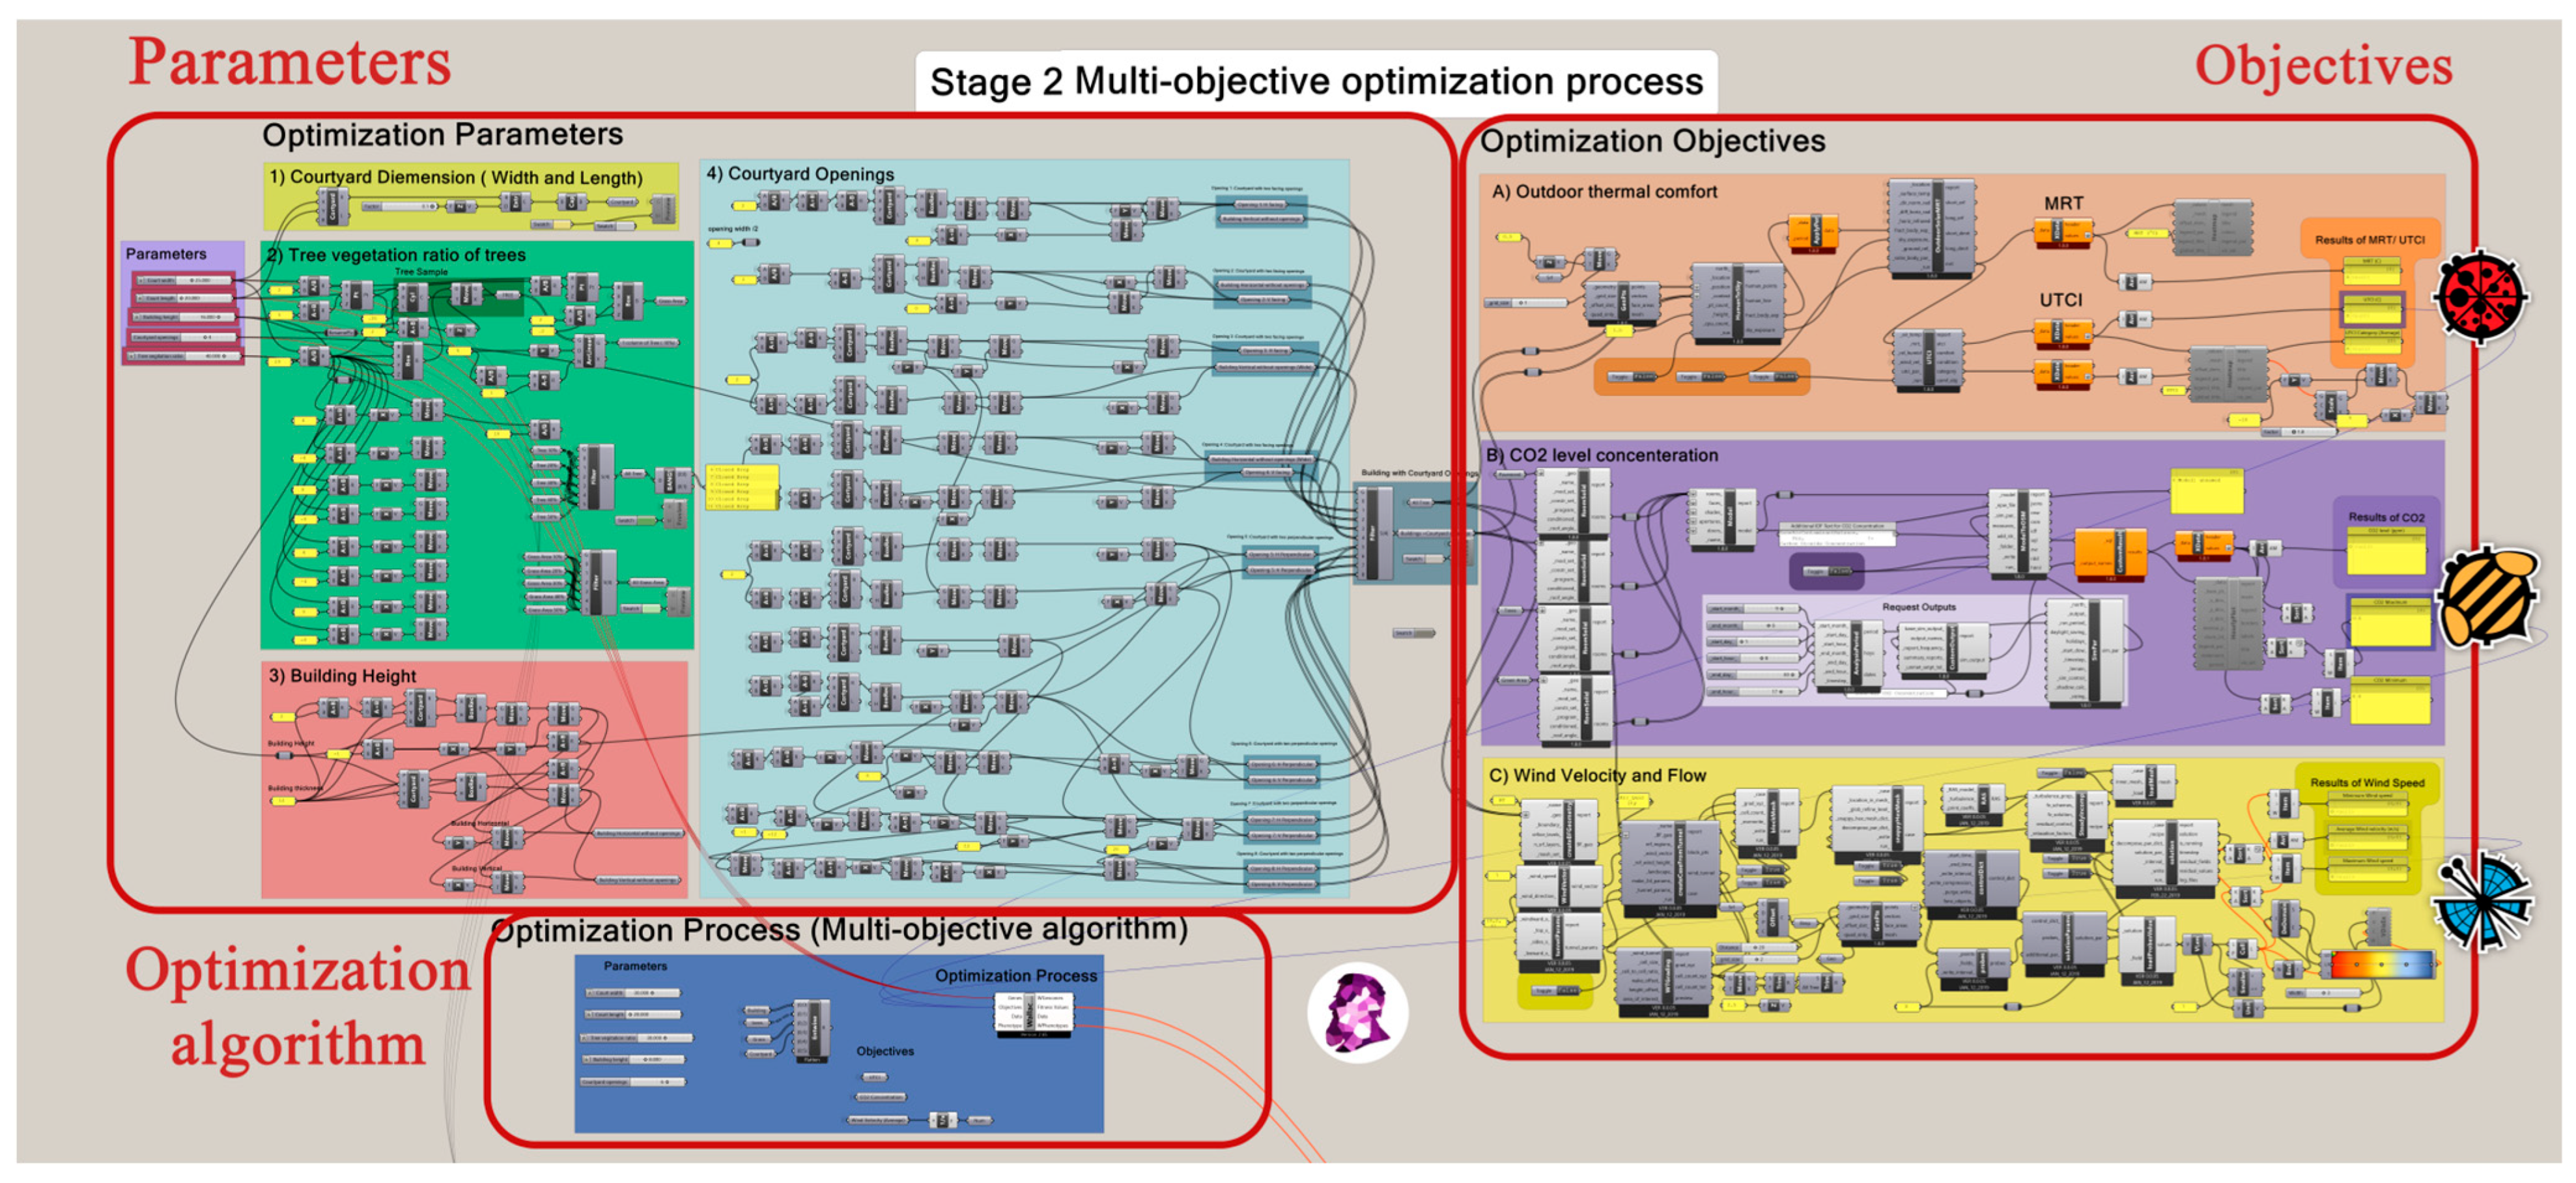
The initial simulation of the Faculties of Agriculture and Education highlighted critical issues concerning air quality and thermal performance within the courtyards. The average UTCI, CO2 concentration level, and wind speed in the courtyard of the Faculty of Agriculture during the hottest week were 42.7 °C, 600 ppm, and 0.9 m/s, respectively. The average UTCI, CO2 concentration level, and wind speed in the courtyard of the Faculty of Education during the hottest week were 44.04 °C, 680 ppm, and 1.5 m/s, respectively. Consequently, the issue was substantiated, and the necessity for optimized design solutions was thoroughly discussed. Hence, a set of design solutions was proposed with diverse building geometric parameters and urban morphological parameters, as illustrated in Figure 6. Firstly, we have the design solutions with different building geometric parameters, which are the following: building height and courtyard opening in the building mass. The building height varied between 4 m and 20 m based on the common height in the university buildings (from 1 to 5 floors). Additionally, eight courtyard opening cases were proposed, each incorporating two opposing or perpendicular openings to harness the cross-ventilation effect, thereby enhancing air quality. Additionally, the building’s mass featured an 8 m wide opening, representing 20% to 40% of the inner courtyard-facing façade. Secondly, we proposed design solutions with different urban morphological parameters, which are as follows: the courtyard’s width, the courtyard’s length, and the vegetation tree ratio. Through observation of the Egyptian universities’ courtyards, it was found that the range of the courtyards’ widths and lengths was between 20 m and 40 m. Consequently, the proposed courtyard’s width and length were from 20 m to 40 m. To improve the air quality in the courtyard, a vegetation area should be implemented inside the courtyard. Thus, a vegetation area with a tree ratio ranging between 10% and 50% was implemented to purify the air and provide shade for the users, in addition to providing spaces for seating and social activities. Certain parameters for tree vegetation ratio were derived from prior studies [20,33,34] which demonstrated their effectiveness in enhancing outdoor thermal comfort and air quality. Meanwhile, building height and courtyard dimensions (expressed as height-to-width, H/W ratios) were adopted from earlier research [15,18], with values adjusted to reflect typical heights in Egyptian university buildings. In contrast, courtyard opening parameters were entirely proposed by the authors.
Moreover, the three main objectives were to minimize the UTCI, minimize the CO2 concentration level, and maximize the wind velocity. Hence, the Ladybug plug-in was used to calculate the UTCI, the Honeybee plug-in was used to determine the CO2 concentration level, and the Butterfly plug-in was used to measure the wind velocity (Figure 7). Furthermore, the optimization process relied on the NSGA-II algorithm, which was presented through the Wallacei plug-in as a multi-objective optimization algorithm. Therefore, the Wallacei plug-in sought to optimize the parameters of all the design solutions to achieve the best results across the three objectives. While the simulations conducted using Rhino+Grasshopper (V8) provide valuable results, several factors may introduce uncertainties into the results. For example, the precision of sensors used to collect input data of wind speed or air temperature and the fluctuations in environmental conditions, including changes in wind direction and speed, can affect the consistency of the simulation results over time. However, this approach ensures transparency regarding the limitations of the simulation and underscores the importance of considering various factors that can influence the accuracy of analyses in Rhino and Grasshopper. So, the settings of the optimization process are illustrated in Table 2.

2.2.3. Visualization of the Results: Stage 3

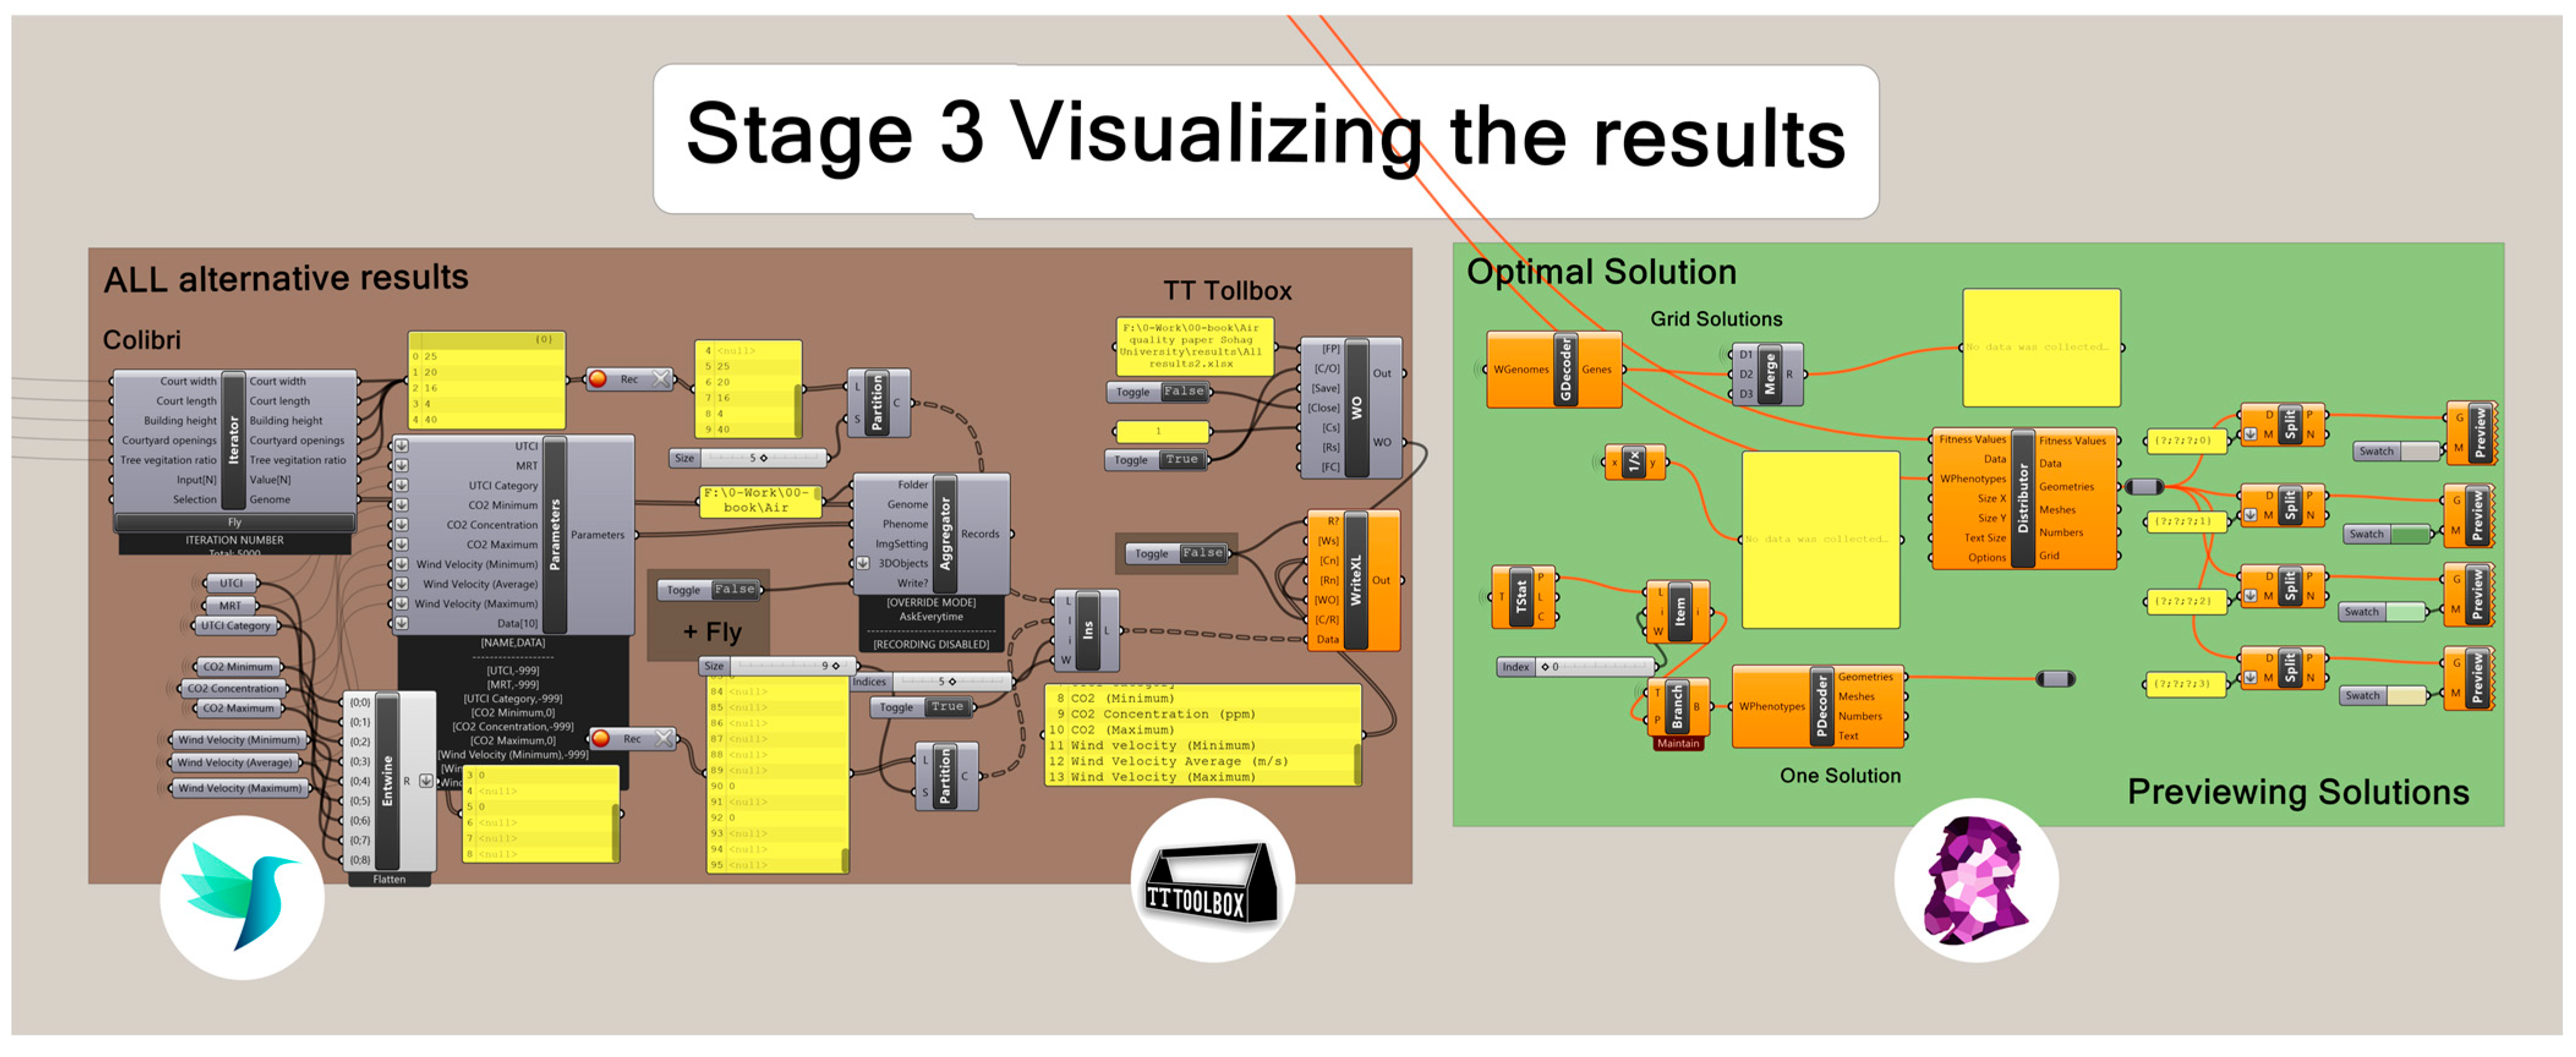
To improve the thermal comfort and air quality inside the courtyard of university buildings, three measurable objectives were optimized: decreasing the average UTCI, decreasing the average CO2 concentration level, and increasing the average wind velocity. In the third stage, the results of the optimization process were collected and visualized. Meanwhile, the Wallacei plug-in was used to obtain the optimal solutions based on the fitness value of the three objectives, as shown in Figure 8. The Colibri plug-in collected all the results of the 5000 design solutions and exported them to an Excel file using the TT Toolbox plug-in to analyze the coefficient of correlation determination (R2). Accordingly, the results of the parametric methodology will be explained in the next section.

3. Results and Discussion

3.1. Monitoring and Evaluation of Wind Speed and CO2 Concentration Levels of the Real Case Study

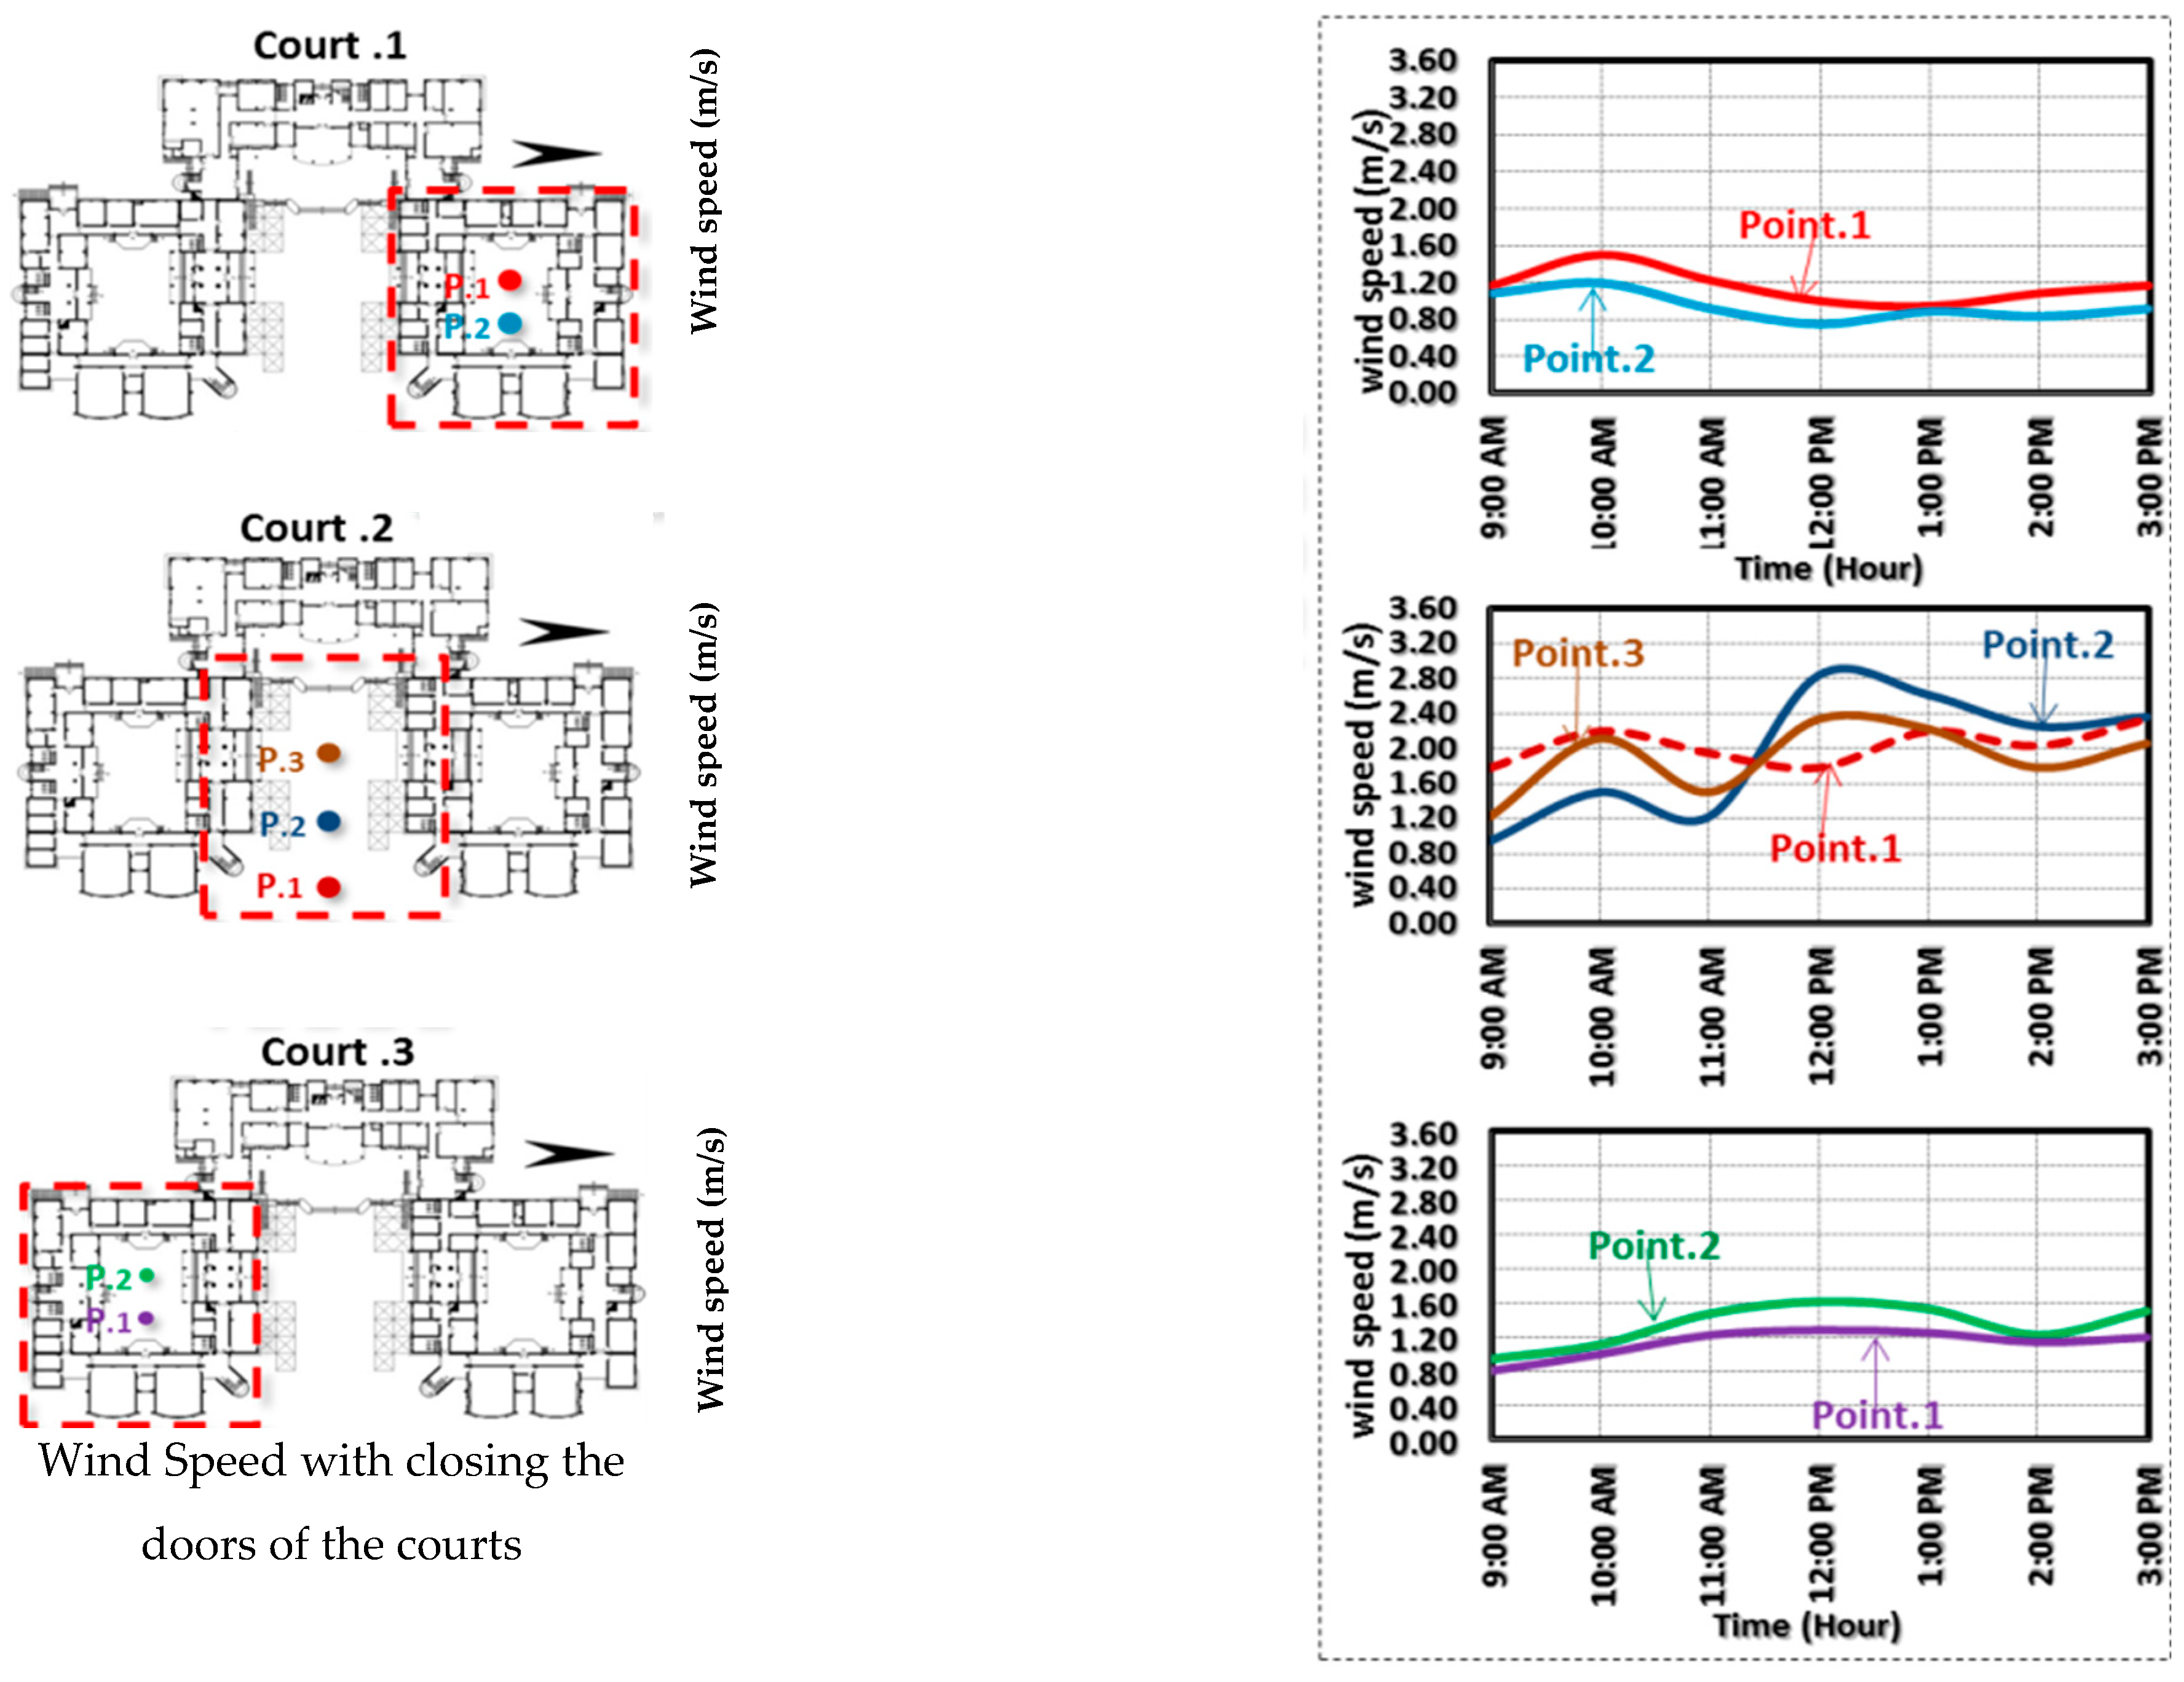
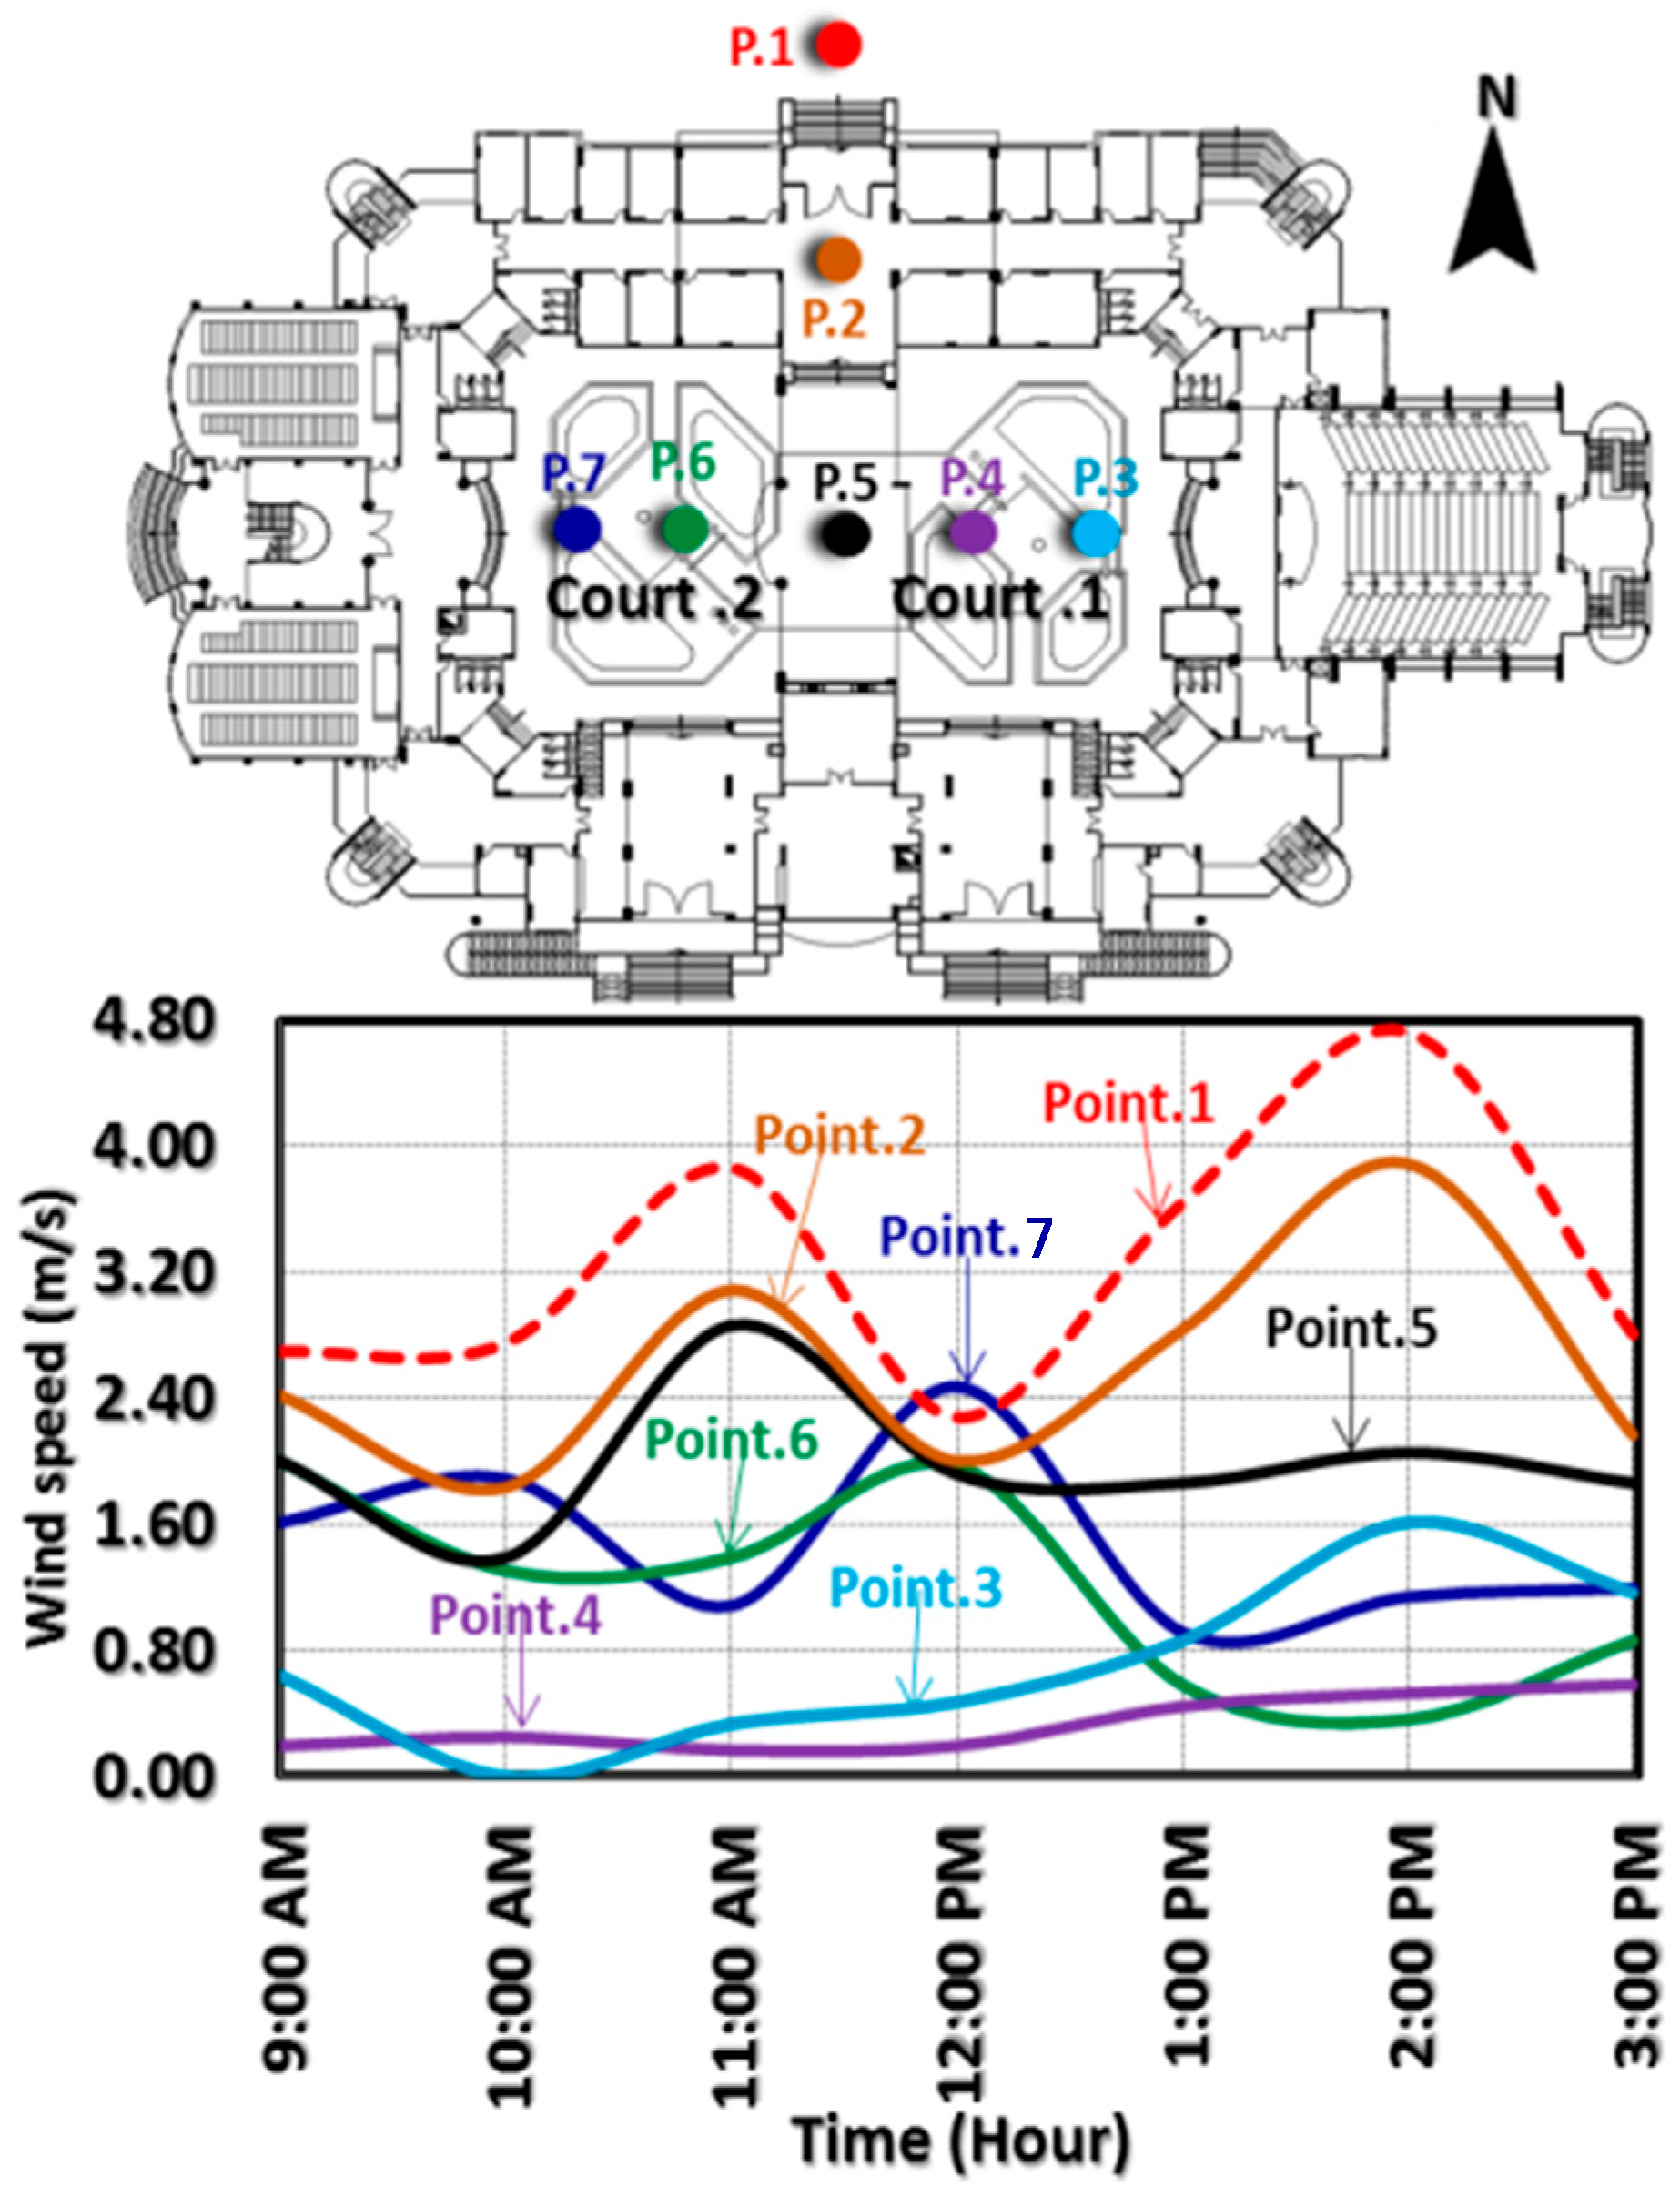
The following data is represented for a full understanding of the actual indoor situation and air quality in classrooms overlooking the courtyards. Figure 9 shows the Faculty of Agriculture, with wind speed monitored in the middle courtyard. In this courtyard wind speed is higher than in the other two. This is explained by the effect of the outer street environment, which drives air from high-pressure zones to low-pressure ones. Wind speed increased by an average of 1.1, 2.6, and 1.5 m/s for 0.7 (H/W) aspect ratio in courtyards 1, 2, and 3, respectively. Meanwhile, in the Faculty of Education, courtyards had an aspect ratio (H/W) of 1.2. During the hot period, the highest mean wind speed was 3.8 m/s at point (2), whereas the lowest wind speed recorded was 0.2 m/s at point (3), as shown in Figure 10. The effect of building geometry and street environment on ventilation strategies/courtyard ventilation is discussed by [41,42].
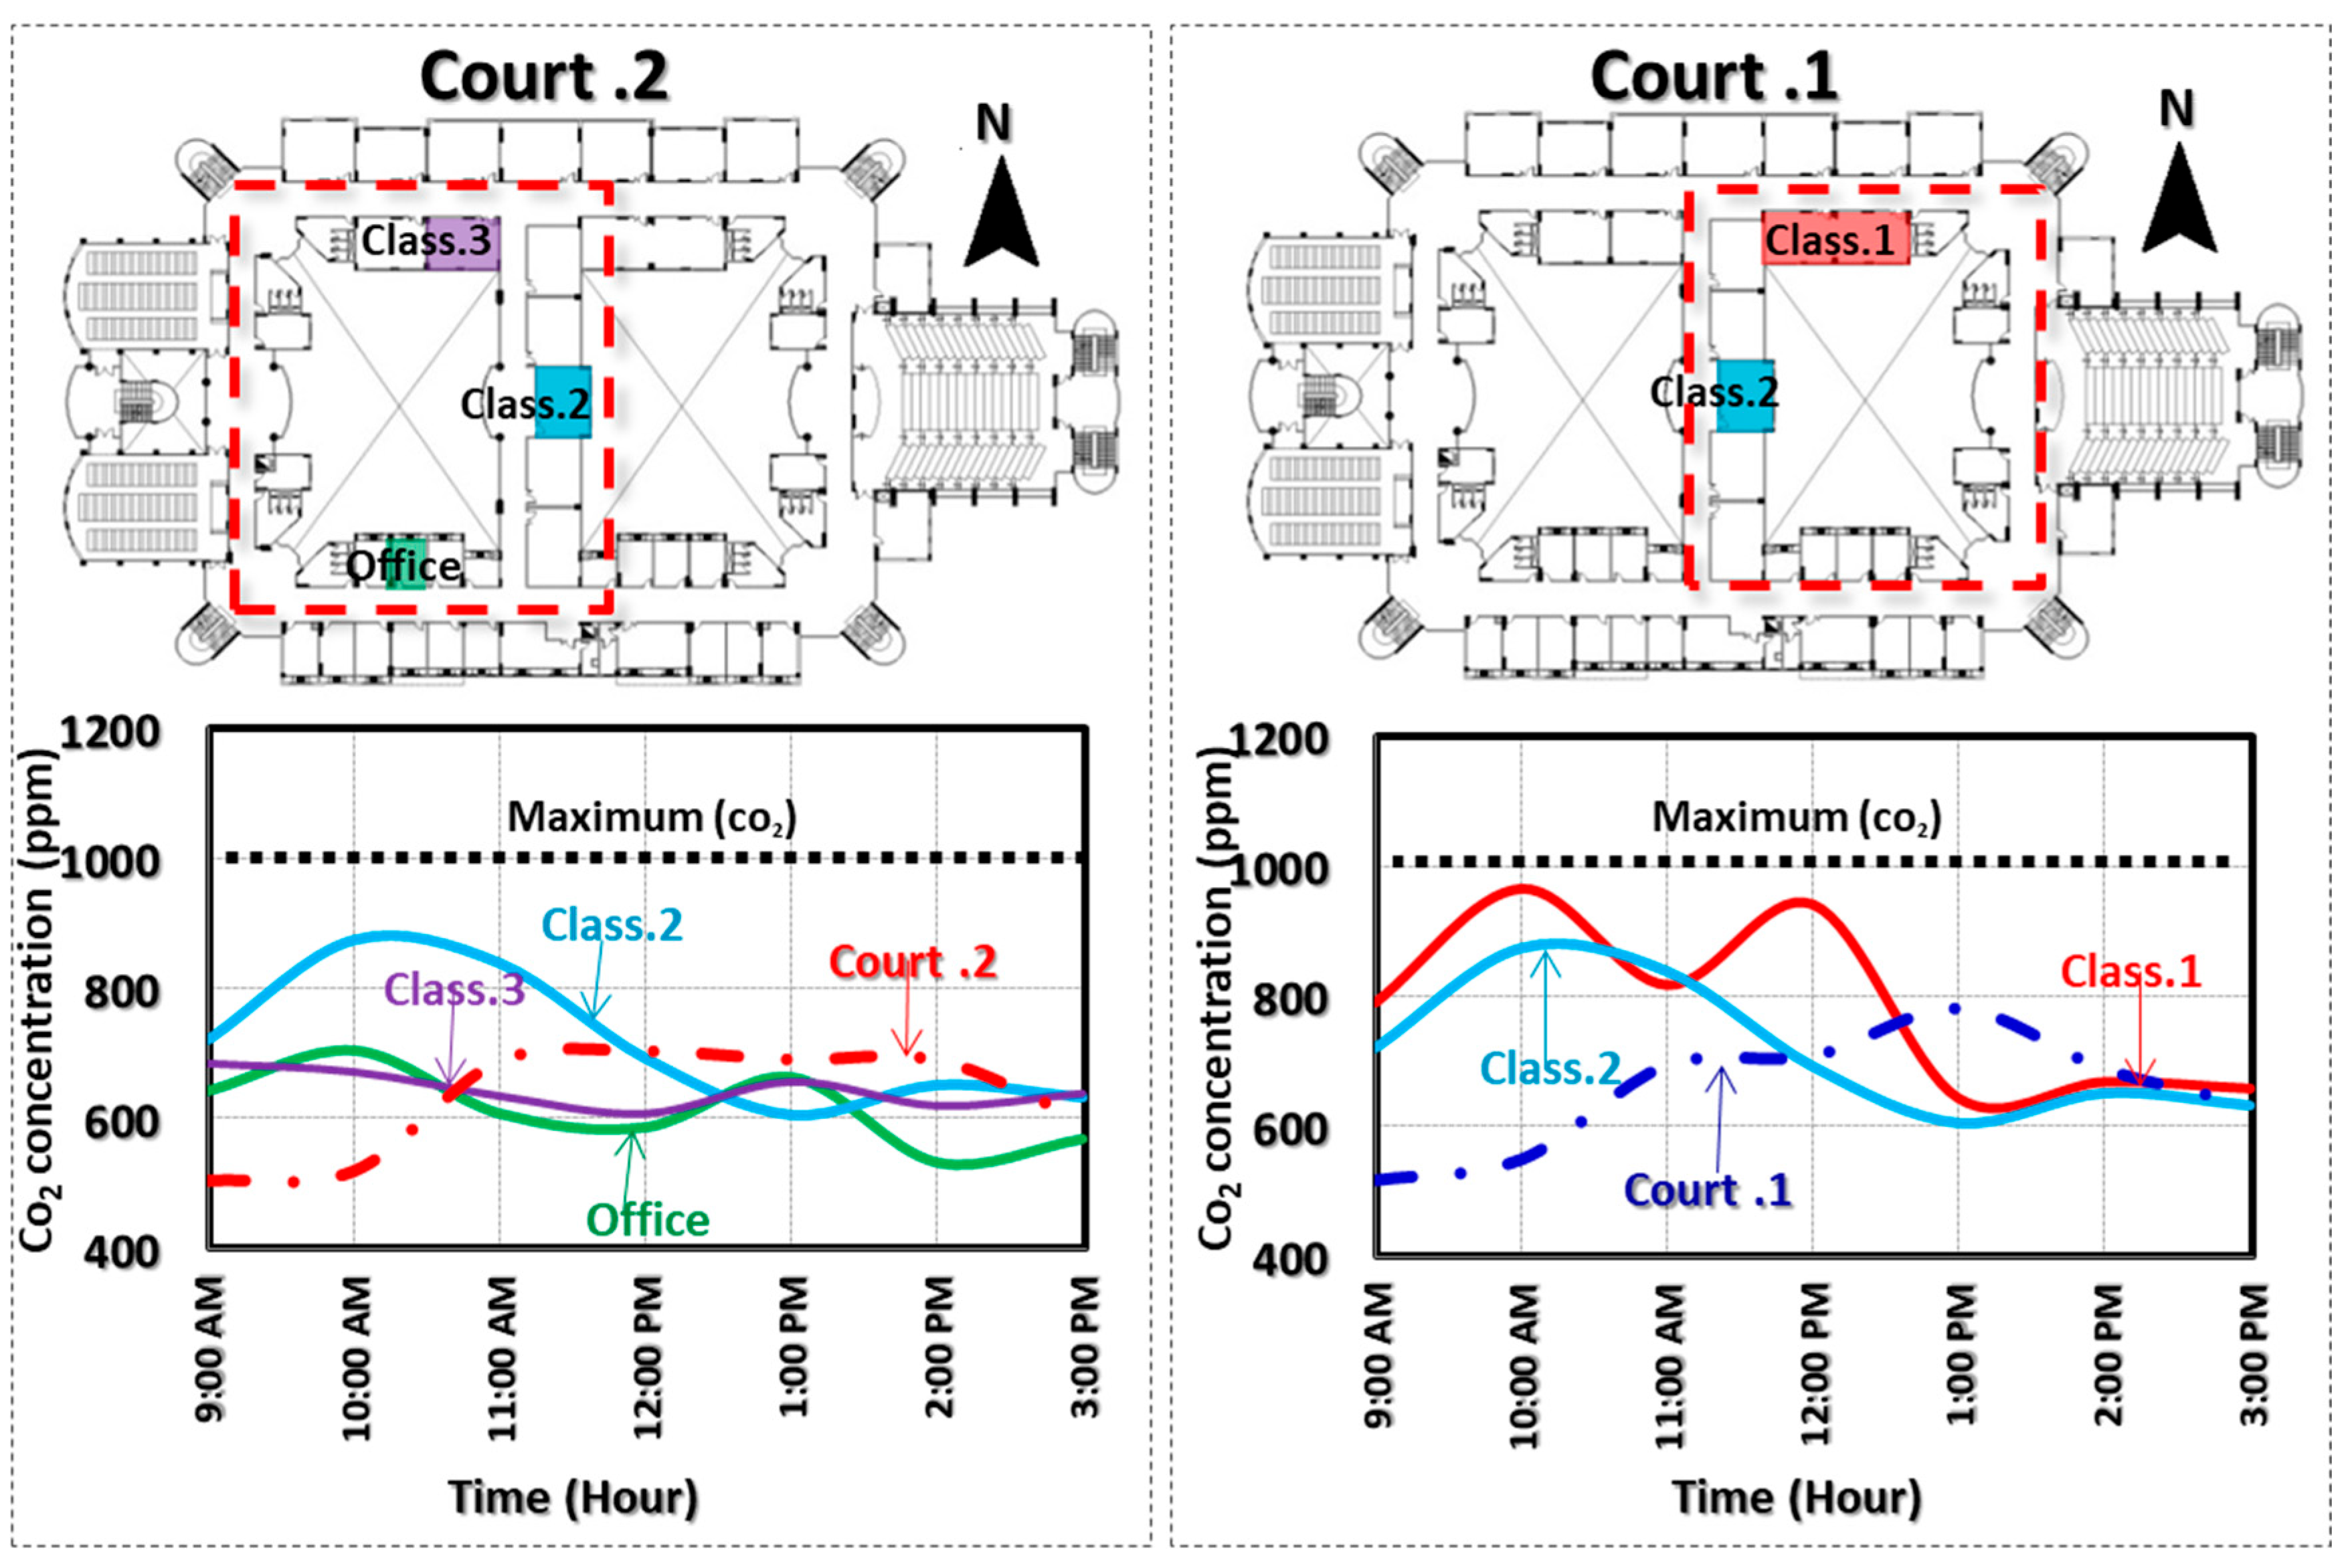
Opening the entrance doors of courtyards in the Faculty of Education for cross ventilation causes the wind speed to be 3.0 m/s. This raises CO2 concentration levels to 780 ppm in the afternoon in different courtyards with an aspect ratio of 1.2. This can be attributed to the high student density in the courtyards, with different activities including resting. In the remainder of the day, CO2 concentration fell to 500 ppm as a result of high wind speed in the two courtyards. The result of opening doors was increased wind speed inside courtyards, CO2 concentration reduction, and better air quality for students in outer environments to practice different activities. This agrees with previous studies by [43,44]. Figure 11 illustrates different CO2 concentrations in spaces overlooking courtyards within both faculties. In a class overlooking “courtyard 2” (H/W = 0.7), CO2 concentration rose to 960 ppm. The reason behind this was the closing windows and students’ occupancy. Further, lab activities led to the same result in the laboratory. Further, indoor CO2 concentration increased as doors between courtyards were closed. This caused an increase in outdoor concentration, leading to a corresponding indoor concentration. In the Faculty of Education, in courtyards with a 1.2 aspect ratio, outdoor CO2 concentration exerted a strong effect on indoor CO2 concentration in spaces overlooking the courtyards. The maximum value (1200 ppm) fell within the acceptable range of the ASHRAE standard [39]. The result is reduced fresh air supply to such spaces, thus impacting students’ productivity in the classroom, in agreement with previous studies by [44].
Cross ventilation and opening doors between courtyards decrease CO2 concentration inside courtyards, resulting in better air quality therein, leading to a corresponding improvement in spaces overlooking courtyards. The indoor environment of classrooms has to be carefully considered. Comfortable classrooms with good air quality boost learning, and vice versa. Further, urban morphological and building geometrical parameters need to be optimized, particularly inside courtyards, to improve air quality and foster students’ experience in the outer spaces of such university buildings.

3.2. Analysis of the Simulation Results

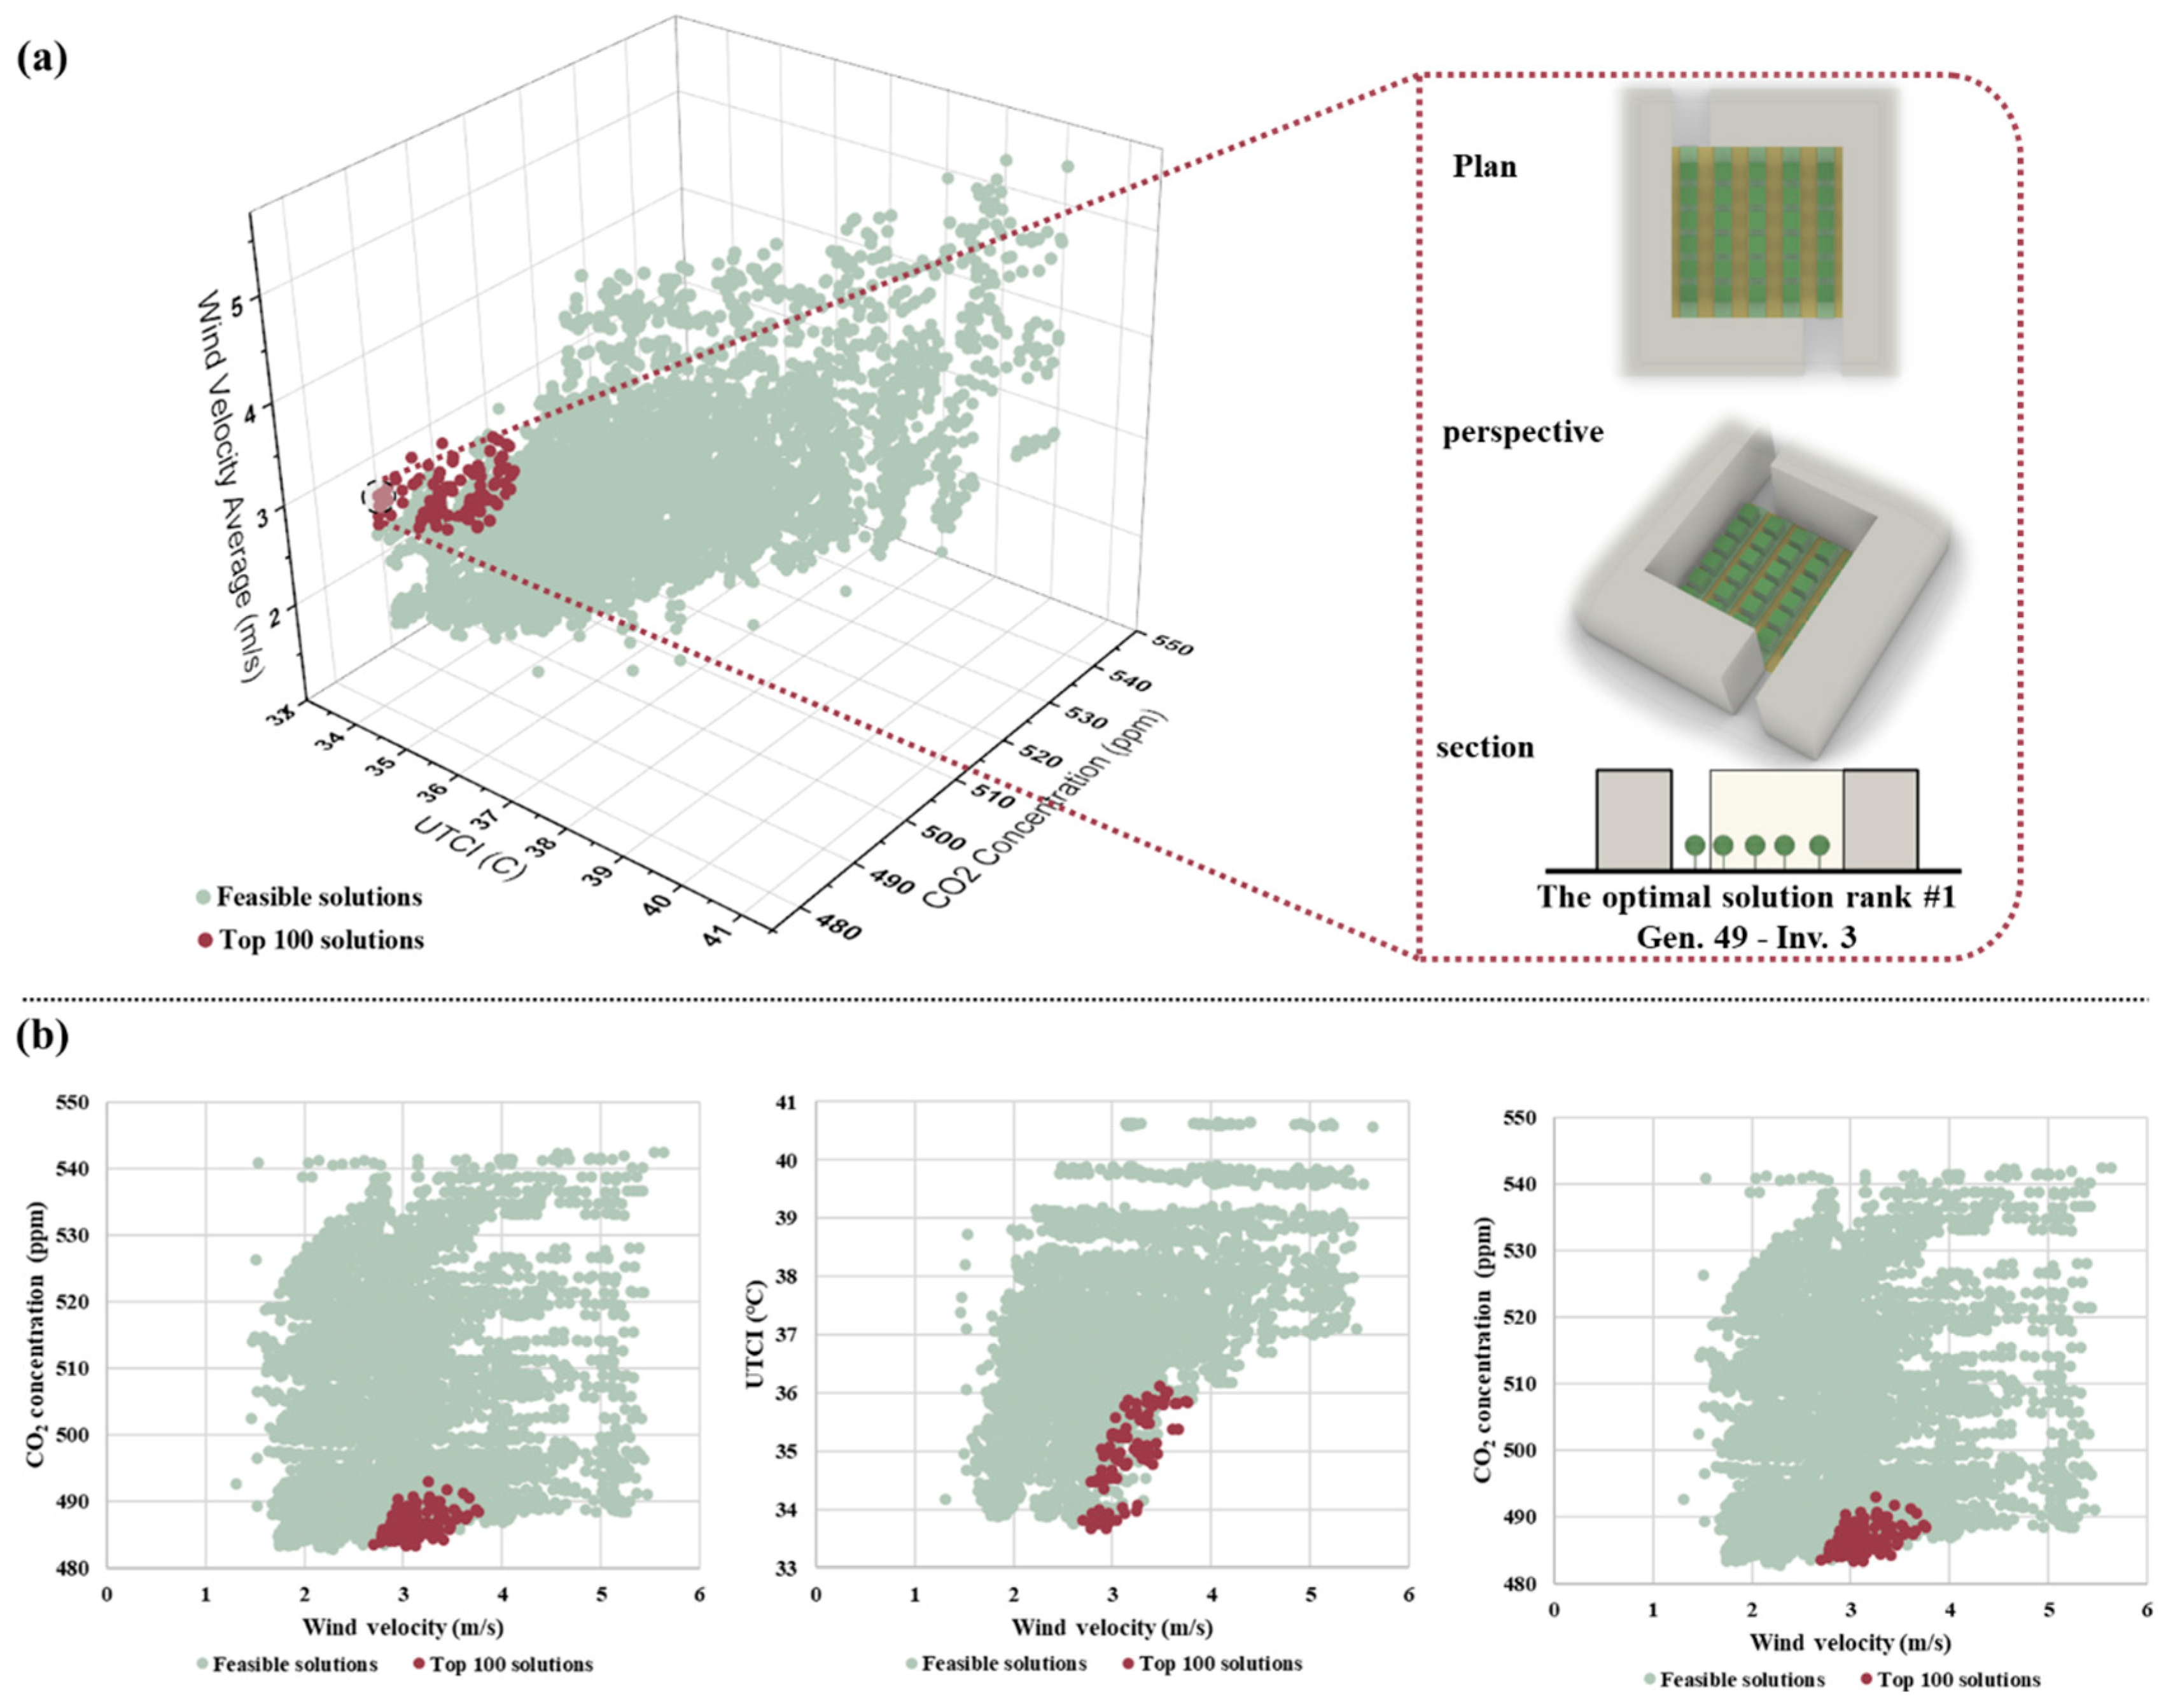
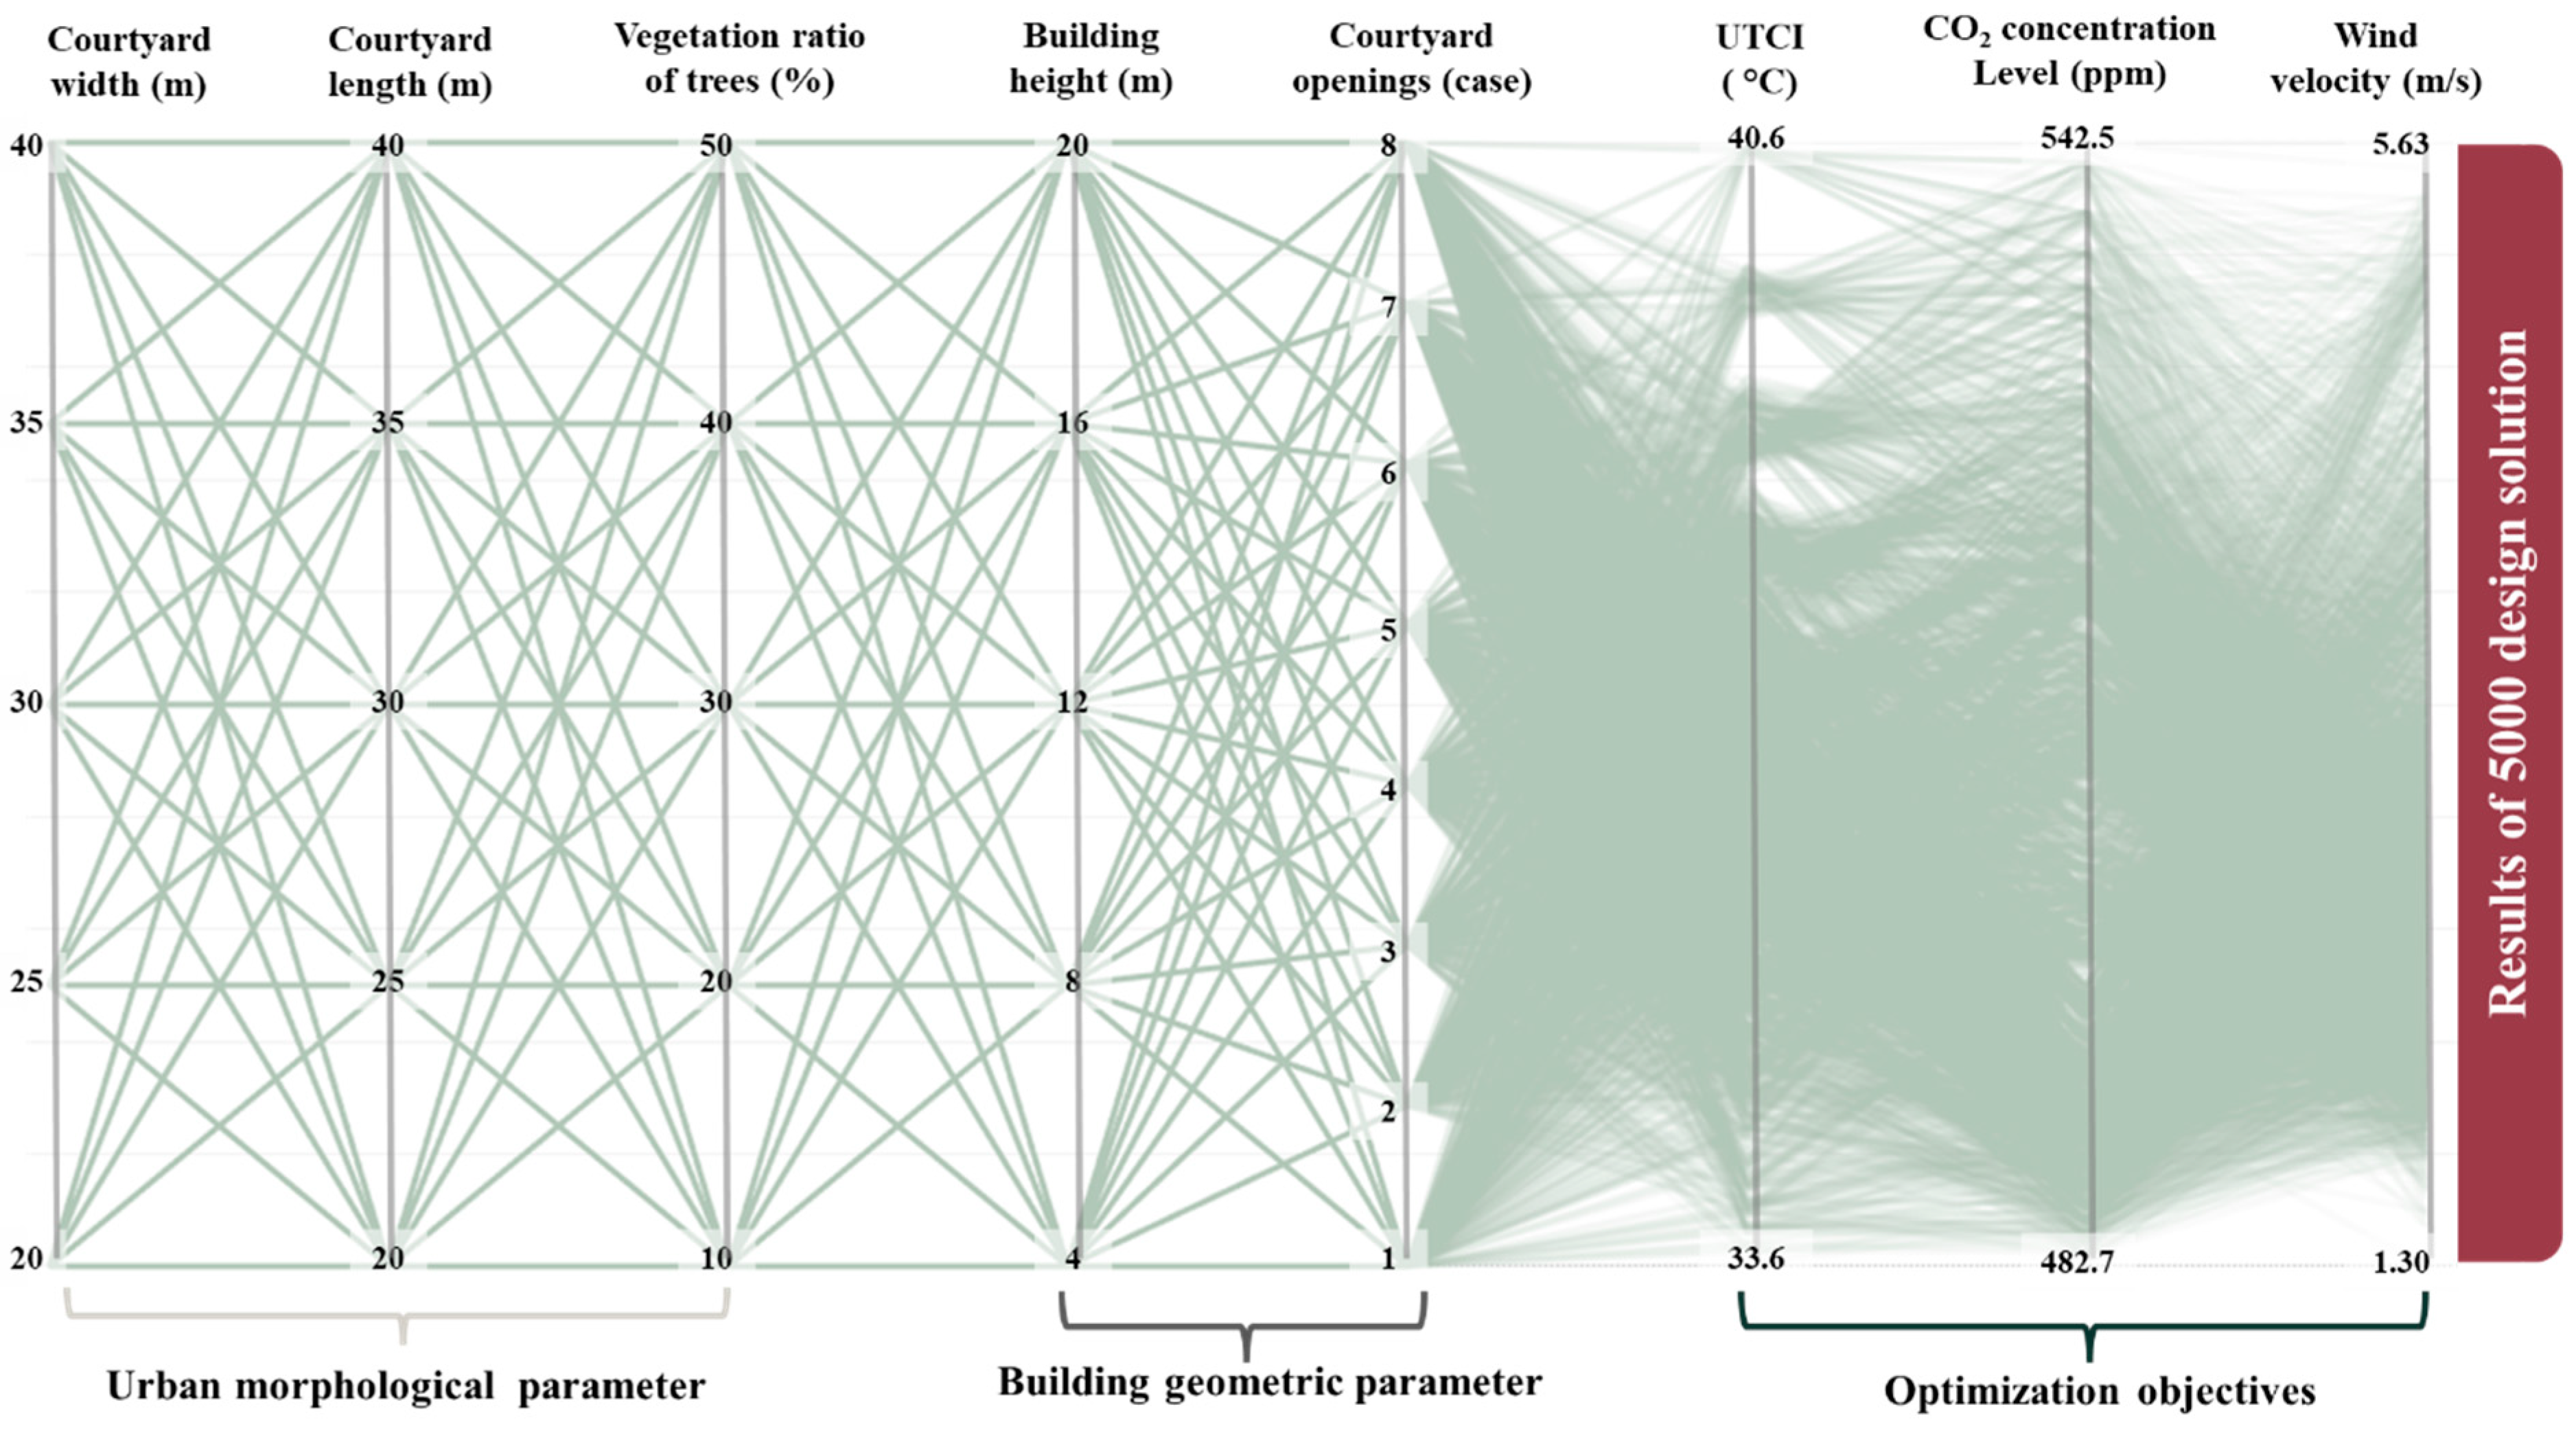
One of the main results of the optimization process by the Wallacei plug-in is the Pareto front of the solutions, as shown in Figure 12. Moreover, the 3D Pareto front could visualize the results of the proposed parametric methodology (the 5000 design solutions) based on the three objectives (Figure 12a). Consequently, the optimal solution can be determined by achieving a balance between the rank of the the objectives at the same time. Also, the top 100 design solutions were presented in the 3D Pareto front and the 2D Pareto front. Therefore, the results of all feasible solutions ranged from 33.6 °C to 40.6 °C for the UTCI, from 482.7 ppm to 542.5 ppm for the CO2 concentration level, and from 1.30 to 5.63 m/s for the wind velocity. The 2D Pareto front indicated that the findings of the top 100 design solutions ranged from 33.6 °C to 36.1 °C for the UTCI, from 483.2 ppm to 492.9 ppm for the CO2 concentration level, and from 2.70 to 3.76 m/s for the wind velocity. Hence, the results of the parametric methodology are very satisfactory, as it would reduce the UTCI and CO2 concentration level, besides increasing the wind velocity, as will be detailed in the following section. The parallel coordinates graph of the feasible solutions is shown in Figure 13. The parallel coordinates present all the combinations of feasible design solutions to achieve the desired objectives and improve the air quality in the university buildings’ courtyards. The decrease in UTCI and CO2 concentration level in the last optimized Generation (Gen 49) is noted in contrast to the increase in wind velocity, which is needed for reaching a balance between the three objectives.
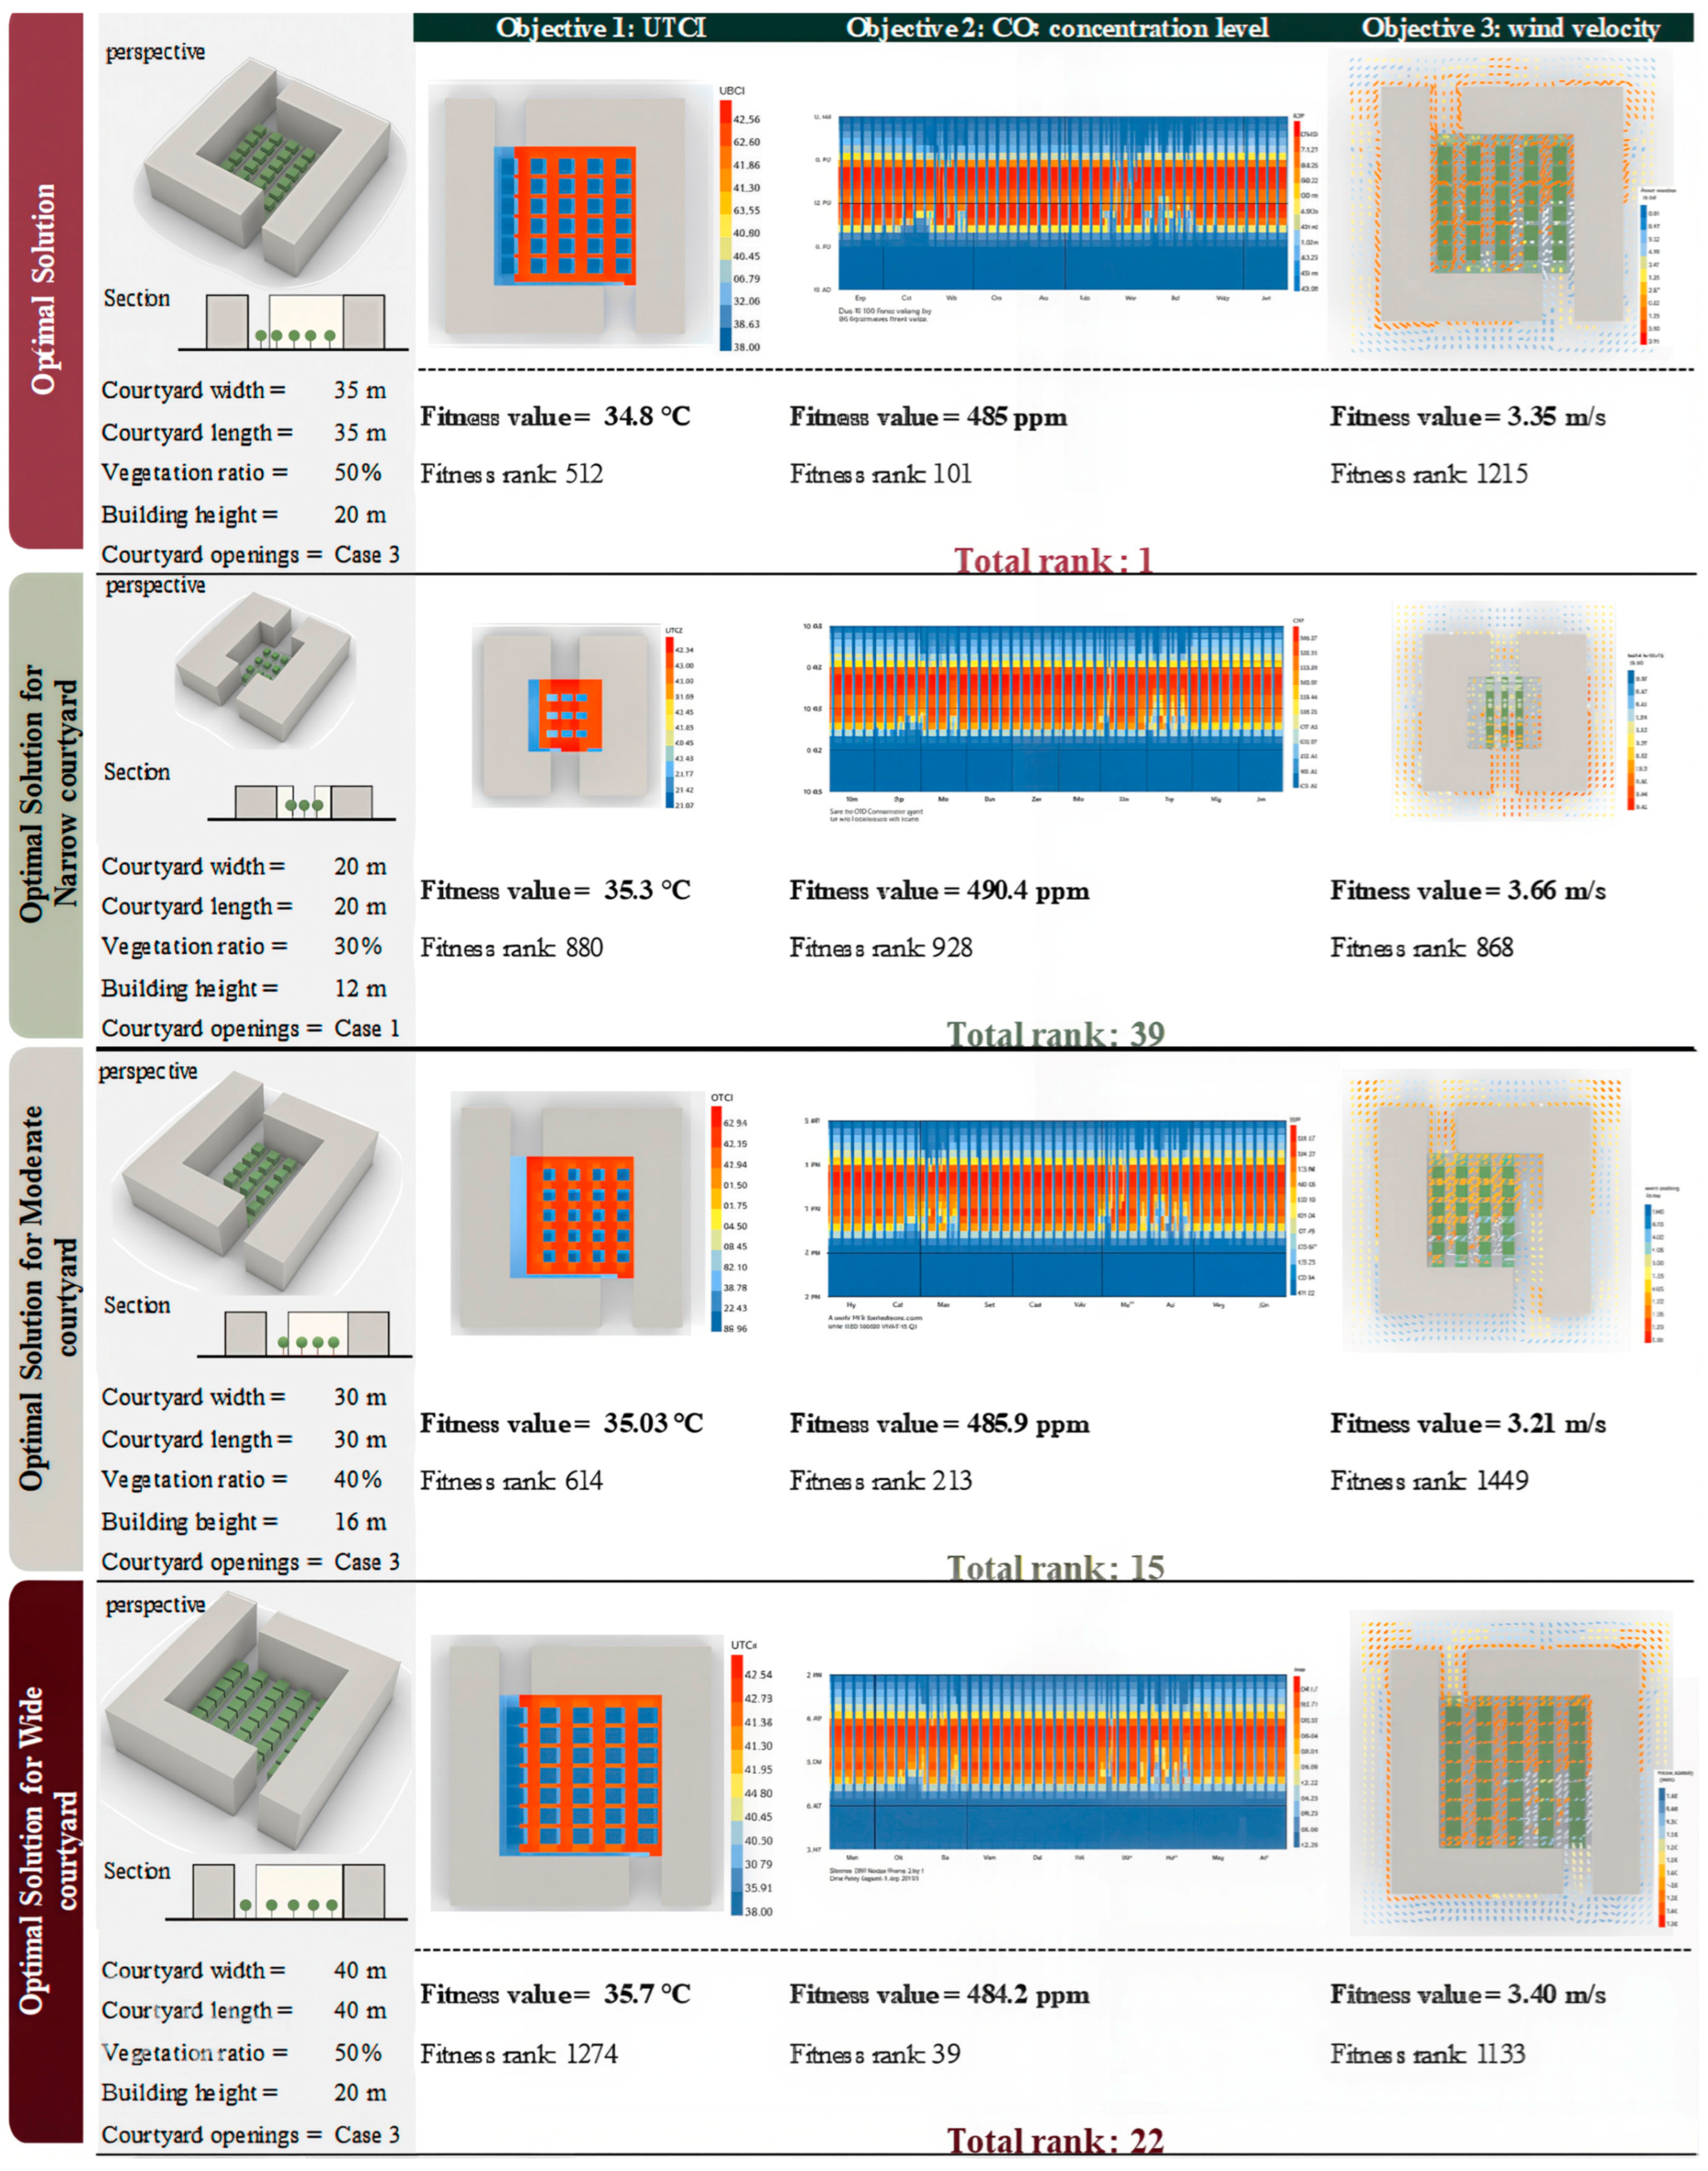
The optimal solution for a university building’s courtyard, as the outcome of the optimization parametric methodology, is illustrated in Figure 14. The ranking of the design solutions was calculated based on achieving the best fitness values of the three objectives together. Hence, the optimal solution has achieved a fitness value of 34.8 °C for the objective of reducing the UTCI, 485 ppm for the objective of reducing the CO2 concentration level, and 3.35 m/s for the objective of increasing the wind velocity. Despite the fitness ranks of each objective for the optimal solution being 512 for UTCI, 101 for CO2 concentration level, and 1215 for wind velocity, the total rank of the optimal solution is the first. Also, the urban morphological parameters of the optimal solution are 35 m for courtyard width and length, and a 50% vegetation ratio, in addition to the building geometric parameters: 20 m for building height and case 3 of courtyard openings with two facing openings in the north–south direction. Consequently, the optimal solution could reduce UTCI and CO2 concentration levels by 9.24 °C and 195 ppm, respectively, and increase the wind velocity by 1.5 m/s.
Moreover, Figure 14 elaborates the optimal solution for each courtyard size as follows: (a) a narrow courtyard with 20 m width and 20 m length, (b) a medium courtyard with 30 m width and 30 m length, and (c) a wide courtyard with 40 m width and 40 m length. For the narrow courtyard (20 × 20 m), the optimal solution with a rank of 39 achieved fitness values of 35.3 °C, 490.4 ppm, and 3.66 m/s for UTCI, CO2 concentration levels, and wind velocity, respectively. At the same time, its parameters were a 30% vegetation ratio, 12 m for building height, and case 1 of courtyard openings. For the medium courtyard (30 × 30 m), the optimal solution with a rank of 15 achieved fitness values of 35.03 °C, 485.9 ppm, and 3.21 m/s for UTCI, CO2 concentration levels, and wind velocity, respectively. The parameters were a 40% vegetation ratio, 16 m for building height, and case 3 of courtyard openings. For the wide courtyard (40 × 40 m), the optimal solution with a rank of 22 achieved fitness values of 35.7 °C, 484.2 ppm, and 3.4 m/s for UTCI, CO2 concentration levels, and wind velocity, respectively. The parameters were a 40% vegetation ratio, 16 m for building height, and case 3 of courtyard openings. It can be concluded that low vegetation ratio and building height are appropriate for narrow courtyards, and when increasing the courtyard size to medium or wide, high vegetation ratio and high-rise buildings can effectively improve the air quality. Finally, the typical and last solutions for each objective will be discussed separately in the following section.

3.2.1. Optimization Objective 1: Improving Outdoor Thermal Comfort

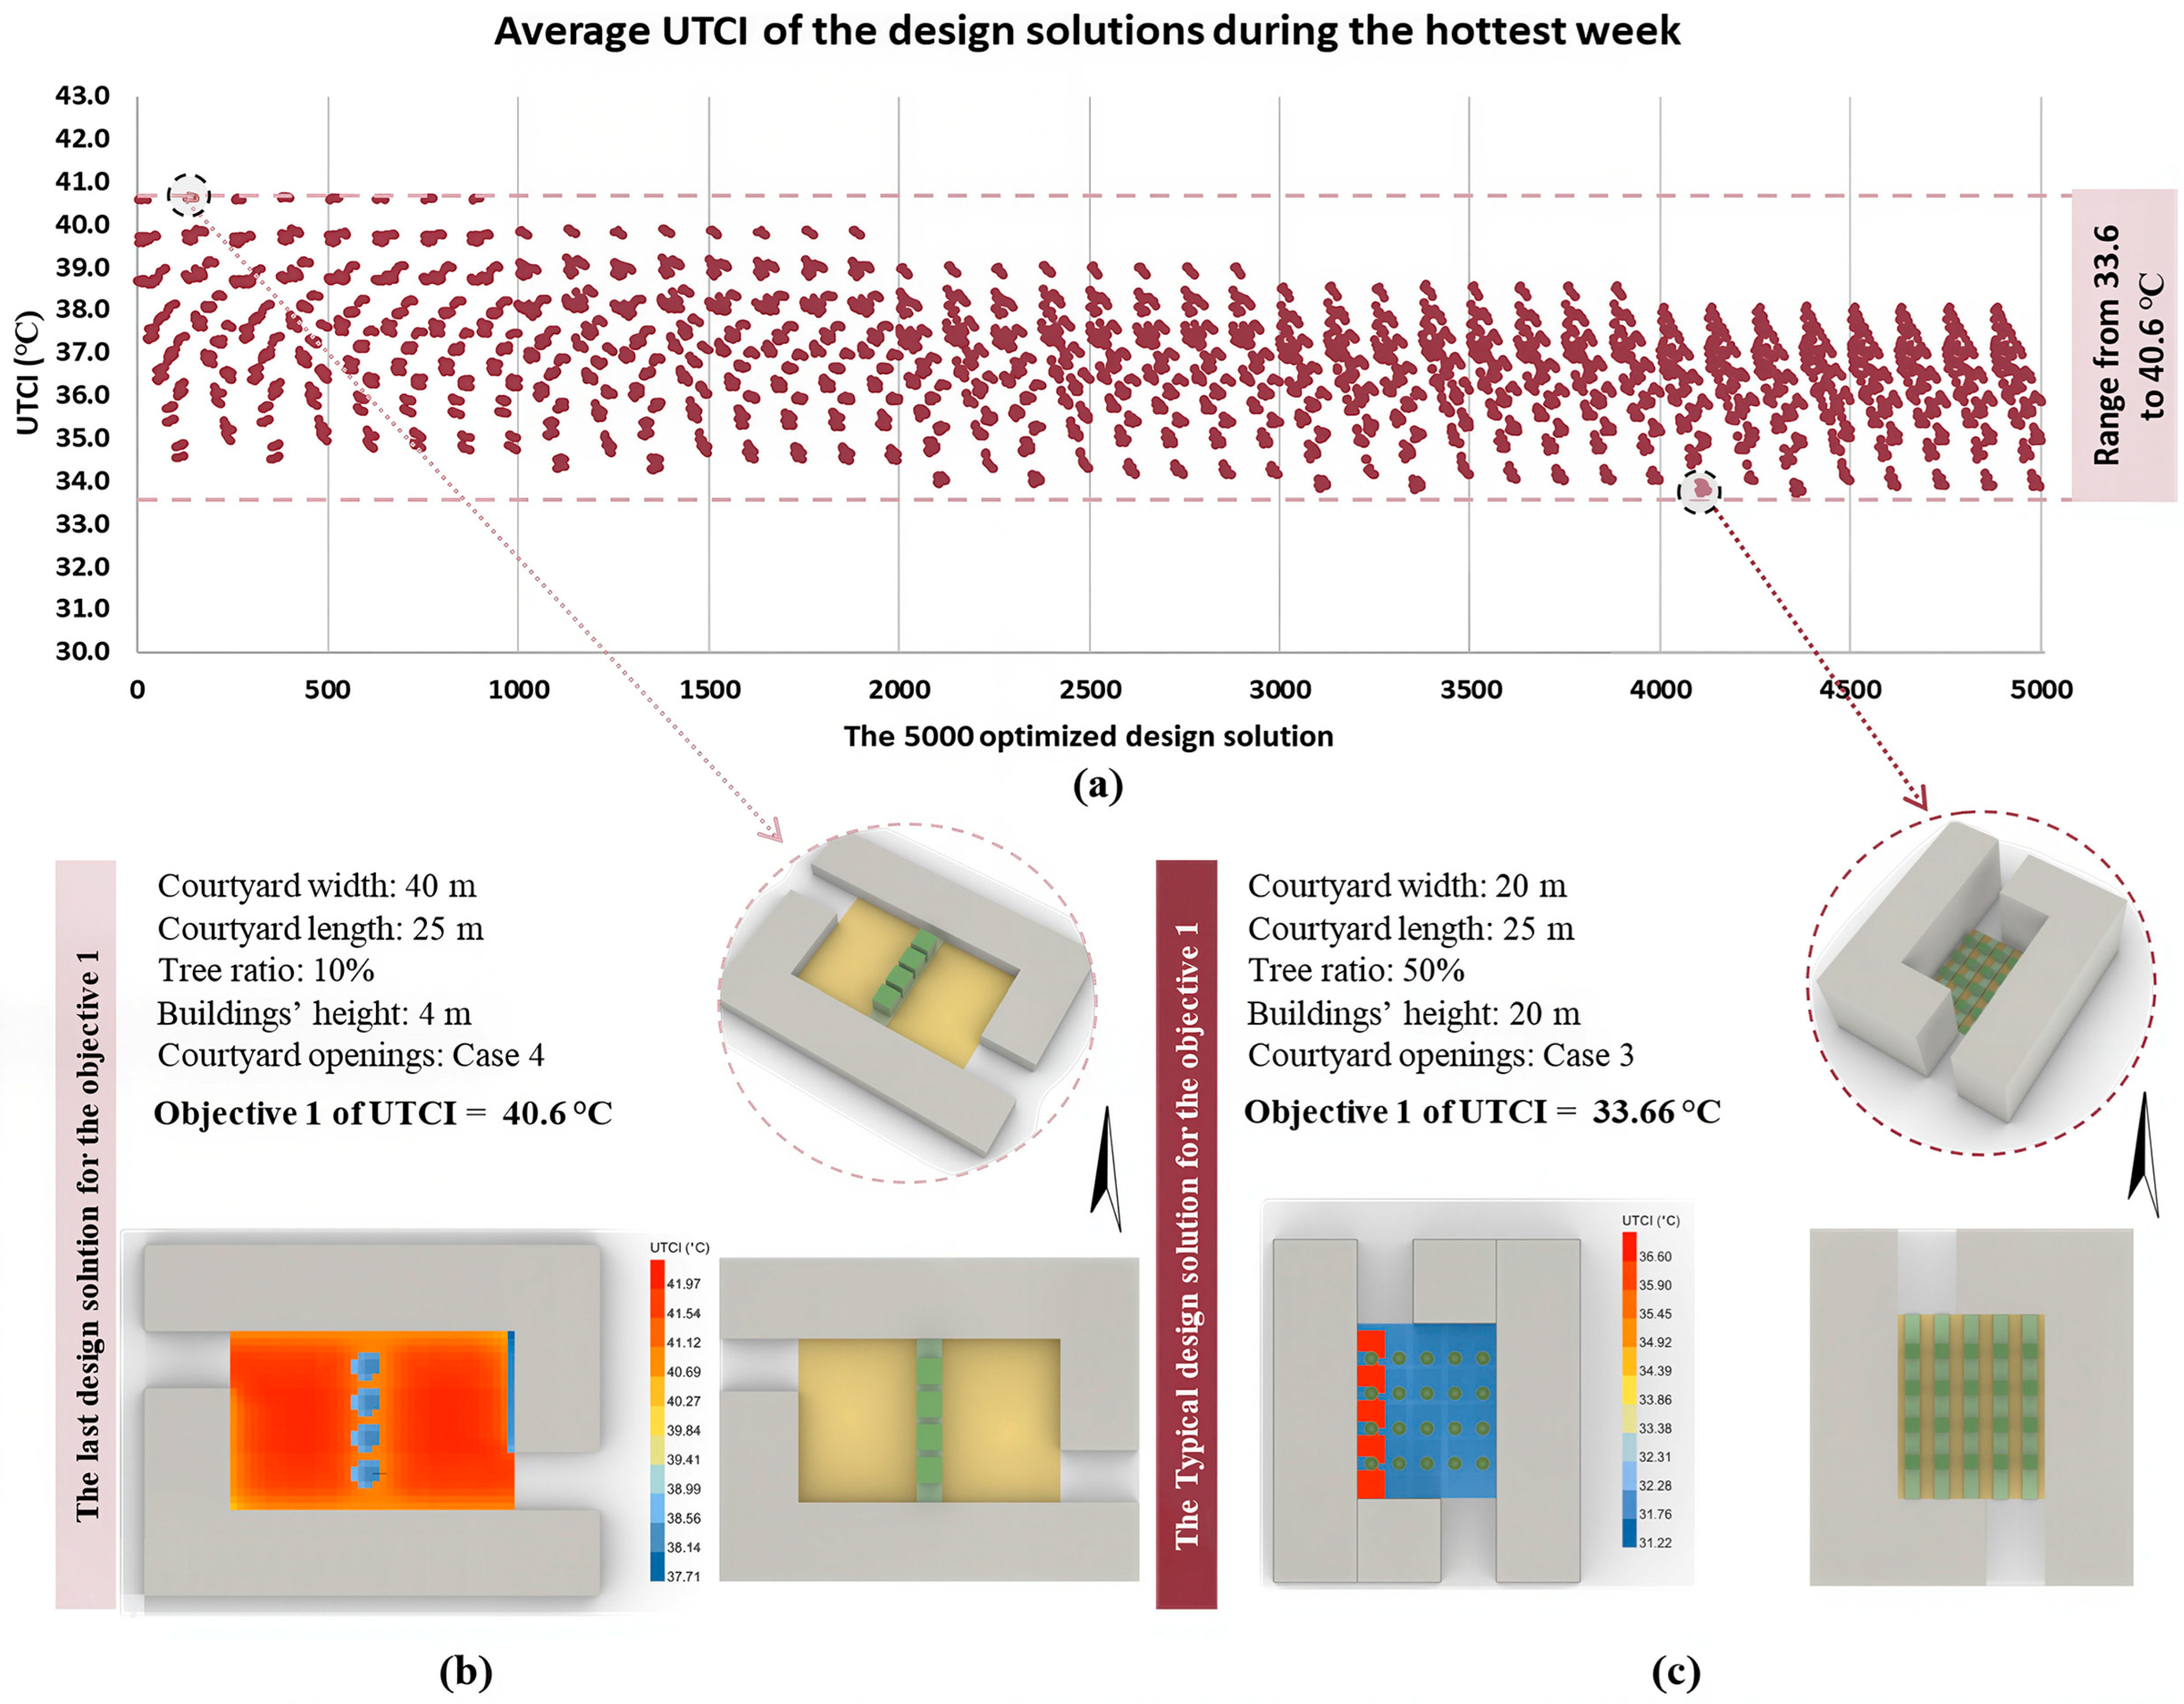
Improving outdoor thermal comfort is an essential aspect of improving the air quality in outdoor urban spaces, as it links environmental variables with potential implications. Thus, reducing the thermal stress is the first objective in the proposed parametric methodology, because of its direct influence on the students’ social activities. Accordingly, the UTCI, as an index of outdoor thermal comfort, was simulated for each design solution, and its average was calculated during the hottest week (from 10 July to 16 July). As shown in Figure 15, the average UTCI of the proposed design solutions ranged from 33.66 °C to 40.65 °C. The decrease in UTCI is highly commendable when compared to the base case prior to implementing the design solutions (42.7 °C and 44.04 °C). The reduction in UTCI ranged from 2.04 °C to 10.3 °C, as a result of increasing the vegetation ratio of trees and raising buildings’ heights. In addition, the stress classification in almost all design solutions was reduced to strong heat stress (from 32 °C to 38 °C) instead of the classification of very strong heat stress (from 38 °C to 46 °C) in the base case [45]. Figure 15c shows the typical design solution in UTCI, whose morphological parameters are 20 m, 20 m, and 50% for courtyard width, courtyard length, and tree ratio, respectively. In addition, the geometric parameters are 20 m and case 3 (courtyard with two facing openings facing north) for building height and courtyard openings, respectively. Hence, the average UTCI of the optimal solution during the hottest week was 33.66 °C, which predicts its efficiency during the rest of the year. These results are compatible with the results of [3], which indicated that the outdoor thermal comfort has been enhanced by 11.2 °C after applying a vegetation scenario in the school courtyard. Although the results are consistent with the results of [17,34], they are inconsistent with the results of 1.02 °C UTCI reduction [19].
The top 100 design solutions, based on UTCI values, were selected to investigate the impact of the common parameters (Figure 16). The range of UTCI was between 33.6 °C and 34.04 °C. It can be observed that the narrow courtyards, with widths such as 20 m and 25 m, are the most efficient, because they provide the smallest sunny area. Conversely, the variety of courtyard lengths is not considered an efficient parameter. It is obvious that a high ratio of vegetation and trees led to a significant reduction in UTCI, particularly the ratio of 50% of trees, due to the wide shade area provided by the high tree ratio. Similarly, a building height of 20 m assisted in shading almost the entire courtyard area, thus reducing the UTCI. On the other hand, in courtyards with two facing openings, case 1 and case 3, where the openings face the north, the wind velocity inside the courtyard was improved and thus the UTCI was improved. These results are compatible with the results of [20], which indicated that trees with diameters between 10 and 15 m could reduce UTCI by 11.26 °C. In conclusion, among the urban morphological building geometric parameters, courtyard width, vegetation ratio of trees, and building height are the most efficient for improving UTCI.

3.2.2. Optimization Objective 2: CO2 Concentration Level

The purity of air and lowering the CO2 concentration are critical aspects in improving the air quality in outdoor spaces. Hence, reducing the CO2 concentration level is the second objective in the parametric methodology to provide low-pollutant air for students during their use of the courtyard, which will assist in improving the air quality in indoor spaces, too. Based on this, the CO2 concentration level was simulated for each design solution and its average was calculated during the hottest week (from 10 July to 16 July). Figure 17 illustrates the CO2 concentration level for the 5000 design solutions. It can be observed that the range of CO2 concentration levels is between 482.7 ppm and 542.5 ppm. The observed decrease in CO2 concentration levels is notably adequate when compared to the base case before applying the design solutions (600 ppm and 680 ppm). Because of adding vegetation areas and various tree ratios, the reduction of the CO2 concentration level was between 57.4 ppm and 197.2 ppm. Figure 17c shows the typical design solution with the lowest CO2 concentration level, whose morphological parameters are 40 m, 40 m, and 50% for courtyard width, courtyard length, and tree ratio, respectively. Besides, the geometric parameters are 20 m and case 2 (courtyard with two facing openings facing east) for building height and courtyard openings, respectively. Thus, the reduction in CO2 concentration levels reached 9.5–29%, closely aligning with the 28.43% decrease reported by [30] and the 15% decrease reported by [18], and the 14% decrease reported by [28]. However, these findings are inconsistent with those of [16], which reported a modest 3.07% reduction in CO2 concentration. Hence, the average CO2 concentration level of the optimal solution during the hottest week was 482.7 ppm, which predicts its efficiency during the rest of the year. This shows the influence of built form on air quality.
Figure 18 shows the top 100 design solutions based on CO2 concentration levels that were selected to investigate the impact of the common parameters. The range of CO2 concentration levels was between 482.7 ppm and 484.9 ppm. It can be observed that the width and length of the courtyard are not extremely efficient on CO2 concentration, despite the wide courtyard dimensions (40 m width and length) achieved in reducing the CO2 concentration level. On the other hand, the parameter of vegetation and tree ratio was the most efficient in reducing the CO2 concentration level due to its CO2-absorbing phenomenon. Nevertheless, the building heights of 16 m and 20 m assisted in providing a shaded area in the courtyard and reducing the wind speed, which led to a lowering of CO2 concentration levels. However, the various courtyard opening cases were sufficiently effective in reducing CO2 concentration levels. In conclusion, the urban morphological parameters include the vegetation ratio of trees. In addition, the building geometric parameters include the building height parameter, which is the most efficient for improving the CO2 concentration level.

3.2.3. Optimization Objective 3: Wind Velocity

Improving wind speed to the appropriate limits for sitting for a short time (from 2.5 m/s to 4 m/s), or for walking and strolling (from 4 to 6 m/s), is more critical for enhancing the air quality [46]. Thus, increasing the wind velocity is the third objective of the parametric methodology to boost the students’ experience inside the courtyards of the university buildings. Accordingly, the wind velocity was simulated for each design solution and its average was calculated during the hottest week (from 10 July to 16 July). In Figure 19, the average wind velocity of the proposed design solutions ranged from 1.3 m/s to 5.6 m/s. That increase in wind velocity is highly adequate when compared to the wind velocity values in the base cases, which were 0.9 m/s and 1.5 m/s inside the courtyard, although the wind speed out of the courtyard (layout campus) was 6.2 m/s in the hottest week. The increase in wind velocity ranged between 0.4 m/s and 4.7 m/s as a result of applying courtyard openings facing the prevailing wind direction (north and northwest). In addition, lowering the building height led to an increase in the airflow and the wind velocity inside the courtyard. Therefore, the typical design solution is shown in Figure 19b; its morphological parameters are 40 m, 20 m, and 10% for courtyard width, courtyard length, and tree ratio, respectively. In addition, the geometric parameters are 4 m and case 1 (courtyard with two facing openings facing north) for the building height and courtyard openings, respectively. Consequently, the proposed design solutions could enhance wind velocity throughout the year, and these results align well with those reported by [24].
Figure 20 shows the top 100 design solutions based on wind velocity that were selected to investigate the impact of the common parameters. The range of wind velocity was between 5.6 m/s and 5.1 m/s. Obviously, wide courtyard widths, such as 35 m and 40 m, are more efficient in increasing wind velocity than narrow widths. Increasing the courtyard width will lead to the area being oriented toward the prevailing wind, and consequently the airflow and wind velocity will increase. Conversely, courtyard length is not an efficient parameter because the increase in length is in the direction of the wind and not perpendicular to it. Also, the vegetation ratio of trees parameter is an uninfluential parameter, especially in solutions where the building height is low. The high ratios of vegetation and trees negatively affect wind velocity in solutions where the buildings are high and the courtyards are narrow, because they restrict the movement of air and airflow. On the other hand, the low building height allows wind to flow into the courtyard, thus improving the wind velocity. But at the same time, a building height of 4 m is not recommended in university buildings. Thus, the proposed parameter of courtyard openings toward the prevailing wind (north and northwest) is efficient and contributes to enhancing wind velocity. In conclusion, the urban morphological parameters include courtyard width; the building geometric parameters include courtyard openings, which are the most efficient for improving wind velocity.

3.3. Analyzing the Correlation Determination

In this section, the correlation determination between the three main objectives and between the optimization parameters and objectives will be analyzed. To begin with, the correlation analysis between the three objectives—reducing UTCI and CO2 concentration and increasing wind velocity—is demonstrated in Figure 21. It can be observed that a moderate positive relationship exists between UTCI values and CO2 concentration levels because the Coefficient of Determination (R2) was 0.49 [47]. Otherwise, there are weak positive relationships between wind speed values and UTCI values, with an R2 of 0.27, in addition to a negligible relationship between wind speed values and CO2 concentration levels with an R2 of 0.17. The results indicate that by improving UTCI values, the CO2 concentration levels may be improved, but wind speed values may not improve. Therefore, it was necessary to analyze the correlation between the optimization parameters and objectives to determine the correlation characteristics among them.
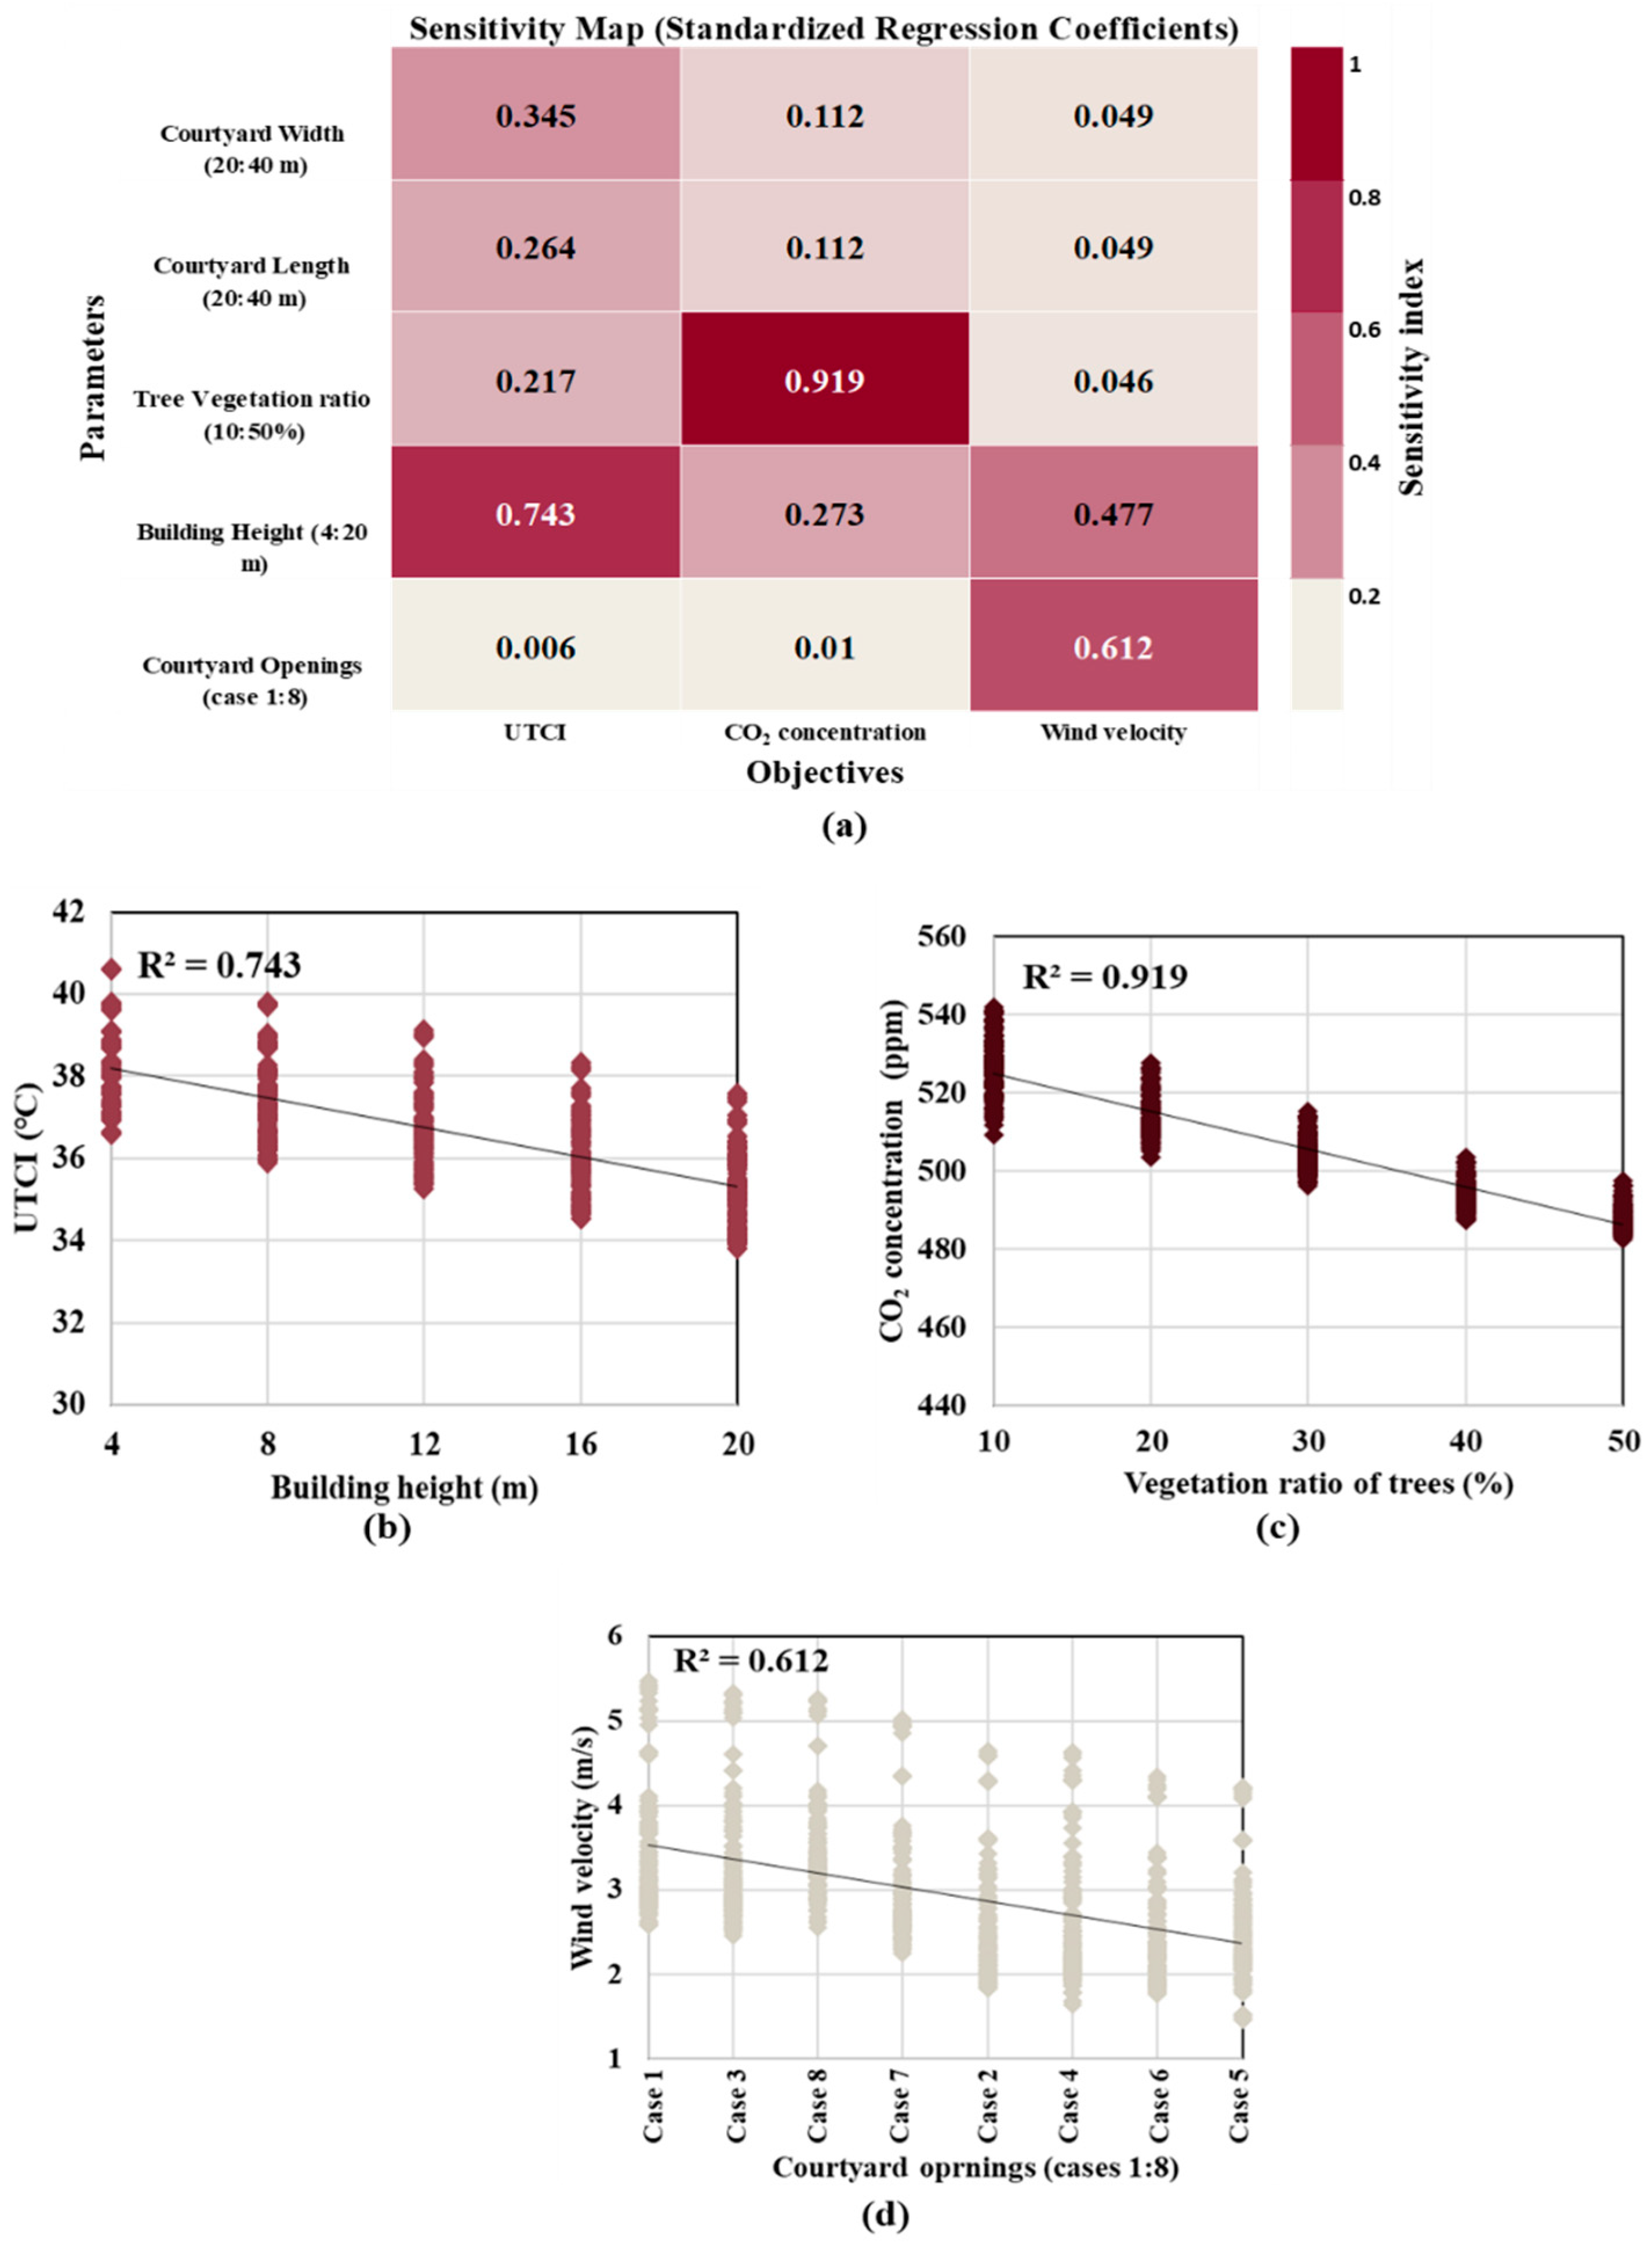
Furthermore, Figure 22a presents a Sensitivity Map based on Standardized Regression Coefficients that assesses how different urban and building parameters affect the three objectives. In general, the most influential and sensitive parameters for reducing UTCI and CO2 concentration and increasing wind velocity are building height, vegetation ratio of trees, and courtyard openings, respectively. For the objective of decreasing the UTCI, the building height parameter exhibits a very strong negative relationship, with an R2 value of 0.743 (Figure 22b). The higher the building, the wider the shaded area, which leads to a reduction in air temperature and UTCI accordingly. The same applies to the increase in vegetation and ratio of trees, particularly with a high ratio of trees, such as 50%. Also, the courtyard width parameter exhibits a moderate positive relationship with reduced UTCI values, with an R2 value of 0.345, because the narrow width of a courtyard provides the smallest sunny area. For reducing CO2 concentration levels, the vegetation ratio of trees parameter exhibits a very strong negative relationship, with an R2 value of 0.919 (Figure 22c). This was evident because trees are expected to absorb huge amounts of carbon dioxide, unlike the other parameters, which have weak and negligible relationships with reducing CO2 concentration levels. Likewise, the parameter of courtyard openings exhibits a strong negative relationship with increasing wind velocity inside the courtyard, with an R2 value of 0.612 (Figure 22d). Due to the courtyard openings toward the prevailing wind (north and northwest) in almost all of the proposed cases, the airflow and wind velocity could be successfully increased as a result of applying the cross-ventilation phenomenon. In addition, the high-rise-building parameter is negatively correlated with increasing wind velocity, as it blocks airflow within the courtyard and restricts air movement. It can be concluded that improving both urban morphological parameters and building geometrical parameters together was extremely influential in optimizing the university buildings’ courtyards.
Finally, the parameters with strong relationships with each objective will be accurately illustrated in this section. Figure 23a shows the minimum, maximum, and average UTCI values based on various building heights. It can be observed that, at a building height of 4 m, the UTCI values ranged between 36.46 °C and 40.65 °C, which could be considered relatively high. In contrast, a building height of 20 m caused a reduction in the UTCI to between 33.67 °C and 37.67 °C. Figure 23b shows the thermal map of the best solutions for UTCI for each value of building height at 13:00, which is the main break time for students. Despite the efficiency of increased building height in reducing UTCI, it conflicts with improving other objectives, such as wind velocity. Consequently, the findings indicated that a more suitable building height is between 12 m and 16 m, and 20 m in the design solution of a wide courtyard with openings oriented towards the prevailing wind.
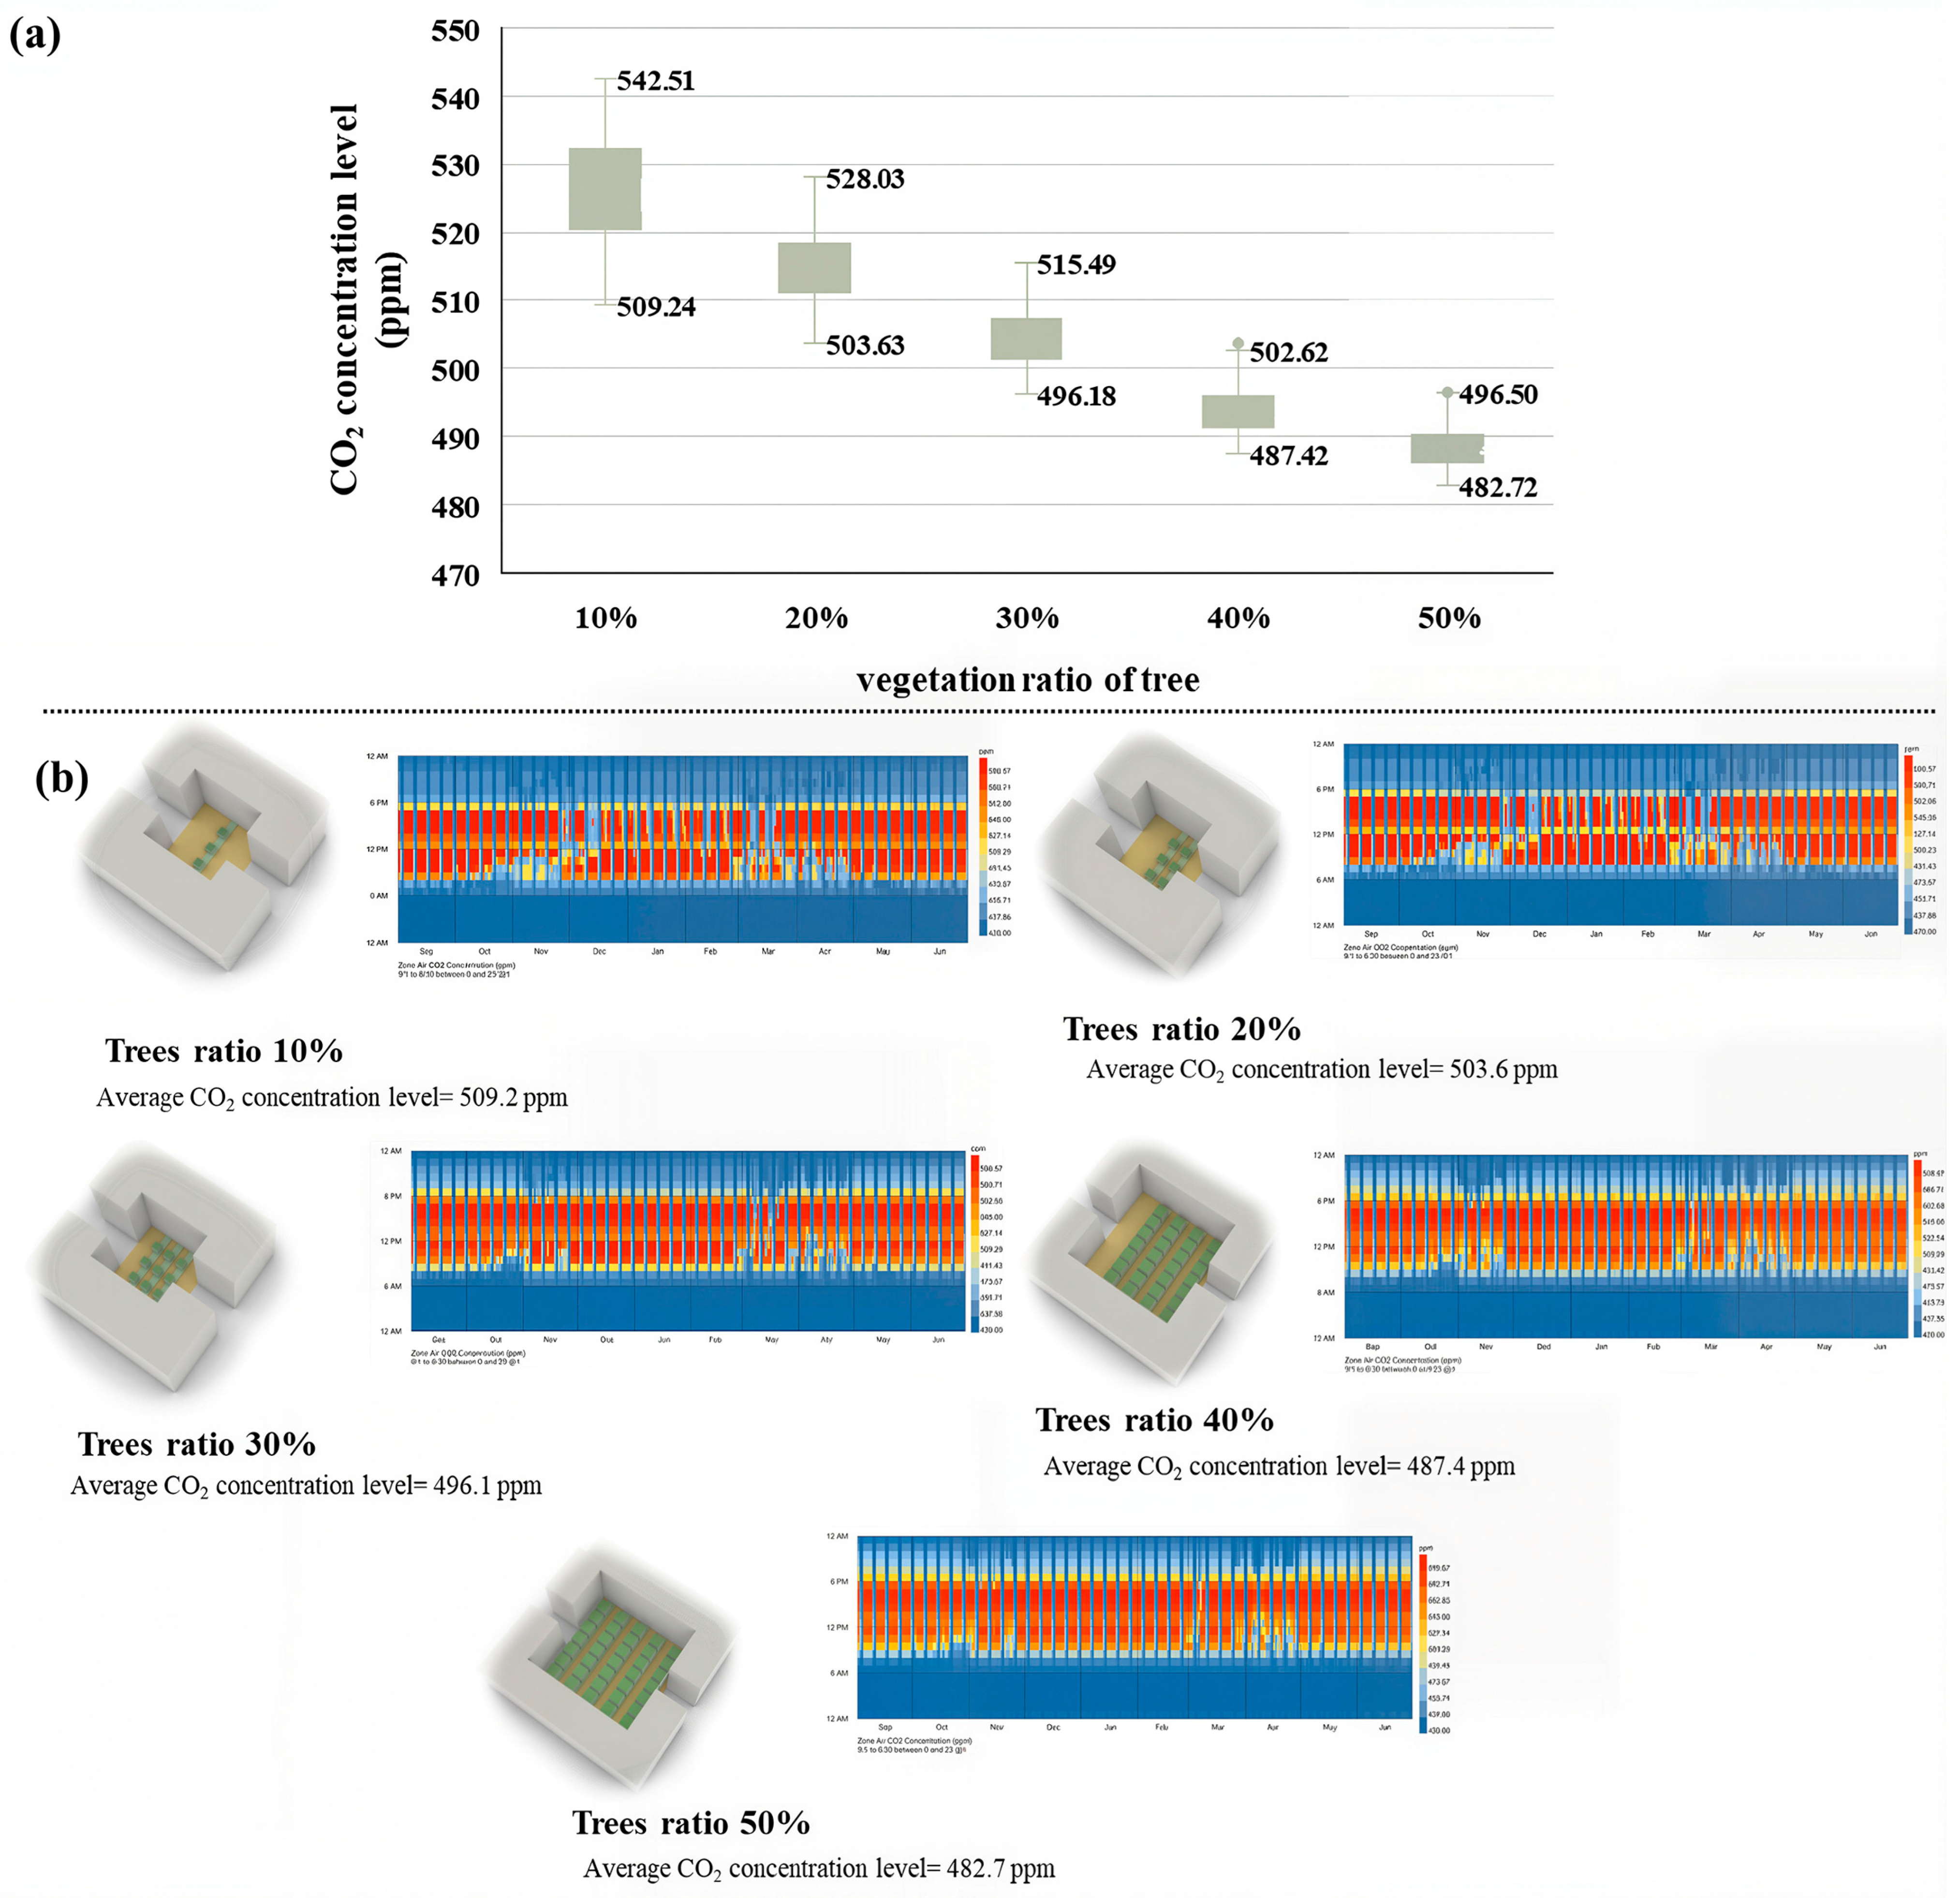
Figure 24a shows the minimum, maximum, and average CO2 concentration levels based on various vegetation ratios of trees. Thus, with a vegetation ratio of 10%, the CO2 concentration levels ranged between 509.24 ppm and 542.5 ppm. In contrast, a vegetation ratio of 10% caused a reduction in the CO2 concentration levels to between 482.7 ppm and 496.5 ppm. Hence, Figure 24b shows the CO2 concentration map of the best solutions of CO2 levels for each ratio of vegetation of trees during the study months from September to June. However, the critical role of vegetation ratios of trees in reducing CO2 concentration levels, besides reducing UTCI, in a few solutions, caused restriction of the movement of air and airflow inside the courtyard. Consequently, the findings indicated that the most suitable vegetation ratios of trees are 30%, 40%, and 50% in the design solutions of narrow, medium, and wide courtyards, respectively.
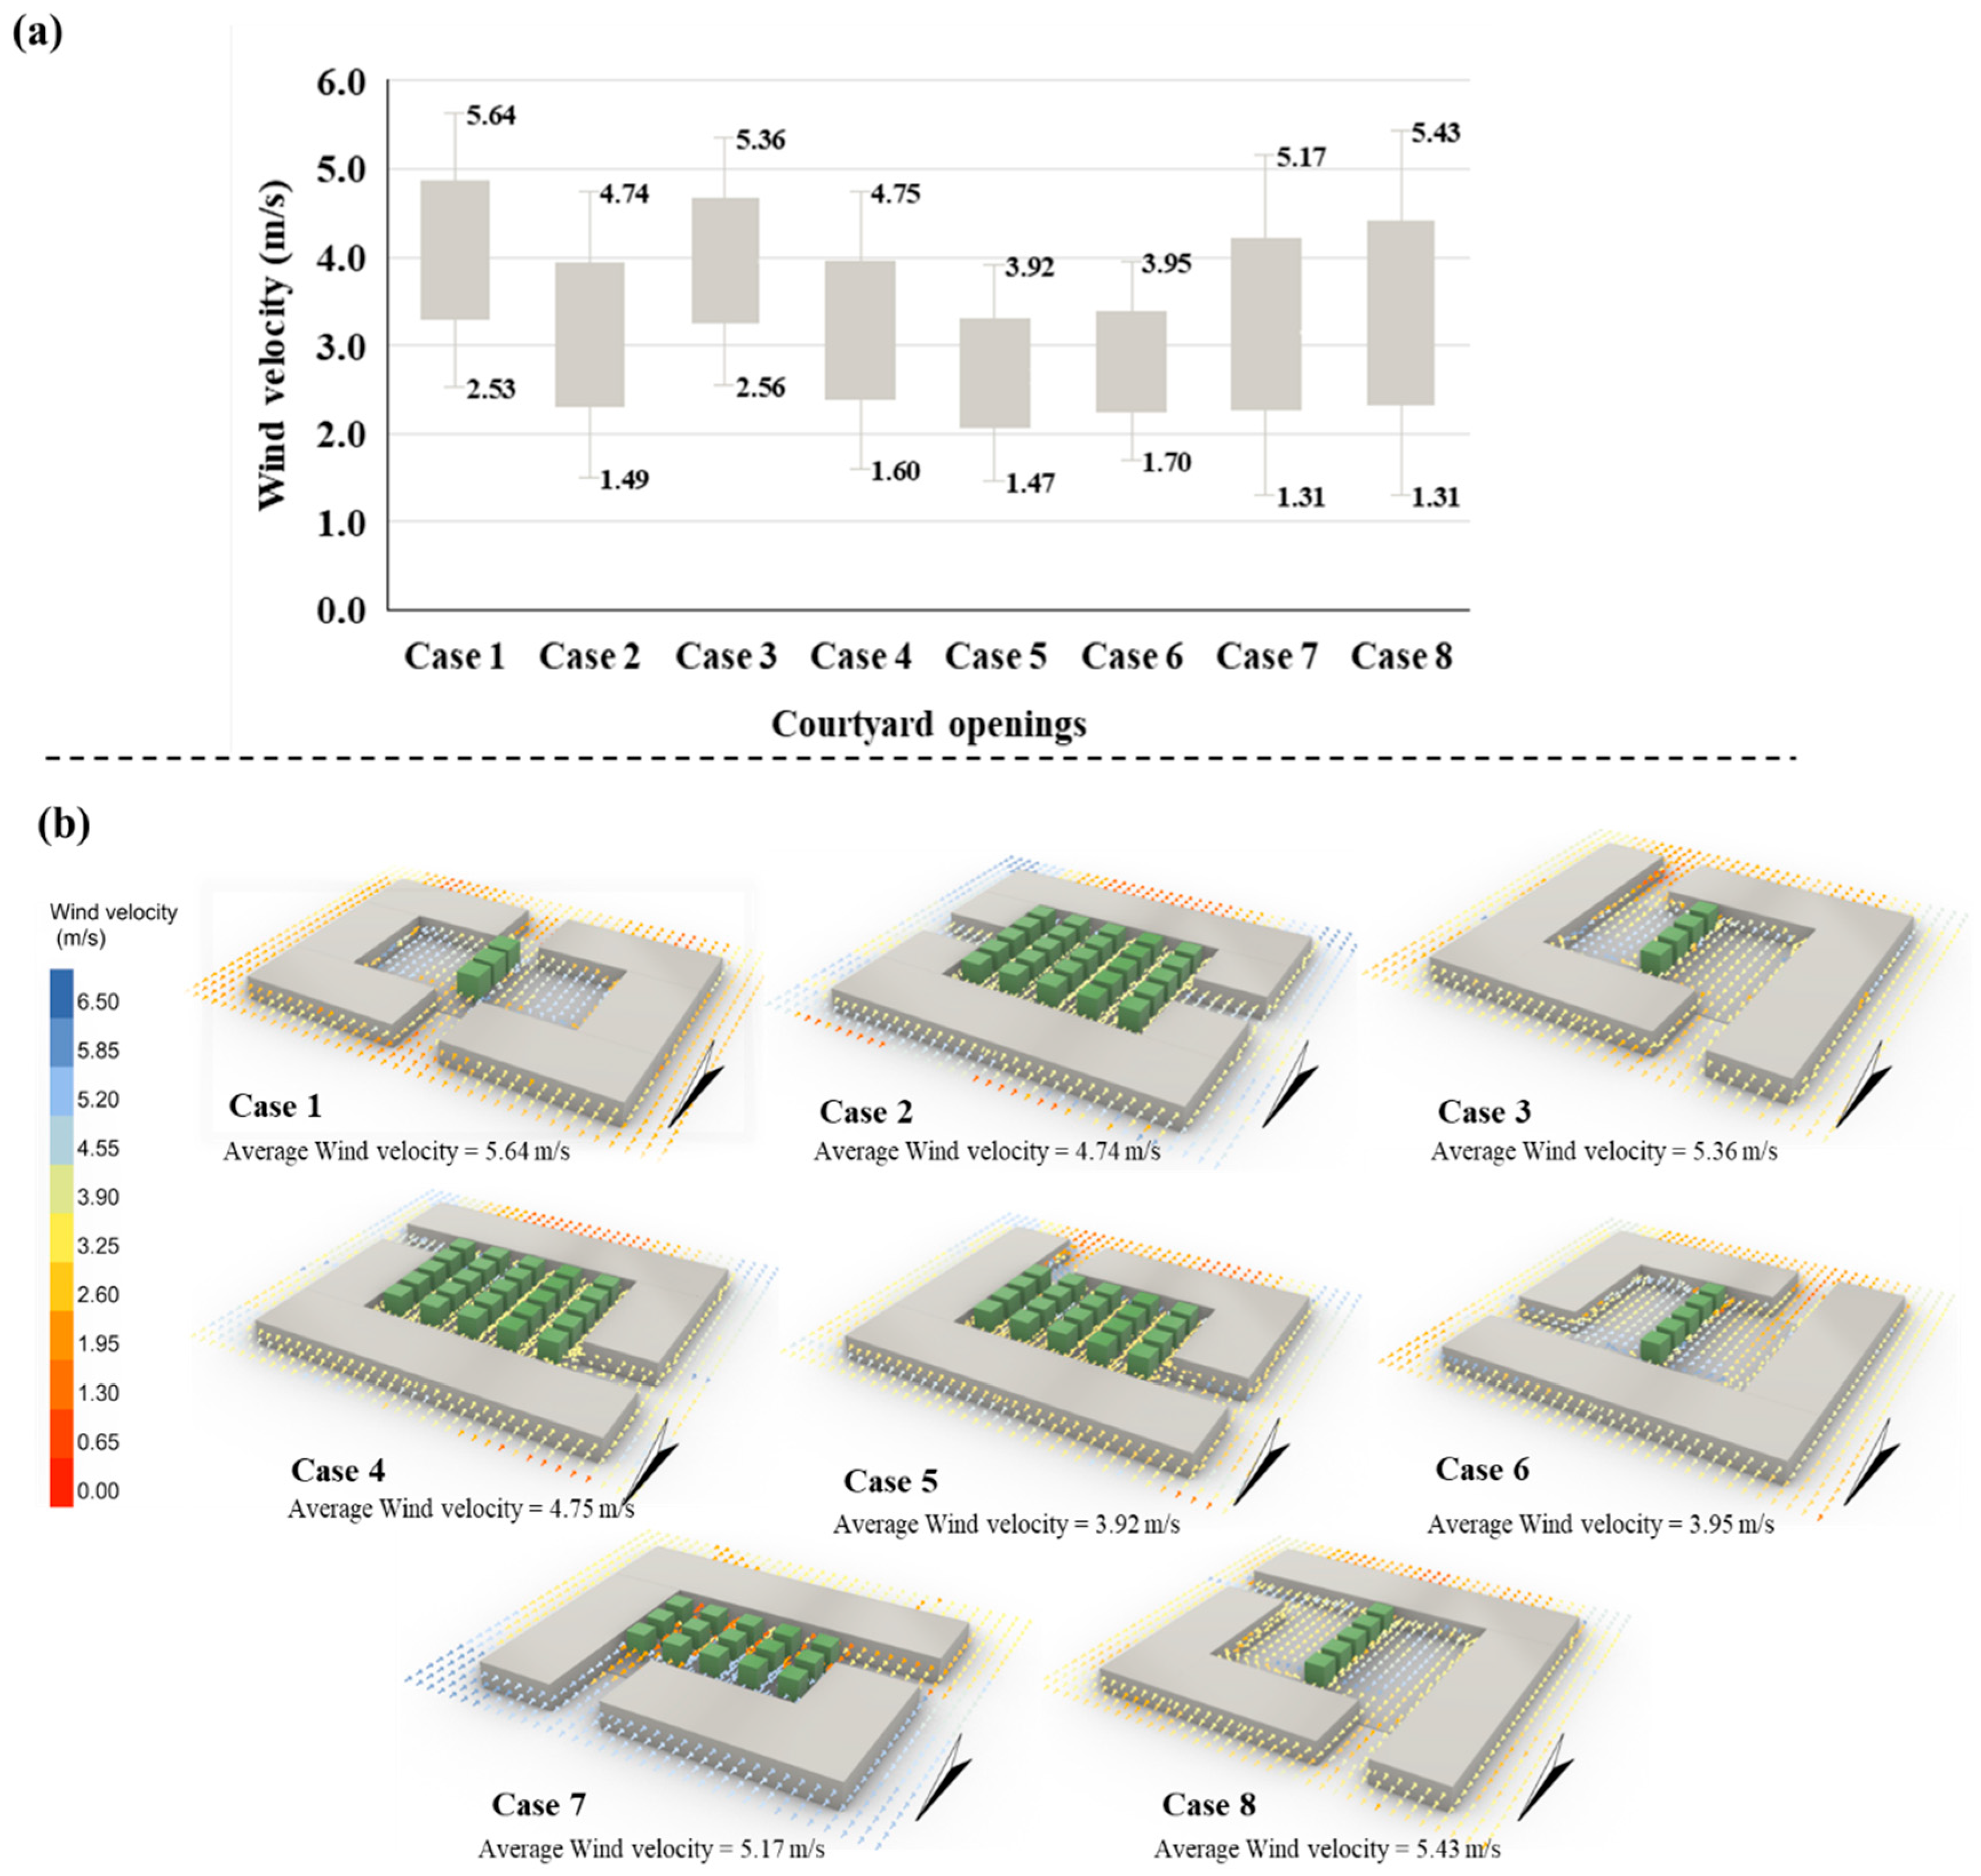
Figure 25a shows the minimum, maximum, and average wind velocity levels based on various courtyard openings. So, a courtyard with two facing openings in the north–south direction, such as in case 1 and case 3, contributed to an increase in the wind velocity between 2.53 m/s and 5.64 m/s. But a courtyard with two facing openings in the east–west direction, such as in case 2 and case 4, contributed to an increase in the wind velocity between 1.49 m/s and 4.75 m/s. On the other hand, a courtyard with two perpendicular openings, one of which was toward the north, such as in case 7 and case 8, caused an increase in the wind velocity by a range between 1.31 m/s and 5.43 m/s. In contrast, case 5 and case 6 slightly improved the wind velocity by a range between 1.4 m/s and 3.95 m/s because the openings were not oriented towards the prevailing wind. Moreover, Figure 25b shows the airflow map of the best solutions of wind velocity for each case of the courtyard openings during the hottest week. Although the courtyard openings were not directly influential parameters for improving UTCI and CO2 concentration levels, they play a critical role in improving wind velocity and air quality accordingly. Therefore, the findings indicated that the more efficient courtyard openings are the ones oriented towards the prevailing wind, whether facing or perpendicular openings.
Based on the main aim, the courtyard with narrow width and integration of 30% tree density achieves reduction of CO2, improved student thermal comfort, and increased wind speed, and these results overcome the results of the monitoring in the real situation.

3.4. Potentials and Limitations of the Parametric Methodology

The proposed parametric methodology has been discussed, so its potentials are categorized into the following:
(a)
Practical potentials include providing guidelines for future design of university buildings in hot arid climates, based on typical courtyard and building dimensions found in Egyptian educational institutions, thereby enabling more efficient courtyard openings instead of closed designs.
(b)
Technical potentials include providing numerous design solutions based on various urban and building parameters for bioclimatic design principles, enhancing air quality through metrics such as UTCI, CO2 concentration, and wind velocity, identifying the most effective parameter for each objective through correlation analysis, and determining the optimal placement of courtyard openings.
(c)
Conceptual potentials include presenting optimal solutions for either all objectives simultaneously or individual objectives. Consequently, the flexibility of the proposed methodology allows for the expansion of its parameters and objectives by integrating them into the simulation workflow, enabling the steps of the methodology to be carried out smoothly and effectively.
On the other hand, the limitations of the proposed parametric methodology are as follows:
(a)
Practical limitations include the reliance on a linear tree distribution, which may restrict the arrangement of seating areas.
(b)
Technical limitations include restricting courtyard dimensions and building heights, as well as excluding other urban and building parameters (e.g., shading, façade materials). Due to computational simulation constraints by Rhino and Grasshopper, additional pollutant gases (e.g., CO, NO2, SO2, PM levels) were not considered, and occupant behavior was not accurately addressed. For fast and feasible CFD simulations, the geometry of trees was simplified, which led to low accuracy.
(c)
Conceptual limitations include the initial framing of the methodology within the context of Egyptian university buildings to ensure relevance and accuracy based on local data. Additionally, the methodology relies on linear courtyard forms, excluding non-linear configurations such as curved courtyards. Also, the cost, space availability, or architectural regulations will be studied in future studies.

4. Conclusions and Recommendations

Improving air quality in university buildings is crucial for safeguarding students’ health, enhancing cognitive performance, and fostering a learning environment. Thus, this study aims to develop optimized design solutions for university buildings and courtyards to enhance outdoor thermal comfort and reduce CO2 concentration levels as an indicator of air quality. Consequently, the study developed a parametric methodology by using Rhino 3D+Grasshopper (V8) software to optimize urban and building parameters to achieve three objectives: improving thermal comfort, reducing the CO2 concentration level, and improving wind velocity. The results can be summarized as follows:
  • The aspect ratio (H/W) significantly influences airflow patterns, with lower ratios (0.7) promoting better ventilation when doors are open (average airspeed increase: 1.1–2.6 m/s), while higher ratios (1.2) create uneven airflow distribution (0.2–3.8 m/s) based on measurements.
  • The most efficient courtyard dimensions are 20 × 20 m, providing the smallest sunny area, while courtyard openings facing north, the prevailing wind direction, significantly contributed to the following: (a) student thermal comfort, with a reduction in the Universal Thermal Climate Index (UTCI) ranging between 2.04 and 10.3 °C, (b) air quality, with a CO2 concentration reduction between 57 and 197 ppm, and (c) ventilation, with a wind speed increasing by 0.4–4.07 m/s.
  • A building height of 20 m could significantly reduce UTCI, because of maximizing the shaded area, but it limits airflow and reduces wind speed, which led to lowered CO2 concentration levels. The most suitable vegetation ratio of trees integrated inside the courtyards is 30% in the design solution of a narrow courtyard for improving UTCI and CO2 concentration, besides avoiding restricting the movement of air and airflow inside the narrow courtyard.
  • Courtyard openings facing north, the prevailing wind direction, contributed to increasing the wind velocity between 1.03 m/s and 4.7 m/s in addition to indirectly reducing CO2 by 195 ppm with appropriate vegetation ratios, and so enhancing thermal comfort.
In conclusion, it is recommended to use narrow courtyards (20 × 20 m) with a maximum building height equal to 20 m in new university building designs, and to implement a vegetation density ratio equal to 30% inside the courtyards of current and new buildings. This research helps enhance current and future courtyard design only with total building height in university buildings in a hot arid climate, particularly in Upper Egypt, with the help of the university administration, for outdoor air quality and thermal comfort. Nevertheless, future work could expand this methodology’s applicability to other climates and regions to ensure broader generalizability by adjusting input parameters and weather data files. Additionally, it could explore diverse courtyard configurations and mitigation strategies, such as kinetic shading systems, to enhance outdoor air quality and thermal comfort. The findings of this study can potentially be extended to other climate zones or varying courtyard dimensions and shapes without requiring further simulations.

Author Contributions

Conceptualization, A.S.H.A. and R.M.A.M.; methodology, A.S.H.A. and R.M.A.M.; software, R.M.A.M.; validation, R.M.A.M. formal analysis, A.S.H.A. and R.M.A.M.; investigation, A.S.H.A. and R.M.A.M.; resources, A.S.H.A. and R.M.A.M.; data curation, A.S.H.A. and R.M.A.M.; writing—original draft preparation, A.S.H.A. and R.M.A.M.; writing—review and editing, A.S.H.A., R.M.A.M., A.R. and M.M.G.; visualization, R.M.A.M.; supervision, A.S.H.A. & A.R. and M.M.G.; project administration, A.S.H.A., A.R. and M.M.G.; funding acquisition, A.R. and M.M.G. All authors have read and agreed to the published version of the manuscript.

Funding

This work was supported and funded by the Deanship of Scientific Research at Imam Mohammad Ibn Saud Islamic University (IMSIU) (grant number IMSIU-DDRSP2502).

Conflicts of Interest

There are no conflicts of interest. The authors declare that they have no known competing financial interests or personal relationships that could have appeared to influence the work reported in this paper.

References

  1. Salameh, M. Courtyards as Passive Design Solution for School Buildings in Hot Areas: UAE as a Case Study. Doctoral Dissertation, The British University in Dubai (BUiD), Dubai, United Arab Emirates, 2018. [Google Scholar]
  2. Martinelli, L.; Matzarakis, A. Influence of height/width proportions on the thermal comfort of courtyard typology for Italian climate zones. Sustain. Cities Soc. 2017, 29, 97–106. [Google Scholar] [CrossRef]
  3. Mahmoud, R.M.A.; Abdallah, A.S.H. Assessment of outdoor shading strategies to improve outdoor thermal comfort in school courtyards in hot and arid climates. Sustain. Cities Soc. 2022, 86, 104147. [Google Scholar] [CrossRef]
  4. Abdallah, A. Passive design strategies to improve student thermal comfort in Assiut University: A field study in the Faculty of Physical Education in hot season. Sustain. Cities Soc. 2022, 86, 104110. [Google Scholar] [CrossRef]
  5. Soflaei, F.; Shokouhian, M.; Abraveshdar, H.; Alipou, A. The impact of courtyard design variants on shading performance in hot-arid climates of Iran. Energy Build. 2017, 143, 71–83. [Google Scholar] [CrossRef]
  6. Zamani, Z.; Heidari, S.; Hanachi, P. Reviewing the thermal and microclimatic function of courtyards. Renew. Sustain. Energy Rev. 2018, 93, 580–595. [Google Scholar] [CrossRef]
  7. Salameh, M.; Taleb, H. Courtyard as Passive Design Solution for School Buildings in Hot Area. In Proceedings of the 2nd World Congress on Civil, Structural, and Environmental Engineering, Barcelona, Spain, 2–4 April 2017. [Google Scholar]
  8. Ghaffarianhoseini, A.; Berardi, U.; Ghaffarianhos, A. Thermal performance characteristics of unshaded courtyards in hot and humid climates. Build. Environ. 2015, 87, 154–168. [Google Scholar] [CrossRef]
  9. Taleghani, M.; Tenpierik, M.; van den Dobbelsteen, A. Heat in courtyards: A validated and calibrated parametric study of heat mitigation strategies for urban courtyards in the Netherlands. Sol. Energy 2014, 103, 108–124. [Google Scholar] [CrossRef]
  10. Zango, M.; Modi, S. The Effect of Vegetation in Enhancing the Performance of Courtyard in Buildings of Tropical Climate. J. Appl. Sci. Environ. Sustain. 2017, 3, 34–42. [Google Scholar]
  11. Soflaei, F.; Shokouhian, M.; Shemirani, S. Investigation of Iranian traditional courtyard as passive cooling strategy (a field study on BS climate). Int. J. Sustain. Built Environ. 2016, 5, 99–113. [Google Scholar] [CrossRef]
  12. Kapalo, P.; Mečiarová, Ľ.; Vilčeková, S.; Krídlová Burdová, E.; Domnita, F.; Bacotiu, C.; Péterfi, K.E. Investigation of CO2 production depending on physical activity of students. Int. J. Environ. Health Res. 2019, 29, 31–44. [Google Scholar] [CrossRef]
  13. Forouzandeh, A. Numerical modelling validation for the microclimate thermal condition of semi-closed courtyard spaces between buildings. Sustain. Cities Soc. 2018, 36, 327–345. [Google Scholar] [CrossRef]
  14. Shaari, N.A.; Zaki, S.A.; Ali, M.; Sukri, M. Investigation of the PMV and TSV Models of Thermal Comfort in Air-Conditioned University Classrooms in Malaysia. Mech. Mater. 2016, 819, 207–211. [Google Scholar] [CrossRef]
  15. Abdallah, A.S.H.; Mohamed, D.; Mohamed, A. The influence of different courtyard ratios in university buildings on their thermal performance during the hot period: (Faculties of Agriculture and Education, New Sohag University, Egypt as a case study). IOP Conf. Ser. Earth Environ. Sci. 2019, 397, 012019. [Google Scholar] [CrossRef]
  16. Eid, M.A.; Mahmoud, R.M.A.; Abdallah, A.S.H. A New Planning Proposal for Achieving Residents’ Thermal Comfort in Hot Arid Climate-based on Simulation Model. Mansoura Eng. J. 2023, 48, 1. [Google Scholar] [CrossRef]
  17. Li, Z.; Zhang, H.; Wen, C.Y.; Yang, A.S.; Juan, Y.H. Effects of frontal area density on outdoor thermal comfort and air quality. Build. Environ. 2020, 180, 107028. [Google Scholar] [CrossRef]
  18. Su, S.; Feng, J.; Wang, W.; Jin, Y.; Chong, D. Dynamic prediction of lifecycle carbon emissions in residential communities: Insights into the role of residential form. Environ. Impact Assess. Rev. 2025, 112, 107845. [Google Scholar] [CrossRef]
  19. Bedra, K.B.; Zheng, J.; Li, J.; Sun, Z.; Zheng, B. Automating Microclimate Evaluation and Optimization during Urban Design: A Rhino–Grasshopper Workflow. Sustainability 2023, 15, 16613. [Google Scholar] [CrossRef]
  20. Abdallah, A.S.H.; Mahmoud, R.M.A.; Aloshan, M.A. Optimizing Urban Spaces: A Parametric Approach to Enhancing Outdoor Recreation Between Residential Areas in Riyadh, Saudi Arabia. Buildings 2025, 15, 1527. [Google Scholar] [CrossRef]
  21. van der Walt, R.E.; Grobbelaar, S.S.; Booysen, M.J. Indoor temperature and CO2 in South African primary school classrooms: Inspecting brick, container, and prefab structures. J. Clean. Prod. 2024, 470, 143120. [Google Scholar] [CrossRef]
  22. Mahyuddin, N.; Essah, E.A. Spatial distribution of CO2 Impact on the indoor air quality of classrooms within a University. J. Build. Eng. 2024, 89, 109246. [Google Scholar] [CrossRef]
  23. Summa, S.; Remia GPerna, C.D.; Stazi, F. Mechanically ventilated classrooms in central Italy’s heritage school buildings: Proposal of archetypes and CO2 prediction models. Build. Environ. 2024, 265, 111963. [Google Scholar] [CrossRef]
  24. Wu, B.; Zhao, S.; Liu, Y.; Zhang, C. Do meteorological variables impact air quality differently across urbanization gradients? A case study of Kaohsiung, Taiwan, China. Heliyon 2025, 11, 41694. [Google Scholar] [CrossRef] [PubMed]
  25. Maiques, M.; Tarragona, J.; Gangolells, M.; Casals, M. Energy implications of meeting indoor air quality and thermal comfort standards in Mediterranean schools using natural and mechanical ventilation strategies. Energy Build. 2025, 328, 115076. [Google Scholar] [CrossRef]
  26. Li, L.; Mirzabeigi, S.; Soltanian-Zadeh, S.; Dong, B.; Krietemeyer, B.; Gao, P.; Wilson, N.; Zhang, J. A high-performance multi-scale modular-based green design studio platform for building and urban environmental quality and energy simulations. Sustain. Cities Soc. 2025, 119, 106078. [Google Scholar] [CrossRef]
  27. Moghadam, T.T.; Bruton, K.; O’Sullivan, D.T.J.; Norton, B. Energy efficient achievement of indoor air quality and thermal comfort using mechanical ventilation heat recovery and solar-energy pre-heating. Energy Convers. Manag. 2025, 327, 119528. [Google Scholar] [CrossRef]
  28. Yao, S.; Li, M.; Yuan, J.; Huo, Q.; Zhao, S.; Wu, Y. Optimization design of layout dimension for residential buildings weighing up daylighting, thermal comfort, and indoor air quality with a low-carbon decision-making. J. Build. Eng. 2024, 98, 111328. [Google Scholar] [CrossRef]
  29. Gebreyesus, T.; Borgemeister, C.; Herrero-J’auregui, C.; Kelboro, G. Transforming urban air quality: Green infrastructure strategies for the urban centers of Ethiopia. Environ. Pollut. 2024, 363, 125244. [Google Scholar] [CrossRef]
  30. Abdeen, N.; Rafaat, T. Assessing vertical green walls for indoor corridors in educational buildings and its impact outdoor: A field study at the universities of Canada in Egypt. Results Eng. 2024, 21, 101838. [Google Scholar] [CrossRef]
  31. Gustafsson, M.S.; Lindén, J.; Johansson, E.M.; Watne, Å.K.; Uddling, J.; Sjölie, D.; Pleijel, H. Well-planned greenery improves urban air quality—Modelling the effect of altered airflow and pollutant deposition. Atmos. Environ. 2024, 338, 120829. [Google Scholar] [CrossRef]
  32. Kofel, D.; Bourgeois, I.; Paganini, R.; Pulfer, A.; Grossiord, C.; Schmale, J. Quantifying the impact of urban trees on air quality in Geneva, Switzerland. Urban For. Urban Green. 2024, 101, 128513. [Google Scholar] [CrossRef]
  33. Kaveh, S.; Habibi, A.; Nikkar, M.; Aflaki, A. Optimizing green infrastructure strategies for microclimate regulation and air quality improvement in urban environments: A case study. Nat.-Based Solut. 2024, 6, 100167. [Google Scholar] [CrossRef]
  34. Islam, A.; Pattnaik, N.; Moula, M.M.; Rötzer, T.; Pauleit, S.; ARahman, M. Impact of urban green spaces on air quality: A study of PM10 reduction across diverse climates. Sci. Total Environ. 2024, 955, 176770. [Google Scholar] [CrossRef]
  35. Reiminger, N.; Jurado, X.; Maurer, L.; Vazquez, J.; Wemmert, C. Advancing urban air quality modeling with solar radiation-included computational fluid dynamics simulations. Atmos. Pollut. Res. 2025, 16, 102383. [Google Scholar] [CrossRef]
  36. HBRC. The Egyptian Code for Enhancing Energy Use in Buildings. 2006. Available online: https://www.hbrc.edu.eg/en (accessed on 1 April 2025).
  37. Noaa. 2025. Available online: http://www.noaa.gov/ (accessed on 1 April 2025).
  38. Meteoblue. 2025. Available online: https://www.meteoblue.com (accessed on 1 April 2025).
  39. ANSI/ASHRAE Standard 62.1-2019; Ventilation for Acceptable Indoor Air Quality. American Society of Heating, Refrigerating and Air-Conditioning Engineers: Atlanta, GA, USA, 2019.
  40. Mahmoud, R.M.A. Multi-objective Approach for Optimizing Buildings’ Forms and Kinetic Façade Systems in Office Buildings. Mansoura Eng. J. 2024, 49, 3. [Google Scholar] [CrossRef]
  41. Muhaisen, A.S. Ventilation performance of courtyards as a passive cooling strategy in hot climates. Renew. Energy 2006, 31, 2061–2071. [Google Scholar]
  42. Al-Masri, N.; Abu-Hijleh, B. Courtyard housing in midrise buildings: An environmental assessment in hot-arid climate. Renew. Sustain. Energy Rev. 2012, 16, 1892–1898. [Google Scholar] [CrossRef]
  43. Abdallah, A.S.H.; Mahmoud, R.M.A. Sustainable Mitigation Strategies for Enhancing Student Thermal Comfort in the Educational Buildings of Sohag University. Buildings 2025, 15, 2048. [Google Scholar] [CrossRef]
  44. Persily, A.; de Jonge, L. Carbon dioxide generation rates for building occupants. Indoor Air 2017, 27, 868–879. [Google Scholar] [CrossRef]
  45. Xu, X.; Yin, C.; Wang, W.; Xu, N.; Hong, T.; Li, Q. Revealing Urban Morphology and Outdoor Comfort through Genetic Algorithm-Driven Urban Block Design in Dry and Hot Regions of China. Sustainability 2019, 11, 3683. [Google Scholar] [CrossRef]
  46. Norouziasas, A.; Ha, P.P.; Ahmadi, M.; Rijal, H.B. Evaluation of urban form influence on pedestrians’ wind comfort. Build. Environ. 2022, 224, 109522. [Google Scholar] [CrossRef]
  47. Saura, R.B.D.; Andante, R.J.M. Detection of cyanide in freshwater fishes relative to sex dimorphism using landmark-based geometric morphometrics in Agusan del Sur, Philippines. Int. J. Biosci. 2018, 12, 2222–5234. [Google Scholar] [CrossRef]
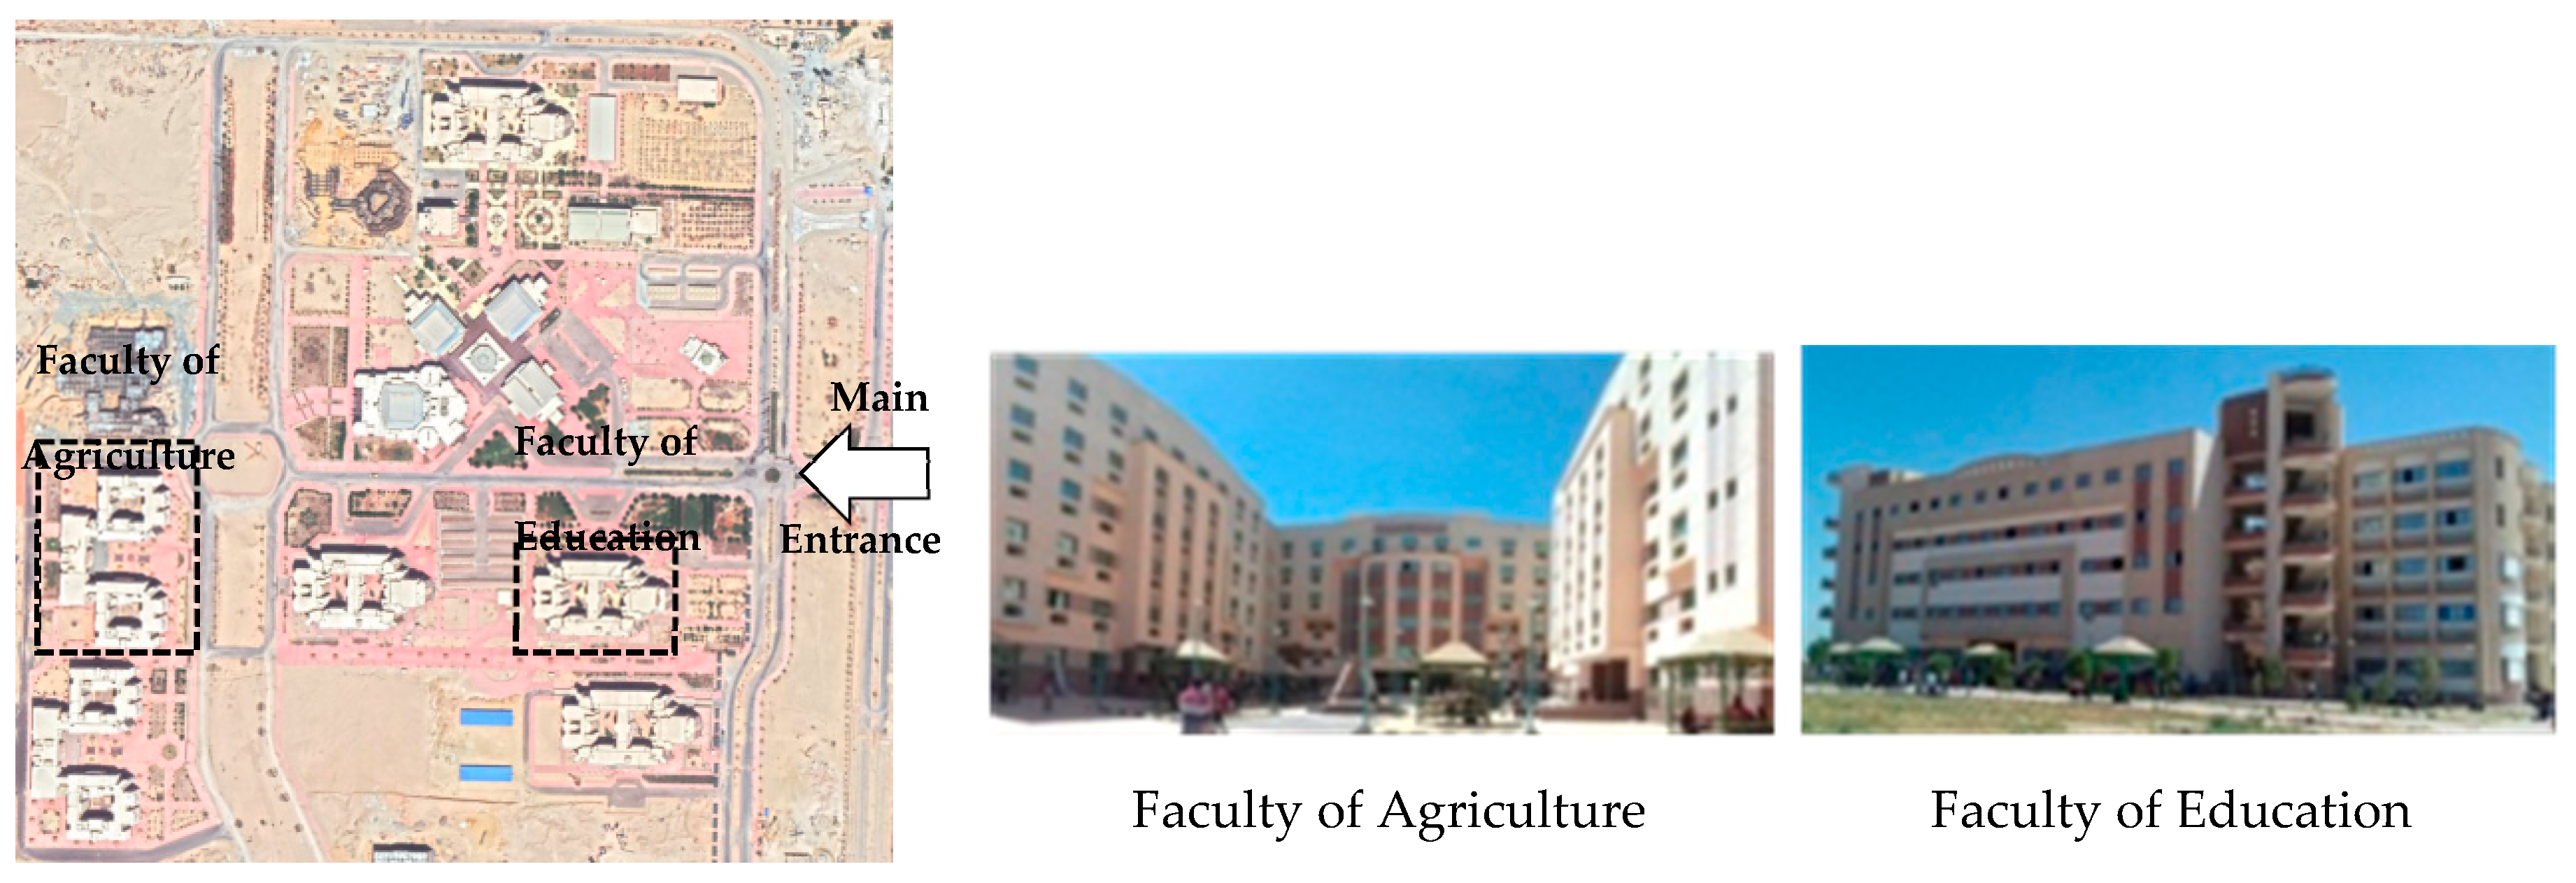
Figure 1. Satellite image and outside view of the two faculties in New Sohag University.
Buildings 15 03140 g001
Figure 2. The proposed parametric methodology for optimizing air quality in a university building.
Buildings 15 03140 g002
Figure 3. The workflow of the parametric methodology for optimizing air quality in the Grasshopper environment.
Buildings 15 03140 g003
Figure 4. Workflow of stage 1: Generating a prototypical model in the Grasshopper environment.
Buildings 15 03140 g004
Figure 5. The validation of Grasshopper simulation tools compared with field measurements in the Faculty of Agriculture; (a) CO2 concentration level and (b) wind speed.
Buildings 15 03140 g005
Figure 6. The proposed design solutions.
Buildings 15 03140 g006
Figure 7. Workflow for stage 2 of the multi-objective optimization process in the Grasshopper environment.
Buildings 15 03140 g007
Figure 8. Workflow for stage 3 of visualizing the results in the Grasshopper environment.
Buildings 15 03140 g008
Figure 9. Wind speed monitoring in different locations inside the courtyards of the Faculty of Agriculture.
Buildings 15 03140 g009
Figure 10. Wind speed patterns in different locations inside the courtyards of the Faculty of Education.
Buildings 15 03140 g010
Figure 11. CO2 concentration in the spaces overlooking the courtyards in the Faculty of Education building.
Buildings 15 03140 g011
Figure 12. Pareto front solutions; (a) 3D Pareto, and (b) 2D Paretos.
Buildings 15 03140 g012
Figure 13. Parallel coordinates graph of a feasible solution of the parametric methodology.
Buildings 15 03140 g013
Figure 14. The optimal solutions of the proposed parametric methodology.
Buildings 15 03140 g014
Figure 15. The average UTCI of (a) the 5000-design solution, (b) the last design solution, and (c) the typical design solution.
Buildings 15 03140 g015
Figure 16. The common parameters of the 100 top solutions based on UTCI results.
Buildings 15 03140 g016
Figure 17. The average CO2 concentration level of (a) the 5000-design solution, (b) the last design solution, and (c) the typical design solution.
Buildings 15 03140 g017
Figure 18. The common parameters of the 100 top solutions based on CO2 concentration levels.
Buildings 15 03140 g018
Figure 19. The average wind velocity of (a) the 5000-design solution, (b) the typical design solution, and (c) the last design solution.
Buildings 15 03140 g019
Figure 20. The common parameters of the 100 top solutions based on wind velocity.
Buildings 15 03140 g020
Figure 21. Correlation analysis between the optimization objectives: (a) UTCI and CO2 concentration level, (b) UTCI and wind speed, and (c) CO2 concentration level and wind speed.
Buildings 15 03140 g021
Figure 22. The Coefficient of Determination values and interpretation: (a) sensitivity analysis between the optimization parameters and objectives, (b) UTCI and building height, (c) CO2 concentration and vegetation ratio, and (d) wind velocity and courtyard openings.
Buildings 15 03140 g022
Figure 23. (a) The range and average values of (a) UTCI based on various building heights and (b) the thermal map of the best solutions of UTCI for each value of building height.
Buildings 15 03140 g023
Figure 24. (a) The range and average values of CO2 concentration levels based on various vegetation ratios of trees, and (b) the thermal map of the best solutions for CO2 concentration for each value of vegetation ratio of trees.
Buildings 15 03140 g024
Figure 25. (a) The range and average values of wind velocity based on various courtyard openings, and (b) the airflow map of the best solutions for wind velocity for each case of courtyard openings.
Buildings 15 03140 g025
Table 1. Devices used for measurements.
ParametersInstrumentsAccuracyRangeMeasurement Interval
Wind speed in courtyardsEA3000 Standard Handheld Anemometer±5%, +0.1 m/s0.2 m/s to 30 m/sEvery 1 min
Concentration of CO2 in spaces and courtyardsTR-76Ui1%, ±1 °C(0 to 45 °C)
(10% to 90% RH)
Every 30 s
Table 2. The settings of the optimization process.
Inputs DataValue
Location Sohag City, Egypt (26°32′59″ N, 31°42′0.003″ E)
Weather fileSohag.AP SJ EGY 623980 TMYx
Simulation periodThe hottest week from 10 July to 16 July in the scheduled hours from 9:00 to 17:00
North angle
Simulation grid1 m × 1 m
Simulation heightPedestrian level 1.8 m
AlgorithmNon-Dominated Sorting Genetic Algorithm II (NSGA-II)
Generation number50
Population size10
Random seed1
Disclaimer/Publisher’s Note: The statements, opinions and data contained in all publications are solely those of the individual author(s) and contributor(s) and not of MDPI and/or the editor(s). MDPI and/or the editor(s) disclaim responsibility for any injury to people or property resulting from any ideas, methods, instructions or products referred to in the content.