Inversion of Physical and Mechanical Parameters of Surrounding Rock Mass in Foundation Pits Using a PSO-BP Neural Network
Abstract
1. Introduction
2. The Parameter Inversion Method Based on the PSO-BP Neural Network
2.1. The Principle of the BP Neural Network
2.1.1. Forward Propagation
- Weighted sum, the input to the j-th node of the hidden layer
- 2.
- Activated through the activation function
- 3.
- Output layer calculation
2.1.2. Backpropagation of the Error
- 1.
- Using mean squared error (MSE)
- 2.
- The weight update principle
- 3.
- Error between the output and input layers
- 4.
- Weight update
2.2. The Principle of the PSO Algorithm
- 1.
- Iteration limit: The algorithm terminates when the number of iterations reaches the predefined maximum.
- 2.
- Fitness variation threshold: The algorithm stops when the change in the global optimal fitness value is smaller than the predefined threshold, i.e., it satisfies Equation (11).
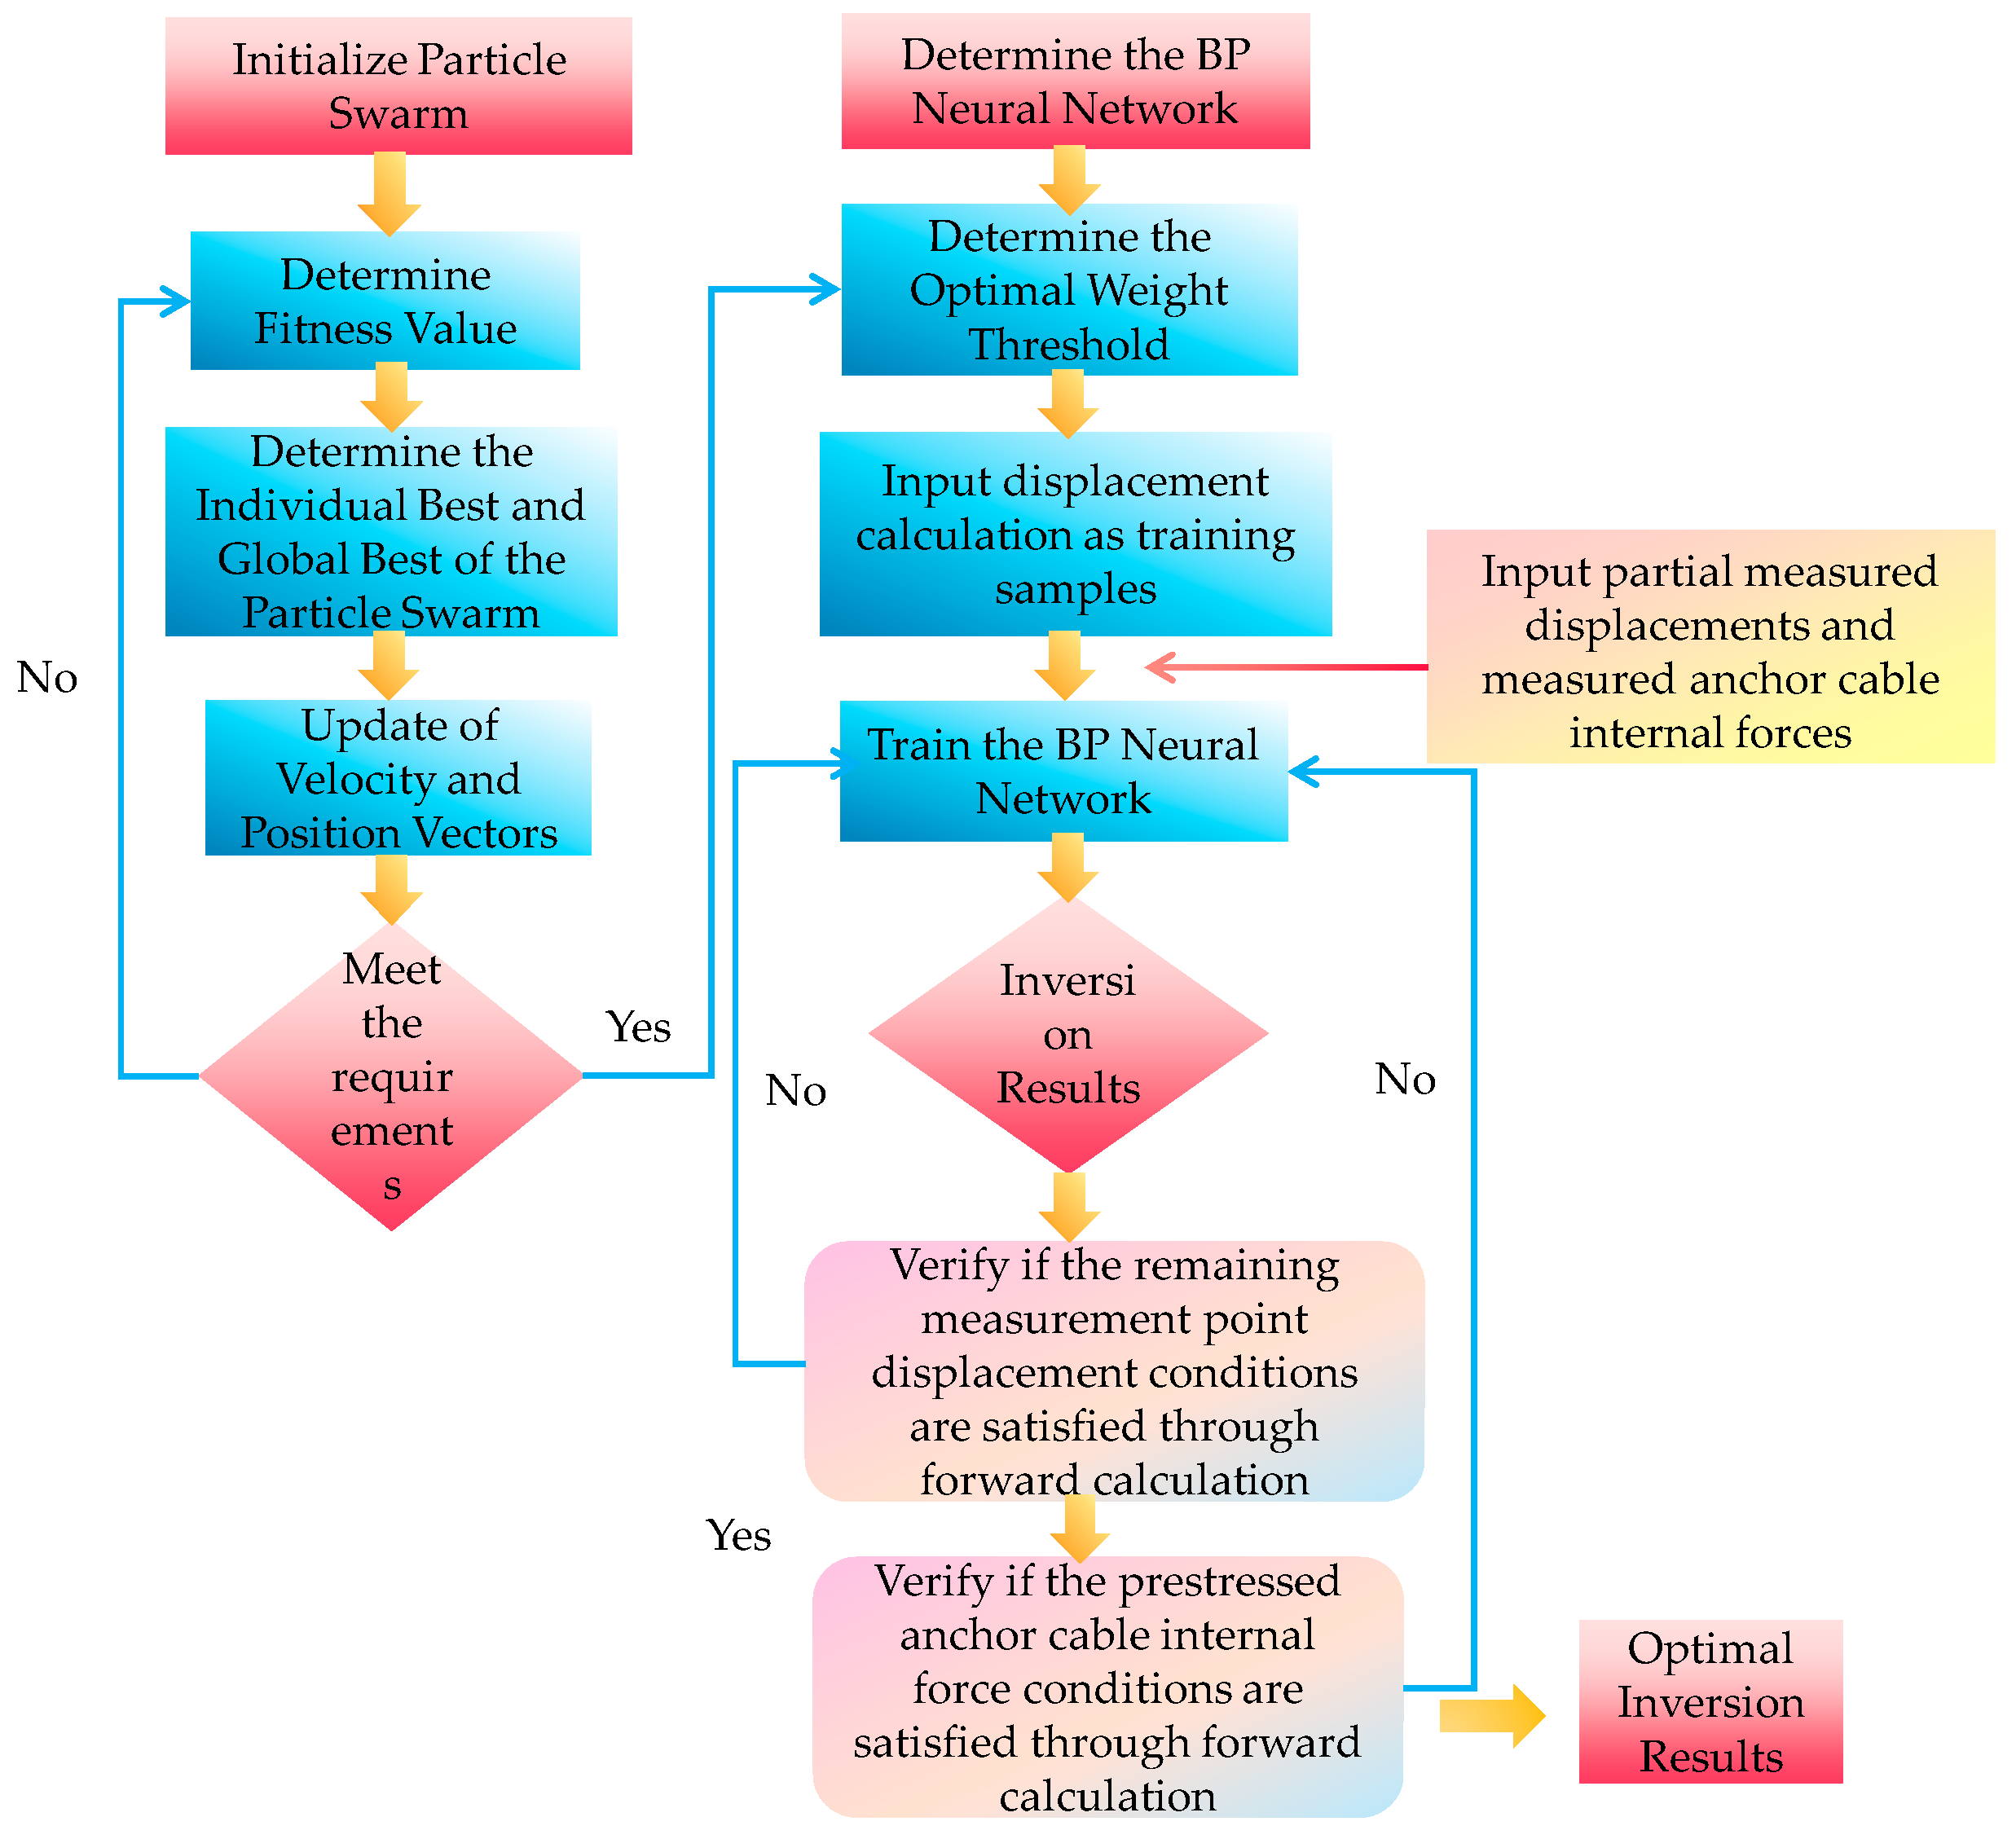
2.3. The Parameter Inversion Process
- 1.
- First, the parameter range of the geotechnical soil is divided based on the findings from the local survey report.
- 2.
- A three-dimensional model of the foundation pit is established using finite difference software. The parameter range of the soil body is subjected to orthogonal experimental design. The parameters of each experimental condition, obtained through the design, are then input into the finite difference software for numerical computation. This process yields the simulated values of the top slope’s vertical displacement, horizontal displacement, and the prestressed anchor cable’s internal force under different conditions (parameters).
- 3.
- The displacement of the surrounding rock and the internal force of the anchor cables, along with the corresponding parameters obtained from the numerical simulation software, are divided into two parts: one as the training set and the other as the test set. The number of neuron nodes in the input layer, hidden layer, and output layer is determined, and the BP neural network is established.
- 4.
- The normalization process:
- 5.
- The particle swarm optimization (PSO) algorithm is used to optimize the BP neural network, updating the weights and thresholds.
- 6.
- Some measured displacement values and anchor cable internal forces are input into the trained neural network for inversion to obtain the geotechnical parameters.
- 7.
- Finally, the inverted geotechnical parameters are input into the simulation software, and the simulated values of the top slope’s vertical displacement, horizontal displacement, and prestressed anchor cable internal force are compared with the measured values to verify the accuracy of the inverted parameters.
3. Engineering Example
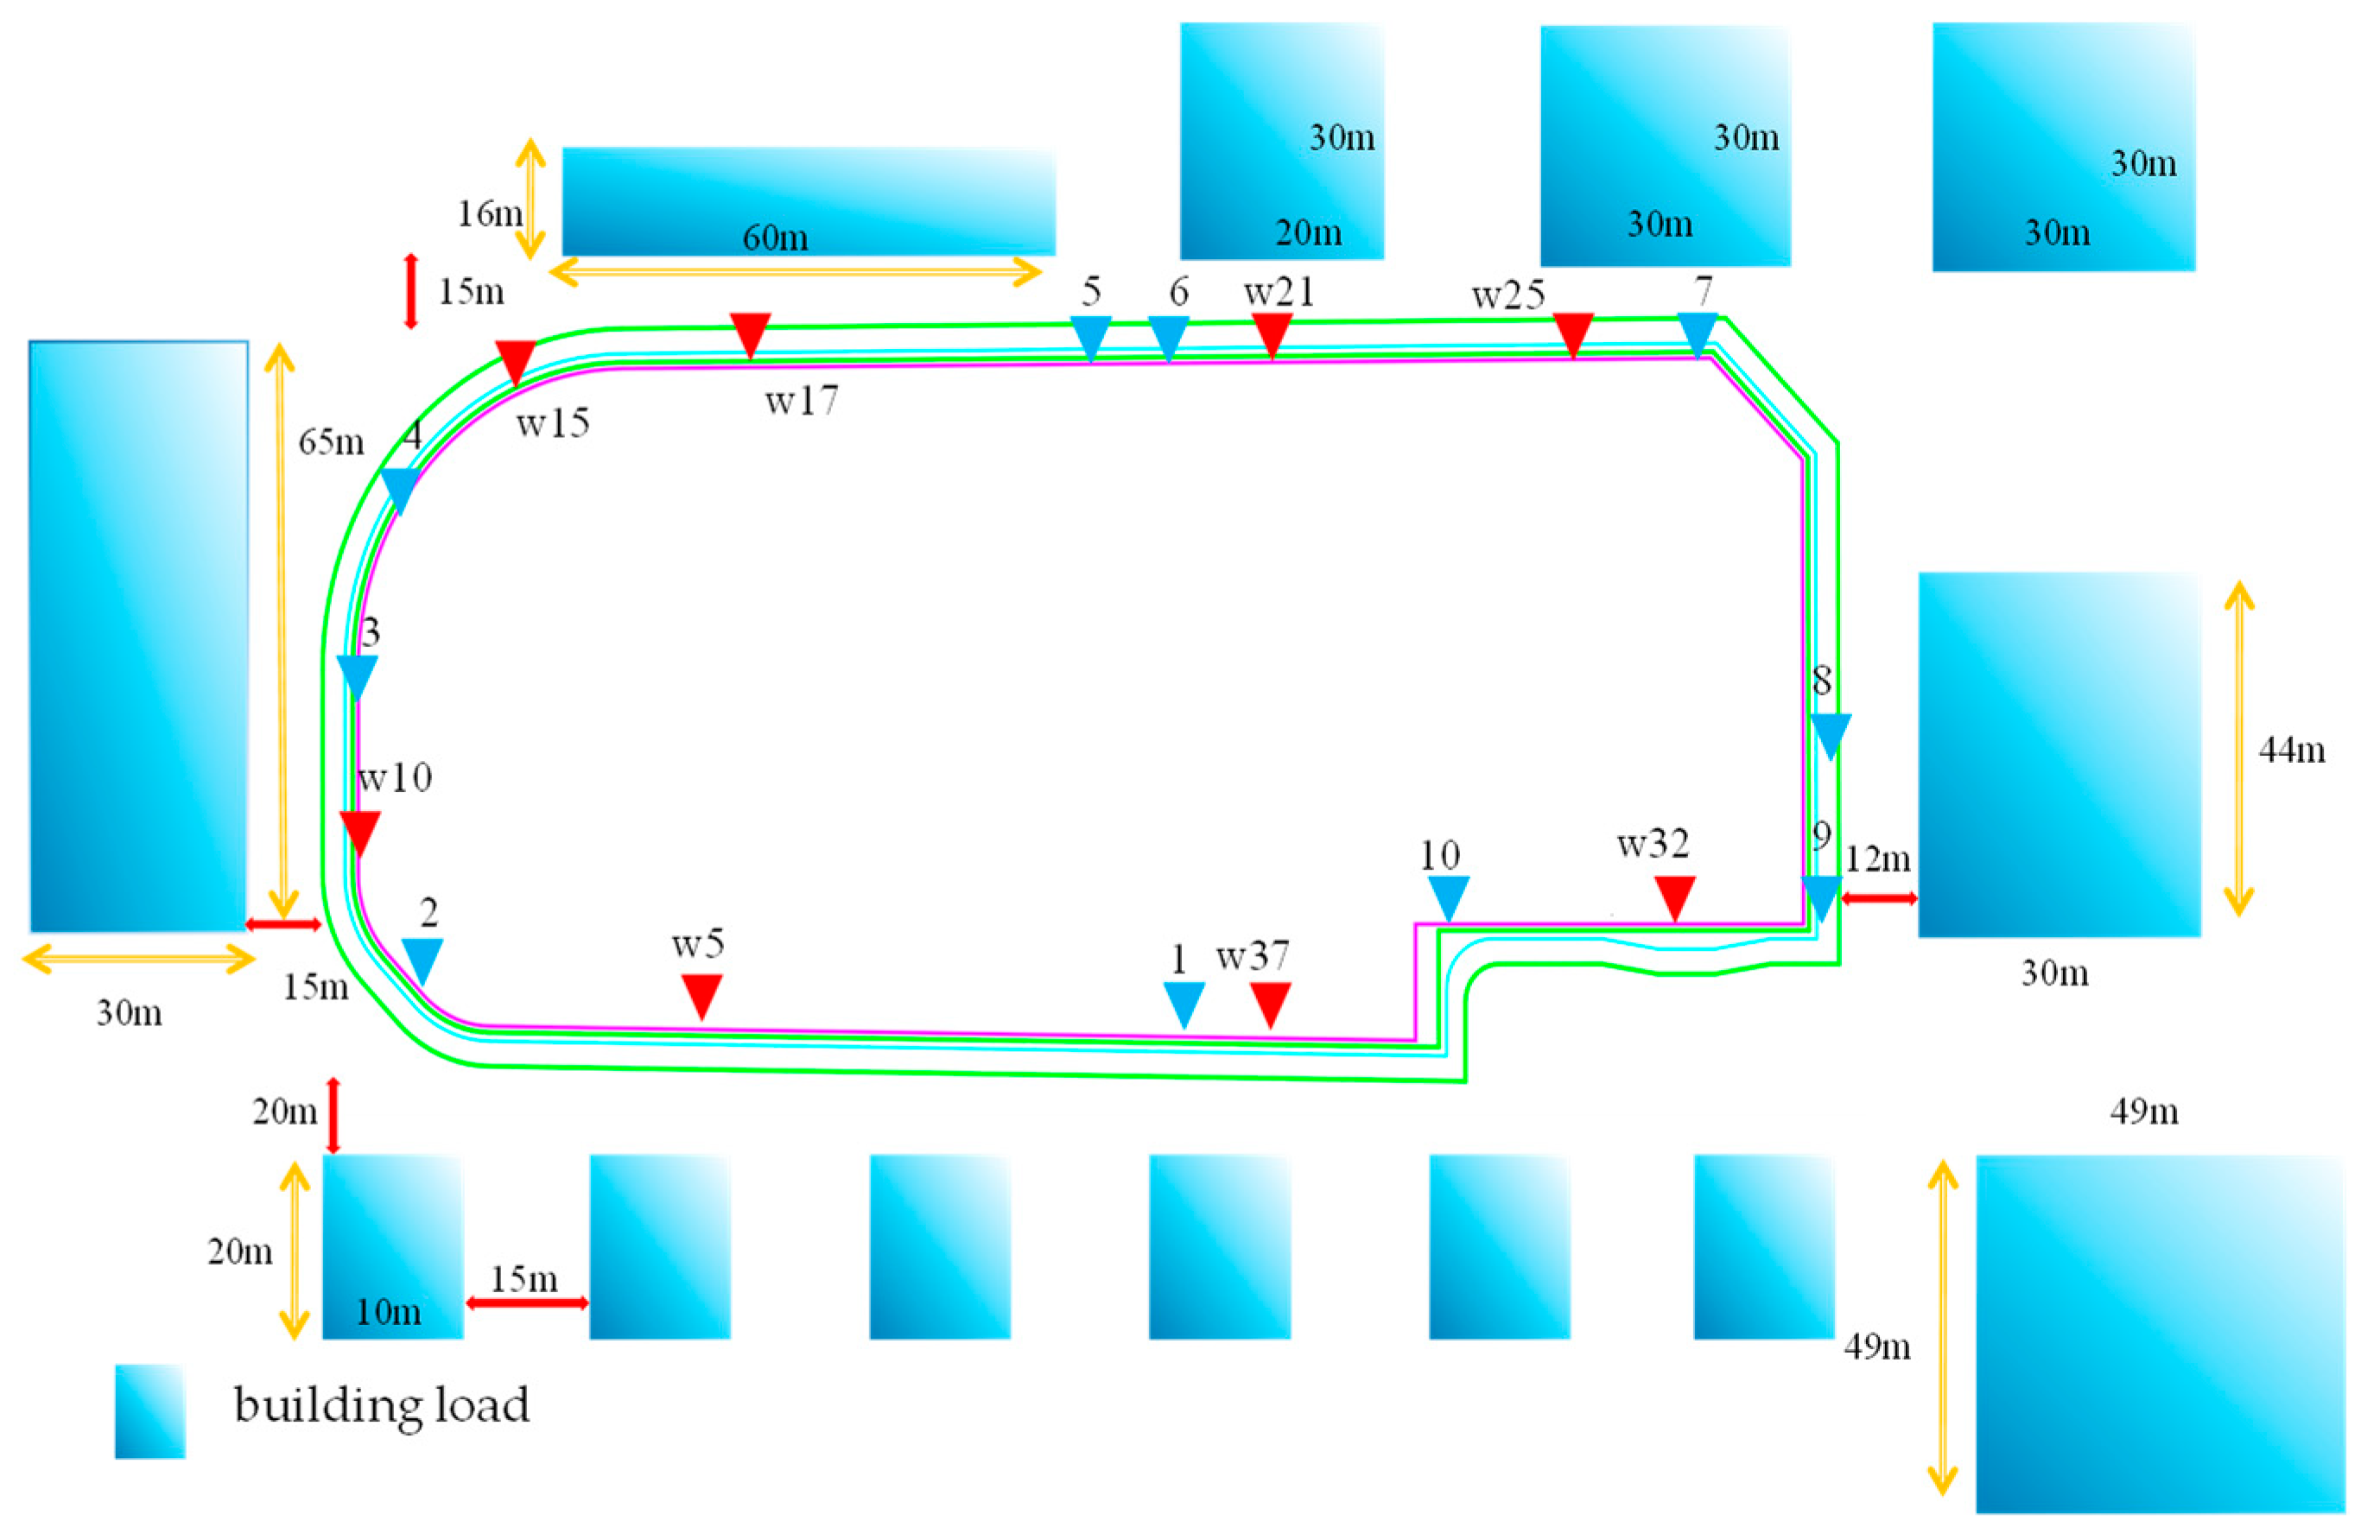
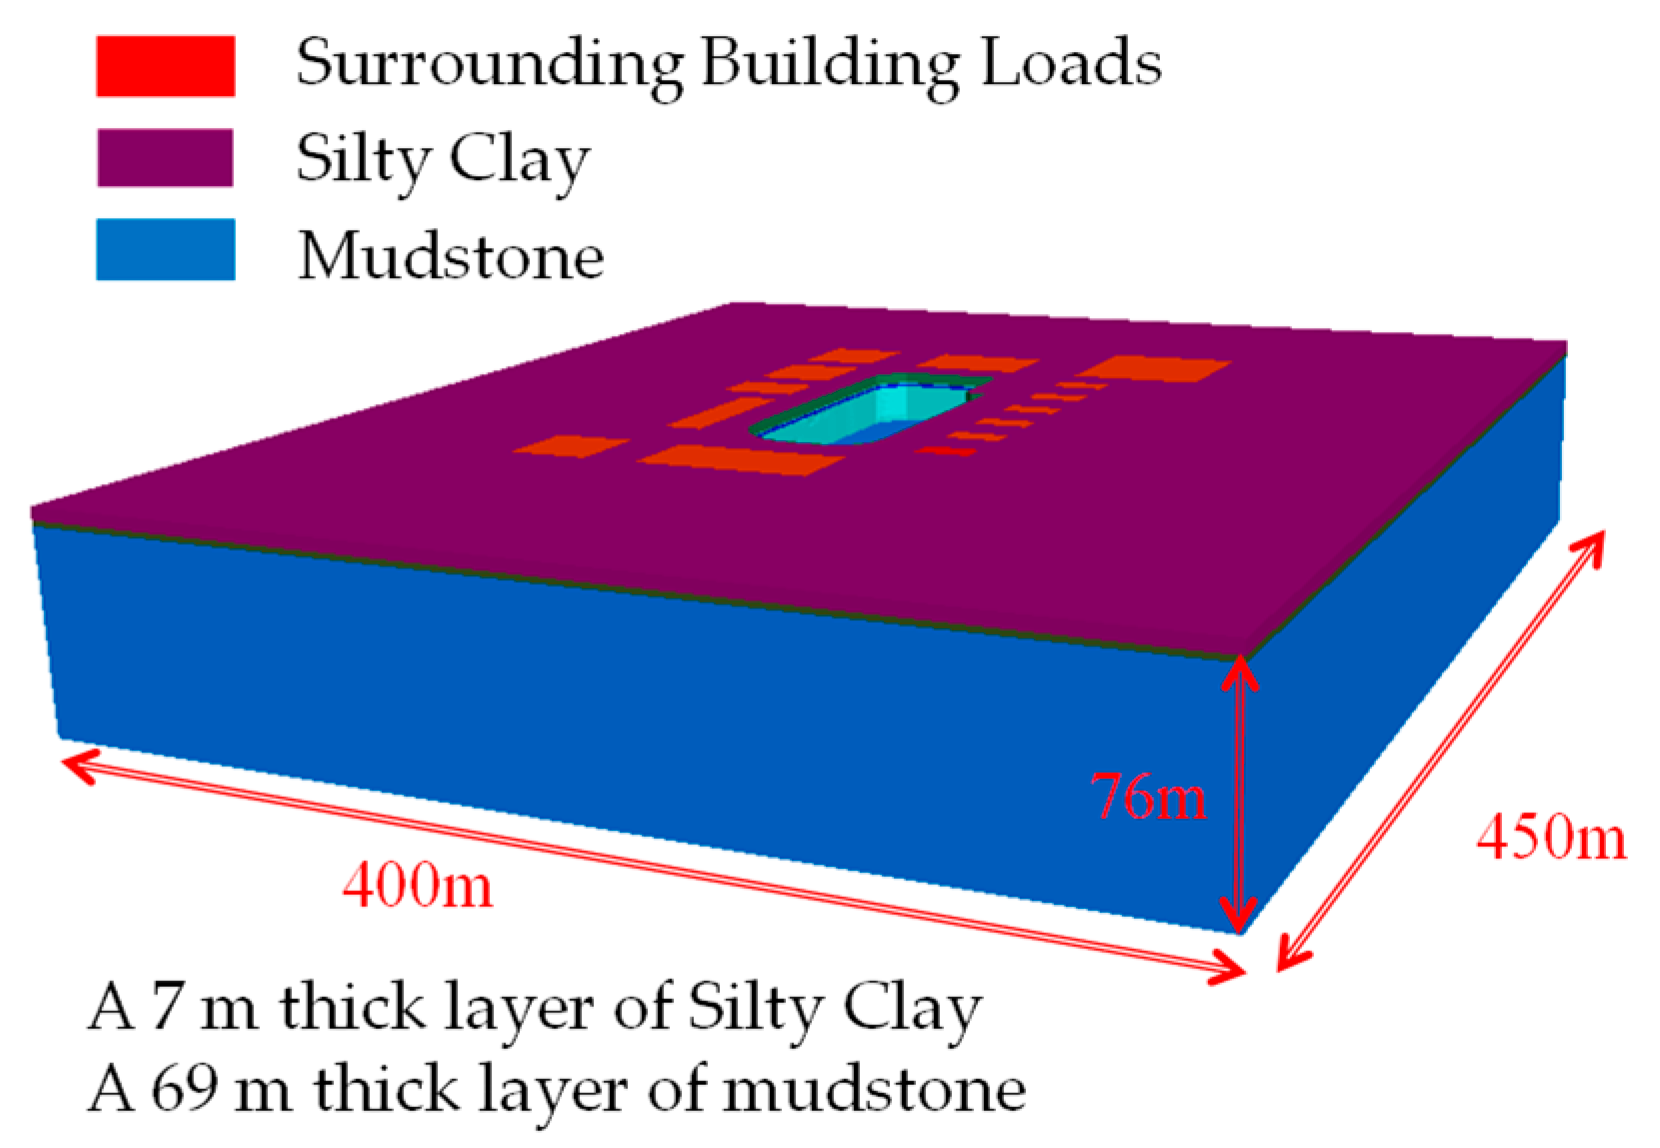
3.1. Project Overview and Numerical Simulation
3.2. Parameter Orthogonal Experimental Design
4. Establishing a PSO-BP Neural Network
4.1. Parameter Sensitivity Analysis
4.2. PSO-BP Parameters Determination
4.3. Parameter Inversion
4.4. Analysis and Validation of Inversion Results
4.4.1. Analysis of Support Piles
4.4.2. Verification of Anchor Cable Internal Force and Deformation Results
5. Limitations of This Study and Future Work
- 1.
- The inversion results are limited by the quality and quantity of the training data. Although satisfactory accuracy has been achieved, the data coverage may be insufficient under complex geological conditions. Future studies should increase data diversity, particularly by collecting more field measurements in complex geological environments, to further enhance inversion accuracy.
- 2.
- Although anchor cable force and displacement data were introduced as dual validation, the heterogeneity and anisotropy of geotechnical media under complex geological conditions may still affect the accuracy of parameter inversion. Future research could incorporate additional validation indicators to improve robustness.
- 3.
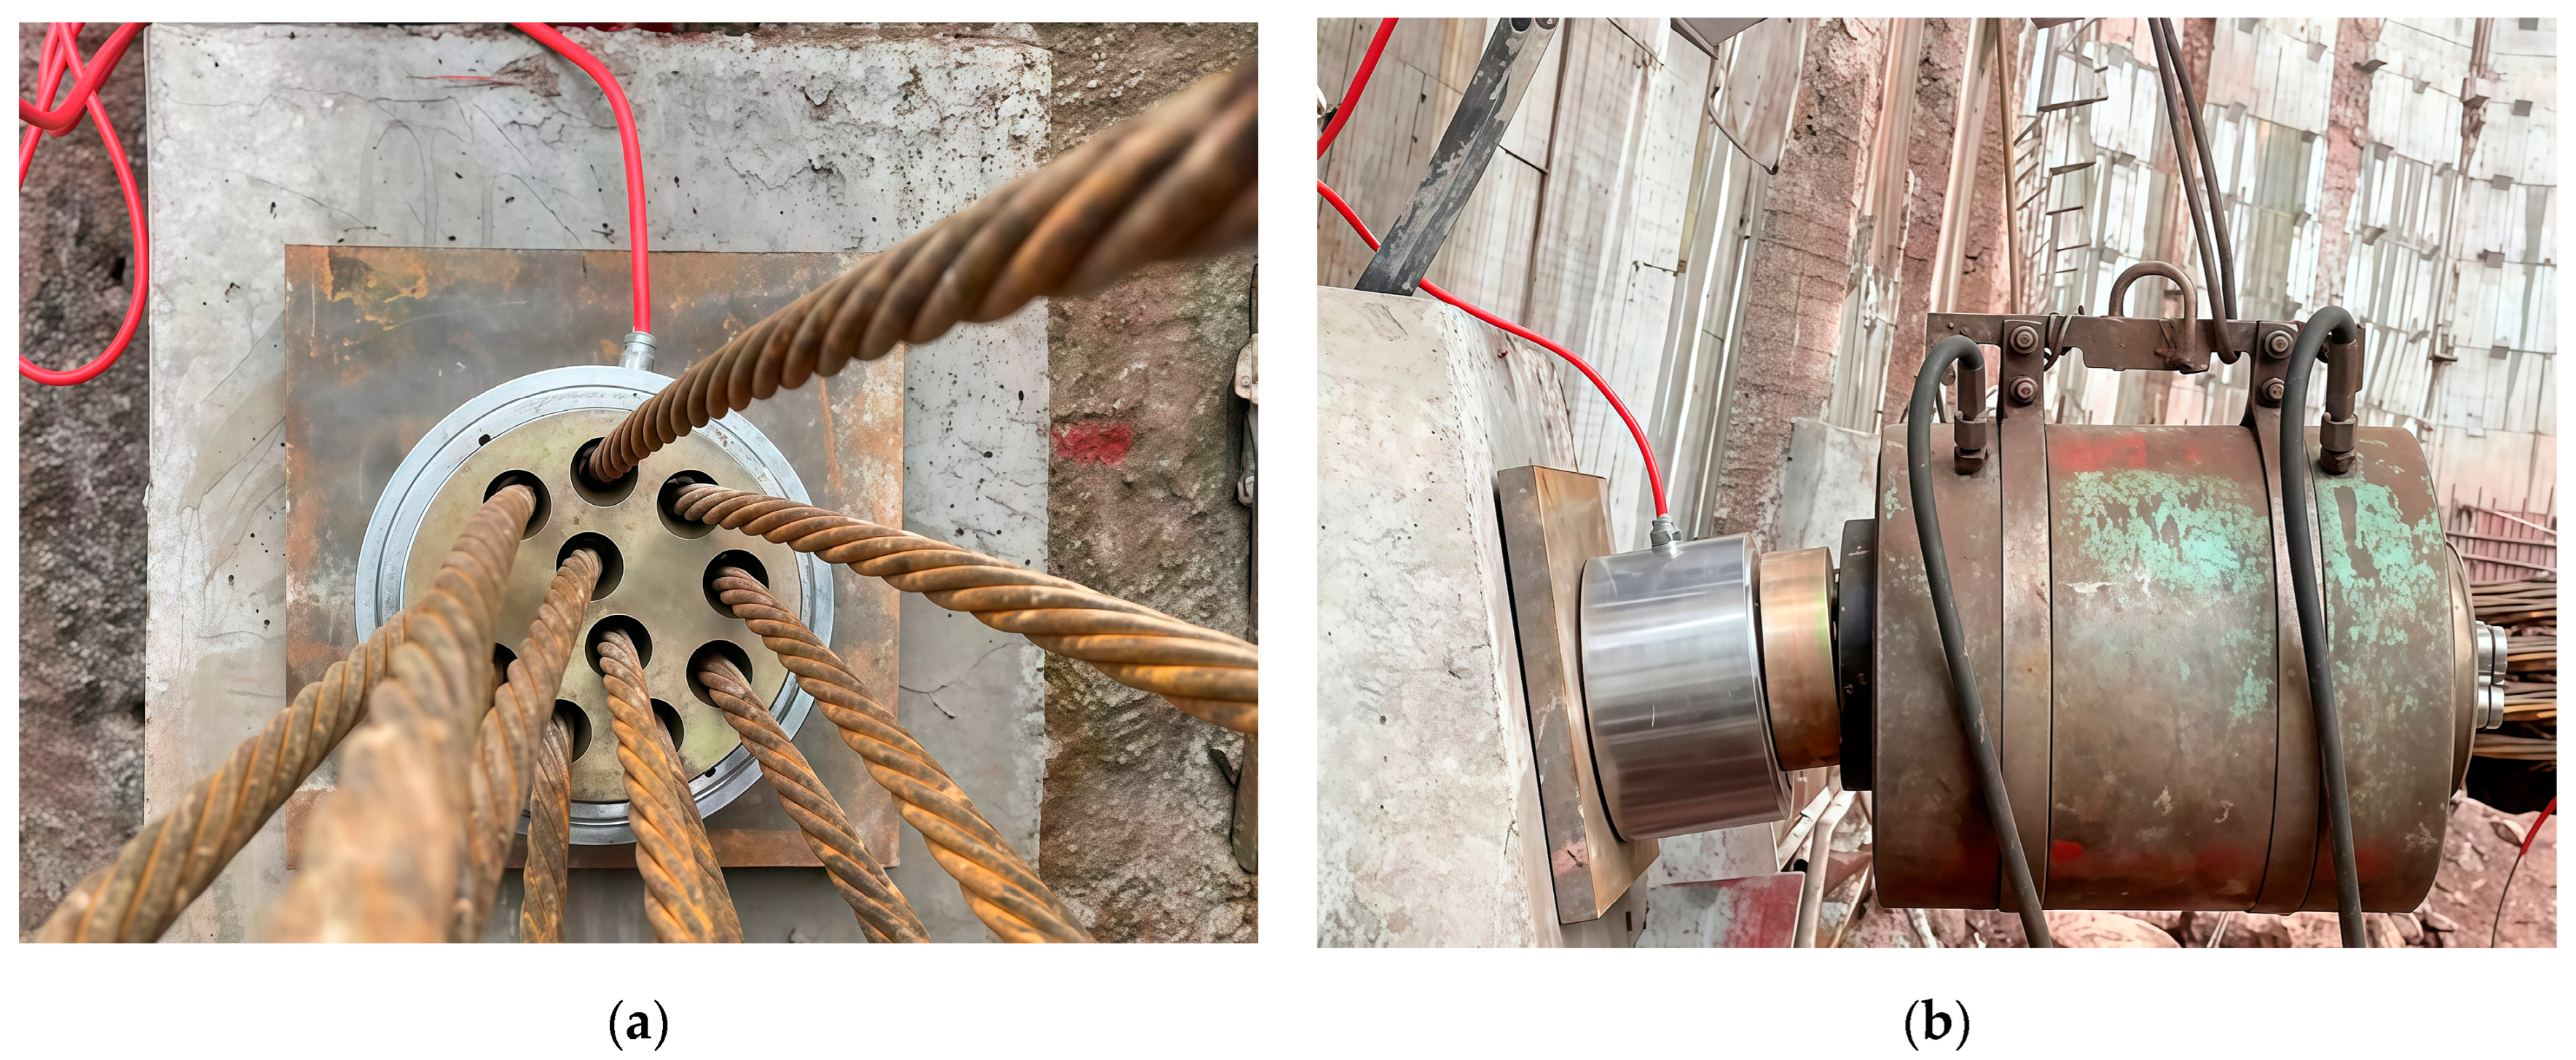
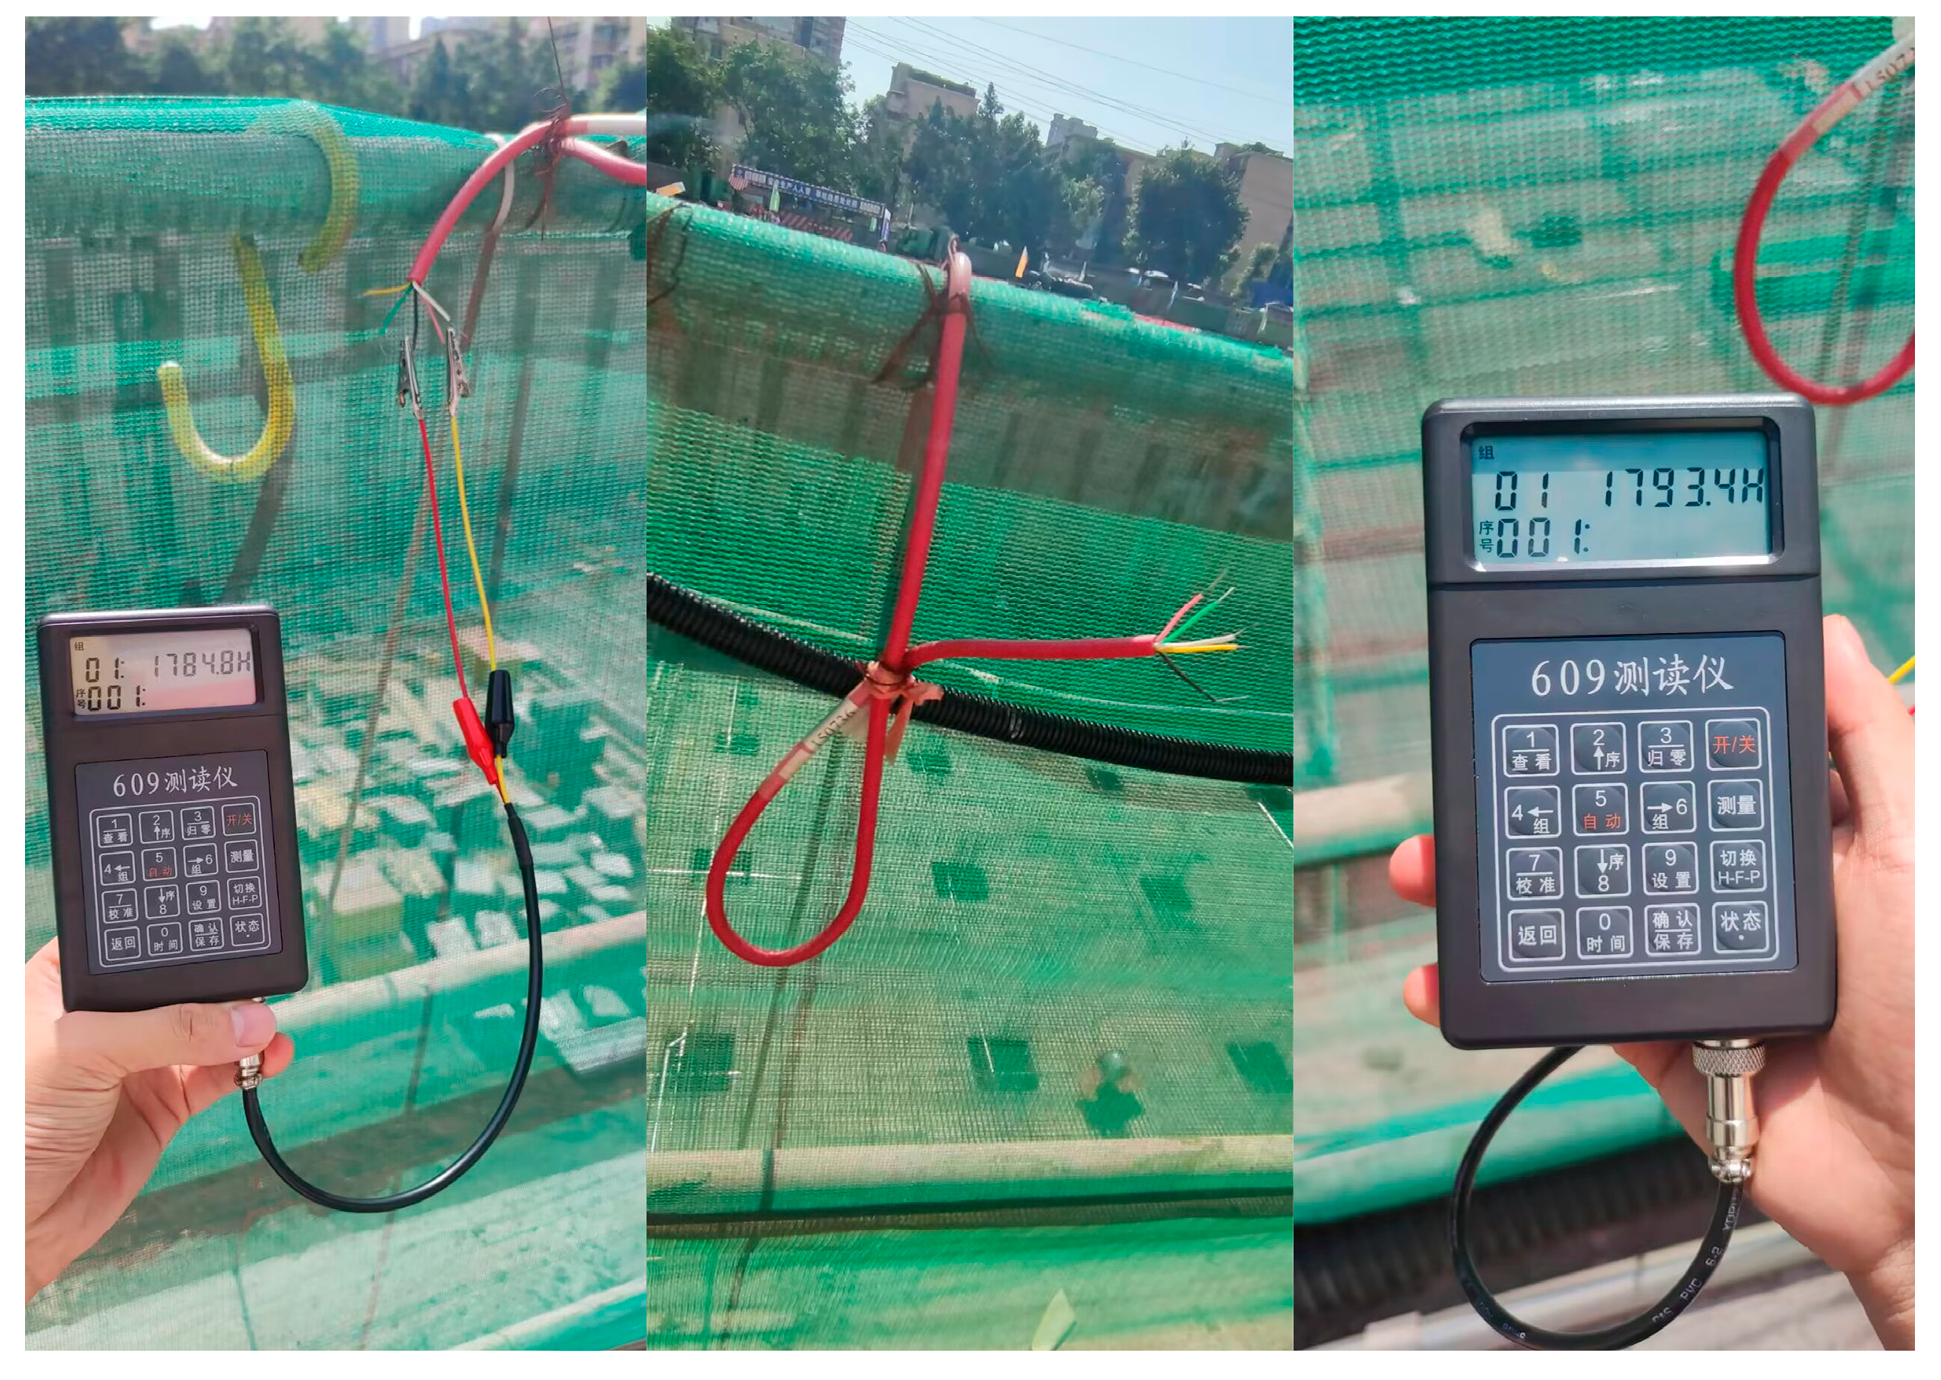
- As described earlier, the data collection scheme included the arrangement of monitoring points and on-site acquisition procedures. However, due to environmental and equipment limitations, the field data may still be affected by external disturbances, such as uncontrollable factors during construction, leading to certain errors. Future research may employ higher-precision measurement devices and consider developing intelligent platforms that integrate relevant algorithms into applications for real-time monitoring, thereby enhancing practical engineering applications [29].
6. Conclusions
- 1.
- By optimizing the BP neural network using the PSO algorithm, the overall convergence speed of the model can be improved, and it also helps to avoid the network falling into local optima. This algorithm has certain reference value and practicality for the inversion of the physical and mechanical parameters of the surrounding rock in foundation pit engineering.
- 2.
- The inverted physical–mechanical parameters of the Shapingba foundation pit fell within the ranges reported in the geotechnical survey, confirming their engineering reliability.
- 3.
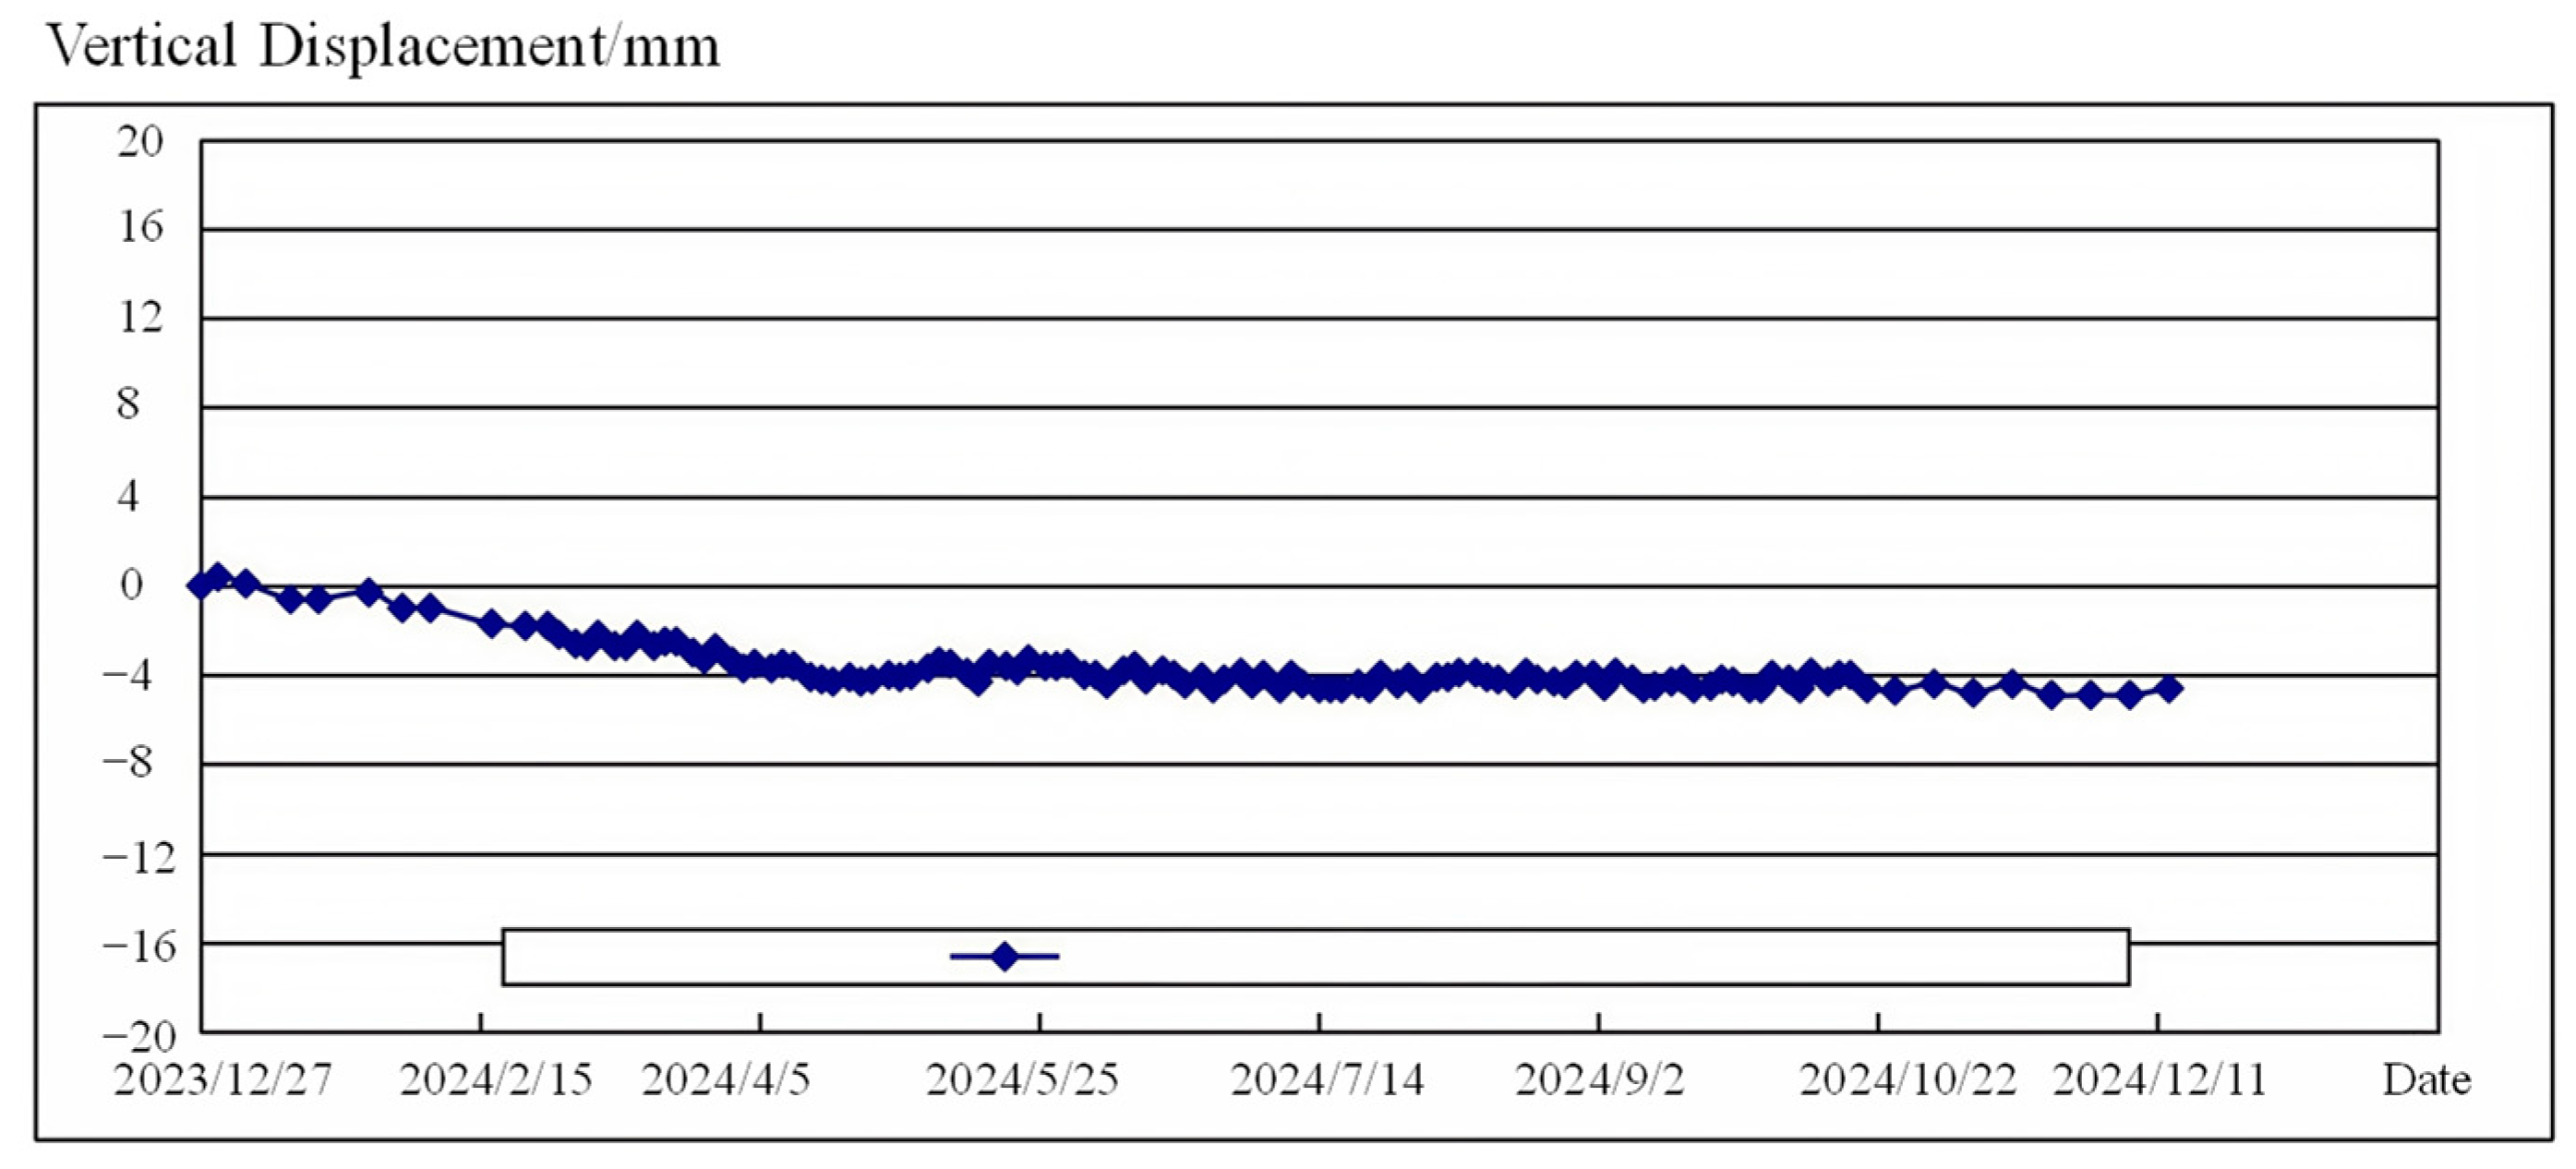
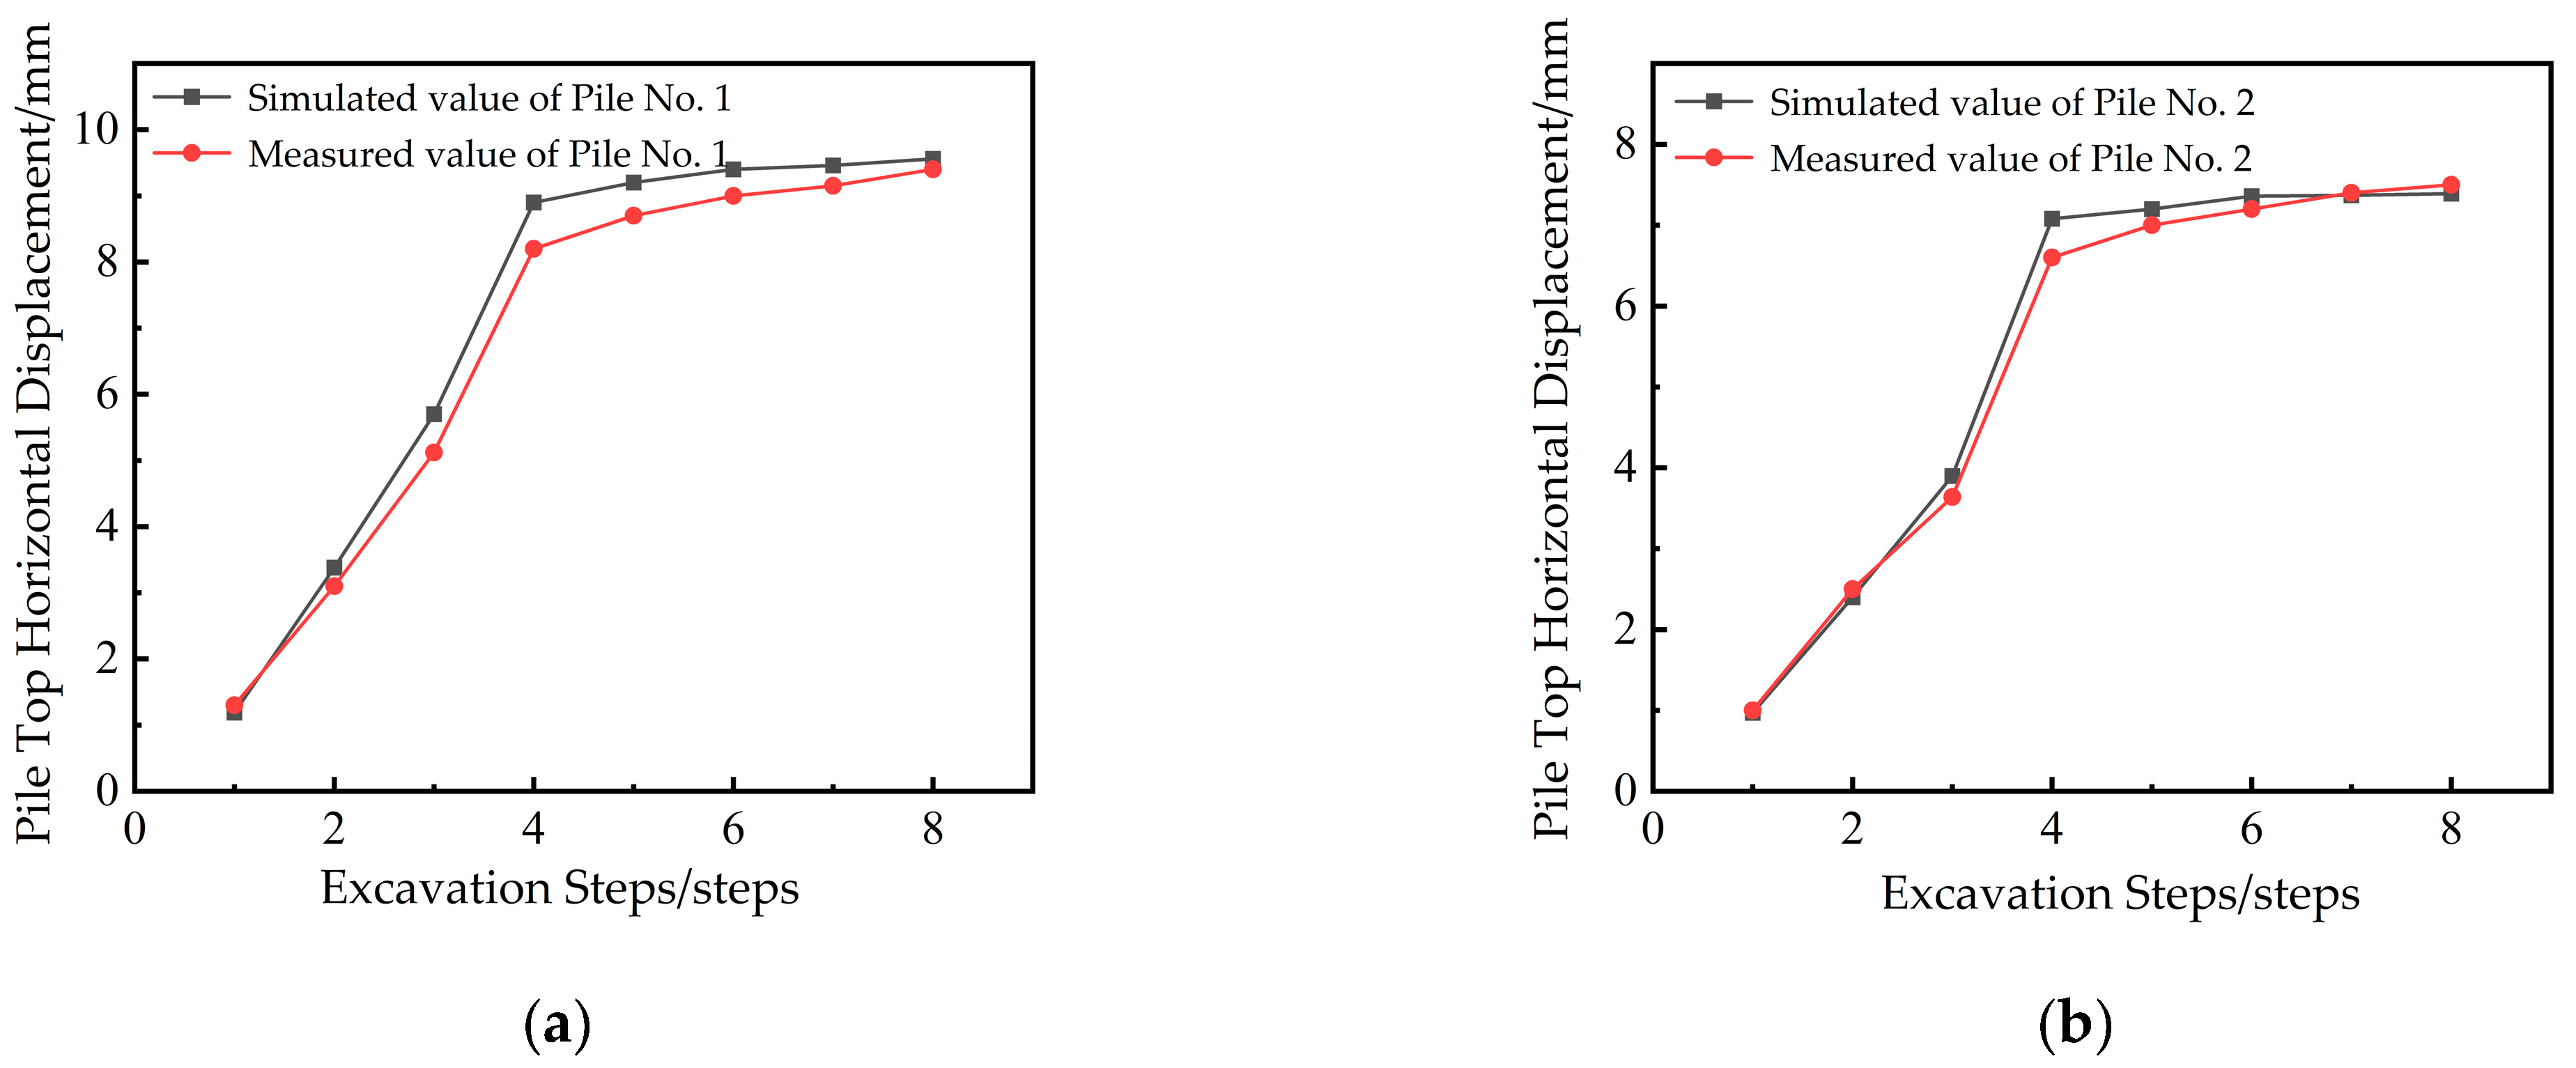
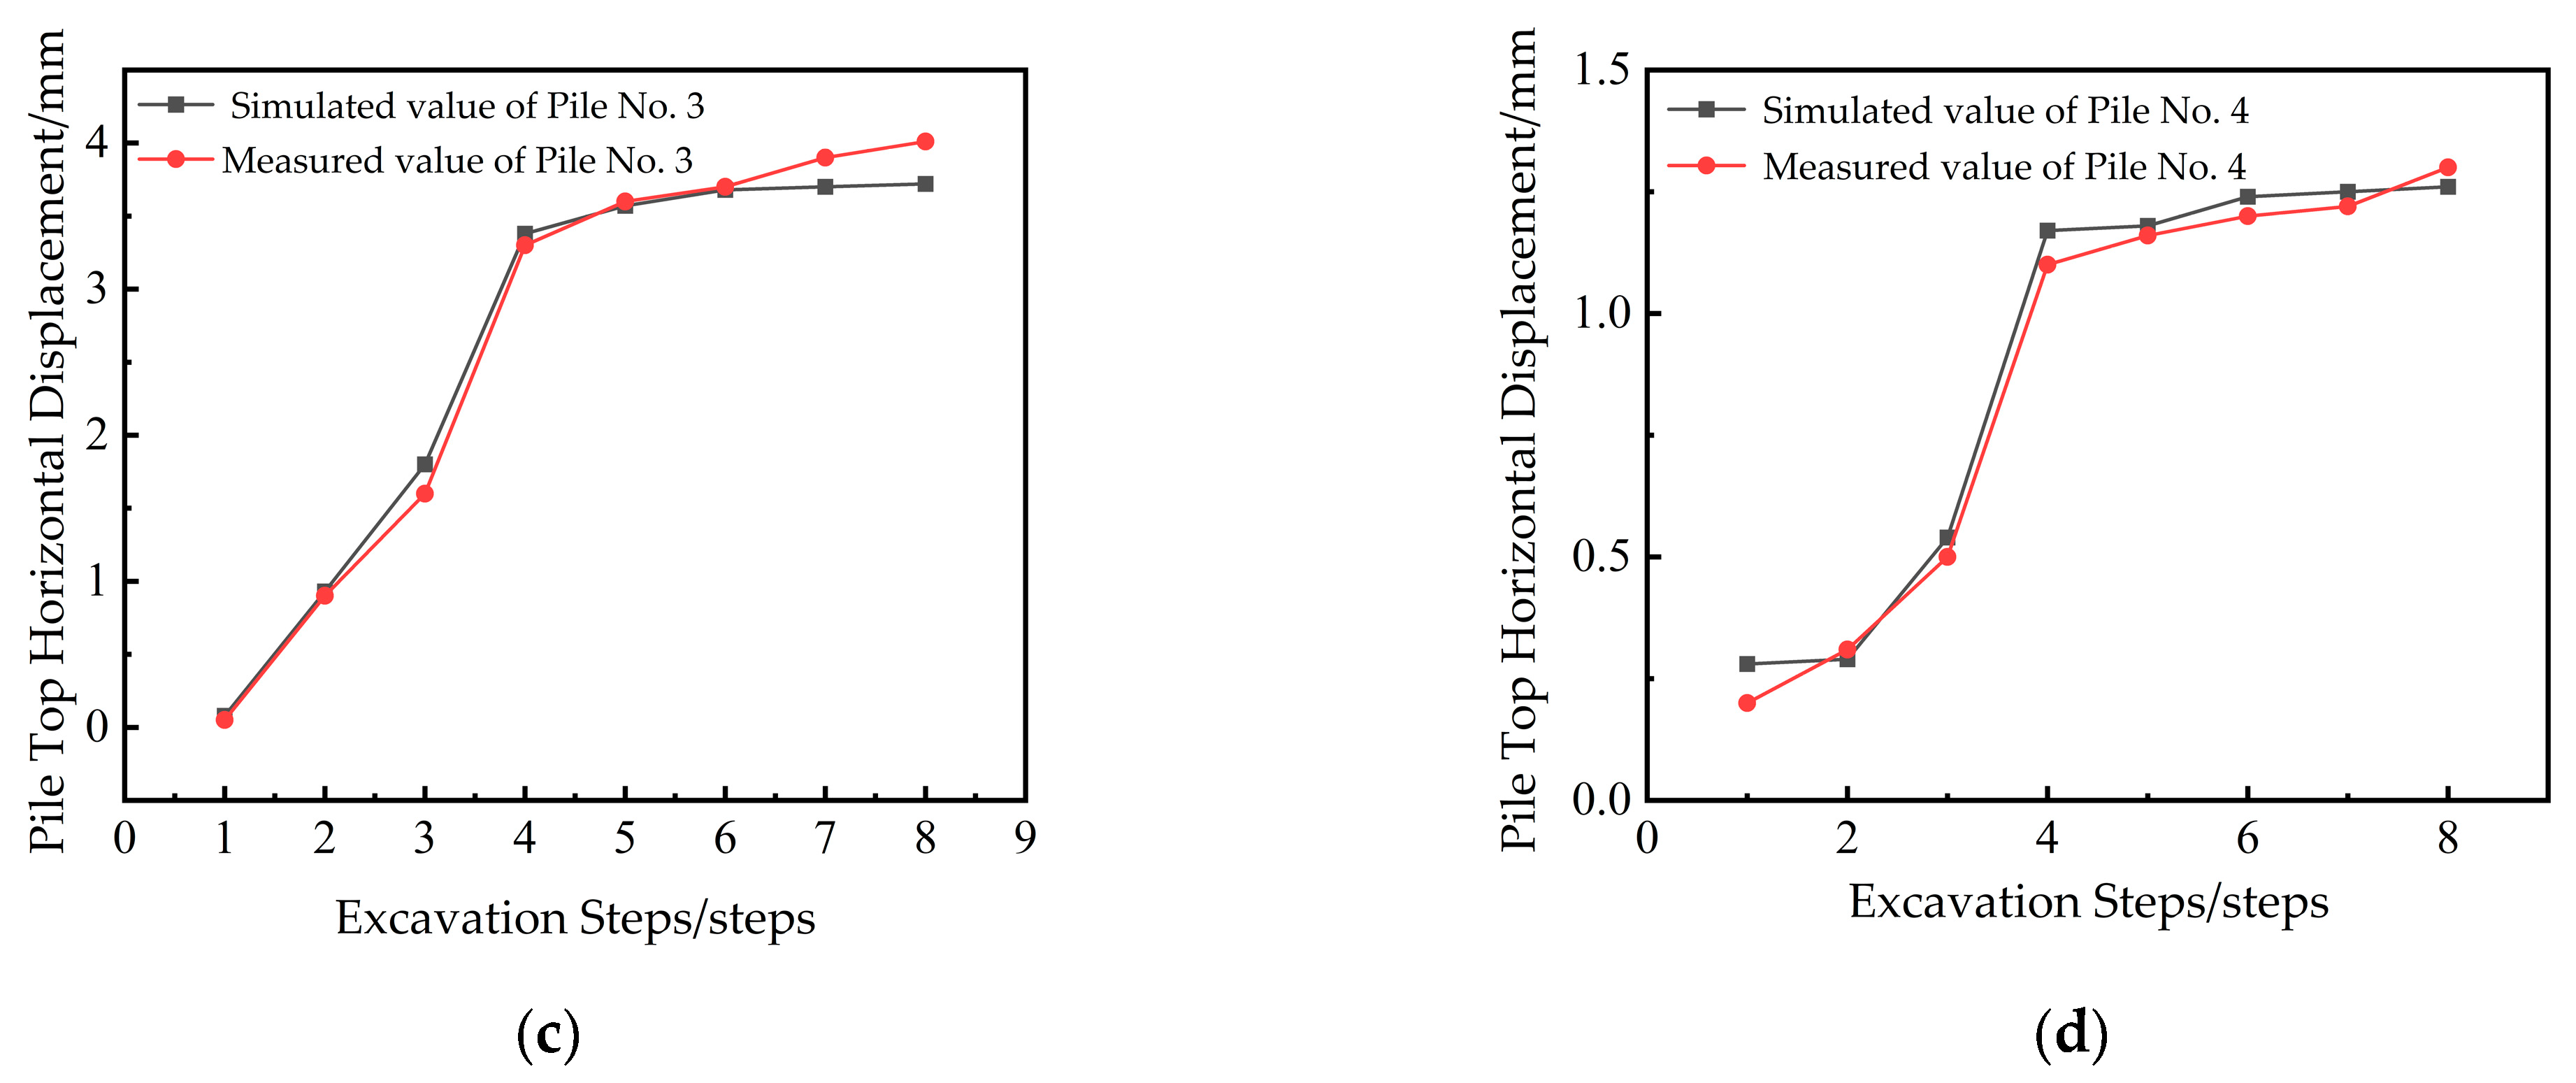
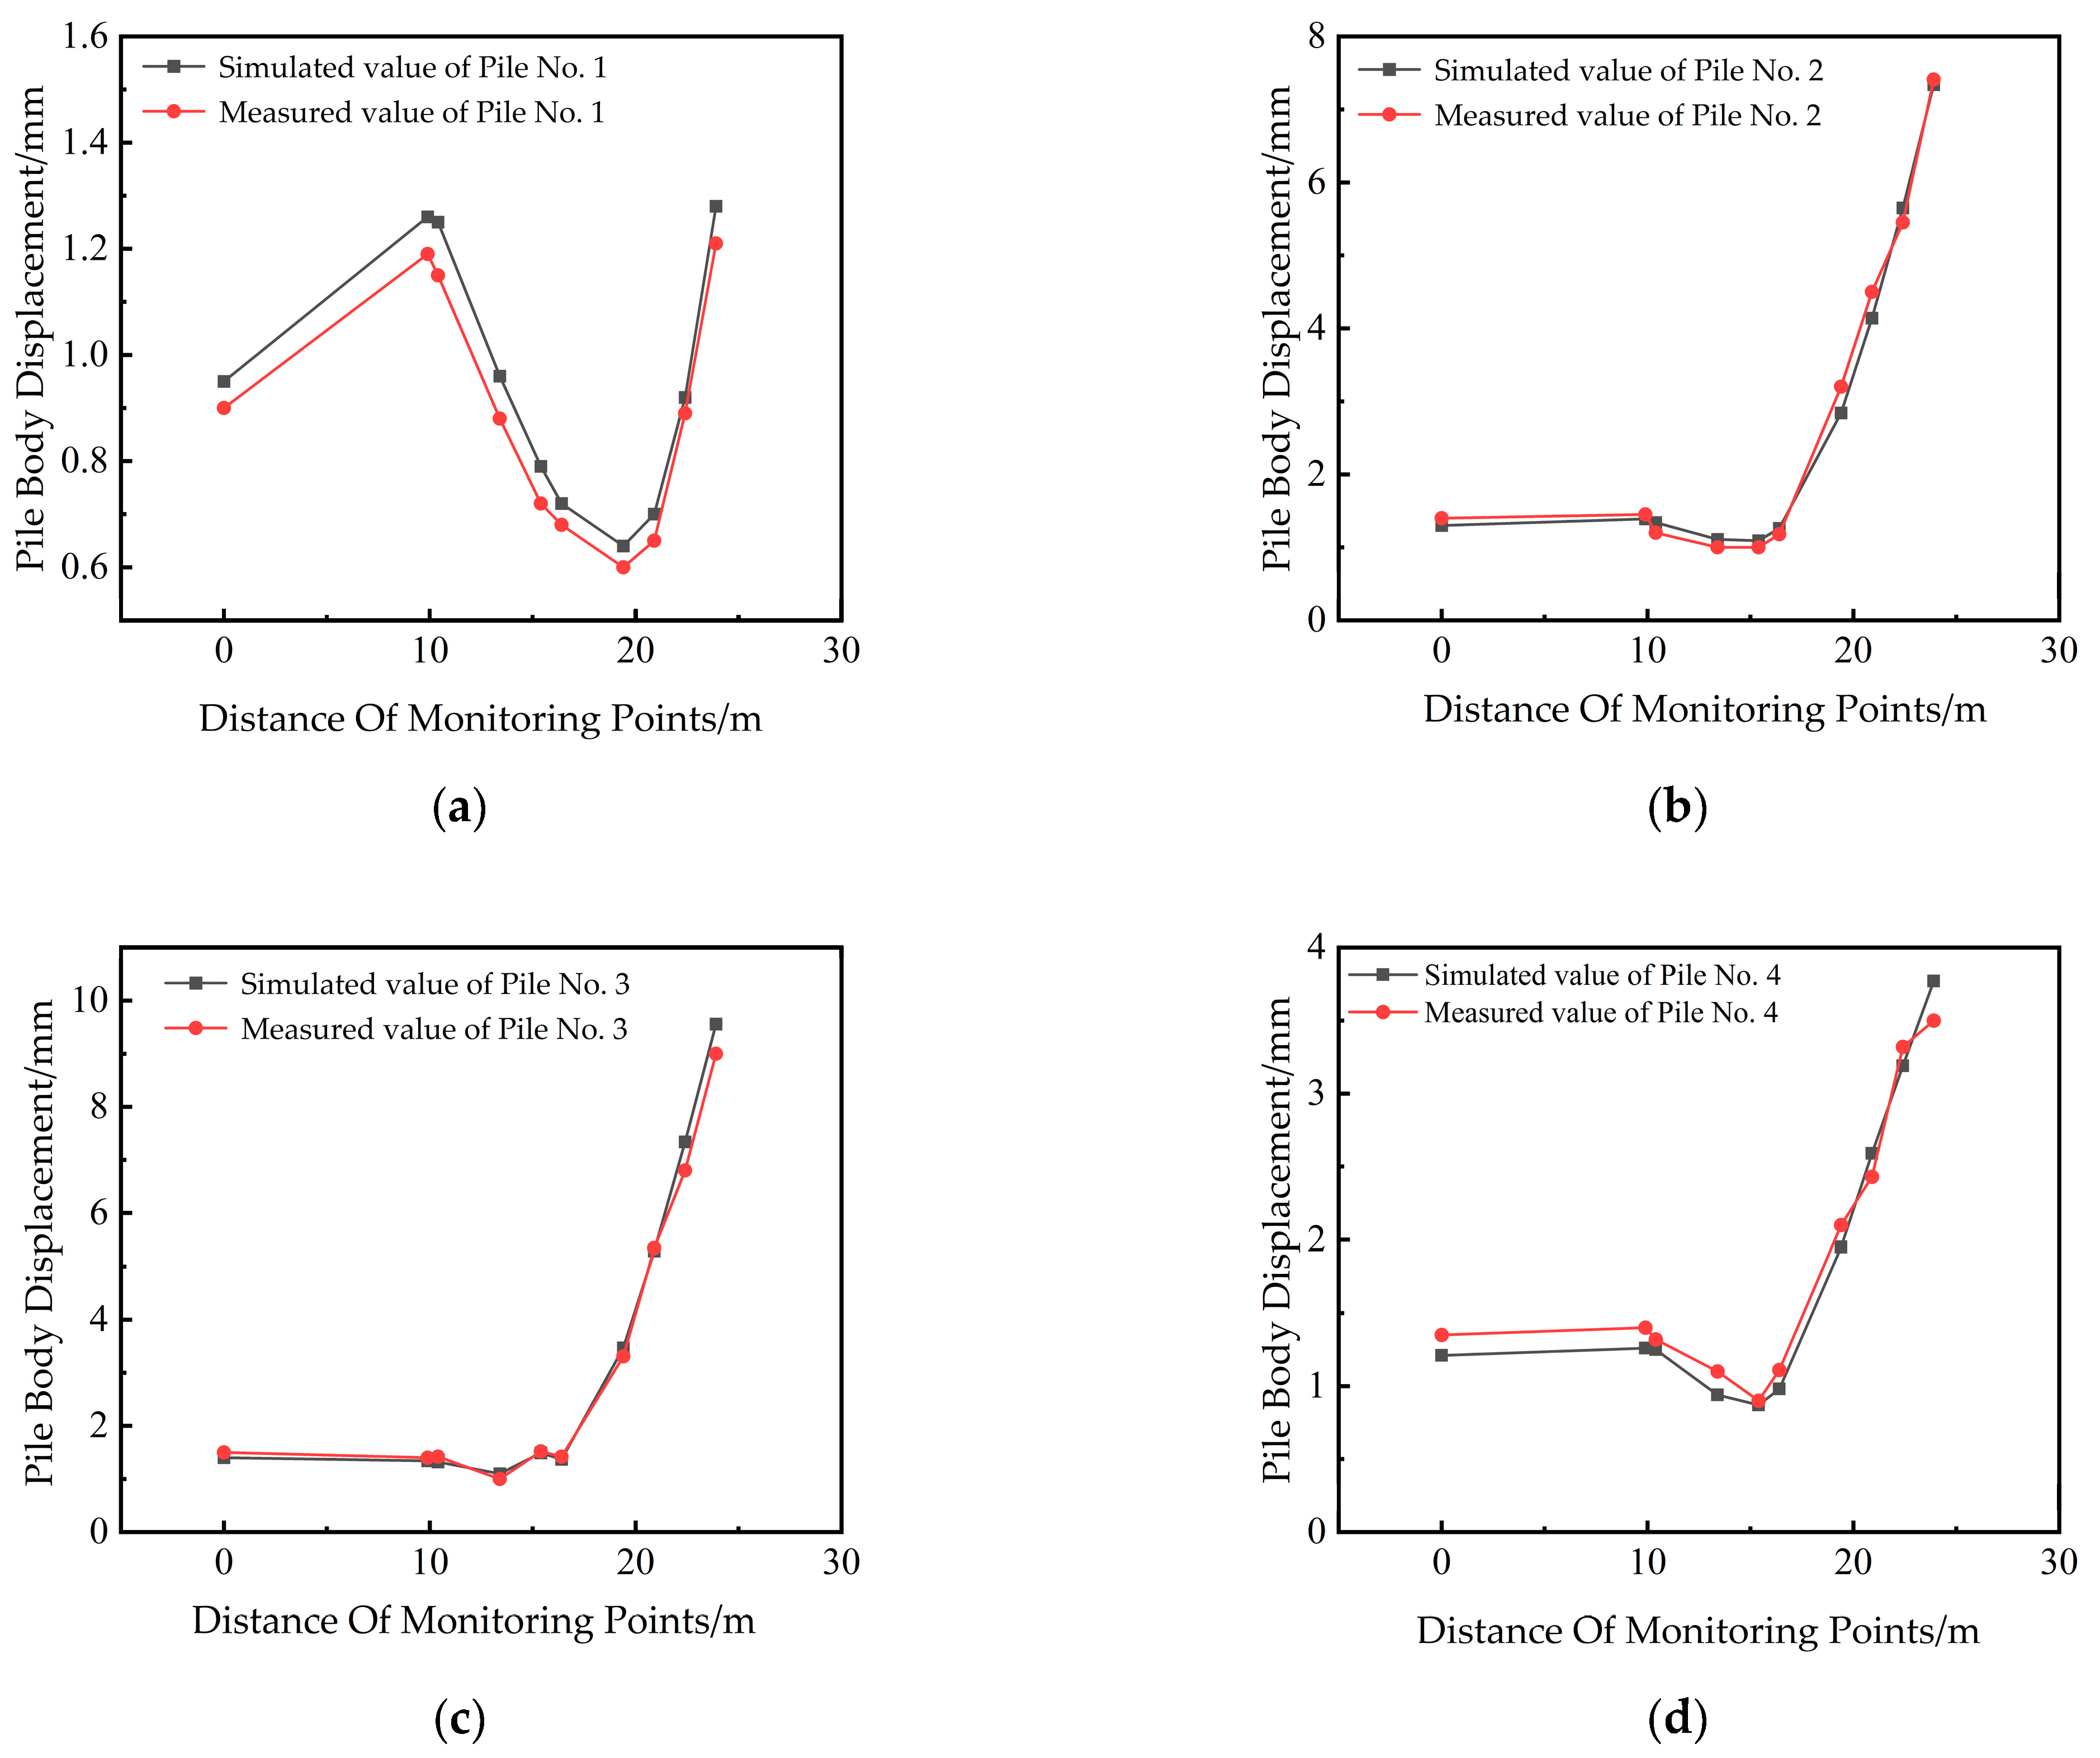
- The numerical simulation of foundation pit surrounding rock displacement showed a maximum relative error of 8% compared with field measurements. At the pit center, the relative error was 3%, and at the eastern point with the largest settlement, the error was 5%. For prestressed anchor cable forces, the maximum relative error was 7.9%. All errors were below 10%, confirming the reliability of the inversion results.
- 4.
- Unlike other studies, this research not only used field displacement data as a validation indicator for parameter inversion but also incorporated measured anchor cable forces. The combination of these two indicators significantly improved the inversion accuracy.
Author Contributions
Funding
Data Availability Statement
Conflicts of Interest
Appendix A. Complete Parameter Level Table
| Geotechnical Parameters | Silty Clay | Mudstone | ||||||||
|---|---|---|---|---|---|---|---|---|---|---|
| Parameters | (MPa) | (°) | (MPa) | (kg/m3) | (MPa) | (°) | (MPa) | (kg/m3) | ||
| Level 1 | 0.0214 | 12.3 | 5.85 | 0.35 | 18.8 | 1 | 35.7 | 1110 | 0.29 | 22.5 |
| Level 2 | 0.0222 | 12.63 | 7.05 | 0.36 | 18.92 | 1.029 | 35.77 | 1212.86 | 0.3 | 22.79 |
| Level 3 | 0.0229 | 12.96 | 8.25 | 0.38 | 19.04 | 1.057 | 35.84 | 1315.71 | 0.31 | 23.07 |
| Level 4 | 0.0237 | 13.29 | 9.45 | 0.39 | 19.16 | 1.086 | 35.91 | 1418.57 | 0.32 | 23.36 |
| Level 5 | 0.0245 | 13.61 | 10.65 | 0.41 | 19.27 | 1.114 | 35.99 | 1521.43 | 0.33 | 23.64 |
| Level 6 | 0.0253 | 13.94 | 11.85 | 0.42 | 19.39 | 1.143 | 36.06 | 1624.29 | 0.34 | 23.93 |
| Level 7 | 0.026 | 14.27 | 13.05 | 0.44 | 19.51 | 1.171 | 36.13 | 1727.14 | 0.35 | 24.21 |
| Level 8 | 0.0268 | 14.6 | 13.8 | 0.45 | 19.63 | 1.2 | 36.2 | 1830 | 0.36 | 24.5 |
Appendix B. Training Samples
| Parameters | ||||||||||
|---|---|---|---|---|---|---|---|---|---|---|
(MPa) | (°) | (MPa) | (kg/m3) | (MPa) | (°) | (MPa) | (kg/m3) | |||
| 1 | 0.0214 | 12.3 | 5.85 | 0.35 | 18.8 | 1 | 35.7 | 1110 | 0.29 | 22.5 |
| 2 | 0.0214 | 12.3 | 5.85 | 0.35 | 18.8 | 1.029 | 35.77 | 1212.86 | 0.3 | 22.79 |
| 3 | 0.0214 | 12.3 | 5.85 | 0.35 | 18.8 | 1.057 | 35.84 | 1315.71 | 0.31 | 23.07 |
| 4 | 0.0214 | 12.3 | 5.85 | 0.35 | 18.8 | 1.086 | 35.91 | 1418.57 | 0.32 | 23.36 |
| 5 | 0.0214 | 12.3 | 5.85 | 0.35 | 18.8 | 1.114 | 35.99 | 1521.43 | 0.33 | 23.64 |
| 6 | 0.0214 | 12.3 | 5.85 | 0.35 | 18.8 | 1.143 | 36.06 | 1624.29 | 0.34 | 23.93 |
| 7 | 0.0214 | 12.3 | 5.85 | 0.35 | 18.8 | 1.171 | 36.13 | 1727.14 | 0.35 | 24.21 |
| 8 | 0.0214 | 12.3 | 5.85 | 0.35 | 18.8 | 1.2 | 36.2 | 1830 | 0.36 | 24.5 |
| 9 | 0.0222 | 12.63 | 7.05 | 0.36 | 18.92 | 1 | 35.7 | 1110 | 0.29 | 22.5 |
| 10 | 0.0222 | 12.63 | 7.05 | 0.36 | 18.92 | 1.029 | 35.77 | 1212.86 | 0.3 | 22.79 |
| 11 | 0.0222 | 12.63 | 7.05 | 0.36 | 18.92 | 1.057 | 35.84 | 1315.71 | 0.31 | 23.07 |
| 12 | 0.0222 | 12.63 | 7.05 | 0.36 | 18.92 | 1.086 | 35.91 | 1418.57 | 0.32 | 23.36 |
| 13 | 0.0222 | 12.63 | 7.05 | 0.36 | 18.92 | 1.114 | 35.99 | 1521.43 | 0.33 | 23.64 |
| 14 | 0.0222 | 12.63 | 7.05 | 0.36 | 18.92 | 1.143 | 36.06 | 1624.29 | 0.34 | 23.93 |
| 15 | 0.0222 | 12.63 | 7.05 | 0.36 | 18.92 | 1.171 | 36.13 | 1727.14 | 0.35 | 24.21 |
| 16 | 0.0222 | 12.63 | 7.05 | 0.36 | 18.92 | 1.2 | 36.2 | 1830 | 0.36 | 24.5 |
| 17 | 0.0229 | 12.96 | 8.25 | 0.38 | 19.04 | 1 | 35.7 | 1110 | 0.29 | 22.5 |
| 18 | 0.0229 | 12.96 | 8.25 | 0.38 | 19.04 | 1.029 | 35.77 | 1212.86 | 0.3 | 22.79 |
| 19 | 0.0229 | 12.96 | 8.25 | 0.38 | 19.04 | 1.057 | 35.84 | 1315.71 | 0.31 | 23.07 |
| 20 | 0.0229 | 12.96 | 8.25 | 0.38 | 19.04 | 1.086 | 35.91 | 1418.57 | 0.32 | 23.36 |
| 21 | 0.0229 | 12.96 | 8.25 | 0.38 | 19.04 | 1.114 | 35.99 | 1521.43 | 0.33 | 23.64 |
| 22 | 0.0229 | 12.96 | 8.25 | 0.38 | 19.04 | 1.143 | 36.06 | 1624.29 | 0.34 | 23.93 |
| 23 | 0.0229 | 12.96 | 8.25 | 0.38 | 19.04 | 1.171 | 36.13 | 1727.14 | 0.35 | 24.21 |
| 24 | 0.0229 | 12.96 | 8.25 | 0.38 | 19.04 | 1.2 | 36.2 | 1830 | 0.36 | 24.5 |
| 25 | 0.0237 | 13.29 | 9.45 | 0.39 | 19.16 | 1 | 35.7 | 1110 | 0.29 | 22.5 |
| 26 | 0.0237 | 13.29 | 9.45 | 0.39 | 19.16 | 1.029 | 35.77 | 1212.86 | 0.3 | 22.79 |
| 27 | 0.0237 | 13.29 | 9.45 | 0.39 | 19.16 | 1.057 | 35.84 | 1315.71 | 0.31 | 23.07 |
| 28 | 0.0237 | 13.29 | 9.45 | 0.39 | 19.16 | 1.086 | 35.91 | 1418.57 | 0.32 | 23.36 |
| 29 | 0.0237 | 13.29 | 9.45 | 0.39 | 19.16 | 1.114 | 35.99 | 1521.43 | 0.33 | 23.64 |
| 30 | 0.0237 | 13.29 | 9.45 | 0.39 | 19.16 | 1.143 | 36.06 | 1624.29 | 0.34 | 23.93 |
| 31 | 0.0237 | 13.29 | 9.45 | 0.39 | 19.16 | 1.171 | 36.13 | 1727.14 | 0.35 | 24.21 |
| 32 | 0.0237 | 13.29 | 9.45 | 0.39 | 19.16 | 1.2 | 36.2 | 1830 | 0.36 | 24.5 |
| 33 | 0.0245 | 13.61 | 10.65 | 0.41 | 19.27 | 1 | 35.7 | 1110 | 0.29 | 22.5 |
| 34 | 0.0245 | 13.61 | 10.65 | 0.41 | 19.27 | 1.029 | 35.77 | 1212.86 | 0.3 | 22.79 |
| 35 | 0.0245 | 13.61 | 10.65 | 0.41 | 19.27 | 1.057 | 35.84 | 1315.71 | 0.31 | 23.07 |
| 36 | 0.0245 | 13.61 | 10.65 | 0.41 | 19.27 | 1.086 | 35.91 | 1418.57 | 0.32 | 23.36 |
| 37 | 0.0245 | 13.61 | 10.65 | 0.41 | 19.27 | 1.114 | 35.99 | 1521.43 | 0.33 | 23.64 |
| 38 | 0.0245 | 13.61 | 10.65 | 0.41 | 19.27 | 1.143 | 36.06 | 1624.29 | 0.34 | 23.93 |
| 39 | 0.0245 | 13.61 | 10.65 | 0.41 | 19.27 | 1.171 | 36.13 | 1727.14 | 0.35 | 24.21 |
| 40 | 0.0245 | 13.61 | 10.65 | 0.41 | 19.27 | 1.2 | 36.2 | 1830 | 0.36 | 24.5 |
| 41 | 0.0253 | 13.94 | 11.85 | 0.42 | 19.39 | 1 | 35.7 | 1110 | 0.29 | 22.5 |
| 42 | 0.0253 | 13.94 | 11.85 | 0.42 | 19.39 | 1.029 | 35.77 | 1212.86 | 0.3 | 22.79 |
| 43 | 0.0253 | 13.94 | 11.85 | 0.42 | 19.39 | 1.057 | 35.84 | 1315.71 | 0.31 | 23.07 |
| 44 | 0.0253 | 13.94 | 11.85 | 0.42 | 19.39 | 1.086 | 35.91 | 1418.57 | 0.32 | 23.36 |
| 45 | 0.0253 | 13.94 | 11.85 | 0.42 | 19.39 | 1.114 | 35.99 | 1521.43 | 0.33 | 23.64 |
| 46 | 0.0253 | 13.94 | 11.85 | 0.42 | 19.39 | 1.143 | 36.06 | 1624.29 | 0.34 | 23.93 |
| 47 | 0.0253 | 13.94 | 11.85 | 0.42 | 19.39 | 1.171 | 36.13 | 1727.14 | 0.35 | 24.21 |
| 48 | 0.0253 | 13.94 | 11.85 | 0.42 | 19.39 | 1.2 | 36.2 | 1830 | 0.36 | 24.5 |
| 49 | 0.026 | 14.27 | 13.05 | 0.44 | 19.51 | 1 | 35.7 | 1110 | 0.29 | 22.5 |
| 50 | 0.026 | 14.27 | 13.05 | 0.44 | 19.51 | 1.029 | 35.77 | 1212.86 | 0.3 | 22.79 |
| 51 | 0.026 | 14.27 | 13.05 | 0.44 | 19.51 | 1.057 | 35.84 | 1315.71 | 0.31 | 23.07 |
| 52 | 0.026 | 14.27 | 13.05 | 0.44 | 19.51 | 1.086 | 35.91 | 1418.57 | 0.32 | 23.36 |
| 53 | 0.026 | 14.27 | 13.05 | 0.44 | 19.51 | 1.114 | 35.99 | 1521.43 | 0.33 | 23.64 |
| 54 | 0.026 | 14.27 | 13.05 | 0.44 | 19.51 | 1.143 | 36.06 | 1624.29 | 0.34 | 23.93 |
| 55 | 0.026 | 14.27 | 13.05 | 0.44 | 19.51 | 1.171 | 36.13 | 1727.14 | 0.35 | 24.21 |
| 56 | 0.026 | 14.27 | 13.05 | 0.44 | 19.51 | 1.2 | 36.2 | 1830 | 0.36 | 24.5 |
| 57 | 0.0268 | 14.6 | 13.8 | 0.45 | 19.63 | 1 | 35.7 | 1110 | 0.29 | 22.5 |
| 58 | 0.0268 | 14.6 | 13.8 | 0.45 | 19.63 | 1.029 | 35.77 | 1212.86 | 0.3 | 22.79 |
| 59 | 0.0268 | 14.6 | 13.8 | 0.45 | 19.63 | 1.057 | 35.84 | 1315.71 | 0.31 | 23.07 |
| 60 | 0.0268 | 14.6 | 13.8 | 0.45 | 19.63 | 1.086 | 35.91 | 1418.57 | 0.32 | 23.36 |
| 61 | 0.0268 | 14.6 | 13.8 | 0.45 | 19.63 | 1.114 | 35.99 | 1521.43 | 0.33 | 23.64 |
| 62 | 0.0268 | 14.6 | 13.8 | 0.45 | 19.63 | 1.143 | 36.06 | 1624.29 | 0.34 | 23.93 |
| 63 | 0.0268 | 14.6 | 13.8 | 0.45 | 19.63 | 1.171 | 36.13 | 1727.14 | 0.35 | 24.21 |
| 64 | 0.0268 | 14.6 | 13.8 | 0.45 | 19.63 | 1.2 | 36.2 | 1830 | 0.36 | 24.5 |
| Measured Displacement (mm) | ||||||||||
|---|---|---|---|---|---|---|---|---|---|---|
| 1 | 2 | 3 | 4 | 5 | 6 | 7 | 8 | 9 | 10 | |
| 1 | 7.62 | 4.39 | 4.74 | 4.97 | 7.14 | 7.11 | 4.88 | 4.32 | 4.35 | 5.79 |
| 2 | 6.95 | 3.97 | 4.29 | 4.5 | 6.47 | 6.46 | 4.42 | 3.9 | 3.94 | 5.25 |
| 3 | 6.59 | 3.75 | 4.06 | 4.25 | 6.15 | 6.14 | 4.21 | 3.71 | 3.74 | 5 |
| 4 | 6.53 | 3.38 | 3.6 | 3.86 | 5.92 | 5.91 | 3.62 | 3.51 | 3.67 | 4.97 |
| 5 | 5.6 | 3.16 | 3.45 | 3.59 | 5.2 | 5.19 | 3.57 | 3.12 | 3.15 | 3.15 |
| 6 | 5.24 | 2.95 | 3.22 | 3.35 | 4.86 | 4.85 | 3.33 | 2.9 | 2.92 | 3.93 |
| 7 | 4.92 | 2.76 | 3.03 | 3.15 | 4.56 | 4.56 | 3.12 | 2.7 | 2.73 | 3.68 |
| 8 | 4.64 | 2.59 | 2.86 | 2.97 | 4.3 | 4.31 | 2.94 | 2.54 | 2.56 | 3.47 |
| 9 | 7.64 | 4.4 | 4.74 | 4.98 | 7.17 | 7.14 | 4.86 | 4.33 | 4.36 | 5.8 |
| 10 | 6.48 | 3.69 | 3.99 | 4.17 | 6.04 | 6.03 | 4.11 | 3.64 | 3.68 | 4.91 |
| 11 | 6.49 | 3.69 | 3.99 | 4.17 | 6.04 | 6.02 | 4.09 | 3.63 | 3.67 | 4.91 |
| 12 | 6.02 | 3.41 | 3.7 | 3.87 | 5.6 | 5.58 | 3.82 | 3.38 | 3.41 | 4.55 |
| 13 | 5.6 | 3.17 | 3.45 | 3.6 | 5.22 | 5.21 | 3.56 | 3.13 | 3.15 | 4.22 |
| 14 | 5.25 | 2.96 | 3.23 | 3.36 | 4.88 | 4.87 | 3.33 | 2.91 | 2.92 | 3.93 |
| 15 | 4.92 | 2.77 | 3.03 | 3.16 | 4.57 | 4.57 | 3.1 | 2.71 | 2.73 | 3.69 |
| 16 | 4.64 | 2.6 | 2.86 | 2.97 | 4.31 | 4.31 | 2.93 | 2.54 | 2.56 | 3.47 |
| 17 | 7.65 | 4.41 | 4.75 | 4.99 | 7.17 | 7.15 | 4.86 | 4.34 | 4.36 | 5.81 |
| 18 | 7.03 | 4.03 | 4.34 | 4.55 | 6.57 | 6.55 | 4.45 | 3.97 | 3.99 | 5.32 |
| 19 | 6.49 | 3.7 | 3.99 | 4.18 | 6.06 | 6.04 | 4.1 | 3.64 | 3.67 | 4.92 |
| 20 | 6.01 | 3.41 | 3.7 | 3.87 | 5.61 | 5.61 | 3.82 | 3.39 | 3.41 | 4.55 |
| 21 | 5.61 | 3.17 | 3.45 | 3.61 | 5.22 | 5.21 | 3.56 | 3.14 | 3.16 | 4.23 |
| 22 | 5.26 | 2.96 | 3.23 | 3.37 | 4.88 | 4.88 | 3.32 | 2.91 | 2.92 | 3.94 |
| 23 | 4.93 | 2.77 | 3.04 | 3.16 | 4.58 | 4.57 | 3.09 | 2.71 | 2.73 | 3.69 |
| 24 | 4.65 | 2.6 | 2.86 | 2.98 | 4.32 | 4.32 | 2.92 | 2.54 | 2.56 | 3.47 |
| 25 | 7.68 | 4.42 | 4.74 | 4.99 | 7.18 | 7.15 | 4.86 | 4.34 | 4.36 | 5.8 |
| 26 | 7.09 | 4.07 | 4.38 | 5.1 | 6.58 | 6.74 | 4.47 | 3.87 | 3.28 | 5.11 |
| 27 | 6.49 | 3.7 | 3.99 | 4.19 | 6.05 | 6.04 | 4.09 | 3.64 | 3.67 | 4.92 |
| 28 | 6.03 | 3.42 | 3.7 | 3.88 | 5.62 | 5.61 | 3.82 | 3.38 | 3.41 | 4.56 |
| 29 | 5.62 | 3.18 | 3.45 | 3.6 | 5.22 | 5.22 | 3.56 | 3.13 | 3.15 | 4.22 |
| 30 | 5.25 | 2.97 | 3.23 | 3.37 | 4.88 | 4.87 | 3.32 | 2.91 | 2.92 | 3.94 |
| 31 | 4.94 | 2.78 | 3.03 | 3.16 | 4.58 | 4.58 | 3.1 | 2.71 | 2.73 | 3.69 |
| 32 | 4.66 | 2.61 | 2.86 | 2.99 | 4.32 | 4.32 | 2.91 | 2.55 | 2.56 | 3.48 |
| 33 | 7.71 | 4.44 | 4.75 | 5 | 7.21 | 7.18 | 4.86 | 4.36 | 4.37 | 5.82 |
| 34 | 7.04 | 4.05 | 4.35 | 4.57 | 6.59 | 6.57 | 4.45 | 3.97 | 3.99 | 5.33 |
| 35 | 6.51 | 3.72 | 4 | 4.2 | 6.08 | 6.06 | 4.11 | 3.66 | 3.68 | 4.93 |
| 36 | 6.03 | 3.43 | 3.71 | 3.89 | 5.63 | 5.62 | 3.82 | 3.39 | 3.42 | 4.56 |
| 37 | 5.63 | 3.19 | 3.46 | 3.62 | 5.22 | 5.22 | 3.55 | 3.14 | 3.16 | 4.24 |
| 38 | 5.26 | 2.98 | 3.23 | 3.39 | 4.91 | 4.9 | 3.32 | 2.91 | 2.93 | 3.95 |
| 39 | 4.95 | 2.79 | 3.04 | 3.18 | 4.59 | 4.59 | 3.09 | 2.72 | 2.73 | 3.7 |
| 40 | 4.66 | 2.62 | 2.87 | 2.99 | 4.34 | 4.34 | 2.91 | 2.55 | 2.56 | 3.48 |
| 41 | 7.71 | 4.06 | 4.35 | 4.58 | 6.6 | 6.58 | 4.45 | 3.98 | 4 | 5.34 |
| 42 | 7.07 | 4.06 | 4.35 | 4.58 | 6.6 | 6.58 | 4.45 | 3.98 | 4 | 5.34 |
| 43 | 6.52 | 3.73 | 4 | 4.21 | 6.08 | 6.06 | 4.1 | 3.66 | 3.68 | 4.94 |
| 44 | 6.05 | 3.44 | 3.71 | 3.9 | 5.64 | 5.63 | 3.82 | 3.39 | 3.41 | 4.57 |
| 45 | 5.64 | 3.2 | 3.45 | 3.63 | 5.24 | 5.23 | 3.56 | 3.14 | 3.16 | 4.24 |
| 46 | 5.28 | 2.98 | 3.24 | 3.39 | 4.9 | 4.9 | 3.31 | 2.92 | 2.93 | 3.95 |
| 47 | 4.95 | 2.79 | 3.04 | 3.18 | 4.61 | 4.61 | 3.09 | 2.72 | 2.73 | 3.7 |
| 48 | 4.66 | 2.62 | 2.87 | 3 | 4.34 | 4.34 | 2.91 | 2.55 | 2.56 | 3.49 |
| 49 | 4.61 | 2.51 | 2.86 | 3 | 4.31 | 4.31 | 2.9 | 2.54 | 2.5 | 3.38 |
| 50 | 7.06 | 4.06 | 4.34 | 4.58 | 6.61 | 6.59 | 4.44 | 3.98 | 3.99 | 5.34 |
| 51 | 6.53 | 3.74 | 4.01 | 4.22 | 6.08 | 6.06 | 4.11 | 3.67 | 3.7 | 4.94 |
| 52 | 6.06 | 3.45 | 3.71 | 3.9 | 5.64 | 5.62 | 3.81 | 3.39 | 3.42 | 4.57 |
| 53 | 5.63 | 3.2 | 3.45 | 3.63 | 5.25 | 5.24 | 3.55 | 3.14 | 3.16 | 4.24 |
| 54 | 5.28 | 2.99 | 3.23 | 3.39 | 4.91 | 4.9 | 3.31 | 2.91 | 2.93 | 3.95 |
| 55 | 4.95 | 2.8 | 3.04 | 3.18 | 4.61 | 4.6 | 3.08 | 2.72 | 2.73 | 3.7 |
| 56 | 4.67 | 2.63 | 2.87 | 3 | 4.35 | 4.34 | 2.9 | 2.55 | 2.56 | 3.48 |
| 57 | 7.71 | 4.47 | 4.77 | 5.04 | 7.24 | 7.21 | 4.86 | 4.36 | 4.37 | 5.83 |
| 58 | 6.84 | 3.9 | 4.18 | 4.42 | 6.38 | 6.36 | 4.26 | 3.82 | 3.84 | 5.16 |
| 59 | 6.55 | 3.74 | 4.01 | 4.23 | 6.1 | 6.09 | 4.11 | 3.67 | 3.7 | 4.95 |
| 60 | 6.06 | 3.46 | 3.72 | 3.91 | 5.66 | 5.64 | 3.83 | 3.41 | 3.43 | 4.59 |
| 61 | 5.65 | 3.22 | 3.47 | 3.64 | 5.27 | 5.26 | 3.55 | 3.15 | 3.17 | 4.25 |
| 62 | 5.29 | 3 | 3.24 | 3.41 | 4.93 | 4.92 | 3.31 | 2.93 | 2.94 | 3.96 |
| 63 | 4.96 | 2.81 | 3.05 | 3.2 | 4.63 | 4.62 | 3.09 | 2.73 | 2.74 | 3.71 |
| 64 | 4.68 | 2.64 | 2.88 | 3.01 | 4.37 | 4.36 | 2.91 | 2.56 | 2.57 | 3.49 |
| Internal Forces of Anchorage Systems/kN | ||||
|---|---|---|---|---|
| 1 | 2 | 3 | 4 | |
| 1 | 178 | 365 | 383 | 432 |
| 2 | 180 | 368 | 384 | 436 |
| 3 | 184 | 370 | 383 | 437 |
| 4 | 186 | 371 | 387 | 443 |
| 5 | 189 | 374 | 392 | 446 |
| 6 | 193 | 378 | 391 | 447 |
| 7 | 195 | 384 | 403 | 451 |
| 8 | 198 | 392 | 403 | 452 |
| 9 | 179 | 366 | 384 | 434 |
| 10 | 182 | 366 | 384 | 435 |
| 11 | 185 | 367 | 386 | 435 |
| 12 | 190 | 368 | 387 | 437 |
| 13 | 190 | 370 | 390 | 439 |
| 14 | 194 | 373 | 391 | 443 |
| 15 | 198 | 376 | 393 | 445 |
| 16 | 200 | 380 | 396 | 448 |
| 17 | 182 | 366 | 384 | 435 |
| 18 | 182 | 368 | 386 | 437 |
| 19 | 183 | 368 | 387 | 438 |
| 20 | 186 | 369 | 390 | 439 |
| 21 | 189 | 370 | 394 | 439 |
| 22 | 194 | 371 | 397 | 443 |
| 23 | 197 | 372 | 402 | 447 |
| 24 | 201 | 373 | 403 | 449 |
| 25 | 181 | 367 | 385 | 436 |
| 26 | 184 | 368 | 387 | 438 |
| 27 | 187 | 367 | 388 | 438 |
| 28 | 190 | 366 | 392 | 440 |
| 29 | 194 | 368 | 394 | 440 |
| 30 | 196 | 370 | 398 | 441 |
| 31 | 199 | 371 | 401 | 444 |
| 32 | 202 | 372 | 403 | 446 |
| 33 | 182 | 367 | 385 | 436 |
| 34 | 186 | 368 | 386 | 439 |
| 35 | 188 | 369 | 386 | 440 |
| 36 | 192 | 370 | 389 | 441 |
| 37 | 196 | 371 | 396 | 444 |
| 38 | 198 | 372 | 399 | 448 |
| 39 | 200 | 372 | 399 | 451 |
| 40 | 202 | 373 | 401 | 452 |
| 41 | 183 | 365 | 387 | 437 |
| 42 | 187 | 368 | 390 | 439 |
| 43 | 189 | 368 | 391 | 441 |
| 44 | 193 | 367 | 392 | 443 |
| 45 | 196 | 369 | 393 | 447 |
| 46 | 199 | 370 | 394 | 448 |
| 47 | 201 | 371 | 397 | 450 |
| 48 | 201 | 373 | 402 | 453 |
| 49 | 184 | 367 | 388 | 438 |
| 50 | 187 | 368 | 390 | 440 |
| 51 | 190 | 368 | 392 | 440 |
| 52 | 194 | 370 | 395 | 441 |
| 53 | 197 | 371 | 394 | 444 |
| 54 | 199 | 371 | 398 | 447 |
| 55 | 201 | 372 | 402 | 450 |
| 56 | 201 | 373 | 404 | 452 |
| 57 | 185 | 367 | 388 | 432 |
| 58 | 189 | 367 | 394 | 434 |
| 59 | 192 | 368 | 396 | 437 |
| 60 | 195 | 369 | 397 | 443 |
| 61 | 199 | 370 | 398 | 446 |
| 62 | 199 | 372 | 398 | 447 |
| 63 | 201 | 373 | 401 | 451 |
| 64 | 202 | 373 | 403 | 452 |
References
- Zheng, L.H.; Wang, D.; Sun, J.Q.; Wang, Q.Q. Analysis of the impact of deep foundation pit construction based on the semi-reversed method on subway station deformation. Build. Struct. 2021, 51 (Supp. S1), 1935–1939. [Google Scholar]
- Wang, C.H.; Wu, Z.X.; Wang, K.; Tang, D.; Ma, C. Random mechanics-Bayesian method for calibrating CPTU data of deep soft soil parameters in Shanghai. J. Geotech. Eng. 2023, 45, 75–84. [Google Scholar]
- Gong, S.; Yang, Z.; Zhang, G.P.; Luo, X.; Chen, X.Z. Study on the tunnel geotechnical mechanical parameter analysis method based on the optimized BP neural network algorithm. Northwest Water Power 2022, 5, 133–137. [Google Scholar]
- Ma, H.H.; Yuan, S.; Zhang, Z.; Tian, Y.; Dong, S. Application of soil parameter inversion method based on BP neural network in foundation pit deformation prediction. Appl. Geophys. 2023, 20, 299–309. [Google Scholar] [CrossRef]
- Zhou, Y.; Wu, S.C.; Jiao, J.J.; Zhang, X.P. Study on the mesoscopic mechanical parameters of geotechnical materials based on BP neural network. Geotech. Mech. 2011, 32, 3821–3826. [Google Scholar]
- Li, B.Y.; Si, M.J. Inversion analysis of foundation pit horizontal displacement based on MEC-BP neural network. J. Railw. Sci. Eng. 2021, 18, 1764–1772. [Google Scholar]
- Jiang, W.; Ouyang, Y.; Yan, J.Z.; Wang, Z.; Liu, L. Inverse iterative correction inversion method for the shear strength of slope geotechnical materials. Geotech. Mech. 2022, 43, 2287–2295. [Google Scholar]
- Zhang, K.Y.; Su, Z.K.; Nie, M.J.; Guo, K.; Shen, X. Soil parameter inversion and deformation prediction method based on ISSA-ELM. J. Appl. Basic Eng. Sci. 2024, 32, 1434–1448. [Google Scholar]
- Wang, Y.; He, Z.; Yang, Y.; Ding, D.; Ding, F.; Dang, X.-W. Multi-parameter inversion of AIEM by using bi-directional deep neural network. Remote Sens. 2022, 14, 3302. [Google Scholar] [CrossRef]
- Wang, M.; Wang, E.; Liu, X.; Wang, C. Topological graph representation of stratigraphic properties of spatial-geological characteristics and compression modulus prediction by mechanism-driven learning. Comput. Geotech. 2023, 153, 105112. [Google Scholar] [CrossRef]
- Vahab, M.; Shahbodagh, B.; Haghighat, E.; Khalili, N. Application of Physics-Informed Neural Networks for forward and inverse analysis of pile–soil interaction. Int. J. Solids Struct. 2023, 277, 112319. [Google Scholar] [CrossRef]
- Hosni, I.; Farah, L.B.; Farah, I.R.; Bennaceur, R.; Naceur, M.S. A Genetic Algorithm for the Retrieval of Soil Multi-scale Roughness and Moisture Parameters. In Proceedings of the 2019 PhotonIcs & Electromagnetics Research Symposium-Spring (PIERS-Spring), Rome, Italy, 17–20 June 2019; IEEE: Piscataway, NJ, USA, 2019; pp. 1074–1080. [Google Scholar]
- Lin, R.; Wei, Z.; Hu, R.; Chen, H.; Li, Y.; Zhang, B.; Wang, F.; Hu, D. Construction and validation of surface soil moisture inversion model based on remote sensing and neural network. Atmosphere 2024, 15, 647. [Google Scholar] [CrossRef]
- Pan, S.Y.; Cheng, J.; Li, T.C. The forward and inversion analysis of high rock-fill dam during construction period using the node-based smoothed point interpolation method. Eng. Comput. 2020, 37, 1531–1555. [Google Scholar] [CrossRef]
- Zhou, C.; Gao, B.; Yan, B.; Zhu, W.; Ye, G. A combined machine learning/search algorithm-based method for the identification of constitutive parameters from laboratory tests and in-situ tests. Comput. Geotech. 2024, 170, 106268. [Google Scholar] [CrossRef]
- Guo, Z.Q.; Yang, S.S.; Li, Y.B.; Yang, H.H.; Pang, X.; Luo, B.S. Inversion of geotechnical parameters for metro shield tunnel sites based on PSO-BP neural network. J. Taiyuan Univ. Technol. 2020, 51, 171–176. [Google Scholar]
- Li, Q.; Cheng, F.; Zhang, X. Numerical simulation and deformation prediction of deep pit based on PSO-BP neural network inversion of soil parameters. Sensors 2024, 24, 2959. [Google Scholar] [CrossRef]
- Li, Y.; Zhou, L.; Gao, P.; Yang, B.; Han, Y.; Lian, C. Short-term power generation forecasting of a photovoltaic plant based on PSO-BP and GA-BP neural networks. Front. Energy Res. 2022, 9, 824691. [Google Scholar] [CrossRef]
- Yin, Y.T.; Ma, J.; Bai, Z.T.; Lu, W.; Mao, X.F.; Ni, N.; Li, D.B. Intelligent prediction of soil site anchorage force based on improved PSO-BP neural network. J. Mech. 2025, 57, 1–17. [Google Scholar]
- Li, X.; Jia, C.; Zhu, X.; Zhao, H.; Gao, J. Investigation on the deformation mechanism of the full-section tunnel excavation in the complex geological environment based on the PSO-BP neural network. Environ. Earth Sci. 2023, 82, 326. [Google Scholar] [CrossRef]
- Zhang, J.; Wang, Y.; Niu, F.; Zhang, H.; Li, S.; Wang, Y. Parameterization of multi-angle shaker based on PSO-BP neural network. Minerals 2023, 13, 929. [Google Scholar] [CrossRef]
- Zhou, X. Research on Insurance Rate Determination for Highway Engineering Based on PSO-BP Neural Network. Master’s Thesis, Hunan University, Changsha, China, 2019. [Google Scholar]
- Tian, H.; Chen, W.; Yang, D.; Dai, Y.; Yang, J. Application of the orthogonal design method in geotechnical parameter back analysis for underground structures. Bull. Eng. Geol. Environ. 2016, 75, 239–249. [Google Scholar] [CrossRef]
- Hao, J.; Wang, B. Parameter Sensitivity Analysis on Deformation of Composite Soil-Nailed Wall Using Artificial Neural Networks and Orthogonal Experiment. Math. Probl. Eng. 2014, 2014, 502362. [Google Scholar] [CrossRef]
- Liu, R.J.; Zhang, Y.W.; Wen, C.W.; Tang, J. Study on orthogonal experimental design and analysis methods. Exp. Technol. Manag. 2010, 27, 52–55. [Google Scholar]
- Liu, W.; Chen, Y.F.; Hu, R.; Zhou, C.B. Inversion analysis of rock mass permeability characteristics based on the unstable seepage process. J. Rock Mech. Eng. 2015, 34, 362–373. [Google Scholar]
- Chen, W.B.; Sun, Y.S.; Wei, H.W.; Li, J. Soil parameter inversion and deformation prediction under deep foundation pit support. In Proceedings of the 2022 Industrial Building Academic Exchange Conference (Volume II), Beijing, China, 14 October 2022; pp. 301–305. [Google Scholar]
- Yang, S.J.; Chen, K. Study on the correlation between BP neural network performance and hidden layer structure. J. Ningbo Univ. (Nat. Sci. Ed.) 2013, 26, 48–52. [Google Scholar]
- Jiang, X.T.; Zhang, X.W.; Lü, Y.H.; Li, R.; Jiang, H. Current status and future prospects of machine learning in geotechnical engineering. Rock Soil Mech. 2025, 46 (Suppl. S1), 419–436. [Google Scholar]





| Geotechnical Parameters | Silty Clay | Mudstone | |||||||||
|---|---|---|---|---|---|---|---|---|---|---|---|
| (MPa) | (°) | (MPa) | (kg/m3) | (MPa) | (°) | (MPa) | (kg/m3) | ||||
| Upper Limit | 0.0214 | 12.3 | 5.85 | 0.35 | 18.8 | 1 | 35.7 | 1110 | 0.29 | 22.5 | |
| Lower Limit | 0.0268 | 14.6 | 13.8 | 0.45 | 19.63 | 1.2 | 36.2 | 1830 | 0.36 | 24.5 | |
| Geotechnical Parameters | Silty Clay | Mudstone | ||||||||
|---|---|---|---|---|---|---|---|---|---|---|
| Parameters | (MPa) | (°) | (MPa) | (kg/m3) | (MPa) | (°) | (MPa) | (kg/m3) | ||
| Level 1 | 0.0214 | 12.3 | 5.85 | 0.35 | 18.8 | 1 | 35.7 | 1110 | 0.29 | 22.5 |
| Level 8 | 0.0268 | 14.6 | 13.8 | 0.45 | 19.63 | 1.2 | 36.2 | 1830 | 0.36 | 24.5 |
| Displacement Correlation | Anchor Cable Force Correlation | Overall Correlation | |
|---|---|---|---|
| 1 | 0.9754 | 0.9697 | 0.9726 |
| 2 | 0.9745 | 0.9693 | 0.9719 |
| 3 | 0.9767 | 0.9708 | 0.9737 |
| 4 | 0.9649 | 0.9743 | 0.9696 |
| 5 | 0.9746 | 0.9686 | 0.9716 |
| 6 | 0.9748 | 0.9693 | 0.9720 |
| 7 | 0.9741 | 0.9712 | 0.9726 |
| 8 | 0.9745 | 0.9697 | 0.9721 |
| 9 | 0.9745 | 0.9697 | 0.9721 |
| 10 | 0.9748 | 0.9693 | 0.9720 |
| Parameters | ||||||||||
|---|---|---|---|---|---|---|---|---|---|---|
(MPa) | (°) | (MPa) | (kg/m3) | (MPa) | (°) | (MPa) | (kg/m3) | |||
| 1 | 0.0214 | 12.3 | 5.85 | 0.35 | 18.8 | 1 | 35.7 | 1110 | 0.29 | 22.5 |
| 9 | 0.0222 | 12.63 | 7.05 | 0.36 | 18.92 | 1 | 35.7 | 1110 | 0.29 | 22.5 |
| 17 | 0.0229 | 12.96 | 8.25 | 0.38 | 19.04 | 1 | 35.7 | 1110 | 0.29 | 22.5 |
| 25 | 0.0237 | 13.29 | 9.45 | 0.39 | 19.16 | 1 | 35.7 | 1110 | 0.29 | 22.5 |
| 33 | 0.0245 | 13.61 | 10.65 | 0.41 | 19.27 | 1 | 35.7 | 1110 | 0.29 | 22.5 |
| 41 | 0.0253 | 13.94 | 11.85 | 0.42 | 19.39 | 1 | 35.7 | 1110 | 0.29 | 22.5 |
| 49 | 0.026 | 14.27 | 13.05 | 0.44 | 19.51 | 1 | 35.7 | 1110 | 0.29 | 22.5 |
| 57 | 0.0268 | 14.6 | 13.8 | 0.45 | 19.63 | 1 | 35.7 | 1110 | 0.29 | 22.5 |
| Measured Displacement (mm) | ||||||||||
|---|---|---|---|---|---|---|---|---|---|---|
| 1 | 2 | 3 | 4 | 5 | 6 | 7 | 8 | 9 | 10 | |
| 1 | 7.62 | 4.39 | 4.74 | 4.97 | 7.14 | 7.11 | 4.88 | 4.32 | 4.35 | 5.79 |
| 9 | 7.64 | 4.4 | 4.74 | 4.98 | 7.17 | 7.14 | 4.86 | 4.33 | 4.36 | 5.8 |
| 17 | 7.65 | 4.41 | 4.75 | 4.99 | 7.17 | 7.15 | 4.86 | 4.34 | 4.36 | 5.81 |
| 25 | 7.68 | 4.42 | 4.74 | 4.99 | 7.18 | 7.15 | 4.86 | 4.34 | 4.36 | 5.8 |
| 32 | 4.66 | 2.61 | 2.86 | 2.99 | 4.32 | 4.32 | 2.91 | 2.55 | 2.56 | 3.48 |
| 40 | 4.66 | 2.62 | 2.87 | 2.99 | 4.34 | 4.34 | 2.91 | 2.55 | 2.56 | 3.48 |
| 48 | 4.66 | 2.62 | 2.87 | 3 | 4.34 | 4.34 | 2.91 | 2.55 | 2.56 | 3.49 |
| 56 | 4.67 | 2.63 | 2.87 | 3 | 4.35 | 4.34 | 2.9 | 2.55 | 2.56 | 3.48 |
| 64 | 4.68 | 2.64 | 2.88 | 3.01 | 4.37 | 4.36 | 2.91 | 2.56 | 2.57 | 3.49 |
| Internal Forces of Anchorage Systems/kN | ||||
|---|---|---|---|---|
| 1 | 2 | 3 | 4 | |
| 1 | 178 | 365 | 383 | 432 |
| 9 | 179 | 366 | 384 | 434 |
| 17 | 182 | 366 | 384 | 435 |
| 25 | 181 | 367 | 385 | 436 |
| 33 | 182 | 367 | 385 | 436 |
| 41 | 183 | 365 | 387 | 437 |
| 49 | 184 | 367 | 388 | 438 |
| 57 | 185 | 367 | 388 | 432 |
| Identification Number | Empirical Value/mm |
|---|---|
| 1 | 2.8 |
| 2 | 2.3 |
| 3 | 3.3 |
| 4 | 3.9 |
| 5 | 1.6 |
| 6 | 1.3 |
| 7 | 4.4 |
| 8 | 3.5 |
| 9 | 4.1 |
| 10 | 3.9 |
| Identification Number | Empirical Value/mm |
|---|---|
| 1 | 185 |
| 2 | 400 |
| 3 | 370 |
| 4 | 442 |
| Geotechnical Parameters | Silty Clay | Mudstone | ||||||||
|---|---|---|---|---|---|---|---|---|---|---|
| (MPa) | (°) | (MPa) | (kg/m3) | (MPa) | (°) | (MPa) | (kg/m3) | |||
| 0.0214 | 13.37 | 9.70 | 0.44 | 18.86 | 1.12 | 36.13 | 1433.57 | 0.36 | 24.32 | |
| Geotechnical Parameters | Silty Clay | Mudstone | ||||||||
|---|---|---|---|---|---|---|---|---|---|---|
| (MPa) | (°) | (MPa) | (kg/m3) | (MPa) | (°) | (MPa) | (kg/m3) | |||
| 0.0220 | 14.22 | 8.35 | 0.41 | 19.51 | 1.2 | 35.88 | 1624.29 | 0.32 | 23.05 | |
| Identification Number | Finite Difference Numerical Simulation/mm | Empirical Value/mm |
|---|---|---|
| W5 | 4.10 | 3.80 |
| W10 | 3.39 | 3.20 |
| W15 | 4.21 | 4.30 |
| W25 | 4.22 | 4.40 |
| W37 | 4.68 | 4.90 |
| W17 | 5.30 | 5.80 |
| W21 | 6.75 | 6.60 |
| W32 | 0.28 | 0.30 |
| Identification Number | Finite Difference Numerical Simulation/mm | Empirical Value/mm |
|---|---|---|
| W5 | 4.23 | 3.80 |
| W10 | 3.63 | 3.20 |
| W15 | 4.60 | 4.30 |
| W25 | 4.01 | 4.40 |
| W37 | 5.53 | 4.90 |
| W17 | 4.92 | 5.80 |
| W21 | 6.10 | 6.60 |
| W32 | 0.22 | 0.30 |
| Identification Number | Finite Difference Numerical Simulation/KN | Empirical Value/KN |
|---|---|---|
| 1 | 340 | 315 |
| 2 | 337 | 326 |
Disclaimer/Publisher’s Note: The statements, opinions and data contained in all publications are solely those of the individual author(s) and contributor(s) and not of MDPI and/or the editor(s). MDPI and/or the editor(s) disclaim responsibility for any injury to people or property resulting from any ideas, methods, instructions or products referred to in the content. |
© 2025 by the authors. Licensee MDPI, Basel, Switzerland. This article is an open access article distributed under the terms and conditions of the Creative Commons Attribution (CC BY) license (https://creativecommons.org/licenses/by/4.0/).
Share and Cite
Li, G.; Xiao, W.; Liang, Y.; Gu, Q.; Jiang, J.; Meng, W.; Zhou, Y. Inversion of Physical and Mechanical Parameters of Surrounding Rock Mass in Foundation Pits Using a PSO-BP Neural Network. Buildings 2025, 15, 3499. https://doi.org/10.3390/buildings15193499
Li G, Xiao W, Liang Y, Gu Q, Jiang J, Meng W, Zhou Y. Inversion of Physical and Mechanical Parameters of Surrounding Rock Mass in Foundation Pits Using a PSO-BP Neural Network. Buildings. 2025; 15(19):3499. https://doi.org/10.3390/buildings15193499
Chicago/Turabian StyleLi, Gang, Wei Xiao, Yanlin Liang, Qiyin Gu, Junxin Jiang, Wei Meng, and Yuanfu Zhou. 2025. "Inversion of Physical and Mechanical Parameters of Surrounding Rock Mass in Foundation Pits Using a PSO-BP Neural Network" Buildings 15, no. 19: 3499. https://doi.org/10.3390/buildings15193499
APA StyleLi, G., Xiao, W., Liang, Y., Gu, Q., Jiang, J., Meng, W., & Zhou, Y. (2025). Inversion of Physical and Mechanical Parameters of Surrounding Rock Mass in Foundation Pits Using a PSO-BP Neural Network. Buildings, 15(19), 3499. https://doi.org/10.3390/buildings15193499


