Article

Sensitivity Analysis of the Uncertainty of the Heat-Flux Method for In-Situ Thermal Conductance Assessment in Glazed Façades

by
Riccardo Gazzin
1,2,
Giuseppe De Michele
3,
Giovanni Pernigotto
1,*,
Andrea Gasparella
1 and
Roberto Garay-Martinez
2
1
Faculty of Engineering, Free University of Bozen-Bolzano, 39100 Bolzano, Italy
2
Faculty of Engineering, University of Deusto, 48007 Bilbao, Spain
3
Eurac Research, 39100 Bolzano, Italy
*
Author to whom correspondence should be addressed.
Buildings 2025, 15(19), 3504; https://doi.org/10.3390/buildings15193504
Submission received: 8 August 2025 / Revised: 23 September 2025 / Accepted: 26 September 2025 / Published: 28 September 2025
(This article belongs to the Special Issue Research on Indoor Built Environments and Energy Performance)

Abstract

The discrepancy between design-stage predictions and actual building energy performance, known as the “performance gap,” poses a barrier to achieving energy efficiency goals, especially in modern buildings with high-performance envelopes and complex façades. Characterization of façade elements, both on site and in laboratory facilities, can help ensure envelope quality and mitigate this gap. Although glazed envelopes are increasingly used in contemporary architecture, current regulations lack standardized procedures for experimental heat transfer assessment in buildings. This paper explores how existing standards for heat flux measurements in opaque envelopes could be adapted to transparent façades. A detailed uncertainty analysis is provided to define measurement conditions that ensure accurate conductance results. A sensitivity analysis—based on both analytical error propagation and Monte Carlo simulations—identifies minimum sensor precision, temperature gradients, and test durations needed for reliable in situ assessments. Results show that uncertainty is mainly driven by small temperature gradients and systematic sensor errors. Measurements taken over six hours with a minimum 5 K gradient yield acceptable uncertainty. The proposed framework supports the development of rigorous experimental protocols for assessing the conductance of transparent façade elements, accounting for real-world conditions and measurement limitations.

1. Introduction

1.1. Context

Overcoming the discrepancy between expected and actual performance of buildings—commonly referred to as the “performance gap”—is a significant challenge in the field of building physics, especially when it comes to the definition of effective building energy strategies [1,2,3]. This is particularly critical for new or renovated buildings, which frequently consume more energy than expected from calculations according to the current design standards [4,5]. This gap often results from construction deficiencies, improper operation and maintenance of building systems and users’ behaviour. Among all components, however, the building envelope plays a crucial role in determining overall energy consumption. In order to reduce the performance gap, an effective strategy can rely on commissioning, i.e., the systematic process designed to ensure that a building meets its intended quality and performance objectives [6]. Commissioning involves a sequence of structured steps, starting from the design phase and ending with the client’s handover [7]. A critical phase within this sequence is the on-site verification of building performance through testing.
Within this context, thermal performance assessment of the envelope is typically qualitative: thermal imaging cameras identify thermal bridges, but quantitative evaluations, such as the U-value assessment, are not standard practice. Indeed, major commissioning standards—such as those defined by ASHRAE [7] and leading building certifications such as LEED [8]—do not mandate quantitative U-value measurements of envelope components. Additionally, national standards often do not include requirements for commissioning procedures and assume that thermal properties of the building envelope, such as thermal transmittance and g-value, are consistent with calculations and specifications established in the design phase.
Transparent curtain walls are increasingly frequent in new constructions across Europe. However, there is a notable absence of standardized in situ U-value measurement methods for glazing. Thermal performance is commonly assumed to be determined through numerical analysis; nevertheless, research demonstrates that performing such calculations for intricate façade systems—such as Insulated Glazing Units featuring integrated shading within the cavity or ventilated façades—poses significant challenges in the absence of empirical data and the calibration of digital models [9]. Moreover, the existing literature on in situ evaluation of envelope performance predominantly addresses opaque elements [10], with a very low percentage of studies focusing exclusively on transparent components. On-site thermal performance evaluation of transparent envelope elements, such as windows or curtain walls, is even more rarely approached [11,12]. Characterization of the real thermal conduction properties of glazing elements can be useful not only for the evaluation of the thermal insulation level of the building envelope, but also for the evaluation of the solar performance [13,14,15].

1.2. Methods for U-Value Measurement of Opaque Walls

Currently, various methods are available for measuring the U-value of opaque walls. Some approaches require the use of a heat flux meter, whereas others utilize alternative techniques.
The principal methodologies [16,17] are illustrated in Figure 1 and are as follows:
  • Standard Heat-Flux Meter (HFM) methods (ISO 9869-1 [18], “average” and “dynamic” analyses). In this method, a heat-flux meter is positioned on the internal surface of the wall, while two temperature sensors record the internal and external air temperatures. The measurement campaign extends for a minimum of 72 h to ensure the attainment of stable results, although it may extend longer until consistent data is achieved. This is due to the standard being intended for systems like opaque masonry façades with high-inertia walls [19,20]. The extended duration of this process can significantly impact operational costs, thereby potentially discouraging its implementation. The standard includes a method for lightweight structures, requiring only night-time measurements over at least three consecutive nights. However, it mainly applies to opaque, inertial systems and is not explicitly applicable to transparent envelopes. According to the standard, the U-value is calculated over the measurement period as per Equation (1).
    U = i = 1 N q i i = 1 N T i
    where   q is the measured heat flux and T is the air temperature gradient across the wall.
  • Controlled-environment HFM variants (ISO 8990:1994 [21]; e.g., the Simple Hot-Box–HFM method and the Temperature-Control-Box HFM). This approach, although not an “in situ” method, is utilized to assess the thermal performance of façade prototypes. In a controlled environment, boundary conditions like air velocity and humidity are better managed to have more accurate results.
  • Infrared Thermography (IRT) (ISO 9869-2) [22], which uses non-contact IR cameras plus internal and external air temperatures. Infrared cameras are typically employed for qualitative assessments of thermal anomalies. However, certain methodologies incorporate surface temperature measurements to estimate the U-value [23]. In this approach, HFMs are not used.
  • Probe Insertion Method (ISO 9869-3) [24]. This is a minimally invasive technique where a thin probe with temperature sensors is inserted into a small, drilled hole to measure temperature gradients across the wall. It can be used qualitatively to detect insulation defects, or quantitatively—with added heat-flux data—to calculate local U-values. It is particularly suited for lightweight or framed constructions where standard HFM methods may be less effective.
  • Temperature-Based Methods (TBM/THM/ASTR), relying on indoor/outdoor air and surface-temperature ratios [25,26]. Unlike the IRT method, surface temperature is measured using contact sensors.
  • Natural Convection & Radiation (NCaR) approaches [27], which infer U-values from measured heat-transfer coefficients without any heat-flux sensor.
In practical on-site applications, only the standard Heat Flow Meter (HFM) method is employed. The ISO 9869-1 standard mandates a minimum of 72 h of continuous data measurement to determine the U-value; however, it does not stipulate a specific temperature differential between the interior and exterior surfaces of the wall but rather implies the necessity of maintaining an appropriate gradient. Nevertheless, studies show that gradients below 10 K can cause significant uncertainties [28]. ISO 9869-1 specifies an approximate uncertainty threshold of 14% for opaque walls when measurements are performed under prescribed conditions. This threshold is determined by using the root sum square method for evaluating single error effects.
The standard also stipulates that measurement data must demonstrate convergence and maintain a standard deviation below a specified threshold. For highly insulated envelopes—which exhibit low heat fluxes, pronounced transient effects, and potential flux reversals—achieving reliable results can take several days. Such extended measurement periods are not only an engineering challenge but also a business concern, as they increase on-site evaluation costs. For this reason, minimizing the measurement campaign is an important issue [29]. Garay-Martínez et al. [30] show that, when the temperature gradient between the internal air and the wall internal surface is small (<2 K), instantaneous estimates of the internal surface heat transfer coefficient can incur > 60% uncertainty, which only drops to 12–20% after ≥8 h of data and proper statistical averaging. This results in limited validity of IRT, TBM/THM/ASTR and NCaR methods. A formal propagation of sensor and flux errors is therefore essential to define both minimum measurement durations and ΔT thresholds.
A variety of alternative non-HFM and non-IR methods have been proposed to measure the in situ U-value of building envelope elements. The Thermometric Method (THM) relies solely on surface and air temperatures but is sensitive to convective-coefficient assumptions and temperature gradients [31]. The Excitation Pulse Method (EPM) delivers results within hours by imposing a controlled thermal pulse and observing transient heat-flux responses, making it well suited to lightweight walls but demanding specialized heating/cooling rigs and complex analysis [32].

1.3. Methods for Thermal Performance Assessment of the Entire Envelope

In addition to component-level U-value measurements, whole-envelope approaches aim to determine the total heat loss coefficient (HLC) of an entire building under real operating conditions [33]. These methods are essential for assessing integrated energy performance and identifying discrepancies between design intent and actual building behaviour. The most used approach is the “average method”: it is performed by continuously measuring the heat provided by the HVAC system and the electricity consumption during periods with very low or null exposition to solar loads. The formula is expressed in Equation (2) [34].
H L C = i = 1 N ( Q i + K i ) i = 1 N ( T i n , i T o u t , i ) ,
where Q is the provided heat, K is the electricity consumption, T i n is the internal air temperature and T o u t is the external air temperature.
A variation of this method is the Quick U-Value of Buildings (QUB) test, developed by Alzetto et al. [35]. QUB test is a fast, dynamic approach for determining a building’s total heat loss coefficient (HLC) in a single night by applying a controlled heating pulse and monitoring the resulting temperature response; despite its brevity, the method rests on a straightforward theoretical model that—when key experimental conditions (such as a prescribed heating power criterion and minimal solar interference) are met—yields HLC estimates comparable in accuracy to multi-day steady-state tests.

1.4. Transparent Elements (Glazing Units)

Although some researchers have adapted Heat Flux Meter (HFM) techniques for glazing setups similar to those outlined in ISO 9869-1 [36], these adaptations have not achieved standardization. Goia and Serra [13], for example, devised a methodology to evaluate the thermal conductance, transmittance, and g-value of transparent façade elements under actual conditions across multiple seasons. Bartko et al. [37] evaluated the thermal performance of three windows by employing the HFM method during a two-year measurement campaign. However, these studies used long-term data or followed minimum duration requirements from ISO 9869-1, without the aim to develop a short-term method to assess in situ thermal performance of glazing units.
ZAE Bayer has developed a portable hot-box tool designed to measure the U-value of windows and glazed façades on-site [38]. Additionally, infrared thermography is problematic for low-emissivity (low-e) glazing because the coating causes cameras to register lower temperatures than actual values.
Calorimetric chambers are one method to measure the thermal characteristics of glazed façade elements. There are also outdoor versions of these facilities, such as MoWitt from LBNL [39], the Fraunhofer Institute’s “Calorimetric Façade and Roof Test Facility” [40], which can track the sun and be oriented to it at different angles, and the mobile g-value test apparatus from the University of Innsbruck, Austria [41]. Nevertheless, these facilities are designed to assess the performance of façades/windows prototypes and cannot be used for on-site measurements of real buildings.

1.5. Research Gap and Study Objective

Currently, no standardized method exists for the in situ measurement of thermal conductance in glazed façade elements. Existing standards, such as ISO 9869-1 [18], focus on opaque components and are not directly applicable to transparent or semi-transparent systems, limiting the reliability and comparability of on-site assessments for advanced glazing solutions.
Given this gap, the present study evaluates the applicability of in situ conductance measurements for glazed façade systems, adapting the ISO 9869-1 methodology to this context. The specific aim is to achieve an overall uncertainty level below 14%, as indicated in the standard for opaque walls; this threshold is considered appropriate for glazed elements, since their relatively low thermal variability allows measurement uncertainties to be maintained within the same range. Given the low thermal inertia of glazing, this study also aims to complete the measurement process within a single night.
This analysis examines principal factors affecting measurement reliability, such as sensor precision, temperature differentials across the glazing, and the length of data acquisition. The objective is to evaluate how these variables influence measurement uncertainty and to determine thresholds necessary for conducting dependable thermal assessments of glazing units. Unlike previous works based on experimental campaigns, the present study focuses on the methodological framework itself, assessing its applicability to transparent systems through theoretical and simulation-based analysis. The outcomes are intended to support the development of robust experimental protocols for transparent envelope systems, enabling accurate and repeatable in situ conductance assessments under real-world conditions.

2. Methodology

The methodological framework adopted in this study is summarized in Figure 2.
The workflow is structured into four steps: (i) definition of the glazing unit system and reference parameters; (ii) definition of sensor setup and conductance calculation under nighttime conditions; (iii) uncertainty analysis, carried out through both analytical error propagation and Monte Carlo simulations; and (iv) sensitivity analysis of measurement conditions and sensor errors. The approach adapts the ISO methodology in a controlled, simulation-based framework, using representative reference values for glazing systems. The schematic overview in Figure 2 highlights the logical sequence of the adopted methodology, which is then detailed in the following subsections.

2.1. Definition of the System

As noted in the introduction, there exists a standardized methodology for evaluating the thermal performance of opaque walls, specifically in terms of transmittance and conductance. However, there remains a deficiency in standardization regarding the assessment of glazed façades and windows.
In this study, the methodological framework established in ISO standards—originally developed for opaque elements—is adapted and its applicability and validity for transparent building envelope elements is tested.
The thermal performance target values for glazed elements of new and renovated buildings change according to local regulations and standards. For example, within the European Union, the EPBD [42] does not stipulate specific target values for envelope thermal transmittances. Instead, it establishes a methodology for determining the cost-optimal performance targets that each member state must adopt when developing its own local regulations. For this reason, for the purposes of this study, a reference thermal conductance value of 1.0 W/m2·K has been adopted to define the measurement protocol. This value is representative of typical glazed façade systems and falls between that of standard double glazing (~1.5 W/m2·K) and high-end triple glazing (~0.5 W/m2·K).

2.2. Description of the Sensor Setup and Conductance Calculation Method

The experimental sensors’ configuration to measure the dynamic thermal conductance of glazing units under nighttime conditions is derived from the one defined in ISO 9869-1. The setup is represented in Figure 3 and it comprises the following:
  • A heat-flux meter (HFM), installed on the internal side of the glazed façade.
  • Two surface temperature sensors (PT100), on the two sides of the façade.
To calculate the thermal conductance of the glazing unit ( Λ ) over the measurement time, the formula in Equation (3) can be used, in absence of solar radiation.
Λ = i = 1 N q H F M , i i = 1 N ( T s , i n t , i T s , o u t , i )
where q H F M is the total heatflux measured by the heat flux meter (HFM), T s , i n t is the surface temperature of the inner face of the glazing unit and T s , o u t is the surface temperature of the outer face of the glazing unit.
Thermal conductance differs from thermal transmittance because it does not consider the air temperature gradient, but rather the surface temperature gradient. In this way, it is possible to neglect the influence of the surrounding air’s convective effects, thereby isolating the intrinsic conductive properties of the glazing surfaces for a more direct assessment of the glazing unit’s thermal performance.
Glazing units offer several advantages for in situ testing compared to opaque walls, including generally higher transmittance, lower thermal inertia, and minimized transient effects.

2.3. Uncertainty Analysis

The approaches used in this work to quantify the uncertainty of the performed measurements are twofold. First, an analytical approach based on the conductance value calculation formula will be employed. This involves utilizing partial derivatives to observe the propagation of errors from various measurements. The second approach involves a more empirical method, where experimental data will be simulated starting from theoretical values of thermal flux and temperature gradients and applying systematic and random errors.
Analytical approach
Starting from the conductance value calculation formula, the uncertainty equation utilizes the partial derivatives equation to observe the propagation of errors from various measurements. The quantification of errors is accomplished by reviewing the technical data sheets of sensors for calibration errors, while other sources are quantified through technical standards, addressing issues like contact imperfections of heat flux meters.
Regarding the analytical uncertainty of the thermal conductance, this can be expressed as in Equation (4).
δ Λ = δ Λ m + δ Λ e s t
where δ Λ m is the systematic error while δ Λ e s t is the noise error.
Systematic error of the conductance calculation can be analytically calculated with the partial derivatives equation, considering the variables involved, such as heat flux measurement and internal and external temperature readings. The formula is reported in Equation (5).
δ Λ m = d Λ d q H F M , m δ q H F M , m + d Λ d T s , i n t , m δ T s , i n t , m + d Λ d T s ,   o u t , m δ T s , o u t , m
where δ q H F M , m is the systematic error of the HFM and δ T s , i n t , m and δ T s , o u t , m are the systematic errors of the temperature sensors.
Noise error can be calculated similarly with Equation (6).
δ Λ e s t = K σ ( Λ ) n = K n ( 1 T s , i n t T s , o u t σ ( q H F M , e s t ) + q H F M T s , i n t T s , o u t 2 ( σ ( T s , i n t , e s t ) + σ ( T s , o u t , e s t ) ) )
where K is the sensitivity coefficient which defines the confidence level of the uncertainty interval (K = 1.96 for 95% of confidence), σ represents the standard deviation of the respective measurements, and n is the number of measurements.
With these equations, it is possible to calculate the uncertainty of the measurements, considering the average temperature delta and the average heat flux.
Monte Carlo approach
This process involves deriving the heat flux through the glazing unit from an expected conductance and a specified temperature difference, based on an ideal one-dimensional heat transfer. Then measurement errors are introduced, based on the probability distribution of systematic and random errors of each sensor type.
A Monte-Carlo approach is used to generate a large number of measurement samples, thereby allowing for the analysis of the resultant conductance distribution as if it were a measurement campaign under steady-state conditions. For each simulation run, a large number of samples (ranging from 360 to 3240) are generated via the Monte Carlo method, depending on the configuration of the sensitivity analysis, to assess the resulting conductance distribution.
The uncertainty of the conductance results from Monte Carlo simulations is calculated as the difference between the obtained value and the expected value.
In this procedure, the following steps are taken:
  • Definition of the expected measurement:
    The expected conductance value Λ e x p is used to calculate the corresponding heat flux mean, with the formula in Equation (7).
    q e x p = Λ e x p · ( T s , i n t T s , o u t )
    Since only the temperature difference affects the result, the absolute values of the surface temperatures are not significant in this context.
  • Simulation of temperature measurements and heat flux measurements
    Two temperature measurements, T 1 and T 2 , are generated such that their difference matches the imposed temperature gradient. Systematic errors are applied by offsetting T 1 and T 2 by a constant amount, and random noise is added using a normal distribution with standard deviation σ ( T s ) . This simulates the inherent uncertainties and fluctuations in temperature sensor readings. Similarly, the heat flux measurement q is perturbed by both a systematic error (a fixed percentage of q e x p ) and random noise (with standard deviation σ ( q ) ). This creates a realistic set of simulated heat flux values, capturing both the calibration or installation biases and the inherent sensor noise.
  • Statistical analysis:
    The overall estimated conductance is calculated by taking the ratio of the sum of all simulated heat flux values to the sum of all simulated temperature differences (Equation (8)).
    Λ M C = q i Δ T i
    The deviation from the expected conductance determines the uncertainty of the lambda calculation with this method, reported in Equation (9).
    Λ M C = Λ M C Λ e x p
  • Repetition of the simulations:
    As this method relies on randomized values, simulations are conducted 10 times, with the least favorable result being selected to mitigate the possibility of overly optimistic outcomes.
This Monte Carlo simulation, by generating a large number of samples, provides a statistical characterization of the measurement uncertainty, replicating the experimental conditions and error sources that occur in practical measurements.

2.4. Sensitivity Analysis

Sensitivity analysis is performed to determine the impact of variations in measurement apparatus and boundary conditions on the reported thermal conductance of the glazing unit. By comprehending the extent to which different factors influence the results, researchers can recommend measurement conditions to minimize errors and enhance accuracy.
The sources of errors must first be identified. ISO 9869-1 is used as a reference, considering only the types of errors that may affect glazed façades. For heat flux meters (HFM), calibration errors and installation errors related to thermal contact are taken into account.
The standard identifies other sources of errors that can be overlooked for this measurement setup. One of these is the transient effect, considering the façade has low inertia, and the outdoor air temperatures at night do not exhibit strong or rapid fluctuations. The total systematic error of the HFM can be determined by calculating the quadratic square root sum of all the error sources. The adopted formula is Equation (10).
δ s y s t , t o t = δ c a l 2 + δ i n s t 2
For temperature sensors, if PT100 are used, the only relevant error which is taken into consideration is the calibration one, which depends on the accuracy class of the sensor.
Noise errors in the measurement arise from multiple sources, including the inherent electronic noise of the sensors, fluctuations in ambient conditions, and limitations in the data acquisition system. These random errors are influenced by the sensor’s signal-to-noise ratio, the resolution and stability of the instruments, and the sampling frequency used during data collection. Understanding these noise errors and their contributions to the overall uncertainty is crucial for refining the measurement process and enhancing the reliability of the data.
In the sensitivity analysis, each variable’s effect on overall uncertainty will be evaluated by systematically varying one parameter at a time while keeping all others constant. In each analysis, all variables will remain at their default values except for the one being examined in the sensitivity analysis. These variables are defined in Table 1, in which default values and the minimum and maximum values considered are quantified.
The quantification of default values for the sensitivity analysis is based on practical considerations related to typical measurement conditions and reasonable estimations of expected uncertainties:
  • Temperature difference (ΔT = 7.0 K): This is a representative value for real experimental setups for winter periods in mild climates, ensuring sufficient temperature contrast for meaningful conductance measurements without introducing excessive gradients that could lead to additional uncertainties.
  • Systematic error of temperature sensors (0.1 K): This value reflects the typical accuracy associated with laboratory-grade sensors, such as a PT100.
  • Systematic error of the heat flux meter (7.1%): This value is derived from an estimation using the uncertainty values reported in ISO 9869-1, which specifies typical sources of systematic error. The overall error is composed of just two elements: a 5% calibration error, which reflects the performance of a well-calibrated, high-quality sensor, and a 5% installation error arising from contact resistance. Applying the quadratic sum method, the total systematic error results in approximately 7.1%.
  • Noise of temperature sensors (0.07 K): This value was determined based on a previous experimental campaign conducted by the authors [43], involving PT100 sensors. A moving average filter was applied to the time series data to remove low-frequency trends, and the standard deviation of the residuals was computed, yielding an estimate of the noise floor.
  • Noise of the heat flux meter (4.0 W/m2): As the noise of the temperature sensors, this value was calculated based on the same experimental data and procedure.
  • Number of simulated measurements (n = 1080): A logging system collecting data at a frequency of one measurement every 20 s results in this number of simulations over a 6 h period. This quantity provides a sufficient statistical sample for Monte Carlo simulations and spans a full night of measurements.

3. Results and Discussion

As illustrated in the analytical formula, the uncertainty relies on the temperature gradient between the external surface and the internal surface. The temperature gradient has been varied within a range of 2.0 K to 20.0 K (Table 1). Results are represented in Figure 4. In this analysis, also the analytical uncertainties with other two different glass conductance values are plotted (0.5 and 2.0 W/m2·K).
Comparing the results from Monte Carlo simulations and the analytical values of the glazing unit with a conductance of 1.0 W/m2·K it can be observed that both methods yield comparable outputs. Throughout the entire range, both results exhibit similar trends. Uncertainty increases substantially as the temperature gradient nears its minimum value and decreases as the temperature gradient grows. The most significant reduction in uncertainty is observed at lower gradients; further increases in the gradient result in diminishing decreases in uncertainty. In this configuration, a target uncertainty of 14% for glazed conductance measurement can be accomplished when the temperature difference is 5.0 K.
Looking at the analytical trends of the different conductance values, it is possible to observe that a higher conductance necessitates a lower temperature gradient to be measured with comparable uncertainty to that of a lower conductance. To achieve an uncertainty level of 14%, a glazing unit with a conductance of 2.0 W/m2·K requires a temperature gradient of approximately 4.0 K, whereas a conductance of 0.5 W/m2·K necessitates a gradient of 7.0 K. This difference occurs because an insulating glazing unit with lower conductance permits less heat flux through it at the same temperature gradient, compared to a higher-conductance unit. As a result, when the heat flux is lower, measurement errors from the heat flux meter have a greater impact. As the temperature gradient increases, the disparities in uncertainties among different glazing units become less pronounced. The findings indicate that forthcoming advancements and applications of in situ methodologies for evaluating the thermal performance of glazing units should incorporate minimum temperature gradients to ensure measurement accuracy. Furthermore, these gradients may need to be specified based on the type of glazing unit and its anticipated performance characteristics.
The impact of systematic errors in the Λ -value calculation has been evaluated for both the sensors. The range considered for the temperature sensors is again reported in Table 1.
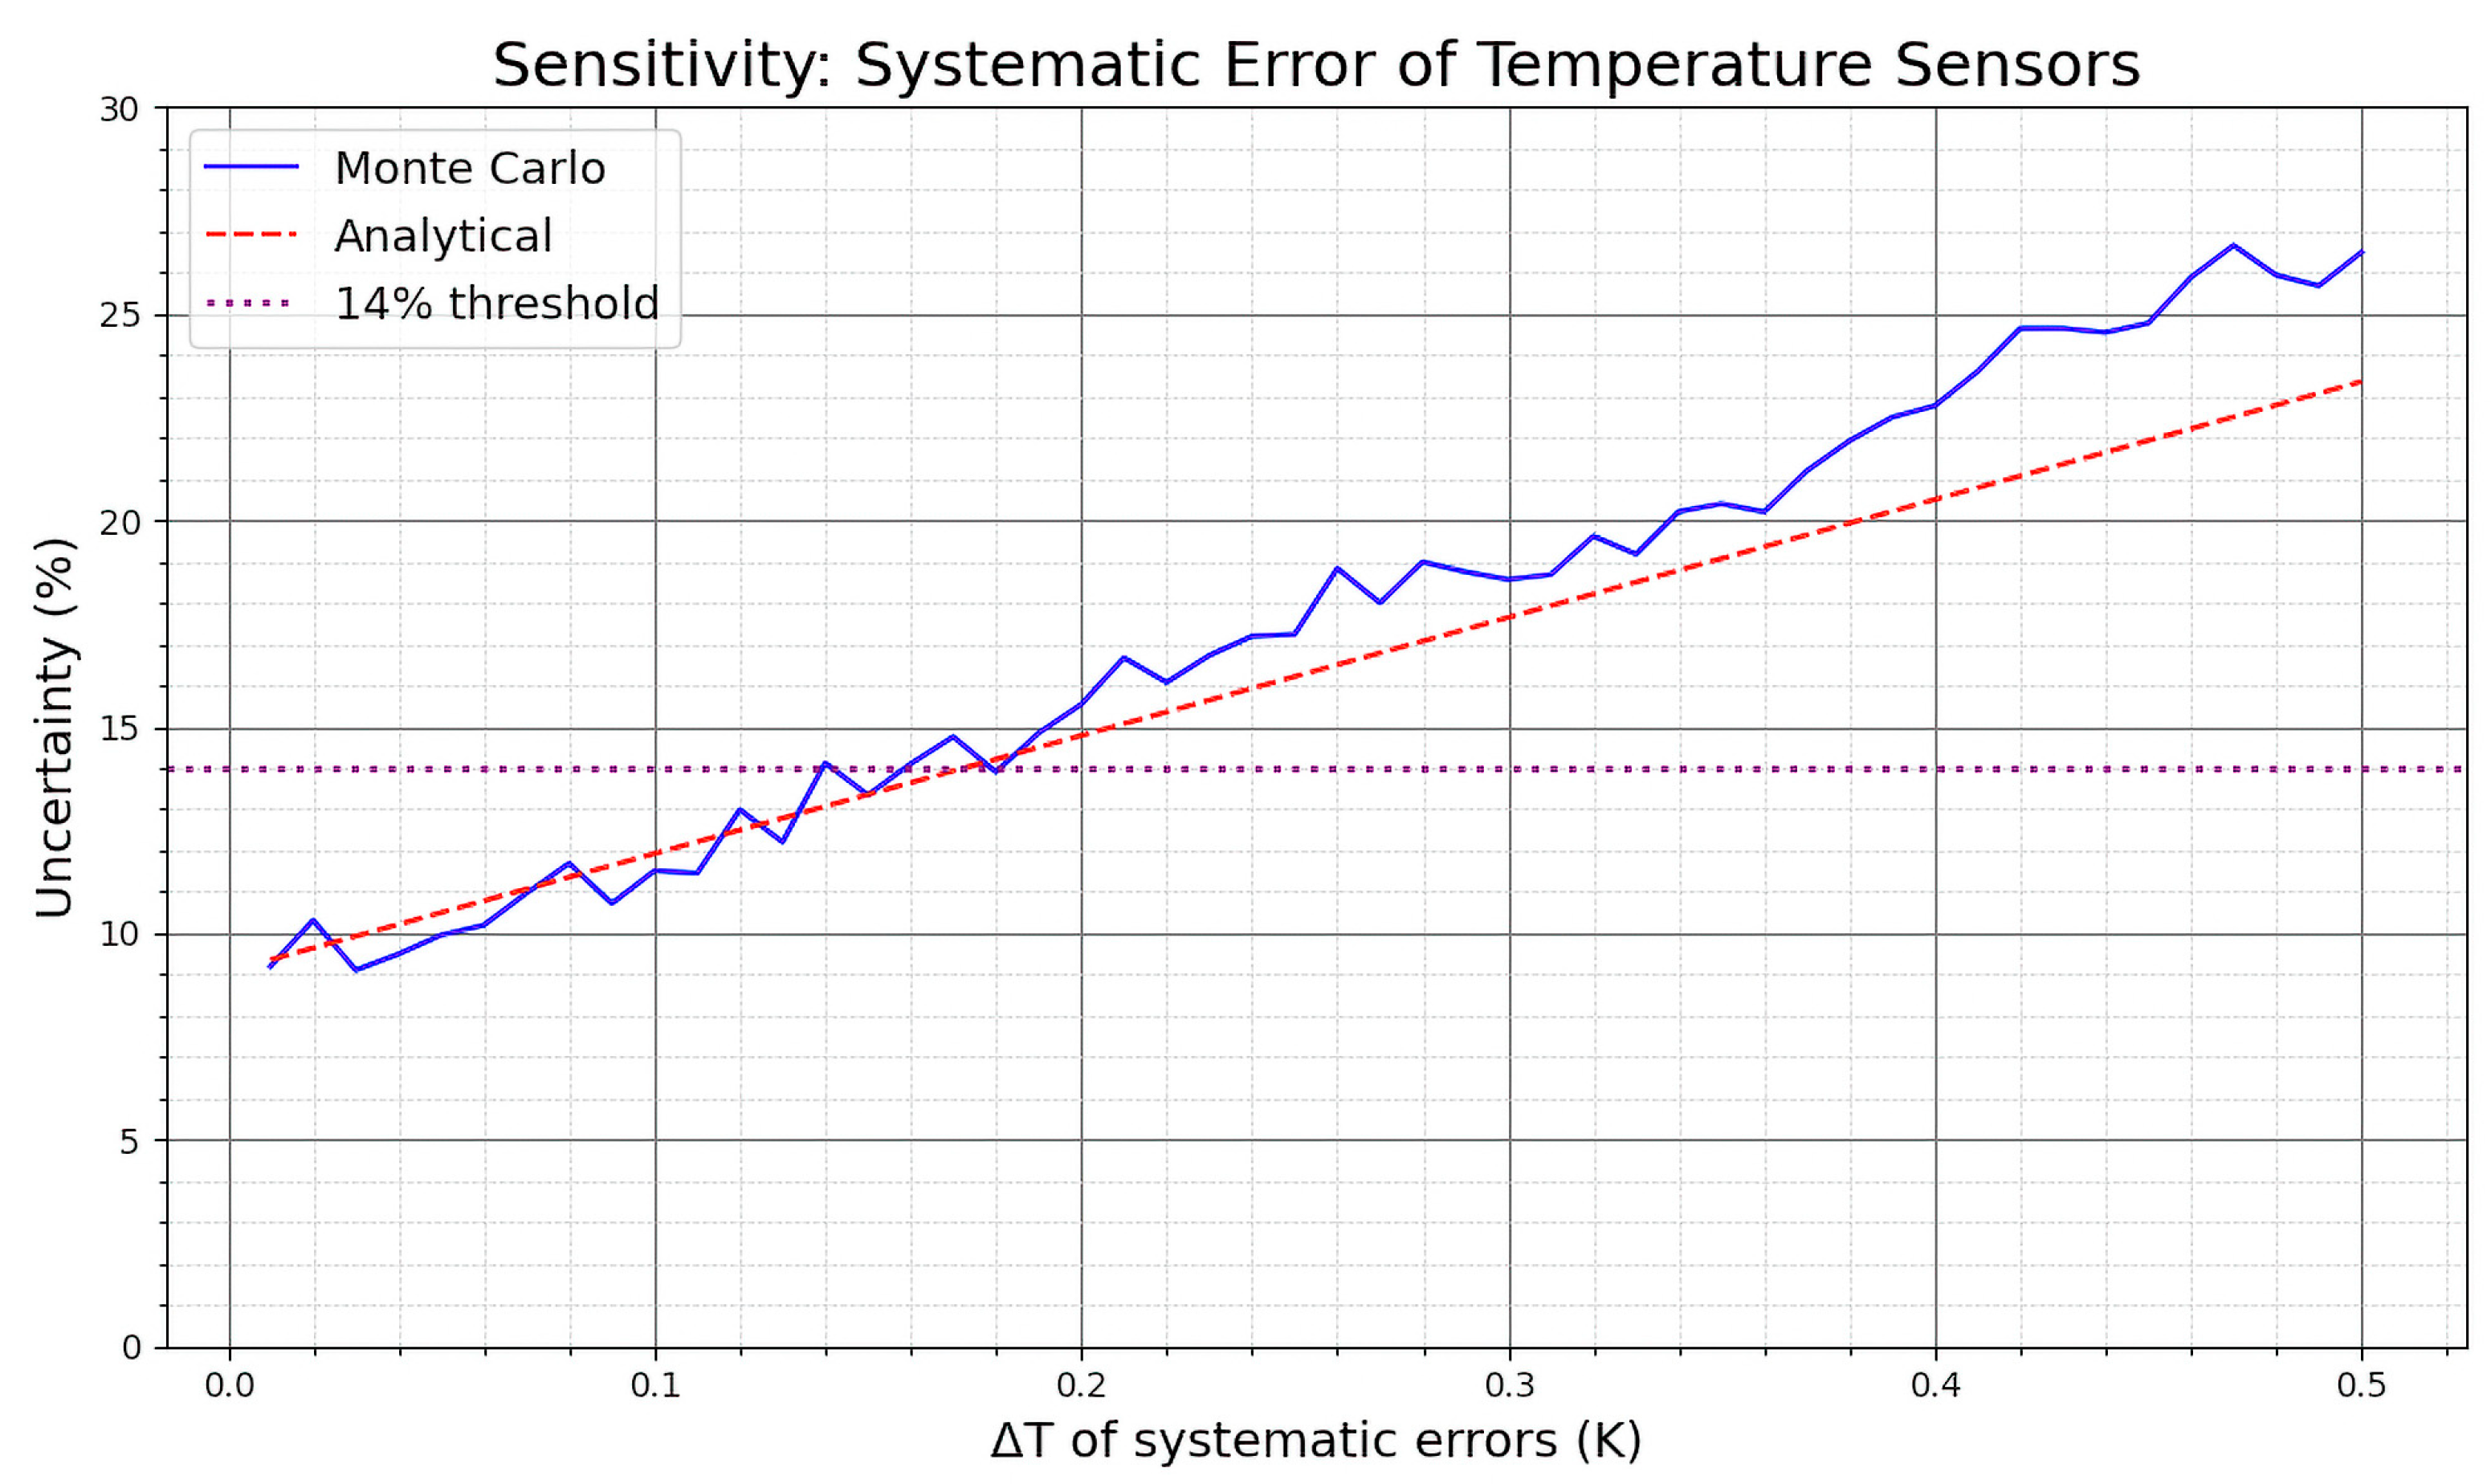
As can be observed in Figure 5 and Figure 6, the Monte Carlo simulation method aligns with the linear trend observed in analytical uncertainty values for both scenarios, though differences at higher error values are evident for temperature sensors. For these sensors, the systematic errors should stay below 0.15 K to not overreach an uncertainty value of 14% (Figure 5), assuming other parameters remain constant. Since two temperature sensors are included in the setup, this effect should be considered as doubled, as indicated by the analytical equation.
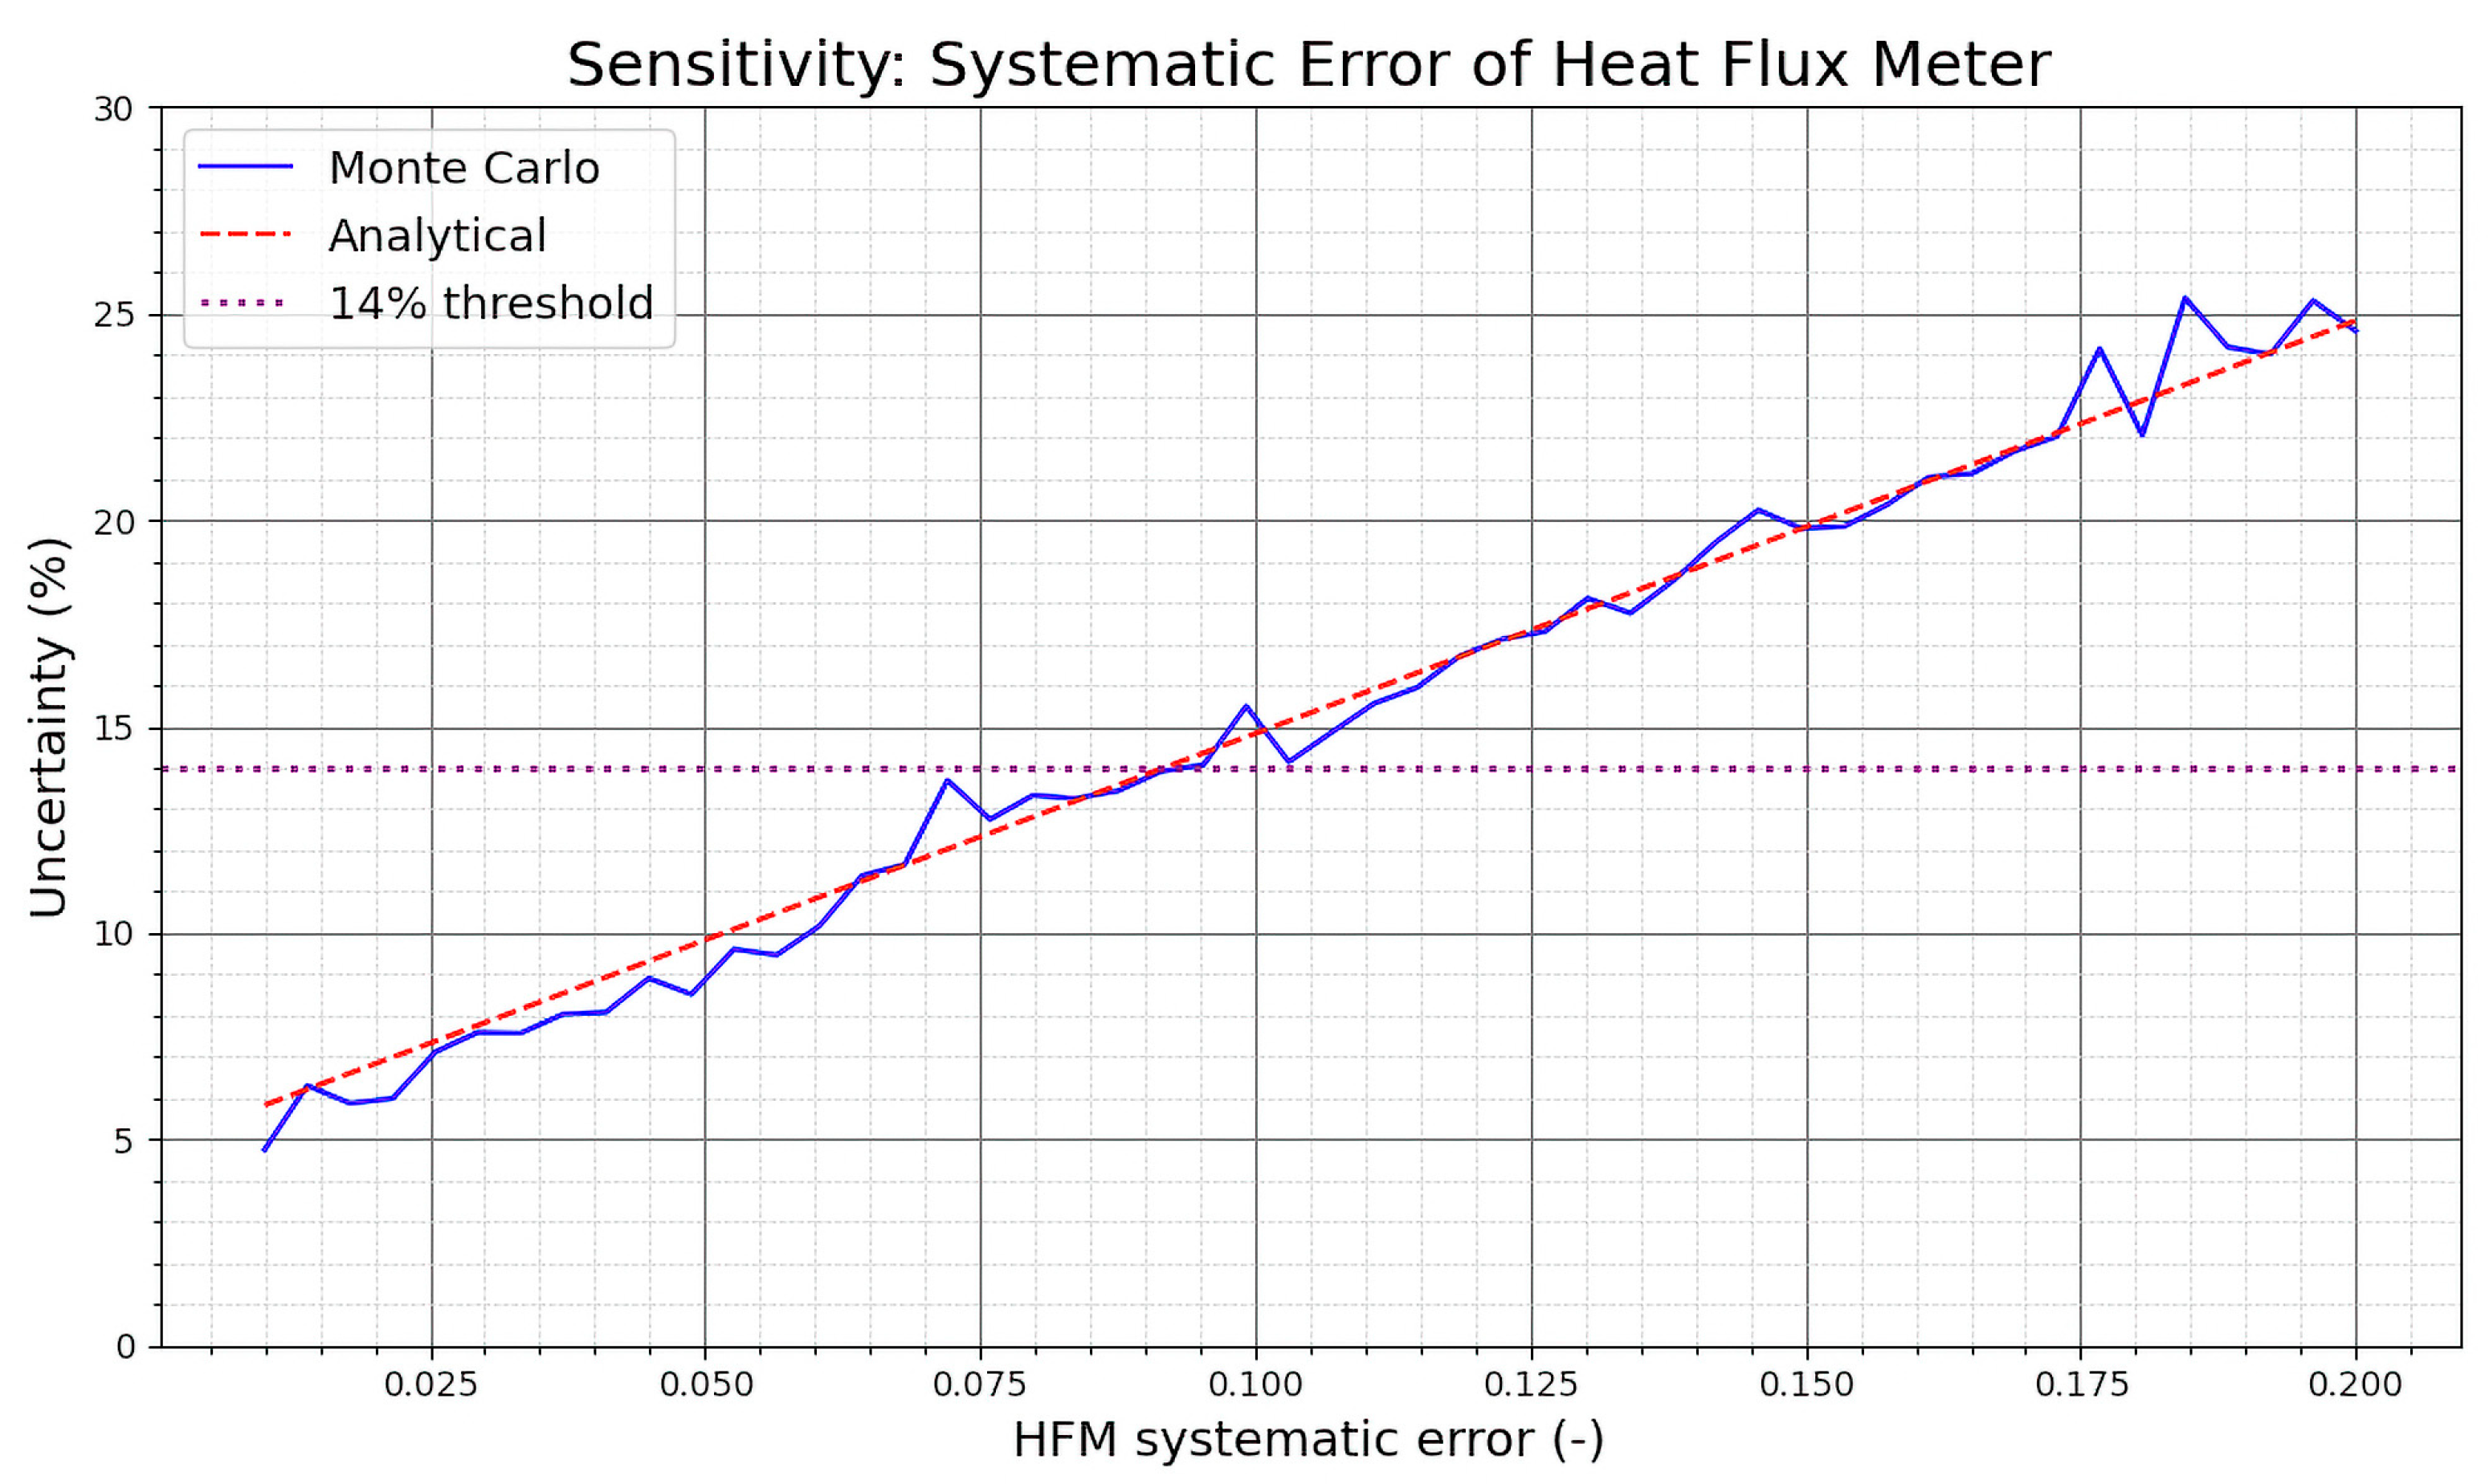
In contrast, for HFM sensors (Figure 6), results from both methods show greater agreement. This variable has a notable influence on overall uncertainty. When the HFM sensor exhibits low systematic error, overall uncertainty is minimal; however, it increases significantly as the systematic error rises. In order to maintain an uncertainty value below 14%, it is essential that systematic error does not exceed 9% for the HFM, assuming all other variables remain at their default settings.
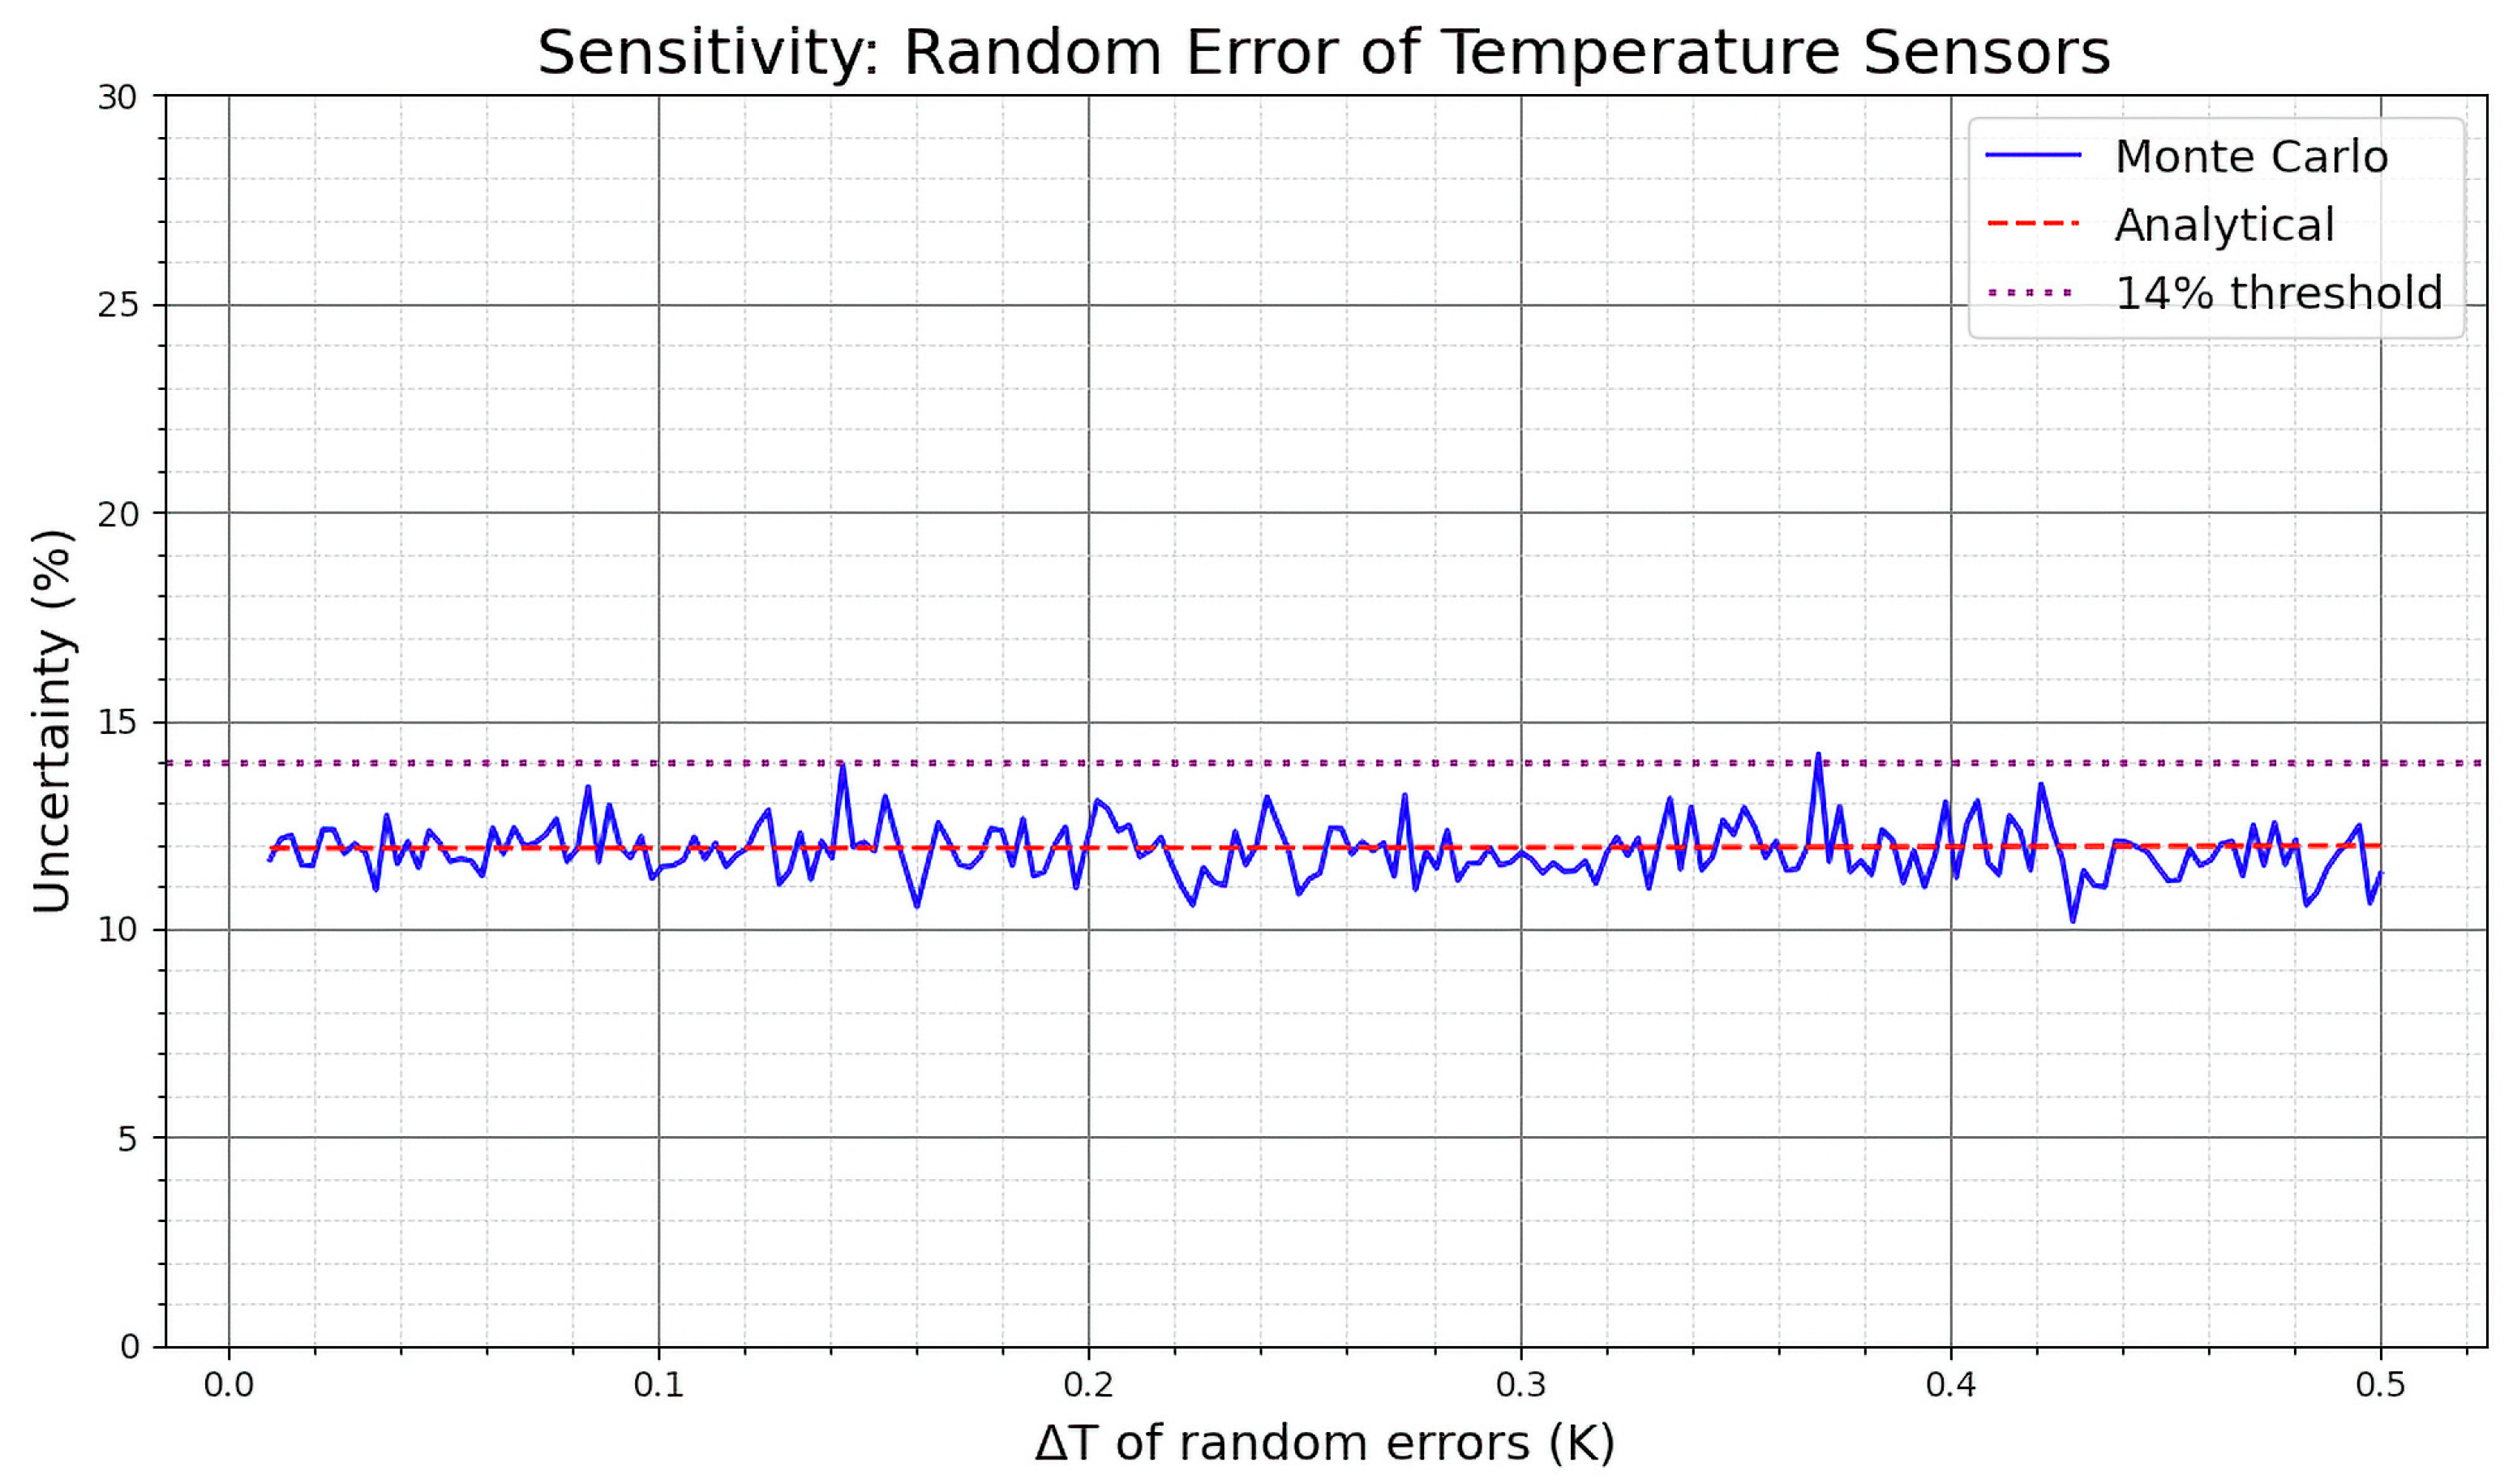
Regarding the random errors, the graphs in Figure 7 and Figure 8 show how variations in random errors impact the overall uncertainty of the conductance measurement in different ways for the two types of sensors. In Figure 7, where the random error of the temperature sensors is varied, there is an almost imperceptible increase in uncertainty as the noise level increases. This trend confirms that small to moderate levels of random fluctuations in temperature measurements do not drastically inflate the overall uncertainty, which is in stark contrast to the effect of systematic errors where even a slight offset can have a much larger impact.
In Figure 8, the influence of random errors in the heat flux meter is shown. Like the temperature sensors, the uncertainty increases as the noise in the heat flux measurements increases, but the overall rise is more moderate compared to the steep increase observed with systematic errors. This behavior reflects the fact that random errors, unlike systematic biases, can be mitigated by increasing the number of measurements, thereby averaging out the noise.
The close correspondence between results from Monte Carlo simulations and predictions from analytical uncertainty equations supports the assumptions used in the error propagation analysis. Systematic errors—such as those related to calibration, installation, and transient behavior—have a significant effect on overall uncertainty. In contrast, random errors have a comparatively smaller impact. This indicates that systematic biases need to be minimized in practical applications, since achieving low systematic errors in HFM measurements can be challenging. The graph shows that, although both random and systematic errors contribute to overall uncertainty, systematic errors are the primary factor; therefore, controlling these errors is necessary for reducing measurement uncertainty in thermal conductance evaluations.
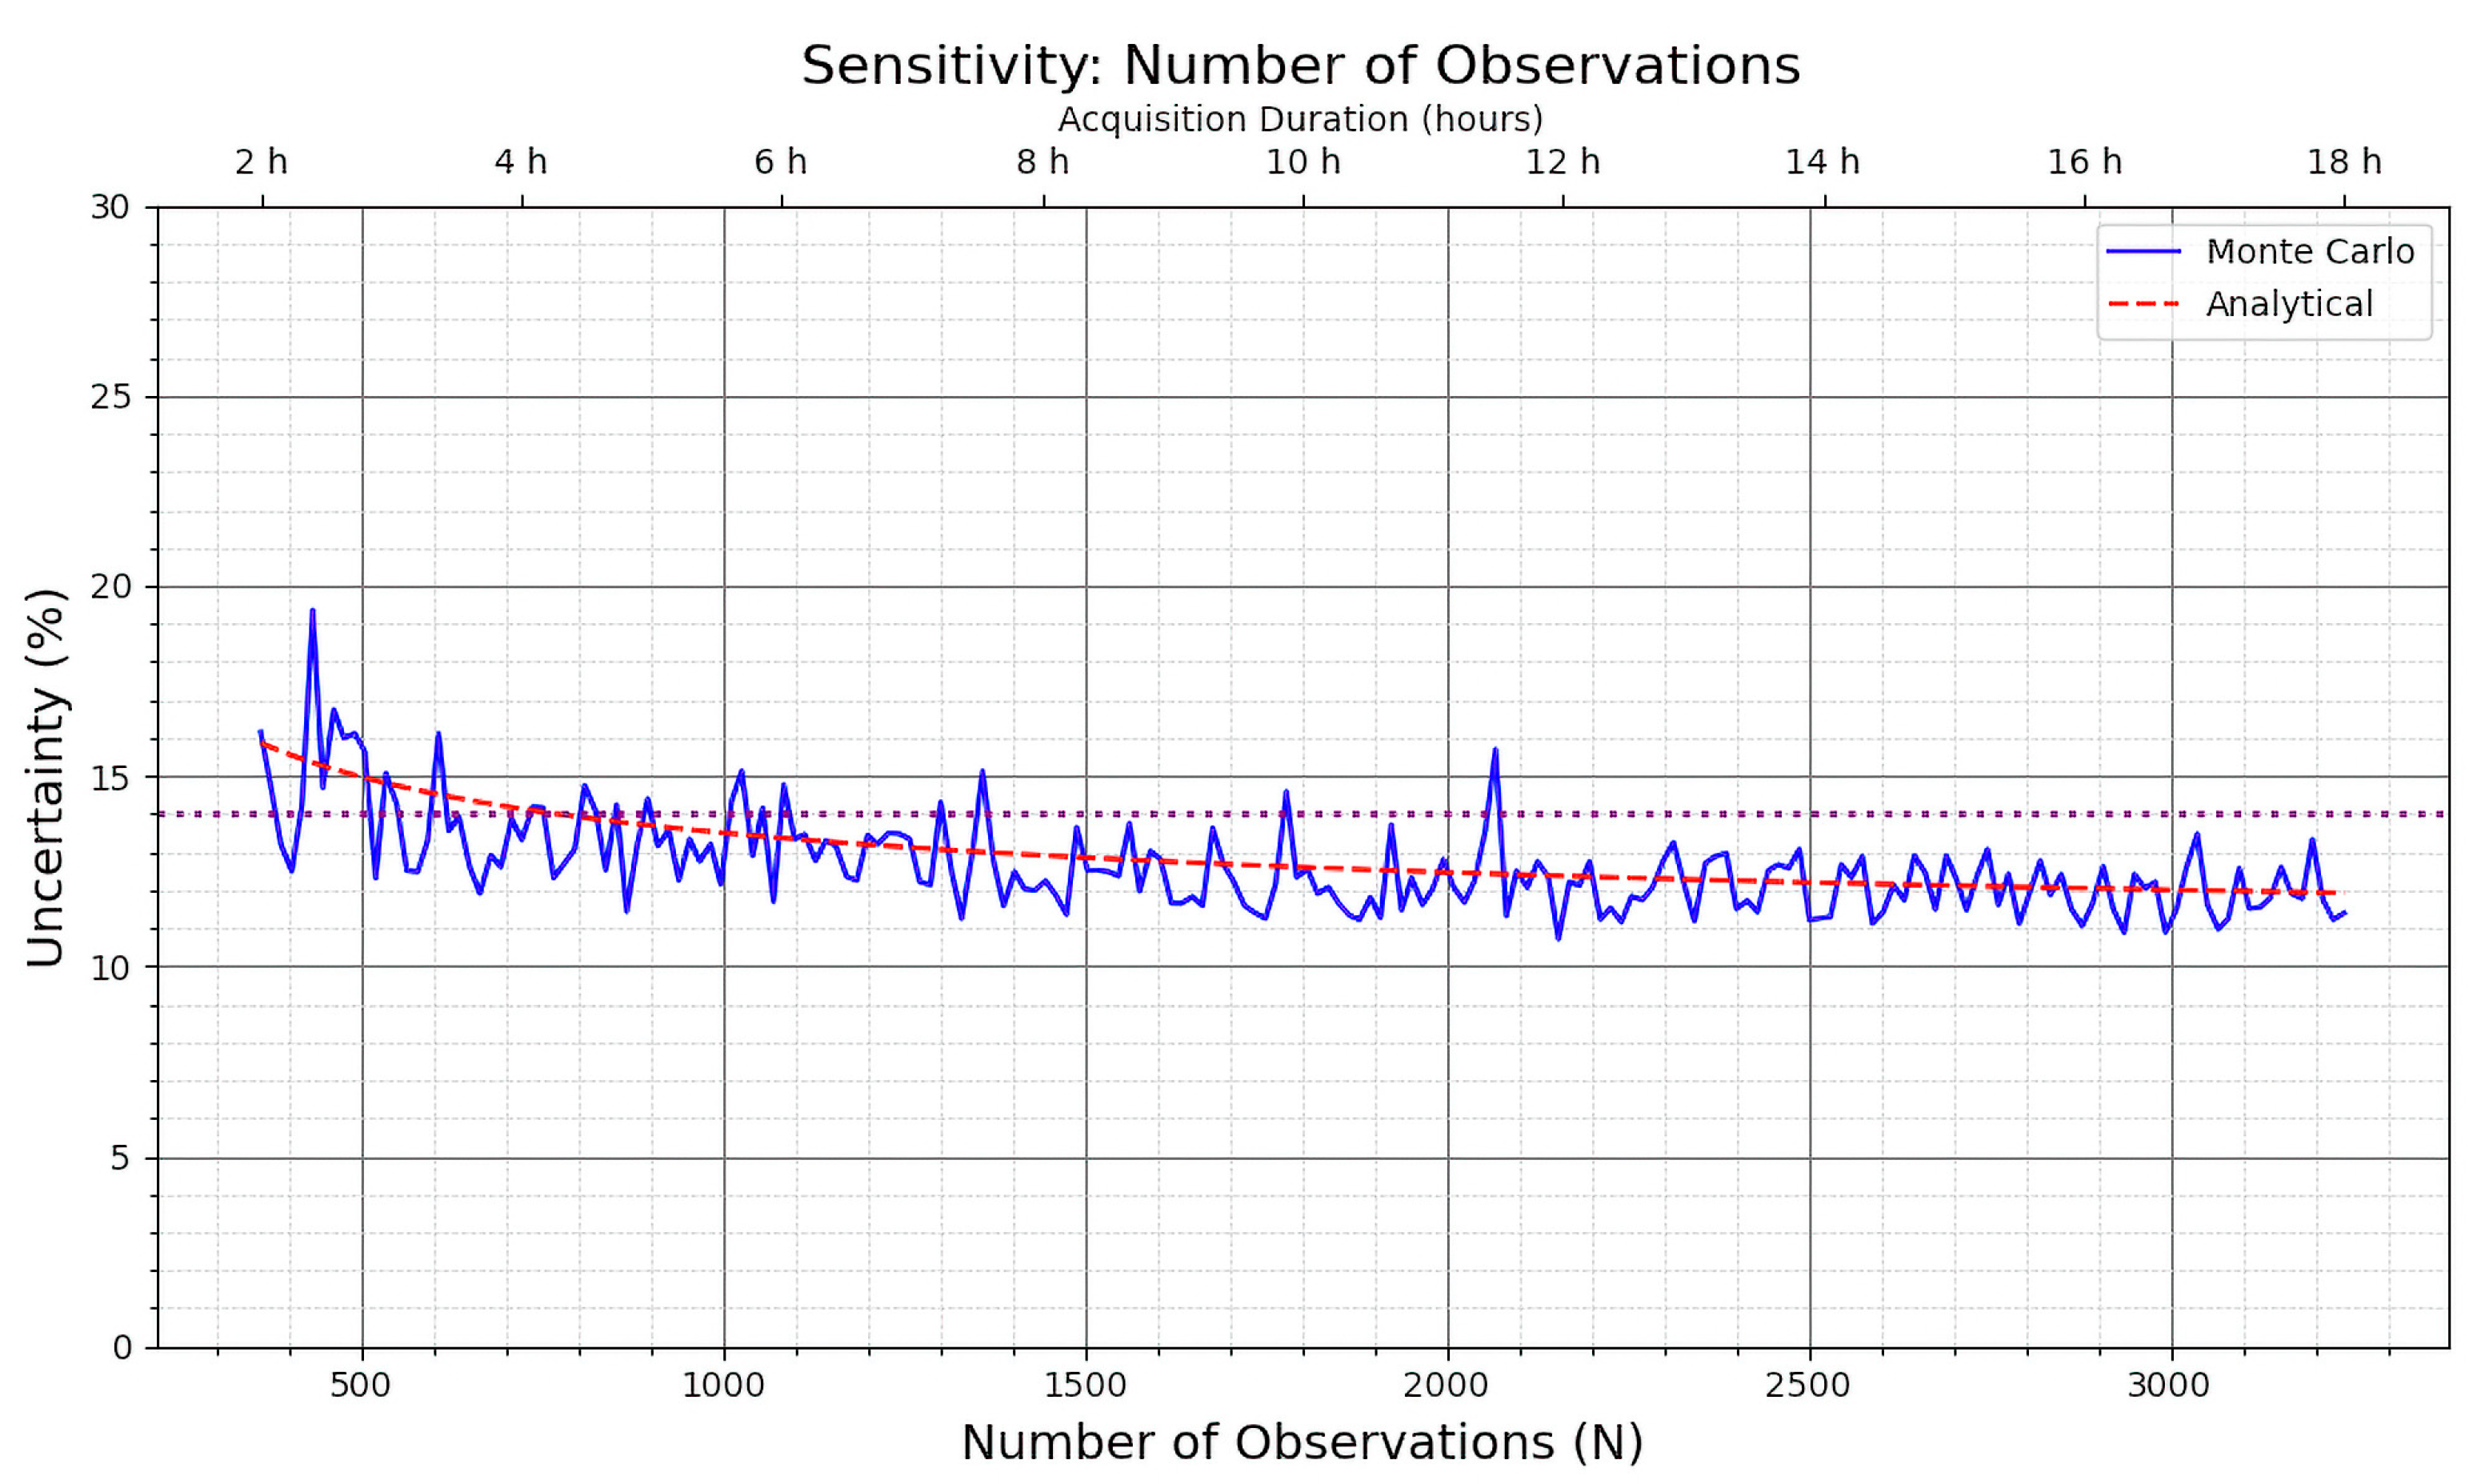
Lastly, the relationship between the uncertainty level and the number of observations can be evaluated. In Figure 9, both the Monte Carlo (blue) and analytical (red dashed) uncertainty values exhibit a general decline as the number of simulations increases, consistent with the anticipated reduction in random errors. Notably, a measurement duration of 4 h results in an uncertainty around 14%, indicating that even comparatively brief measurement campaigns (relative to the minimum 72 h required for opaque walls) can yield satisfactory results. Extending the measurement duration initially produces notable improvements; however, the benefits become marginal beyond 6 to 18 h.
The result suggests that it may be possible to perform sufficiently accurate measurements within one night, which was the primary aim of this study. Keeping the measurement period within this timeframe could offer practical and economic benefits, as extending the duration would increase the time spent on measuring the same glazing units and raise associated costs.

4. Conclusions and Future Research

This study confirms that reliable in situ measurement of thermal conductance in glazed façade elements is feasible, even within a relatively short measurement period such as a single night. However, achieving accurate results depends on several key factors.
First, having an adequate temperature gradient between the internal and external surfaces, of at least 5 K, is crucial to obtain sufficiently accurate results. This value is below the temperature gradient of 10 K recommended in the literature as being necessary for opaque walls. If the temperature difference is too small, the resulting heat flux through the glazing becomes minimal, amplifying the relative impact of sensor errors and reducing measurement reliability. The analysis also shows that higher-conductance systems require smaller gradients to achieve the same level of uncertainty as lower-conductance systems. However, it should be noted that this analysis omits dynamic effects. Specifically, it does not account for variable weather conditions typically observed in real-world scenarios.
Furthermore, systematic errors resulting from sensor setup significantly influence the overall measurement uncertainty. Therefore, addressing these biases is crucial for ensuring a reliable evaluation of glazed element conductance. Utilizing high-quality sensors and following stringent installation protocols are an acknowledged way to minimize such errors. As a reference, measurement configurations that align with the specified default characteristics typically achieve uncertainties below the target threshold of 14%. While acceptable results may be obtained with slightly higher systematic errors, it is recommended that deviations in HFM sensor readings do not exceed 9%, and temperature sensor errors remain below 0.2 K, in order to maintain measurement uncertainty within the 14% limit.
Random errors or noise can be reduced by increasing the number of measurements, thereby leveraging the averaging effect. Consequently, noise does not typically represent a significant limitation, provided that the measurement duration is sufficient to enable this effect. The data shows that while random errors contribute to total uncertainty, their effect is generally less significant and more readily controlled than that of systematic errors. According to this analysis, the length of the measurement campaign does not need to be excessively long, as long as the noise of the measures is kept at reasonable values. The findings suggest that a shorter measurement period, within one night, under stable conditions should be sufficient to obtain satisfactory results. Although extending the measurement duration to more than one night can improve accuracy, the benefits diminish beyond a certain point, such as 6 to 18 h.
The primary objective of this study was to identify the key factors contributing to overall uncertainty in thermal conductance measurements and to establish the conditions necessary for obtaining reliable results within a single night. These findings support the development of a robust in situ methodology for assessing the thermal conductance of glazing systems under actual operating conditions.
However, while the thermal inertia of glazing is typically less significant than that of opaque walls, its influence on thermal conductance measurements still requires careful assessment, as it may affect accuracy and prolong the testing process. Future research should therefore integrate dynamic factors—such as transient weather conditions and glazing inertia—into thermal models to provide a more realistic representation of real-world conditions. This will improve the reliability of results and clarify whether accurate in situ measurements of glazing elements can be achieved within a single night, ultimately supporting the development of robust experimental protocols for transparent building envelopes.

Author Contributions

Conceptualization, R.G., R.G.-M., G.D.M., G.P. and A.G.; Methodology, R.G. and R.G.-M.; Software, R.G.; Validation, R.G. and R.G.-M.; Formal Analysis, R.G. and R.G.-M.; Writing—Original Draft Preparation, R.G.; Writing—Review & Editing, R.G.-M., G.P., G.D.M. and A.G.; Supervision, R.G.-M., G.P., G.D.M. and A.G.; Project Administration, G.D.M.; Funding Acquisition, A.G. and G.D.M. All authors have read and agreed to the published version of the manuscript.

Funding

This research has been funded by the European Union-Next Generation EU, Mission 4 Component 1 CUP I52B22000830005 and developed in the framework of the PhD Research Scholarship “Façade commissioning, from early design to end of life for a user centered and zero emission building”, funded in the framework of the DM 352/2022 (PNRR) and co-funded by EURAC Research. It has also been developed in the framework of the project “Development of tools and methods for assessment, monitoring and control of the performance of VENTILATED Façades” (FAIR: Project EFRE1035, CUP: D53C23003090005, Programme EFRE-FESR 2021-2027).

Data Availability Statement

The original contributions presented in this study are included in the article. Further inquiries can be directed to the corresponding author.

Conflicts of Interest

The authors declare no conflicts of interest.

References

  1. De Wilde, P. The gap between predicted and measured energy performance of buildings: A framework for investigation. Autom. Constr. 2014, 41, 40–49. [Google Scholar] [CrossRef]
  2. Menezes, A.C.; Cripps, A.; Bouchlaghem, D.; Buswell, R. Predicted vs. actual energy performance of non-domestic buildings: Using post-occupancy evaluation data to reduce the performance gap. Appl. Energy 2012, 97, 355–364. [Google Scholar] [CrossRef]
  3. Sunikka-Blank, M.; Galvin, R. Introducing the prebound effect: The gap between performance and actual energy consumption. Build. Res. Inf. 2012, 40, 260–273. [Google Scholar] [CrossRef]
  4. Cozza, S.; Chambers, J.; Deb, C.; Scartezzini, J.L.; Schlüter, A.; Patel, M.K. Do energy performance certificates allow reliable predictions of actual energy consumption and savings? Learning from the Swiss national database. Energy Build. 2020, 224, 110235. [Google Scholar] [CrossRef]
  5. Palladino, D. Energy performance gap of the Italian residential building stock: Parametric energy simulations for theoretical deviation assessment from standard conditions. Appl. Energy 2023, 345, 121365. [Google Scholar] [CrossRef]
  6. National Institute of Building Sciences. NIBS Guideline 3-2012: Building Enclosure Commissioning Process BECx; National Institute of Building Sciences: Washington, DC, USA, 2012. [Google Scholar]
  7. ASHRAE. Guideline 0-2019: The Commissioning Process; ASHRAE: Atlanta, GA, USA, 2019. [Google Scholar]
  8. U.S. Green Building Council. LEED v4.1; U.S. Green Building Council: Washington, DC, USA, 2019. [Google Scholar]
  9. Demanega, I.; De Michele, G.; Pernigotto, G.; Gasparella, A.; Avesani, S. Development and experimental validation of a CFD model for the thermal behaviour assessment of Complex Fenestration Systems. J. Build. Eng. 2023, 68, 106150. [Google Scholar] [CrossRef]
  10. Song, A.; Kim, Y.; Hwang, S.; Shin, M.; Lee, S. A Comprehensive Review of Thermal Transmittance Assessments of Building Envelopes. Buildings 2024, 14, 3304. [Google Scholar] [CrossRef]
  11. Moghaddam, S.A.; Brett, M.; da Silva, M.G.; Simões, N. Comprehensive in-situ assessment of glazing systems: Thermal properties, comfort impacts, and machine learning-based predictive modelling. Build. Environ. 2025, 279, 113027. [Google Scholar] [CrossRef]
  12. Feng, Y.; Duan, Q.; Wang, J.; Baur, S. Approximation of building window properties using in situ measurements. Build. Environ. 2020, 169, 106590. [Google Scholar] [CrossRef]
  13. Goia, F.; Serra, V. Analysis of a non-calorimetric method for assessment of in-situ thermal transmittance and solar factor of glazed systems. Sol. Energy 2018, 166, 458–471. [Google Scholar] [CrossRef]
  14. Baracani, M.; Favoino, F.; Fantucci, S.; Serra, V.; Perino, M.; Introna, M.; Limbach, R.; Wondraczek, L. Experimental assessment of the energy performance of microfluidic glazing components: The first results of a monitoring campaign carried out in an outdoor test facility. Energy 2023, 280, 128052. [Google Scholar] [CrossRef]
  15. Favoino, F.; Goia, F.; Perino, M.; Serra, V. Experimental analysis of the energy performance of an ACTive, RESponsive and Solar (ACTRESS) façade module. Sol. Energy 2016, 133, 226–248. [Google Scholar] [CrossRef]
  16. Teni, M.; Krstić, H.; Kosiński, P. Review and comparison of current experimental approaches for in-situ measurements of building walls thermal transmittance. Energy Build. 2019, 203, 109417. [Google Scholar] [CrossRef]
  17. Lu, X.; Memari, A.M. Comparison of the experimental measurement methods for building envelope thermal transmittance. Buildings 2022, 12, 282. [Google Scholar] [CrossRef]
  18. ISO 9869-1:2014; Thermal Insulation—Building Elements—In-Situ Measurement of Thermal Resistance and Thermal Transmittance—Part 1: Heat Flow Meter Method. ISO: Geneva, Switzerland, 2014.
  19. Choi, D.S.; Ko, M.J. Analysis of convergence characteristics of average method regulated by ISO 9869-1 for evaluating in situ thermal resistance and thermal transmittance of opaque exterior walls. Energies 2019, 12, 1989. [Google Scholar] [CrossRef]
  20. Jung, D.E.; Yoo, S.; Lee, K.H.; Kim, J. In-situ measurement of thermal transmittance of building walls: Evaluation of stored heat flux in heavy-weight walls during the cooling season. Energy Build. 2024, 325, 114981. [Google Scholar] [CrossRef]
  21. ISO 8990:1994; Thermal Insulation—Determination of Steady-State Thermal Transmission Properties—Calibrated and Guarded Hot Box. ISO: Geneva, Switzerland, 1994.
  22. ISO 9869-2:2018; Thermal Insulation—Building Elements—In-Situ Measurement of Thermal Resistance and Thermal Transmittance—Part 2: Infrared Method for Frame Structure Dwelling. ISO: Geneva, Switzerland, 2018.
  23. Albatici, R.; Tonelli, A.M. Infrared thermovision technique for the assessment of thermal transmittance value of opaque building elements on site. Energy Build. 2010, 42, 2177–2183. [Google Scholar] [CrossRef]
  24. ISO 9869-3:2023; Thermal Insulation of Building Elements—In-Situ Measurement of Thermal Resistance and Thermal Transmittance—Part 3: Probe Insertion Method. ISO: Geneva, Switzerland, 2023.
  25. Bienvenido-Huertas, D.; Rodríguez-Álvaro, R.; Moyano, J.J.; Rico, F.; Marín, D. Determining the U-value of façades using the thermometric method: Potentials and limitations. Energies 2018, 11, 360. [Google Scholar] [CrossRef]
  26. Kim, S.H.; Kim, J.H.; Jeong, H.G.; Song, K.D. Reliability field test of the air-surface temperature ratio method for in situ measurement of U-values. Energies 2018, 11, 803. [Google Scholar] [CrossRef]
  27. Jankovic, A.; Antunovic, B.; Preradovic, L. Alternative method for on site evaluation of thermal transmittance. Facta Univ. Ser. Mech. Eng. 2017, 15, 341–351. [Google Scholar] [CrossRef]
  28. Ficco, G.; Iannetta, F.; Ianniello, E.; D’Ambrosio Alfano, F.R.; Dell’Isola, M. U-value in situ measurement for energy diagnosis of existing buildings. Energy Build. 2015, 104, 108–121. [Google Scholar] [CrossRef]
  29. Gaspar, K.; Casals, M.; Gangolells, M. Review of criteria for determining HFM minimum test duration. Energy Build. 2018, 176, 360–370. [Google Scholar] [CrossRef]
  30. Garay-Martinez, R.; Arregi, B.; Lumbreras, M. Surface heat transfer coefficients in building envelopes: Uncertainty levels in experimental methods. J. Build. Phys. 2023, 47, 62–91. [Google Scholar] [CrossRef]
  31. Nardi, I.; Lucchi, E. In Situ Thermal Transmittance Assessment of the Building Envelope: Practical Advice and Outlooks for Standard and Innovative Procedures. Energies 2023, 16, 3319. [Google Scholar] [CrossRef]
  32. Rasooli, A.; Itard, L.; Ferreira, C.I. A response factor-based method for the rapid in-situ determination of wall’s thermal resistance in existing buildings. Energy Build. 2016, 119, 51–61. [Google Scholar] [CrossRef]
  33. Sonderegger, R.C.; Modera, M.P. Electric coheating: A method for evaluating seasonal heating efficiencies and heat loss rates in dwellings. In Proceedings of the Second CIB Symposium on Energy Conservation in the Built Environment, Copenhagen, Denmark, 28 May–1 June 1979; Lawrence Berkeley National Laboratory: Berkeley, CA, USA, 1979; p. LBL-8949. [Google Scholar]
  34. Uriarte, I.; Erkoreka, A.; Giraldo-Soto, C.; Martin, K.; Uriarte, A.; Eguia, P. Mathematical development of an average method for estimating the reduction of the Heat Loss Coefficient of an energetically retrofitted occupied office building. Energy Build. 2019, 192, 101–122. [Google Scholar] [CrossRef]
  35. Alzetto, F.; Pandraud, G.; Fitton, R.; Heusler, I.; Sinnesbichler, H. QUB: A fast dynamic method for in-situ measurement of the whole building heat loss. Energy Build. 2018, 174, 124–133. [Google Scholar] [CrossRef]
  36. Aguilar-Santana, J.L.; Velasco-Carrasco, M.; Riffat, S. Thermal transmittance (U-value) evaluation of innovative window technologies. Future Cities Environ. 2020, 6, 12. [Google Scholar] [CrossRef]
  37. Bartko, M.; Durica, P. Experimental analysis of thermo-technical parameters of windows glazing in the pavilion laboratory. Buildings 2023, 13, 1026. [Google Scholar] [CrossRef]
  38. ZAE Bayern. 2013 Tätigkeitsbericht Annual Report. 2013. Available online: http://www.zae-bayern.de (accessed on 25 July 2025).
  39. Berkeley Lab. Mobile Window Thermal Test (MoWiTT) Facility; Lawrence Berkeley National Laboratory: Berkeley, CA, USA, 2023.
  40. Fraunhofer IBP. Calorimetric Façade and Roof Test Facility. Available online: https://www.pruefstellen.ibp.fraunhofer.de/en/energyefficiencyandindoorclimate/calorimetric-test-facility.html (accessed on 25 July 2025).
  41. Kersken, M. Method for the climate-independent determination of the solar heat gain coefficient (SHGC; g-value) of transparent façade and membrane constructions from in situ measurements. Energy Build. 2021, 239, 110866. [Google Scholar] [CrossRef]
  42. European Parliament and Council. Directive (EU) 2024/1275 of 24 April 2024 on the energy performance of buildings (recast). Off. J. Eur. Union 2024, L 2024/1275, 1–68. [Google Scholar]
  43. Minguez, L.; Isaia, F.; Demanega, I.; Gennaro, G.; De Michele, G.; Gazzin, R. Deliverable 3.3: Active Window Configurator Tool; European Commission: Luxembourg, 2021. [Google Scholar]
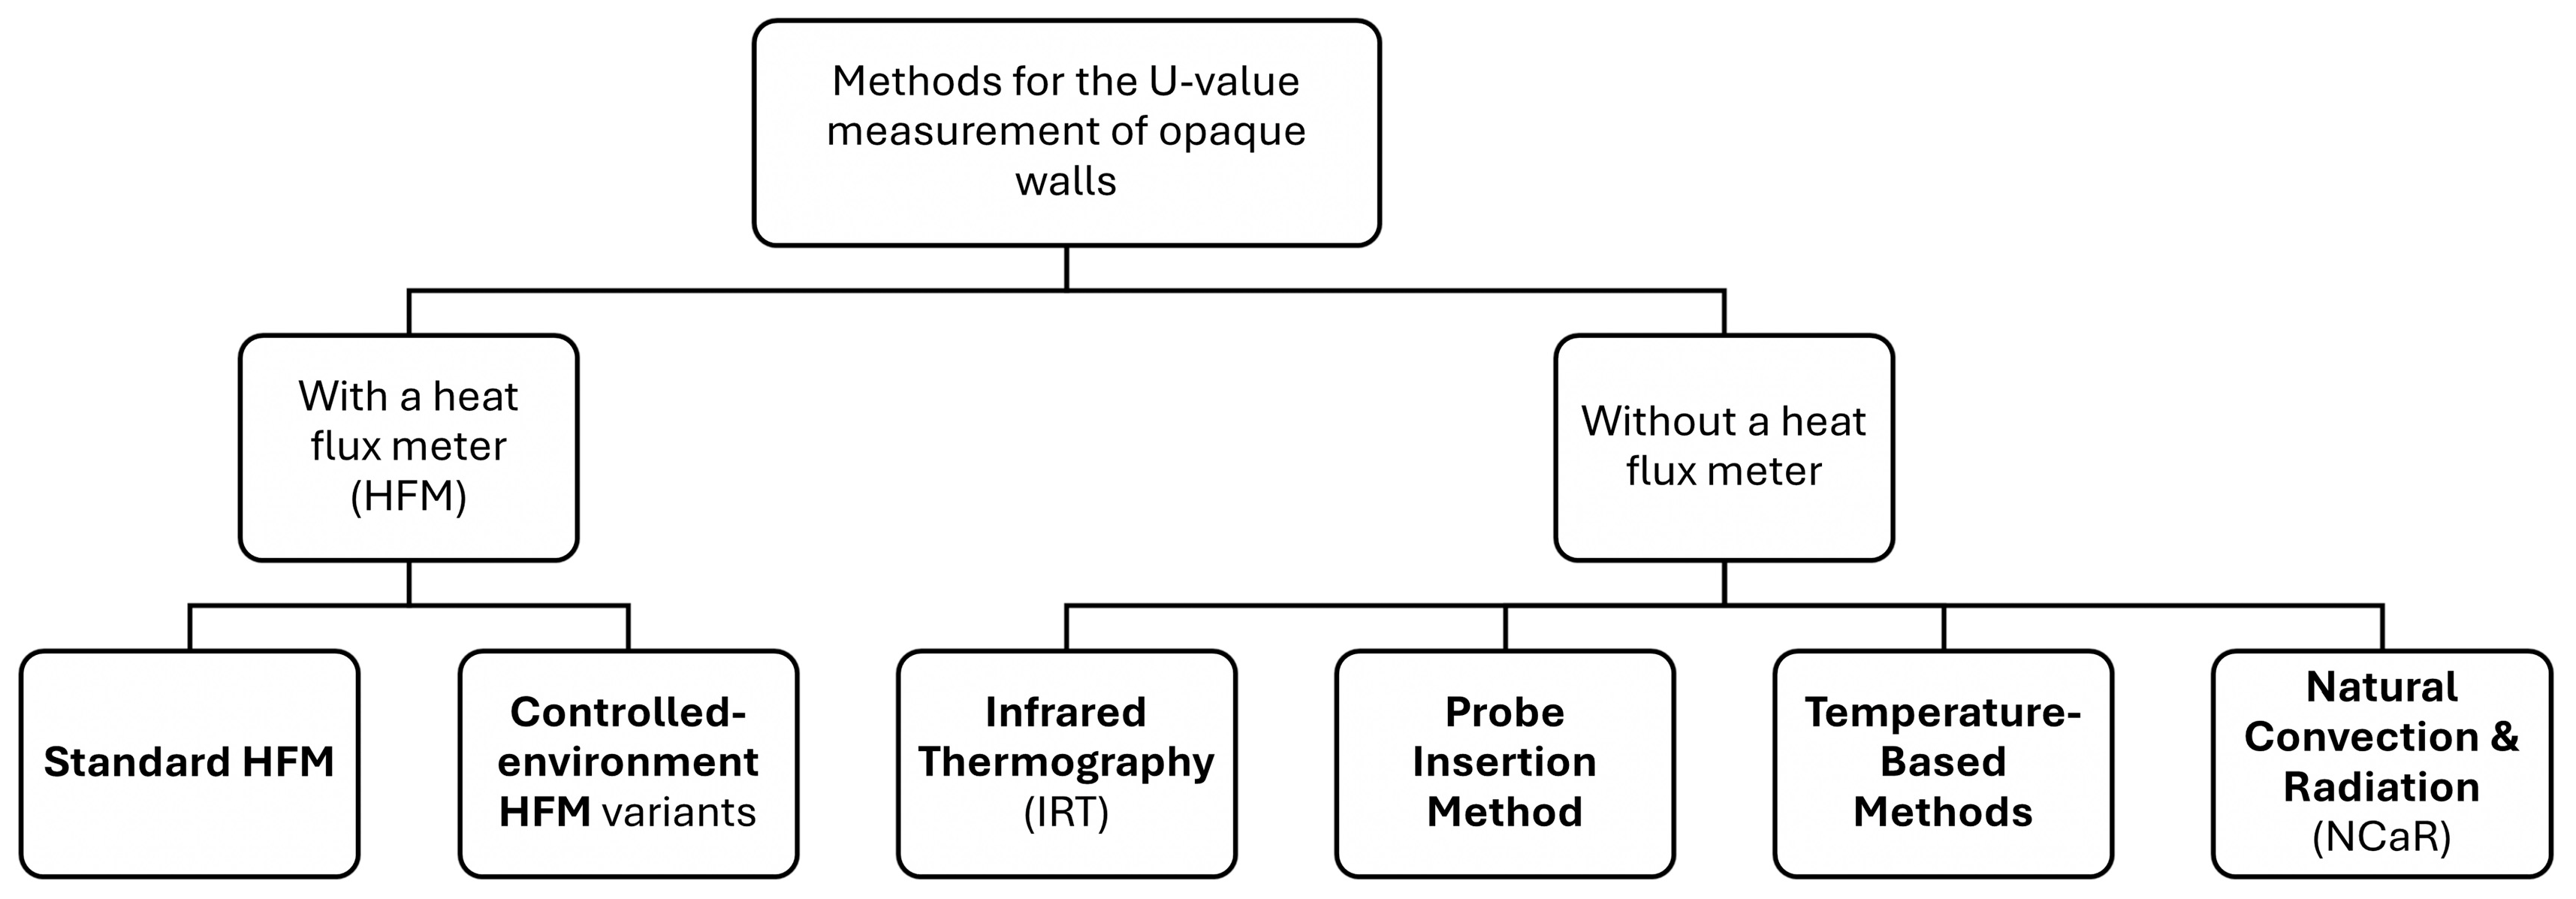
Figure 1. Principal methodologies for measuring the U-value of opaque walls.
Buildings 15 03504 g001
Figure 2. Workflow of the adopted methodology.
Buildings 15 03504 g002
Figure 3. Depiction of the sensors’ setup employed for measuring thermal conductance in a glazing unit.
Buildings 15 03504 g003
Figure 4. Sensitivity analysis of the Temperature Difference.
Buildings 15 03504 g004
Figure 5. Sensitivity analysis of the systematic errors for temperature sensors.
Buildings 15 03504 g005
Figure 6. Sensitivity analysis of the systematic errors for HFM sensors.
Buildings 15 03504 g006
Figure 7. Sensitivity analysis of random errors for temperature sensors.
Buildings 15 03504 g007
Figure 8. Sensitivity analysis of random errors for HFM sensors.
Buildings 15 03504 g008
Figure 9. Sensitivity analysis of the number of observations and corresponding acquisition duration. The bottom x-axis shows the number of observations; the top axis shows the equivalent duration.
Buildings 15 03504 g009
Table 1. Default, maximum and minimum values of the measurement conditions for the sensitivity analysis.
VariableDefault ValueMin. ValueMax. Value
Δ T (K)7.02.020.0
Systematic error of temperature sensors (K)0.10.010.5
Systematic error of the heat flux meter (%)7.11.020.0
Noise of temperature sensors (K)0.070.010.5
Noise of the heat flux meter (W/m2)4.01.010.0
N of (simulated) measurements 1080 (6 h)360 (2 h)3240 (18 h)
Disclaimer/Publisher’s Note: The statements, opinions and data contained in all publications are solely those of the individual author(s) and contributor(s) and not of MDPI and/or the editor(s). MDPI and/or the editor(s) disclaim responsibility for any injury to people or property resulting from any ideas, methods, instructions or products referred to in the content.