Article

Design and Validation of a Compact, Low-Cost Sensor System for Real-Time Indoor Environmental Monitoring

Department of Architecture, Built Environment and Construction Engineering, Politecnico di Milano, Via Ponzio 31, 20133 Milan, Italy
*
Author to whom correspondence should be addressed.
Buildings 2025, 15(19), 3440; https://doi.org/10.3390/buildings15193440
Submission received: 27 July 2025 / Revised: 12 September 2025 / Accepted: 16 September 2025 / Published: 23 September 2025

Abstract

The growing interest in smart buildings and the integration of IoT-based technologies is driving the development of new tools for monitoring and optimizing indoor environmental quality (IEQ). However, many existing solutions remain expensive, invasive and inflexible. This paper presents the design and validation of a compact, low-cost, and real-time sensor system, conceived for seamless integration into indoor environments. The system measures key parameters—including air temperature, relative humidity, illuminance, air quality, and sound pressure level—and is embeddable in standard office equipment with minimal impact. Leveraging 3D printing and open-source hardware/software, the proposed solution offers high affordability (approx. EUR 33), scalability, and potential for workspace retrofits. To assess the system’s performance and relevance, dynamic simulations were conducted to evaluate metrics such as the Mean Radiant Temperature (MRT) and illuminance in an open office layout. In addition, field tests with a functional prototype enabled model validation through on-site measured data. The results highlighted significant local discrepancies—up to 6.9 °C in MRT and 28 klx in illuminance—compared to average conditions, with direct implications for thermal and visual comfort. These findings demonstrate the system’s capacity to support high-resolution environmental monitoring within IoT-enabled buildings, offering a practical path toward the data-driven optimization of occupant comfort and energy efficiency.

1. Introduction

In an era in which people spend about 90% of their time indoors, the indoor environmental quality (IEQ) may significantly impact the comfort sensation, productivity, well-being, and psychological health of users [1]. The reduction in energy use is prominent to decarbonize the building sector, which accounts for about 40% of the total energy consumption in the EU [2]. In this framework, heating, ventilation, and air conditioning (HVAC) and lighting systems are employed to control the environment and to enhance the user’s experience inside buildings. Nevertheless, these systems are mostly controlled using a “one size fits all” approach considering a limited number of reference points and providing ideally uniform conditions for all the occupants, even in large and heterogeneous buildings. On the other hand, several studies highlight how mood, activities, personal preferences, age, and gender can influence user preferences. Moreover, occupants may experience different climatic conditions based on their position with respect to windows, supply vents, radiators, or any emission system without having direct control over it [3]. In this sense, having a punctual local measurement device integrated within a typical work environment can provide valuable insights both for occupants and facility managers, especially in existing buildings, which are expected to represent 85–90% of the building stock still in use in 2050 [4]. However, currently available systems fail to offer a solution that is simultaneously cost-effective, compact, flexible, and comprehensive for an accurate assessment. The present research aims to detail the design development of a fully integrated multi-purpose sensor system embeddable into an object typically present on desks (i.e., a desk lamp) to carry out local environmental monitoring. The device has a short and intuitive installation process and can provide fairly accurate measurements related to the occupants’ local conditions. The study includes both in situ validation and simulation. The desk lamp alpha prototype is deployed in an occupied laboratory, and a computational model of the same environment is developed to estimate the environmental metrics. The capabilities of this system can enhance occupant comfort and well-being, generate energy savings, and provide facility managers with actionable insight into occupants’ local environmental perceptions, ultimately fostering healthier and more sustainable indoor spaces through a data-driven approach and potentially complementing the passive, nature-based retrofits of the building [5].

1.1. Environmental Variables Affecting Human Comfort and Physical Measurement

In the study of IEQ, multiple variables play a crucial role in determining occupant comfort, productivity, and well-being. Identifying these variables may help to spot key elements affecting the occupant’s comfort sensation. These parameters can be quantified using both direct and indirect techniques and sensors can provide an accurate picture of environmental conditions. For this reason, a review is proposed reporting some of the most recurring environmental variables present in comfort models and standards with the associated measurement. Table A1, included in Appendix A, is divided into domains considering four macro-categories: thermal comfort, visual comfort, air quality, and acoustic comfort.
Thermal comfort is influenced by a variety of environmental and personal factors that are included in Fanger’s [6], adaptive [7], and personal [8] thermal comfort models. In particular, Fanger’s models incorporate both environmental variables (such as air temperature and air velocity) and personal factors (such as clothing insulation and metabolic rate) to calculate the Predicted Mean Vote (PMV) and Predicted Percentage of Dissatisfied (PPD) metrics. Adaptive models also consider outdoor conditions, recognizing that people may adapt to varying temperatures according to external environmental conditions. Personal thermal comfort models emerged in the literature due to their high dependency and adaptability based on personal features. Visual comfort is another essential component of IEQ, largely determined by factors such as illuminance, contrast, luminance, and glare. These variables are assessed using standards such as the ISO-8995 [9] or UNI EN-12464 [10], which suggest limiting values or ranges so as not to cause excessive discomfort to the user. Indoor air quality (IAQ) has a significant impact on both health and comfort, and numerous standards, certification schemes and intergovernmental organizations published guidelines over the years. Among the various pollutants, CO2, volatile organic compounds (VOCs), and particulate matter (PM10/PM2.5) appear to be the most regulated, whereas substances like radon, HCHO, SO2, O3, CO, and NOX are also recognized for their potential health impact and are increasingly subject to monitoring. In line with this, certification frameworks such as WELL [11] and LEED [12] emphasize the importance of monitoring VOCs and PM to ensure that indoor air is free of harmful contaminants, aiming to protect building occupants from long-term exposure to poor air. The World Health Organization (WHO) [13] and the Environmental Protection Agency (EPA) [14] guidelines are generally also applicable to outdoor air. Different types of sensors, which often use electrochemical mechanisms to detect pollutants, are necessary for an appropriate assessment. Acoustic comfort is critical for occupant well-being, particularly in office environments where noise can disrupt focus and productivity. Acoustic comfort is measured using phonometers and sound level meters, and solid comfort models are still under development in the literature. However, the study by Vardaxis et al. [15] identifies common metrics among 19 models or assessment methods regarding the acoustics in indoor environments. Noise plays a crucial role in defining the type of sound and the bearing threshold of the occupant. Also, standards like ISO-717 [16] provide metric ranges for different types of environments.

1.2. Post-Occupancy Evaluation Monitoring Techniques

Post-occupancy evaluation (POE) is defined in the literature as the “process of systematically evaluating the performance of buildings after they have been built and occupied for some time” [17] and consists of a method or approach used to gather feedback about a building’s performance after its occupancy. It focuses on various aspects such as energy efficiency, IEQ, and occupant satisfaction, providing valuable information to designers, building managers, and stakeholders. This feedback may help to improve current building operations and inform future design decisions.
In particular, the advantages associated with POE include benefits achievable in the short, mid, or long term. The potential improvement in occupant satisfaction obtained by aligning spaces’ conditions more closely with user needs and also reducing operational costs and building footprints through optimized building management is classified as a short-term benefit, while the enrichment of the design practices may improve current tools and knowledge in the early phases of the project (mid-term benefit). Moreover, the enrichment of the knowledge database and an evaluation of the solution adopted could assist designers in the long term. However, the implementation of POE does not come without barriers, and the most significant challenges are the industry’s traditional resistance to innovation, the definition of shared benchmarks, the cost related to this practice, and the liability of stakeholders in the process [18]. Additionally, POE can be seen as intrusive by building occupants, which may limit their participation, especially when more detailed and invasive methods are employed [19]. POE was positioned in the early adoption phase, according to Li et al. [20], who indicated a series of problems that are slowing its adoption such as the split of incentives, reliability issues, and lack of standardization.
The expected result of a POE analysis strictly depends on the desired level of the investigation, data, instruments, and time available for the study. In particular, indicative, investigative, and diagnostic POEs are three different levels of analysis [21]. The first level, indicative POEs, is a preliminary evaluation that identifies major successes and failures in a building’s performance. It is mainly resource-efficient and relies on walkthroughs, interviews, photography, and basic questionnaires, serving as an introductory assessment. The second level, investigative POEs, delves deeper, typically following up on issues identified in the indicative phase. This level requires more detailed methodologies, including structured questionnaires, focus groups, and visual documentation, providing qualitative insights into the specific issues present in the building. The third and most comprehensive level among them all, diagnostic POEs, involves a highly specialized analysis using advanced techniques and tools. It focuses on both the occupants’ experiences and the functionality of environmental systems, offering in-depth findings that provide long-term recommendations for not only addressing issues in a particular facility but also informing the design of future buildings, contributing to broader knowledge in the field. Survey techniques used in POEs are generally categorized into direct and indirect methods or objective and subjective methods [22]. Direct techniques involve engaging building occupants through surveys, interviews, and walkthroughs, which provide qualitative insights into occupant satisfaction and specific issues and complaints within the building environment. These methods allow for a deeper understanding of user experiences and needs. On the other hand, indirect techniques adopt monitoring systems, environmental sensors, and data loggers to collect objective data on parameters such as energy consumption, indoor environmental comfort, and occupancy patterns. Indirect methods are usually less intrusive and provide continuous data that can reveal performance trends over time, complementing the qualitative insights gained from direct techniques. A study conducted in 2018 [20] reviewing a series of POE analyses showed that occupant surveys (82% of the studies), interviews (46% of the studies), and thermal comfort monitoring (43% of the studies) are the three most popular tools adopted in a POE analysis. In general, a combination of both direct and indirect survey techniques should be preferred to allow the POE to offer a comprehensive evaluation of building performance.
During the past years, a series of POE protocols was created to develop a guide to the evaluation process. These protocols provide standardized approaches to measure and analyze the building performance across various dimensions. An analysis of the most shared protocols in the literature is proposed as a table in Appendix B. Many protocols were introduced in the past decade, with a peak between 2010 and 2015, with a concentration in North America (US and Canada). The table indicates that most protocols operate at a diagnostic or diagnostic-capable depth, reflecting an emphasis on instrumented, root-cause assessments rather than screening-only surveys. Data are most frequently collected via snapshot (typically, assessments are over hours to days) or short-campaign (usually lasting some weeks) deployments, while annual or seasonal monitoring is comparatively rare and mostly linked to energy/operations benchmarking. BOSSA [23], PMP [24], and HOPE [25] are some of the most popular protocols among the others. They recommend a mix of subjective and objective methods for environmental monitoring, combining occupant feedback with relevant environmental data. The use of established POE protocols helps to ensure consistency in data collection and evaluation, allowing for meaningful comparisons between different buildings or spaces. However, in 2024, none of them are consistently used worldwide due to a multitude of factors such as technological barriers, a not always clear definition of the scope, and the involvement of stakeholders [26].

1.3. Integrated Sensor Systems for Assessing Local IEQ

The assessment of IEQ on a local scale requires a system which is capable of capturing a series of metrics used to monitor the environment. There are various devices designed for detecting the local condition near the occupant, but many of them present limitations such as the spatial footprint, the integrability with the environment, or the excessive cost.
An example is the Smart IoT desk for personalizing indoor environmental conditions by Aryal et al. [27]. The study focuses on developing a smart desk that adapts to user preferences, thereby potentially enhancing comfort, health, and productivity. This desk integrates sensors to detect air quality, illuminance on the desk plane, temperature, and relative humidity. Over three iterations, the desk has evolved from basic environmental monitoring capabilities to more personalized features, allowing the user to actively manage the local environment by including personal comfort systems. The device is conceived as a self-standing system, only needing electricity and an internet connection. The disadvantages of this approach may be the low adaptability to environments that are already occupied, considering that desks should be completely replaced. Another noteworthy case is the LSI Lastem multi-objective indoor sensor (Sphensor) [28]. This Italian company specializes in environmental monitoring solutions and offers multiparameter sensors capable of long-term monitoring on a room scale. The model is a compact device that can measure a wide range of environmental parameters including temperature, humidity, air quality, and light levels. The data are transmitted via radio signals and analyzed through a dedicated app. This system comes in different versions, which have a simple user interface and limited footprint compared to the smart desk. On the other hand, the device can be quite expensive, and the optimal positioning can be hindered by the bulk of the system on a normal desk, resulting in a loss of precision.
Several smart desk lamps are currently available on the market, typically equipped with sensors and offering direct user interaction. A total of 23 studies focusing on smart lamp models were identified in the literature. Their main characteristics (such as type of study, variables of interest, control inputs, and integrated sensors) are summarized in Appendix C. As highlighted in the previous literature reviews [29,30], the distribution of studies across target categories is unbalanced, with residential and office settings receiving significantly more attention than other environments. The main focus appears to be “energy saving” (93% over the total), considering that a reduction in energy consumption can be achieved through a reduction in operating hours and/or the light intensity (most of the studies) or communication with the heating/cooling system (less common). Well-being is covered in the 39% of the studies. In addition, the reviewed studies show that combining occupancy and lighting sensors is a common approach in the literature. Some studies underline how the potential savings in offices can vary from 15% to 95% over manual control systems, and this estimation is usually performed through mathematical models (76%), field experiments (24%), or a mix of them. It appears that the automatization of light control typically brings positive effects concerning both comfort and energy savings in work environments. Their effectiveness is dependent on the geographical location, user preferences, capability of the system, usage, and geometry of the room. Other studies show how automatic systems have to be combined with some level of personal control to achieve an improvement in users’ productivity [31].

2. Materials and Methods

The present research was organized following the sequential workflow outlined in Figure 1. In particular, the Materials and Methods chapter is organized in two parallel phases: (i) the system–architecture stream, which details the sensor circuitry, functional integration, prototyping and the cost breakdown; and (ii) the simulation stream, where the daylight and energy models are presented. Outputs from these two phases feed directly into the Results chapter, in which the simulation results are proposed, as well as the final step of physical measurement recorded in the room is analyzed, and the validation, in which the functionality of the device is assessed and verified, takes place.

2.1. System Architecture and Sensor Definition

2.1.1. Sensor Circuit and Functioning

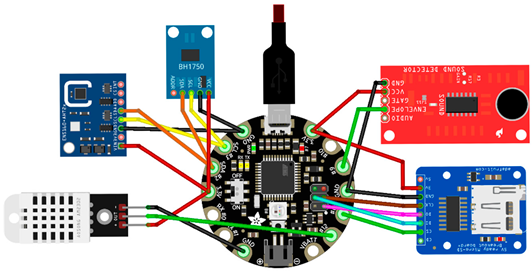
The designed system should comply with the initial requirement of cost-effectiveness and compactness. For this reason, considering the listed variables affecting human comfort and the availability of sensors in the market, four sensor devices were selected to measure illuminance, air quality in terms of total VOC (TVOC) and eCO2, an estimated CO2 level based on TVOC measurement, air temperature, relative humidity, and noise (sound pressure level and frequency). Variables such as heart rate or specific pollutant concentrations were excluded because of the difficulty of measuring the quantities in a self-standing system, as well as the sensor availability and price. Thus, Table 1 details the technical characteristics of the sensors chosen for lighting (BH1750 [32]), air quality (ENS160 + AHT21 [33]), temperature and relative humidity (DHT22 [34]), and sound pressure (Sparkfun sound detector [35]). The sensors were selected according to the following criteria:
-
A measurement range and accuracy suitable for indoor applications;
-
Reduced dimensions;
-
Ease of installation and integration.
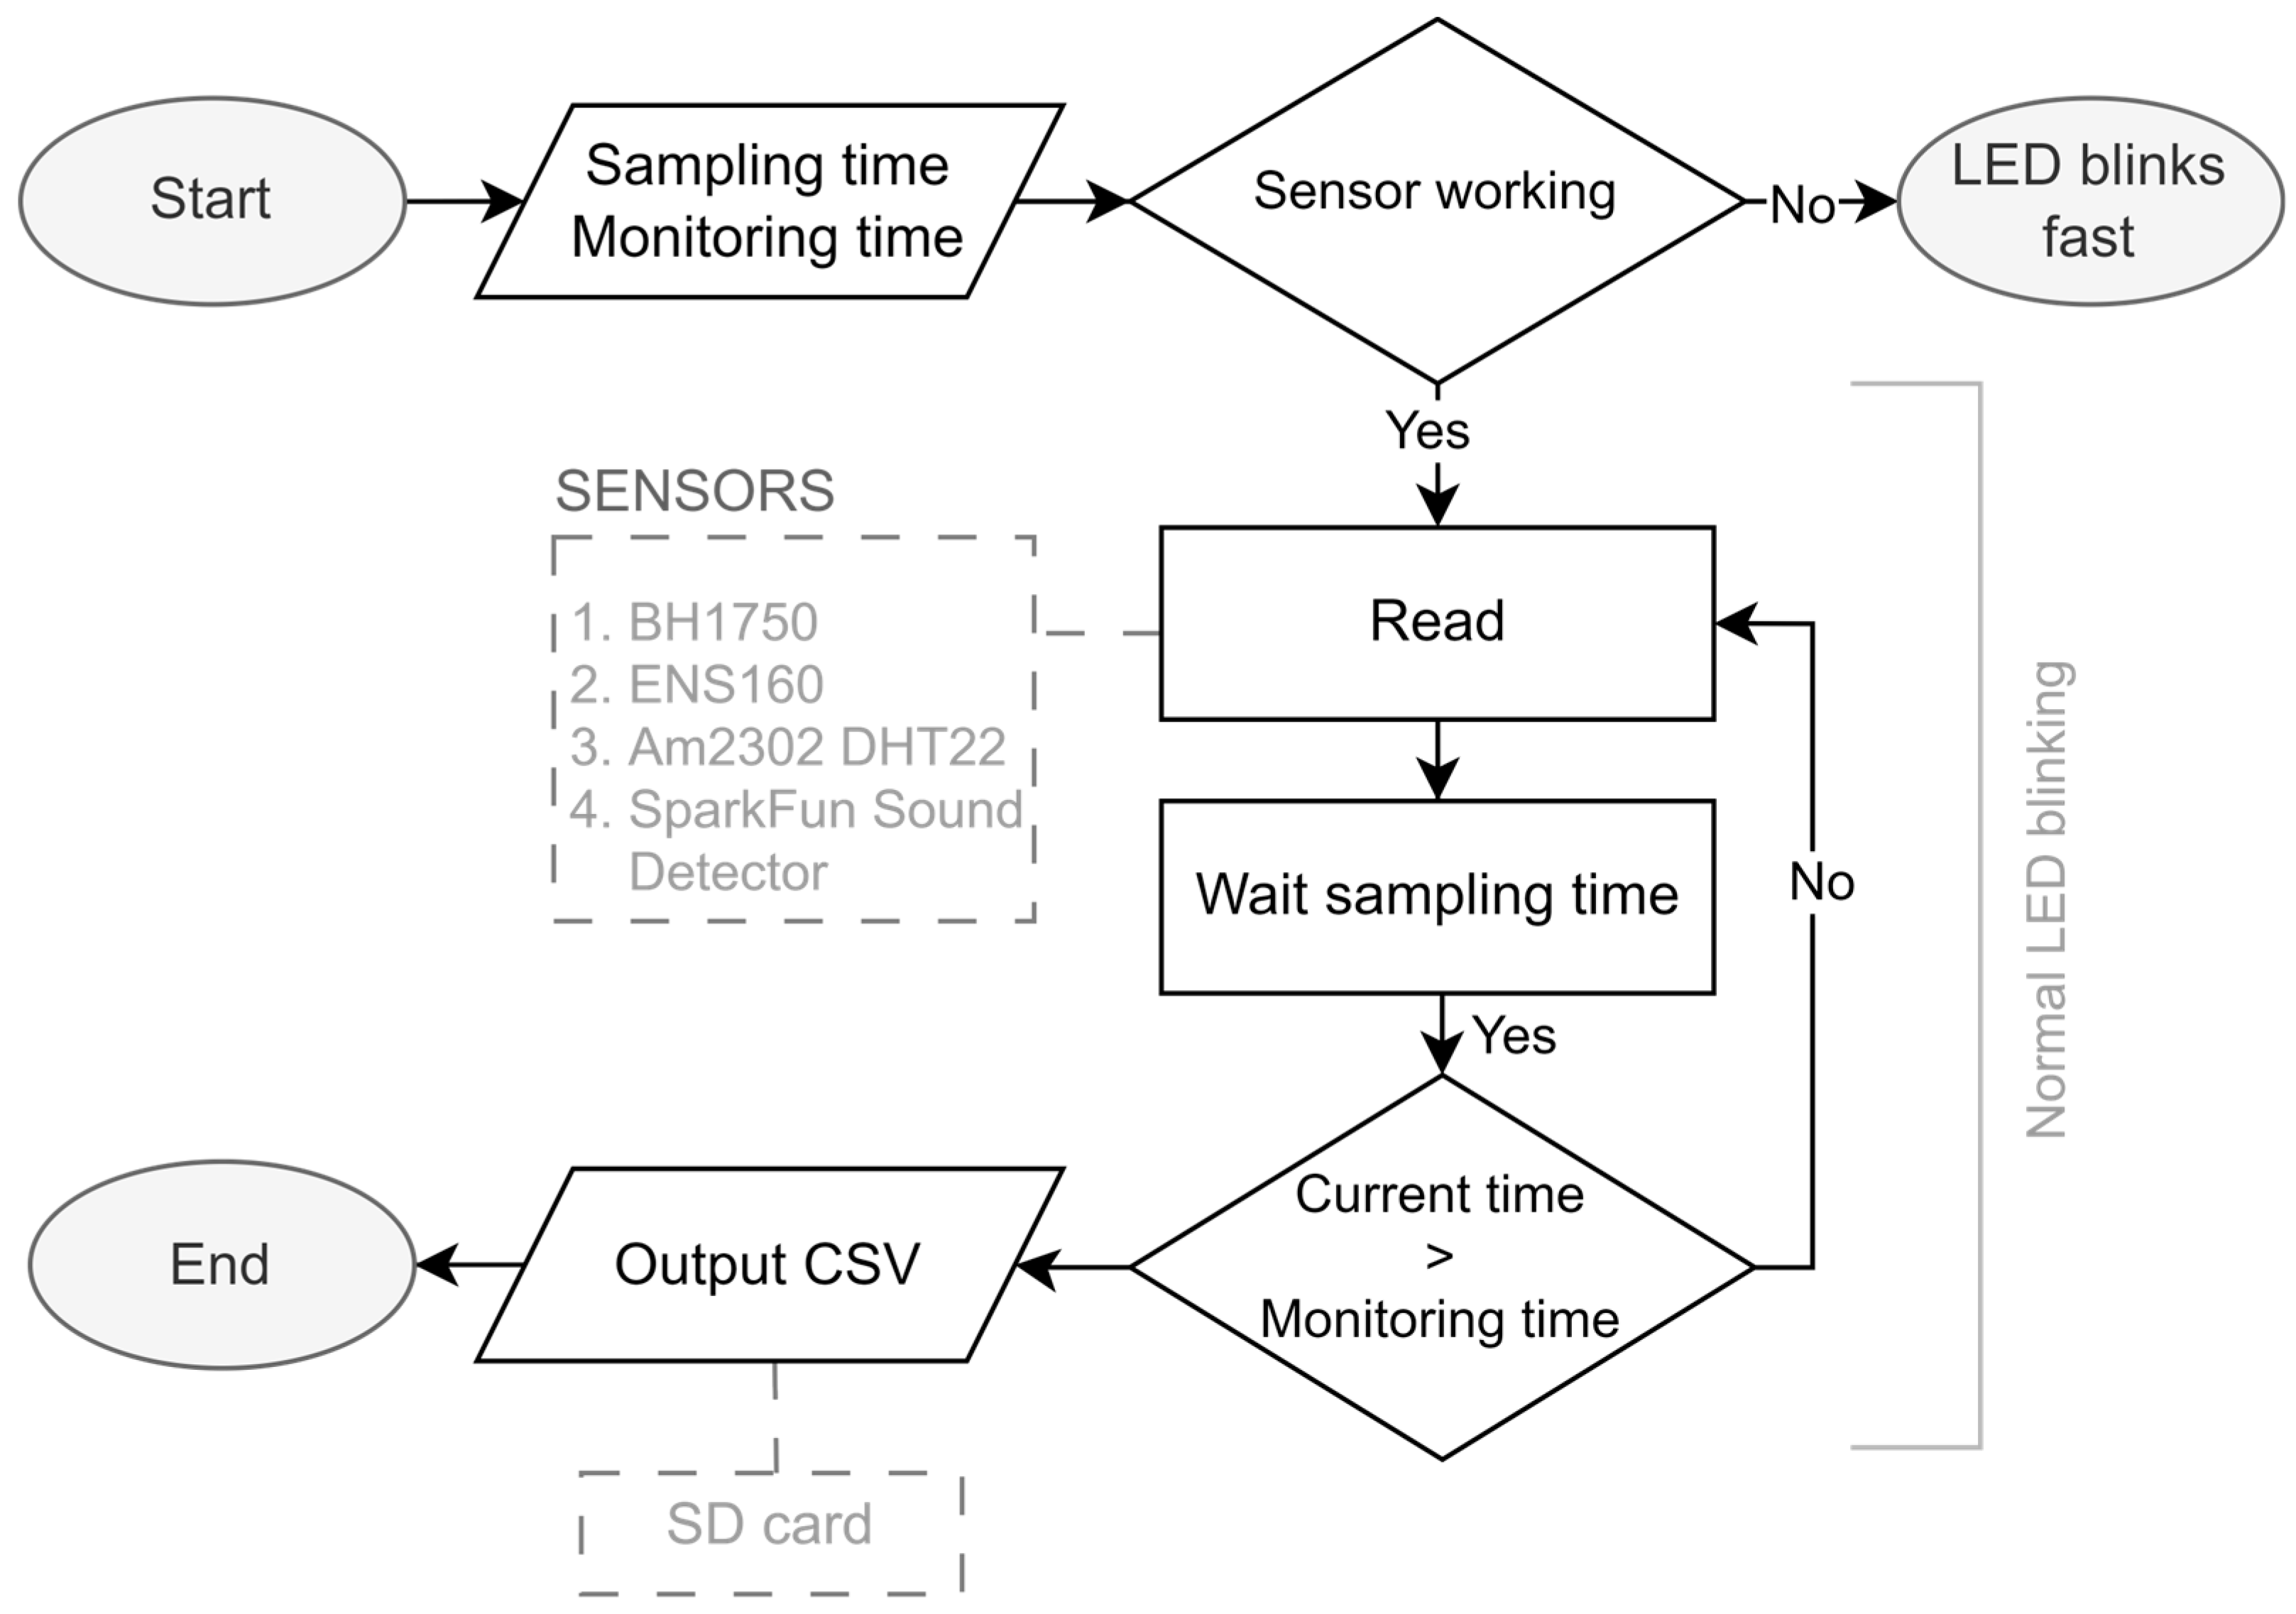
In addition to the sensors, the system includes a microcontroller (Adafruit Flora v3 [36]) and an SD card slot (MicroSD card breakout board [37]). The first one is the core of the system, responsible for interacting with the other devices, while the SD slot enables storing and exporting data. The whole system is powered through a micro-USB port (5 V and 500 mA) that has to be connected to a source. All sensors support 3.3 V power coming directly from the board. A C++ script was produced to control the data monitoring. The code permits one to manually adjust two main variables by modifying the source script: the sampling time and the total time of measurement. A status message is printed every time data are required if a monitor is connected to the board and errors are handled and reported through the blink of the internal LED of the board. Figure 2 schematically shows the algorithm’s main steps and the device involved in each part of it.

2.1.2. System Embedding and Functional Models

The presented sensor system has to be integrated within the work environment with the aim of minimizing the footprint without losing reliability on measurements. Sensor placement has a significant impact on final results based on best practices shared in the literature [38,39]; these were selected and have been summarized in Table 2. Air temperature sensors should be placed at head, chest, or ankle levels to account for the vertical temperature gradient that often exists in a room. Positioning these sensors away from windows, HVAC vents, and heat sources like radiators is crucial to avoid misrepresentation due to local drafts or direct sunlight. Humidity sensors should ideally be placed close to the center of the room or near the occupant’s breathing zone. Positioning sensors too close to HVAC vents or near sources of water vapor, such as humidifiers or bathrooms, could bias the measurements [40]. Air quality sensors should be placed near the breathing zone to better capture personal exposure levels, considering that, especially in an environment with considerable vertical air velocity, local variation may be significant. For light measurement, the positioning of photodiode-based sensors must ensure that the sensor faces the target area of interest, and no obstructions are placed. Finally, when it comes to acoustic measurements, placing the sensor near the hearing zone is essential to capture the user’s stimulus [41]. In addition, all the sensors require access to energy. In order to adapt to the detailed requirements, a typical office space was carefully analyzed to select the position and/or the item which most satisfies those requirements to have the specific sensors integrated. A series of objects such as a monitor, a chair, and the desk itself were taken into account to host the system.
However, the advantages associated with a desk lamp were immediately recognized. A desk lamp is well-integrated into a workspace, allows a certain degree of flexibility by being able to be moved easily, and is directly connected to electricity. In addition, it is usually placed at a height that stands between the chest and the head of a seated person, allowing for an easier and more accurate sensor placement. Nevertheless, the choice of the lamp also presents some drawbacks: heat emitted by the light source and driver may bias temperature readings, the device’s position and orientation are user-dependent, and power electronics and dimming can introduce electrical noise. These problems can be addressed or reduced by appropriate placement, standardized mounting geometry, and a consistent deployment protocol. In addition to this, there have been hundreds of models proposed by designers over the years, and standardization is necessary to provide a device that is adaptable to a large variety of models by checking a few dimensional requirements. To accomplish this analysis, a selection of models was considered (Figure 3) depicting a general structure for which the lamp is idealized in three pieces: top, arm, and base. Although the dimensions, shape, and material deeply vary among models, such a structure can be employed to provide guidance on the sensor’s possible position. For this reason, the figure proposes a three-class classification system to guide the user on sensor placement by indicating a preferable, moderate, and non-ideal position for each component when relevant. By following this advice, it is possible to select a reliable configuration for each case.

2.1.3. Digital Prototype and Assembly

Based on the previous section, a desk lamp has been considered a “background” for the add-in system and was used to apply the advice and design the pieces according to the selected sensors, development board, and SD module. Figure 4 shows the designed system in two 3D views, with numbers indicating the main components. The board, the SD module, and the light sensor were placed on top of the base of the lamp, while the temperature, relative humidity, air quality, and sound sensor were located in the arm. All the components are integrated in two 3D-printable pieces, depicted in Figure 4. The base part presents an opening to allow the connection of the external power source, the other sensors, and the possibility to insert a micro-SD card; the top part has also openings to allow air to flow in while preserving and protecting the devices. It is important to mention that both parts do not interfere with the regular functioning of the lamp. In particular, the base occupies a space of 9.1 × 6.3 × 1.5 cm and the arm 16.3 × 3.4 × 1.8 cm, which is quite limited considering that the spaces are typically free in the desk lamp. However, as happens for many desk lamp models, a thinner arm of a minimum of 1.5 cm is also acceptable for the system to be installed, considering that the piece will have a protrusion of a couple of centimeters per side. Two fixing points are designed for each piece, and screws are employed to enhance the durability of the system, but adhesives/elastic bands could also be considered for the scope. After printing the pieces, the assembly process is detailed into eight steps. First, the base is positioned with relevant connections and components; then, the other three sensors are fitted into two printed pieces that allow one to keep the sensor in place. Fixings are then applied to the system.

2.1.4. Material Cost Breakdown

A detailed cost breakdown was compiled for the prototype, enumerating every component, subassembly, and raw material together with their quantities, suppliers, and unit prices. To account for the wide price range of sensing elements, two alternatives are offered: (i) a budget version with low-cost sensors and (ii) a high-performance version featuring premium parts. The parts were selected based on market availability, indoor-rated accuracy and range, compact form-factor, 3.3 V logic compatibility, and ease of plug-and-play integration, and the distinction between the two options may impact the expected measurement fidelity and service life, with the premium branded sensors offering higher reliability, longer manufacturer support, reduced error margins, and better long-term stability than their low-cost counterparts. Items are grouped into physical housing, main board, sensing, data storage, communications, power, and mounting categories; full descriptions, quantities and individual costs are provided in Appendix D.
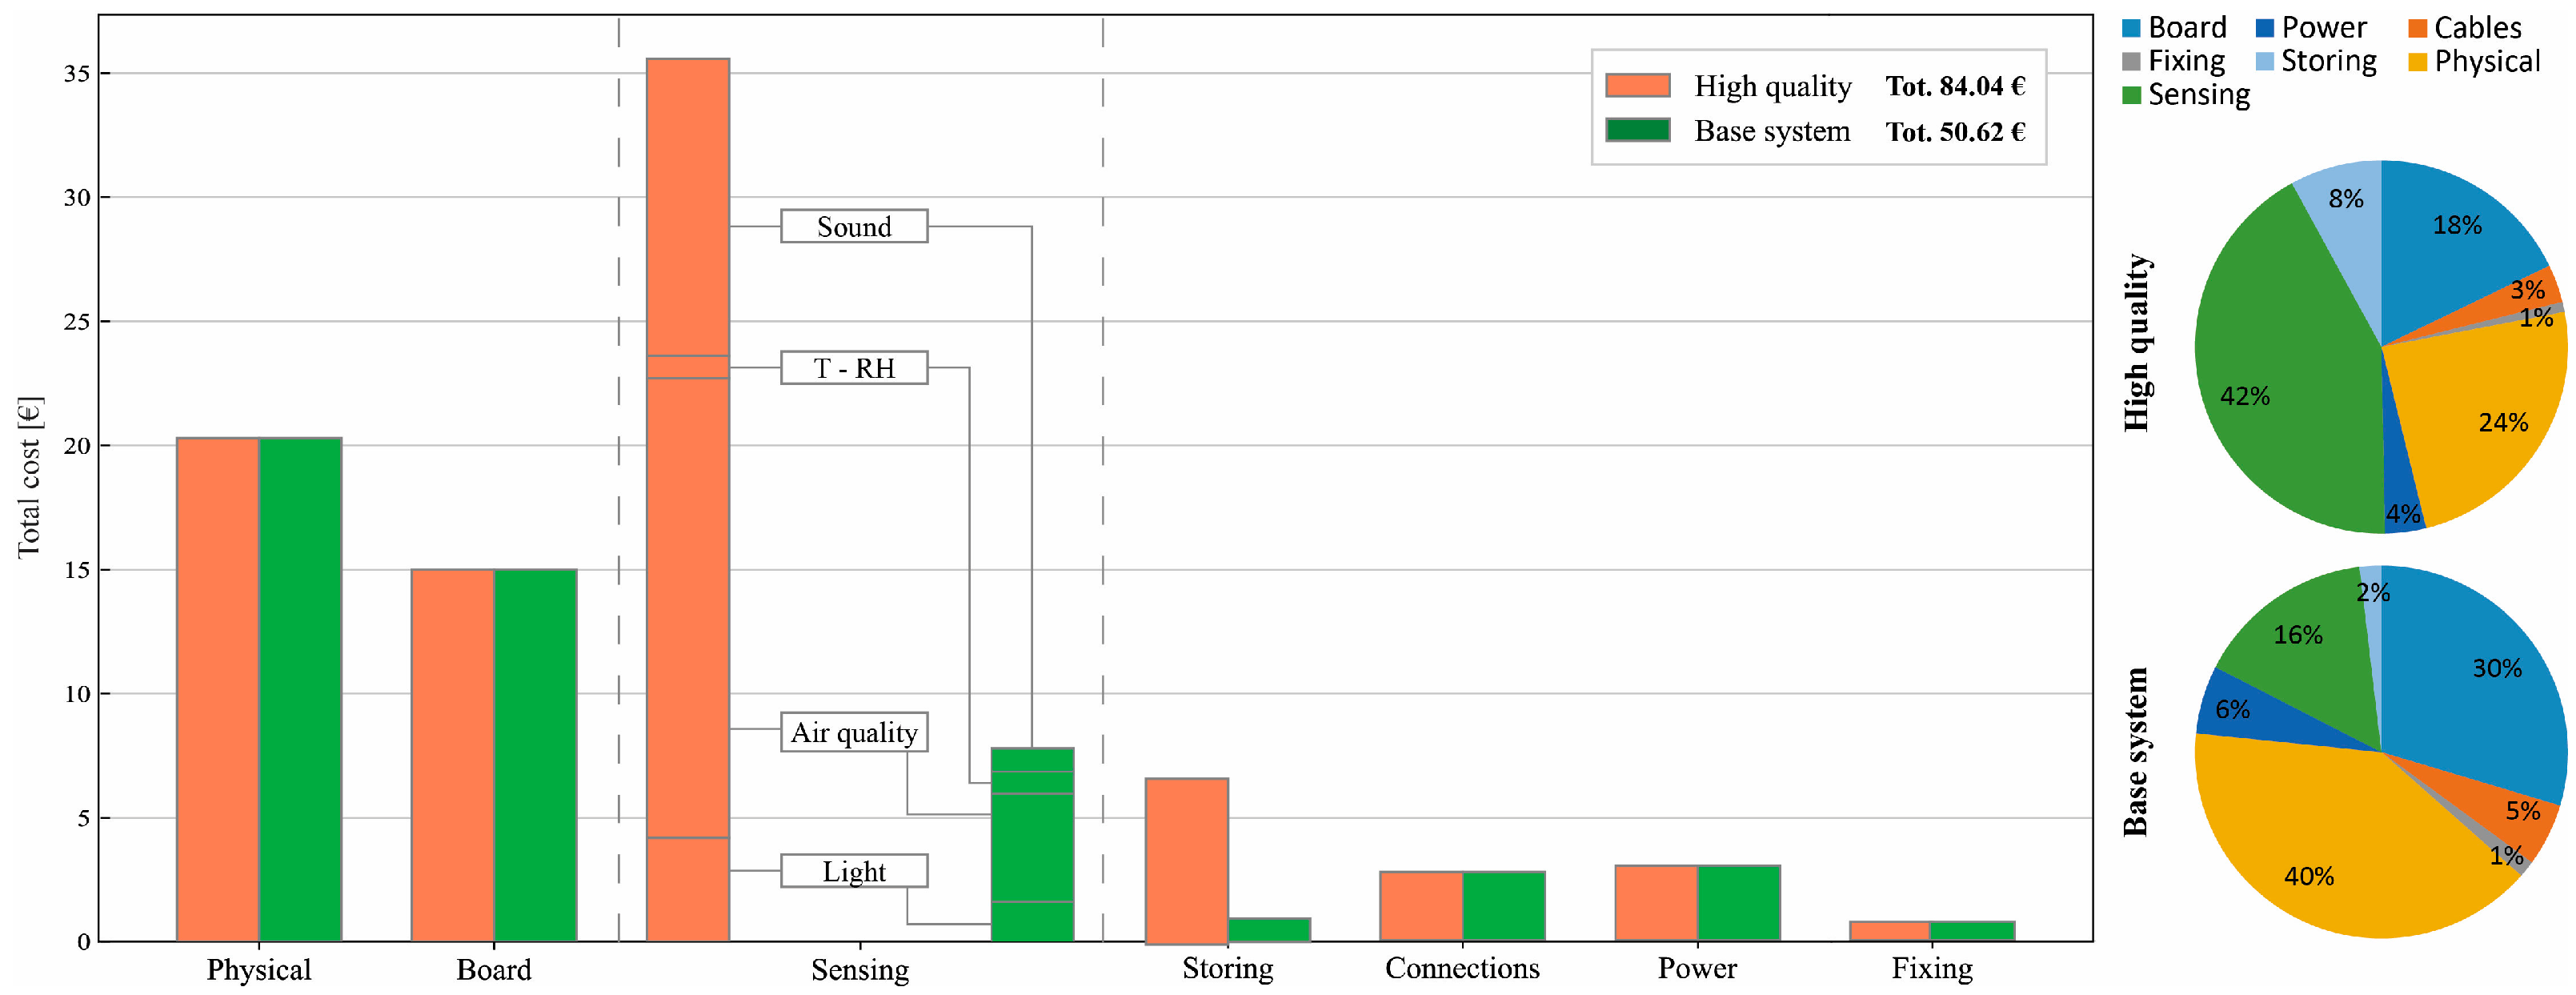
Figure 5 displays visual insights regarding the cost breakdown of the two proposed options. The bar chart illustrates the division of the cost by category while, on the right, two pie charts that display the percentage related to the different voices over the total are presented. Regarding the physical part, the price of the desk lamp was determined by looking for a similar model to the one taken as a reference. The base and the arm parts are 3D-printed, and the software Bambu Studio v1.9.4 [35] was used to estimate the price, considering a Bambu Lab X1 printer ((Shenzhen Tuozhu Technology Co., Ltd., Shenzhen, China) with a nozzle of 0.4 mm and using PLA as material (a reasonable choice considering the modest mechanical properties demanded); the obtained cost for this category is, however, negligible compared to the other parts. The connecting cables are of two types; alligator cables are accounted for, allowing the easier placement of connections, especially for the sensors located in the arm part. The power is ensured by a USB connector, and, considering the low power demand of such systems, electricity costs are not covered in the table. It is possible to observe that the only modifications between the options are related to the sensing system and the SD slot, leading to significant savings in the overall cost, resulting in a potential reduction of about 40% and up to 51% if the lamp is excluded. The drawback of the base system may be the loss of quality, reliability, and precision of the pieces used, and consideration of this kind is relevant in the decision-making process. Nevertheless, all the sensors proposed align with the typical requirement for an office environment occupied by humans. In the high-quality system, the sensing part is the field connected to the highest expenses (42% of the total) followed by the physical part (mainly the lamp) and the board. The air quality and sound sensors are the most expensive, due to their hardware complexity. More inexpensive options were selected in the base system, in which the sensor price drops substantially, and the physical part becomes the priciest part. Also, the SD slot price could be reduced significantly by adopting a non-branded sensor, while connections and power were kept constant. Overall, the system costs around EUR 84 (EUR 66 without the lamp) in its expensive version and about EUR 51 (EUR 33 without the lamp) in the base case. This figure is quite affordable considering the monitoring alternatives reviewed and the fact that any price drop related to scalability was neglected. This may allow for long-term experiments assuming only electrical power is the operative cost.
It should be noted that the reported costs refer to the purchase of components in small quantities via online retail channels. These costs are therefore likely to decrease significantly with scale. Furthermore, no profit margins for potential resale, nor costs related to packaging, distribution, or general overhead have been included. This is because the aim of this analysis is not to develop a business model, but rather to demonstrate the technical and economic feasibility of sensing systems designed to improve personal comfort within the framework of an open and accessible project.

2.1.5. Physical Prototype

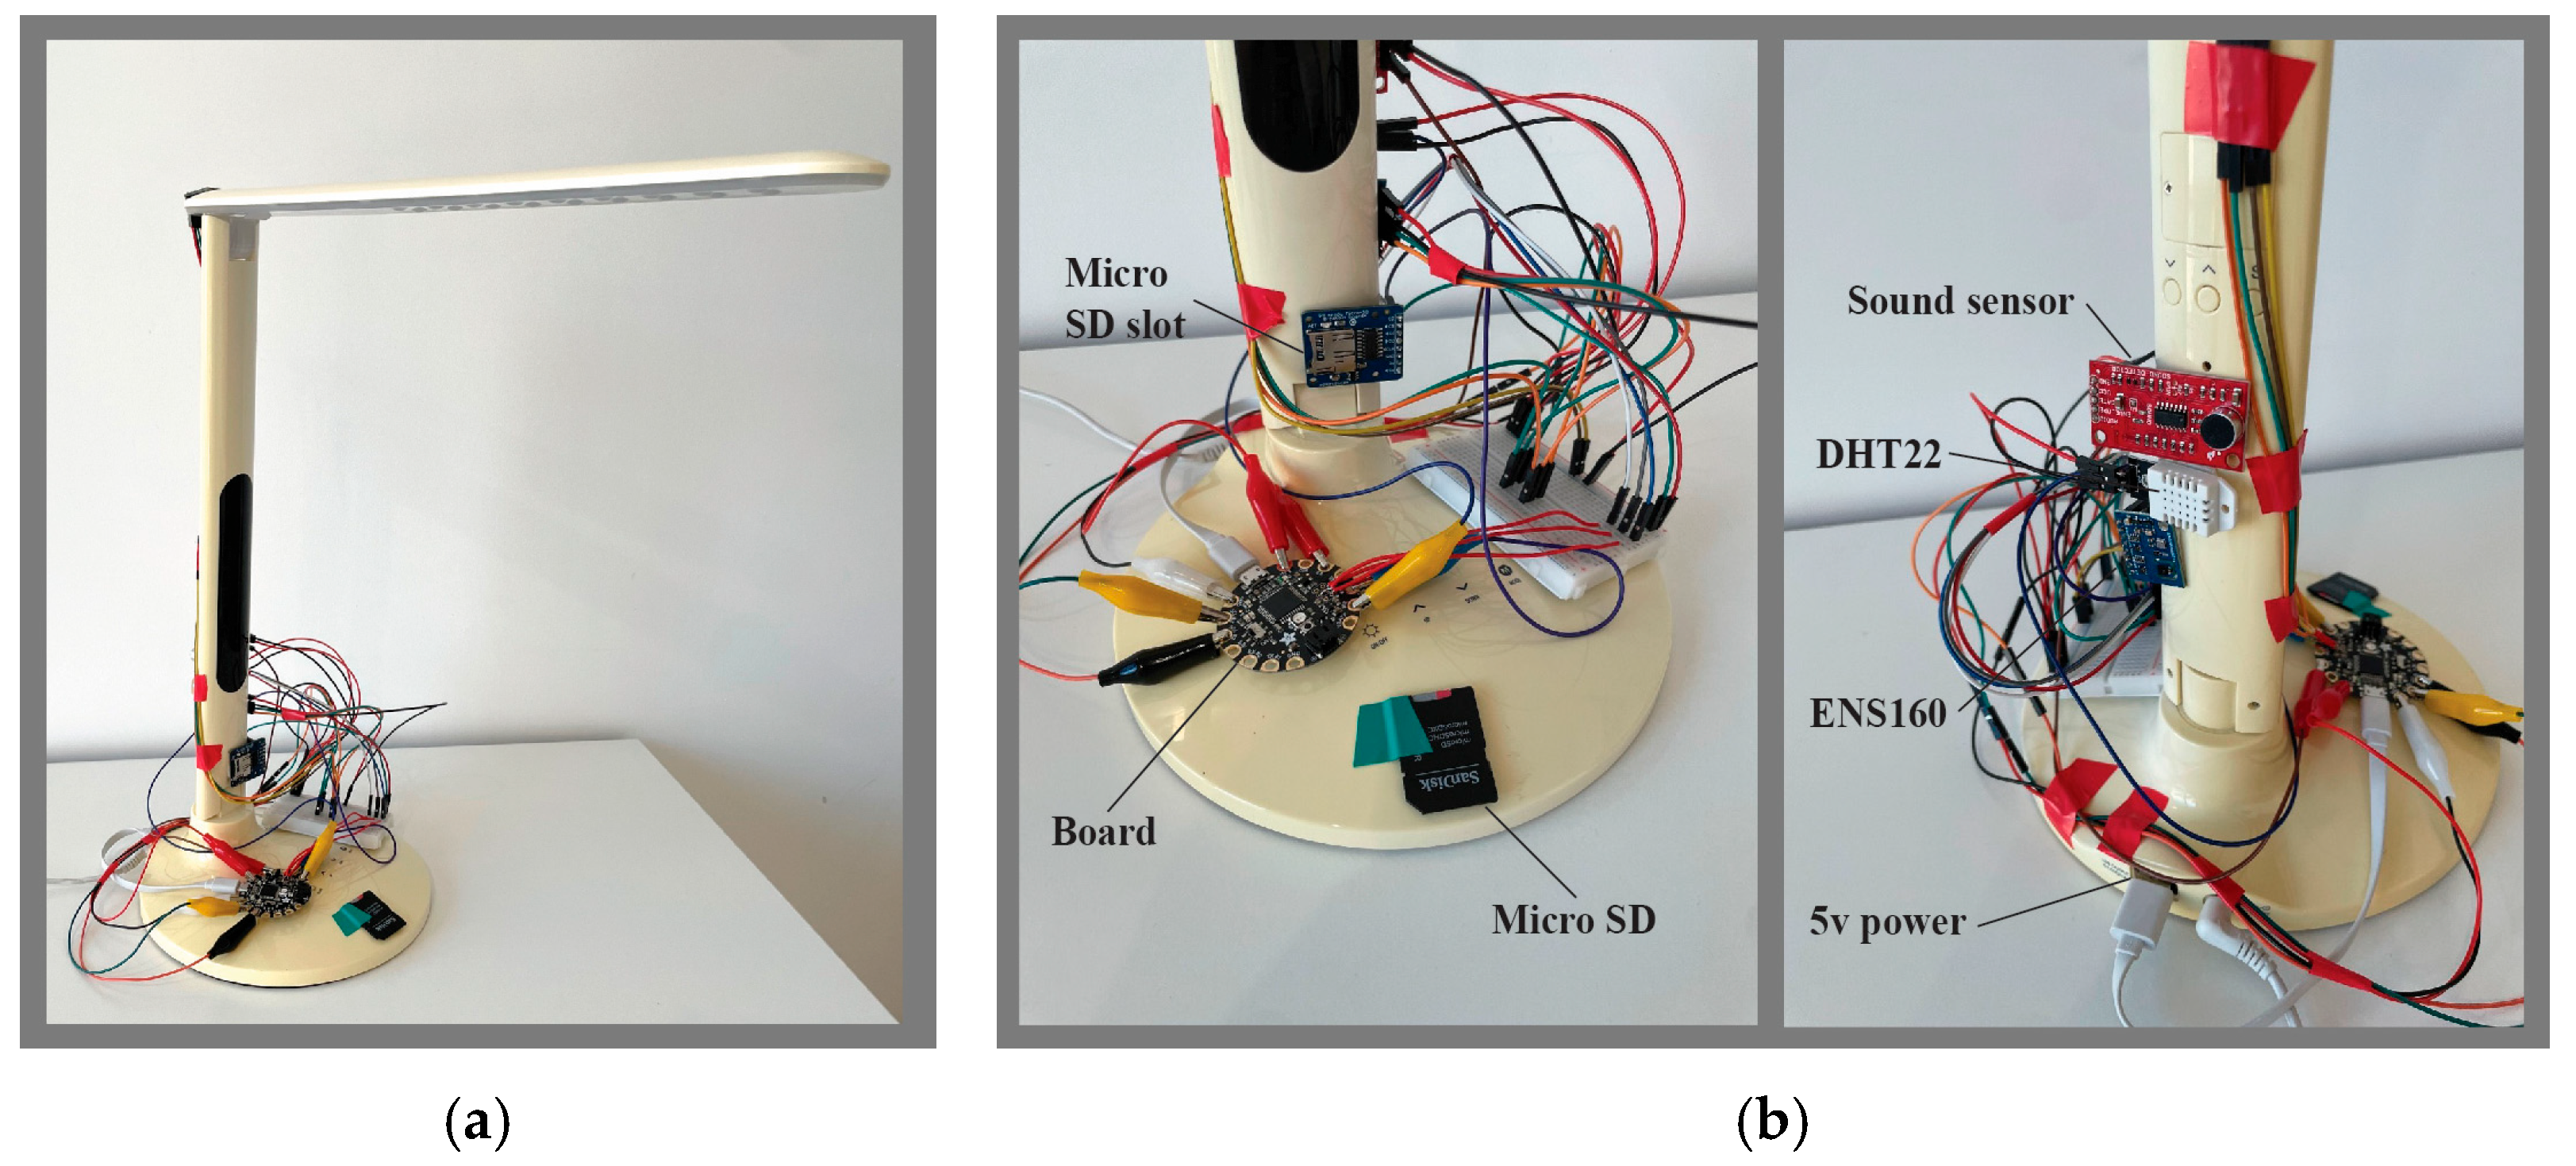
In order to prove the feasibility of the system, an alpha prototype was assembled in the Architecture, Built Environment, and Construction Engineering department (DABC) of Politecnico di Milano. This prototype was realized considering the availability of components and a pre-existing desk lamp. In particular, the components were attached to the lamp with adhesives, and a breadboard was employed to facilitate the connections. The photos of the prototype are visible in Figure 6, and it can be observed that the position of the sensors was slightly modified for connectivity reasons, and thus, the light sensor was moved between the head and the arm of the lamp. In addition, an SD adapter was taped to the lamp. Overall, the system is composed of six alligator cables attached to the board and some internal connections that go through the breadboard. The prototype took about 45 min to be assembled and is powered via the lamp’s integrated USB port. The system was tested considering the proposed algorithm, and the output is a CSV file in which the time and the measured variables are reported. These data are saved in the SD card and can be easily visualized and post-processed, allowing for the monitoring of the indoor environment. However, robustness and long-term reliability were not systematically evaluated at this stage, as the present device is an alpha prototype; potential extended-use issues, contact intermittency from alligator leads/breadboard wiring, supply noise susceptibility of USB power, thermal bias near the lamp head, and gradual sensor drift may occur and can be addressed in subsequent design iterations.

2.2. Case Study and Simulation Set-Up

Based on the designed and prototyped system, it was necessary to initially adopt a simulation-based approach in order to understand how the positioning of the developed system could affect the accuracy of the measured data and, consequently, the reliability of the analysis. An open office on the second floor of the Department of Architecture, Built Environment, and Construction Engineering of Politecnico di Milano, located in Via Giuseppe Ponzio 31, Milan (Italy), was selected as the case study for this study. The office, used by PhD fellows, researchers, and professors, is currently a “living lab project” and serves as a room to conduct experiments and research on a wide range of topics. This choice was made in order to have an array of sensors already integrated into the environment, which are useful for the validation of the newly developed system. Figure 7 shows the room of interest in a 3D and plan view. The space presents a rectangular shape with a base of 6.9 × 7.8 m (53.8 m2), considering the gross surface and an internal height of 4 m. Three of the four vertical walls are partially glazed, with exposure to the north, south, and east views. The windows-to-wall ratio is 32.4%, considering the ribbon windows and one internal door. The ceiling is exposed to the outdoor environment, while the floor and the opaque partition border other rooms of the building. The case study room is located in an urban environment, with the presence of buildings and trees which provide shadings to the eastern and northern exposed windows. Six virtual sensors were placed in different parts of the room to consider various locations within the same space. In particular, the virtual sensors were named with a letter and a number to record their position (e.g., “D” stands for desk, “W” stands for window, and “S” stands for sensor), aiming to capture discrepancies—defined as the difference between the sensor reading and the corresponding median value at that time—in the indoor environment. The space was initially modeled in Rhino 3D, while a simplified model was created to perform energy and daylight simulations, which were carried out using the ClimateStudio software v1.9.8 [42]. The typical meteorological year (TMY) of the reference weather file for Milan (Milano-Linate 2007–2021) was retrieved on the Onebuilding website [43]. In the following paragraphs, the details concerning the energy and delight models are reported.

2.2.1. Energy Model

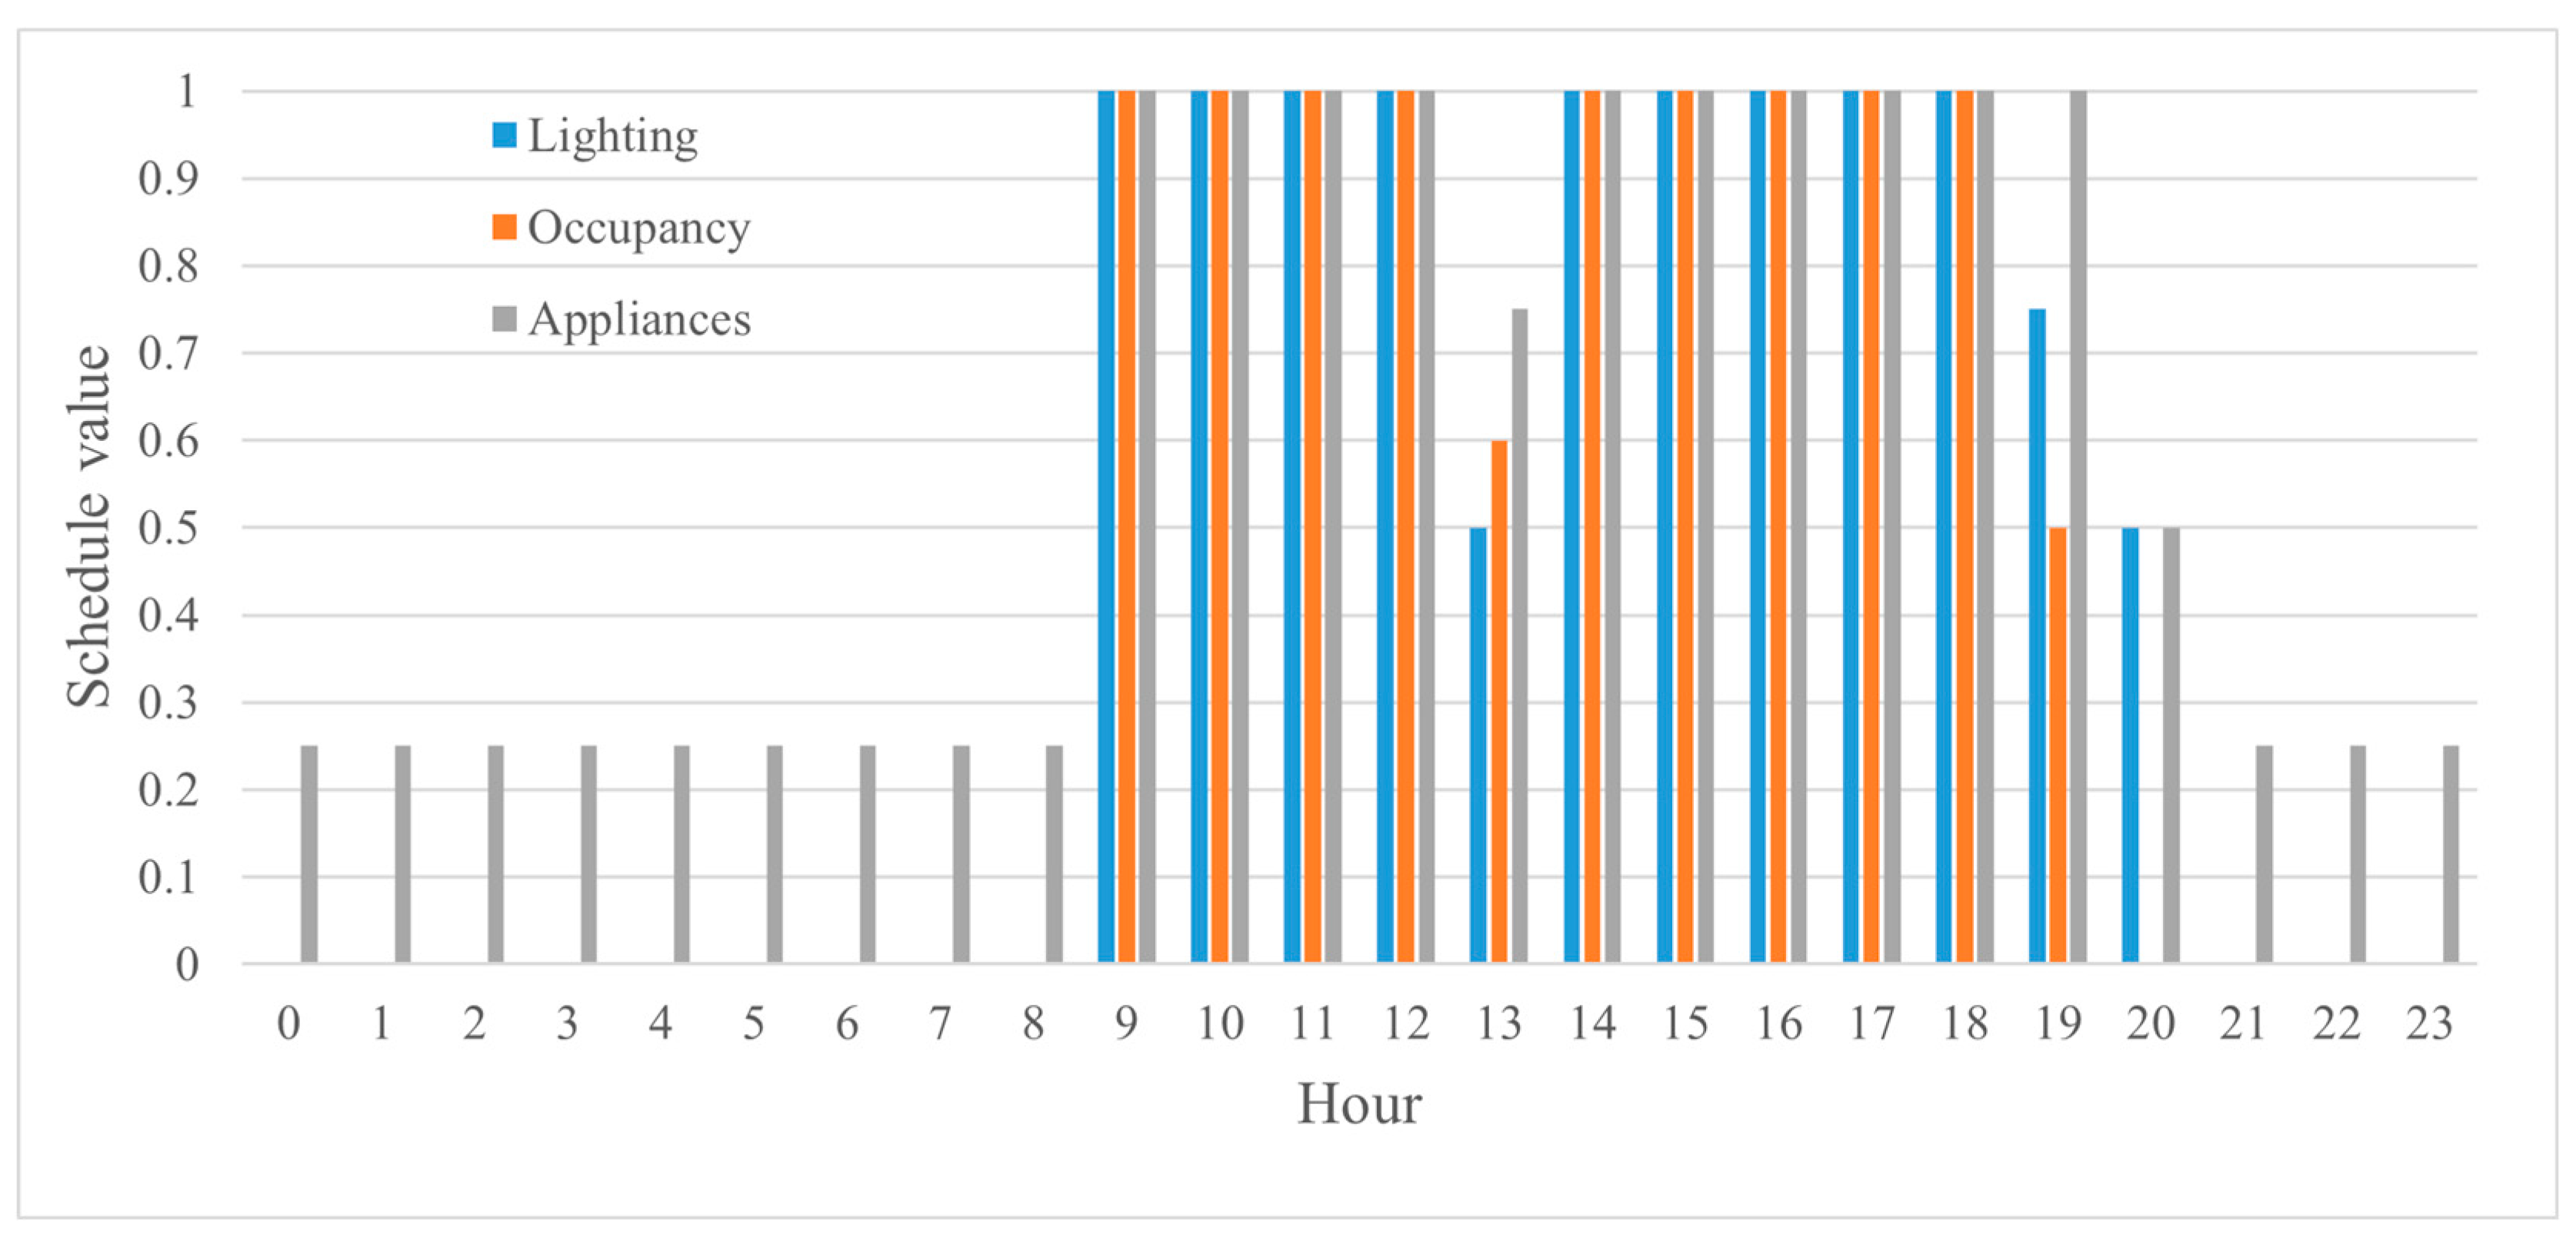
The internal wall and floor are treated as adiabatic surfaces, while the thermal transmittance and thermal mass of the other opaque elements are listed in Table 3 with the properties of transparent surfaces. The external shadings were also modeled with a defined transmittance and reflectance. Internal gains are defined according to ISO 17772-1 [44], while the number of people occupying the environment is known (0.15 person per square meter), and while the energy and lighting power density are equal to 20 W/m2 and 5 W/m2, respectively. Schedules are edited based on ISO 18523-1 [45], considering a normal office open from Monday to Friday with the 2024 calendar for holidays. The adopted schedules are reported in Figure 8.
Despite the presence of coil units in the real room, the simulated one is not equipped with any cooling or heating system; all the simulations performed are thus free-floating. The reason behind this choice is motivated by the unknown usage schedule of these devices (which are manually activated) and the goal of understanding the temperature discrepancies in the room. Natural ventilation was inserted in the simulations with an adaptive profile that is active when it is 25 °C or more in the environment. As in the real room, no shading device is present. The sensor grid for local simulations is defined by 42 sensors evenly spaced in a 6 × 7 m grid. The grid is placed at 80 cm in height with respect to the floor level.
Once the thermal model is set, the spatial thermal comfort tool is used. This specific workflow provides an annual analysis and, in particular, values of MRT, PPD, and PMV for each hour of the year and each of the 42 sensors. A ode was developed in Python 3.10.15 to export the resulting data into a database (Figure 9). By using this model, several analyses were conducted, including a temperature profile, which involved a global simulation of the operative and air temperature mean values in the environment over the year. A relative humidity (RH) profile was also generated through a global simulation. Additionally, simulations to assess localized comfort metrics were conducted, enabling the recording of the Mean Radiant Temperature (MRT) in different positions throughout the reference year.

2.2.2. Daylight Model

The main material properties (i.e., the visual reflectance and transmittance, when applicable) for the indoor environment and the external shadings are added to the model. The visual reflectance of the walls and ceiling is equal to 0.85 (white plaster), while the floor presents a pattern of tiles which has an estimated reflectance of 0.42 [46], instead of using the standard value of 0.2. In addition, the windows have a transmittance of 0.76. The employed sensor grid is composed of 1188 sensors with a spacing of 0.2 m from each other and an offset of 0.1 m from the borders. The grid has a height of 0.8 m to correspond to the desk plane.
Daylight factor distribution was initially analyzed to identify potential critical situations. Spatial daylight availability (sDA), average useful daylight illuminance (UDIa), annual sunlight exposure (ASE), and average yearly illuminance were assessed as climate-based metrics to quantify light and its quality throughout the year. The sDA measures the percentage of an area in the room that meets a minimum illuminance level (300 lux for office rooms) for at least 50% of occupied hours annually. UDIa evaluates the average proportion of time when daylight levels fall within a specified range (300–3000 lux in this case), providing a measure of the balance between insufficient and excessive daylight over a year. ASE quantifies the percentage of a space receiving excessive direct sunlight, above 1000 lux, for more than a specified number of hours per year (250 in this case). The average yearly illuminance is used to evaluate the areas of the room that receive more light. The annual daylight glare probability (DGP) was also analyzed to assess glare occurrence throughout the year. A DGP value of 0.38 is considered disturbing, while a value of 0.45 indicates intolerable glare. Lastly, illuminance and point-in-time illuminance were analyzed to evaluate the most critical periods, with a specific focus on the desk area.

3. Results

3.1. Simulation Results

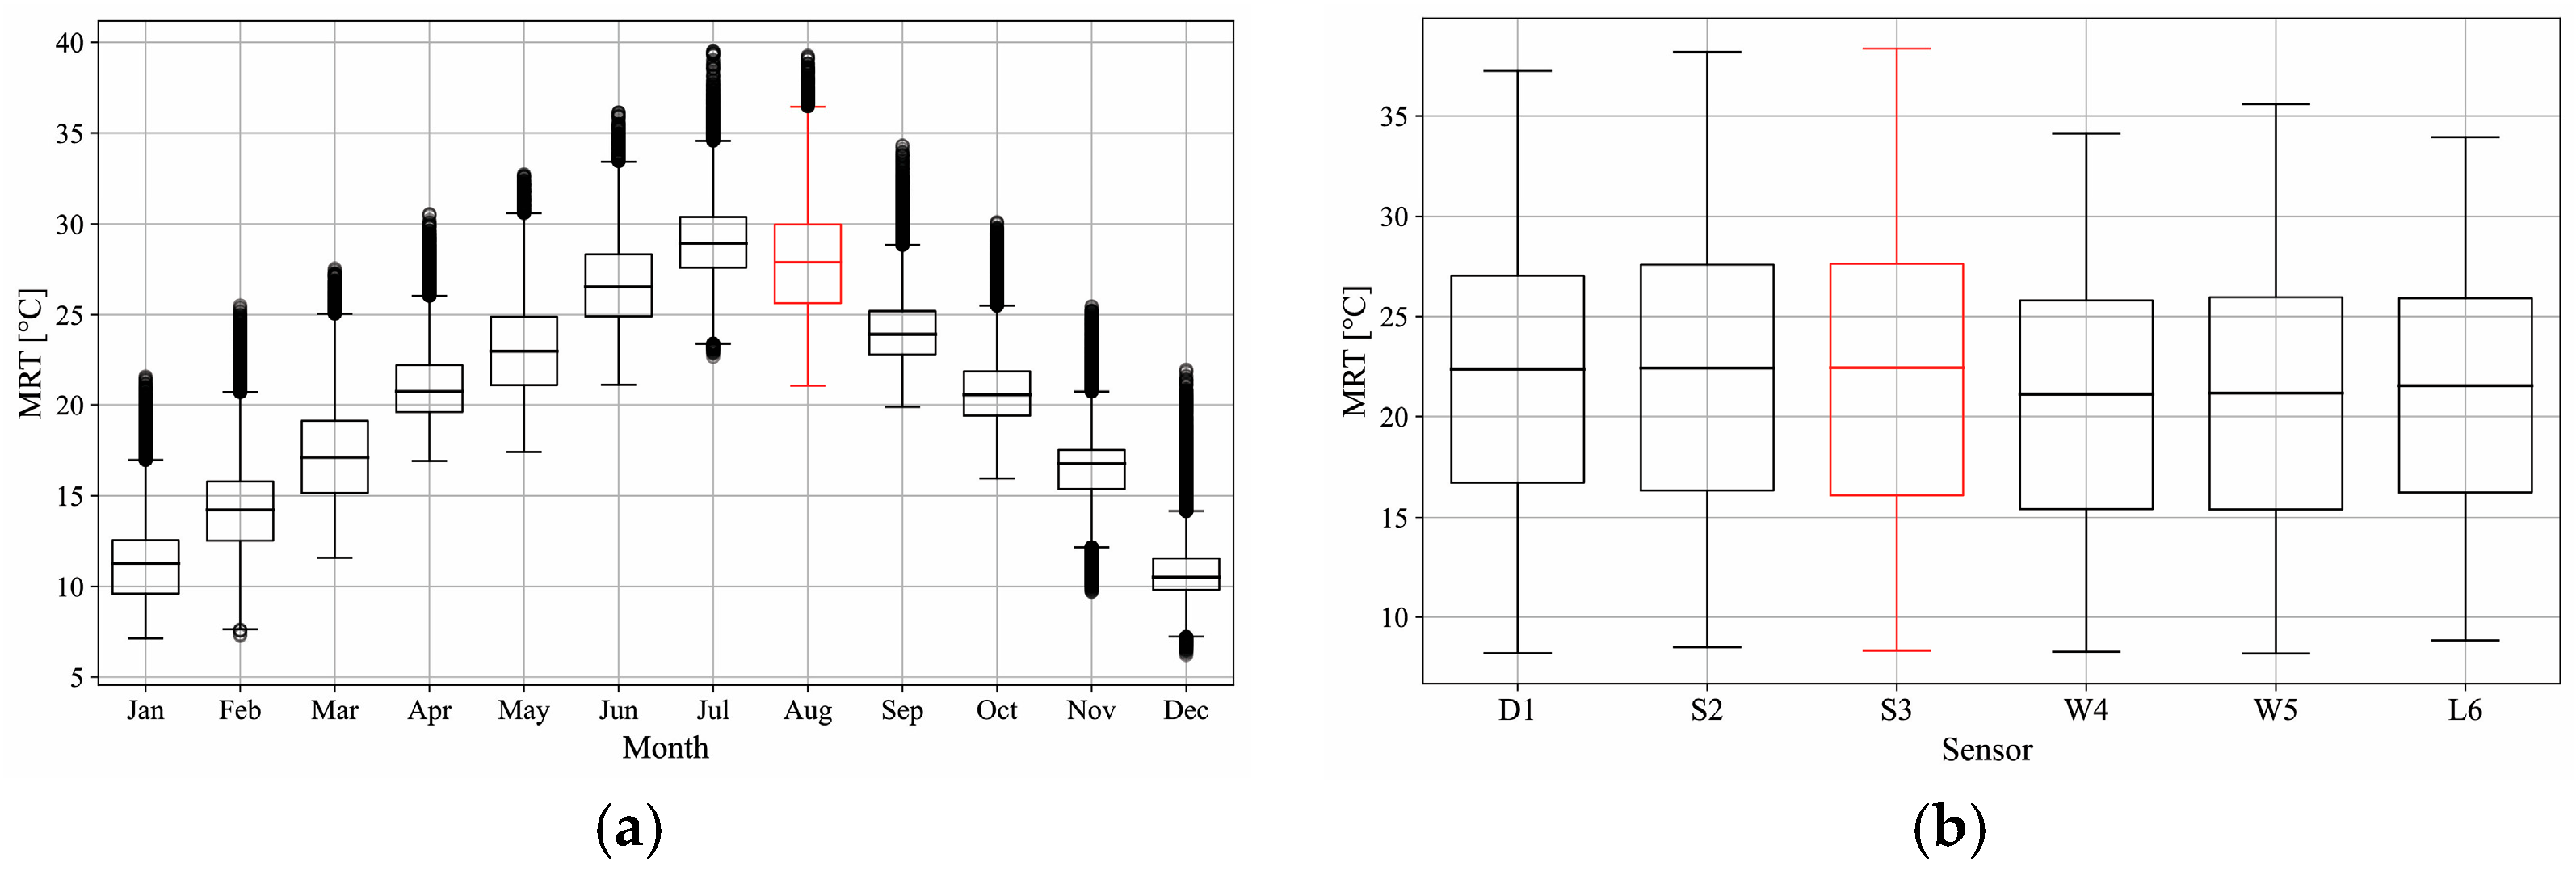
The box plots of Figure 10 represent the hourly variation by month of the recorded value for each sensor during the year (from 9:00 to 18:00, weekdays only). The median MRT ranges from 12 °C to 38 °C during the years with lower peaks of 7 °C and upper peaks of just below 40 °C in July and August. The uneven distribution of outliers indicates a clear trend for which, in the room, lower MRT values tend to be more compact than the higher ones. In addition, December is the month with the highest number of outliers. In the case of the sensors, no outliers are recorded following the same methodology. The sensor median values stand between 21 °C and 23 °C with a higher dispersion for the sensor placed near the smart windows (S1 and S2). On the other hand, W4 and W5 (sensors placed on the opposite side of the smart windows) have a less sparse profile while the desk (D1) stands in the middle, resulting in higher ranges on the south side.
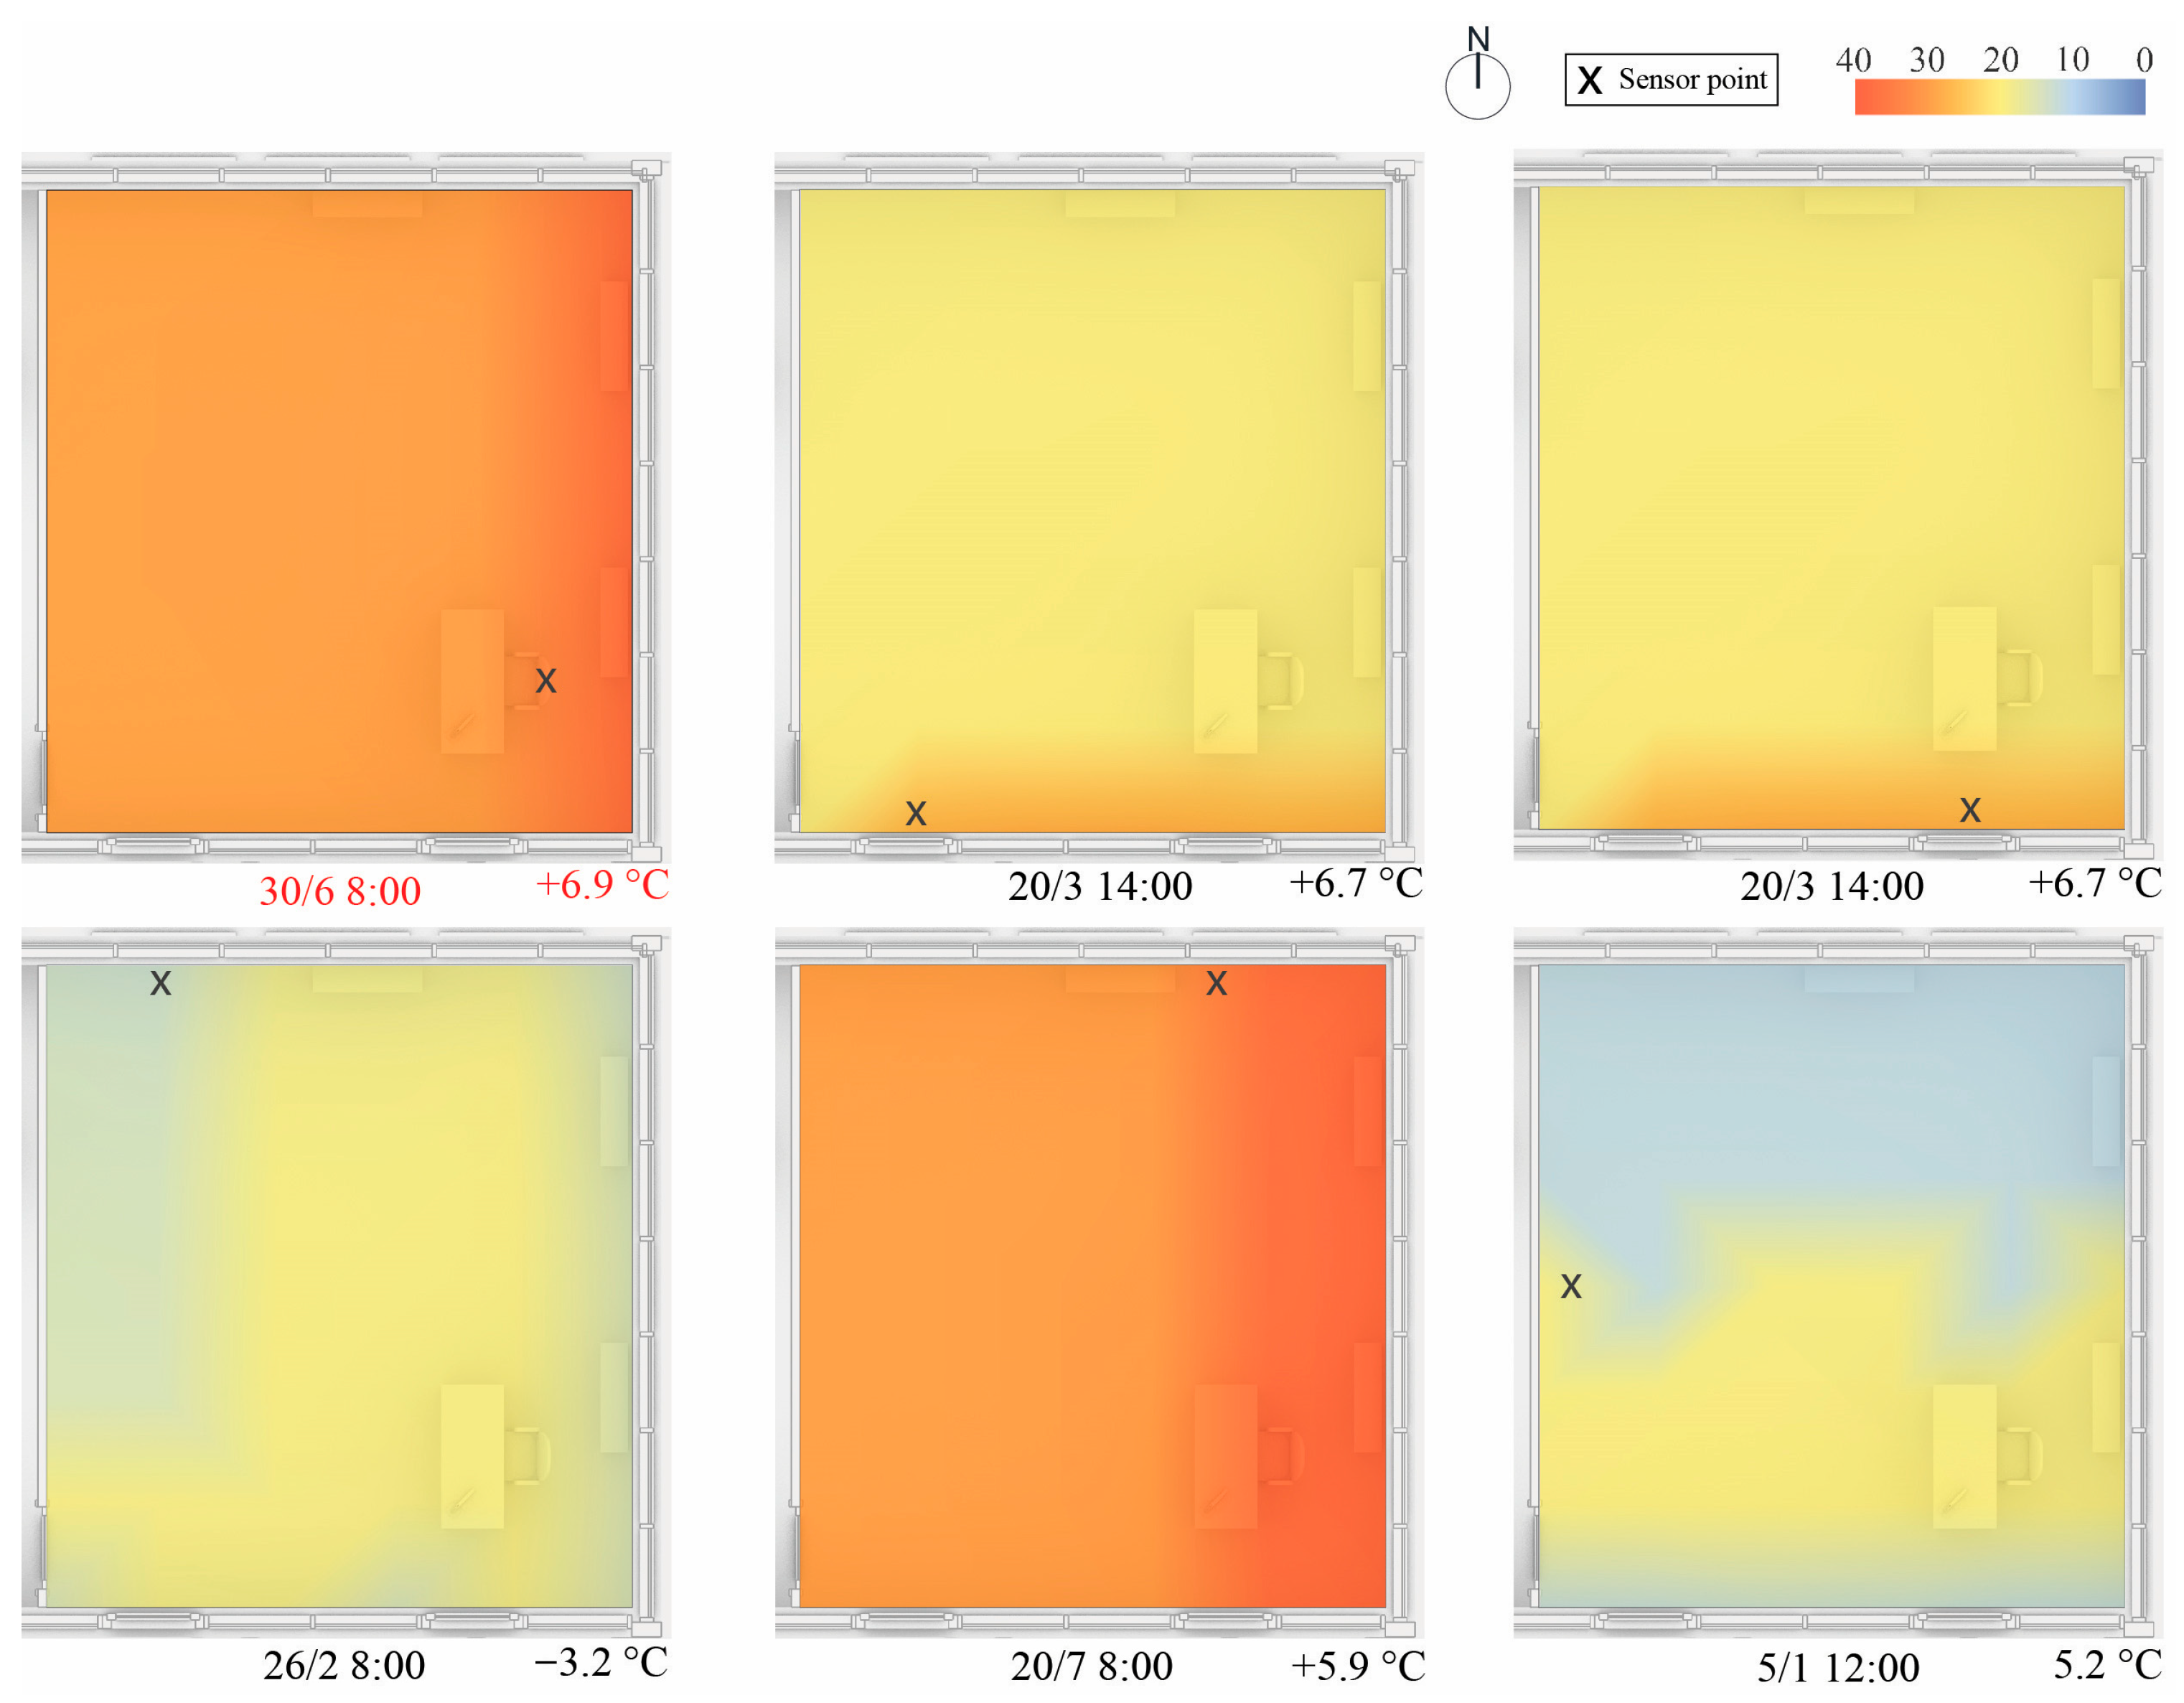
The discrepancy profile related to the MRT is depicted in Figure 11. This data series shows how S2 and S3 are associated with similar behavior throughout the year, but the same does not happen for W4 and W5, which are placed in the north side. While all the sensors (except for D1) tend to have higher discrepancies in the mid-season and summer periods, L6 shows positive differences in the autumn and winter periods. The maximum values recorded occur in January for L6, in February for W4, in March for S2 and S3, in June for D1, and in July for W5. The desk (D1) is associated with the highest discrepancy value of 6.9 °C above the median, while just 3.2 °C of differences are related to W4. The most critical periods in terms of the discrepancy with the other sensors (median value) are represented in detail in Figure 12, in which the MRT distribution was reported for the room. The different distributions in the room clearly explain the reasons for the discrepancies recorded. For example, in the case of S3, a component of direct radiation affects the room only partially in that area, increasing the data distribution from one side to the other. The same may be observed for D1, S2, and W5. The case of W4 shows the opposite behavior, in which the sensor records particularly low data in that area of the room. This happened in winter at 8 am when the sun was rising from the east.
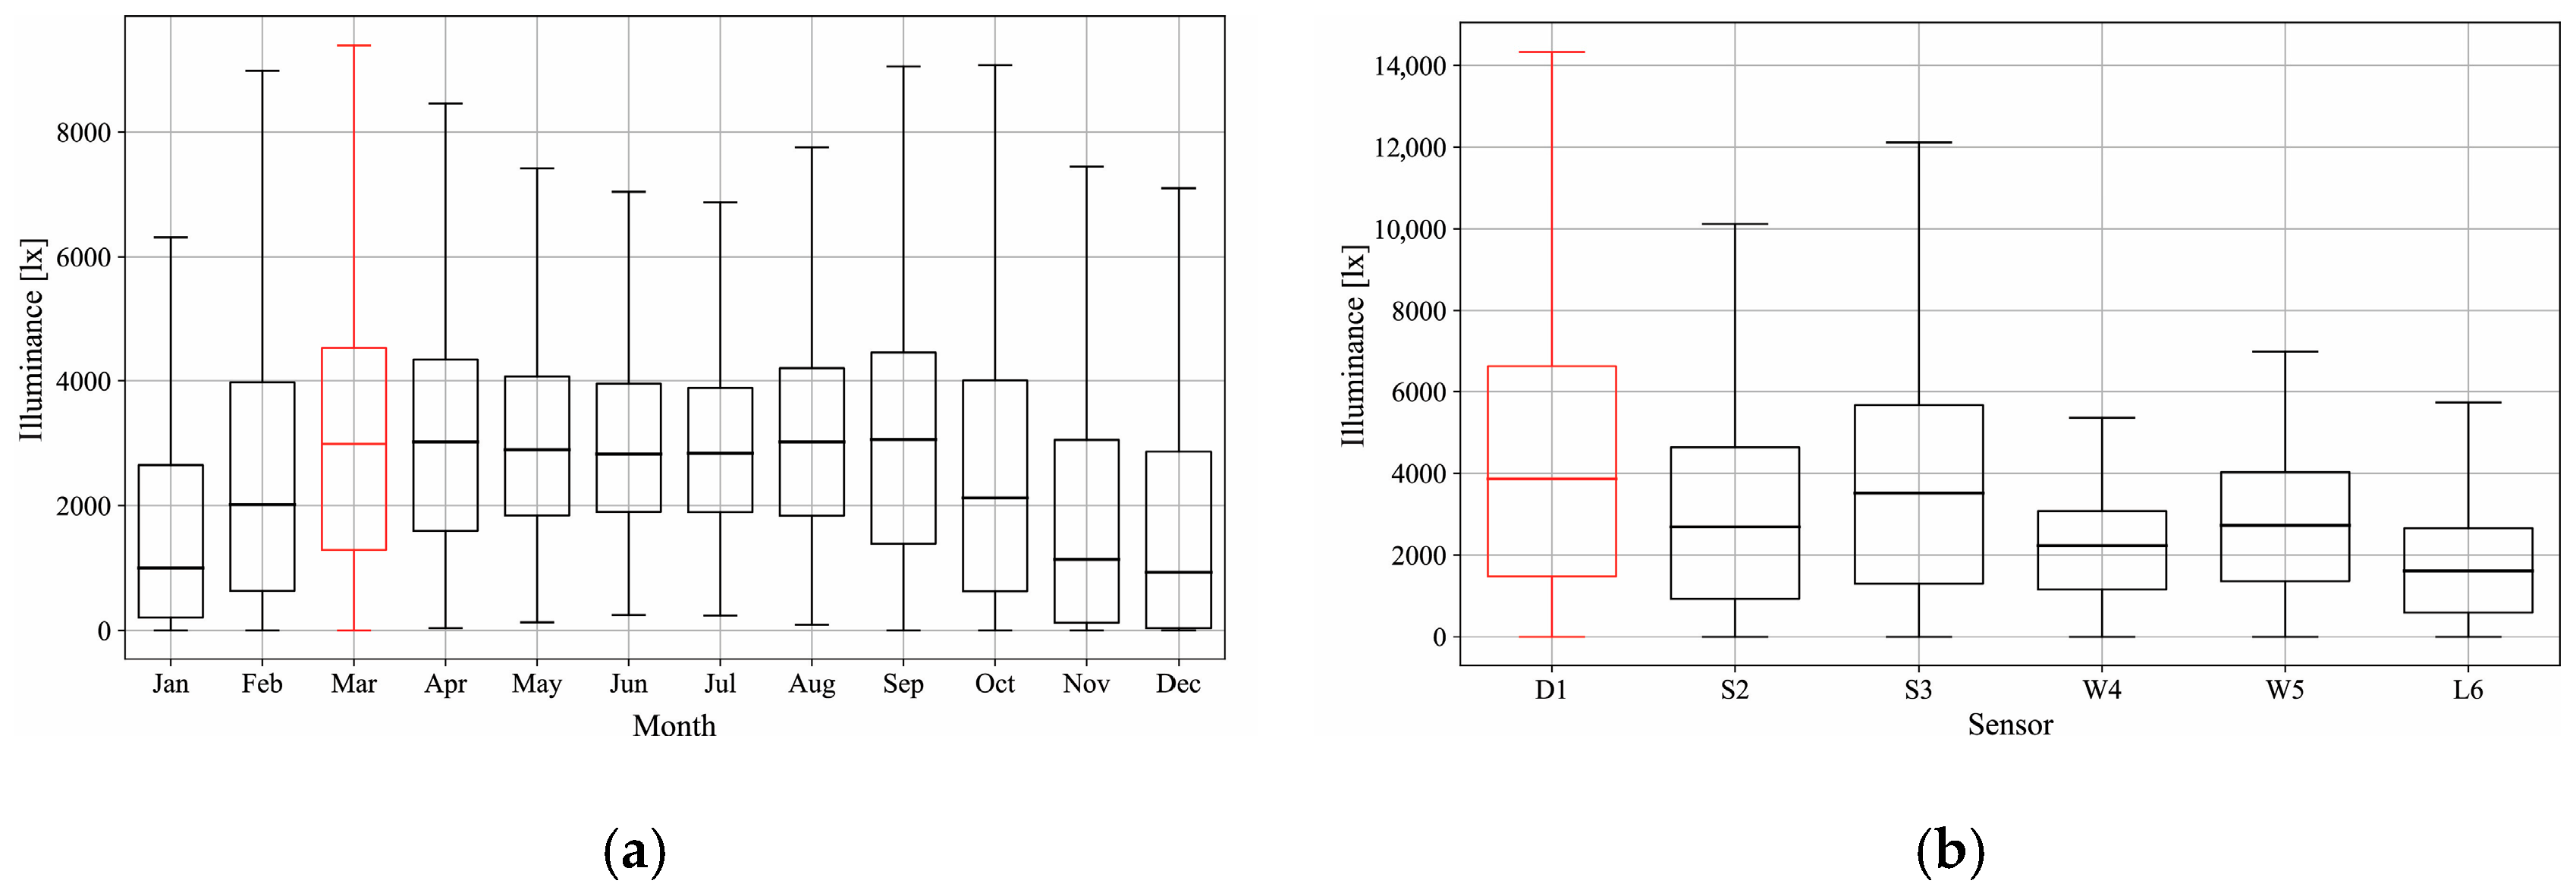
Figure 13 reports a box plot of the illuminance value in the room divided by month and by sensor in the occupied hours. In every month outliers are present, these are hidden to facilitate the comprehension of the graph. September is the month in which the highest median and the highest dispersion are present, while January and December present lower values and also lower dispersions. It is possible to observe how the general dispersion tends to shrink in the middle part of the year, while it is more significant in the mid-season months. Due to its position, the desk (D6) presents a high value of illuminance with a median of 4000 lx over the year. On the other hand, L6, which stands near the opaque wall, has a median of less than 2000 lx. An impressive dispersion is related to the desk, while the north-placed sensor data are less sparse. S2 and S3 have an in-between behavior.
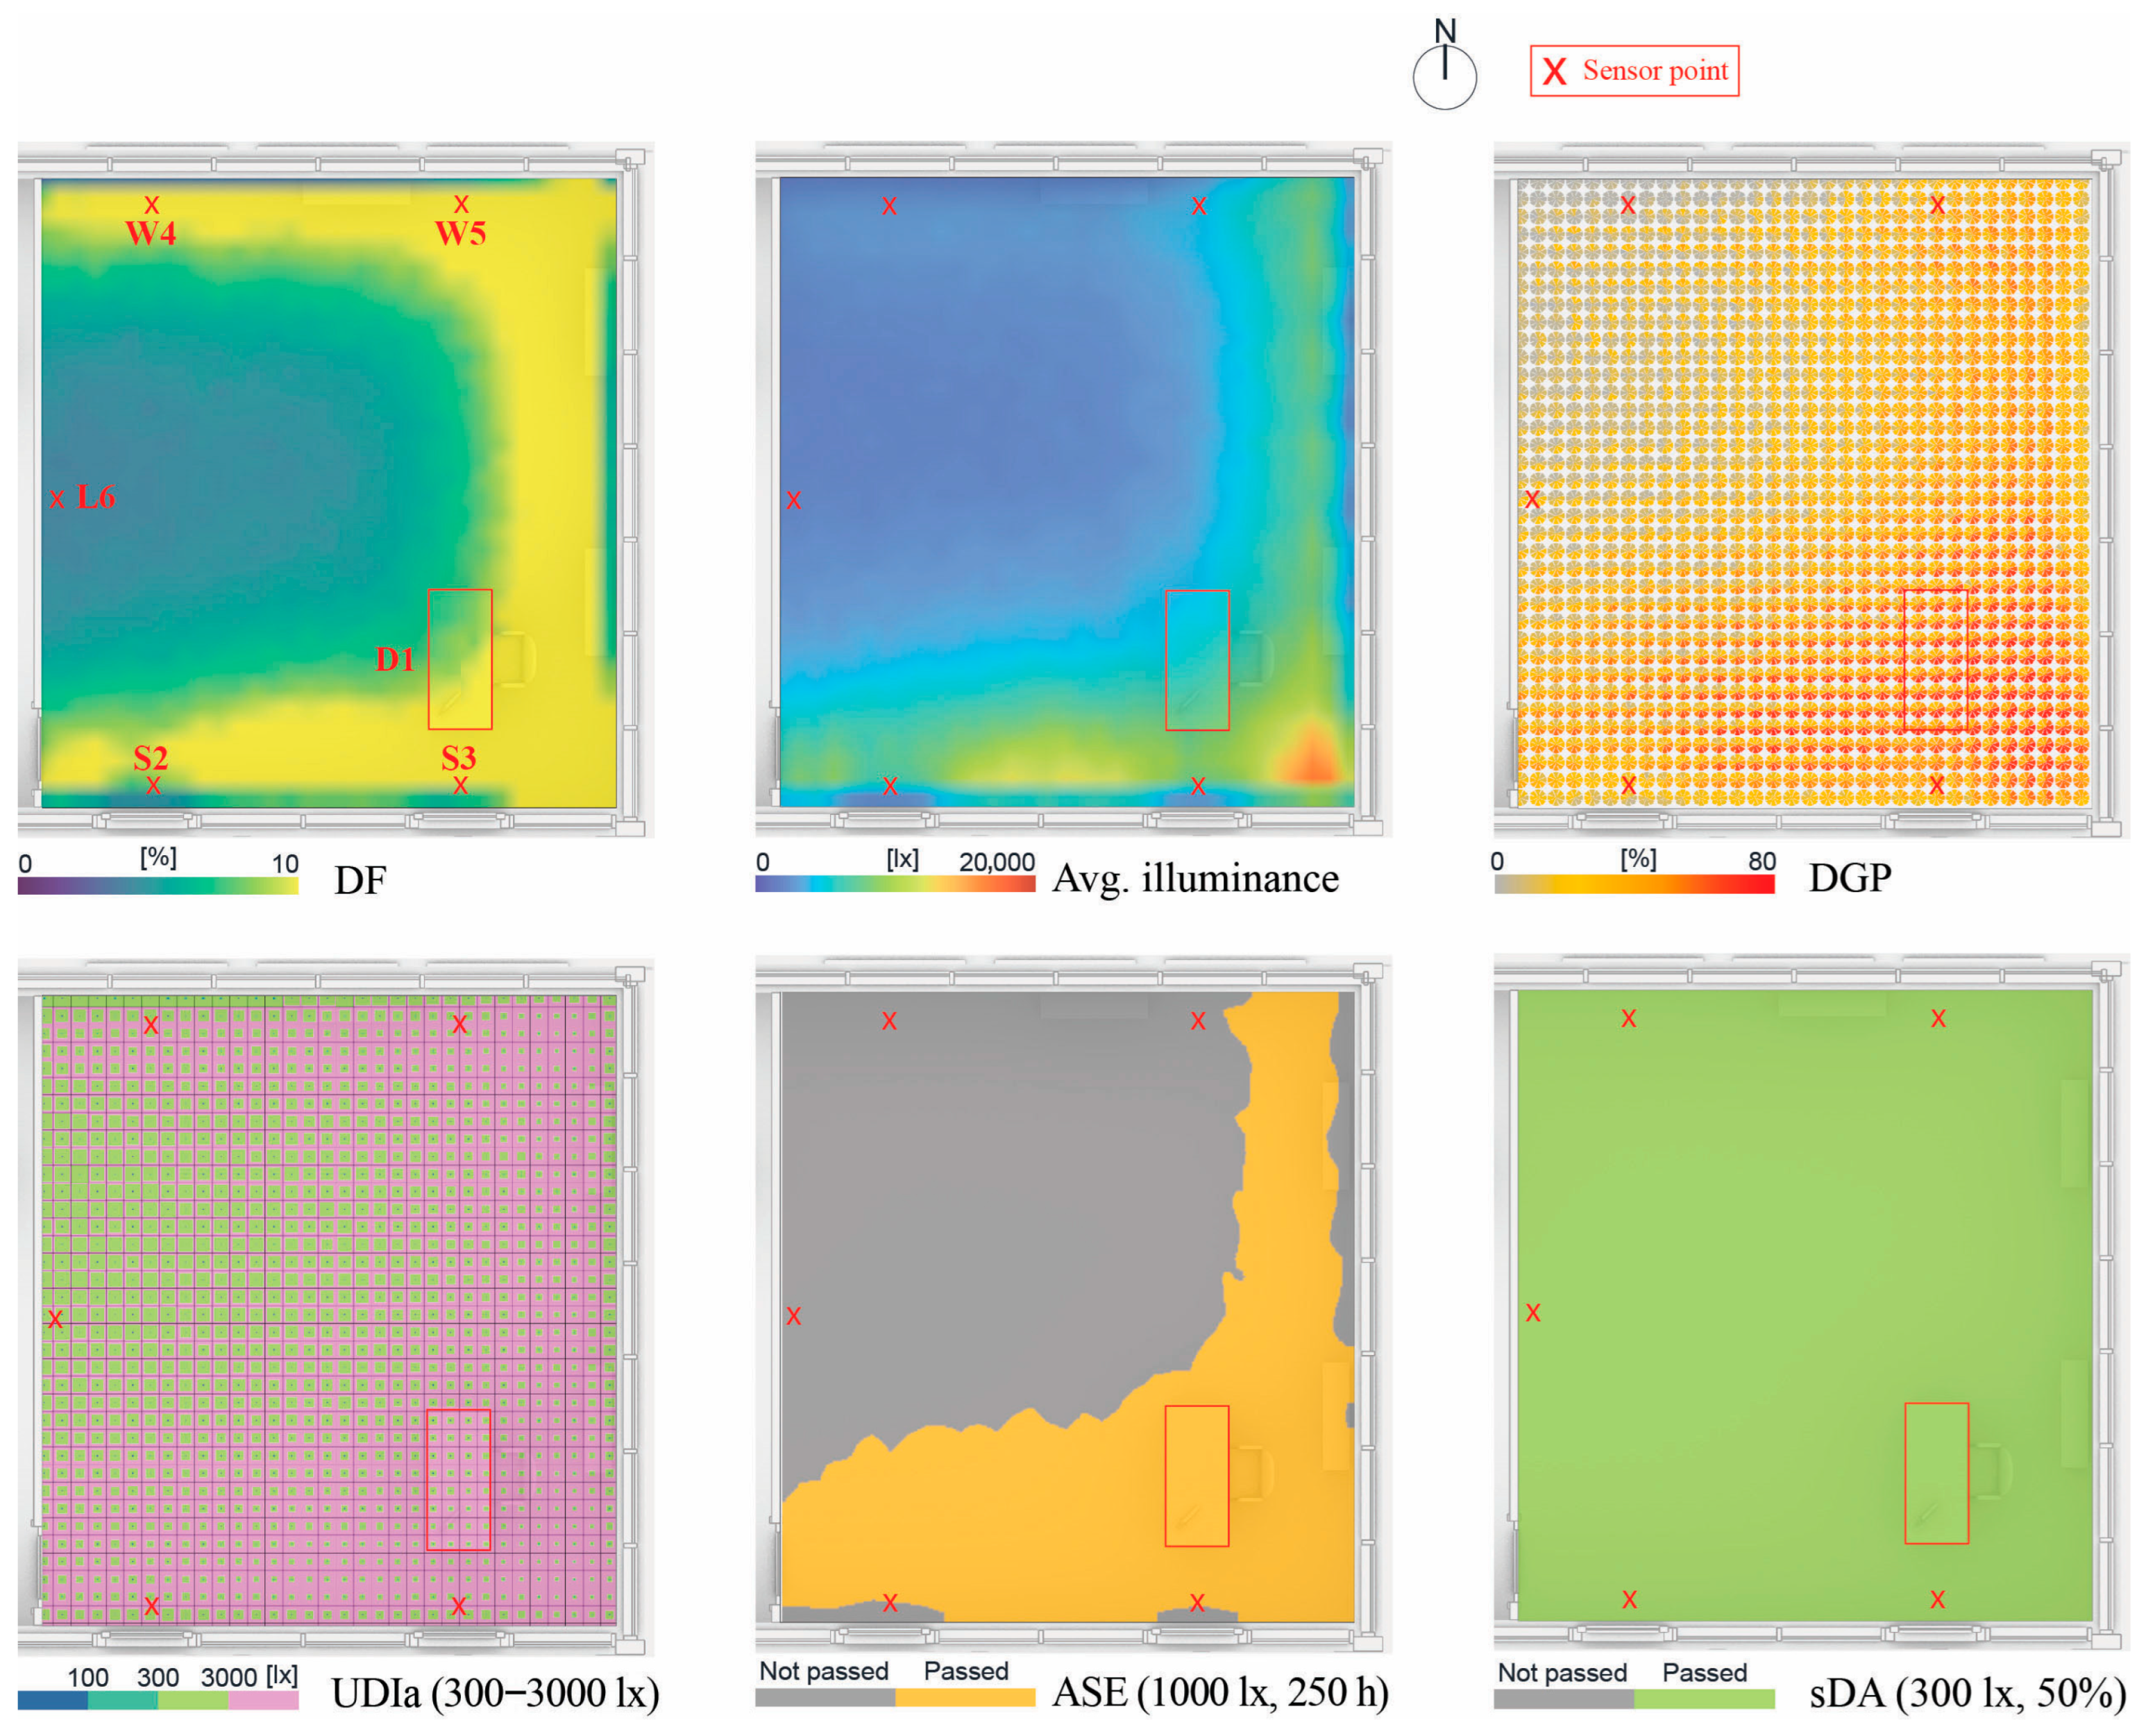
Climate-based metrics are represented in Figure 14, where the daylight factor (DF), average illuminance, angular DGP, spatial daylight autonomy (sDA), useful daylight illuminance (UDIa), and annual sunlight exposure (ASE) are shown. As expected, the parts of the room associated with the highest values are close to the windows. It can be noticed that there is a certain asymmetry related to the north and south-facing windows. The DF is unevenly distributed in the room with higher values close to windows. The average illuminance reaches its peak in the south-east part of the room, while the north window provides a small increment if compared to the internal part of the room (L6). The angular DGP shows that critical views are mainly from the south and east parts, which may result in discomfort. The UDI and ASE enforce the hypothesis for which the desk space is expected to be more subjected to direct radiation, while the sDA is actually verified for the whole room.
Figure 15 illustrates the illuminance discrepancy of each sensor compared to the median recorded value in the room. The results reveal that S2 and S3 have quite similar behavior during the year with the same discrepancy peak of 53,000 lx; this confirms the previous results. W4 and W5 are less correlated. In fact, while the first tends to stay closer to the room values, the second presents an oscillation through the mid-seasons and the summer, with a peak of 30,000 lux of discrepancy. The desk recorded values are usually higher than the median ones during all years, while, near the opaque walls, values are below the median for most of the year. Peaks are in the summer four out of six times (D1, S2, S3 and W5) and two out of six times in autumn (W4 and L6). All the peak times are located in the first part of the day (between 8:00 and 11:00), which reasonably describes a situation in which direct solar radiation is present in a confined area of the room.

3.2. Physical Measurement and Validation

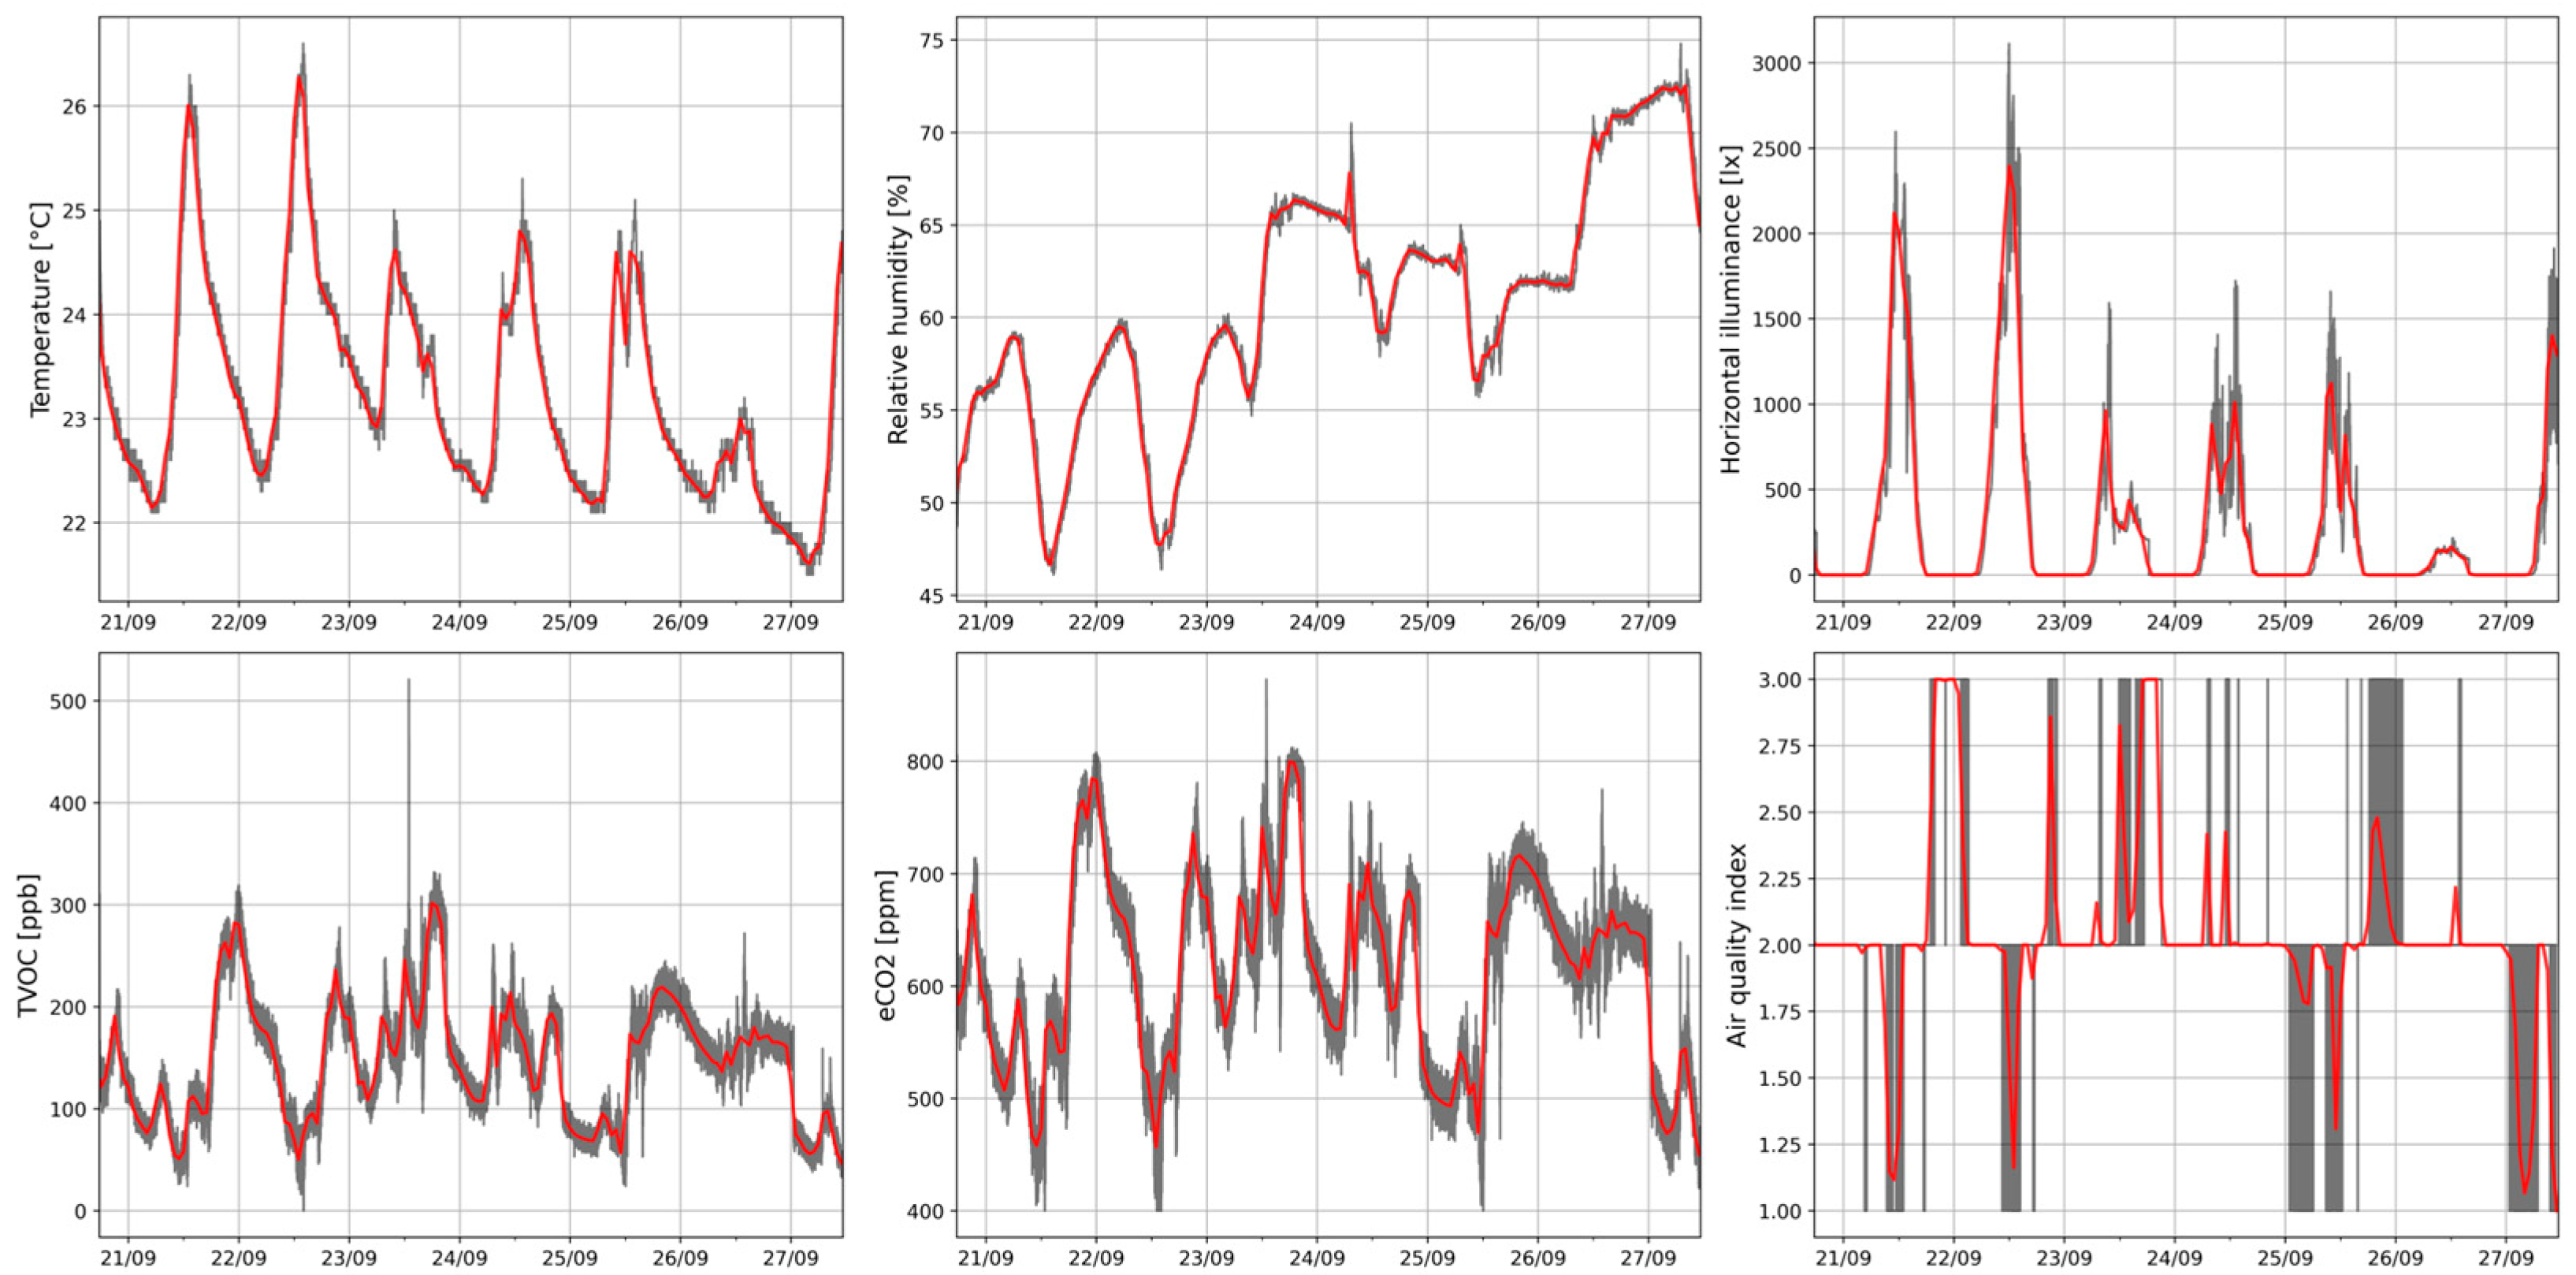
The alpha prototype presented was tested during a one-week experiment (from 19:40 on 20 September 2024 to 13:10 on 27 September 2024) conducted in the office to verify its functionality. The desk lamp was positioned in the south-east part of the room, and the simulations and environmental variables were recorded considering a 15 s interval between two measurements. Figure 16 illustrates the distribution of temperature, relative humidity, horizontal illuminance, and air quality-related variables such as TVOC, equivalent CO2 (eCO2), and the air quality index (AQI) during the experiment. Throughout this period, the weather remained predominantly sunny for the first three days, whereas the latter half of the week experienced deteriorating conditions with overcast skies and rainfall. This resulted in an overall increase in the relative humidity and a decrease in temperature, which seems to mimic the daily path with a range that stands between 22.8 °C and 24.3 °C during the occupied hours (from 9:00 to 18:00, weekends excluded), with an average relative humidity of 63%. The concentration of TVOC recorded by the lamp device oscillates during that time with a 25th and 75th percentile of 118 ppb and 184 ppb, while the eCO2 concentration has an average of 622 ppm. The resulting average AQI is around 2.02, which indicates a good air quality level.
The extracted data were compared with readings from existing commercial sensors in the space with a focus on temperature, although further validation would be beneficial to confirm their reliability. Figure 17 depicts the comparison among the desk lamp values: the ones associated with other sensors present in the room and the external temperature. All the room sensors are positioned on the south side and near the window, at the entrance, and in the middle of the desk. From the probability density distribution graph, it is evident how the values extracted differ significantly. In particular, the portion of the room near the window is subjected to higher temperatures that can go up to 34.6 °C due to direct solar radiation, while the desk and lamp temperatures are 7 °C below this value. The window profile exhibits the most variation throughout the studied period, while the lamp, display sensors, and desk follow a similar trend. Considering the latter as a base, the average absolute difference with the desk lamp sensor is 0.8 °C, while the display and window sensors go to 1.1 °C and 2.2 °C, respectively. On the other hand, the window profile more accurately reflects the external weather conditions.

4. Discussion

This project revealed significant insights into the development of local monitoring systems in existing buildings and the potential impact this device may have on designers and occupants by enhancing the decision-making process and providing objective data to users, bridging the gap between current monitoring solutions and more personalized approaches. Specifically, the system design is the result of an analysis of relevant metrics, combined with the possibility of purchasing affordable and compact sensors with the addition of a dedicated script to perform monitoring. The devices selected were then embedded in a desk lamp, which was chosen among other objects in the workspace, and functional models are available to generalize the compatibility of this design, which reaches a basic price of EUR 33. The system is thus cheap, fully integrated within the environment, flexible, and comprehensive. This differs from other options available in the market or in the literature, which often fail to include all those aspects simultaneously. Specifically, as reviewed in Section 1.3, many market solutions either require furniture replacement (e.g., smart desks), impose a bulky footprint and high unit cost (e.g., room-scale multiparameter monitors), or prioritize non-essential features that significantly impact the final cost, whereas the proposed desk lamp probe is retrofittable, has a small-footprint and low-cost, while delivering IEQ measurements at the micro-environment level. On the other hand, existing solutions may be more suitable for selected topics such as the conduction of short campaigns (e.g., multi-objective indoor sensor systems) or continuous, compliance-oriented monitoring in regulated or high-occupancy spaces with specific spatial restrictions. The assembled prototype constitutes an alpha of the system but is still effective in providing meaningful results by conducting long-term monitoring in a room.
The analysis related to the open office spaces studied spotlighted the need for a less centralized system by depicting a highly variable environment with significant discrepancies over the year in the six locations selected for the virtual sensors. The MRT field appears to be extremely variable in time, as it is dominated by direct radiation. In the selected critical hours, a person seated near the desk may experience an MRT that is up to 6.9 °C higher than the median condition in the room, resulting in a decrease in comfort sensation, as this difference was observed in the summer. Similar results are achieved for the sensor placed near the south windows. Climate-based daylight metrics immediately depict an uneven space with the ASE, which identifies two subspaces in the room separating the north-west part from the south-east one (which passed the threshold). The average illuminance over the year peaks near the south-east side of the room, and the discrepancy analysis confirms a major variation in the desk time series that originates from the excessive exposure to direct radiation compared to the other part of the room. The opaque wall, and even the north-east sensor, follow the median condition of the environment. Surprisingly, south-side windows present the highest differences in spring and summer. As expected, the less varying results are related to the opaque wall and the north façade, which has reduced impinging solar radiation compared to the south one. These simulations indicate that more sensors are indeed necessary to depict the condition of such a room. The variability obtained may constitute the base for optimizing sensor placement by avoiding redundant data (i.e., a sensor close to the opaque wall would produce an output similar to the one in the north-west part) and encouraging more precision in the parts that are subjected to higher variations. Finally, the validation of the system allowed us to verify the functionality of the device by testing it in a 7-day experiment. During the campaign, the lamp-mounted device collected >40,000 temperature, humidity, illuminance, eCO2, and IAQ samples, revealing sharp micro-climatic contrasts across the space. The air quality-related variable indicates a “good” air quality level, with the AQI averaging at 2.02. At the lamp location, occupied-hour temperatures stayed within 22.8–24.3 °C, yet simultaneous reference probes revealed that the south-facing window zone spiked to 34.6 °C, while the center-desk probe differed from the lamp by just 0.8 °C, confirming the accuracy of the device and, at the same time, the steep horizontal gradient that a single wall sensor would have missed otherwise. Collectively, these findings validate the sensor chain, and the results gathered show a clear trend in which the recorded variables may vary substantially in the room, emphasizing the need for a more decentralized control that is able to capture local discrepancies within the space. In fact, localized sensing makes a centrally controlled open plan tractable at the desk scale. By streaming desk-level conditions to the BMS, supervisory logic can issue targeted micro-adjustments—light control or also the possibility to integrate PCS—only to affected users, avoiding zone-wide over-conditioning and providing the facility manager with valuable insight and data about the environment under monitoring. This results in potential energy-saving by leveraging a human-centered design in which the comfort condition of each occupant is accounted for, moving the building toward smarter and more sustainable operations.

5. Conclusions

This research details the development of a fully integrated, easy-to-assemble, and functional multi-purpose sensor system embeddable in a desk lamp, considering very few requirements to go beyond the problems related to the systems already available in the market which are, in some cases, limited to a few metrics, bulky, and expensive. With a design that prioritizes a minimal footprint, ease of assembly, and adaptability to existing office spaces, the device comes with a broad variety of measurable variables at a base price of EUR 33, which may significantly drop if scaled, making it a cheap and practical solution for post-occupancy evaluations and personalized environmental control. The device facilitates localized environmental monitoring in existing spaces through the accurate measurement of comfort-related variables in order to provide useful and impactful data to ease the assessment of an environment. The research also remarks on the importance of localized monitoring, evidenced by computer simulations which underlined significant discrepancies between the global and local conditions in an open office environment. The findings highlight the necessity of personalized monitoring, considering the significant variability of MRT and illuminance distribution in the space, which can substantially modify the user experience. In addition, the alpha prototype was used to show the feasibility of the system and to acquire real data, resulting in a one-week experiment in which the capabilities of the system were assessed and compared to existing sensors present in the laboratory. The result is a functional prototype that could provide designers with local data, potentially enhancing the decision-making process to reduce energy consumption and the environmental impact of the building, providing a useful tool towards the decarbonization of the building sector through a data-centric approach.
This paper does not come without limitations, and further studies should focus on continuing the development process of the system. The produced prototype is an early (alpha) version of the product, which does not reflect the designed compactness and does not prove the reliability of sensors over the long term. In particular, the desk lamp’s positioning and orientation can bias local readings; proximity to heat sources may induce self-heating and convective artifacts; and heterogeneity in sensor designs may limit the readability and comparability. For this reason, the next step would be to use the designed 3D-printed pieces so as to optimize the connections from the sensors to the development board to minimize the visual footprint and execute long-term calibration/validation campaigns to quantify drift and reliability. In addition, the connectivity of the device with an external system may lead to significant benefits in terms of time and accuracy. Another development board with a Wi-Fi integrated module can be adapted to allow for the sharing of data over the internet and broadcast the information to the building management system (BMS) or the digital twin of the building. Additionally, future iterations could explore the integration with personal comfort systems (PCS), leveraging the localized data gathered by the sensor system to adaptively control the connected devices based on individual occupant needs. This would support more occupant-centric environmental control strategies. Lastly, the expandability of this research to larger spaces or with different destinations of use remains unsolved, especially considering that some of the tools used may not be so accurate in large rooms in which computational fluid dynamic (CFD) studies are more appropriate to estimate the spatial distribution of variables [47].

Author Contributions

Conceptualization, V.D.L., A.S. and J.D.B.C.; methodology, V.D.L., A.S. and J.D.B.C.; software, V.D.L.; validation, V.D.L. and A.S.; formal analysis, V.D.L.; investigation, V.D.L. and A.S.; resources, A.S. and J.D.B.C.; data curation, V.D.L.; writing—original draft preparation, V.D.L.; writing—review and editing, V.D.L. and A.S.; visualization, V.D.L.; supervision, A.S., J.D.B.C. and G.F.; project administration, A.S. and J.D.B.C.; funding acquisition, A.S. All authors have read and agreed to the published version of the manuscript.

Funding

This research received no external funding.

Conflicts of Interest

The authors declare no conflict of interest.

Abbreviations

The following abbreviations are used in this manuscript:
AQIAir Quality Index
ASEAnnual Sunlight Exposure
BMSBuilding Management System
CFDComputational Fluid Dynamics
DFDaylight Factor
DGPDaylight Glare Probability
HVACHeating, Ventilation and Air Conditioning
IAQIndoor Air Quality
IEQIndoor Environmental Quality
IoTInternet of Things
MRTMean Radiant Temperature
PCSPersonal Comfort system
PMParticulate Matter
PMVPredicted Mean Vote
POEPost-Occupancy Evaluation
PPDPredicted Percentage of Dissatisfied
RHRelative Humidity
sDASpatial Daylight Autonomy
TMYTypical Meteorological Year
TVOCTotal Volatile Organic Compounds
UDIaUseful Daylight Illuminance
VOCVolatile Organic Compound

Appendix A

Table A1. Relevant environmental variables affecting indoor environmental comfort.
CategoryVariableMeasurement TypeModel/Standard
Thermal comfortAir temperatureThermometer[5,6,7]
Mean radiant temperatureGlobe thermometer[5,6,7]
Air velocityAnemometer[5,6,7]
Relative humidityHygrometer[5,7]
Clothing insulation Tables [5,7]
Metabolic rateWearable sensor/reference table[5,7]
Outdoor temperatureWeather station[6,7]
Outdoor relative humidityWeather station[7]
PrecipitationWeather station[7]
ClimateWeather station[7]
Skin temperatureSkin thermometer[7]
Heart rateWearable sensor[7]
Visual comfortVisual taskEstimation[9,47]
IlluminanceLux meter[9,47]
ContrastLux meter[9,47]
LuminanceVideo photometer[9,47]
ColorVideo photometer[9,47]
GlareVideo photometer[9,47]
Air qualityCONDIR/Electrochemical sensor[10,11,13,14]
CO2NDIR/Electrochemical sensor[10,11,13,14]
NOXElectrochemical sensor[10,11,13,14]
SO2Electrochemical sensor[10,11,13,14]
O3Electrochemical sensor[10,11,13,14]
HCHOSemiconductor sensor[10,11,14]
TVOCPID/Electrochemical sensor[10,11,14]
PM10Optical particle sensor[10,11,13,14]
PM2.5Optical particle sensor[10,11,14]
RadonRadon sensor[10,11,13,14]
Acoustic comfortPhonPhonometer[15,48,49]
Sound pressure levelSound level meter/microphone[15,48,49]
Sound intensity levelSound level meter/microphone[48,49]
Low-frequency noiseSound level meter/microphone[48,49]
High-frequency noiseSound level meter/microphone[48,49]
Reverberation timeSound level meter/microphone[15,48,49]
Noise typeExperimental noise analyzer[48,49]
CommonDemographicPersonal data

Appendix B

Table A2. Post-occupancy evaluation protocols review.
Protocol NameRef.DeveloperCountryYearBuilding TypeEvaluation DepthData Collection PeriodTool Used
BOSSA[50]University of Sydney, University of Technology SydneyAustralia2011OfficeInvestigative + DiagnosticSnapshot (1–2 weeks typical; time-lapse enables longitudinal repeats)BOSSA nova cart, BOSSA time-lapse survey, and BOSSA snapshot surveys
CBE BPE toolkit[51]Center for the Built Environment (CBE) at UC BerkeleyUS2000Office, University, and GovernmentInvestigative + DiagnosticSnapshot (web survey) + Short campaign/real timeOccupant IEQ survey, Indoor Climate Monitor, Portable UFAD Commissioning Cart, and sound level pressure meter
CEH[52]University of NottinghamUK2010ResidentialDiagnosticLongitudinal/Continuous (seasonal–annual datasets)Electricity and water use, energy and heat meters, and IEQ monitoring
COPE[53]National Research Council CanadaCanada2000OfficeInvestigative + DiagnosticSnapshot + Short campaign when there are multiple zonesCart-and-chair system, 27-item occupant satisfaction survey
Diagnostic POE Model for an Emergency Department[54]Guinther, Lindsey; Carll-White, Allison; Real, KevinUS2014MedicalDiagnosticShort campaign (multi-method fieldwork over days–weeks)IEQ snapshot, Behavioral Mapping, Staff Questionnaire, Patient and Visitor Questionnaire, and focus groups
HOPE[55]14 organizations in nine European countries (Italy included)Europe2002Office, ResidentialInvestigative + DiagnosticShort campaign to seasonal (integrates surveys + on-site measurements)Inspection checklist, interviews with building managers, and Occupant IEQ satisfaction survey
iiSBE protocol[56]Ryerson University, University of British Columbia, University of ManitobaCanada2014Office, University, and EducationalInvestigative + DiagnosticAnnual + Snapshot/Short campaign (IEQ + survey)Energy and water bills, IEQ snapshot, and occupant survey based on the survey of NRC
NEAT[57]Center for Building Performance and Diagnostics at Carnegie Mellon UniversityUS2003OfficeDiagnosticSnapshot to short campaignElectricity and gas bills, NEAT cart, and COPE questionnaire
NRC[58]National Research Council CanadaCanada2012OfficeDiagnosticSnapshot to short campaignEnergy bills, HDR photography, NICE cart, Pyramids, and online questionnaire
PMP[23]ASHRAE, USGBC, CIBSEUS2010Office, CommercialTiered: Indicative/Diagnostic/InvestigativePeriodic to continuous (protocol specifies frequencies per metric)Energy and water use, IEQ measurements, and CBE survey
POE framework for higher education residence halls[23]Alborz, Nakisa; Berardi, UmbertoUS, Canada2015ResidentialInvestigativeShort campaign (surveys/spot) + Annual (consumption/controls readings)Electricity, water, and gas consumption, building automation controls reading T and RH, and student survey
Post-Occupancy Evaluation for Multi-Unit Residential Buildings Open Green Building SocietyCanada2016ResidentialInvestigativeSnapshot + Annual where availableKick-off meeting, Building Manager Survey, occupant survey, and energy and water use (ENERGY STAR Portfolio Manager)
PROBE[59]Energy for Sustainable Development, William Bordass AssociatesUK1995Office, University, Educational, and MedicalDiagnosticShort campaign (site audits and BUS survey) + Annual (energy benchmarks)Energy audit by OAM, BUS occupant survey
Tsinghua protocol[60]Key Laboratory of Eco Planning & Green Building, Tsinghua UniversityChina2013OfficeDiagnosticShort campaign to seasonalEnergy metering, IEQ monitoring, and IEQ satisfaction survey
Whole Building Cost and Performance Measurement[61]Pacific Northwest National LaboratoryUS2005Office (public buildings)DiagnosticAnnual + Continuous where availableWater, energy, maintenance and operations, waste generation and recycling, IEQ, and transportation

Appendix C

Table A3. Analysis of smart lamp models proposed in the literature.
Ref.Building TypeStudy TypeVariable of InterestControl InputsSensors Used
[62]ResidentialField studyEnergy saving, energy consumptionOccupancy, activity recognitionPlug meters, light sensors, and binary motion sensors
[63]Laboratory studyEnergy saving, user satisfactionDaylight, occupancyMotion, light
[64]Laboratory/computational modelingEnergy saving, energy consumptionOccupancyMotion, heat sink temperature, and light
[65]Laboratory studyStandby energy consumptionDaylightLight
[66]Laboratory study/computer simulationVisual comfort, energy consumptionDaylight, occupancyMotion, light
[67]Laboratory/computational modelingEnergy consumption, visual comfortDaylight, occupancyMotion, light
[68]Laboratory/computational modelingEnergy saving, visual comfort, and melatonin suppression ratioOccupancy, activity recognitionSpectral and RGB, temperature, humidity
[69]Field studySubjective assessment light effectsPre-programmed lighting scenes, time-based scheduleDALI bus lighting management system
[70]Computational modelingEnergy savingDaylight, occupancyMotion, light
[71]Laboratory/computational modelingEnergy savingDaylightLight (smartphone camera)
[72]Computational modelingUser satisfaction with uniformity and illuminationOccupancyInfrared (presence/absence), illuminance
[73]Office/commercialLaboratory/computational modelingEnergy savingsDaylight, user-defined illuminance setpointMotion, light
[74]Field studyEnergy savings, indoor comfortUser presence, daylightLight
[75]Field studyEnergy savings, power quality, and lighting qualityOccupancy, digital dimming controlMotion, light
[76]Field studyUser satisfaction, energy consumptionDaylight, occupancyMotion, light

Appendix D

Table A4. Cost breakdown for the proposed system.
CategoryPart DescriptionProductQuantityUnit Cost [EUR]Total Cost [EUR]
PhysicalDesk lampLamp concept11818
Base 3D printBase 3D print on Bambu Lab X1, 0.4 nozzle (Bambu Lab, Shenzhen, China), PLA10.80.8
Arm 3D printArm 3D print on Bambu Lab X1, 0.4 nozzle, PLA11.51.5
BoardDevelopment boardAdafruit FLORA v3(Adafruit Industries, New York, NY, USA)11515
SensingLight sensorAdafruit BH1750 Ambient Light Sensor (Adafruit Industries, New York, NY, USA) (±20% at 1 klx)
Kevixun BH1750(±20% at 1 klx)
14.2/
1.7
4.2/
1.7
Air quality sensorSparkFun Indoor Air Quality Sensor—ENS160 + AHT21 (SparkFun Electronics, Niwot, CO, USA).118.5/4.3718.5/4.37
Temperature and RH sensorAm2302 DHT22 (±0.5 °C, ±2% RH) (Aosong (Guangzhou) Electronics Co., Ltd., DHT22 chip, Guangzhou, China)10.910.91
Sound sensorSparkFun Sound Detector
Sound sensor (SparkFun Electronics, Niwot, CO, USA)
111.95/0.9111.95/0.91
StoringSD slotAdafruit MicroSD card breakout board+ (Adafruit Industries, New York, NY, USA)16.7/0.956.7/0.95
CablesAlligator cables (×12)Small Alligator Clip Test Lead (set of 12)0.53.71.35
Cables (no connectors)Flat Ribbon Cable 10-Pin0.271.4
Power3.7 V to USB plug3.7 V USB Charging Cable XH 2.54 mm 2pin Plug to USB Connector133
FixingM3 screwsM3 lowering Screws/cylinder head Screws/lens head Screws stainless steel A2 10 pieces0.41.830.73
OtherHoles for fixingDrilling holes for fixing the screws4--

References

  1. Klepeis, N.E.; Nelson, W.C.; Ott, W.R.; Robinson, J.P.; Tsang, A.M.; Switzer, P.; Behar, J.V.; Hern, S.C.; Engelmann, W.H. The National Human Activity Pattern Survey (NHAPS): A resource for assessing exposure to environmental pollutants. J. Expo. Sci. Environ. Epidemiol. 2001, 11, 231–252. [Google Scholar] [CrossRef] [PubMed]
  2. Boasson, E.; Dupont, C. Buildings: Good Intentions Unfulfilled. In Decarbonization in the European Union: Internal Policies and External Strategies; Palgrave Macmillan UK: London, UK, 2015; pp. 137–158. ISBN 978-1-349-68088-7. [Google Scholar]
  3. de Dear, R.J.; Akimoto, T.; Arens, E.A.; Brager, G.; Candido, C.; Cheong, K.W.D.; Li, B.; Nishihara, N.; Sekhar, S.C.; Tanabe, S.-I.; et al. Progress in Thermal Comfort Research over the Last Twenty Years. Indoor Air 2013, 23, 442–461. [Google Scholar] [CrossRef] [PubMed]
  4. Fufa, S.M.; Flyen, C.; Flyen, A.C. How Can Existing Buildings with Historic Values Contribute to Achieving Emission Reduction Ambitions? Appl. Sci. 2021, 11, 5978. [Google Scholar] [CrossRef]
  5. de Oliveira Santos, T.D.; Pacheco, F.A.L.; Fernandes, L.F.S. A Systematic Analysis on the Efficiency and Sustainability of Green Facades and Roofs. Sci. Total Environ. 2024, 932, 173107. [Google Scholar] [CrossRef]
  6. Fanger, P.O.; Toftum, J. Extension of the PMV Model to Non-Air-Conditioned Buildings in Warm Climates. Energy Build. 2002, 34, 533–536. [Google Scholar] [CrossRef]
  7. Brager, G.S.; De Dear, R. Climate, Comfort & Natural Ventilation: A New Adaptive Comfort Standard for ASHRAE Standard 55; Center for the Built Environment: Berkeley, CA, USA, 2001. [Google Scholar]
  8. Kim, J.; Schiavon, S.; Brager, G. Personal Comfort Models—A New Paradigm in Thermal Comfort for Occupant-Centric Environmental Control. Build. Environ. 2018, 132, 114–124. [Google Scholar] [CrossRef]
  9. ISO/CIE 8995-1:2025; Light and lighting—Lighting of work places—Part 1: Indoor. ISO: Geneva, Switzerland, 2002. Available online: https://www.iso.org/standard/76342.html (accessed on 18 September 2024).
  10. UNI EN 12464-1:2021; UNI Ente Italiano di Normazione: Milan, Italy. Available online: https://store.uni.com/uni-en-12464-1-2021 (accessed on 1 June 2024).
  11. WELL—International WELL Building Institute|IWBI. Available online: https://www.wellcertified.com/ (accessed on 1 June 2024).
  12. LEED Rating System|U.S. Green Building Council. Available online: https://www.usgbc.org/leed (accessed on 8 August 2023).
  13. World Health Organization. Indoor Air Quality: Organic Pollutants; EURO Reports and Studies 111; WHO: Geneva, Switzerland, 1989. [Google Scholar]
  14. AQI Basics|AirNow.Gov. Available online: https://www.airnow.gov/aqi/aqi-basics/ (accessed on 1 June 2024).
  15. Vardaxis, N.G.; Bard, D.; Persson Waye, K. Review of Acoustic Comfort Evaluation in Dwellings—Part I: Associations of Acoustic Field Data to Subjective Responses from Building Surveys. Build. Acoust. 2018, 25, 151–170. [Google Scholar] [CrossRef]
  16. ISO 717-1:2020; Acoustics—Rating of Sound Insulation in Buildings and of Building Elements—Part 1: Airborne Sound Insulation. ISO: Geneva, Switzerland, 2020. Available online: https://www.iso.org/standard/77435.html (accessed on 1 June 2024).
  17. Preiser, W.F.E. Building Performance Assessment—From POE to BPE, A Personal Perspective. Arch. Sci. Rev. 2011, 48, 201–204. [Google Scholar] [CrossRef]
  18. Zimmerman, A.; Martin, M. Post-Occupancy Evaluation: Benefits and Barriers. Build. Res. Inf. 2001, 29, 168–174. [Google Scholar] [CrossRef]
  19. Di Giuda, G.; Pellegrini, L.; Schievano, M.; Locatelli, M.; Paleari, F. BIM and Post-Occupancy Evaluations for Building Management System: Weaknesses and Opportunities. In Digital Transformation of the Design, Construction and Management Processes of the Built Environment; Springer Nature: Cham, Switzerland, 2020; pp. 319–327. ISBN 978-3-030-33569-4. [Google Scholar]
  20. Li, P.; Froese, T.M.; Brager, G. Post-Occupancy Evaluation: State-of-the-Art Analysis and State-of-the-Practice Review. Build. Environ. 2018, 133, 187–202. [Google Scholar] [CrossRef]
  21. Turpin-Brooks, S.; Viccars, G. The Development of Robust Methods of Post Occupancy Evaluation. Facilities 2006, 24, 177–196. [Google Scholar] [CrossRef]
  22. Preiser, W.; Vischer, J. Assessing Building Performance; Routledge: Abingdon, UK, 2006; ISBN 1136427961. [Google Scholar]
  23. Candido, C.; Kim, J.; De Dear, R.; Thomas, L. BOSSA: A Multidimensional Post-Occupancy Evaluation Tool. Build. Res. Inf. 2016, 44, 214–228. [Google Scholar] [CrossRef]
  24. Dixit, S. Study of Factors Affecting the Performance of Construction Projects in AEC Industry. Organ. Technol. Manag. Constr. 2020, 12, 2275–2282. [Google Scholar] [CrossRef]
  25. Bluyssen, P.M.; Aries, M.; van Dommelen, P. Comfort of Workers in Office Buildings: The European HOPE Project. Build. Environ. 2011, 46, 280–288. [Google Scholar] [CrossRef]
  26. Vischer, J. Post-Occupancy Evaluation: A Multifaceted Tool for Building Improvement. In Learning from Out Buildings: A State-of-the-Practice Summary of Post-Occupancy Evaluation; National Academies Press: Washington, DC, USA, 2002; pp. 23–34. [Google Scholar]
  27. Aryal, A.; Anselmo, F.; Becerik-Gerber, B. Smart IoT Desk for Personalizing Indoor Environmental Conditions. In Proceedings of the 8th International Conference on the Internet of Things, London, UK, 13–15 October 2018; ACM International Conference Proceeding Series; Association for Computing Machinery: New York, NY, USA, 2018. [Google Scholar]
  28. Sphensor—LSI LASTEM Soluzioni per Il Monitoraggio Ambientale. Available online: https://www.lsi-lastem.com/products/indoor-environment-sensors/multiparameter-sensors/sphensor/ (accessed on 11 September 2024).
  29. Chew, I.; Karunatilaka, D.; Tan, C.P.; Kalavally, V. Smart Lighting: The Way Forward? Reviewing the Past to Shape the Future. Energy Build. 2017, 149, 180–191. [Google Scholar] [CrossRef]
  30. Soheilian, M.; Fischl, G.; Aries, M. Smart Lighting Application for Energy Saving and User Well-Being in the Residential Environment. Sustainability 2021, 13, 6198. [Google Scholar] [CrossRef]
  31. Newsham, G.; Veitch, J.; Arsenault, C. Effect of Dimming Control on Office Worker Satisfaction and Performance. In Proceedings of the IESNA Annual Conference, Tampa, FL, USA, 25–28 July 2004. [Google Scholar]
  32. DEBO BH 1750: Developer Boards—Digital Light Sensor, BH1750 Buy at Reichelt. Available online: https://www.reichelt.com/it/en/shop/product/developer_boards_-_digital_light_sensor_bh1750-224217 (accessed on 21 September 2024).
  33. ENS160 + AHT21 Anidride Carbonica CO2 Eco2 Toc Sensore di Qualità Dell’aria e Temperatura e Umidità—AliExpress 502. Available online: https://it.aliexpress.com/item/1005004052950350.html?src=google&pdp_npi=4%40dis!EUR!5.54!5.54!!!!!%40!12000027873104953!ppc!!!&src=google&albch=shopping&acnt=742-864-1166&isdl=y&slnk=&plac=&mtctp=&albbt=Google_7_shopping&aff_platform=google&aff_short_key=UneMJZVf&gclsrc=aw.ds&&albagn=888888&&ds_e_adid=&ds_e_matchtype=&ds_e_device=c&ds_e_network=x&ds_e_product_group_id=&ds_e_product_id=it1005004052950350&ds_e_product_merchant_id=107713925&ds_e_product_country=IT&ds_e_product_language=it&ds_e_product_channel=online&ds_e_product_store_id=&ds_url_v=2&albcp=22118443566&albag=&isSmbAutoCall=false&needSmbHouyi=false&gad_source=1&gclid=CjwKCAiAnpy9BhAkEiwA-P8N4iRpkyG6cTF678nJZ-UAxtzvV1TRQtryJs0ycvGgFBI9xA6JPPY96xoCckcQAvD_BwE (accessed on 8 February 2025).
  34. Sensore di Temperatura Digitale/Sensore di Umidità AM2302 Modulo Sensore DHT22 per Arduino Elettronico Fai da Te—AliExpress 502. Available online: https://it.aliexpress.com/item/32759901711.html?src=google&pdp_npi=4%40dis!EUR!2.08!2.08!!!!!%40!62102476019!ppc!!!&src=google&albch=shopping&acnt=742-864-1166&isdl=y&slnk=&plac=&mtctp=&albbt=Google_7_shopping&aff_platform=google&aff_short_key=UneMJZVf&gclsrc=aw.ds&&albagn=888888&&ds_e_adid=&ds_e_matchtype=&ds_e_device=c&ds_e_network=x&ds_e_product_group_id=&ds_e_product_id=it32759901711&ds_e_product_merchant_id=107683874&ds_e_product_country=IT&ds_e_product_language=it&ds_e_product_channel=online&ds_e_product_store_id=&ds_url_v=2&albcp=22118443566&albag=&isSmbAutoCall=false&needSmbHouyi=false&gad_source=1&gclid=CjwKCAiAnpy9BhAkEiwA-P8N4tAEHCwCi5u4UYhGv35GWNjmzK6Dn9w4YF4SYqtteWHFPVYmVZr8xxoCD1kQAvD_BwE (accessed on 8 February 2025).
  35. SparkFun Sound Detector—SEN-12642—SparkFun Electronics. Available online: https://www.sparkfun.com/products/12642 (accessed on 2 June 2024).
  36. FLORA—Wearable Electronic Platform: Arduino-Compatible [v3]: ID 659: Adafruit Industries, Unique & Fun DIY Electronics and Kits. Available online: https://www.adafruit.com/product/659 (accessed on 21 May 2024).
  37. MicroSD Card Breakout Board+: ID 254: Adafruit Industries, Unique & Fun DIY Electronics and Kits. Available online: https://www.adafruit.com/product/254 (accessed on 21 September 2024).
  38. Suryanarayana, G.; Arroyo, J.; Helsen, L.; Lago, J. A Data Driven Method for Optimal Sensor Placement in Multi-Zone Buildings. Energy Build. 2021, 243, 110956. [Google Scholar] [CrossRef]
  39. Otim, T.; Díez, L.E.; Bahillo, A.; Lopez-Iturri, P.; Falcone, F. Effects of the Body Wearable Sensor Position on the UWB Localization Accuracy. Electronics 2019, 8, 1351. [Google Scholar] [CrossRef]
  40. Serrano-Arellano, J.; Belman-Flores, J.M.; Hernández-Pérez, I.; Aguilar-Castro, K.M.; Macías-Melo, E.V.; Elizalde-Blancas, F.; Riesco-Ávila, J.M.; García-Rodríguez, F.J. Numerical Study of the Distribution of Temperatures and Relative Humidity in a Ventilated Room Located in Warm Weather. CMES—Comput. Model. Eng. Sci. 2020, 123, 571–602. [Google Scholar] [CrossRef]
  41. Ogilvie, J.R.; Barber, E.M.; Randall, J.M. Floor Air Speeds and Inlet Design in Swine Ventilation Systems. Trans. ASAE 1990, 33, 255–259. [Google Scholar] [CrossRef]
  42. ClimateStudio—Solemma. Available online: https://www.solemma.com/climatestudio (accessed on 26 May 2024).
  43. \Climatewebsite\WMO_Region_6_Europe\ITA_Italy. Available online: https://climate.onebuilding.org/WMO_Region_6_Europe/ITA_Italy/index.html (accessed on 16 September 2024).
  44. BS ISO 17772-1 2017; BSI Standards Publication Energy Performance of Buildings-Indoor Environmental Quality. ISO: Geneva, Switzerland, 2017; ISBN 9780580790560.
  45. ISO 18523-1:2016; Energy Performance of Buildings—Schedule and Condition of Building, Zone and Space Usage for Energy Calculation—Part 1: Non-Residential Buildings. ISO: Geneva, Switzerland, 2016. Available online: https://www.iso.org/standard/62765.html (accessed on 23 June 2024).
  46. Cadena, J.D.B.; Speroni, A.; Mainini, A.G.; Poli, T. Color Heterogeneity of Building Surfaces: Lean Image Processing Approach for Visible Reflectance Characterization Performance. In Proceedings of the Building Simulation 2019: 16th Conference of IBPSA, Rome, Italy, 2–4 September 2016; International Building Performance Simulation Association: Verona, WI, USA, 2019; Volume 2, pp. 1199–1206. [Google Scholar]
  47. Yu, C.R.; Liu, X.; Wang, Q.C.; Yang, D. Solving the Comfort-Retrofit Conundrum through Post-Occupancy Evaluation and Multi-Objective Optimisation. Build. Serv. Eng. Res. Technol. 2023, 44, 381–403. [Google Scholar] [CrossRef]
  48. Ljunggren, F.; Simmons, C. Correlation between sound insulation and occupants’ perception—Proposal of alternative single number rating of impact sound, Part III. Appl. Acoust. 2024, 197, 108955. [Google Scholar] [CrossRef]
  49. Hagberg, K.; Bard, D. Low Frequency Sound Transmission in Multifamily Wooden Houses. In Proceedings of the INTERNOISE 2014—43rd International Congress on Noise Control Engineering: Improving the World Through Noise Control 2014, Melbourne, Australia, 16–19 November 2014. [Google Scholar]
  50. Park, S.H.; Lee, P.J.; Lee, B.K.; Roskams, M.; Haynes, B.P. Associations between job satisfaction, job characteristics, and acoustic environment in open-plan offices. Appl. Acoust. 2020, 168, 107425. [Google Scholar] [CrossRef]
  51. Tekler, Z.D.; Lei, Y.; Peng, Y.; Miller, C.; Chong, A. A hybrid active learning framework for personal thermal comfort models. Build. Environ. 2023, 234, 110148. [Google Scholar] [CrossRef]
  52. Jayathissa, P.; Quintana, M.; Abdelrahman, M.; Miller, C. Humans-as-a-sensor for buildings: Intensive longitudinal indoor comfort models. Buildings 2020, 10, 174. [Google Scholar] [CrossRef]
  53. Ali, S.B.; Patnaik, S. Thermal comfort in urban open spaces: Objective assessment and subjective perception study in tropical city of Bhopal, India. Urban Clim. 2018, 24, 954–967. [Google Scholar] [CrossRef]
  54. Coleman, S. Normalizing Sustainability in a Regenerative Building: The Social Practice of Being at CIRS. 2016. Available online: https://open.library.ubc.ca/collections/24/items/1.0319909 (accessed on 1 June 2025).
  55. Leaman, A.; Stevenson, F.; Bordass, B. Building evaluation: Practice and principles. Build. Res. Inf. 2010, 38, 564–577. [Google Scholar] [CrossRef]
  56. Costa, A.A.; Lopes, P.M.; Antunes, A.; Cabral, I.; Grilo, A.; Rodrigues, F.M. 3I Buildings: Intelligent, Interactive and Immersive Buildings. Procedia Eng. 2015, 123, 7–14. [Google Scholar] [CrossRef]
  57. Lovins, A. Energy-Efficient Buildings: Institutional Barriers and Opportunities; E Source, Inc.: Boulder, CO, USA, 1992. Available online: https://www.osti.gov/biblio/55563 (accessed on 12 June 2025).
  58. Boissonneault, A.; Peters, T. An Exploration of Post-Occupancy Evaluation in Canada: Origins, Milestones and Next Steps. Build. Res. Inf. 2024, 52, 332–357. [Google Scholar] [CrossRef]
  59. Fowler, K.M.; Spees, K.L.; Kora, A.R.; Rauch, E.M.; Hathaway, J.E.; Solana, A.E. Whole Building Cost and Performance Measurement: Data Collection Protocol Revision 2; U.S. Department of Energy: Washington, DC, USA, 2009. [CrossRef]
  60. Chen, Y.; Zhang, J.; Yang, Z.; Qiu, Z. Improving Life Quality for the Aged: A Comprehensive Post-Occupancy Evaluation of Long-Term Care Facilities in China. Front. Public Health 2024, 12, 1488653. [Google Scholar] [CrossRef]
  61. Fowler, K.M.; Rauch, E.M.; Henderson, J.W.; Kora, A.R. Re-Assessing Green Building Performance: A Post Occupancy Evaluation of 22 GSA Buildings; U.S. Department of Energy: Washington, DC, USA, 2010. [CrossRef]
  62. Ahmadi-Karvigh, S.; Ghahramani, A.; Becerik-Gerber, B.; Soibelman, L. Real-Time Activity Recognition for Energy Efficiency in Buildings. Appl. Energy 2018, 211, 146–160. [Google Scholar] [CrossRef]
  63. Byun, J.; Hong, I.; Lee, B.; Park, S. Intelligent Household LED Lighting System Considering Energy Efficiency and User Satisfaction. IEEE Trans. Consum. Electron. 2013, 59, 70–76. [Google Scholar] [CrossRef]
  64. Cimini, G.; Freddi, A.; Ippoliti, G.; Monteriù, A.; Pirro, M. A Smart Lighting System for Visual Comfort and Energy Savings in Industrial and Domestic Use. Electr. Power Compon. Syst. 2015, 43, 1696–1706. [Google Scholar] [CrossRef]
  65. Dikel, E.E.; Li, Y.E.; Vuotari, M.; Mancini, S. Evaluating the Standby Power Consumption of Smart LED Bulbs. Energy Build. 2019, 186, 71–79. [Google Scholar] [CrossRef]
  66. Frascarolo, M.; Martorelli, S.; Vitale, V. An Innovative Lighting System for Residential Application That Optimizes Visual Comfort and Conserves Energy for Different User Needs. Energy Build. 2014, 83, 217–224. [Google Scholar] [CrossRef]
  67. Kumar, A.; Kar, P.; Warrier, R.; Kajale, A.; Panda, S.K. Implementation of Smart LED Lighting and Efficient Data Management System for Buildings. Energy Procedia 2017, 143, 173–178. [Google Scholar] [CrossRef]
  68. Kwon, S.Y.; Lim, J.H. Multi-Objective Context-Adaptive Natural Lighting System. Energy Build. 2017, 144, 61–73. [Google Scholar] [CrossRef]
  69. Plischke, H.; Linek, M.; Zauner, J. The Opportunities of Biodynamic Lighting in Homes for the Elderly: Melanopic Measurements and Experiences from Three Senior Citizen Facilities. Curr. Dir. Biomed. Eng. 2018, 4, 123–126. [Google Scholar] [CrossRef]
  70. Ringel, M.; Laidi, R.; Djenouri, D. Multiple Benefits through Smart Home Energy Management Solutions—A Simulation-Based Case Study of a Single-Family-House in Algeria and Germany. Energies 2019, 12, 1537. [Google Scholar] [CrossRef]
  71. Tang, S.; Kalavally, V.; Ng, K.Y.; Parkkinen, J. Development of a Prototype Smart Home Intelligent Lighting Control Architecture Using Sensors Onboard a Mobile Computing System. Energy Build. 2017, 138, 368–376. [Google Scholar] [CrossRef]
  72. Wang, L. Home Intelligent Lighting Control System Based on Wireless Sensor. J. Eng. Des. Technol. 2020, 18, 1231–1240. [Google Scholar] [CrossRef]
  73. Görgülü, S.; Ekren, N. Energy Saving in Lighting System with Fuzzy Logic Controller Which Uses Light-Pipe and Dimmable Ballast. Energy Build. 2013, 61, 172–176. [Google Scholar] [CrossRef]
  74. Guillemin, A.; Morel, N. An Innovative Lighting Controller Integrated in a Self-Adaptive Building Control System. Energy Build. 2001, 33, 477–487. [Google Scholar] [CrossRef]
  75. Chung, T.M.; Burnett, J.; Wu, M.K.T. Office Lighting Retrofit Using Dimmable Electronic Ballasts and Occupancy Controls. HKIE Trans. Hong Kong Inst. Eng. 2001, 8, 8–15. [Google Scholar] [CrossRef]
  76. Galasiu, A.D.; Newsham, G.R.; Suvagau, C.; Sander, D.M. Energy Saving Lighting Control Systems for Open-Plan Offices: A Field Study. LEUKOS-J. Illum. Eng. Soc. N. Am. 2007, 4, 7–29. [Google Scholar] [CrossRef]
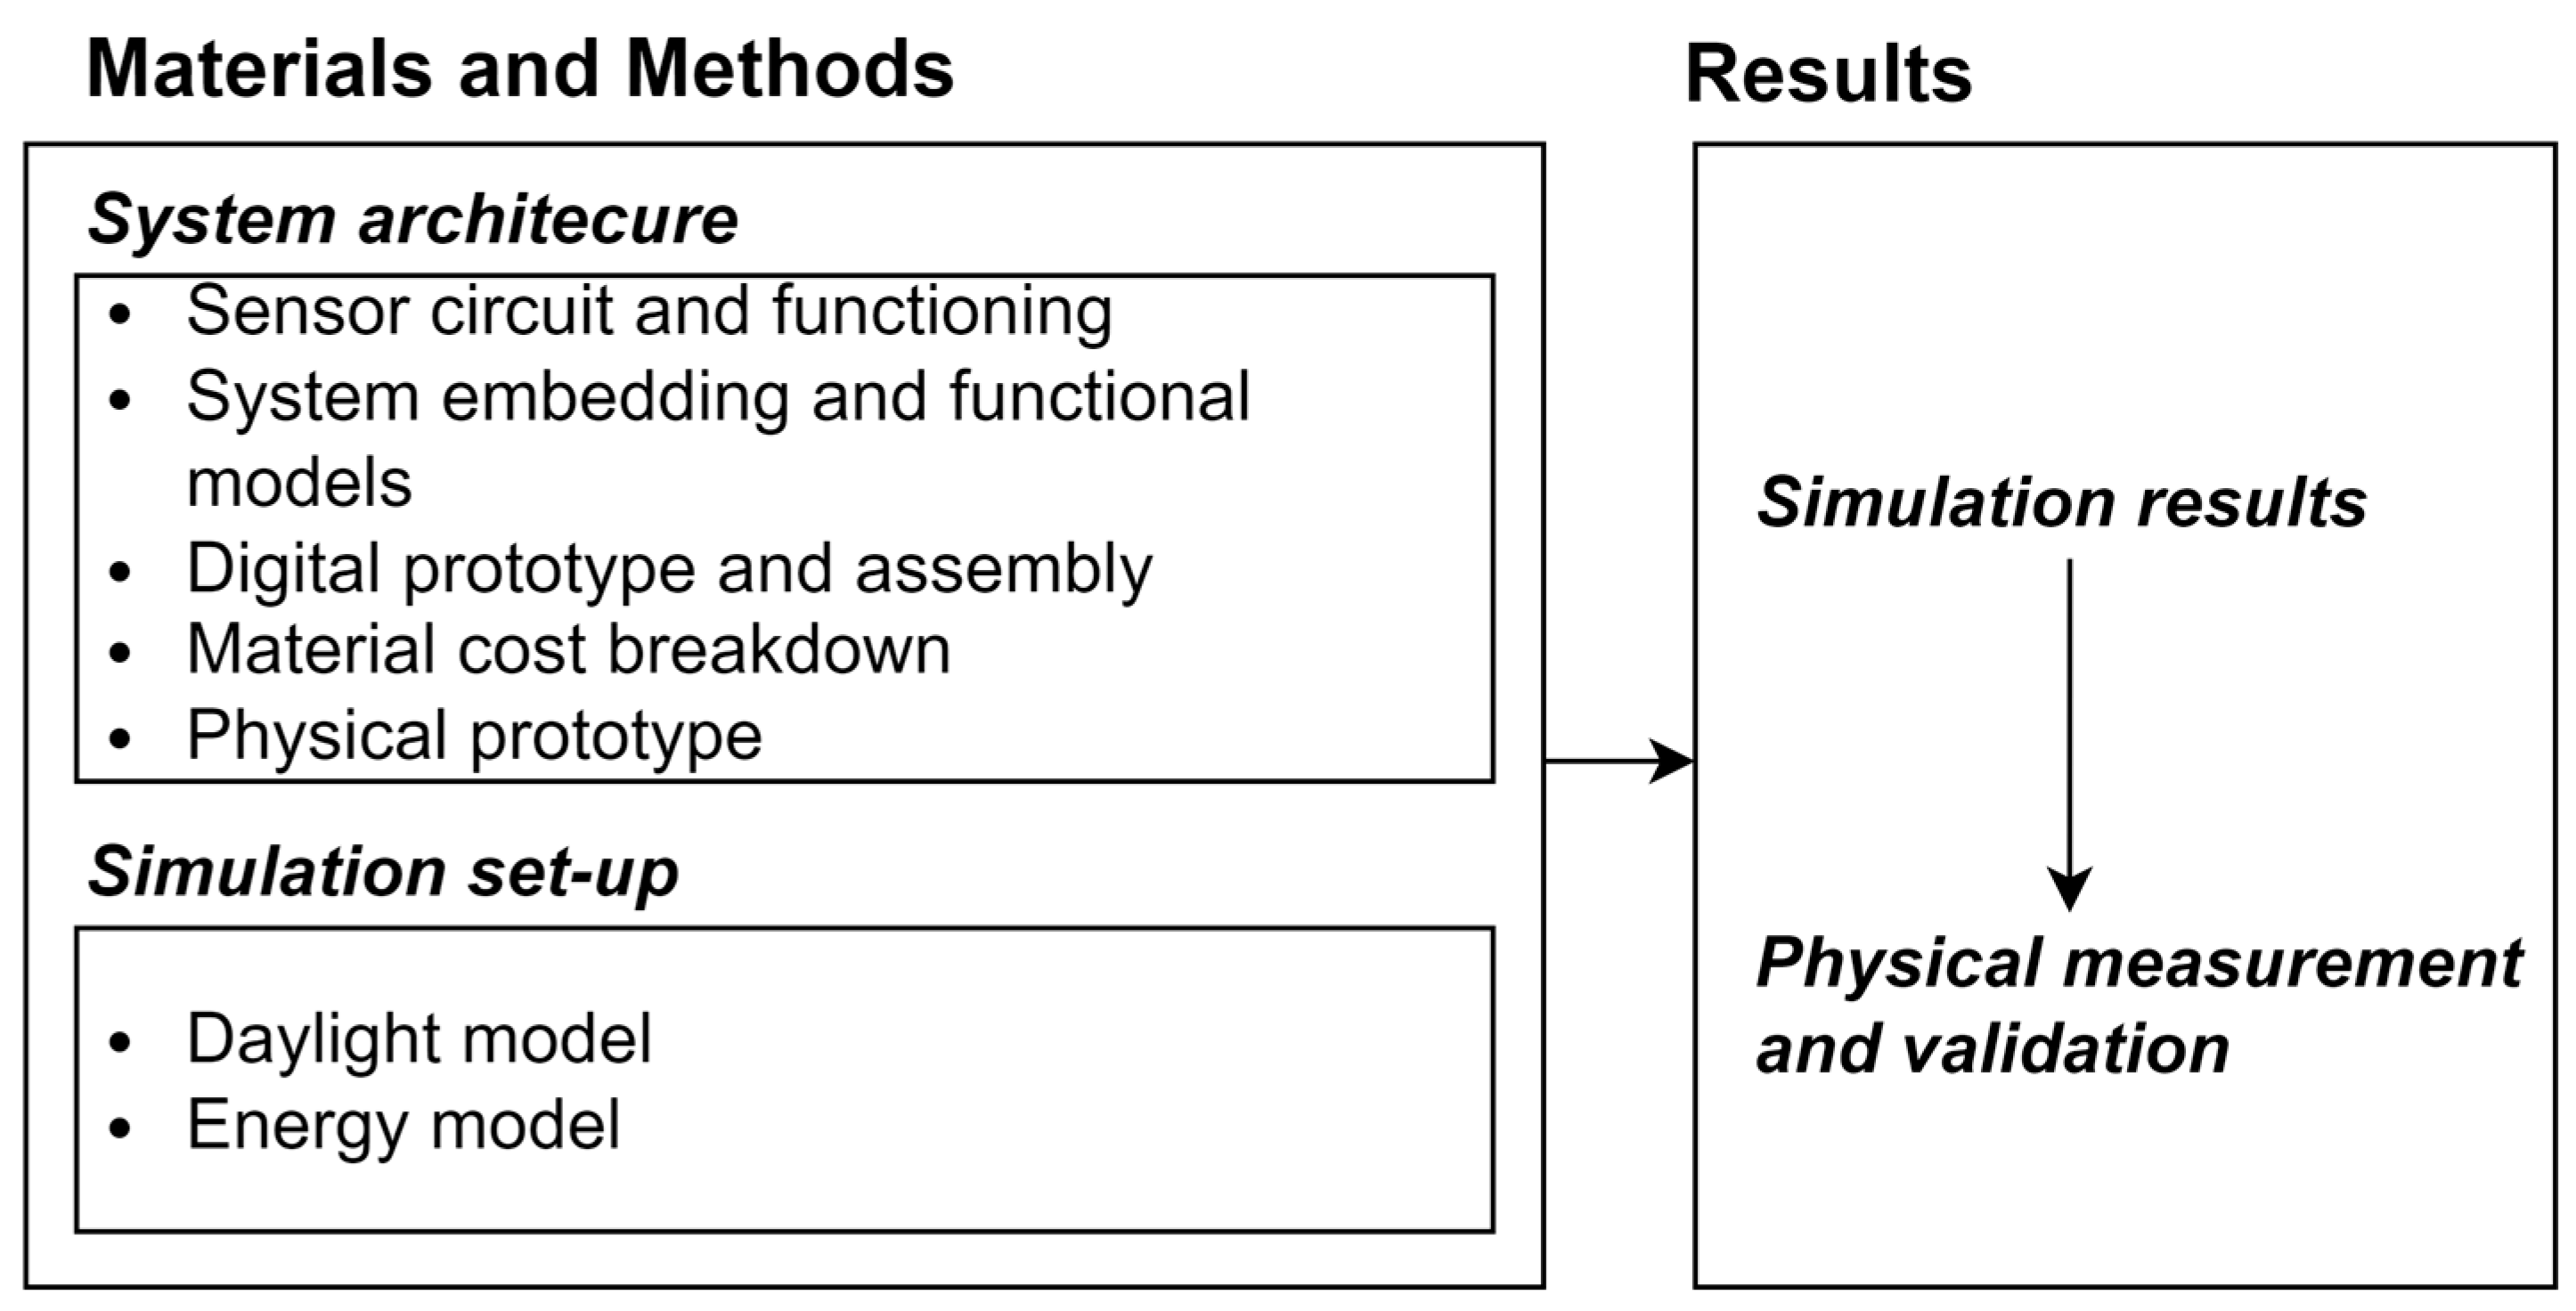
Figure 1. Workflow of the methodological phases followed in the present research.
Buildings 15 03440 g001
Figure 2. Flowchart representing the main steps of the C++ code embedded in the development board. The algorithm allows one to complete a measurement campaign, given the sampling time and the monitoring time provided by the user.
Buildings 15 03440 g002
Figure 3. Idealized models considered for specifying the ideal sensor position (left) and functional models to enhance the reliability of the measurements (right).
Buildings 15 03440 g003
Figure 4. Exploded isometric view of the designed system. (1) Board, illuminance sensor, and SD breakout, (2) base cover, (3) protective transparent panel, (4) base fixings, (5) base plane for sensor positioning, (6) sound, temperature, and AQ, (7) arm cover, and (8) arm fixings.
Buildings 15 03440 g004
Figure 5. Cost breakdown for the different categories considering high quality and base-level sensors. The pie charts show the percentage associated with every category, revealing significant changes in the relative cost of sensing and physical categories.
Buildings 15 03440 g005
Figure 6. (a) Physical prototype photo; (b) main components installed in the base area (center) and on top of the arm (right).
Buildings 15 03440 g006
Figure 7. Three-dimensional and plan view of the selected room (highlighted in red) with dimensions and virtual sensor position.
Buildings 15 03440 g007
Figure 8. Schedules for lighting, occupancy, and appliances for every hour during weekdays. On the weekends and holidays, only the minimum appliance load is considered.
Buildings 15 03440 g008
Figure 9. Thermal comfort tool workflow in Grasshopper and definition of a Python script for database compilation.
Buildings 15 03440 g009
Figure 10. (a) Box plot representing the MRT distribution during the year in the occupied hours (9 am–6 pm weekdays only); (b) MRT distribution recorded by the virtual sensors and grouped by month revealing larger dispersion and higher values in the south-facing windows. The higher interquartile range recorded is highlighted in red.
Buildings 15 03440 g010
Figure 11. MRT discrepancy with the median value at each hour for the sensors with the indication of the maximum value. The graph reveals that significant differences are particularly present in the case of sensor D1 and S3/S2, all in the south part of the room.
Buildings 15 03440 g011
Figure 12. MRT distribution for the six identified critical hours (one per sensor from D1 to L6, as marked in the figure) with the associated discrepancy from the median value. Summer hours show the most pronounced spread around the south windows, whereas interior points tend to remain more grouped. The highest discrepancy recorded is highlighted in red.
Buildings 15 03440 g012
Figure 13. (a) Box plot representing the illuminance distribution during the year in the occupied hours (9 am–6 pm weekdays only); (b) illuminance distribution recorded by the virtual sensors and grouped by month, revealing larger dispersion and higher values in the desk position, possibly due to the double exposure. The higher interquartile range recorded is highlighted in red.
Buildings 15 03440 g013
Figure 14. Climate-based metrics distribution in the studied room. Daylight factors, average illuminance, and daylight glare probabilities are in the upper part. Useful daylight illuminance and spatial daylight availability are in the lower part.
Buildings 15 03440 g014
Figure 15. Illuminance discrepancy with the median value at each hour for the sensors with the indication of the maximum value. The graph reveals that significant differences are particularly present in the case of sensors S3 and S2 in the south part of the room, due to direct light exposure.
Buildings 15 03440 g015
Figure 16. Variables recorded by the desk lamp device during the experiment (temperature, relative humidity, horizontal illuminance, TVOC, eCO2, and air quality index). The red line indicates the hourly average, while the gray lines represent the 15 s interval data recorded.
Buildings 15 03440 g016
Figure 17. Temperature recorded by sensors in the environment and external weather during the experiment, depicting a correlation among the trends of the recorded variables but showing the value differences.
Buildings 15 03440 g017
Table 1. Specifications of the sensors selected for the system circuit.
Buildings 15 03440 i001
Sensor(1) BH1750(2) ENS160(3) Am2302 DHT22(4) SparkFun Sound Detector
Sensor TypePhotodiodeMetal oxideThermistor, capacitiveMicrophone
Variable(s) MeasuredIlluminanceeCO2, TVOC, AQIAir temperature, RHSound level, frequency
Range of Measure0–64 K lux0–65 K ppm−40–80°/0–100%0.05–14 kHz
Resolution1 lx1 ppm0.5 °C0.1 kHz
Response Time [s]0.110.2<0.1
Accuracy±1–5 lx<10%±0.5 °C/±2.5%0.5% of frequency
Voltage [V]3.3–51.7–3.63.3–53.3–5
Dimensions [mm]16 × 30 × 1830 × 30 × 933 × 15.5 × 824 × 46 × 7
ProducerDeboDongkerAosong ElectronicsSparkFun
Cost [EUR]24.40.911.95
Table 2. General functional models for sensor placement in indoor environments.
Sensor TypePreferred PositioningNon-Ideal PositioningSource of Interference
Air temperatureHead, chest, and ankle levelWindows, HVAC ventsHeat sources, direct radiation (e.g., sunlight), and drafts
HumidityCenter of the room or close to the personClose to the breathing zone, close to HVAC ventsWater sources, humans breathing
Air qualityNear the breathing zoneWindows, doors, floor, and HVAC ventsPlaces with irregular pollutant concentration
LightCenter of the work area (photodiode), aligned with one’s view (phonometer)Far from the area or plane of interestLocal obstructions
AcousticNear the hearing zoneClose to acoustic or vibration sources (e.g., PC speakers, floor)Sound sources, vibrations
Table 3. Main thermal properties of the build-up and elements inserted in the model.
LayersU-Value [W/m2 K]Thermal Mass [kJ/(m2 K)]G-Value [-]
External wall1.62180-
Roof (green roof)0.34140-
Roof (no green roof)0.35132-
Windows2.63-0.71
Disclaimer/Publisher’s Note: The statements, opinions and data contained in all publications are solely those of the individual author(s) and contributor(s) and not of MDPI and/or the editor(s). MDPI and/or the editor(s) disclaim responsibility for any injury to people or property resulting from any ideas, methods, instructions or products referred to in the content.