1. Introduction
Nearly zero energy building (nZEB) is Europe’s answer to the challenge of the huge amount of primary energy consumption and greenhouse gas production by buildings. nZEBs are very high-performance buildings that use low or zero energy, mostly from renewable or local sources that are economically feasible [
1]. The European Union (EU) first defined nZEBs in the Energy Performance in Buildings Directive (EPBD) 2010 [
2]. A revision of the EPBD adopted in 2024 changed targets for member states to reach 55% greenhouse gas reduction by 2030 [
3]. However, there are various barriers, including a lack of metrics, low market penetration, and the effective monitoring of nZEBs for Eastern and Southern Europe [
4,
5]. These barriers hinder effective policymaking and design strategies, suggesting that existing frameworks need tailoring to meet these challenges. A systematic utilization of EN/ISO definitions in both technical and policy documents would facilitate the work of design and construction firms, and lead to cost decreases. Therefore, governing bodies must articulate clear and explicit requirements for energy requirements within their national implementation of the nZEBs [
5]. Achieving nZEB status necessitates a re-evaluation of conventional rules of thumb and design assumptions, especially regarding bioclimatic architecture and passive design.
Renovation strategies need to utilize customized metrics that honor the historical and cultural significance of existing structures while improving energy performance [
6]. The EU renovation wave (2020) [
7] aims to improve the energy efficiency of 35 million buildings by 2030, while EPBD (2024) [
3] sets targets and requires member states to develop national building renovation plans to achieve these numbers and gradually guide building owners. However, achieving such numbers in a limited timeframe is not easy. In addition, nZEBs should not only focus on energy efficiency but also health, comfort, and compliance with relevant Indoor Environmental Quality standards. Attia et al. [
5] advise that field measurements and surveys related to fuel poverty should support national adaptive comfort requirements. Moreover, the integration of local renewable energy sources is crucial to reduce greenhouse gas emissions and meet the evolving demands of the built environment. This background makes it necessary to establish climate comparisons, guidelines for passive cooling, efficient active cooling systems, and grid interaction models to prepare for the deep renovation challenge.
Designers have various tools to model, simulate, optimize designs, and implement new technologies. While different building types can implement numerous solutions, utilizing local renewable energy is indispensable in decreasing greenhouse gas emissions. In addition to decreasing energy consumption in buildings, the challenges for the built environment now include buildings generating energy [
8]. For example, for a house that produces more energy than it consumes located in the Mediterranean climate, the most beneficial system in terms of life cycle costs is renewable energy using photovoltaic (PV) panels [
9]. The EU furthers this concept by researching positive energy districts in the Horizon 2020 programme as “an area within the city boundaries capable of generating more energy than consumed and agile/flexible enough to respond to the variation of the energy market” [
10]. For example, Sertsöz [
10] proposed a positive energy district that adopts renewable energy from a mixture of solar, hydrogen, and regenerative braking energy from the trams [
10]. A comprehensive consideration of long-term energy planning and techno-economic aspects led to the recommendation of opting for an optimization model for energy-saving measures to decrease heating demand while expanding district heating [
11]. This aligns with the necessity to predict the amount of renewable energy requirements necessary for techno-economic feasibility in the long term; however, the effect of climate change is another research gap in adding renewable energy into nZEBs.
Climate change hugely impacts temperatures and weather in a region; therefore, many researchers focus on its effects on the built environment in short and long timeframes. For energy consumption, this usually is significant in increasing cooling energy and decreasing heating energy requirements. Considering the various studies for 2050 reveal the results below. For the temperate climate, hotter temperatures will increase cooling demand by nearly half and the milder winters could decrease nearly all heating demand and have around a one-fifth increase in total energy consumption and higher peak loads [
12]. In contrast, in hot summer climates, while there are various opportunities to renovate rural dwellings and make them nZEB, climate scenarios such as RCP 8.5 cause substantial difficulty and many building types cannot meet nZEB requirements without considerably increasing renewable energy installation [
13]. Conversely, in the colder climates, adaptation policies require huge changes in the infrastructure [
14]. This is because of a huge increase in cooling demands and a slight decrease in heating demands.
Future climate change scenarios have increasing impacts on user behavior on energy demands. These impacts are significant yet often underestimated [
15]. To address this, simulation-based studies are frequently used for preliminary design, final design, and future forecasting. Many studies investigate accurate occupancy and behavior models to forecast future residential energy demands [
16,
17,
18]. In this context, data-driven approaches and region-specific models are important to optimize energy consumption. Building on this, a comparison of deterministic, stochastic, and energy-data-driven occupancy models for district energy system design showed that better accuracy is achieved when energy data are available [
19]. Furthermore, realistic occupancy programs derived from the time use surveys would provide more accurate assessments of future residential energy demands [
20]. While various studies discuss the most accurate model, a higher resolution of occupancy data does not always increase the accuracy of a building simulation [
21,
22,
23]. Hence, it is necessary to use occupancy programs with appropriate resolutions for different simulation needs. Meanwhile, the number of occupants is a significant parameter in the energy performance of the building [
24]. While there are many available tools, there is too much detail to model the interaction of everything at the same time, and an experienced researcher “chooses the right questions to ask and sets up an appropriate level of detail to answer them” [
25]. In line with this, less detailed occupancy scenarios can still lead to effective design solutions for low-energy buildings and nZEBs [
26]. This is especially true for simulations oriented towards large scales or policy decisions.
Global challenges, such as climate change, require local responses. Turkey’s climates show variety since it is a large peninsula with changing topography, proximity to the sea, and altitudes. Turkey has three main regulations regarding the energy calculation of buildings. First is the Thermal Insulation Rules for Buildings (TS 825) [
27]. This regulation defines climatic regions in Turkey [
27] according to cooling degree days since 1998. It mainly assesses building envelopes in terms of U value and condensation risk. Second is the Building Energy Performance Regulation in 2008, last updated in 2022 [
28], established as the national calculation methodology for compliance with EPBD. It determines building performance levels from A to F and requires the results of the BEP-Tr software v.2. The third regulation “TS-2165” [
29] deals with the heating and cooling equipment and is not used in the scope of this study since this study only deals with heating and cooling loads and does not define any equipment. The Housing Development Administration (TOKI) was established by the state to meet the housing needs, develop typical projects, and implement typical projects all over the country. Their typical projects are used in all the climatic regions regardless of occupancy scenarios.
There is an urgent need for innovative concepts against the impacts of climate change that make the challenges posed by climate change into positive opportunities. This paper aims to research and form a basis for future studies to build upon regarding the additional renewable energy requirements for existing buildings under future climate change. The objectives are the investigation of the changing energy requirements in different regional climates, the required additional renewable energy, and changing of the number of occupants. By utilizing TRNSYS Type 55 building energy simulation, the research highlights the impact of climate change and occupancy variations on energy demand, independent of HVAC system performance. The findings underscore the necessity for innovative concepts to address the challenges posed by climate change, transforming them into positive opportunities. Furthermore, the integration of required renewable energy and occupancy size with climate change scenarios fills a significant gap in the existing research.
The results obtained can be generalized, as the changes in climate patterns are likely to be applicable to other similar climatic regions, including Mediterranean, temperate, and continental climates. In addition, this analysis is conducted independently of HVAC system performance, focusing solely on the thermal loads of the buildings. This approach ensures that the results reflect the impact of climate change and occupancy variations on energy demand without the influence of specific system efficiency variations. The study utilizes occupancy size since lifestyle changes until 2050 have many uncertainties on occupant behaviors. Therefore, it does not incorporate dynamic occupancy scenarios, HVAC system degradation over time, or the effects of advanced adaptive control technologies. However, the results obtained provide a basis for the integration of various systems, such as renewable energy and thermal energy storage, and serve as a reference for future studies. Overall, this work lays the groundwork for investigation into the additional renewable energy requirements for existing buildings as 2050 approaches, in alignment with the IPCC scenarios of 2.6, 4.5, and 8.5. The following section provides a broader view of the methods and processes utilized in the study, including an analysis of weather data, while the case study section details a TOKI apartment scheme, current and projected climatic conditions, and details the simulation. After looking at the objective results, the discussion examines their place in the literature based on the goals of this work and ends with concluding remarks.
2. Materials and Methods
The simulation-based approach adopted in this study, integrating TRNSYS v18, SketchUp Pro 2022, and Power BI, has been validated and widely applied in previous research due to its accuracy, robustness, and flexibility for addressing complex climate-building interactions [
30]. Alternative approaches, such as simplified steady-state methods (e.g., monthly average models), lack the temporal resolution required to assess hourly occupancy scenarios and dynamic thermal responses [
31]. Other dynamic simulation tools (e.g., EnergyPlus, DesignBuilder) offer comparable results; however, TRNSYS was specifically selected for its advanced capabilities in multizone modeling, detailed thermostat controls, and extensive built-in component libraries, particularly suited for evaluating renewable energy integration [
32]. Additionally, TRNSYS provides strong compatibility with MATLAB, facilitating future work focused on advanced optimization, control strategies, or sensitivity analysis at the system level. Future research would particularly benefit from validated system-side integration between TRNSYS simulations and MATLAB-based optimization or control approaches. While machine learning-based models provide promising predictive capabilities, their applicability depends heavily on large, historical datasets, limiting their usefulness for novel climate projections without extensive historical data [
33]. Consequently, the chosen TRNSYS-based integrated approach balances precision, flexibility, and feasibility, making it well-suited to address this study’s research objectives and context.
This simulation-based approach was designed to evaluate the impact of future climate change projections and varying occupancy size on heating and cooling energy demand across five distinct climatic regions in Turkey. The methodology, represented in
Figure 1, integrates building energy modeling and climate data processing using TRNSYS 18, Sketchup, and Meteonorm. Additionally, uncertainty analysis was conducted using multiple weather model variants (Clear Sky Model, Meteonorm Default, Diffuse Radiation Model, Temperature Model, and Tilt Radiation Model), and results were visualized in Power BI using box-and-whisker plots to capture the variability in heating and cooling energy demand across weather scenarios.
Historical and projected weather files were generated using Meteonorm 8.1 for climate data. A total of 20 climate datasets (5 cities × 4 periods) were created, covering current Typical Meteorological Year (TMY-2) conditions and future projections under RCP 2.6, 4.5, and 8.5 scenarios. The temporal resolution of the simulation is hourly for the duration of one typical year. The selection of the five cities representing Turkey’s five climatic regions has wide-ranging reasons. Istanbul and Ankara are the biggest cities in Turkey and attract a lot of attention in the literature because of their high population. These cities reveal not only climatic diversity, but also economic and cultural diversity. Antalya is on the Southern coast of Turkey. Its hot summers and mild winters reflect the Mediterranean climate. Erzurum, in the Eastern Anatolia Region, shows the effects of the continental climate characterized by harsh cold temperatures in winter and moderate temperatures in summer. Hakkari attracts attention with its geographical location at the Southeastern tip of Turkey with mountainous terrain and local climate dynamics. Hakkari reveals Turkey’s climate diversity with its climatic differences in both winter and summer seasons.
The need to accurately predict future data is prominent as the climate continues to change. While different methods of generating future weather data affects building energy demands, the effects are considerably less for annual evaluations as utilized in this paper [
34]. The tool Meteonorm, utilized in this paper for current and future climate data generation, is widely used in generating weather data for predicting building energy consumption and renewable energy system performance. It can generate hourly weather data using an inherent database of previous years combining re-analysis and satellite data [
35]. It can utilize user-supplied data to generate synthetic weather files, while the generation of data from more current sources is more reliable [
36]. Meteoneorm-generated data have small deviations in absolute humidity but closely mimic distribution characteristics for air temperatures and solar radiation [
37]. While some studies argue that Meteonorm lacks local climatic phenomena, such as urban heat island effect [
38], the latest version (8.1) incorporates this effect.
The weather file changes according to model assumptions and utilized weather models; therefore, these effects were investigated through the uncertainty analysis below for five different models. Annual heating and cooling loads across 300 simulations were visualized using box-and-whisker plots in Power BI, which automatically calculates key uncertainty metrics such as quartiles, median, and outliers. This allowed a clear representation of variability across climate scenarios, occupancy sizes, and cities.
Figure 2 presents an uncertainty analysis of ambient temperature changes in Antalya and Erzurum under current and different future climate change scenarios and weather data models. The box-and-whisker plots in
Figure 2 compare five weather models (Clear Sky Model (CSM), Diffuse Radiation Model (DRM), Meteonorm Default (MND), Temperature Model (TM), Tilt Radiation Model (TRM)) under four scenarios (Current, RCP 2.6, RCP 4.5, RCP 8.5), illustrating the influence of different modeling approaches on temperature projections. In both cities, median temperatures increase with higher RCPs, with Antalya facing more extreme heat events and Erzurum experiencing a reduction in severe cold conditions. While all models follow a similar warming trend, notable differences arise in extreme temperature projections. CSM tends to underestimate temperature changes by ignoring atmospheric effects, while the DRM and TRM have higher uncertainties due to their sensitivity to radiation parameterization. TM is effective in capturing direct temperature fluctuations but lacks detailed atmospheric corrections. The MND model is regarded as the optimal approach due to its balanced representation of atmospheric conditions and its integration of historical and satellite-based data, ensuring a more reliable and consistent prediction framework. These findings emphasize the importance of regional adaptation strategies and the careful selection of weather models to improve the accuracy of climate impact assessments.
TRNSYS software is widely recognized and has been validated in the literature through various benchmarking and validation studies. Although direct empirical validation of the model was not possible due to the unavailability of measured data for the studied buildings, TRNSYS has undergone rigorous validation procedures, including ANSI/ASHRAE Standard 140, BESTEST, and other international benchmarks, demonstrating strong reliability for simulating building energy demands under diverse climatic conditions. Instead, the model inputs, including building envelope properties, occupancy sizes, and thermostat settings, were accurately based on Turkey’s national standards.
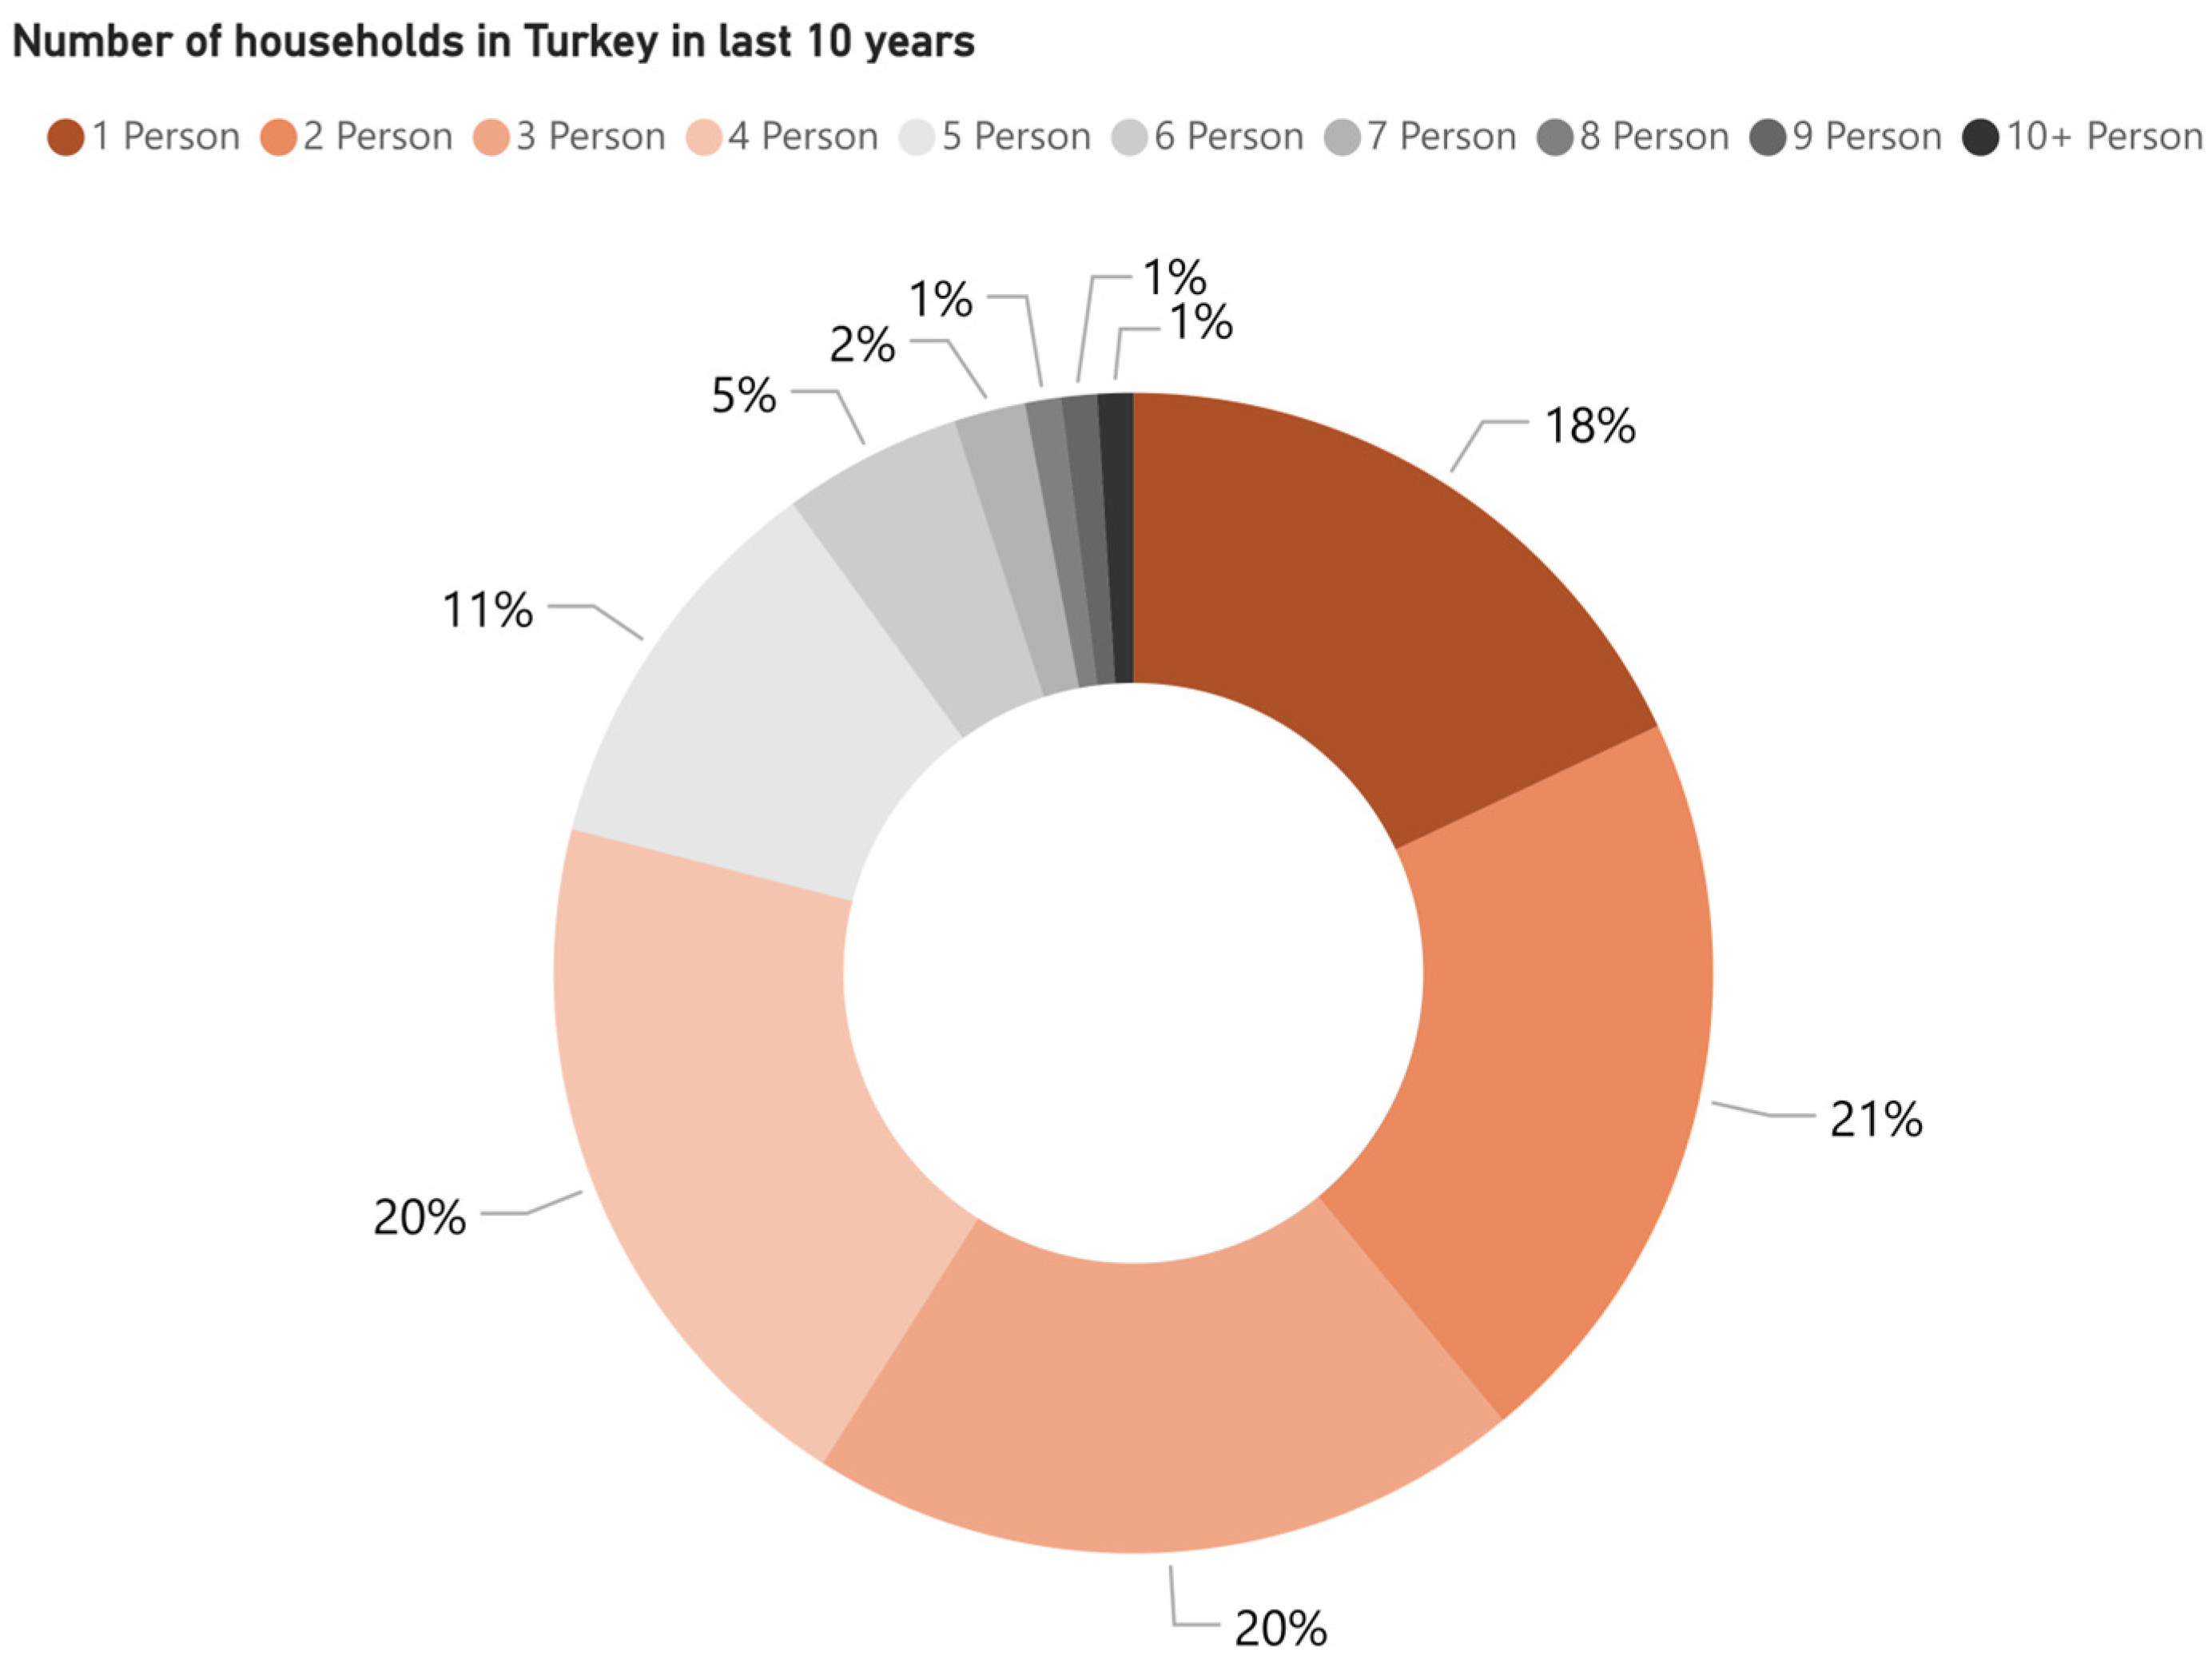
The simulation phase in TRNSYS 18 involves defining zone-specific occupancy schedules, heating and cooling set points, and three distinct occupancy scenarios: (1) Scenario I: Single/Couple Occupant(s). (2) Scenario II: Family with one kid. (3) Scenario III: Family with two kids. When occupancy is active, heating and cooling loads are dynamically adjusted to prevent indoor temperatures from dropping below 24 °C or exceeding 26 °C. Scenarios in the study aim to increase the impact of the study by selecting user groups representing 79% of the number of households in Turkey. The number of households by household size is reported annually by the Turkish Statistical Institute (TUIK), in which the household size is defined as the number of people in a household. According to TUIK data, the percentage distribution of the average number of households by household size in Turkey between 2015 and 2024 is shown in
Figure 3 (figure generated according to data from ref. [
39]). The scatter plot shows the data from the last ten years considering the number of households ranging from 1-person households to households with 10 or more people. The proportion of 1-person households, 2-person households, 3-person households, and 4-person households in the general distribution over the last 10 years was 18%, 21%, 20%, and 20%. Consequently, the user groups considered in the study include one, two, three, and four-person households, totaling 79% of the country’s population.
Although various standards for occupancy schedules have been developed and defined in the world, a standard for occupancy schedules has not yet been developed in Turkey. Therefore, this study uses zone occupancy definitions adapted from ASHRAE 90.1. ASHRAE 90.1 building energy efficiency standard was first published by the United States of America (USA) in 1975 and has been continuously updated and implemented to date. It provides certain definitions for zone occupancy and the most recent version of ASHRAE 90.1 is the 2022 version [
40]. Although parameters, such as heating, cooling, and lighting, are defined as occupancy schedules in ASHRAE 90.1, it does not consider the user behavior changes on occupancy schedules and presents static data. A detailed investigation of the effect of different occupancy schedules adapted to user behavior changes on energy consumption is available by He et al. [
18]. However, this study does not consider changing occupancy patterns as a result of climate change since they are too uncertain. Thus, the analyses in this paper use occupancy schedules adapted for Turkey within the framework of ASHRAE 90.1.
The schedules are defined in each scenario based on the expected occupancy patterns, considering variations in daily routines, presence in different zones, and corresponding heating and cooling demands. These schedules ensure that energy consumption aligns with real-life occupant behavior and comfort needs. For instance, in Scenario I (Single/Couple), the living room is occupied from 17:00 to 24:00, during which the thermostat system maintains temperatures within the comfort range (24–26 °C), optimizing thermal comfort and energy efficiency. This ensures that energy demand reflects realistic occupant behavior and dynamic system responses.
Simulation results from TRNSYS were exported as .CSV files and processed using Power BI. During preprocessing, data were cleaned by verifying integrity, filtering irrelevant outputs, and structuring datasets clearly into categories based on climatic regions, occupancy scenarios, and climate projections. Annual heating and cooling energy loads were calculated explicitly for comparative analysis across scenarios. Additionally, input parameters (occupancy schedules, weather data, thermostat settings) underwent detailed checks and adjustments to confirm simulation accuracy. Power BI’s interactive visualizations facilitated clear graphical comparisons, enabling an effective assessment of occupancy size and climate scenario impacts on building energy demands. Finally, the results are visualized in Power BI, illustrating energy load trends under different climate projections and occupancy scenarios for a comparative assessment across five climatic regions in Turkey. This structured methodology enables a comprehensive evaluation of future climate impacts on building energy performance while considering realistic occupancy size and comfort-driven energy demand variations.
3. Case Study
The Turkish Housing Development Administration of Turkey (TOKI) is the responsible authority for improving housing quality for low or middle-income people with social housing projects they provide. This study assesses a TOKI project designed with the same type and characteristics and implemented in different climatic regions of Turkey in the early 2000s as a case study [
41]. The multistorey apartment building has four independent units on each floor. Each unit construction is of equivalent quality and measures 101.43 m
2 excluding balconies. The independent unit on the southwest facade of the third floor is the case in this study. The location on the southwest facade is where the cooling energy demand is expected to increase the most due to radiation. Hence, the orientation may aid to better show the extreme effects of the expected increase in air temperatures in the future climate projections. Although the TOKI buildings are designed and produced in a similar typology, they are designed with differing numbers of floors according to necessities. There are a larger number of independent units of similar quality on a middle floor than the number of units on the top or ground floor. The case selection reflects the desire to increase the impact of the results while decreasing the calculation load of the simulation. The apartment unit consists of three bedrooms, one living room, two bathrooms, one WC, and one kitchen.
TRNBuild Model of the case study is given in
Figure 4. The geometry initially created in SketchUp was exported through the TRNSYS3D plugin in .IDF file for TRNBuild compatibility. Thermal zones and surface adjacencies were explicitly defined in SketchUp. After importing into TRNBuild (TRNSYS’s thermal simulation environment), geometry accuracy, thermal zones, and surface boundary definitions (outdoor or identical surfaces) were verified and adjusted as needed to ensure simulation precision. Subsequently, the .IDF geometry file was successfully imported into TRNBuild to define a multizone Type-56 model.
Materials suitable for the five climatic regions are used in the building envelope in contact with air in accordance with TS 825, which is the law developed for the energy performance of buildings in Turkey. The limit U-values for five different climatic regions in Turkey according to TS 825 are shown in
Table 1 [
27]. The selected materials and U-values for Istanbul, Ankara, Antalya, Hakkari, and Erzurum in different climatic regions are present in
Table 2. Therefore, the thickness of the EPS insulation on the walls changes to 0.04 m, 0.045 m, 0.055 m, 0.075 m, and 0.08 m for Antalya, Istanbul, Ankara, Hakkari, and Erzurum, respectively. The thermal conductivity values after thermal insulation do not exceed the limit U-values specified in TS 825. Double-glazed, air-filled windows with a thermal conductivity of 1.69 W/m
2K were used in all cities.
The simulations were conducted via TRNSYS. TRNSYS v18 is a dynamic simulation software developed by a team of academics at the University of Wisconsin, USA, incorporating a wide range of mathematical models, such as the thermal modeling of buildings, heating/cooling, and renewable energy systems [
42]. In addition to the library of models for many systems and components within the TRNSYS program, it also consists of several sub-programs, such as TRNBuild, which is used in building thermal modeling, and TRNOpt/GenOpt, which is used in optimization studies. In this study, a thermal model of the building modeled in SketchUp was imported through TRNBuild. The walls, floors, and ceilings building were defined as “identical” whereas the walls in contact with the outside were defined as “outdoors” in Sketchup. The obtained model and climate data were transferred to TRNSYS.
The simulation was created with the appropriate components from the existing TRNSYS library (
Figure 5). TRNSYS simulation for determining the heating and cooling energy demands of the considered building for the selected climatic regions consists mainly of five sub-groups, presented in
Figure 5. These sub-groups are, respectively, sub-groups and weather inputs, scheduling, zone set temperature, TOKI apartment model, and outputs. In the settings and weather inputs section, the component named Simulation Settings defines the information and data required for defining the weather data related to the climatic region of the building model, such as hemisphere, angle of the building to the north, and maximum and minimum air temperature values. In addition, information such as azimuth and zenith angles are calculated through the Radiation Unit Converter to make calculations related to radiation depending on the angles of the exterior walls of the building with respect to sunlight. Simulation Settings and Radiation Unit Converter components were implemented in TRNSYS using the Equa module. In line with these calculator components, information, such as solar radiation, outdoor temperature, and wind speed, are defined by the Weather Data component, and outdoor ground temperature is defined by the Soil Temperature component. From the TRNSYS model library, Type 15-6 was used for the Weather Data component in accordance with reading the TMY-2 climate data file. Type 77 was used for the Soil Temperature component.
Three different occupant types are identified to determine the effect of different occupancy scenarios on the energy demand in the same building. These are a single person, two adults and one child, and two adults and two children. The schedules in
Table 3 assume that occupants use certain parts of the building at certain time intervals. In the Scheduling sub-group of the TRNSYS simulation, the scenarios considered and the occupancy definitions depending on these scenarios are defined for each zone.
Table 3 presents occupancy status is for the living room, kitchen, bedroom I, bedroom II, and bedroom III depending on the scenarios. In line with the scenarios, heating/cooling control signals are generated for the set temperatures of the relevant zones by making definitions with the components in the Scheduling section of
Figure 5.
The components in the Zone Set Temperature section after the Scheduling section, the temperature range where heating and cooling are applied for each zone depending on the occupancy status. The lower and upper temperatures for heating and cooling for each zone are 26 °C and 24 °C, respectively. When occupancy is active, heating and cooling loads are determined to prevent the indoor temperature from falling below 24 °C and rising above 26 °C. Occupancy scenarios 1, 2, and 3 similarly assume that the living room, bedroom I, and kitchen are active during certain time intervals. The living room is in use from 17:00 to 24:00, bedroom I from 22:00 to 08:00, and the kitchen from 07:00 to 09:00 and 17:00 to 21:00. In Scenario 2, representing a family with one child, an additional bedroom was included for active use from 22:00 to 08:00. In scenario 3, representing a family with two children, three bedrooms were in active use during the same time periods (22:00–08:00).
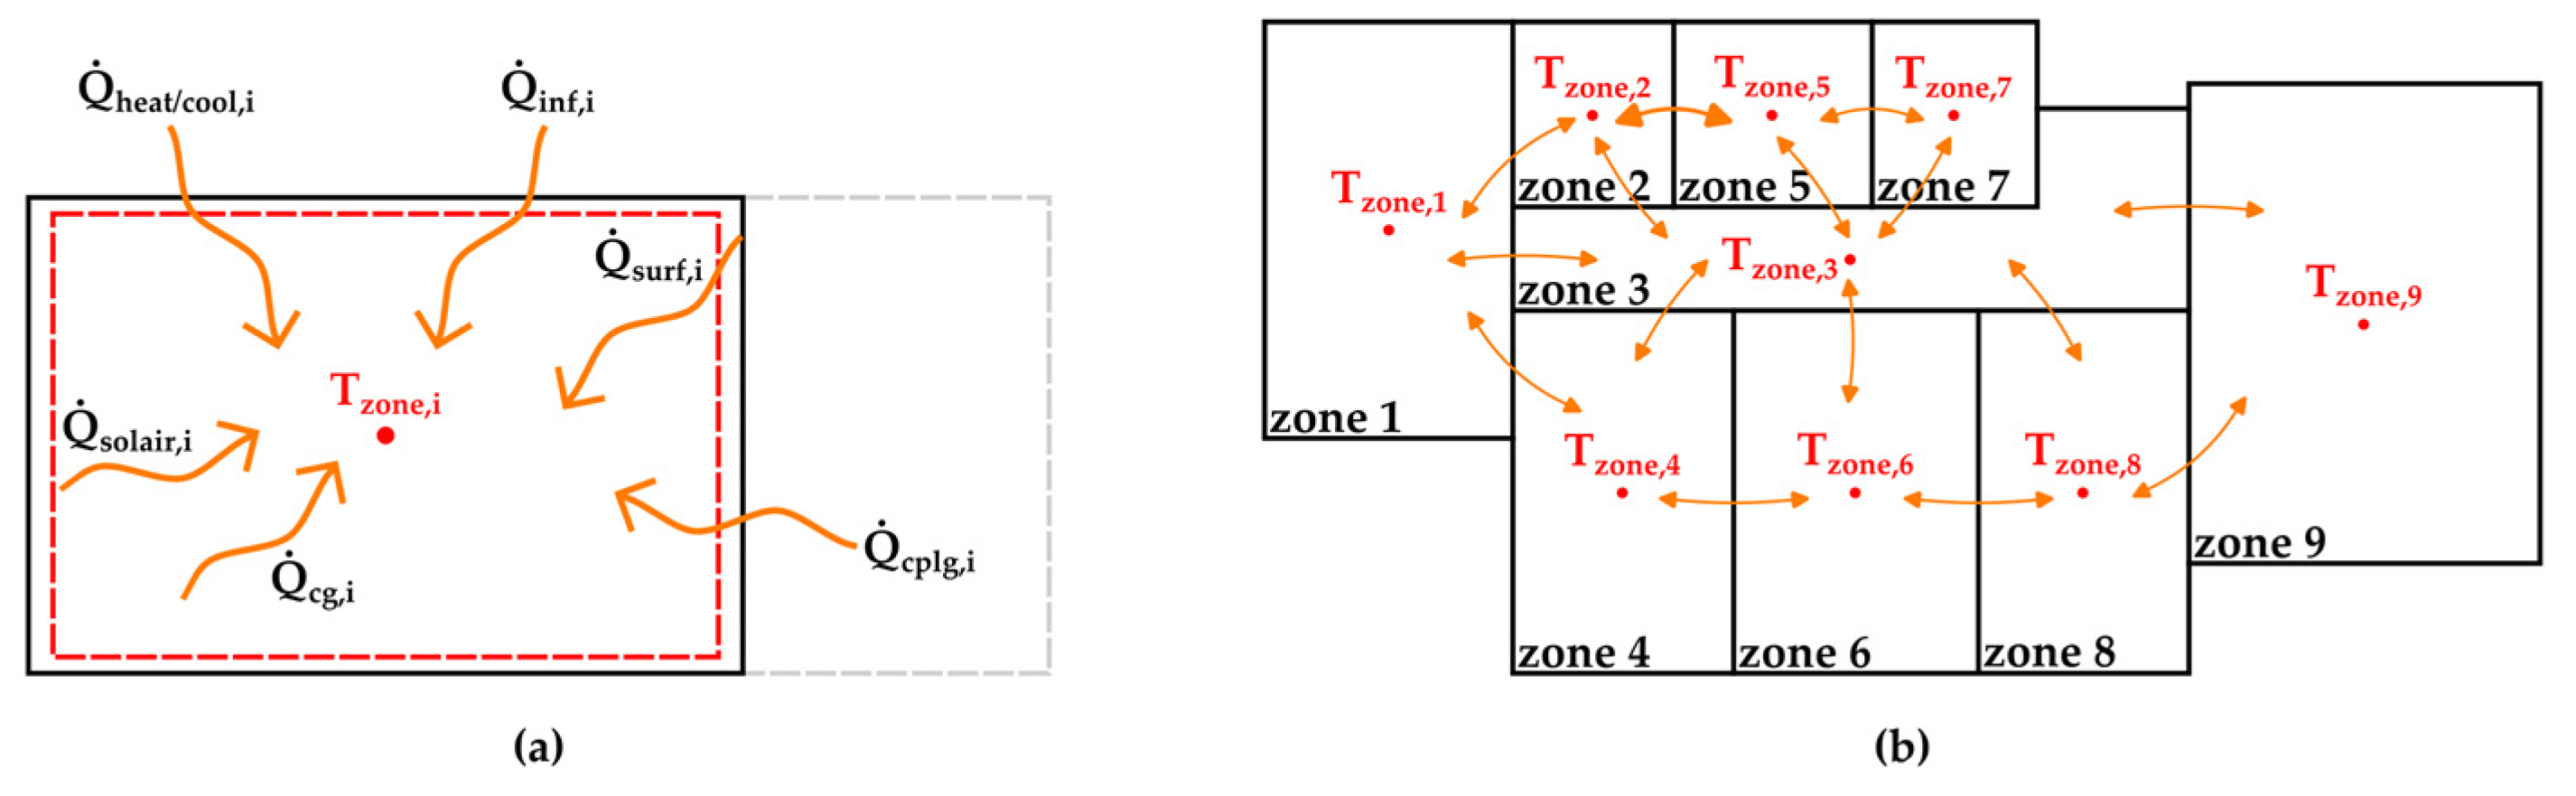
Simulation Settings and Weather Data, Scheduling, and Zone Set Temperature sub-groups provide all the necessary inputs for determining the heating and cooling loads of the TOKI apartment model. The thermal model of the TOKI apartment created using TRNBuild was implemented in the simulation with the Type 56 model used for multizone models from the TRNSYS model library. In Type 56-Multizone Building model, the energy balance approach is used for each sub-zone.
Figure 6 shows the energy balance terms for one zone of the apartment and the schematic representation of the heat transfer between each sub-zone.
The energy balance equation for each zone of the TOKI apartment is presented in Equation (1) [
22]. The terms in
Figure 6a and Equation (1) are calculated to achieve energy balance at each time step of the simulation. The left-hand side of Equation (1) represents the energy exchange term for each zone in each time step. On the right-hand side,
is the convective gain from surfaces,
is the infiltration gains,
is the heating or cooling power,
is the internal convective gains (by people, equipment etc.),
is the fraction of solar radiation from exterior windows entering an air node that is transferred directly to the indoor air as convective gain, and
is the gains due to (connective) airflow from neighbor air nodes or boundary condition.
In the energy balance equation, the value of is determined so that the indoor temperature zone set temperature is provided in the occupancy active process. Thus, total heating and cooling loads can be calculated according to the defined climatic zone and scenarios.
Through the Outputs sub-group of TRNSYS simulation, outputs, such as ambient temperature, solar radiation, zone indoor temperatures, instantaneous and total heating, and cooling loads are monitored and printed throughout the simulation. Type 65d from the TRNSYS model library was used to monitor the solar radiation, the ambient temperature, the indoor temperatures, and instantaneous heating and cooling loads of each zone to check the progress of the simulation.
To determine the total heating and cooling loads for each zone and for all zones, the heating and cooling power over the whole simulation period is obtained by integrating the heating and cooling power over time using Type-55. The Unit Converter component was defined using Equa module for the required unit conversions and load per unit area calculation using the floor areas of each zone. Finally, the total heating and cooling loads, instantaneous heating and cooling loads, and total heating and cooling loads per unit area for each zone and all zones were printed by Type 25c.
4. Results
This study analyzes the heating and cooling energy consumption of a typical TOKI building in five different climatic regions of Turkey under current and future climatic conditions for different user types. The results discern the effect of different user size on energy consumption and energy demand in the future projection.
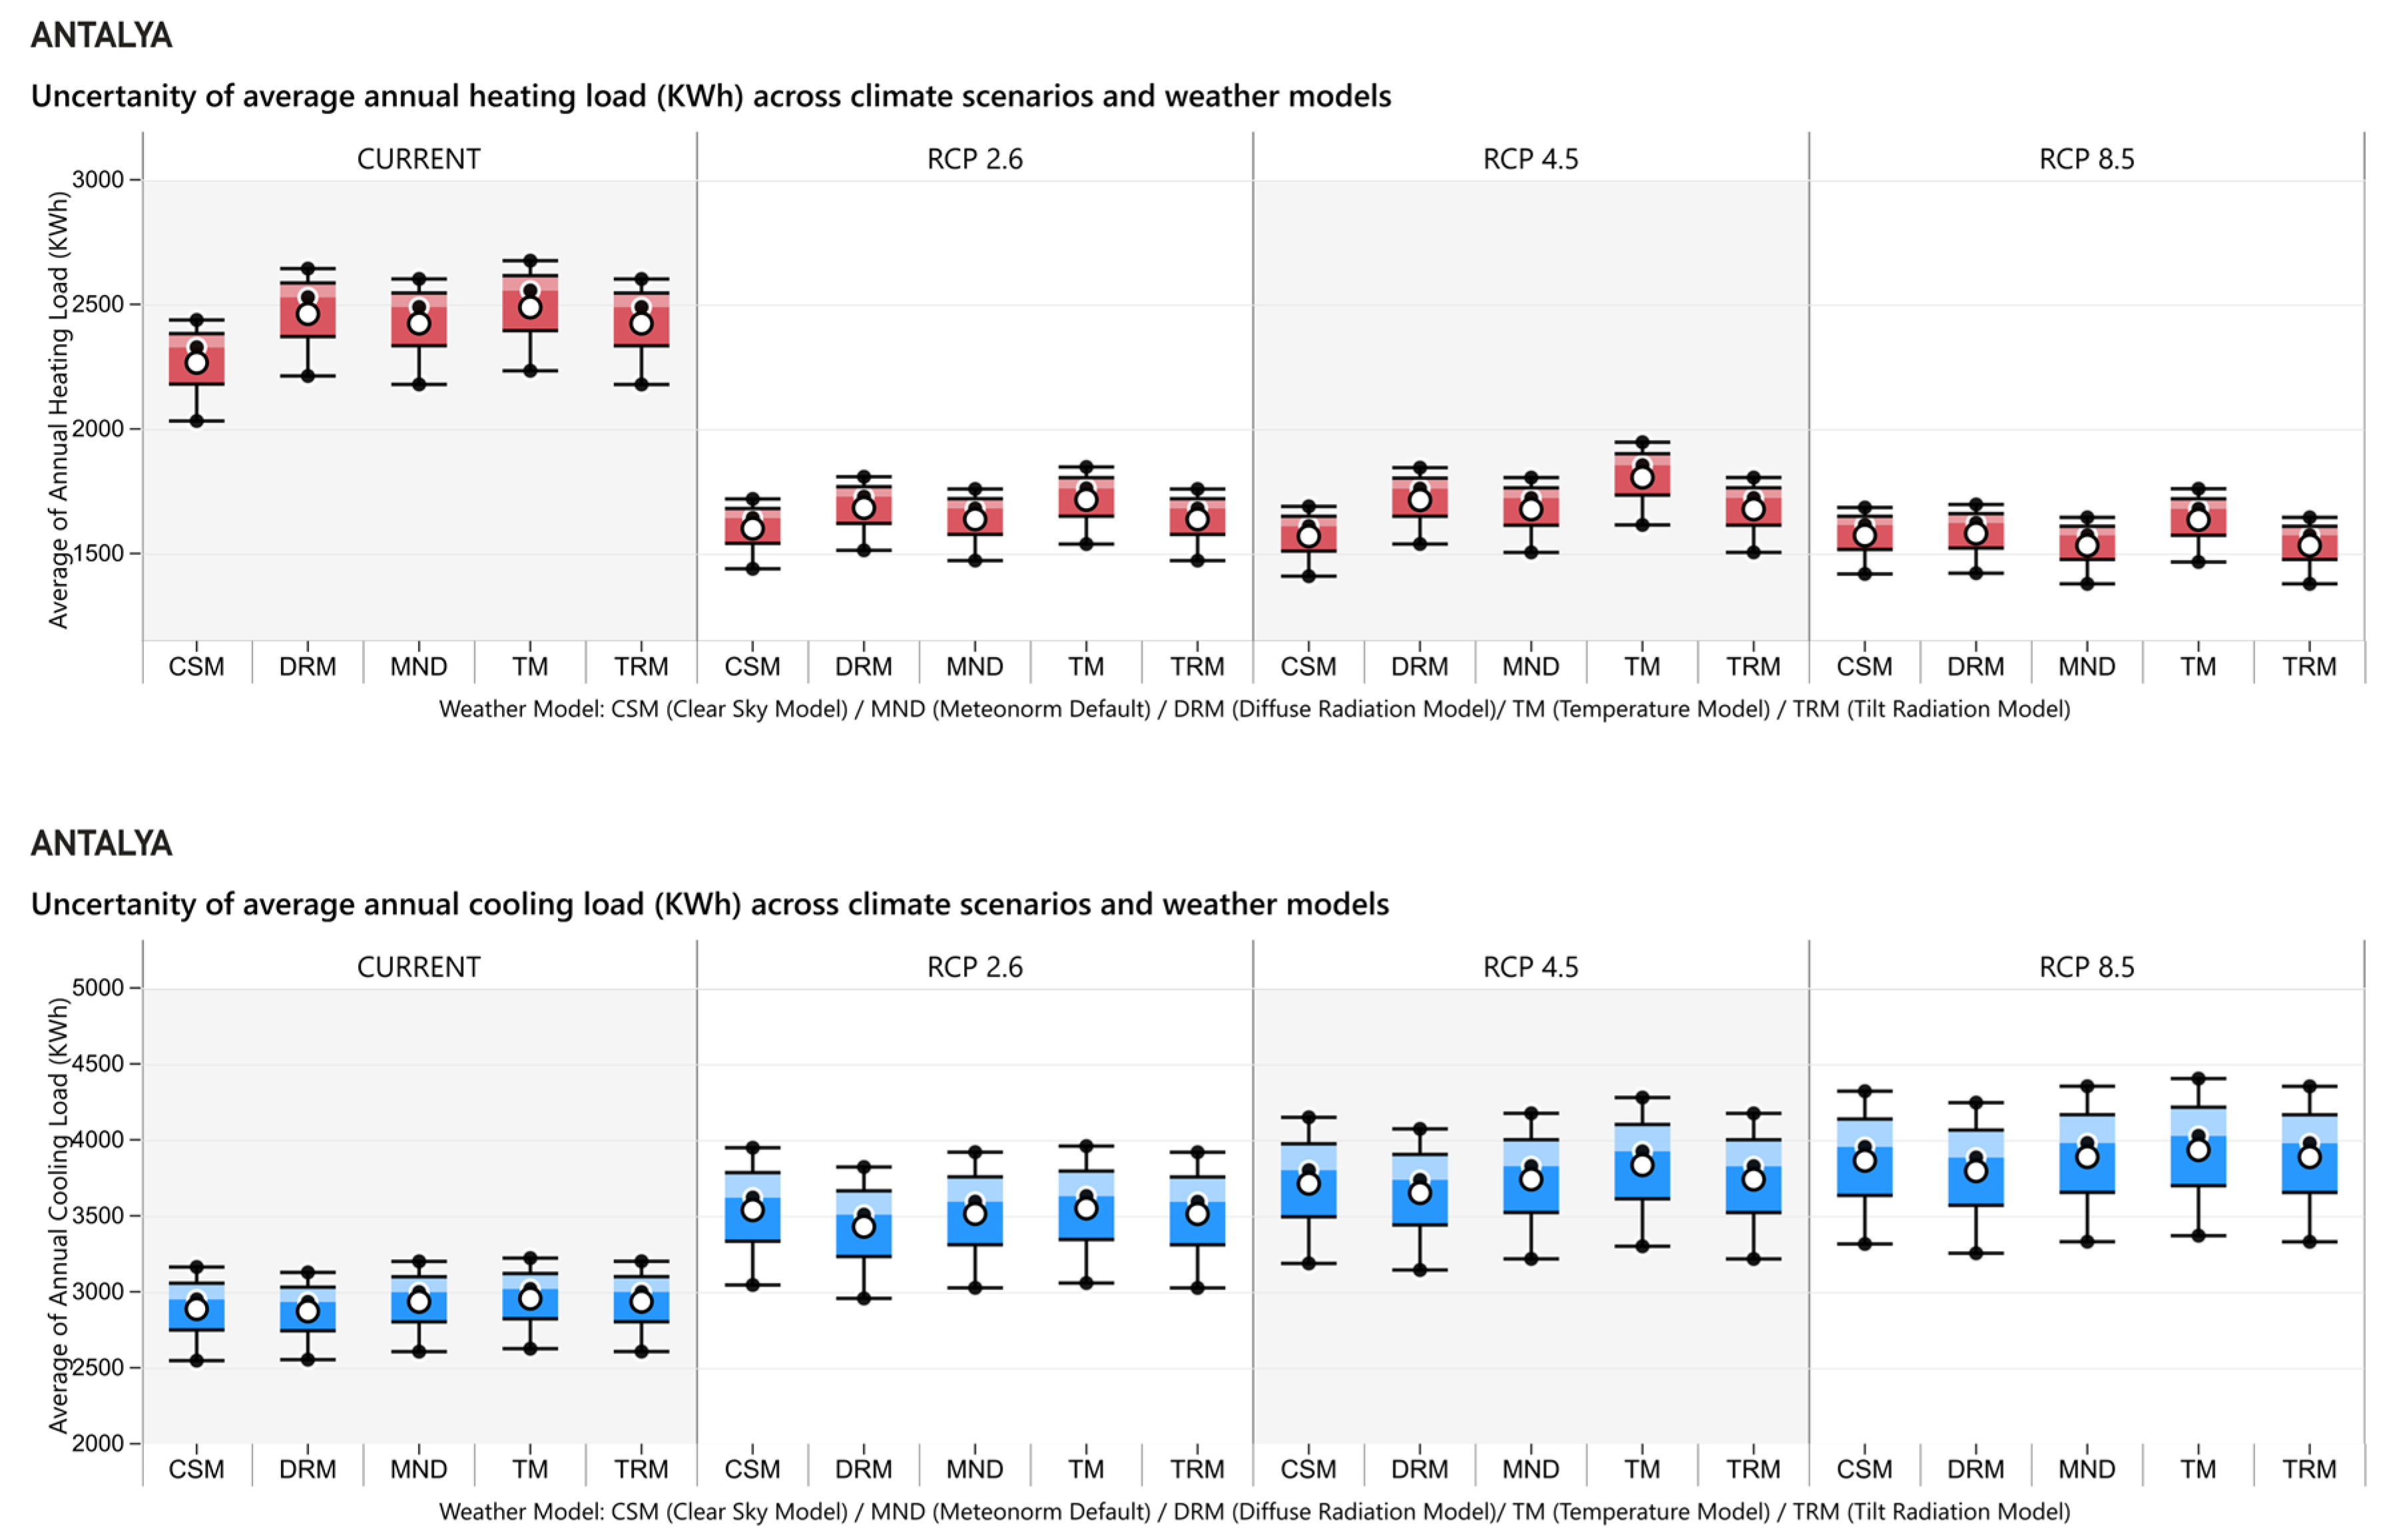
Figure 7 presents the uncertainty analysis for Antalya’s average annual heating and cooling loads under current and future climate scenarios (RCP 2.6, 4.5, and 8.5) using five different weather models. Each box plot displays the distribution of energy demand results for a weather model, where the boxes represent the interquartile range (IQR), the middle presents 50% of the values, while the whiskers show the minimum and maximum. The horizontal line inside each box indicates the median, and the white-filled circles represent the mean, and black-filled dots overlaid on the plots correspond to different occupancy scenarios.
The results indicate a clear trend across climate projections: cooling demand increases, while heating demand decreases. For cooling loads, mean values ranged from approximately 3442 kWh (DRM) to 3574 kWh (TM), with IQRs between 572 kWh and 631 kWh. Heating loads were lower, with means from 1755 kWh (TRM) to 1914 kWh (TM) and IQRs from 362 kWh to 471 kWh. Despite variations in weather data inputs, the range of results remained within reasonable limits, suggesting consistent model behavior. Notably, the MND model gave results that were very close to the average of all five weather models, showing that it can reliably represent overall conditions. This supports the validity of the MND approach and shows that MND, even when used alone, provides a reasonable and robust basis for simulation. Although using multiple weather models helps improve confidence in the projections, the results based on MND fall well within the expected range of variation.
Figure 8 presents the uncertainty results for Erzurum’s average annual heating and cooling loads under current and future climate scenarios, using five different weather models. In contrast to the cooling-dominated behavior observed in Antalya, Erzurum, which is characterized by a cold climate, exhibits a dominant heating energy demand. Across all climate scenarios, the heating loads display a declining trend as future climate warming scenarios progress, whereas cooling loads show a gradual increase.
Annual heating loads ranged between approximately 6600 and 8700 kWh across models and climate projections. For cooling, the values remained significantly lower, varying between about 1100 and 2700 kWh. Despite differences among weather data models and occupancy scenarios, the variation in results remained within an acceptable range.
In Erzurum results for all weather models, the MND weather model consistently produced heating and cooling load results that aligned closely with the averages from the ensemble of weather models similar to the results in Antalya. Its mean and variability fell within the overall range, confirming again that the MND default weather model offers a reasonable and robust basis for simulation in Erzurum as well. While applying multiple weather models increases confidence in the projections, the use of MND still represents the expected range of model-based uncertainty; therefore, only the results of the MND model will be presented below for the sake of simplicity in understanding and discussing the results.
The heating and cooling energy demands of 60 different simulations, including all climatic regions, weather data, and scenario alternatives determined using TRNSYS, are in
Table 4. The simulation numbers are assigned to the combinations of climate regions, climate data, and occupancy scenarios, and the resulting heating and cooling energy demand data are given in kWh. The results are presented and analyzed graphically in the results section of the study. As an example in deciphering
Table 4, simulation number 1 represents the simulation designed for occupancy Scenario 1, using current MND climate data for Antalya city. The results of simulation number 1, the annual heating and cooling loads are in kWh.
Table 4 also shows the percentage changes in heating, cooling, and total energy demand for each city, comparing the occupancy scenarios with the results of the current climate data.
Looking at the results by city, the lowest cooling energy load for Antalya is in simulation number 3 designed for Scenario 3 using current climate data, and the highest cooling energy load is for simulation number 12 using RCP 8.5 for Scenario 3, where around 35% change is observed between simulation number 3 and simulation number 12. The rate of change calculations considers the current weather and simulation-related weather for 2050. The lowest heating energy load for Antalya is observed in simulation number 10 using RCP 8.5 for Scenario 1. Looking at Antalya simulations using Scenario 3, the highest rate of change is a 37% decrease in Scenario 12 using RCP 8.5 data.
Some cities have contrasting climates—Erzurum has a cold continental climate; Antalya represents a warm Mediterranean region—allowing for a comprehensive evaluation of climate change impacts. In Antalya city, where the cooling energy demand is the highest, the results between the simulations using the current climate and the future projections change between a 3% increase and 6% decrease in the total energy loads. In Erzurum, where the heating energy demand is the highest, there is a 10–14% decrease in the total energy load in the future projections.
In Ankara, simulations using current climate show that the heating load decreases by 17–22% while the cooling load increases by 3–32%. In Istanbul, the heating load decreases by 16–28% and the cooling load increases by 1–23%. In Hakkari, the heating load decreases between 19–23% and the cooling load increases between 7–40%. Consequently, the total load increases only in simulations 8, 9, 11, and 12 in Antalya. In all other simulations, annual heating–cooling energy loads decrease between 2% and 14%.
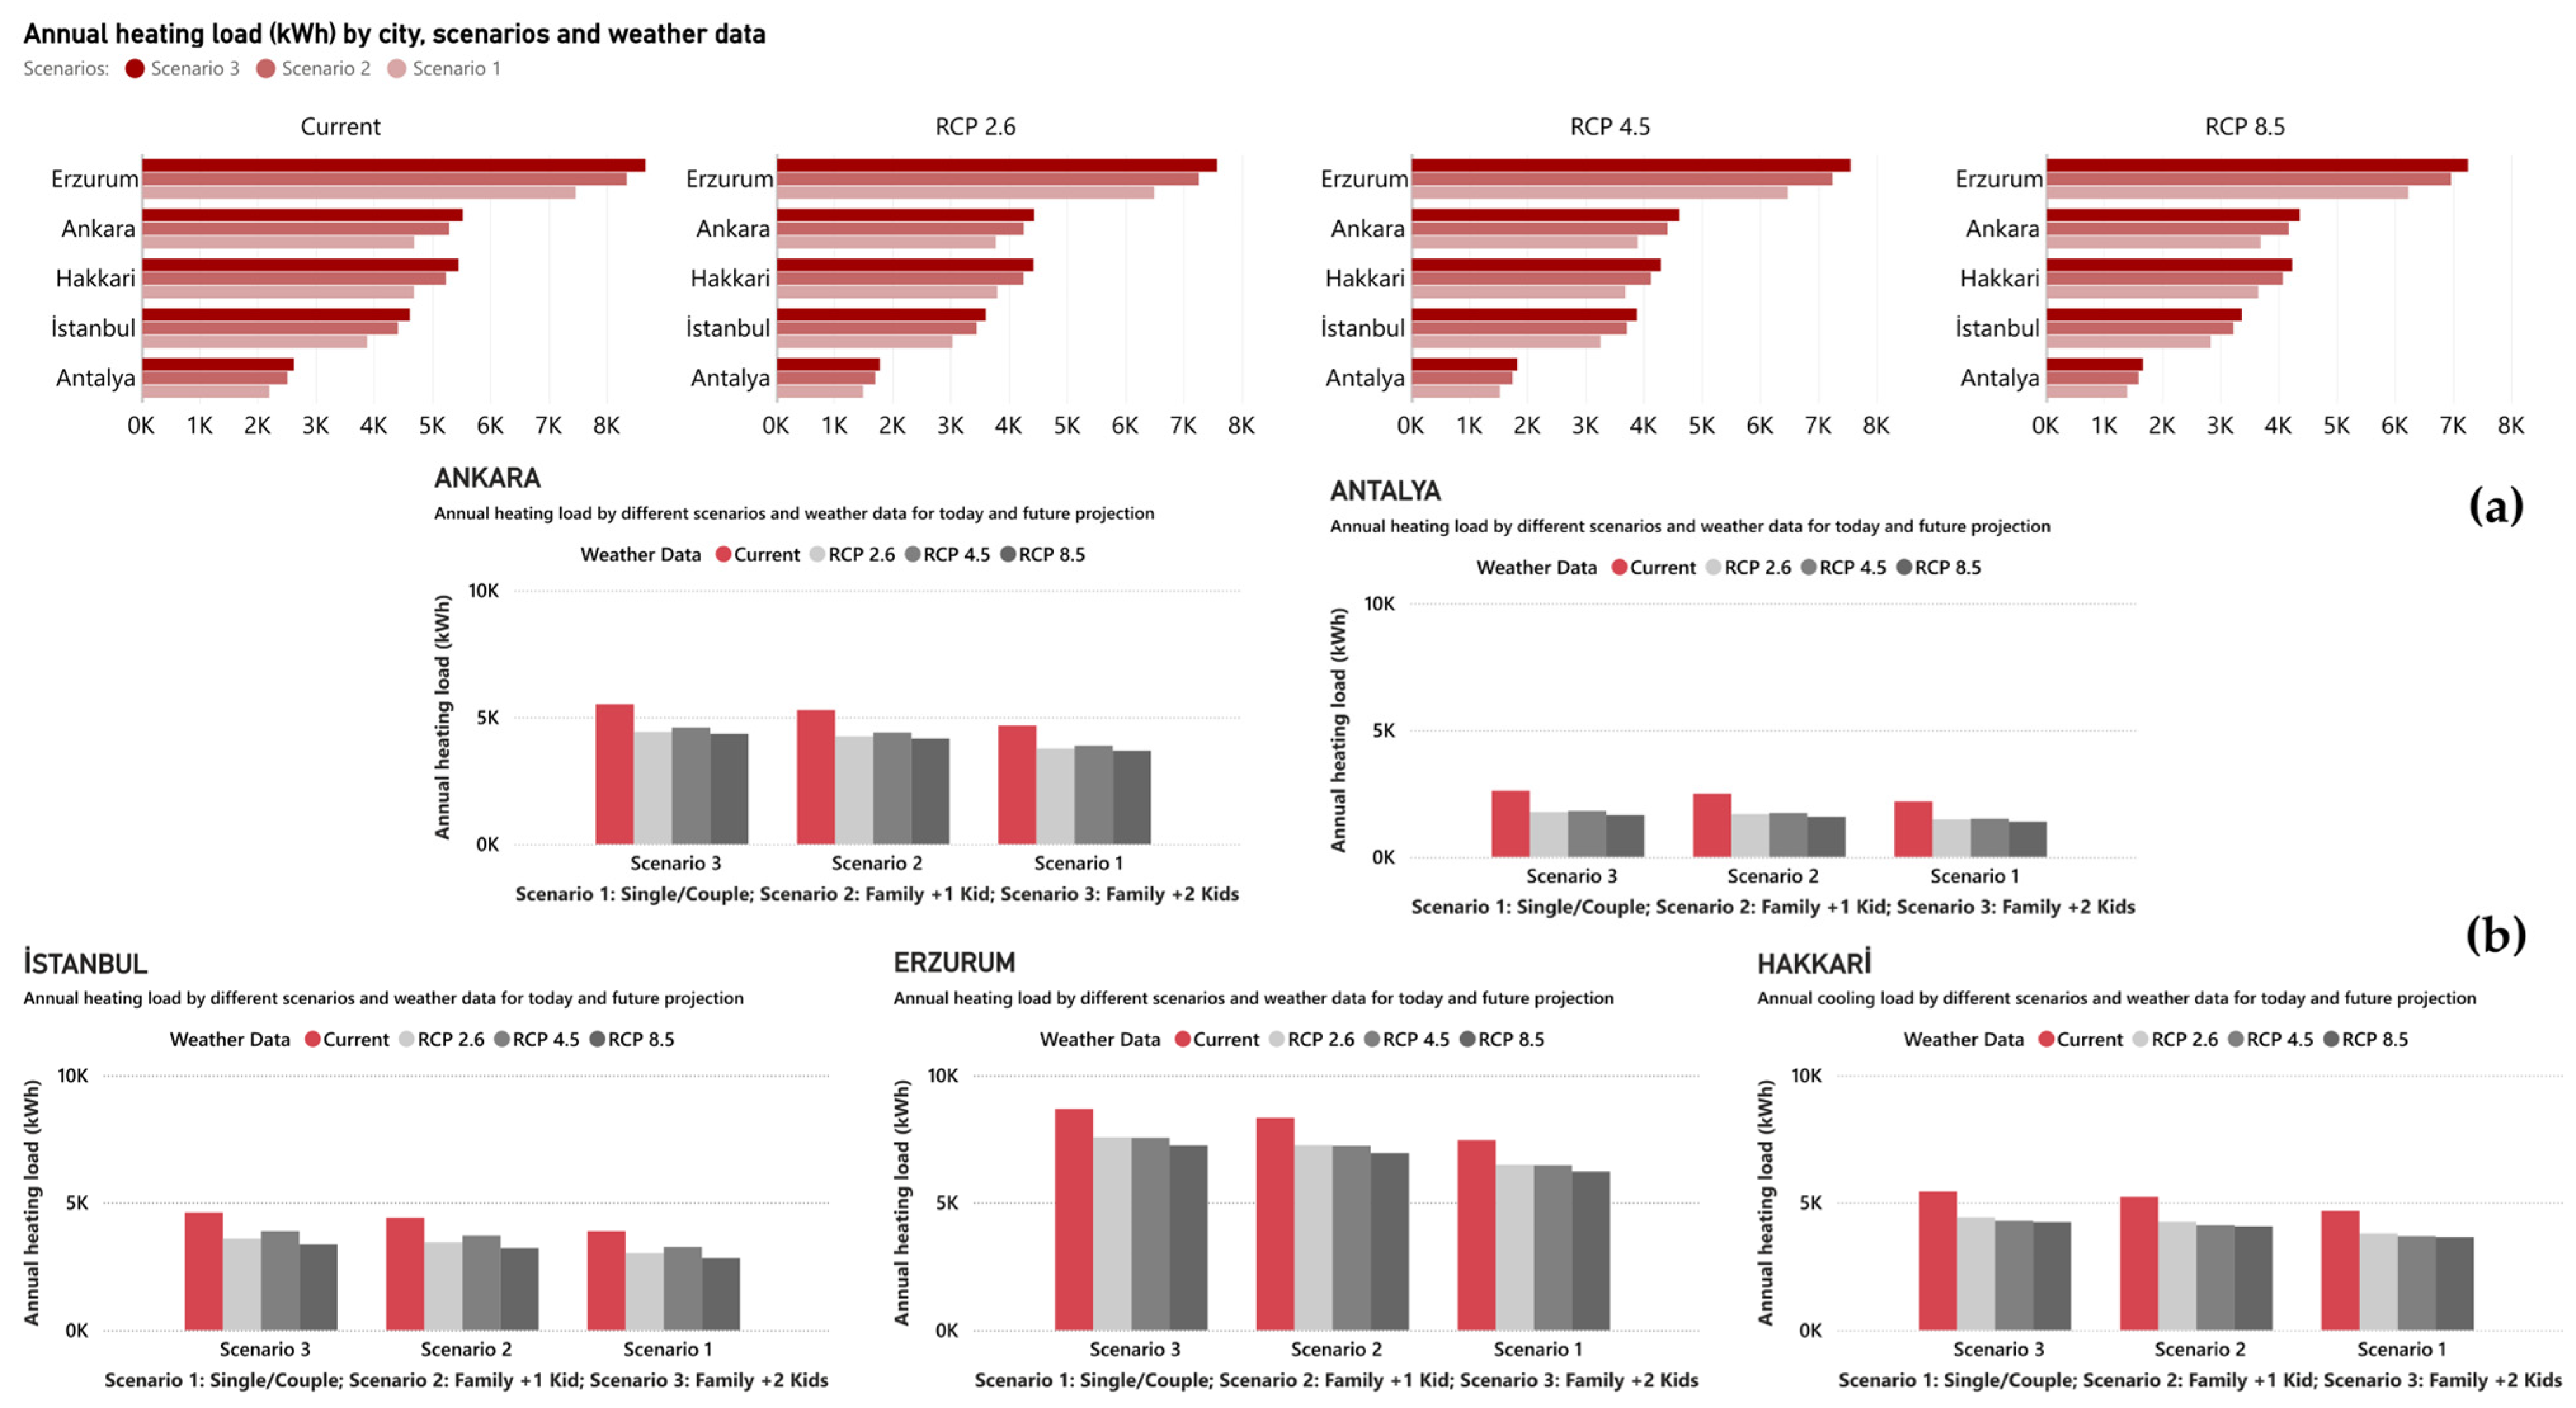
The heating energy demand for each city obtained simulations using current and future RCP 2.6, RCP 4.5, RCP 8.5; climate data are in
Figure 9. Erzurum, where the heating season is longer than other regions, has a much higher heating energy demand compared to other cities. For future weather scenarios, the heating energy demand for each city decreases compared to the current situation. In a comparison of simulations using current climate data with those using RCP 8.5 climate data, the largest reduction in heating energy demand is in Antalya, with a decrease of about 37%, while the smallest reduction is in Erzurum, with a difference of about 13%. In other cities, the reduction in heating energy demand varies between 17% to 28%.
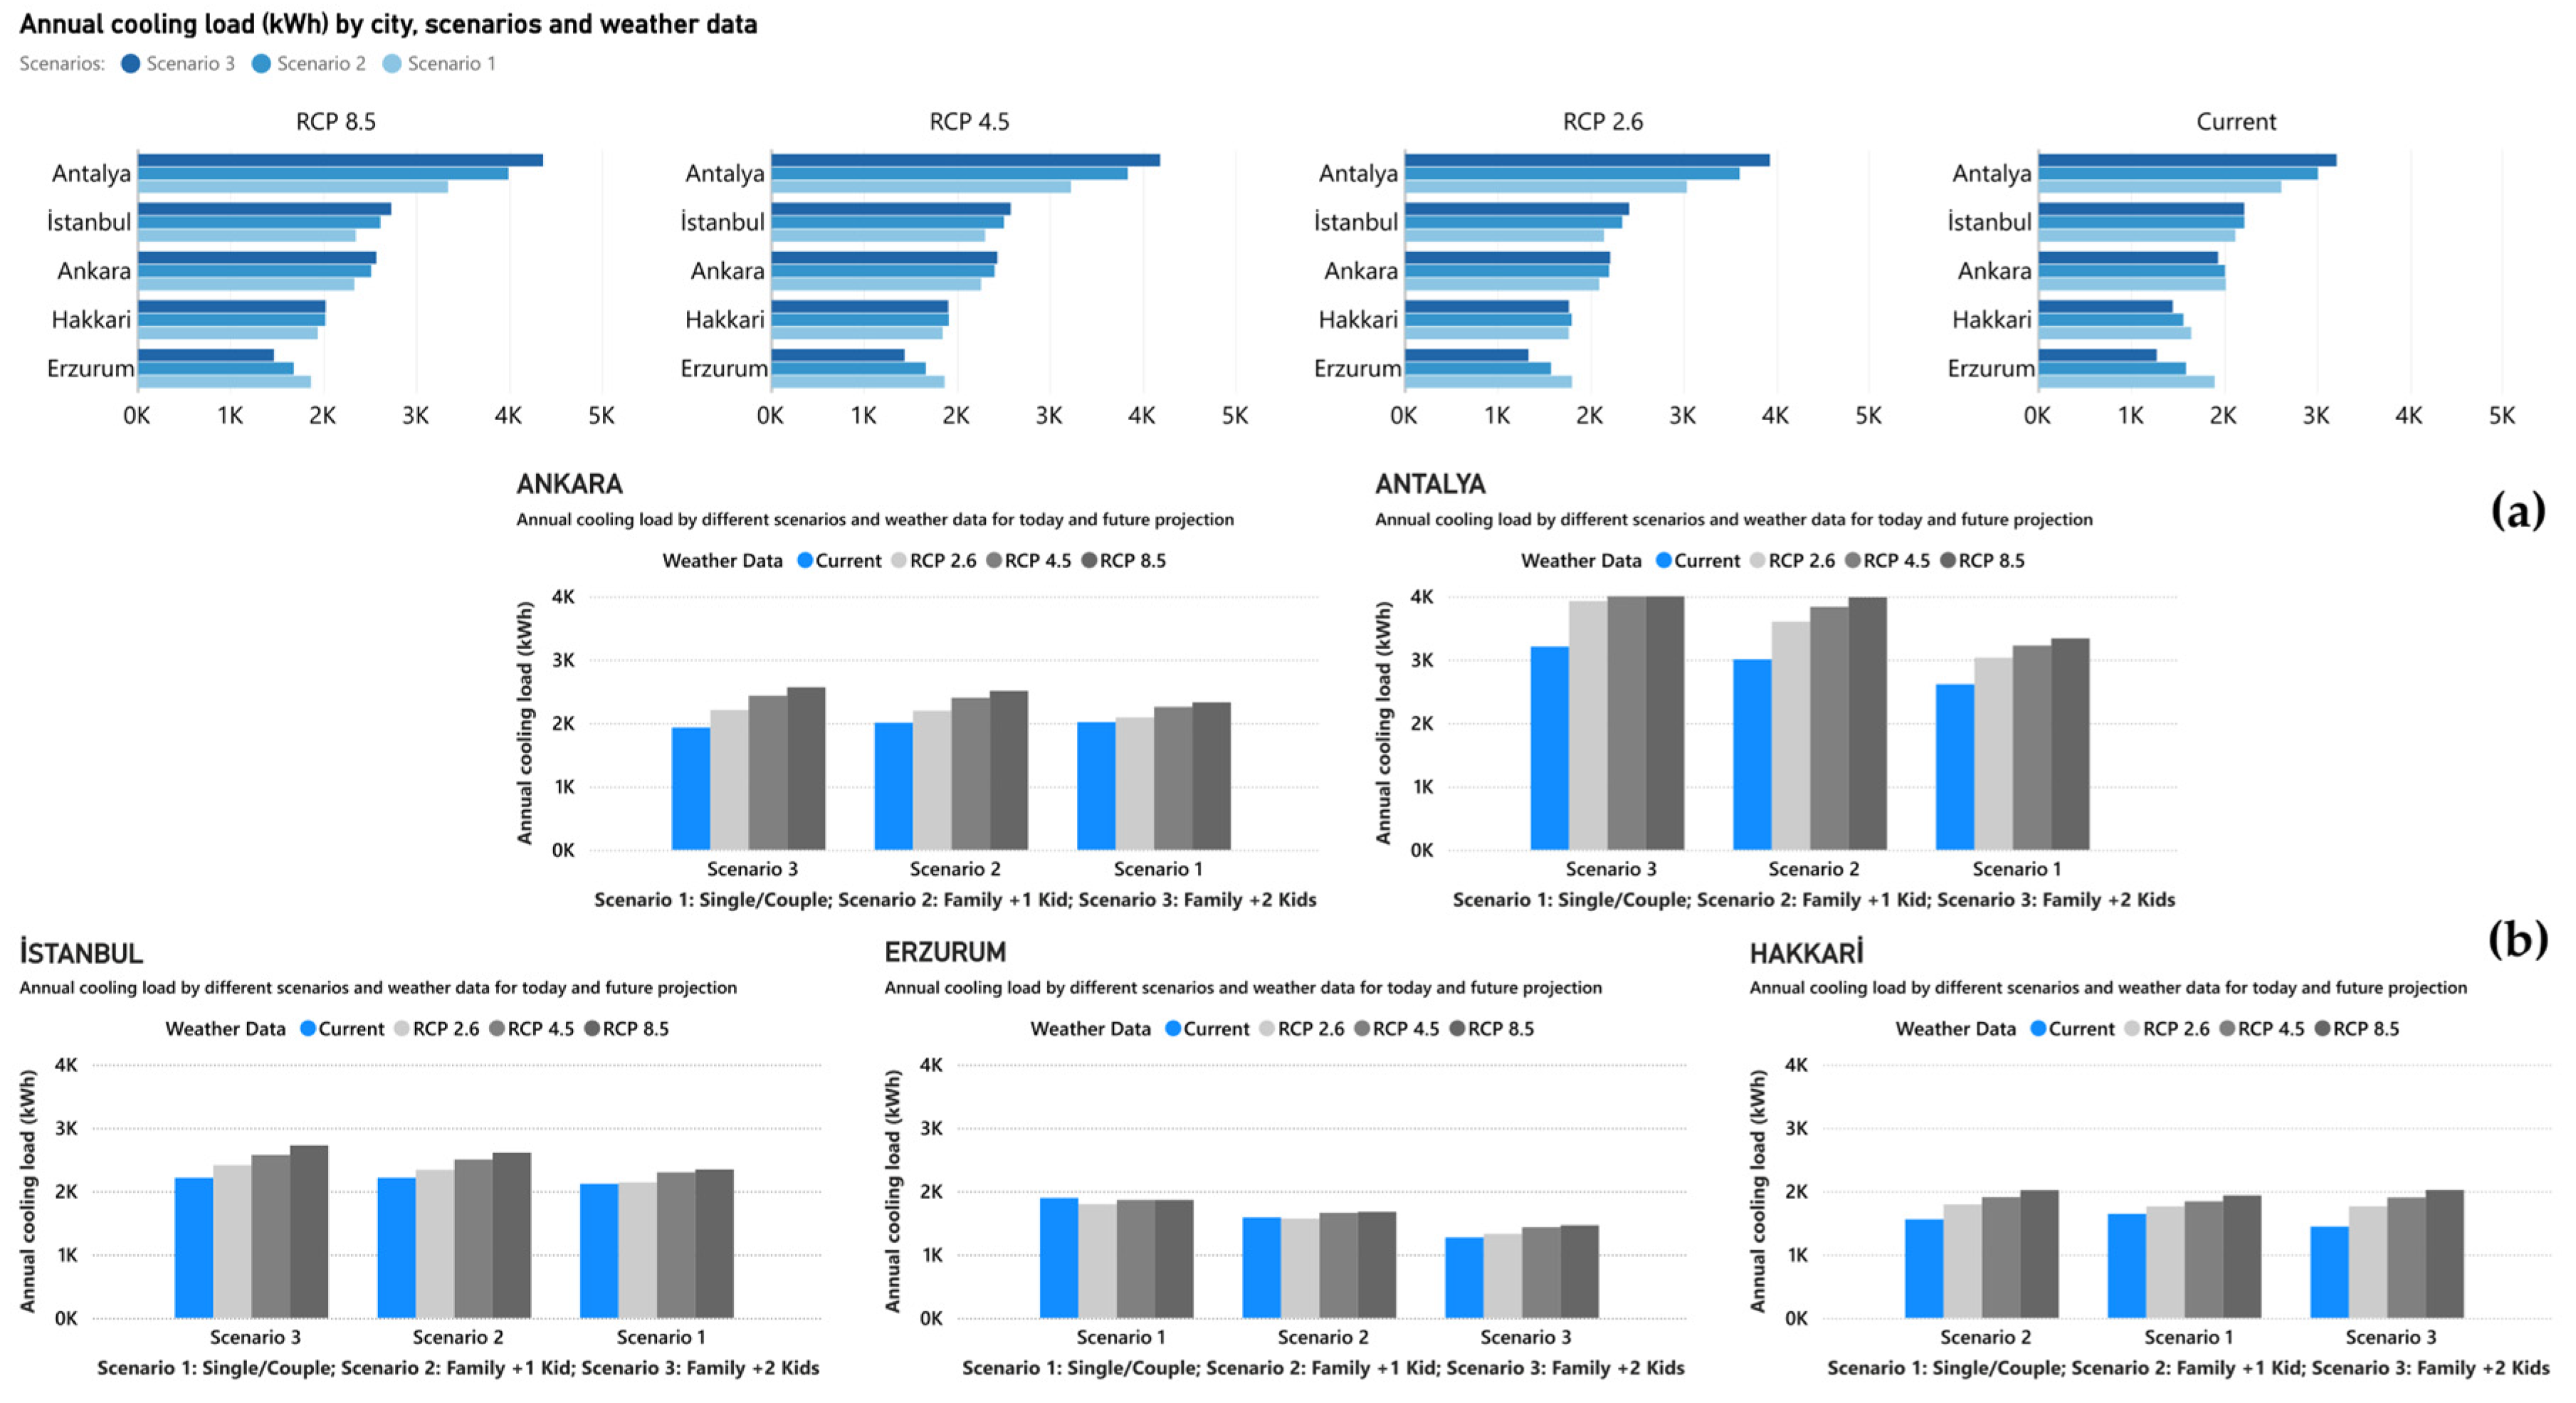
The cooling energy demand data according to the MND weather results are shown in
Figure 10. Contrary to the heating energy demand, an increase in cooling energy demand was observed in all simulations due to the predicted increase in air temperatures in future climate projections. In particular, for simulations using RCP 8.5 climate data, a nearly 35% increase in cooling energy demand is observed in Antalya, where the cooling season is long, compared to simulations using present climate data. Among the analyzed cities, Antalya is the most affected by future climate projections in terms of cooling energy demand, while Erzurum experiences the least impact with an increase of about 6%. An examination of the impact of scenarios on cooling energy demand shows a significant difference between scenario 1 and the other scenarios in Antalya and Ankara. However, in Erzurum, which has a continental climate, there is no significant difference between these scenarios.
Figure 11 represents the impact of climate change on heating and cooling loads. Here, heating and cooling loads are expressed as ratios to each other. The ratio of cooling loads to total energy load has increased in all future projections. Comparing different cities, Antalya is the only city where the cooling load is higher than the heating load, in accordance with the T
max and T
min values of the climate zones. In other cities, the heating load is higher than the cooling load at different rates. Looking at the effect of climate data in the present and future projections on the annual heating and cooling energy load (in
Figure 8), the cooling load is lower and the heating load is higher than today’s climatic conditions. In the scenarios using RCP 8.5, RCP 4.5, and RCP 2.6 data, although the cooling energy demand increases, the total energy load is approximately the same in the present and future projections due to decreasing heating energy. According to the results, the lowest heating energy demand was found in occupancy scenario 1 in all cities. After scenario 1, there is an increasing demand for heating energy in occupancy scenario 2 and scenario 3.
5. Discussion
There are various pathways to reach nZEB or decarbonize the built environment. To achieve these goals without looking at the implications of climate change, buildings need not only be designed for today but for a lifecycle of 30, 50, or 100 years. However, climate change impacts are often disregarded in research [
43]. While the many scenarios for global climate change all have different assumptions, they all expect an increase in maximum and minimum temperatures. This paper considered the current and future temperature profiles of five cities representing Turkey’s distinct climatic regions. For 2050, the current and for RCP 2.5, RCP 4.5, and RCP 8.5 weather data show that the highest temperature values in Antalya, where the current temperature is approximately 42.4 °C, rose up to 45.9 °C. T
min also increased, from 0.4 °C to 2.4 °C in RCP 8.5. Here, the impact of climate change being higher on cities with already high temperatures is evident. The lowest T
max and T
min values are observed in Erzurum, where the current temperatures are 33.8 °C and −29.8 °C; they changed to 36.1 °C and −26.9 °C in RCP 8.5. These changes in T
max and T
min values measured throughout the year in five climatic regions of Turkey will cause a significant shift in heating and cooling energy demands. Consequently, the results of the impact of climate change on regional energy demands show that especially cooling loads show a significant increase in hot climate zones, but more moderate changes occur in heating loads.
5.1. The Changing Energy Requirements in Different Regional Climates
A certain amount of energy is needed to ensure the continuity of thermal comfort in buildings. Many passive techniques, such as the insulation of the building envelope, correct orientation, night ventilation, directional opening design, detail solutions without thermal bridges, and thermal insulation, are used to reduce the energy needed. Yıldız [
44] looked at the three biggest cities of Turkey including İstanbul and Ankara in this study. He emphasized that since TS-825 is mainly interested in decreasing heating loads, newly built and existing residential apartments will face 1.7 to 30 times more cooling energy requirements until 2080 and require the integration of passive cooling strategies. Another analysis of İstanbul for the RCP 4.5 and RCP 8.5 climate scenarios for 2050 and 2080, found that cooling degree days will quadruple and reach 158; hence, a well-ventilated residential building will have triple the cooling energy consumption and a decrease of 41% in heating energy consumption [
45]. Although heating and cooling energy can be reduced to a certain level with energy-efficient solutions applied, energy is still necessary. Palme et al. [
46] looked at three IPCC scenarios in 2040 and 2070 for Rome with a typical Mediterranean climate, Osaka with a continental climate, and Caracas with a tropical hot humid climate. They compared the performance of robust buildings with high thermal mass and an up to 10% window to wall area ratio and sensitive buildings with medium or low thermal mass and up to 50% window to wall ratio; they found that robust buildings perform better under climate change effects except for very hot climatic conditions [
46]. Hence, they argue that the energy certification process should take the effects of climate change into account. This paper’s findings also show that climate change affects the energy consumption of buildings, and the assumptions of energy certification should include re-evaluation or adaptation pathways due to the effects of climate change.
5.2. The Effect of Occupancy Size
Many studies examine the impact of occupant behavior on building energy demand. Wu et al. [
47] state that occupancy is an important input in determining the operating time interval of building heating, cooling, lighting, etc., systems and the level of energy needed. Furthermore, they determined that variations in occupancy patterns can result in a 50% alteration in energy demand in single-person office buildings and approximately 23% in campus buildings [
47]. Therefore, the primary objective of research into occupant behavior is to enhance energy efficiency in buildings, ensuring the continuity of user comfort [
48]. A significant finding is that studies using occupancy-based setpoints achieved energy savings of up to 50% compared to studies using fixed setpoints [
49]. However, Velashjerdi Farahani et al. [
50] acknowledge the complexity of incorporating socio-economic and technical changes into future projections, emphasizing their potential impact on the accuracy of results, particularly in terms of occupancy profiles that reflect contemporary lifestyles, when they aimed to determine the change in energy demand using 2050 climate data. In the same line with Velashjerdi Farahani et al. [
50], this study also adopts a novel approach by determining energy needs for various occupant types, in contrast to conventional fixed occupancy-based simulations. It utilizes the available statistics for Turkey in determining the occupant sizes. The results obtained facilitate the determination of energy requirements for various occupant types. Chen et al. classified various studies on occupant behavior into three main categories: occupancy, interaction, and behavioral efficiency [
51]. Therefore, the effect of occupant behavior is also important on building energy demand. For example, Jami et al. found that wasteful, normal, and thrifty occupants can achieve a 32%, 56%, and 60% reduction in energy demand, respectively, with energy saving measures [
52]. Within the limits of this study, calculations used fixed occupant profiles. Future studies will also consider occupant behavior to allow the results to be interpreted in a broader perspective.
5.3. The Required Additional Renewable Energy
The findings indicate significant differences in heating and cooling load variations across different climate regions. Cooling-dominated climates are more adversely affected by climate change, whereas regions with higher heating demands show relatively balanced variations. While this study does not directly model HVAC efficiency degradation or emerging smart technologies, it is important to acknowledge that system performance may decline over time and that innovative control strategies could influence energy consumption. In this context, the study’s focus on fundamental heating and cooling loads provides a solid basis for future research integrating dynamic HVAC performance modeling and adaptive energy management strategies. Identification of strategies for system optimization when assessing the long-term effectiveness of existing heating and cooling systems is partially important. For example, heat pumps are sensitive to outdoor temperatures, and this may lead to performance fluctuations in future climate scenarios; thus, it is recommended to focus on climate compatible system designs. In this direction, predicting these loads depend on the system coefficient of performance (COP) of the heat pump and central air conditioning devices and to prefer systems with both device capacity and high COP values in the first investment. For a sustainable future and environmental contribution, it is also important that the energy needed is met from renewable sources rather than fossil fuel sources [
53]. There can be many technological innovations in the energy sector with a different diffusion rate into the residential sector until 2050. Therefore, this study does not focus on one technology and looks at the heating and cooling demands in general.
In recent years, there has been a notable increase in the adoption of technologies that generate energy from renewable sources in buildings in developed countries. These technologies have become a significant component of investment decisions, along with considerations such as initial and life cycle costs. This study provides a reference for other regions of the world with similar climatic conditions and constitutes an important benchmark for understanding the long-term impacts of climate change on building energy systems. Therefore, it is necessary to develop energy management strategies specific to different regions and occupancy schedules, to create sustainable solutions for heating and cooling systems to adapt to future conditions. Many studies consider the effects of climate change on integrating renewable energy to buildings. For example, Tamer et al. [
54] predicted the performance of building-integrated photovoltaics for all cities of Turkey in 2020 and 2080 and found that the impact of climate change on photovoltaics energy generation would be limited for 2080. Meanwhile, the increased building energy requirements and cooling loads show that climate resistance requires both design strategies and energy generation, where the best performance for the climatic region is by photovoltaics [
55].
This study evaluates the heating and cooling load variations under different climate scenarios without directly assessing the sufficiency of existing renewable energy systems. The analysis focuses on thermal energy demand rather than the performance of specific energy supply solutions, ensuring that the results reflect fundamental changes in building energy requirements. The sizing of Heating, Ventilating, and Air Conditioning (HVAC) systems needs to account for peak load variations, but system performance can also be assessed through seasonal performance indicators such as the Seasonal Coefficient of Performance (SCOP) for heat pumps and Seasonal Energy Efficiency Ratio (SEER) for cooling systems. In this direction, determining the total heating and cooling loads has an important role in the discussion of renewable energy systems and thermal energy storage solutions that will work integrated with HVAC systems. These considerations are fundamental for future studies aiming to combine energy supply solutions with dynamic load projections. Consequently, the results of the study show that there will be no need to plan to increase the production capacity of the system in future periods, and the production capacity of the system used in future periods can be sufficient in terms of the calculated heating and cooling load.
6. Conclusions
This study analyses the impact of different types of users on heating and cooling energy demand for five climatic regions of Turkey under current climate and future projections. In accordance with the data obtained, the results of the study show the following:
- -
Different types of users affect the heating and cooling load in all climate regions and have an increasing effect from a single/couple user (in occupancy scenario 1) to a family of four persons (in occupancy scenario 3).
- -
Future climate projections affect different climatic regions at different rates. In all cities, the cooling energy load increased at certain rates in the future projection, but the highest increase was found in Antalya. The heating load decreased in all climatic regions. Erzurum was the city with the highest decrease in heating energy load.
- -
Antalya, where the cooling season is the longest, has the highest impact in heating loads, and Erzurum, where the heating season is the longest, has the highest change in heating loads.
- -
When the heating and cooling loads are evaluated as a whole, the results of the scenarios using today’s climate data and the scenarios of the future projection are approximately similar.
- -
Based on the similarity between the current and future energy loads, the energy load will remain similar in 2050, and it will not be necessary to add equipment to the system to increase production capacity in the future.
The limitations of this study mostly regard its scope. This study focuses on apartment buildings and does not consider single dwellings or buildings with different functions. The study has three occupancy scenarios; they are determined by considering the number of households in the Turkish population. One of the limitations of this study is that it does not take into account possible future behavior change scenarios. The study was conducted on the five degree-day zones specified in the current TS 825 Thermal Insulation Rules standard, which includes climate data for continental, temperate, and Mediterranean climates. However, as there are no climate types such as arctic, tropical, or desert among the five climate zones in Turkey, results for the climate types specified in the study could not be obtained. In addition, only 2050 climate data were considered in the future projections. Climate data for further years, such as 2100, can also be included to address longer-term investment decisions. After this study, studies on different climate zones, building types, scenario alternatives, or longer-term future projections will provide data for solving different problems from different perspectives.
Based on these results, it is possible to develop solutions over the lifetime of a building that use energy effectively and efficiently, not only for today’s conditions, but also according to future projections. For a sustainable future, it is extremely important to design buildings that consider future projections and use renewable energy solutions.
The changes in the climatic regions of Turkey can also be true for changes in different Mediterranean and continental climates and can be a further step in increasing knowledge on the effects of climate change on building energy consumption. In future studies, the effect of climate change on other building types and energy generation systems can be studied. Moreover, life cycle cost and optimization studies can be carried out using equipment with different COPs, taking into account that the production capacity will remain constant.


