Article

Research on the Punching Shear Performance of Steel Grid–UHPC Composite Bridge Decks

1
School of Architectural Engineering, Jinling Institute of Technology, Nanjing 211169, China
2
Shandong Electric Power Engineering Consulting Institute Corp., Ltd., Jinan 250013, China
3
School of Civil Engineering, Southeast University, Nanjing 211189, China
*
Author to whom correspondence should be addressed.
Buildings 2025, 15(18), 3398; https://doi.org/10.3390/buildings15183398
Submission received: 12 August 2025 / Revised: 14 September 2025 / Accepted: 16 September 2025 / Published: 19 September 2025

Abstract

This study conducted punching shear tests on steel grid–ultra-high-performance concrete (UHPC) composite bridge decks and performed finite element analysis (FEA) to evaluate their punching shear performance. Initially, a comparative analysis is conducted between the test results and FEA results. The findings indicate that, due to the presence of T-shape steel in this new type of bridge decks, variations in the spacing between adjacent T-shape steel members can lead to two distinct punching shear failure modes: conventional failure mode and unconventional failure mode. Under identical conditions and test specimen parameters, the punching shear capacity associated with the unconventional failure mode is approximately 35% higher than that of the conventional failure mode. Subsequently, a parametric analysis is performed using the FEA method, and the results indicate that, for the composite bridge deck experiencing conventional failure mode, the punching shear capacity decreases approximately linearly with increasing UHPC plate width, whereas it increases approximately linearly with increasing UHPC plate thickness. The type of T-shape steel exhibits negligible influence on the punching shear capacity of the steel grid–UHPC composite bridge deck. Finally, based on the formula for calculating the punching shear capacity of conventional plates in Chinese standards, this paper introduces a correction coefficient that accounts for the width-to-thickness ratio of UHPC plate and proposes an improved calculation method applicable for determining the punching shear capacity of steel grid–UHPC composite bridge decks under conventional punching shear failure mode condition.

1. Introduction

Steel-concrete composite bridge decks are increasingly adopted in bridge engineering as they effectively utilize the mechanical advantages of both steel and concrete. Ultra-high-performance concrete (UHPC) is a cement-based composite material characterized by its ultra-high strength, exceptional toughness, and superior durability [1,2]. In recent years, a novel composite bridge deck structure that integrates UHPC with orthotropic steel or corrugated steel has been increasingly proposed [3,4,5].
In this paper, a novel composite bridge deck system, referred to as the steel grid–UHPC composite bridge deck, is proposed, as illustrated in Figure 1. The structure is constructed by utilizing a steel grid framework. This framework is composed of main T-shape steel, structural T-shape steel, corrugated steel plates, as well as transverse and longitudinal rebars. The main T-shape steel and structural T-shape steel have perforations in the web section. The web of this T-shape steel can serve as an alternative to the traditional perfobond leiste (PBL) shear connectors. The corrugated steel plates act as the bottom formwork. Transverse and longitudinal rebars are arranged in an interlaced manner within the openings of the T-shape steel to form a reinforcing mesh. Subsequently, UHPC concrete is poured onto this steel grid framework.
This type of bridge deck offers several advantages: It fully utilizes the high compressive strength of UHPC and the high tensile strength of steel, thereby effectively reducing the self-weight of the bridge deck and enhancing the bridge’s spanning capacity. The T-shape steel used in the steel grid framework is free of welds, providing excellent fatigue resistance. Additionally, holes are drilled in the web of the T-shape steel, through which rebars are inserted, resulting in a connection performance with concrete that surpasses that of PBL shear connectors. However, this type of bridge deck has a relatively thin cross-section, which may lead to punching shear failure under wheel loading. The research focus of this paper is to investigate the punching shear failure of the steel grid–UHPC composite bridge deck.
Punching shear failure, also referred to as two-way action shear, originally referred to the shear-controlled failure mechanism observed at slab–column connections [6]. Generally speaking, within the bridge deck system structure, bidirectional shear failure induced by concentrated loads also falls under the category of punching shear failure. Jeffrey et al. [7] proposed that the punching shear was identified as the critical failure mode for concrete bridge decks with fiber-reinforced polymer grids. For reinforced concrete slabs, their punching shear capacity is frequently governed by slab thickness, concrete compressive strength, and steel reinforcement [8,9]. Zhang et al. [10] noted that the punching shear capacity of the two-way concrete slab rises as the concrete compressive strength increases. Ahmed et al. [11] and Metwally et al. [12] evaluated the punching shear capacity of normal and high-strength concrete with a cylinder compressive strength range from 25 to 85 MPa and also concluded that increasing the compressive strength enhanced the punching shear resistance. However, the determination of punching shear capacity is restricted by the limitations on concrete compressive strength, as specified in the current code guidelines. Moreover, when the concrete exhibits relatively high compressive strength, design codes tend to overestimate the punching shear capacity [13,14].
According to the formula proposed by Ngab and Shahin [15], the punching shear capacity of high-strength concrete is proportional to the square root of the compressive strength. However, based on the research carried out by Elsanadedy et al. [16], the capacity should be proportional to the cube root instead of the square root. The study [16] revealed that the concrete punching shear capacity was associated with the ratio of the effective depth to the critical perimeter. However, different standards offer diverse definitions for the critical perimeter. The critical section for assessing punching shear capacity is typically situated within a distance ranging from 0.5 to 2.0 times the effective depth (d) from the edge of the loaded area [16]. ACI 318-14 [17], CSA A23.3-14 [18], and IS456-2000 [19] specify a value of 0.5 d, whereas Eurocode 2 [20] adopts a larger distance of 2 d.
A substantial body of research has also examined the effects of steel reinforcement and reinforcement ratio on punching shear capacity. Habeeb et al. [21] concluded that the inclined shear reinforcement has the most positive influence. The research conducted by Jia and Chiang [22] showed that the amount of shear reinforcement had a certain impact on the slab’s punching shear capacity, while the diameter of the shear reinforcement had a relatively negligible effect. Zheng et al. [23] found that the punching shear behavior was enhanced by the increased arching contribution and reinforcement percentage. Amir et al. [24] found that the punching shear capacity of the bridge decks was much larger than that predicted by most international codes that do not consider the effect of compressive membrane action by virtue of lateral restraint effects. The relationship between the punching shear capacity and the reinforcement ratio has been interpreted in diverse ways by numerous researchers and codes. Ngab and Shahin [15] as well as Eurocode 2 [20] proposed that the punching shear capacity is proportional to the cube root of the reinforcement ratio. In contrast, Elsanadedy et al. [16]. contended that the capacity is more appropriately proportional to the square root, rather than the cube root, of the reinforcement ratio. The formulas specified in ACI 318-14 [17], CSA A23.3-14 [18], and IS456-2000 [19] do not take into account the effect of the reinforcement ratio on the punching shear capacity.
The steel grid–UHPC composite bridge deck features a reduced plate thickness, which intensifies the concern regarding punching shear. Additionally, its T-shape steel configuration results in punching shear behavior distinct from that of conventional concrete plates and UHPC plates. This study investigates the punching shear performance and failure mechanisms through both experimental testing and finite element analysis (FEA), with the objective of developing a practical formula for estimating the punching shear capacity suitable for engineering applications.

2. Experimental Work

2.1. Geometric Dimensioning of Test Specimens

Through extensive finite element (FE) simulations conducted in the preliminary stages, the steel grid–UHPC composite bridge deck was selected as the optimal structural solution. This structural form was chosen for its rational design, superior load-bearing capacity, and material efficiency. Based on the dimensions of this bridge deck, the experimental test specimens were subsequently designed. For the steel grid–UHPC composite bridge deck, the middle plate connecting the two T-shape steel sections is susceptible to punching shear failure; therefore, the two T-shape steel sections along with their central connecting region are selected as the specimens for punching shear testing in this study. In this paper, two punching shear specimens are designed, specimen CQD4 is designed according to the above selected optimal structural solution, as shown in Figure 2.
According to the calculation form for shear punching specimens specified in the Chinese standard JTG3363-2018 [25], the currently selected steel grid–UHPC composite bridge deck shows an unconventional punching shear failure mode under vehicle loading. To facilitate comparison with the FE simulation results, an additional specimen CQD6 was designed based on specimen CQD4. The spacing between the T-shape steel components was increased in this design. This modification is intended to induce a conventional punching shear failure mode. The differences between conventional and unconventional failure modes will be detailed in Section 5.
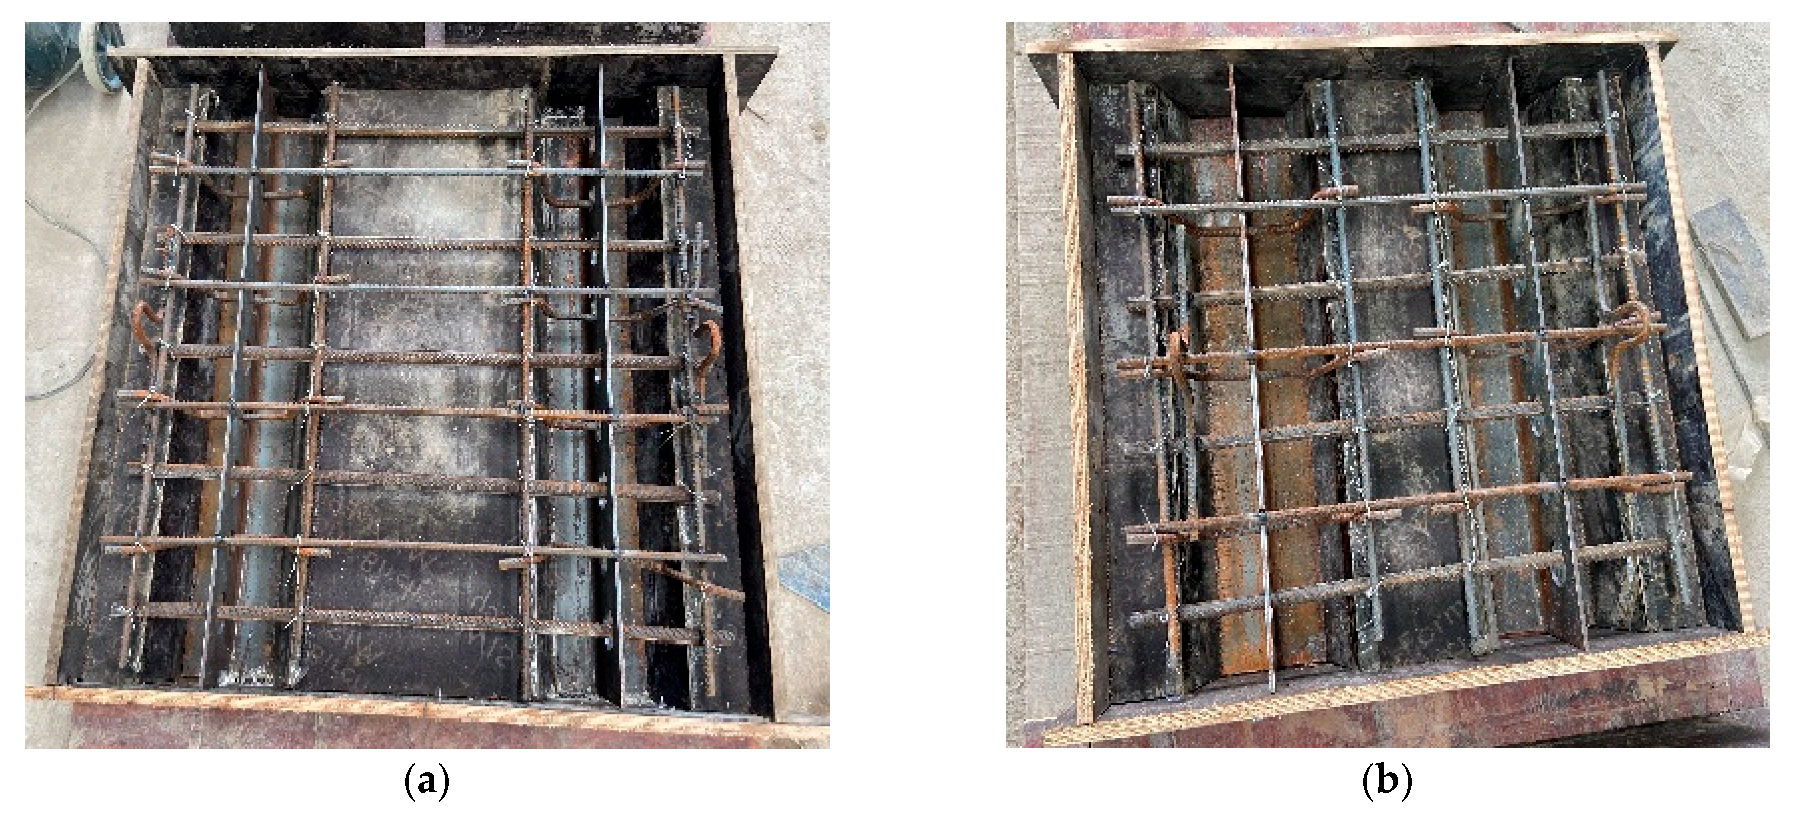
The design parameters of specimens CQD4 and CQD6 are presented in Table 1. The rebars drawings for each specimen are illustrated in Figure 3 and Figure 4, respectively. Rebars No. 1, H1, U1, Z3 are fabricated from hot-rolled ribbed bars (HRB400) conforming to Chinese standard GB/T 1499.2-2018 [26], with yield strength ≥ 400 MPa and tensile strength ≥ 540 MPa. No. 1 features a diameter of 20 mm, while No. H1, U1, Z3 feature a diameter of 12 mm. The photographs of the template taken during the preparation and UHPC pouring process are presented in Figure 5 and Figure 6, respectively.

2.2. Material Property

2.2.1. UHPC

This UHPC formulation utilizes the Subote-UDC(II) UHPC premix material, sourced from a Chinese manufacturer, along with a water-reducing admixture. The detailed mixing proportions are presented in Table 2.
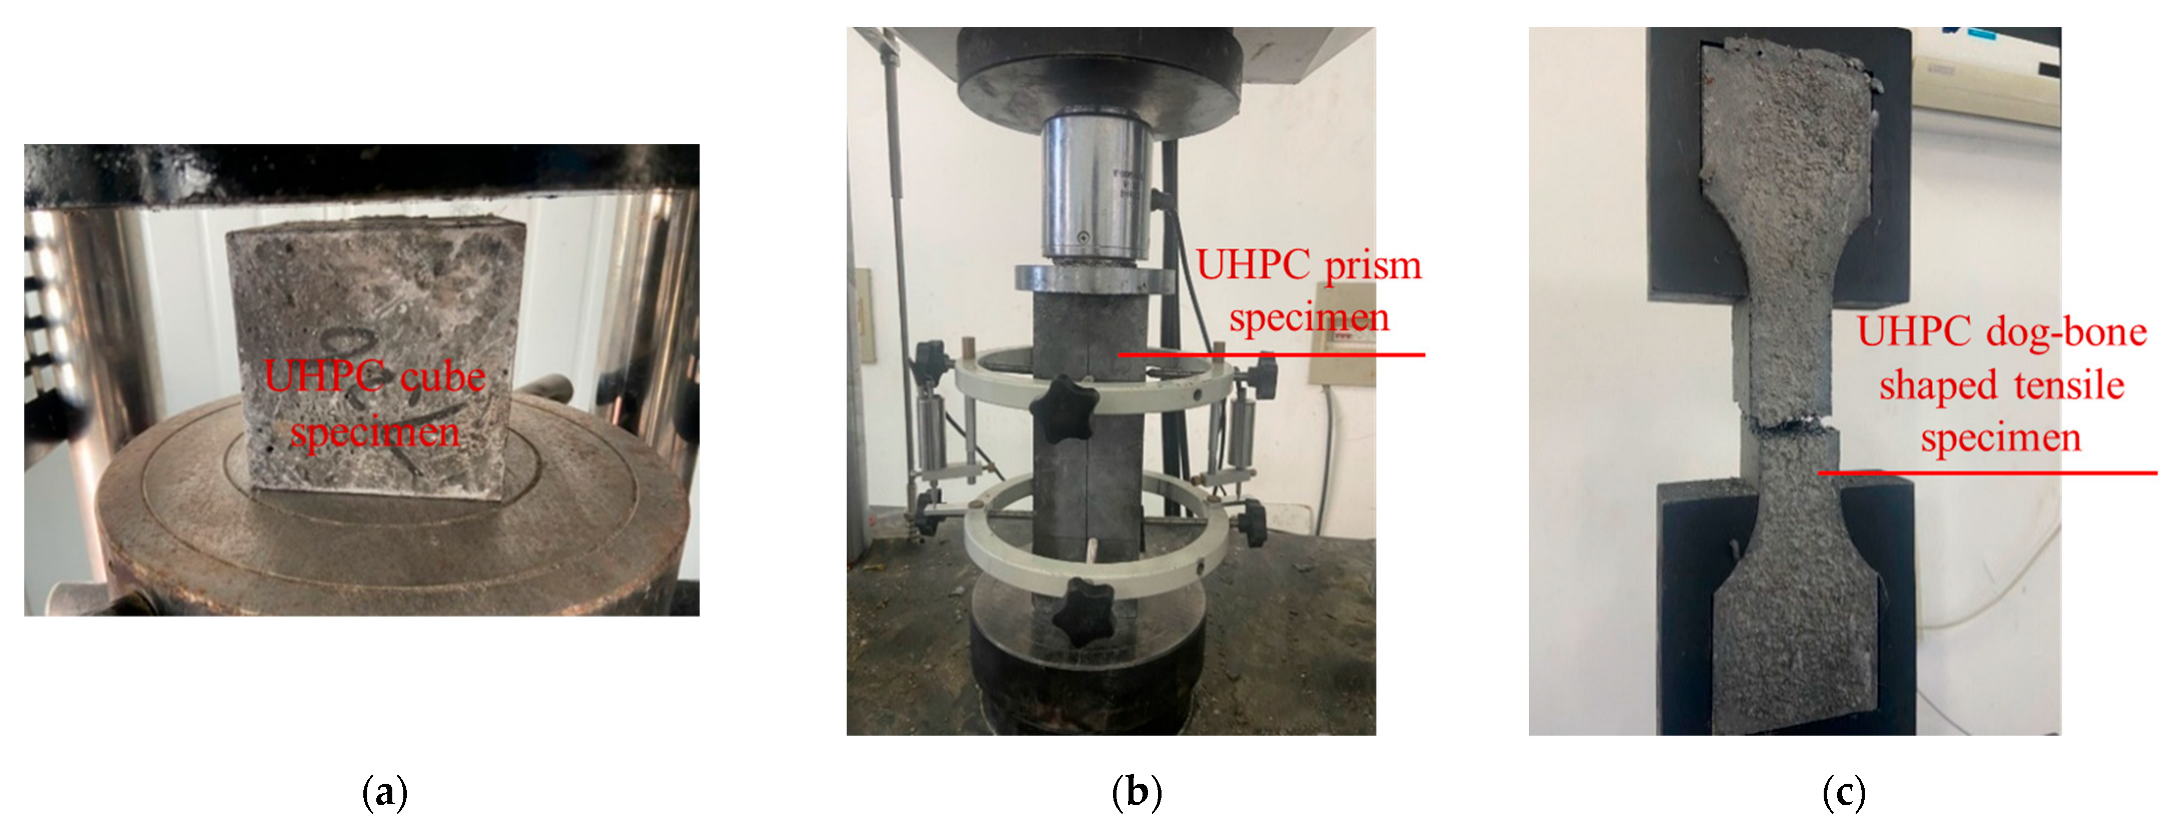
According to the Chinese standard-GB/T 50081-2019 [27], during the pouring process, specimens including 100 mm × 100 mm × 100 mm cube specimens, 100 mm × 100 mm × 300 mm prism specimens, and dog-bone shaped tensile specimens were cast simultaneously. These specimens were subjected to curing conditions identical to those used for the pushing shear test specimens. Subsequently, the cube compressive strength, elastic modulus, and tensile property of the UHPC were measured, respectively, as shown in Figure 7. The results obtained from the material characteristic test are presented in Table 3.

2.2.2. T-Shaped Steel and Rebar

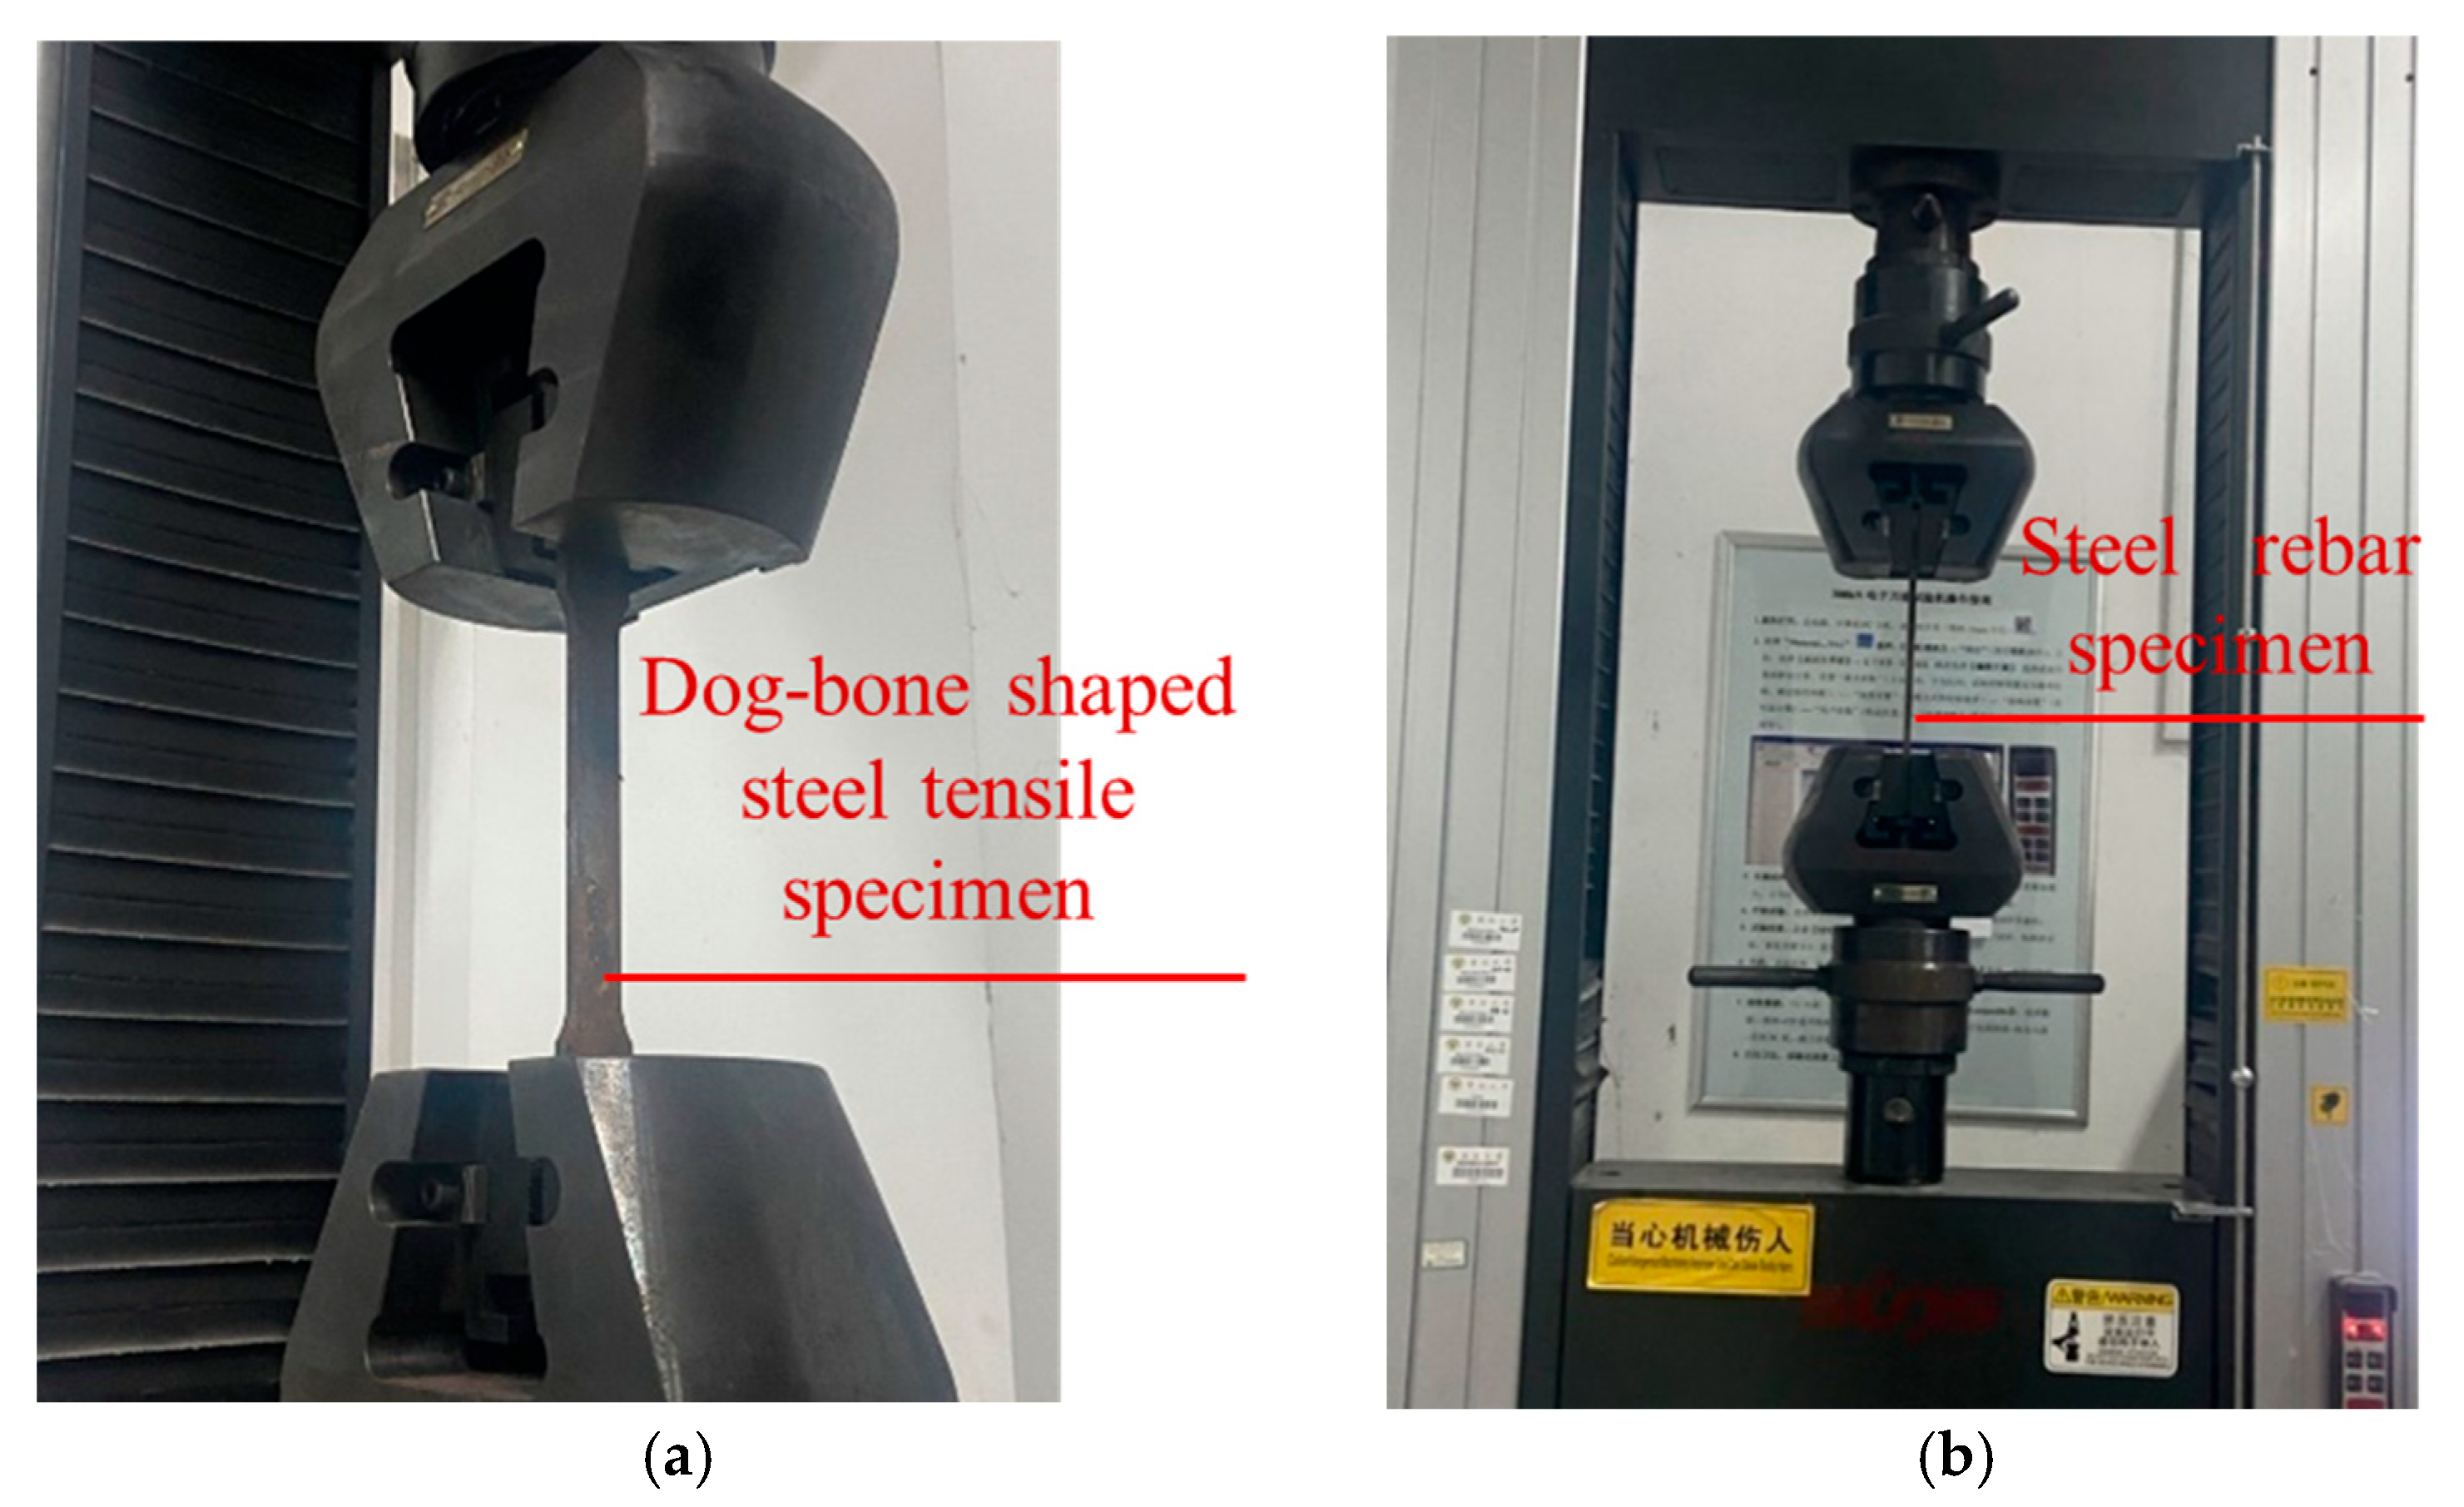
The T-shaped steel utilized in this test was derived from hot-rolled H-shaped steel of Q355B grade through a splitting process. The holes in the T-shaped steel were created using laser cutting technology. The rebars utilized in this test were HRB400 grade hot-rolled ribbed steel bars. In accordance with the Chinese standard-GB/T 228.1-2010 [28], material characteristic tests were performed on the dog-bone shaped tensile specimens which were obtained from the same batch of T-shaped steel and the rebar specimens which were obtained from the same batch of rebars, as shown in Figure 8. The results obtained from the material characteristic test are presented in Table 4.

2.3. Loading Device and Measuring Device

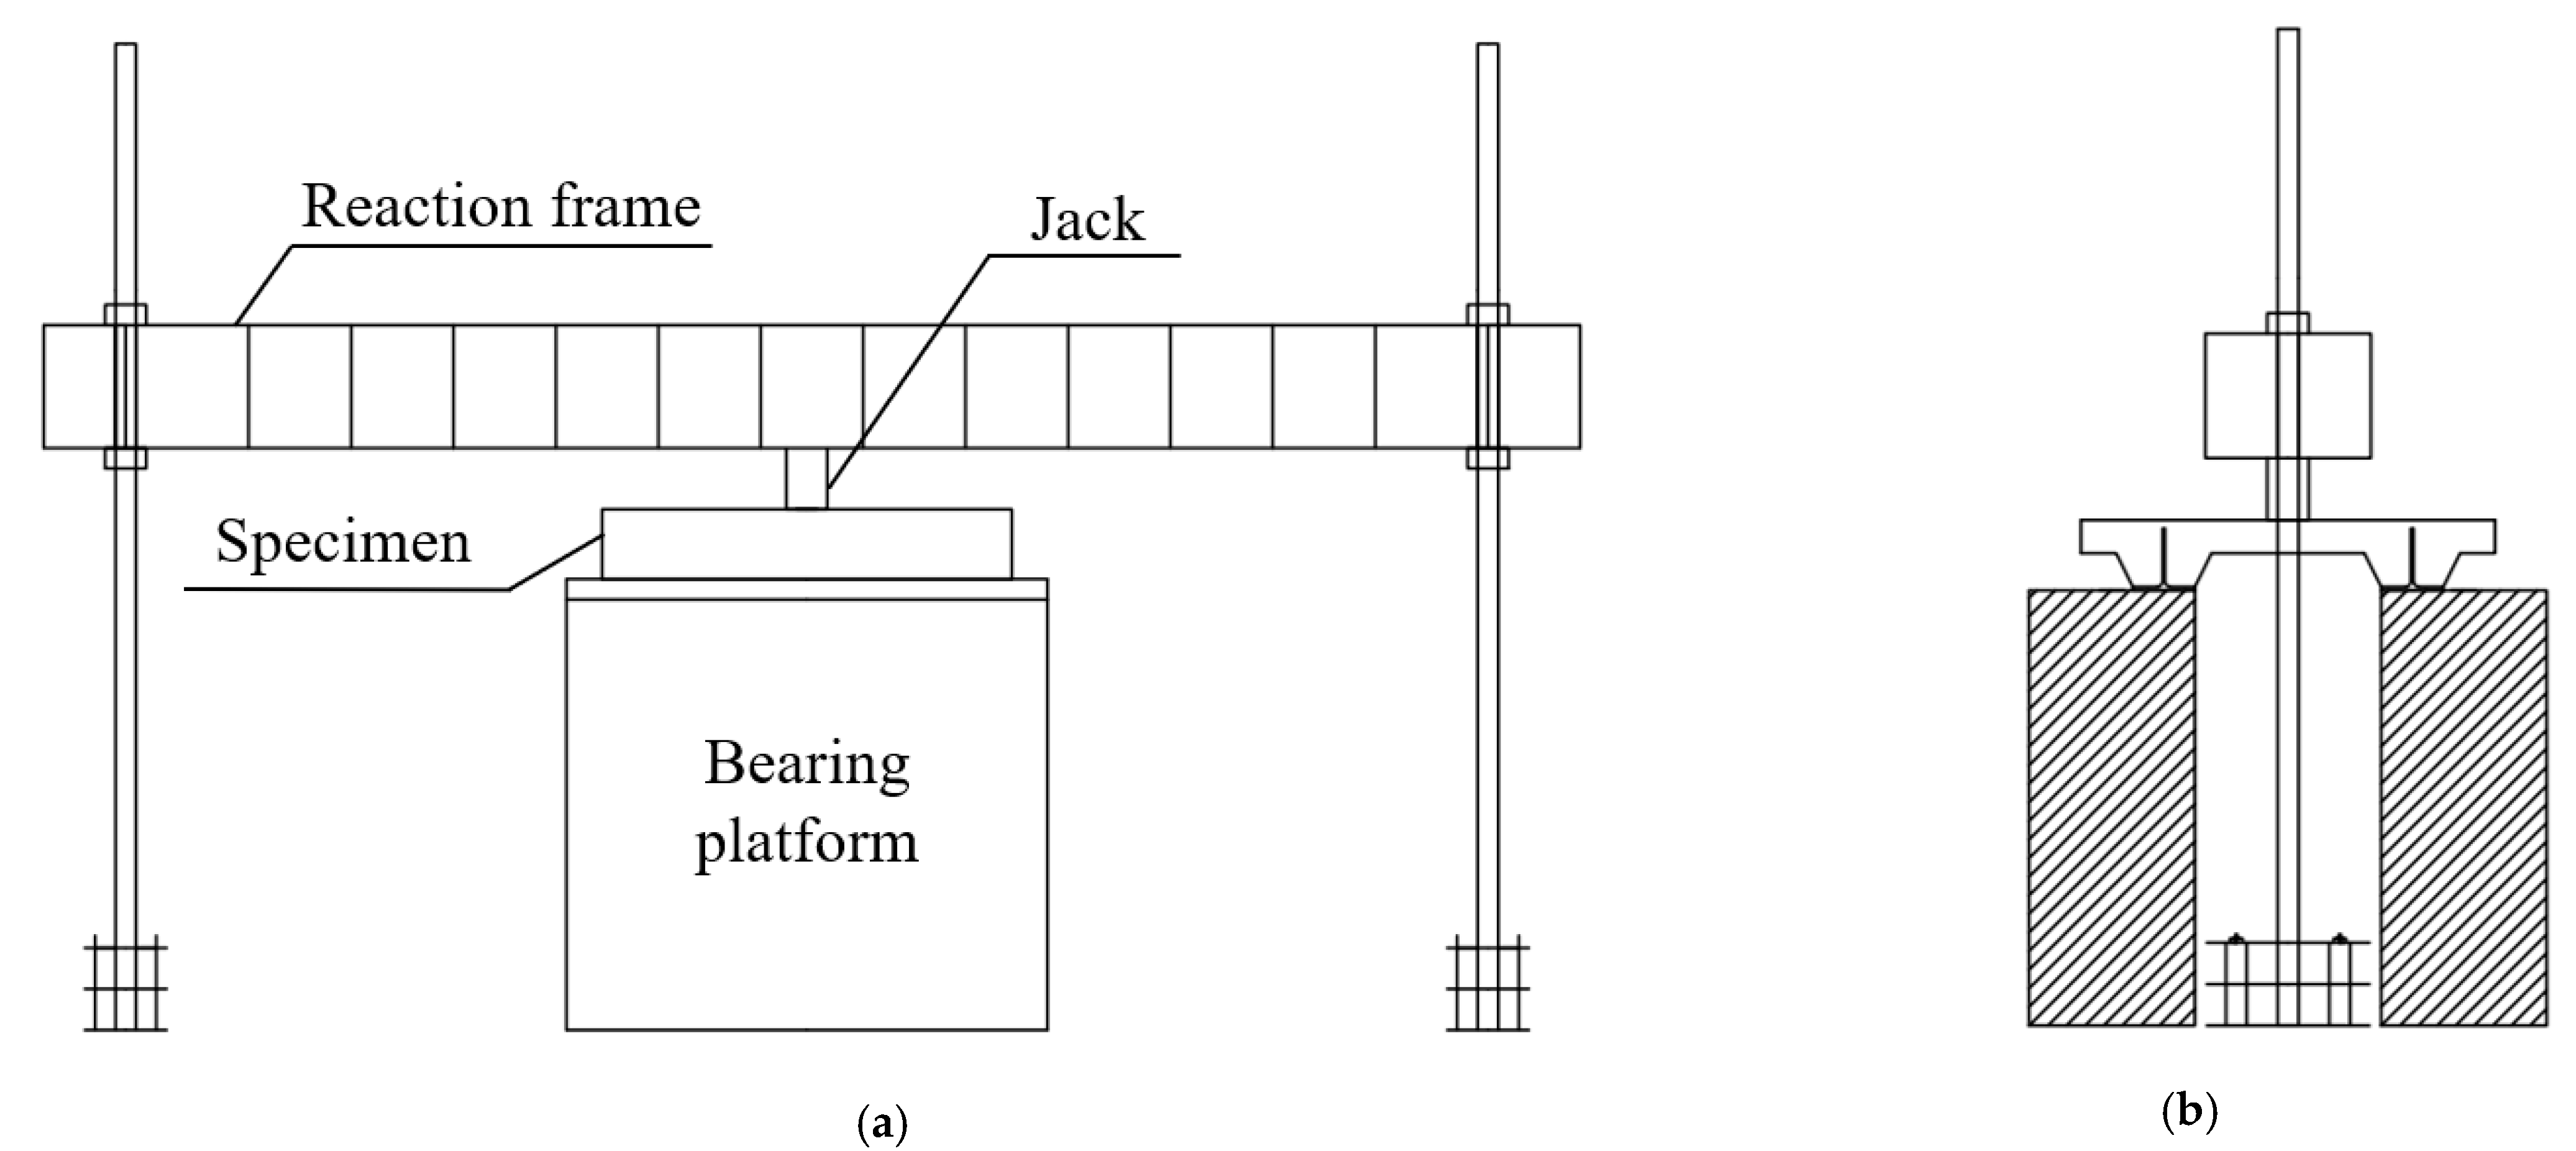
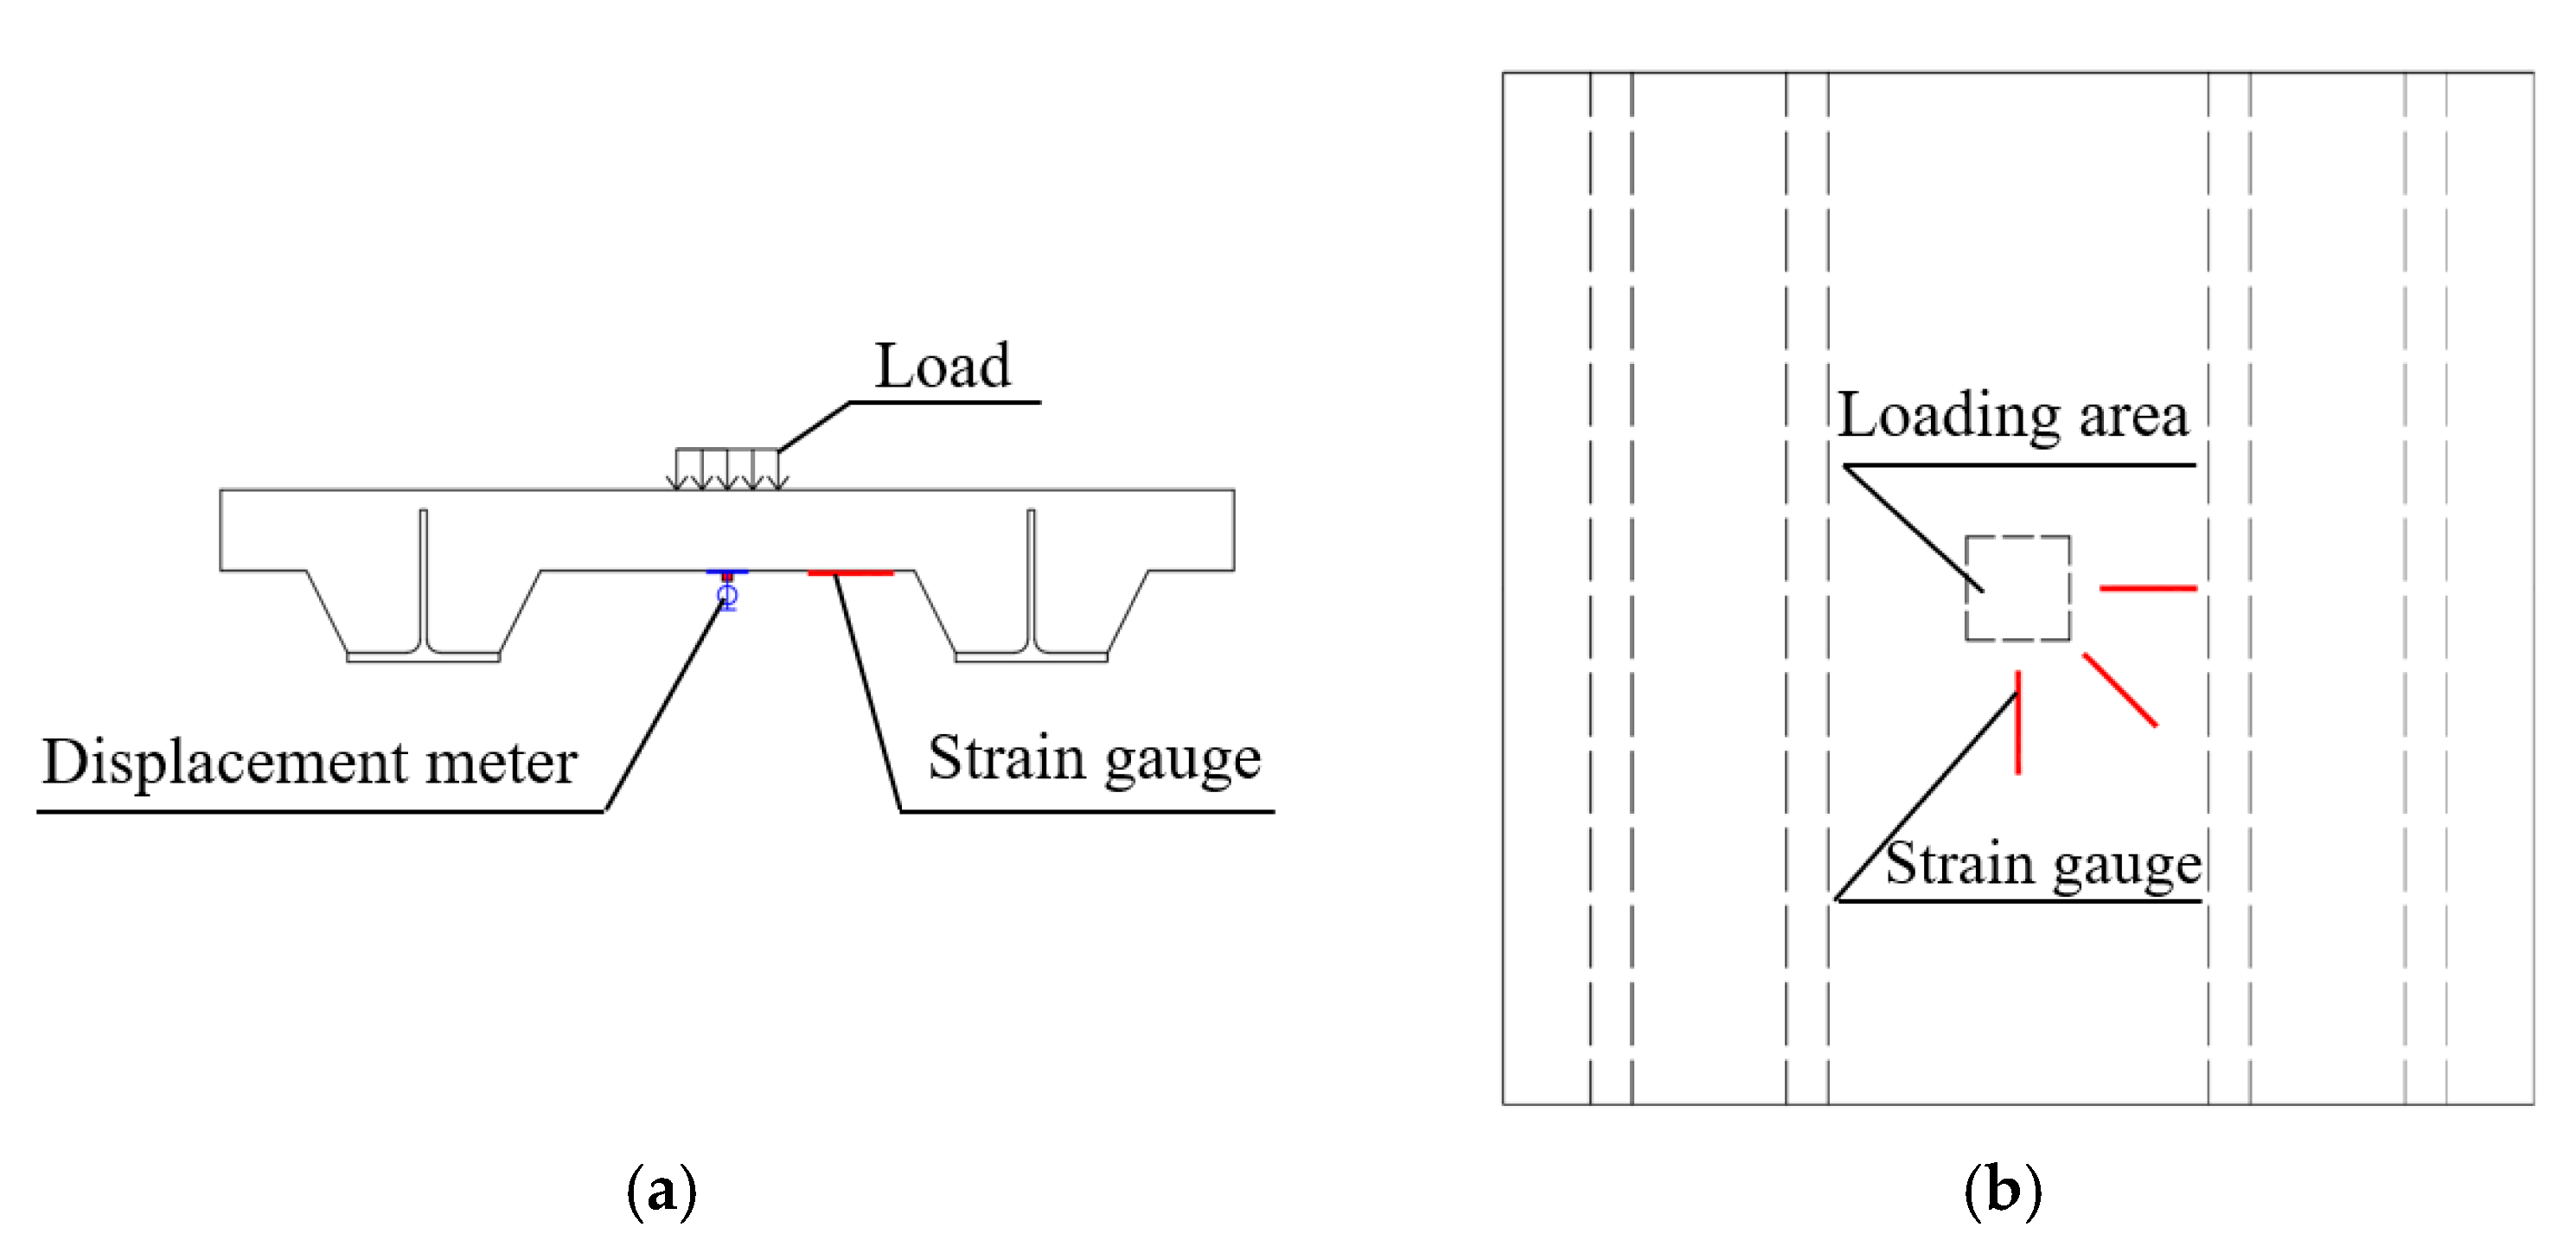
The loading point for the punching shear test of steel grid–UHPC composite bridge decks is located at the central 100 mm × 100 mm area of the deck. The flange of the T-shape steel is simply supported on the supports. The test loading device is illustrated in Figure 9. To facilitate the acquisition of deck displacement and UHPC strain data during the experiment, a displacement meter was installed directly beneath the center of the loading point, and concrete strain gauges were arranged along three orthogonal directions. The specific layout of the measurement points is illustrated in Figure 10.

3. Finite Element Model

3.1. Finite Element Model and Mesh Division

The test results show that under normal service loads, the steel grid–UHPC composite bridge deck featuring perforations in the T-shape steel web section and interlaced through-going reinforcing bars does not experience slippage between the T-shape steel and UHPC components. Thus, when developing the punching shear specimen model, the effect of the T-shape steel web holes is not taken into account. Instead, during the constraint modeling process, the contact surfaces between the T-shape steel and UHPC components are assumed to be fully bonded, and relative slippage is disregarded. This method ensures a more regular structural configuration of the T-shape steel and UHPC components, greatly simplifying the meshing process and reducing the computational time.
The FE modeling and analysis presented in this paper are conducted using ABAQUS 2019 software. A perspective view of the steel grid–UHPC composite bridge deck along with the corresponding FE model is illustrated in Figure 11. The FE model size was determined based on the dimensions of the test specimens. The FE model consists of five components: UHPC, T-shape steel, rebars, support plate, and loading plate. The UHPC, T-shape steel, support plate, and loading plate are modeled using three-dimensional solid element, while the rebars are represented by two-dimensional truss element. Through calculation, it was determined that a grid size of 10 mm for the T-shape steel and UHPC, and a grid size of 20 mm for the rebars, can achieve a high level of computational accuracy.

3.2. Boundary Conditions

In FE model, a square steel loading plate with dimensions of 100 mm × 100 mm × 20 mm is positioned at the center of the punching shear specimen. A tie constraint is applied between the loading plate and the UHPC plate, and the loading is implemented through displacement-controlled loading.
In the initial stage of loading, the specimen is simply supported by two flanges of T-shape steel. As the load gradually increases, the outer flanges of the T-shape steel tilts, causing the specimen to be supported solely by the inner flanges of T-shape steel. To accurately simulate this condition in the FE model, a stiff support plate is introduced beneath the T-shape steel flange. A fixed constraint (U1 = U2 = U3 = UR1 = UR2 = UR3 = 0) is applied to the bottom surface of this support plate. Furthermore, a hard contact interaction is defined between the T-shape steel flange and the support plate, with tangential movement restricted along the contact surface, allowing for normal compressive stress transmission while preventing tensile forces from being transferred. The boundary conditions are illustrated in Figure 12.
Since T-shape steel and UHPC do not experience relative slip under normal service loads, a coupled deformation approach is adopted in the punching shear model, and a tie constraint that excludes slip is employed to define the contact relationship between the T-shape steel and UHPC. Given the higher stiffness of the T-shape steel, its surface is designated as the master contact surface, while the UHPC surface is designated as the slave contact surface. This ensures that UHPC deforms in accordance with the deformation of the T-shape steel.
The rebars are classified into transverse rebars (perpendicular to the T-shape steel) and longitudinal rebars (parallel to the T-shape steel). Given that the excavation holes of the T-shape steel are not taken into account, the transverse rebars are equivalent to being interlaced between the T-shape steel and the UHPC. Therefore, the contact relationship of the transverse rebars is an embedded constraint, and it is embedded throughout the entire model. In contrast, the longitudinal rebars only come into contact with the UHPC. The established contact relationship is also an embedded constraint, but it is only embedded within the UHPC.

3.3. Material Parameters

In this study, the constitutive relationship of UHPC is simulated by using the concrete damage plasticity (CDP) model [29]. In the CDP model, the compressive and tensile strengths of UHPC materials are determined through the mechanical property tests outlined in Section 2.2.1. The poisson’s ratio of UHPC is 0.2. The compressive stress–strain behavior of UHPC is modeled based on the formulation proposed by Shan et al. [30], whereas the tensile stress–strain relationship follows the model introduced by Zhang et al. [31]. The parameters utilized in the plastic failure criterion are as follows: dilation angle is 30°, eccentricity is 0.1, the ratio of the initial equivalent biaxial compressive strength to the initial uniaxial compressive strength is 1.16, The shape parameters of the yield surface in the principal stress plane is 0.667, viscosity parameter is 0.0005 [32].
For steel, the double slash model is adopted. Before reaching the yield strength, the material exhibits a linear relationship between stress and strain, where the slope of the curve represents the elastic modulus. This behavior is consistent with Hooke’s Law. After the stress exceeds the yield strength, the strain continues to increase while the stress increases only slightly. The slope of this region is approximately 0.01 times the elastic modulus.

4. Comparison Between Finite Element Analysis and Experimental Results

4.1. Specimen CQD4

4.1.1. Experimental Phenomenon

Figure 13 illustrates the loading diagram of the punching shear specimen CQD4. At the initial stage of loading, the applied load was relatively low, and no visible cracks were observed. When the load reached 150 kN, minor cracks began to develop along the direction of the T-shape steel in the central region between the two ribs at the bottom plate, as indicated by crack No. 1 in Figure 14. Simultaneously, small cracks also appeared at the interface between the bottom plate and the plate rib near the end of the specimen, as indicated by crack No. 2 in Figure 14.
As the load increased to 200 kN, cracks aligned with the T-shape steel direction emerged in the bottom plate, corresponding to crack No. 3 in Figure 14. Upon reaching 250 kN, additional cracks along the T-shape steel direction formed at the junction between the bottom plate and the plate rib, such as crack No. 4 in Figure 14, which appeared to have propagated from crack No. 2. When the load increased to 300 kN, cracks initiated in the vicinity of the loading area on the top plate of the specimen, propagating along the direction of the T-shaped steel.
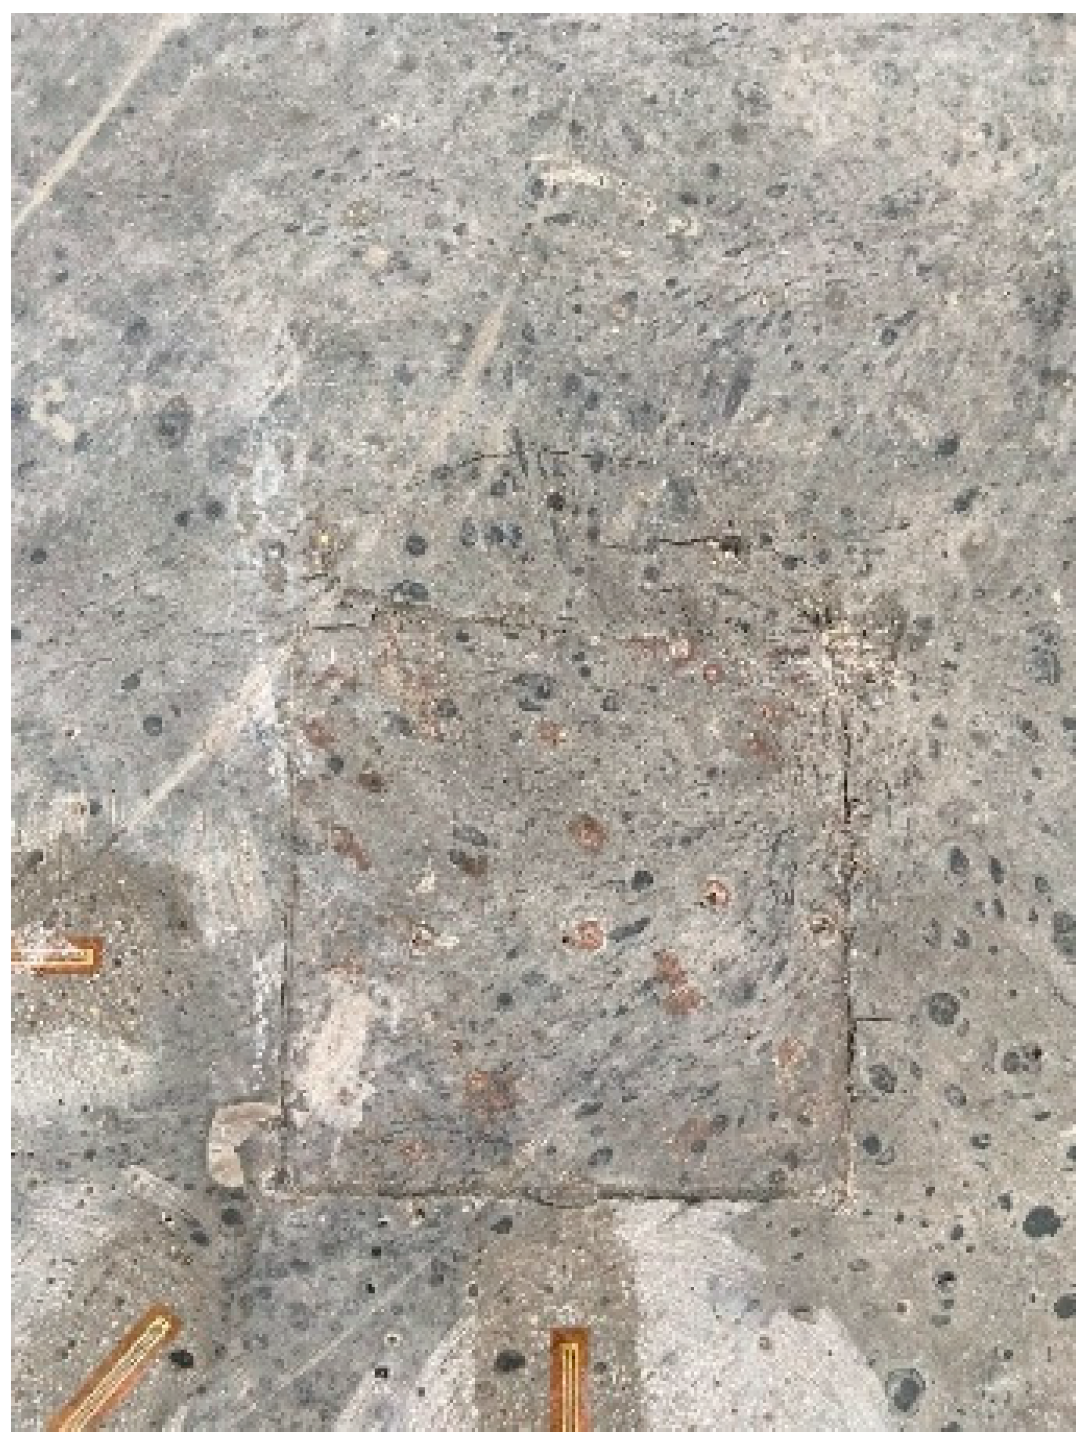
At a load of 420 kN, cracks perpendicular to the T-shape steel direction developed in the central portion of the bottom of the plate rib, as shown by crack No. 5 in Figure 14. By the time the load reached 500 kN, crack No. 1 exhibited significant widening. Finally, when the load increased to 582 kN, the concrete at the loading point on the top surface collapses. Crack No. 5, oriented along the vertical T-shape steel direction, fully penetrated the specimen, and a noticeable downward bulging occurred at the bottom of the plate, indicating a punching shear failure.
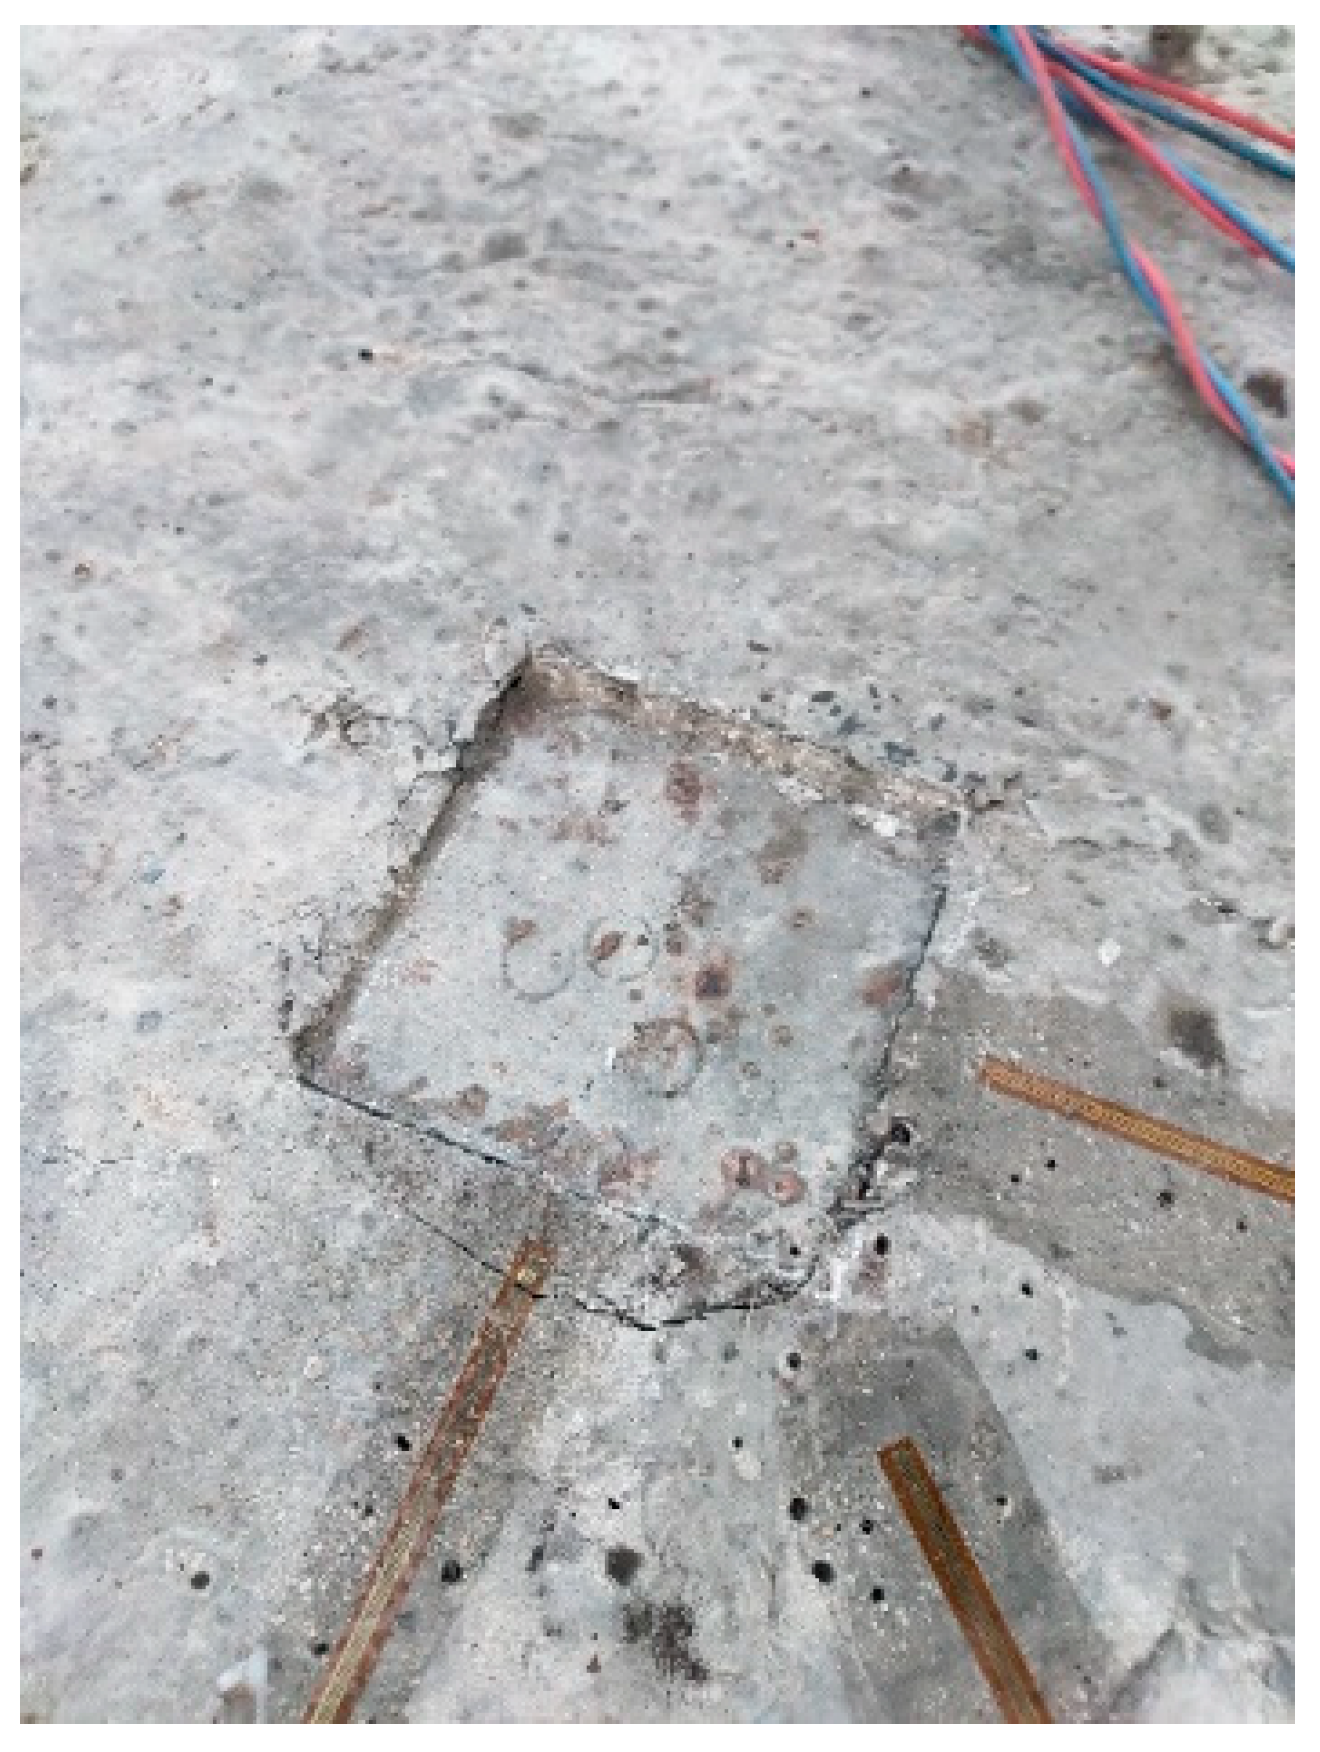
The bottom surface is displayed in Figure 14a, a schematic diagram illustrating the crack patterns of the bottom surface is provided in Figure 14b, and the top surface of the specimen following damage is presented in Figure 15.

4.1.2. Comparison and Analysis

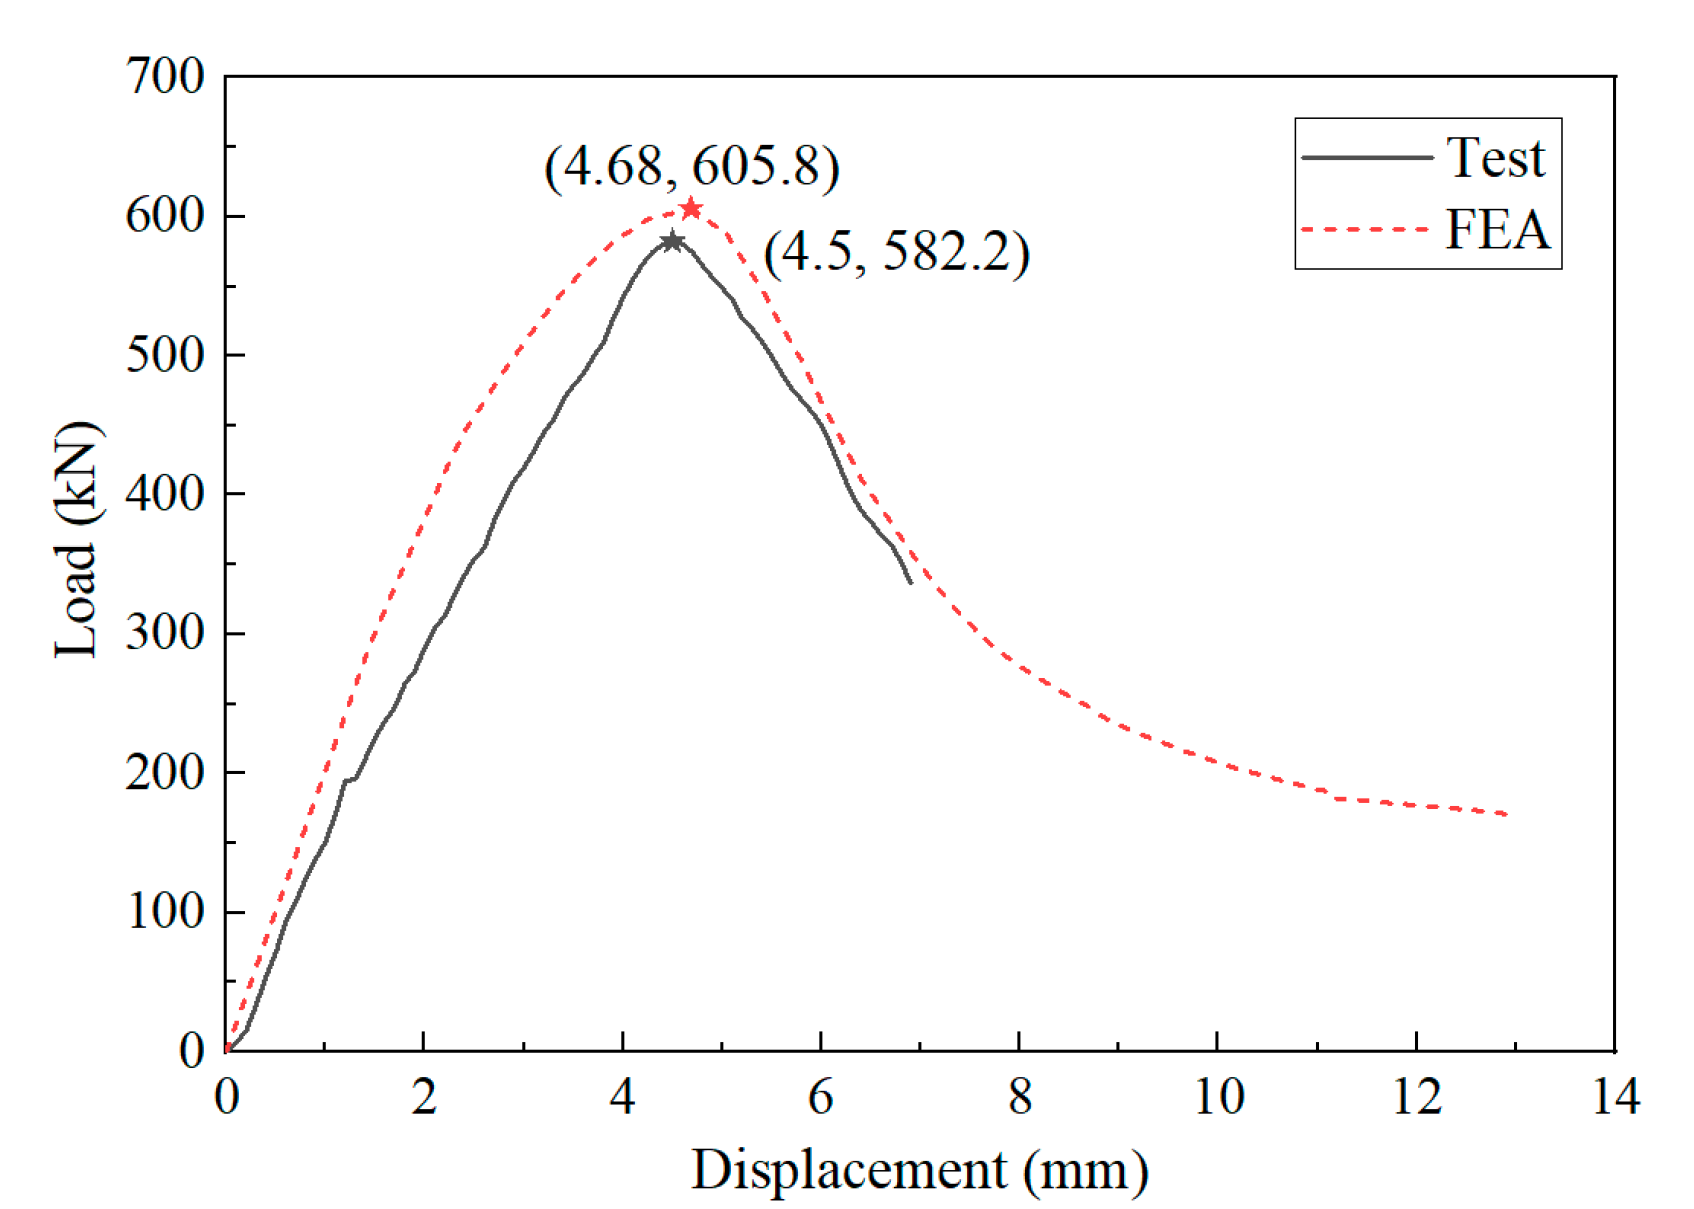
The load–displacement curve for specimen CQD4 is depicted in Figure 16, along with the ultimate load and its corresponding displacement. As illustrated in Figure 16, the ultimate load observed in the test is 582.3 kN, whereas the failure load obtained from the FEA is 605.8 kN. This indicates that the failure load predicted by the FE model is 4.1% higher than the experimentally measured value. In the initial stage of loading, the slopes of the two curves are similar, indicating that the stiffness of the test specimen and the FE model are comparable. As the load gradually increases to approximately 200 kN, the stiffness of the test specimen decreases significantly, whereas the stiffness of the FE model remains relatively unchanged. At this stage, a noticeable divergence begins to appear between the two curves. The possible reason is that, as the load increases, the specimen is supported primarily by the inner flange of the T-shape steel under bending conditions. However, the test support plane is not perfectly level. When slight warping occurs, the inner flange of the T-shape steel is unable to provide full support. Additionally, the spacing between the support points of the test specimen is relatively large. Furthermore, discrepancies between the material properties and contact definitions in the FE model and those in the actual experiment may lead to divergence in stiffness between the two. The displacement of the test specimen at the ultimate load is 4.5 mm, whereas the displacement corresponding to the ultimate load of the FE model is 4.68 mm. The displacements at the ultimate load are very similar, suggesting that the difference in overall stiffness between the two curves is not substantial. After failure, both specimens exhibit a comparable rate of bearing capacity degradation. After the specimen is damaged, it is still capable of sustaining a certain level of load, indicating ductile failure behavior. A total of 15 data points is uniformly selected within the displacement range of 0 to 7 mm for analysis of the two curves. The root mean square error (RMSE) between the two curves is approximately 55 kN, with a correlation coefficient of 0.985. The relatively high RMSE value can be primarily attributed to the difference in stiffness observed between the two curves within the force range of 200 to 600 kN. The FEA results, while accounting for potential errors, demonstrate a reasonable level of reliability.
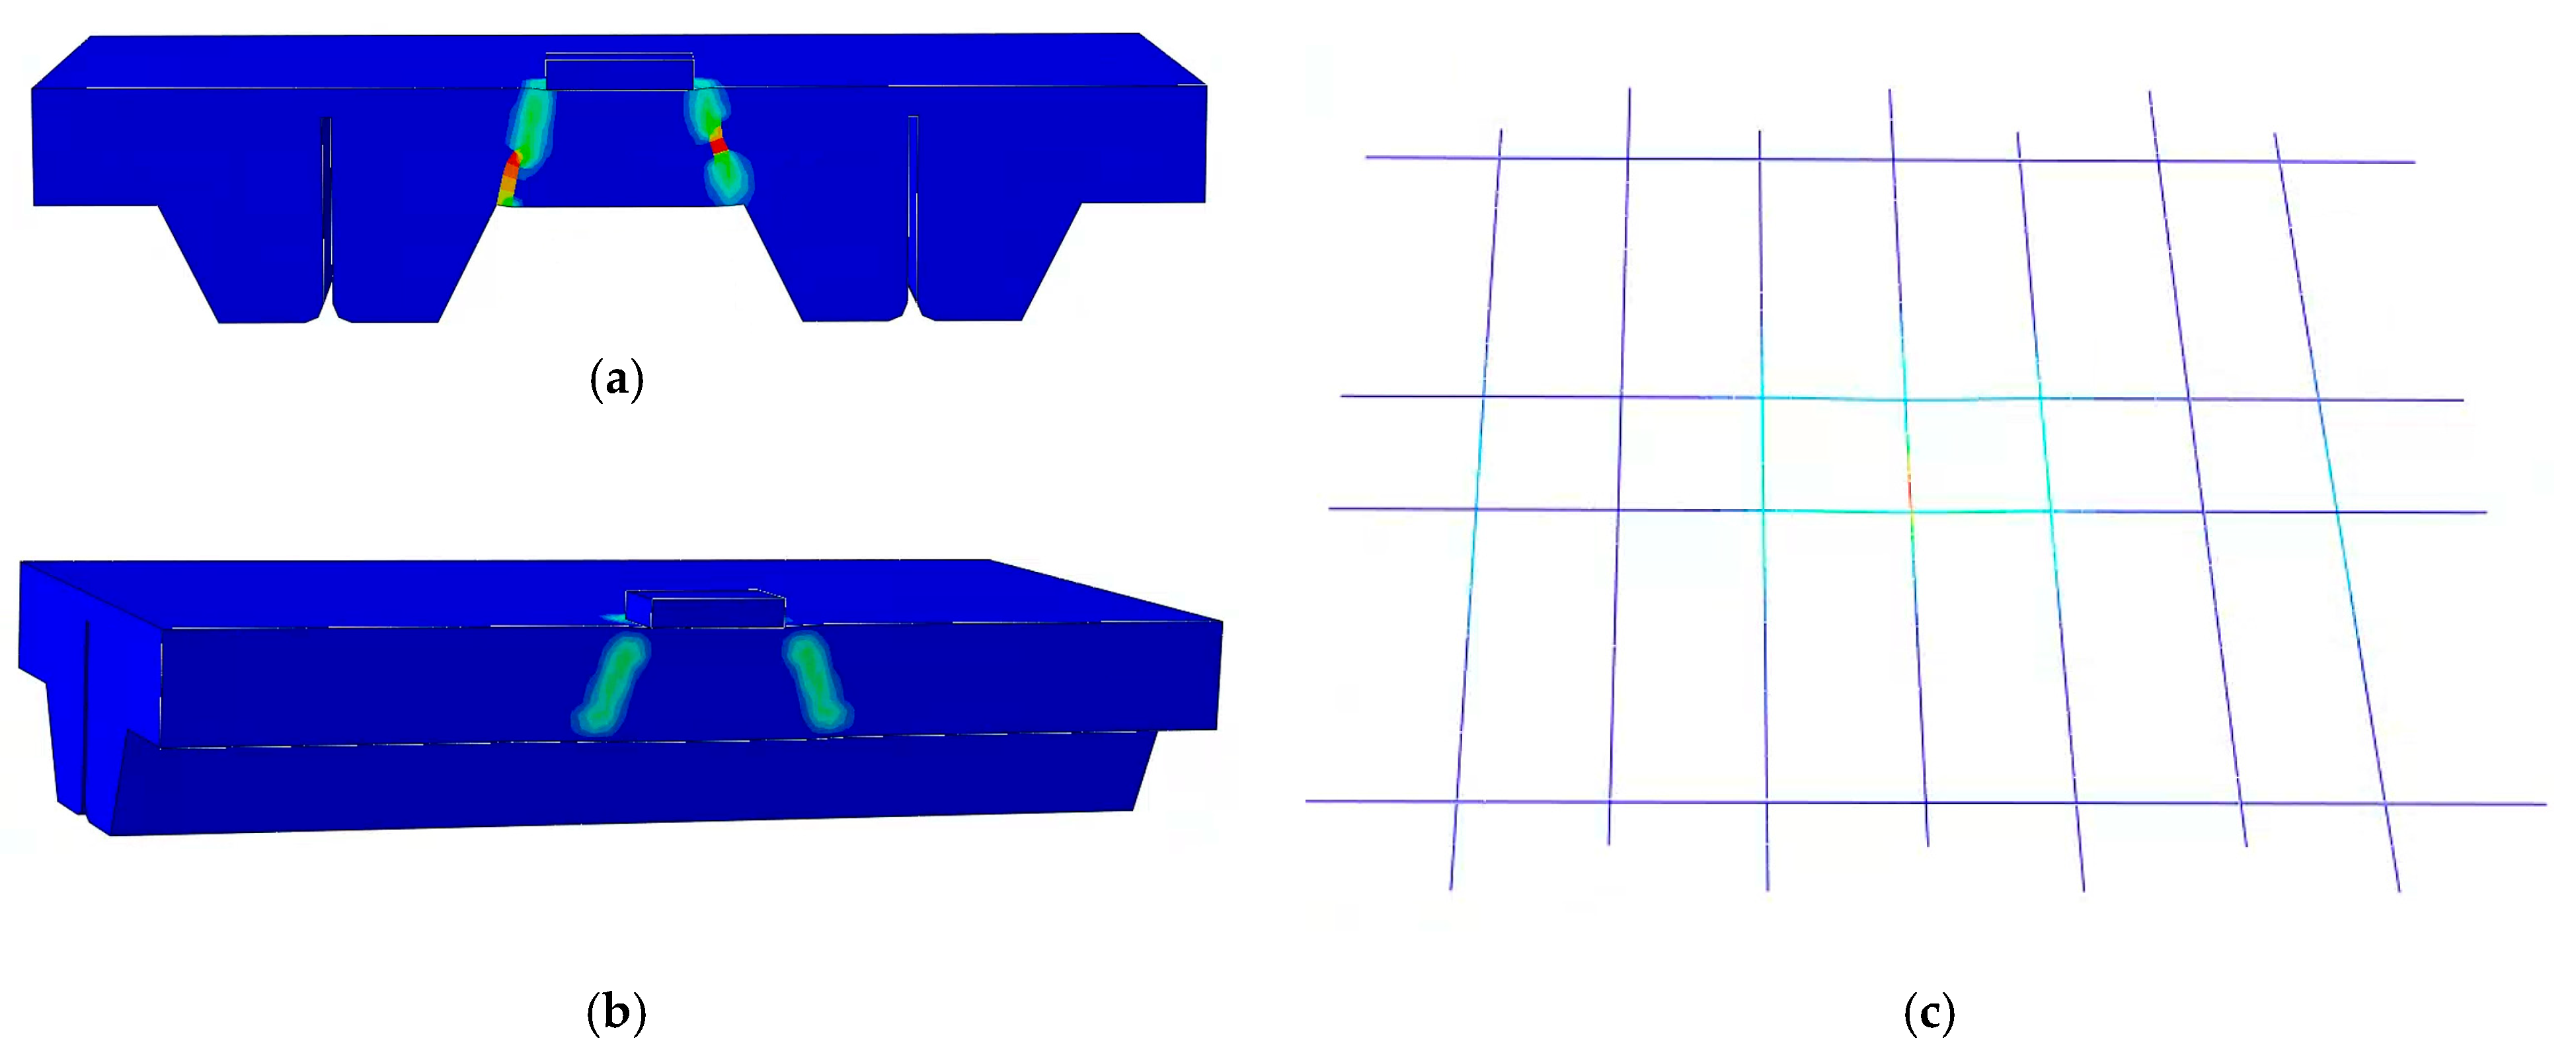
The FEA results indicate that the strain cloud diagrams of the UHPC horizontal cross-section (perpendicular to the T-shape steel direction) and UHPC longitudinal cross-section (along the T-shape steel direction) at the point of specimen CQD4 failure, as well as the strain distribution in the reinforcing bars, are illustrated in Figure 17. As observed from the UHPC cross-section diagram, in the direction perpendicular to the T-shape steel, the failure surface propagates from the edge of the loading point to the variable cross-section, exhibiting a relatively small diffusion angle, with a tangent value of approximately 3/8. In contrast, the diffusion angle along the direction of the T-shape steel is somewhat larger, with a tangent value of approximately 3/4. The strain experienced by the UHPC along the failure surface exceeds its ultimate tensile strain, leading to tensile failure of the UHPC. The difference in diffusion angles in the perpendicular direction of the T-shape steel and along the T-shape steel can be attributed to the narrow spacing between the two adjacent T-shape steel components and the relatively greater plate thickness in the vicinity of the T-shape steel. Consequently, failure tends to initiate at the relatively weaker variable cross-section, preventing the formation of a symmetrical failure platform in both horizontal and perpendicular directions. The strain cloud diagram of the rebars indicates that the maximum stress and strain occur at the loading point, with a peak stress value of 128.4 Mpa, which remains significantly below the tensile strength limit of the rebars. The failure mode of specimen CQD4 is characterized by the tensile strain of UHPC along the load diffusion surface exceeding its ultimate tensile capacity under loading, leading to cracking of the UHPC and subsequent punching shear failure of the specimen.

4.2. Specimen CQD6

4.2.1. Experimental Phenomenon

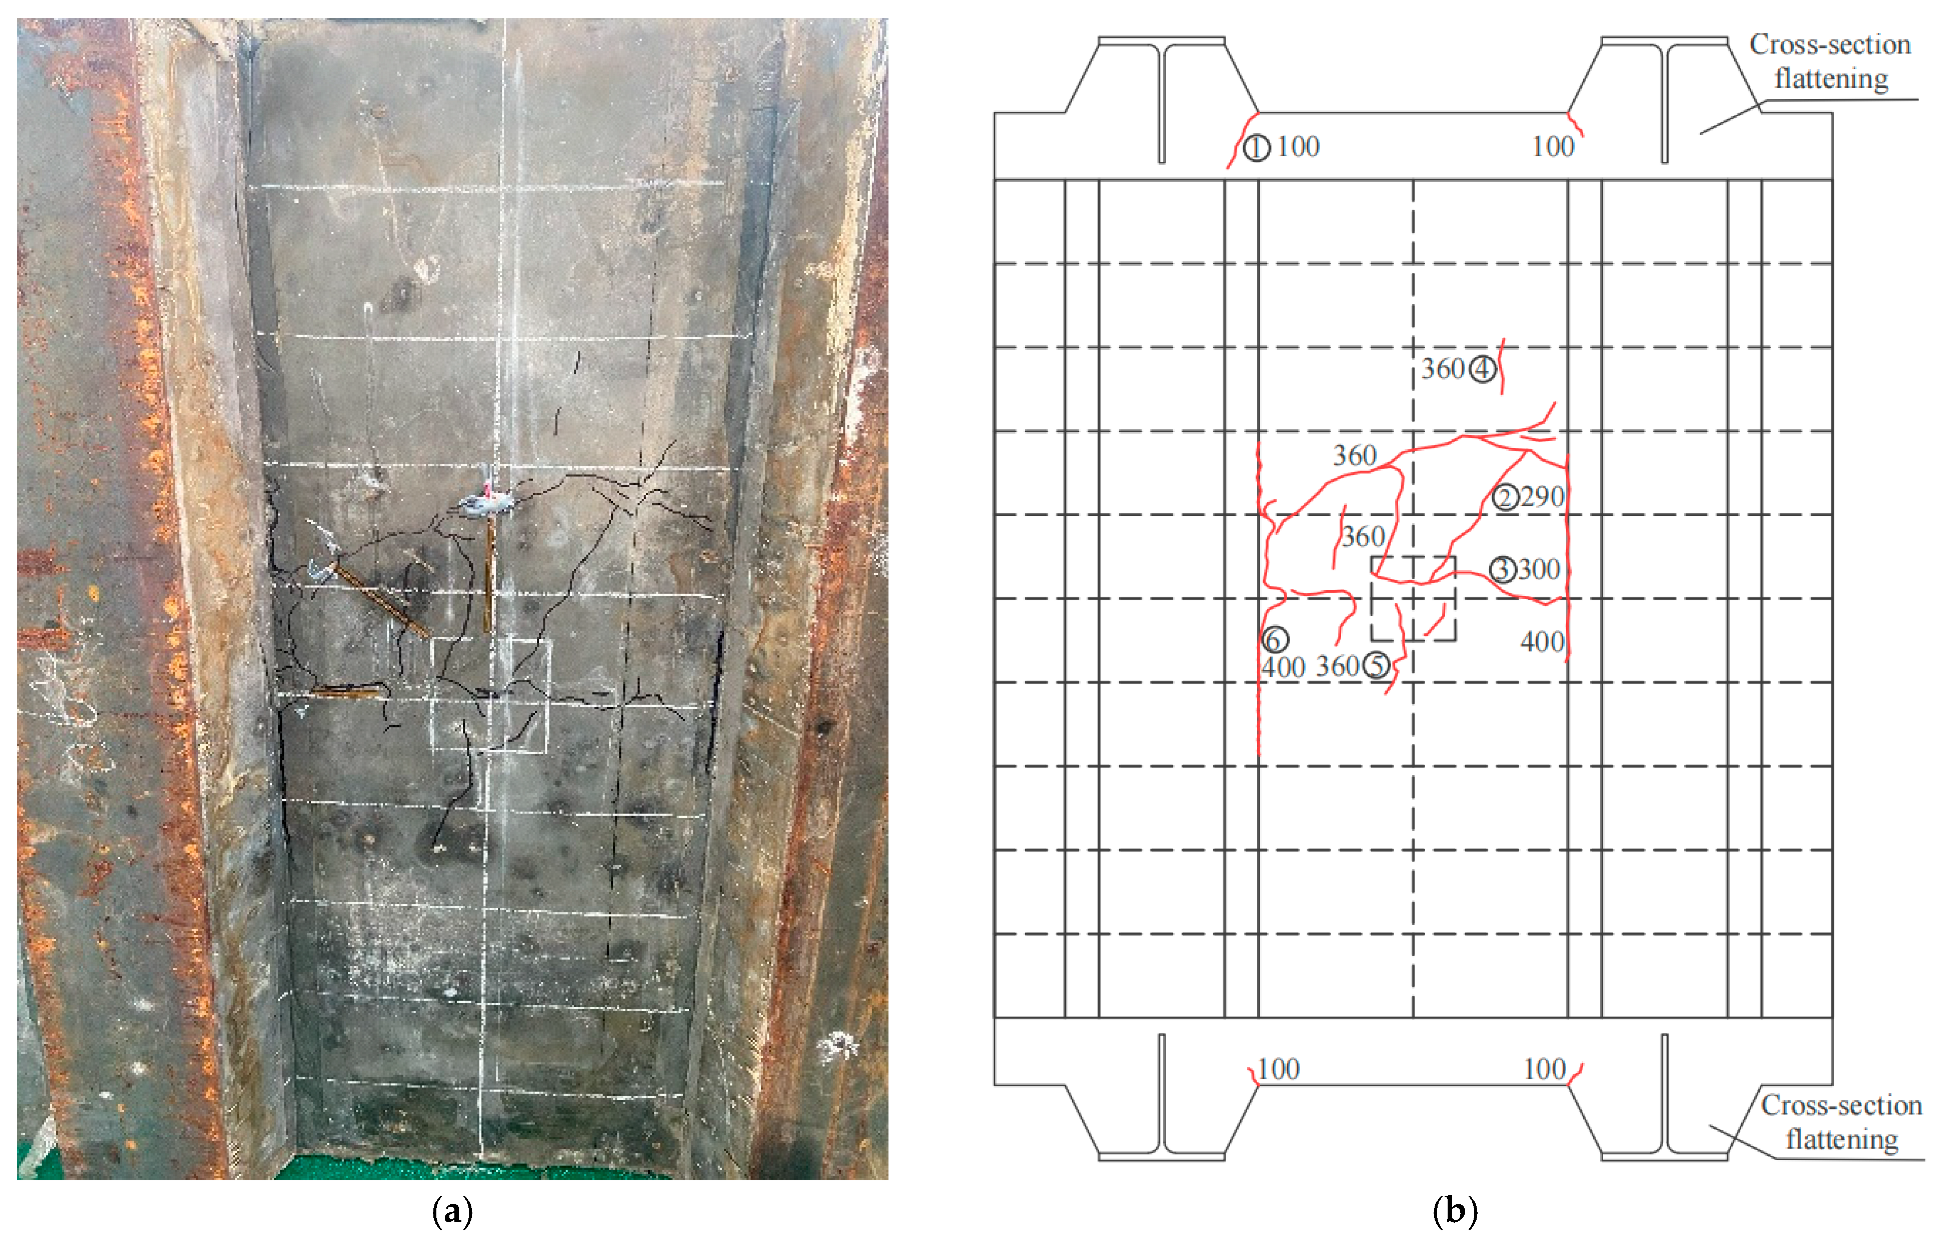
Figure 18 illustrates the loading diagram of the punching shear specimen CQD6. At the initial stage of loading, the applied load was relatively low, and no visible cracks were observed. When the load was increased to 100 kN, a minor crack initiated at the junction between the concrete bottom plate and the plate rib at the end of the specimen, as indicated by Crack No. 1 in Figure 19. Upon increasing the load to 290 kN, a second crack commenced at the location directly beneath the loading center and propagated obliquely outward along the bottom surface of the plate, as illustrated by Crack No. 2 in Figure 19.
When the load increased to 300 kN, the No. 2 crack widened, and a new crack emerged in the direction perpendicular to the T-shape steel, as illustrated by the No. 3 crack in Figure 19. Upon increasing the load to 360 kN, multiple cracks developed along the T-shape steel direction at the bottom of the plate, as indicated by the No. 4 and No. 5 cracks in Figure 19. At a load level of 400 kN, noticeable cracking occurred at the junction between the bottom plate and the central plate rib of the T-shape steel, as represented by the No. 6 crack in Figure 19. Finally, when the load reached 429 kN, a rapid increase in deflection was observed, followed by a reduction in load and significant settlement near the loading point, ultimately leading to a clear punching shear failure of the specimen CQD6.
The bottom surface is displayed in Figure 19a, a schematic diagram illustrating the crack patterns of the bottom surface is provided in Figure 19b, and the top surface of the specimen following damage is presented in Figure 20.

4.2.2. Comparison and Analysis

The load–displacement curve for specimen CQD6 is depicted in Figure 21, along with the ultimate load and its corresponding displacement. As illustrated in Figure 21, the ultimate load observed in the test is 429.8 kN, whereas the failure load obtained from the FEA is 453.2 kN. This indicates that the failure load predicted by the FE model is 5.4% higher than the experimentally measured value. In the initial stage of loading, the slopes of the two curves are similar, indicating that the stiffness of the test specimen and the FE model are comparable. As the load gradually increases to approximately 150 kN, the stiffness of the test specimen decreases significantly, whereas the stiffness of the FE model remains relatively unchanged. At this stage, a noticeable divergence begins to appear between the two curves. The possible reason is that, as the load increases, the specimen is supported primarily by the inner flange edge of the T-shape steel under bending conditions. However, the test support plane is not perfectly level. When slight warping occurs, the inner flange edge of the T-shape steel is unable to provide full support. Additionally, the spacing between the support points of the test specimen is relatively large. Furthermore, discrepancies between the material properties and contact definitions in the FE model and those in the actual experiment may lead to divergence in stiffness between the two. The displacement of the test specimen at the ultimate load is 4.65 mm, whereas the displacement corresponding to the ultimate load of the FE model is 4.69 mm. The displacements at the ultimate load are very similar, suggesting that the difference in overall stiffness between the two curves is not substantial. After failure, both specimens exhibit a comparable rate of bearing capacity degradation. After the specimen is damaged, it is still capable of sustaining a certain level of load, indicating ductile failure behavior. A total of 13 data points is uniformly selected within the displacement range of 0 to 6 mm for analysis of the two curves. The RMSE between the two curves is approximately 45 kN, with a correlation coefficient of 0.993. The relatively high RMSE value can be primarily attributed to the difference in stiffness observed between the two curves within the force range of 150 to 450 kN. The FEA results, while accounting for potential errors, demonstrate a reasonable level of reliability.
The FEA results indicate that the strain cloud diagrams of the UHPC horizontal cross-section (perpendicular to the T-shape steel direction) and UHPC longitudinal cross-section (along the T-shape steel direction) at the point of specimen CQD6 failure, as well as the strain distribution in the reinforcing bars, are illustrated in Figure 22. From the cross-sectional diagram, it is evident that in the direction of the perpendicular T-shape steel, the damaged concrete area has not extended to the variable cross-section region. The tangent value of the diffusion angle is approximately 3/4, and at this point, the tensile strain of the UHPC has exceeded its ultimate tensile strain. Furthermore, along the direction of the T-shape steel, the diffusion angle remains consistent with that observed in the perpendicular direction, with a tangent value of approximately 3/4, and the tensile strain of the UHPC likewise surpasses its ultimate tensile strain. The strain cloud diagram of the rebars indicates that the maximum stress and strain occur at the loading point, with a peak stress value of 130.5 Mpa, which remains significantly below the tensile strength limit of the rebars. The failure mode of specimen CQD6 is characterized by the tensile strain of UHPC along the load diffusion surface exceeding its ultimate tensile capacity under loading, leading to cracking of the UHPC and subsequent punching shear failure of the specimen.

5. Parameter Analysis

Given that the FE simulation results of the steel grid–UHPC composite bridge deck system align closely with the experimental data, the same modeling approach has been adopted to conduct further parametric studies. Key parameters influencing the punching shear capacity, specifically, the width and thickness of the UHPC plate have been varied to generate additional FE models for punching shear analysis. It is important to note that the current configuration of the steel grid–UHPC composite bridge deck shows relatively low steel rebar stress, as depicted in Figure 17 and Figure 22. Thus, the rebar layout will not be regarded as an analytical parameter in the present analysis. Additionally, the punching shear capacity formulas specified in ACI 318-14 [17], CSA A23.3-14 [18], and IS456-2000 [19] also do not consider the effect of the reinforcement ratio.
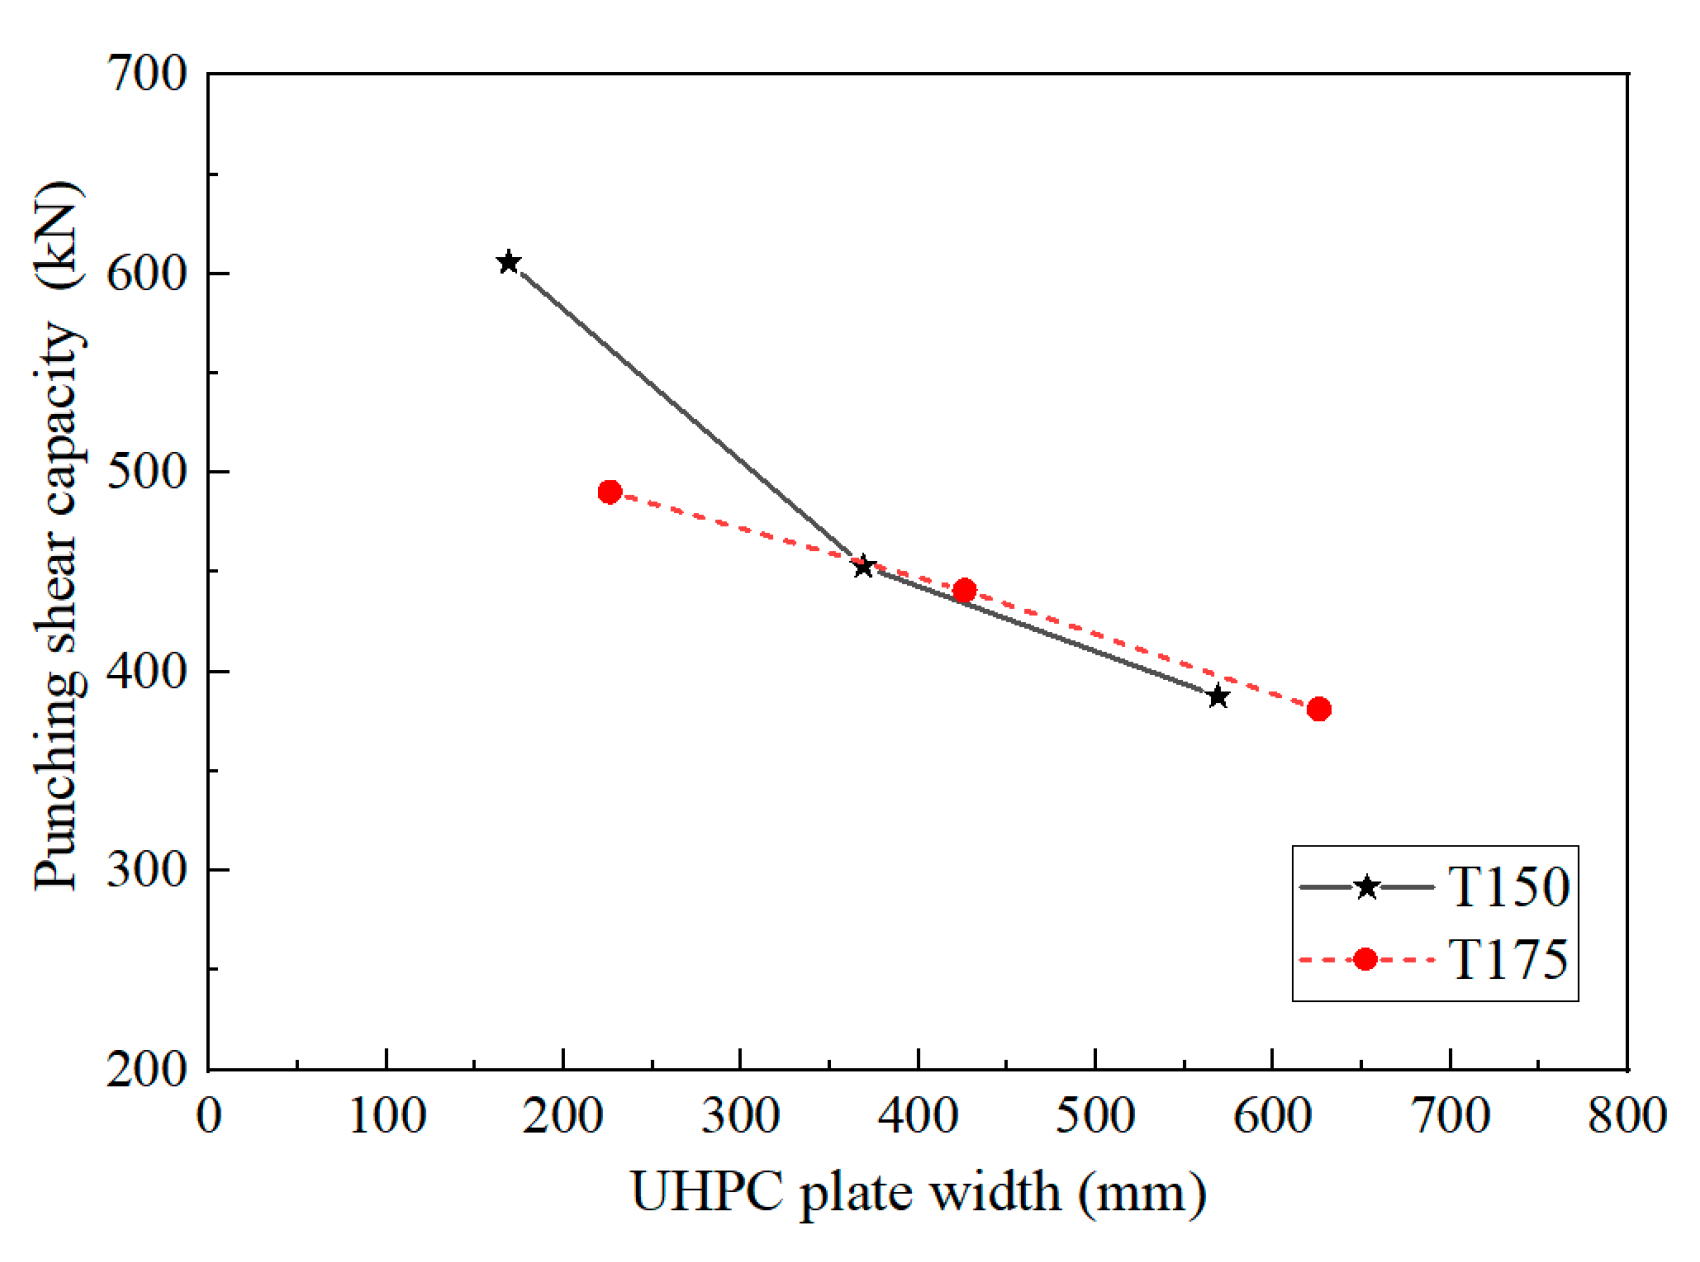
Detailed parameter configurations and punching shear capacity obtained from FEA are summarized in Table 5. In Table 5, the FE models are named according to the following principle: T-shape steel type-UHPC plate width- UHPC plate thickness. The punching shear capacity is determined using FEA. The failure mode pertains to the punching shear failure mode of the steel grid–UHPC composite bridge deck. Section 5.1 will present detailed explanations of both the conventional and unconventional failure modes.

5.1. UHPC Plate Width

Figure 23 presents a comparative analysis of punching shear capacity among specimens with varying UHPC plate width. As illustrated in Figure 23, for specimens fabricated using T175 steel, the punching shear capacity decreases in an approximately linear manner with increasing UHPC plate width. Specifically, when the UHPC plate width increases by 200 mm, the bearing capacity decreases by approximately 50 kN to 60 kN. In contrast, for specimens utilizing T150 steel, the bearing capacity of specimen T150W169T80 (CQD4) is 152.6 kN higher than that of specimen T150W369T80 (CQD6), representing a difference of 33.7%. This is due to the difference in punching shear failure modes between specimen T150W169T80 (CQD4) and specimen T150W369T80 (CQD6).
For the steel grid–UHPC composite bridge deck, which incorporates T-shape steel sections, specimens with varying UHPC plate widths may exhibit two distinct punching shear failure modes. When the UHPC plate width is relatively small, the load diffuses to the T-shape steel, a behavior defined as the unconventional punching shear failure mode, as illustrated in Figure 24a. When the steel grid–UHPC composite bridge deck experiences unconventional failure mode, cracks spread into the UHPC layer on the T-shape steel. Specimen T150W169T80 (CQD4) demonstrated an unconventional failure mode, and the crack distribution on its bottom plate illustrated in Figure 14. Specimen T150W169T80 (CQD4) exhibited a penetrated crack, as shown by crack No. 5 in Figure 14.
In contrast, when the width of the UHPC plate is relatively large, the load is distributed across the UHPC plate located between the two T-shape steel components, and does not effectively diffuse to the T-shaped steel. This mechanism is termed the conventional punching shear failure mode, as depicted in Figure 24b. When the steel grid–UHPC composite bridge deck experiences conventional failure mode, cracks are primarily localized the UHPC bottom plate near the loading zone. Specimen T150W369T80 (CQD6) demonstrated a conventional failure mode, and the crack distribution on its bottom plate illustrated in Figure 19.
As illustrated in Figure 17, specimen T150W169T80 (CQD4) displayed a highly unconventional punching shear failure mode, in contrast to the conventional failure mode observed in specimen T150W369T80 (CQD6), as shown in Figure 22. For the same UHPC plate thickness, different punching shear failure modes significantly influence the punching shear capacity of steel grid–UHPC composite bridge decks. The unconventional failure mode exhibits a higher punching shear capacity.

5.2. UHPC Plate Thickness

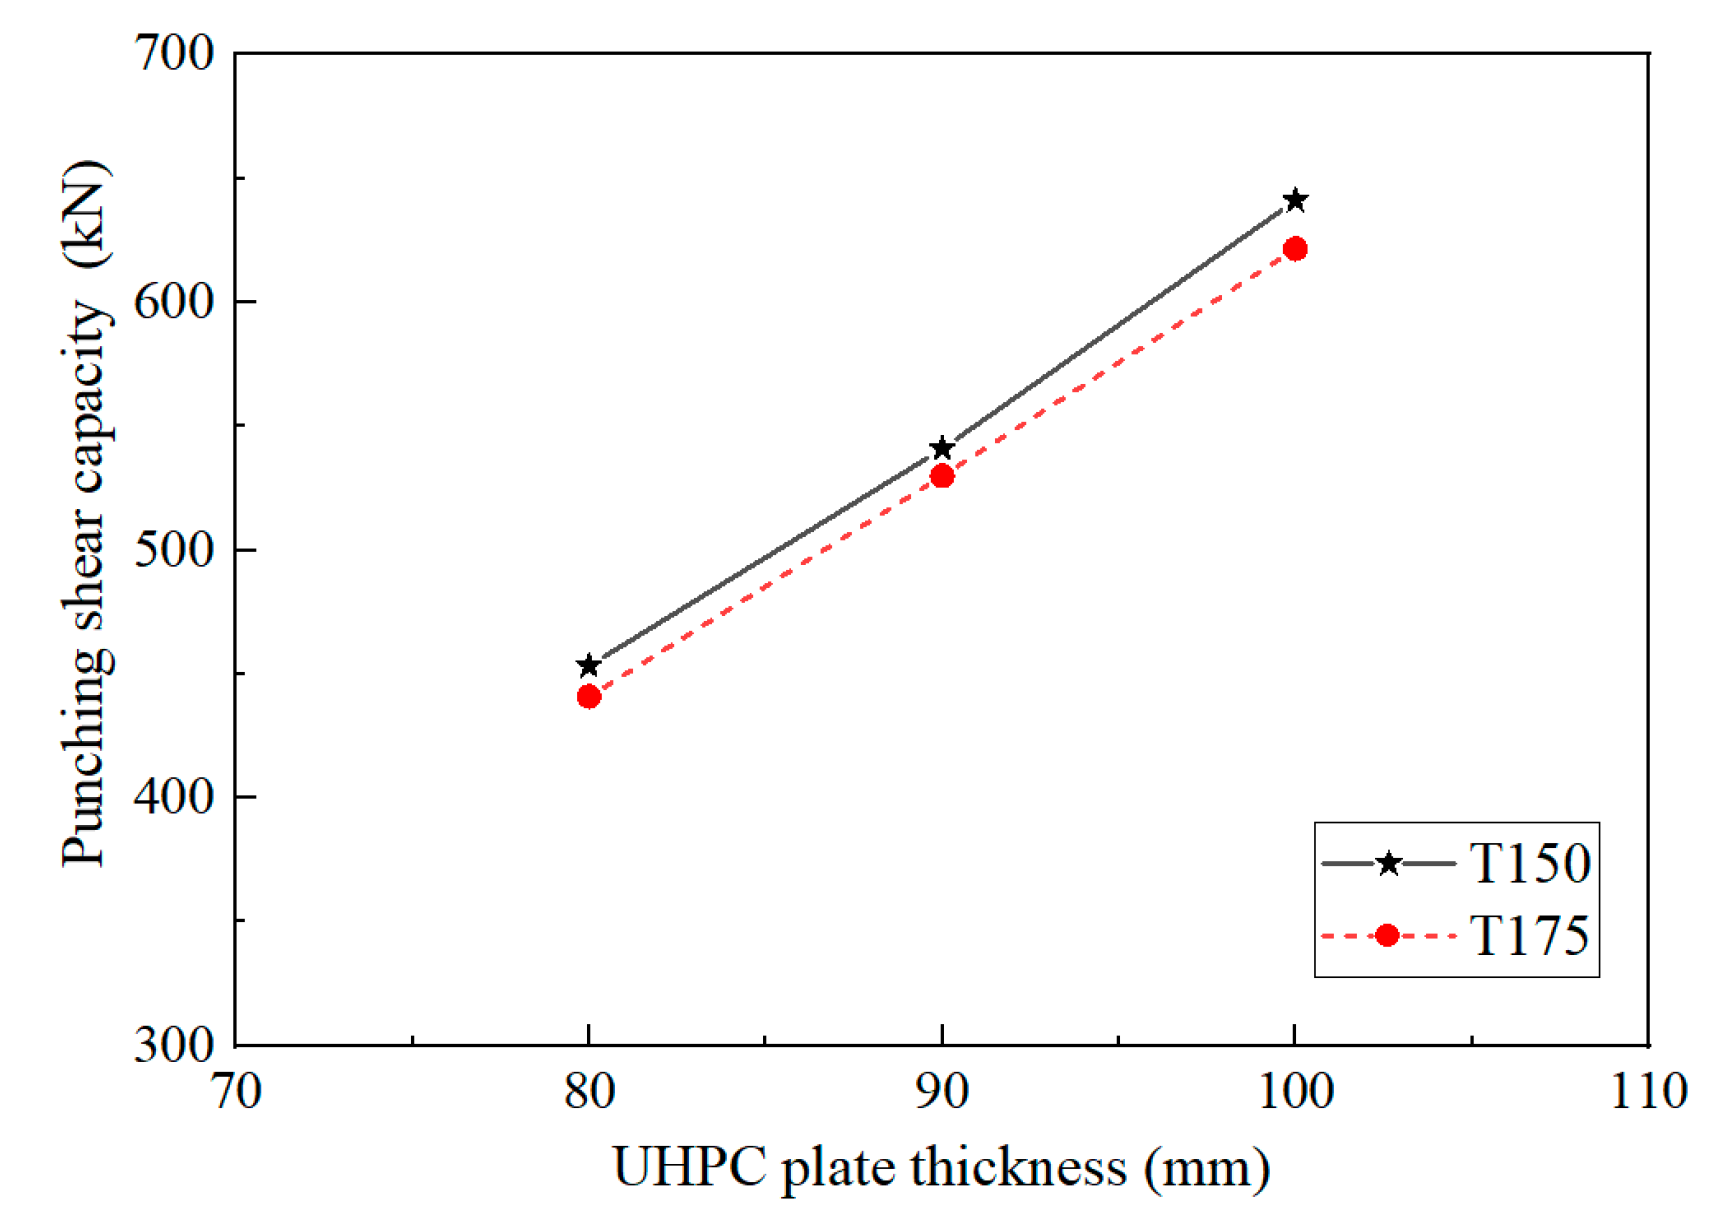
Figure 25 presents a comparative analysis of punching shear capacity among specimens with varying UHPC plate thickness. As illustrated in Figure 25, for specimens with identical UHPC plate width and consistent conventional punching shear failure mode, the punching shear capacity increases in an approximately linear manner with increasing UHPC plate thickness. It can also be observed from Figure 25 that, for specimens with the same UHPC plate thickness and approximately identical UHPC plate width that have experienced conventional punching shear failure mode, the impact punching shear capacity remains very similar across different types of T-shape steel. Therefore, the type of T-shape steel has minimal influence on the punching shear capacity of steel grid–UHPC composite bridge decks.

6. Punching Shear Capacity

6.1. Existing Formulas of Punching Shear Capacity for Plates

6.1.1. Chinese Standard-GB 50010-2010

For a plate without stirrups or bent-up reinforcement, the design formula of punching shear capacity under local loading or concentrated reaction force that provided in Chinese standard-GB 50010-2010 [33] is as Equation (1).
F l ( 0.7 β h f t + 0.25 σ p c , m ) η u m h 0
where F l is the design value of punching shear capacity. h 0 is the effective height of the plate section, which is determined as the average of the effective heights of the sections containing reinforcement in both directions. u m is the perimeter of the cross-section, determined based on the most unfavorable perimeter of the vertical cross-section of the plate, measured at a distance of h 0 / 2 from the region subjected to local load or concentrated reaction force. β h is the influence coefficient of plate thickness; when h 800 mm , then β h = 1.0 ; when h 2000 mm , then β h = 0.9 ; when 800 mm < h < 2000 mm , the value of β h is determined through linear interpolation; h is the plate thickness. f t is the design value of concrete axial tensile strength. σ p c , m is the weighted average of the effective prestress in the concrete across two directions along the cross-sectional perimeter, and this value should be maintained within the range of 1.0 N/mm2 to 3.5 N/mm2.
The coefficient η in Equation (1) should be determined by the two following formulas and selecting the smaller of the two results.
η 1 = 0.4 + 1.2 β s
η 2 = 0.5 + α s h 0 4 u m
where β s is the ratio of the longer side to the shorter side of a rectangular area under the influence of a local load or concentrated reaction force acting on a specific area; the value of β s should not exceed 4; when β s is less than 2, it shall be set to 2; for circular punching shear surfaces, β s shall be fixed at 2. α s is the influence coefficient of the column position: α s is assigned a value of 40 for central columns, 30 for side columns, and 20 for corner columns.

6.1.2. Chinese Standard-JTG 3362-2018

For a plate without punching shear reinforcement, the design formula of punching shear capacity under concentrated reaction force that provided in Chinese standard-JTG 3362-2018 [25] is as Equation (4).
γ 0 F l ( 0.7 β h f t + 0.15 σ p c , m ) u m h 0
where γ 0 is importance coefficient of bridge and culvert structures. u m is the circumference of the cross-sectional area of the failure cone measured at a distance of h 0 / 2 from the surface where the concentrated reaction force is applied. When the pier has a circular cross-section, it may be approximated as a square cross-section pier with a side length equal to 0.8 times the diameter, and the value of u m can subsequently be determined. β h is the influence coefficient of plate thickness; when h 300 mm , then β h = 1.0 ; when h 800 mm , then β h = 0.85 ; when 300 mm < h < 800 mm , the value of β h is determined through linear interpolation; h is the plate thickness. The meanings of the remaining parameters are consistent with those in Equation (1).

6.2. Contrastive Analysis of the Existing Formulas and FEA Results

Table 6 summarizes a comparison of the calculation results obtained from formulas and with FEA results. As shown in Table 6, when the width-to-thickness ratio of UHPC plate is small, the two Chinese standard formulas tend to be relatively conservative. Conversely, when the ratio is large, these formulas may become relatively less safe. The parameter analysis presented in Section 5 demonstrates that both the width and thickness of UHPC plate significantly influence its punching shear capacity. Based on this finding, the subsequent section will introduce the width-to-thickness ratio as a key parameter for modifying the existing formula.
According to the Chinese standards, specifically Equations (1) and (4), for the steel grid–UHPC composite bridge deck, since no prestressed reinforcement is provided, only the contribution of the UHPC plate to the punching shear capacity needs to be considered. The proposed calculation formula for steel grid–UHPC composite bridge decks, experienced conventional punching shear failure mode, is presented as follows:
F l ξ f t u m h
where F l is the punching shear capacity for the steel grid–UHPC composite bridge deck. f t is the concrete axial tensile strength. h is the UHPC plate height. u m is the circumference of the cross-sectional area of the failure cone measured at a distance of h / 2 from the surface where the concentrated reaction force is applied. In JTG 3362-2018 [25], it is proposed that the diffusion angle should adopt a value of 45°. Meanwhile, the diffusion angle can be reduced by increasing the concrete strength [6]. Based on the FEA results, it is recommended to set the tangent value of the diffusion angle to 3/4 when the load is transmitted to the UHPC plate, as illustrated in Figure 26.
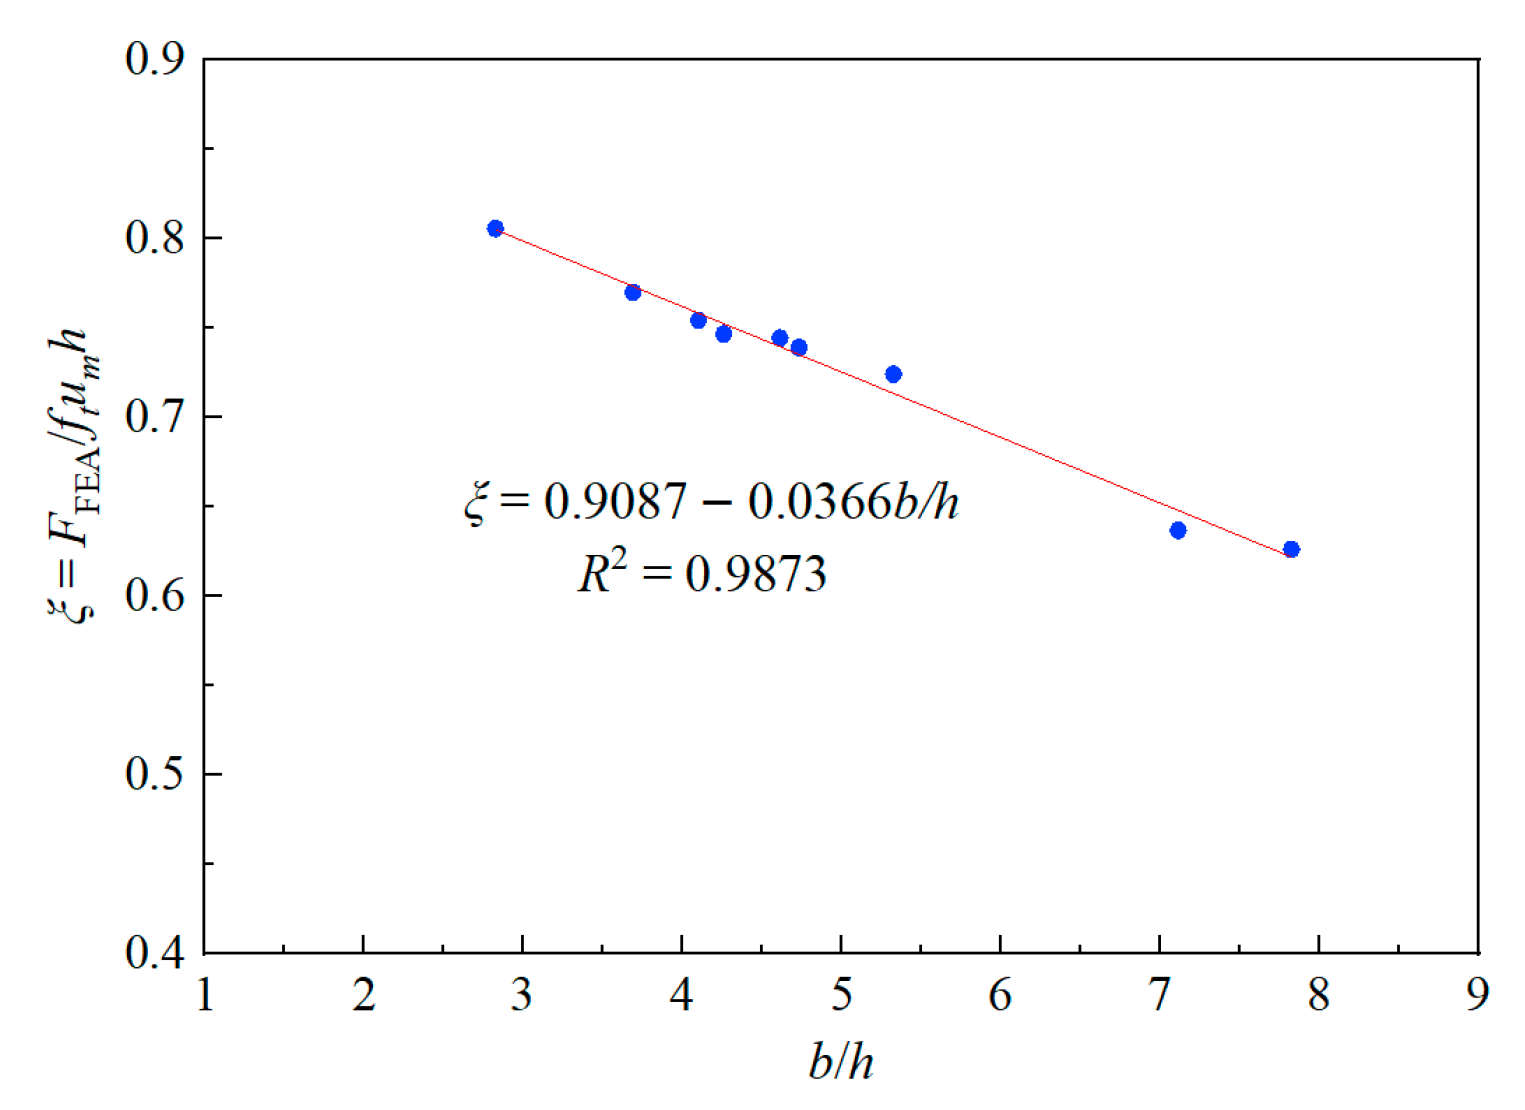
In Equation (5), ξ is the influence coefficient determined by the width-to-thickness ratio of UHPC plate. As illustrated in Figure 27, when the parameter ξ = F FEA / f t u m h is taken as the vertical coordinate and the width-to-thickness ratio b/h as the horizontal coordinate, an approximately linear relationship can be observed between the two variables. The value of ξ can be estimated using Equation (6).
ξ = F FEA f t u m h = 0.9087 0.0366 b h
where b is the UHPC plate width.

7. Conclusions

Based on the experimental results and FEA, this study investigates the punching shear behavior of the steel grid–UHPC composite bridge deck. The main conclusions are summarized as follows:
(1)
The new steel grid–UHPC composite bridge deck exhibits two distinct punching shear failure modes: conventional failure mode and unconventional failure mode. Under identical conditions and test specimen parameters, the punching shear capacity associated with the unconventional failure mode is approximately 35% higher than that of the conventional failure mode.
(2)
The width and thickness of UHPC plate significantly influence the punching shear capacity of the steel grid–UHPC composite bridge deck. In contrast, the type of T-shape steel exhibits a negligible effect. For the composite bridge decks experiencing conventional punching shear failure mode, the bearing capacity decreases approximately linearly with increasing UHPC plate width, whereas it increases approximately linearly with increasing UHPC plate thickness.
(3)
Based on the formula for calculating the punching shear capacity of conventional plates in Chinese standards, this paper introduces a correction coefficient that accounts for the width-to-thickness ratio of UHPC plate and proposes an improved calculation method applicable for determining the punching shear capacity of steel grid–UHPC composite bridge decks under conventional punching shear failure mode condition.
For steel grid–UHPC composite bridge decks, the thickness of the UHPC plate and the spacing of adjacent T-shape steel members should be appropriately designed in conjunction with the bending capacity of the structure to ensure that punching shear failure does not occur prior to bending failure. The aforementioned conclusions can be utilized as a reference for calculating the punching shear capacity of this novel composite bridge deck system.

Author Contributions

Conceptualization, S.L. and H.D.; methodology, S.L. and P.W.; software, P.W.; validation, S.L., P.W. and P.R.; formal analysis, P.W. and P.R.; investigation, S.L., P.W., P.R. and H.D.; data curation, P.W. and P.R.; writing—original draft preparation, S.L.; writing—review and editing, S.L.; supervision, H.D.; funding acquisition, S.L. and H.D. All authors have read and agreed to the published version of the manuscript.

Funding

This research was funded by the Basic Science (Natural Science) Research Project of Higher Education Institutions in Jiangsu Province, China (grant number 23KJB560009), the National Natural Science Foundation of China (grant number 52078121) and the Scientific Research Foundation for High-Level Talents of Jinling Institute of Technology (grant number jit-b-202131).

Data Availability Statement

Data are contained within the article.

Conflicts of Interest

Author Peng Wang was employed by the company Shandong Electric Power Engineering Consulting Institute Corp., Ltd. The remaining authors declare that the research was conducted in the absence of any commercial or financial relationships that could be construed as a potential conflict of interest.

References

  1. Zhao, X.; Nematollahi, B.; Chougan, M.; Xiao, J. Approaches to reduce cost and environmental impacts of UHPC production: A review. Case Stud. Constr. Mater. 2025, 22, e04644. [Google Scholar] [CrossRef]
  2. Zhu, Y.; Hussein, H.; Kumar, A.; Chen, G. A review: Material and structural properties of UHPC at elevated temperatures or fire conditions. Cem. Concr. Compos. 2021, 123, 104212. [Google Scholar] [CrossRef]
  3. Shao, X.; Yi, D.; Huang, Z.; Zhao, H.; Chen, B.; Liu, M. Basic performance of the composite deck system composed of orthotropic steel deck and ultrathin RPC layer. J. Bridge Eng. 2013, 18, 417–428. [Google Scholar] [CrossRef]
  4. Cheng, Z.; Zhang, Q.; Bao, Y.; Deng, P.; Li, M. Flexural behavior of corrugated steel-UHPC composite bridge decks. Eng. Struct. 2021, 246, 113066. [Google Scholar] [CrossRef]
  5. Liu, S.; Zhang, H.; Ding, H.; Ren, P. Study on the interface shear performance of corrugated steel-UHPC composite bridge decks with stud shear connectors. KSCE J. Civ. Eng. 2025, 100286. [Google Scholar] [CrossRef]
  6. Zareef, M.A.E.; Abdulrahaman, A.G.; Alnemari, A. Experimental investigation of punching shear behaviour of ultra-high performance self-compacting concrete slabs. Case Stud. Constr. Mater. 2023, 19, e02307. [Google Scholar] [CrossRef]
  7. Jeffrey, J.; Brunton, J.; Bank, C.L.; Oliva, M.G. Punching shear failure in double-layer pultruded FRP grid reinforced concrete bridge decks. Adv. Struct. Eng. 2012, 15, 601–613. [Google Scholar] [CrossRef]
  8. Awad, R.; Ateyat, A.A.; Junaid, M.T.; Al-Sadoon, Z.; Altoubat, S.; Maalej, M.; Barakat, S. Punching shear capacity of fiber-reinforced concrete suspended slabs: Database analysis and models assessments. J. Build. Eng. 2024, 83, 108433. [Google Scholar] [CrossRef]
  9. Lampropoulos, A.; Tsioulou, O.; Mina, A.; Nicolaides, D.; Petrou, M.F. Punching shear and flexural performance of ultra-high performance fibre reinforced concrete (UHPFRC) slabs. Eng. Struct. 2023, 281, 115808. [Google Scholar] [CrossRef]
  10. Zhang, Y.; Zhu, H.; Gao, D.; Li, C. Experimental study on punching shear bearing capacity of BFRP bars reinforced two-way concrete slabs under concentrated load. Structures 2025, 71, 108072. [Google Scholar] [CrossRef]
  11. Ahmed, F.R.; Numan, B.S.A. Failure characteristics and critical punching perimeter of high strength concrete panels. Int. J. Eng. Trend. Tech. 2014, 13, 367–372. [Google Scholar] [CrossRef]
  12. Metwally, I.M.; Issa, M.S.; El-Betar, S.A. Punching shear resistance of normal and high strength reinforced concrete flat slabs. Civ. Eng. Res. 2008, 30, 982–1003. [Google Scholar]
  13. Ramadan, M.; Ors, D.M.; Farghal, A.M.; Afifi, A.; Zaher, A.H. Punching shear behavior of HSC & UHPC post tensioned flat slabs—An experimental study. Results Eng. 2023, 17, 100882. [Google Scholar] [CrossRef]
  14. Inácio, M.M.G.; Almeida, A.F.O.; Faria, D.M.V.; Lúcio, V.J.G.; Ramos, A.P. Punching of high strength concrete flat slabs without shear reinforcement. Eng. Struct. 2015, 103, 275–284. [Google Scholar] [CrossRef]
  15. Ngab, A.S.; Shahin, M.S. Simple equation for predicting the punching shear capacity of normal and high strength concrete flat plates. Int. J. Eng. Res. Technol. 2021, 10, 678–688. [Google Scholar] [CrossRef]
  16. Elsanadedy, H.M.; Al-Salloum, Y.A.; Alsayed, S.H. Prediction of punching shear strength of HSC interior slab-column connections. KSCE J. Civ. Eng. 2013, 17, 473–485. [Google Scholar] [CrossRef]
  17. ACI Committee 318. Building Code Requirements for Structural Concrete (ACI 318M-14) and Commentary (ACI 318RM-14); American Concrete Institute: Farmington Hills, MI, USA, 2014. [Google Scholar]
  18. CSA A23.3-14; Design of Concrete Structures. Canadian Standard Association: Mississauga, ON, Canada, 2014.
  19. IS 456: 2000; Indian Standard Code of Practice for Plain and Reinforced Concrete, Fourth Revision. Bureau of Indian Standards: New Delhi, India, 2000.
  20. Eurocode 2. BS EN 1992-1-1: 2004; Design of Concrete Structures—Part 1-1: General Rules and Rules for Buildings. European Standard: Brussels, Belgium, 2004.
  21. Habeeb, M.; Al-Azzawi, A.A.; Al-Zwainy, M.F. Punching shear behavior of LWA bubble deck slab with different types of shear reinforcement. J. King Saud Univ.-Eng. Sci. 2020, 33, 15–22. [Google Scholar] [CrossRef]
  22. Jia, Y.; Chiang, J.C. Finite element analysis of punching shear of reinforced concrete slab–column connections with shear reinforcement. Appl. Sci. 2022, 12, 9584. [Google Scholar] [CrossRef]
  23. Zheng, Y.; Sun, C.; Deng, T.; Yang, J.; Lu, Z. Arching action contribution to punching failure of GFRP-reinforced concrete bridge deck slabs. Arabian J. Sci. Eng. 2014, 39, 8609–8625. [Google Scholar] [CrossRef]
  24. Amir, S.; Veen, C.; Walraven, J.C.; Boer, A. Experiments on punching shear behavior of prestressed concrete bridge decks. ACI Struct. J. 2016, 113, 627–636. [Google Scholar] [CrossRef]
  25. JTG 3362-2018; Specifications for Design of Highway Reinforced Concrete and Prestressed Concrete Bridges and Culverts. Ministry of Transport of the People’s Republic of China: Beijing, China, 2018.
  26. GB/T 1499.2-2018; Steel for the Reinforcement of Concrete—Part 2: Hot Rolled Ribbed Bars. General Administration of Quality Supervision, Inspection and Quarantine of the People’s Republic of China: Beijing, China, 2018.
  27. GB/T 50081-2019; Standard for Test Methods of Concrete Physical and Mechanical Properties. Ministry of Housing and Urban-Rural Development of the People’s Republic of China: Beijing, China, 2019.
  28. GB/T 228.1-2010; Metallic Materials-Tensile Testing—Part 1: Method of Test at Room Temperature. General Administration of Quality Supervision, Inspection and Quarantine of the People’s Republic of China: Beijing, China, 2010.
  29. Boulbes, R.J. Troubleshooting Finite-Element Modeling with Abaqus: With Application in Structural Engineering Analysis. Fransa 2020, 1, 439. [Google Scholar]
  30. Shan, B. Experimental Research on the Basic Mechanical Properties of Reactive Powder Concrete. Master’s Thesis, Hunan University, Changsha, China, 2002. [Google Scholar]
  31. Zhang, Z.; Shao, X.; Li, W.; Zhu, P.; Chen, H. Axial tensile behavior test of ultra high performance concrete. China J. Highway Transport. 2015, 28, 50–58. [Google Scholar] [CrossRef]
  32. Li, L.; Ye, M.; Hu, F.; Liao, R.; Tang, J.; Shao, X. Experimental study on the flexural behavior of a prefabricated large-cantilevered prestressed UHPC thin-walled bent cap. China Civ. Eng. J. 2020, 53, 92–104. [Google Scholar] [CrossRef]
  33. GB 50010-2010; Code for Design of Concrete Structures. Ministry of Housing and Urban-Rural Development of the People’s Republic of China: Beijing, China, 2010.
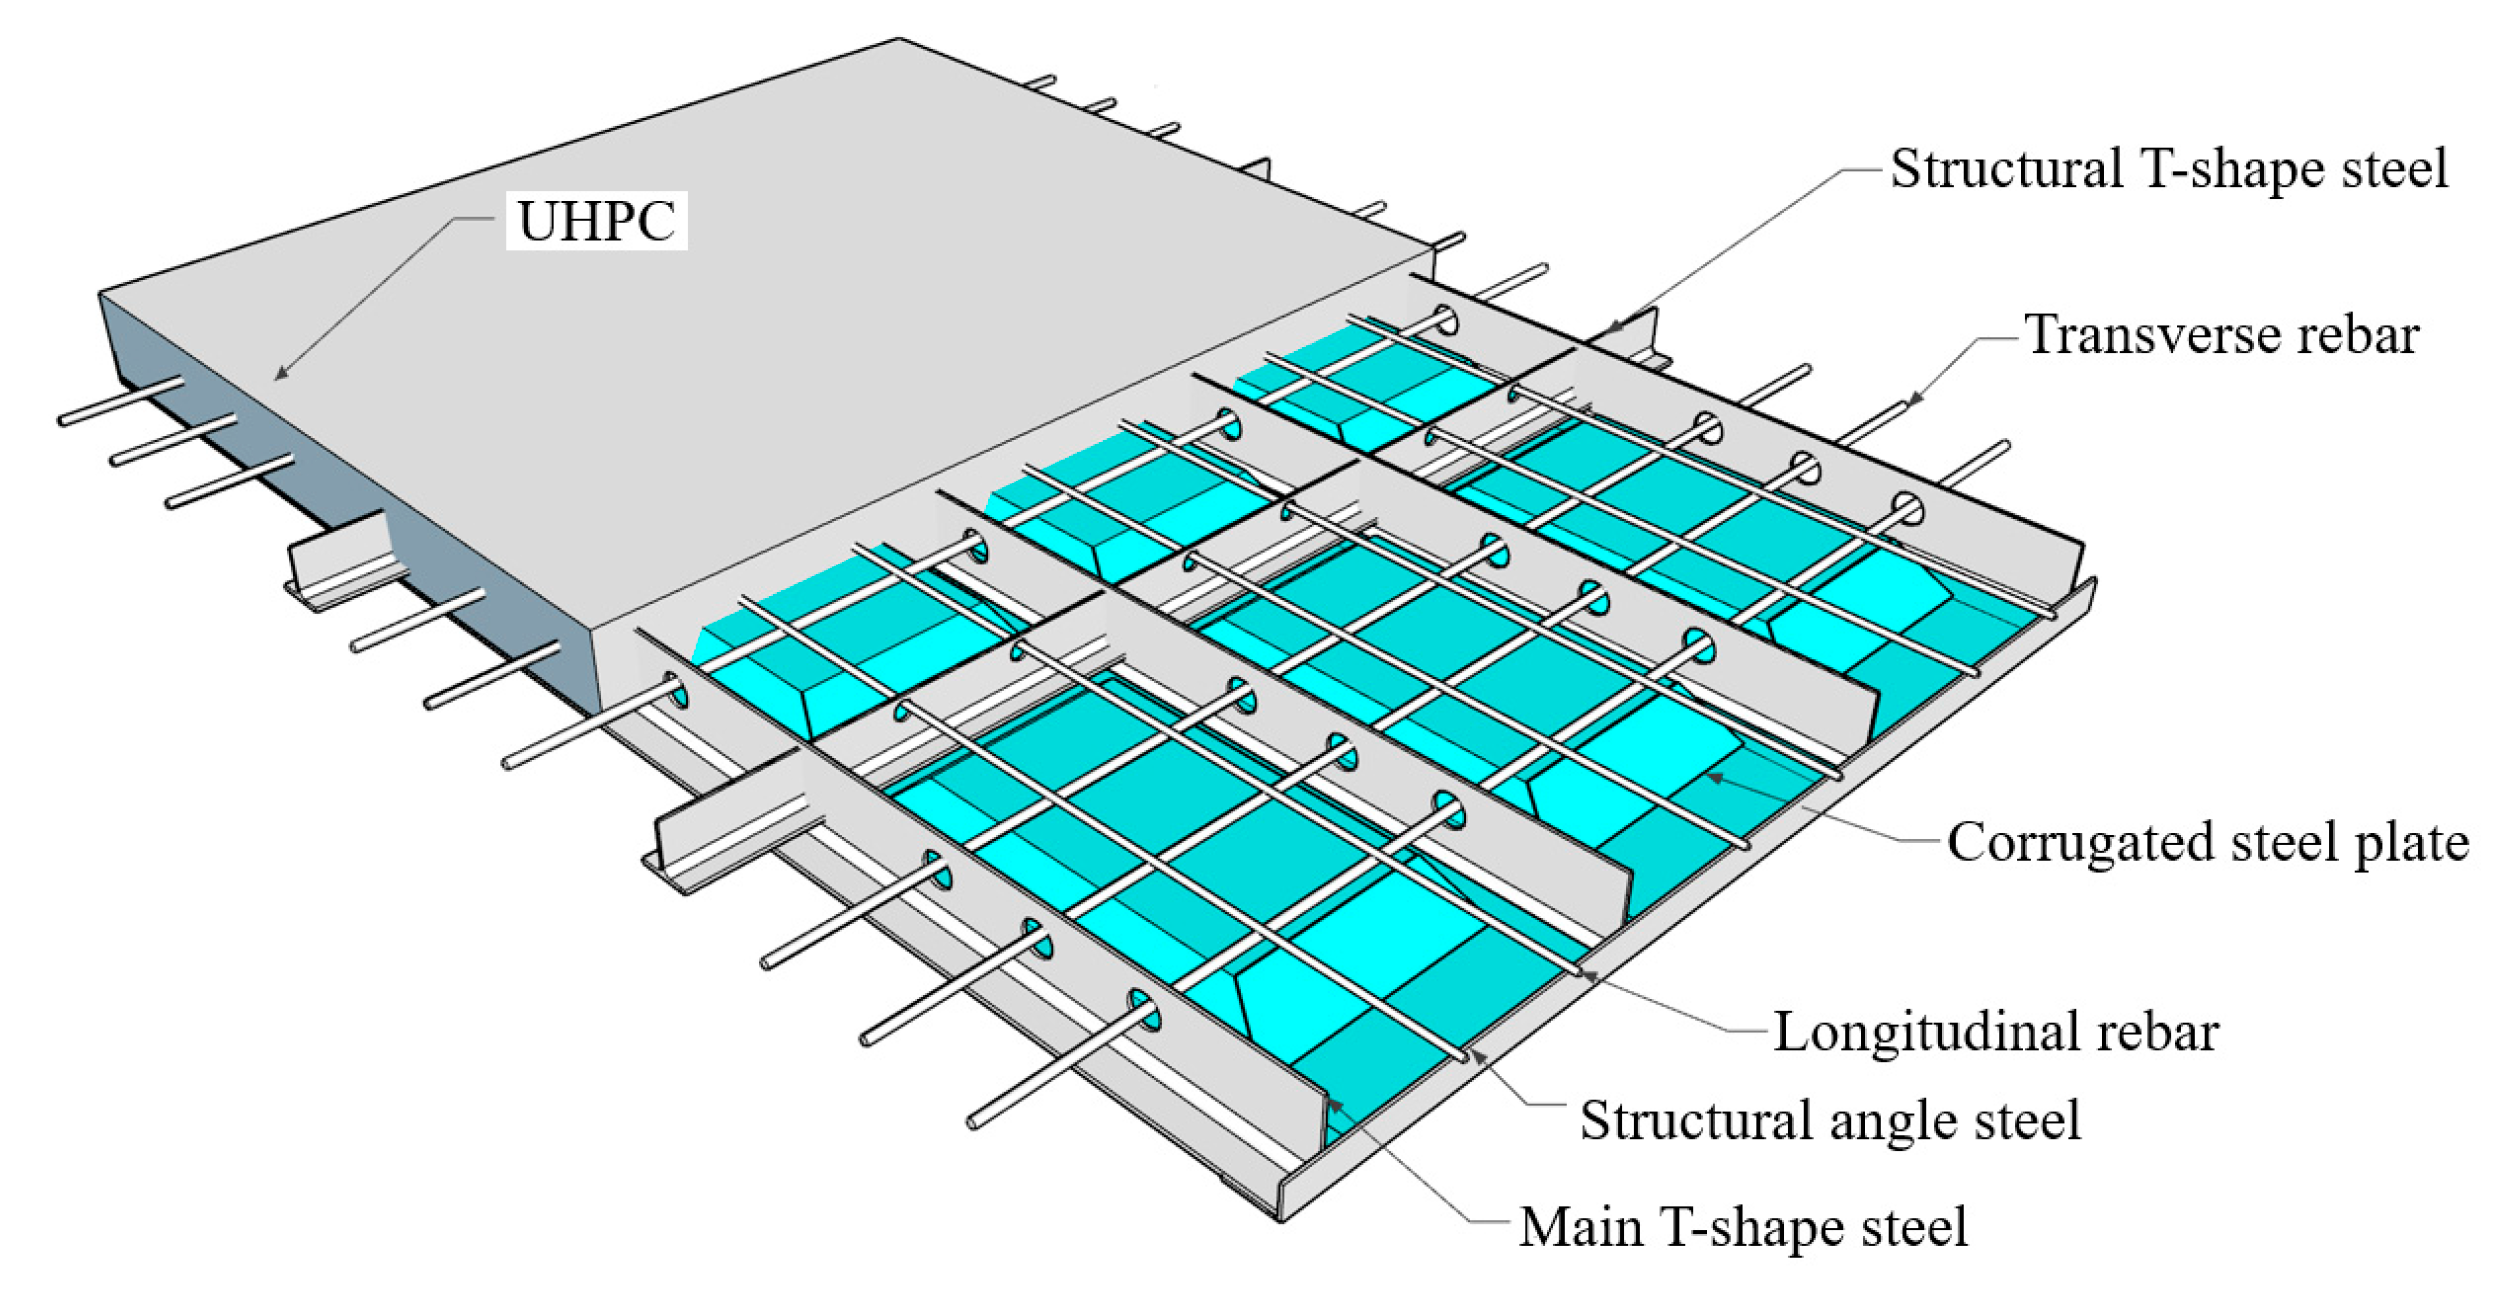
Figure 1. Steel grid–UHPC composite bridge deck.
Buildings 15 03398 g001
Figure 2. Sampling diagram for the punching shear specimen CQD4: (a) Cross-section diagram; (b) Bottom view; (c) Specimen CQD4.
Buildings 15 03398 g002
Figure 3. Rebar drawing of specimen CQD4: (a) Profile view; (b) Side elevation view (unit: mm).
Buildings 15 03398 g003
Figure 4. Rebar drawing of specimen CQD6: (a) Profile view; (b) Side elevation view (unit: mm).
Buildings 15 03398 g004
Figure 5. The photographs of the template taken during the preparation: (a) Specimen CQD4; (b) Specimen CQD6.
Buildings 15 03398 g005
Figure 6. The photographs of UHPC pouring process: (a) Specimen CQD4; (b) Specimen CQD6.
Buildings 15 03398 g006
Figure 7. The material characteristic test diagram of UHPC: (a) Cube compressive strength; (b) Elastic modulus; (c) Tensile property.
Buildings 15 03398 g007
Figure 8. The material characteristic test diagram of the T-shaped steel and rebar: (a) T-shaped steel; (b) Rebar.
Buildings 15 03398 g008
Figure 9. Loading device for the pushing shear test: (a) Front elevation; (b) Side elevation.
Buildings 15 03398 g009
Figure 10. Measuring device for the punching shear test: (a) Front elevation; (b) Top elevation.
Buildings 15 03398 g010
Figure 11. Perspective view and FE model of the steel grid–UHPC composite bridge deck: (a) Perspective view; (b) FE model.
Buildings 15 03398 g011
Figure 12. Boundary conditions of FE model.
Buildings 15 03398 g012
Figure 13. Loading diagram of specimen CQD4.
Buildings 15 03398 g013
Figure 14. Bottom surface diagram of specimen CQD4 following failure: (a) Photograph; (b) Schematic diagram.
Buildings 15 03398 g014
Figure 15. Top surface diagram of specimen CQD4 following failure.
Buildings 15 03398 g015
Figure 16. Load–displacement curve of specimen CQD4.
Buildings 15 03398 g016
Figure 17. Strain cloud diagrams of the UHPC and rebars for specimen CQD4: (a) UHPC midspan horizontal cross-section view; (b) UHPC midspan longitudinal cross-section view; (c) Strain cloud diagrams of rebars.
Buildings 15 03398 g017
Figure 18. Loading diagram of specimen CQD6.
Buildings 15 03398 g018
Figure 19. Bottom surface diagram of specimen CQD6 following failure: (a) Photograph; (b) Schematic diagram.
Buildings 15 03398 g019
Figure 20. Top surface diagram of specimen CQD6 following failure.
Buildings 15 03398 g020
Figure 21. Load–displacement curve of specimen CQD6.
Buildings 15 03398 g021
Figure 22. Strain cloud diagrams of the UHPC and rebars for specimen CQD6: (a) UHPC midspan horizontal cross-section view; (b) UHPC midspan longitudinal cross-section view; (c) Strain cloud diagrams of rebars.
Buildings 15 03398 g022
Figure 23. Comparison of punching shear capacity among specimens with varying UHPC width.
Buildings 15 03398 g023
Figure 24. Punching shear failure modes of steel grid–UHPC composite bridge decks: (a) Unconventional failure mode; (b) Conventional failure mode.
Buildings 15 03398 g024
Figure 25. Comparison of punching shear capacity among specimens with varying UHPC thickness.
Buildings 15 03398 g025
Figure 26. Punching shear load transfer mechanism of steel grid–UHPC composite bridge decks.
Buildings 15 03398 g026
Figure 27. ξ b h curve.
Buildings 15 03398 g027
Table 1. Design parameters of punching shear specimens.
SpecimensLength
(mm)
Width
(mm)
Thickness
(mm)
UHPC Plate
Thickness
(mm)
Two T-Shape
Steel Spacing
(mm)
T-Shape Steel (mm)
Height × Width × Web Thickness × Flange Thickness
CQD480080017080400150 × 150 × 6.5 × 9
CQD61000100017080600150 × 150 × 6.5 × 9
Table 2. The mixing ratio of Subote UDC(II) UHPC (unit: kg/m3).
PremixWater-Reducing AdmixtureWaterSteel Fiber
2071.413184.7181
Table 3. The material characteristics of UHPC (unit: MPa).
Concrete
Strength
Grade
Average Compressive Strength of Cubic Blocks
Measured Over a 28-Day
Curing Period
Average Compressive
Strength of Cubic Blocks During the Test Period
Mean Value of
Axial Compressive Strength
Mean Value of
Axial Tensile Strength
Elastic Modulus
C120137.9153.0105.611.8959,642
Table 4. The material characteristics of the T-shaped steel and rebar (unit: MPa).
GradeYield StrengthUltimate StrengthElastic Modulus
Q355B357566213,642
HRB400425631212,753
Table 5. Design parameters and punching shear capacity of FE models.
FE ModelsUHPC
Plate Width
(mm)
UHPC Plate
Thickness
(mm)
T-Shape Steel (mm)
Height × Width × Web Thickness × Flange Thickness
Punching
Shear Capacity
(kN)
Failure Mode
T150W169T80 (CQD4)16980150 × 150 × 6.5 × 9605.8Unconventional
T150W369T80 (CQD6)36980150 × 150 × 6.5 × 9453.2Conventional
T150W369T9036990150 × 150 × 6.5 × 9540.9Conventional
T150W369T100369100150 × 150 × 6.5 × 9641.0Conventional
T150W569T8056980150 × 150 × 6.5 × 9387.7Conventional
T175W226T8022680175 × 175 × 7 × 11490.5Conventional
T175W426T8042680175 × 175 × 7 × 11440.9Conventional
T175W426T9042690175 × 175 × 7 × 11529.9Conventional
T175W426T100426100175 × 175 × 7 × 11621.6Conventional
T175W626T8062680175 × 175 × 7 × 11381.2Conventional
Table 6. A comparison of the calculation results obtained from existing formulas with FEA results.
FE ModelsWidth-to-ThicknessFEAEquations (1) and (4)Equations (5) and (6)Percentage
Ratio of UHPC PlateResult (kN)Result (kN)ErrorResult (kN)ErrorImprovement
T150W169T80 (CQD4)2.1605.8426.1−29.7%506.1−16.5%18.8%
T150W369T80 (CQD6)4.6453.2426.1−6.0%450.4−0.6%5.7%
T150W369T904.1540.9501.9−7.2%543.90.6%8.4%
T150W369T1003.7641.0582.6−9.1%643.90.5%10.5%
T150W569T807.1387.7426.19.9%394.71.8%−7.4%
T175W226T802.8490.5426.1−13.1%490.2−0.1%15.0%
T175W426T805.3440.9426.1−3.3%434.5−1.4%2.0%
T175W426T904.7529.9501.9−5.3%527.3−0.5%5.1%
T175W426T1004.3621.6582.6−6.3%626.50.8%7.5%
T175W626T807.8381.2426.111.8%378.8−0.6%−11.1%
Disclaimer/Publisher’s Note: The statements, opinions and data contained in all publications are solely those of the individual author(s) and contributor(s) and not of MDPI and/or the editor(s). MDPI and/or the editor(s) disclaim responsibility for any injury to people or property resulting from any ideas, methods, instructions or products referred to in the content.