Article

Debris Simulation in Controlled Demolition of Tall Building Structures: Solid Model-Based Approach

Department of Civil Engineering, Engineering Faculty, Cukurova University, Adana 01330, Türkiye
Buildings 2025, 15(18), 3396; https://doi.org/10.3390/buildings15183396
Submission received: 9 August 2025 / Revised: 16 September 2025 / Accepted: 17 September 2025 / Published: 19 September 2025
(This article belongs to the Section Building Structures)

Abstract

This article presents a unique study on the demolition process of a high-rise reinforced concrete building simulated using a methodology based on the Applied Element Method (AEM). Prior to the parametric analyses, the progressive collapse-based solid model was visually validated against real-world controlled demolition footage captured by both Unmanned Aerial Vehicles (UAVs) and fixed cameras, showing close agreement in building motion and debris dispersion patterns. In contrast to the Finite Element Method (FEM) model, the simulation is not blast-induced; it is instead developed on a column removal approach, which is widely adopted in progressive collapse assessments. Discussions related to the FEM model are provided as well. The parametric analysis is conducted in two stages. First, a constant removal sequence (removal of 4, 3, and 2 floors, respectively, in the first, second, and third axes) is applied to both 20- and 15-storey buildings under three time delays: 100 ms, 300 ms, and 500 ms. Based on these results, a 300 ms delay is identified as a suitable compromise for controlling debris dispersion, and this value is adopted for the subsequent analyses. In the second stage, three distinct removal sequences are examined on the 20-storey structure using the fixed 300 ms delay: Scenario 1 (4–3–2), Scenario 2 (12–8–6), and Scenario 3 (16–12–6). Among these, Scenario 3 yields the most compact horizontal debris spread. The findings indicate a strong correlation between the actual demolition behavior and the proposed model, demonstrating its capability to realistically capture complex structural failure mechanisms and provide practical guidance for optimizing controlled demolition strategies.

1. Introduction

In recent decades, the practice of controlled demolition has gained significant momentum as a critical tool in urban transformation, disaster recovery, and the management of aging infrastructure [1,2,3]. This increase in relevance is driven by several converging factors. Firstly, the structural damage observed in the aftermath of recent major earthquakes has highlighted the urgent need for the safe and targeted removal of compromised buildings [4,5,6,7,8,9,10,11]. Secondly, the occurrence of physical degradation [12], particularly in reinforced concrete structures built during periods of rapid urbanization, has necessitated their replacement due to safety concerns. Unlike timber structures [13], which often have different aging mechanisms, reinforced concrete systems prevalent in many countries are prone to long-term deterioration that compromises their structural integrity.
Additionally, the strategic expansion and reorganization of cities has introduced new demands for space, prompting the systematic replacement of outdated buildings or sometimes bridges [14] with new, more sustainable developments [15]. In this context, controlled demolition has evolved not merely as a method of destruction but as a means of enabling regeneration in the built environment [16]. Particularly since the early 2000s, this technique has found widespread application in both developed and rapidly urbanizing regions, where effective spatial planning and safety management are paramount.
Traditionally, demolition techniques such as mechanical wrecking balls or cable pulling have been employed in various contexts. While these methods remain in use, they exhibit significant limitations in terms of precision, safety, and adaptability, particularly when dealing with high-rise or densely clustered structures. As the complexity and scale of modern buildings increase, simulation-based approaches—especially those involving explosive demolition, have become central to demolition engineering [1,3]. These simulations enable pre-assessment of structural responses, ensuring the collapse follows a predetermined path while minimizing damage to adjacent assets.
In this context, one of the primary considerations in controlled demolition is the directionality of collapse, which becomes especially critical in the presence of sensitive neighboring assets such as historical structures [17], cultural heritage sites, or high-density residential zones. In such cases, decision-makers must carefully choose between toppling, inward implosion, or progressive deconstruction [18], balancing cost, time constraints, and safety. Regardless of the chosen method, predictive modeling and simulation become indispensable to mitigate unintended consequences, protect nearby infrastructure, and preserve public safety.
However, controlled demolition remains an inherently challenging engineering task, especially when full-scale modeling is involved. While full-scale physical experiments provide invaluable insights [19,20], they are often hindered by high costs, extended durations, and logistical constraints. For this reason, scaled-down experimental models, when properly designed, offer a viable alternative for generating reliable scientific knowledge. Nevertheless, even these scaled models pose considerable challenges related to material scaling, dynamic similitude, and result generalization.
In the realm of computational modeling, large-scale demolition model scenarios involving multi-story buildings continue to present significant difficulties in terms of mesh generation, solid element fidelity, convergence behavior, and solution time. Despite these challenges, recent progress, particularly in discrete element-based methodologies, offers promising new avenues for capturing the real behavior of structures undergoing dynamic failure [21,22]. Notable advancements have been reported in the literature, including the studies [23,24], and others employing the Applied Element Method (AEM) [25], which bridges the gap between continuum and discrete modeling approaches.
The increasing use of discrete discontinuum-based simulation tools is driven by their potential to more accurately reflect real structural behavior, particularly in failure scenarios that involve highly nonlinear mechanisms such as cracking, separation, and impact. Such tools not only enable deeper scientific understanding but also hold the promise of resolving longstanding engineering debates regarding collapse mechanisms and failure propagation. However, achieving this level of fidelity requires continuous model calibration through comparison with experimental data [26]. The integration of simulation with field observations and controlled tests remains a vital step toward refining these methods and enhancing their predictive capacity.
Nonlinear dynamic analysis has been extensively used to capture the complex response of reinforced concrete structures under extreme loading, allowing for realistic evaluation of damage propagation and collapse processes [27,28,29,30].
Extensive studies have also focused on fundamental damage mechanisms in RC members, including cracking, crushing, bond-slip, shear failures, and local instabilities. These findings provide critical benchmarks for validating computational models, which are essential for analyzing collapse mechanisms and structural robustness in FEM, where predictive accuracy is crucial for safety-critical operations [27,28,29,30,31]. The problem of progressive collapse has attracted significant research attention, particularly in terms of column removal scenarios and their influence on global stability [31,32,33,34].
Finite Element Method (FEM)-based approaches remain the dominant numerical tool in assessing collapse mechanisms, offering flexibility in modeling both material nonlinearity and large deformation effects [35,36,37,38]. Explicit dynamic formulations are commonly used to simulate sudden failure events, including sequential column removal, member detachment, and debris dispersion, providing guidance for design, retrofitting, and safety assessment.
A key novelty of this work lies in adapting a well-established structural failure simulation method, traditionally used for assessing progressive collapse [39,40], to the planned, directional, and safety-critical context of controlled demolition.
In this context, the present study seeks to contribute to the ongoing development of computational tools and methodologies for controlled demolition by presenting a novel simulation-based investigation. The demolition process of high-rise reinforced concrete buildings are modeled using the Applied Element Method, with particular attention paid to collapse directionality, element detachment, and debris distribution. Rather than relying on blast-based approaches in Finite Element Method explicit analysis [1,2], the simulation is structured around the concept of sequential column removal, a well-established strategy in progressive collapse assessment [41,42].
The study makes a distinctive contribution by employing the Applied Element Method (AEM) together with the column removal approach, a widely adopted strategy in progressive collapse analysis, but here implemented using detailed solid element models. Progressive collapse studies generally investigate the structural response under column loss scenarios, aiming to prevent damage propagation and to identify robustness-based solutions that can mitigate the risk of total collapse. By contrast, the present work focuses on the controlled collapse of structures, with the specific objective of minimizing debris dispersion. This conceptual shift, from damage prevention to controlled failure, clearly distinguishes the present study from prior numerical applications in progressive collapse analysis. In this context, experimental studies and validations in progressive collapse are of great importance; however, the present parametric analyses provide an opportunity to supplement approximate outcomes with extra robust design strategies. In controlled demolition, the predictive model must be even more reliable, as it deals with irreversible scenarios, further emphasizing the critical role of validation efforts. The proposed framework enables systematic investigation of different building heights and varying column removal time intervals, while also providing comprehensive visual validation of collapse propagation. Furthermore, the study clarifies how similar reasoning is typically pursued in FEM-based solid explicit approaches, thereby situating the present findings within the broader context of numerical collapse modeling.
Section 3 presents to the reader the validation of the structural model—previously verified using FEM-explicit analysis [1]—this time employing the Applied Element Method (AEM) combined with a progressive-collapse-based column-removal approach. The validation is performed by comparing the simulated motion and debris dispersion with visual records obtained from Unmanned Aerial Vehicles (UAVs) and fixed cameras.
Following the experimental validation, Section 4 investigates the progressive collapse behavior of two tall building structures by examining the influence of different column removal time intervals. Two primary case studies are considered: a 20-storey building and a 15-storey building. For both structures, the effect of varying column removal sequences, removing columns over 4 floors in the first axis, 3 floors in the second axis, and 2 floors in the third axis, was assessed at time intervals of 100 ms, 300 ms, and 500 ms, with the focus on horizontal debris dispersion. As the results revealed no substantial difference between the 300 ms and 500 ms delays, the subsequent analyses in Section 5 were conducted using the 300 ms interval, which was also deemed preferable from the perspective of ensuring structural stability in the rear portion of the building during demolition.
In Section 5, the 300 ms interval was retained for an additional series of simulations, this time applied exclusively to the taller 20-storey case, but this time with varying column removal patterns. Three column removal scenarios were analyzed: Scenario 1 (4–3–2 floors), Scenario 2 (12–8–6 floors), and Scenario 3 (16–12–6 floors). The objective was to minimize the maximum debris travel distance, thereby reducing the potential risk of impact to surrounding structures. The analysis demonstrated notable differences in horizontal dispersion across the scenarios, with Scenario 3 providing the most effective containment. Finally, the Conclusion section summarizes the key findings of the study.
By offering an in-depth, systematically verified simulation framework, this research aims to support engineers, urban planners, and safety regulators in making informed decisions during the demolition design process. Furthermore, it demonstrates the value of integrating advanced numerical methods with practical demolition objectives, providing a foundation for future studies that seek to harmonize engineering precision with real-world constraints.

2. Materials and Methods

The explicit finite element method is a numerical approach that employs the central difference time integration scheme to solve dynamic problems involving highly nonlinear and transient behavior. It is particularly effective for situations involving contact–impact, large deformations, and material failure. The general equation of motion for a discretized structural system is:
M u″(t) + C u′(t) + K u(t) = F(t)
where M is the global mass matrix, C is the damping matrix, K is the stiffness matrix, u(t) is the displacement vector, and F(t) denotes the external force vector.
In the explicit formulation, accelerations at a given time step tn are obtained as:
u ¨ n   =   M 1   [ F n     C   u ˙ n     K   u n ]
Velocities and displacements are updated incrementally according to:
u ˙ n   +   1 2   =   u ˙ n     1 2   +   Δ t   u ¨ n
u n + 1 = u n + Δ t   u ˙ n   +   1 2
The time increment Δt is restricted by the Courant–Friedrichs–Lewy (CFL) stability condition [43,44]:
Δt ≤ Lmin/cmax
where Lmin is the smallest element dimension and cmax is the highest wave speed in the material. This explicit approach avoids solving a global system of equations at each time step, resulting in computational efficiency for large-scale, high-speed events.
The primary modeling technique employed in this study is the Applied Element Method (AEM) [45,46], a discrete modeling approach that integrates the advantages of both FEM and DEM (Discrete Element Method). In AEM, the structure is discretized into rigid elements connected by a series of nonlinear springs that represent the material’s stiffness in normal, shear, and rotational directions [46,47,48,49]. These springs simulate cracking, separation, and collision behaviors naturally, making AEM particularly suited for simulating structural disintegration, progressive collapse, and nonlinear analysis [50].
Unlike blast-based approaches, the demolition scenario modeled here follows a progressive collapse framework in which the structure fails due to sequential column removal. This approach, commonly used in robustness analysis (e.g., after accidental impacts or explosions), provides a controlled methodology for triggering global failure while avoiding the complexities of fluid modeling.
The Applied Element Method is a computational technique that integrates features of both discrete and finite element methods. In AEM, the structure is divided into small rigid solid elements connected by normal and shear springs distributed along element edges. These springs capture the normal (kn) and shear (ks) stiffness of the material [45,46].
For an edge of length l and thickness t, the spring stiffnesses are expressed as:
kn = E·t/l
ks = G·t/l
where E is the Young’s modulus and G is the shear modulus.
The motion of the system is governed by the general equation:
M   u ¨ +   C   u ˙ +   K   u   = F
AEM typically employs explicit central difference integration, updating contact forces as elements separate or collide. Failure of a spring occurs when the tensile or shear stress exceeds the corresponding material strength:
σn ≥ ft (tensile failure)
τs ≥ fs (shear failure)
where ft and fs represent tensile and shear strengths, respectively. Upon failure, the spring stiffness is removed, enabling free relative motion between elements. This characteristic allows AEM to naturally simulate cracking and fragmentation. In this study, columns are removed at pre-specified time steps, simulating staged failure and enabling clear observation of collapse directionality and damage propagation.

3. Model Validation and Insights from FEM and AEM

To support the reliability of the numerical simulations, a visual validation was conducted by comparing the Applied Element Method (AEM)-based solid model with real-world footage from an actual controlled demolition [1]. In the structural verification model, columns with cross-sectional dimensions of 1.50 × 1.50 m are provided with 20ϕ20 longitudinal bars, those with 1.00 × 1.50 m sections with 14ϕ20 bars, and those with 0.50 × 1.00 m sections with 10ϕ20 bars. All columns are detailed with ϕ10 transverse reinforcement spaced at 150 mm intervals. The floor slab thickness is 300 mm, reinforced on both top and bottom faces with ϕ20 bars at 150 mm spacing in orthogonal directions. Structural components were modelled using C25-grade concrete and S420-grade reinforcing steel. The concrete was assigned a Poisson’s ratio of 0.20, a Young’s modulus of 3.0 × 10⁴ MPa, a density of 2.40 g/cm3, and a compressive strength (fc′) of 25 MPa. The reinforcing steel was characterized by a Poisson’s ratio of 0.30, a Young’s modulus of 2.1 × 10⁵ MPa, a density of 7.80 g/cm3, and a yield strength (σo) 420 MPa. The details are presented in Figure 1, which illustrates the plan view, axis dimensions, and column cross-sections (units in meters) [1].
A total of approximately 70 kg (154 lb) of explosives was distributed across the targeted columns. In the initial stage, the charges were configured to implode the front portion of the structure. The detonation proceeded in sequential stages, causing the upper section to initiate a tilting motion [1]. Table 1 presents the principal modelling and validation parameters adopted in the numerical study. The Applied Element Method (AEM) was selected for its capability to capture detailed fracture progression and debris kinematics in reinforced concrete structures. The collapse mechanism investigated corresponds to progressive failure triggered through sequential column removal, allowing the simulation to replicate controlled demolition conditions. Out-of-plane slab flexibility was accounted for by applying a Thin Structure Correction Factor (TSCF), ensuring a realistic representation of flexural behavior under asymmetric load redistribution.
The model geometry incorporated solid elements with explicit rebar modelling to accurately capture local stiffness and failure modes. Validation was conducted through visual correlation with real demolition footage, leveraging both fixed-camera and drone perspectives. Figure 2 illustrates the comparative modelling approaches between the Finite Element Method (FEM) and the Applied Element Method (AEM), highlighting their respective applications to reinforced concrete (RC) frame demolition simulations. Figure 2a,b depict the FEM solid RC model—first as a fully meshed RC model, and then in elevation with air blocks to represent surrounding voids. Figure 2c,d show the AEM solid RC model with explicit reinforcement, followed by a progressive collapse scenario based on sequential column removal. Figure 2e captures the post-initiation tilt and deformation state under the AEM simulation. This comparative visualization clarifies the modelling transition from conventional FEM-based blast simulation to AEM-based progressive collapse analysis (Figure 2).
Figure 3 illustrates key correspondences between the modelled collapse sequence and the visual data captured from both a fixed camera and aerial drone perspectives. The comparison focuses on critical indicators such as the building’s global deformation profile, the timing and trajectory of debris ejection, and the progressive failure pattern observed in both the model and the physical event.
For clarity, two zones of the building are highlighted: the rear section, shown with a blue bounding box, and the front facade, marked with an orange box. These demarcations emphasize the structural displacement directions and debris spread, which exhibit strong visual agreement between the simulation and the real event.
The collapse process was segmented into equally spaced time frames, allowing a side-by-side temporal comparison of the demolition phases. This alignment reinforces the visual credibility of the simulation in terms of both kinematic behavior and debris propagation (Figure 3).

4. Parametric Studies: Structural System and General Information

The study investigates the progressive collapse behavior of reinforced concrete (RC) high-rise buildings subjected to sequential column removal scenarios. The structural models analyzed include a 15-storey and a 20-storey building, each with a uniform story height of 3.0 m and typical floor plan dimensions comprising regular 6 m spans. The primary structural elements consist of columns with cross-sectional dimensions of 120 × 120 cm and beams with 75 × 90 cm sections. A 4% reinforcement ratio was adopted in the vertical members to reflect a robust seismic-resistant design. The slabs were modelled with a 20 cm thickness, incorporating Thin Structure Correction Factor (TSCF) to accurately capture out-of-plane flexural behavior under extreme loading (Table 2).
Figure 4 provides the geometric configuration of the structural frame and the progression from plan layout to fully meshed three-dimensional models. Figure 4a presents the plan view of the structural grid, while Figure 4b illustrates the column positioning. Figure 4c,d show the meshed representations of a 20-storey and a 15-storey high-rise structure, respectively, with explicit modelling of slab and column elements. This figure serves as the geometric foundation for subsequent structural analyses.

4.1. Results of Debris Propagation in the 20-Storey Building: Influence of Time Interval

In this section, a series of simulations were performed on the 20-storey building, focusing on the influence of time intervals between successive column removals on debris propagation. As visualized in Figure 5, Figure 6 and Figure 7, the columns in the first axis were removed over 4 storeys, followed by 3 storeys in the second axis, and 2 storeys in the third axis, with sequential removals conducted at intervals of 100 ms, 300 ms, and 500 ms. Table 3 summarizes the sequential column removal scenarios applied with staggered storey removals. These removals follow a 4–3–2 sequence and are executed at time intervals of 100 ms, 300 ms, and 500 ms. The table details the corresponding trigger times for each axis, illustrating the temporal progression of the collapse initiation across the axes.
The horizontal debris spread was systematically recorded and analyzed for each scenario. Figure 5, Figure 6 and Figure 7 illustrate the horizontal debris dispersion distances for the 20-storey structure under varying time interval conditions. Figure 5, Figure 6 and Figure 7 correspond to the debris dispersion for the 20-storey structure with the same removal sequence applied at 100 ms, 300 ms, and 500 ms intervals, respectively. Each figure presents a series of snapshots captured at 2 s intervals (t = 0, 2, 4, 6, and 8 s), with the initial stage depicted in the first image of each figure.
Figure 8 presents the time-history of horizontal debris distance in the X-direction, showing final debris reach values of approximately 36.4 m, 39.9 m, and 42.4 m for 100, 300, and 500 ms, respectively. The results of the analysis and the debris dispersion distance (unit in meters) are presented below (Figure 8).
The analysis results (Figure 8) reveal that:
  • At 100 ms interval, the maximum horizontal debris distance reached approximately −42.39 m.
  • At 300 ms interval, debris spread was around −39.9 m.
  • At 500 ms interval, debris spread was about −36.4 m.

4.2. Results of Debris Propagation in the 15-Storey Building: Influence of Time Interval

A similar set of sequential column removal scenarios was implemented on the 15-storey building (Figure 9, Figure 10 and Figure 11), employing the same 4–3–2 removal sequence with time intervals of 100 ms, 300 ms, and 500 ms. The objective was to investigate how the reduced building height influences horizontal momentum transfer and the resulting severity of collapse propagation.
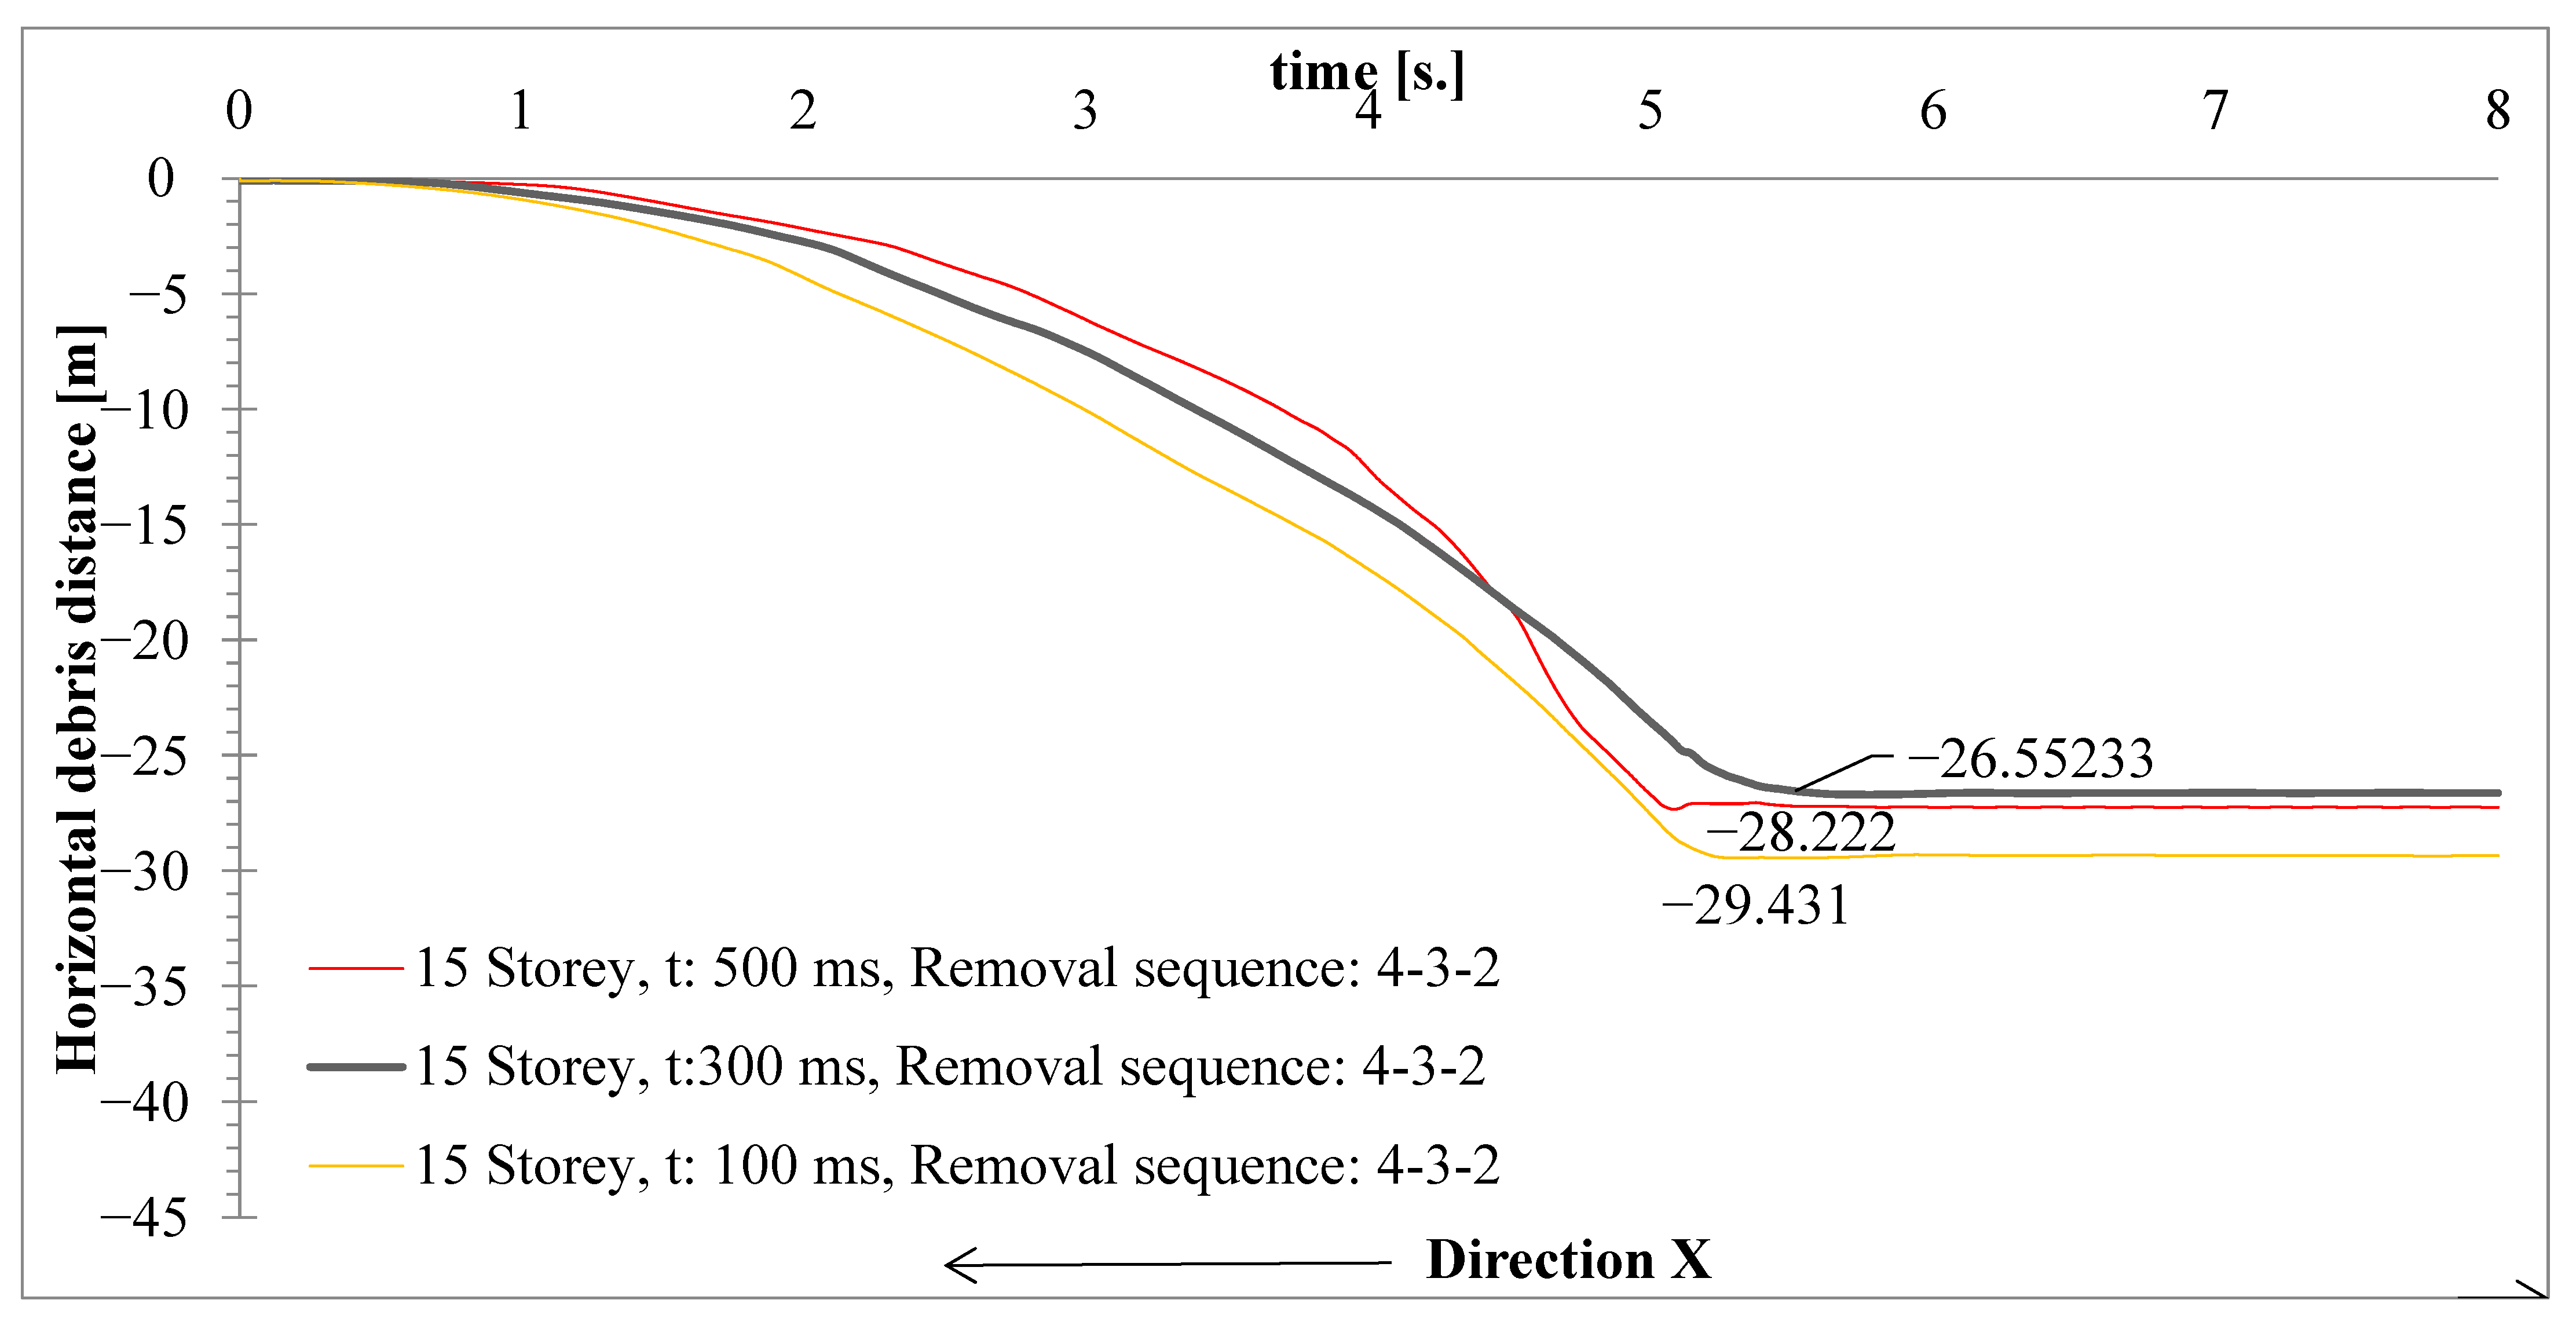
The results confirm that shorter structures exhibit reduced horizontal debris spread primarily due to their lower building height. Consequently, the horizontal debris dispersal distances are significantly smaller compared to those recorded for the 20-storey building. Specifically, the maximum debris spread in the X-direction was approximately 26.6 m at the 500 ms interval, increasing slightly to 28.2 m at 300 ms, and 29.4 m at 100 ms.
These findings suggest that, while the time delay between sequential removals affects the collapse mechanism, the initial structural height remains the dominant parameter controlling the final debris reach. Horizontal debris spread was carefully measured and analyzed for each scenario. Figure 9, Figure 10 and Figure 11 depict the debris dispersion distances corresponding to the 15-storey structure across the different time intervals.
Figure 12 presents a detailed temporal analysis of the maximum horizontal debris distances recorded during the progressive collapse simulations of the 15-storey building. The simulations employ a consistent sequential column removal pattern following the 4–3–2 removal sequence, with three distinct time intervals of 100 ms, 300 ms, and 500 ms between successive removals. This figure captures the dynamic evolution of debris spread as the collapse progresses, providing a comparative perspective on how varying the delay intervals influences the extent and rate of horizontal debris propagation. By illustrating the differences in debris dispersion over time for each time interval, the figure offers critical insights into the interplay between demolition timing and collapse behavior in mid-rise structures. The results shown here form a key component in understanding the controlled demolition process and optimizing removal sequences to minimize hazard potential and ensure safety in urban environments.
For the 15-storey structure the results reveal that (Figure 12):
  • At 100 ms interval, the debris reached approximately −29.43 m.
  • At 300 ms interval, it was around −28.22 m.
  • At 500 ms interval, it was about −26.55 m.
These results indicate that the shortest time interval (100 ms) generally produces the largest horizontal debris spread, whereas the 300 ms and 500 ms intervals yield more comparable debris dispersion outcomes.
Observations from time interval-based scenarios can be summarized as follows:
  • In both the 20-storey and 15-storey models, the maximum debris dispersion occurred under the 100 ms interval scenario, indicating a more aggressive collapse pattern caused by rapid sequential failure.
  • The 300 ms and 500 ms scenarios exhibited relatively reduced horizontal debris spread, with the 300 ms interval providing an optimal balance between collapse progression and debris containment.
  • For the 15-storey structure, although the 100 ms interval still produced the largest debris spread, the differences in debris distances among the three time intervals were less pronounced. This suggests that factors such as structural stiffness and mass distribution reduce the sensitivity of debris propagation to timing variations.

5. Results and Discussions on Modified Collapse Sequences Under 300 Millisecond (ms) Delay

Considering the debris spread behavior, the 300 ms interval was selected for subsequent analyses presented in Section 5. This choice balances two critical considerations:
(a)
The 100 ms interval leads to maximum debris dispersion,
(b)
The 500 ms interval, although offering more time between removals, results in longer durations during which the non-demolished sections remain structurally unsupported, risking unintended collapse or instability. Thus, a 300 ms interval represents an optimal compromise, maintaining controlled collapse progression while limiting excessive debris spread and preserving short-term structural stability of the remaining sections during demolition.
Subsequently, three additional collapse sequences were defined to investigate the effect of removal location and order on debris dispersion. All removals maintained the 300 ms time interval between successive actions (Table 4).
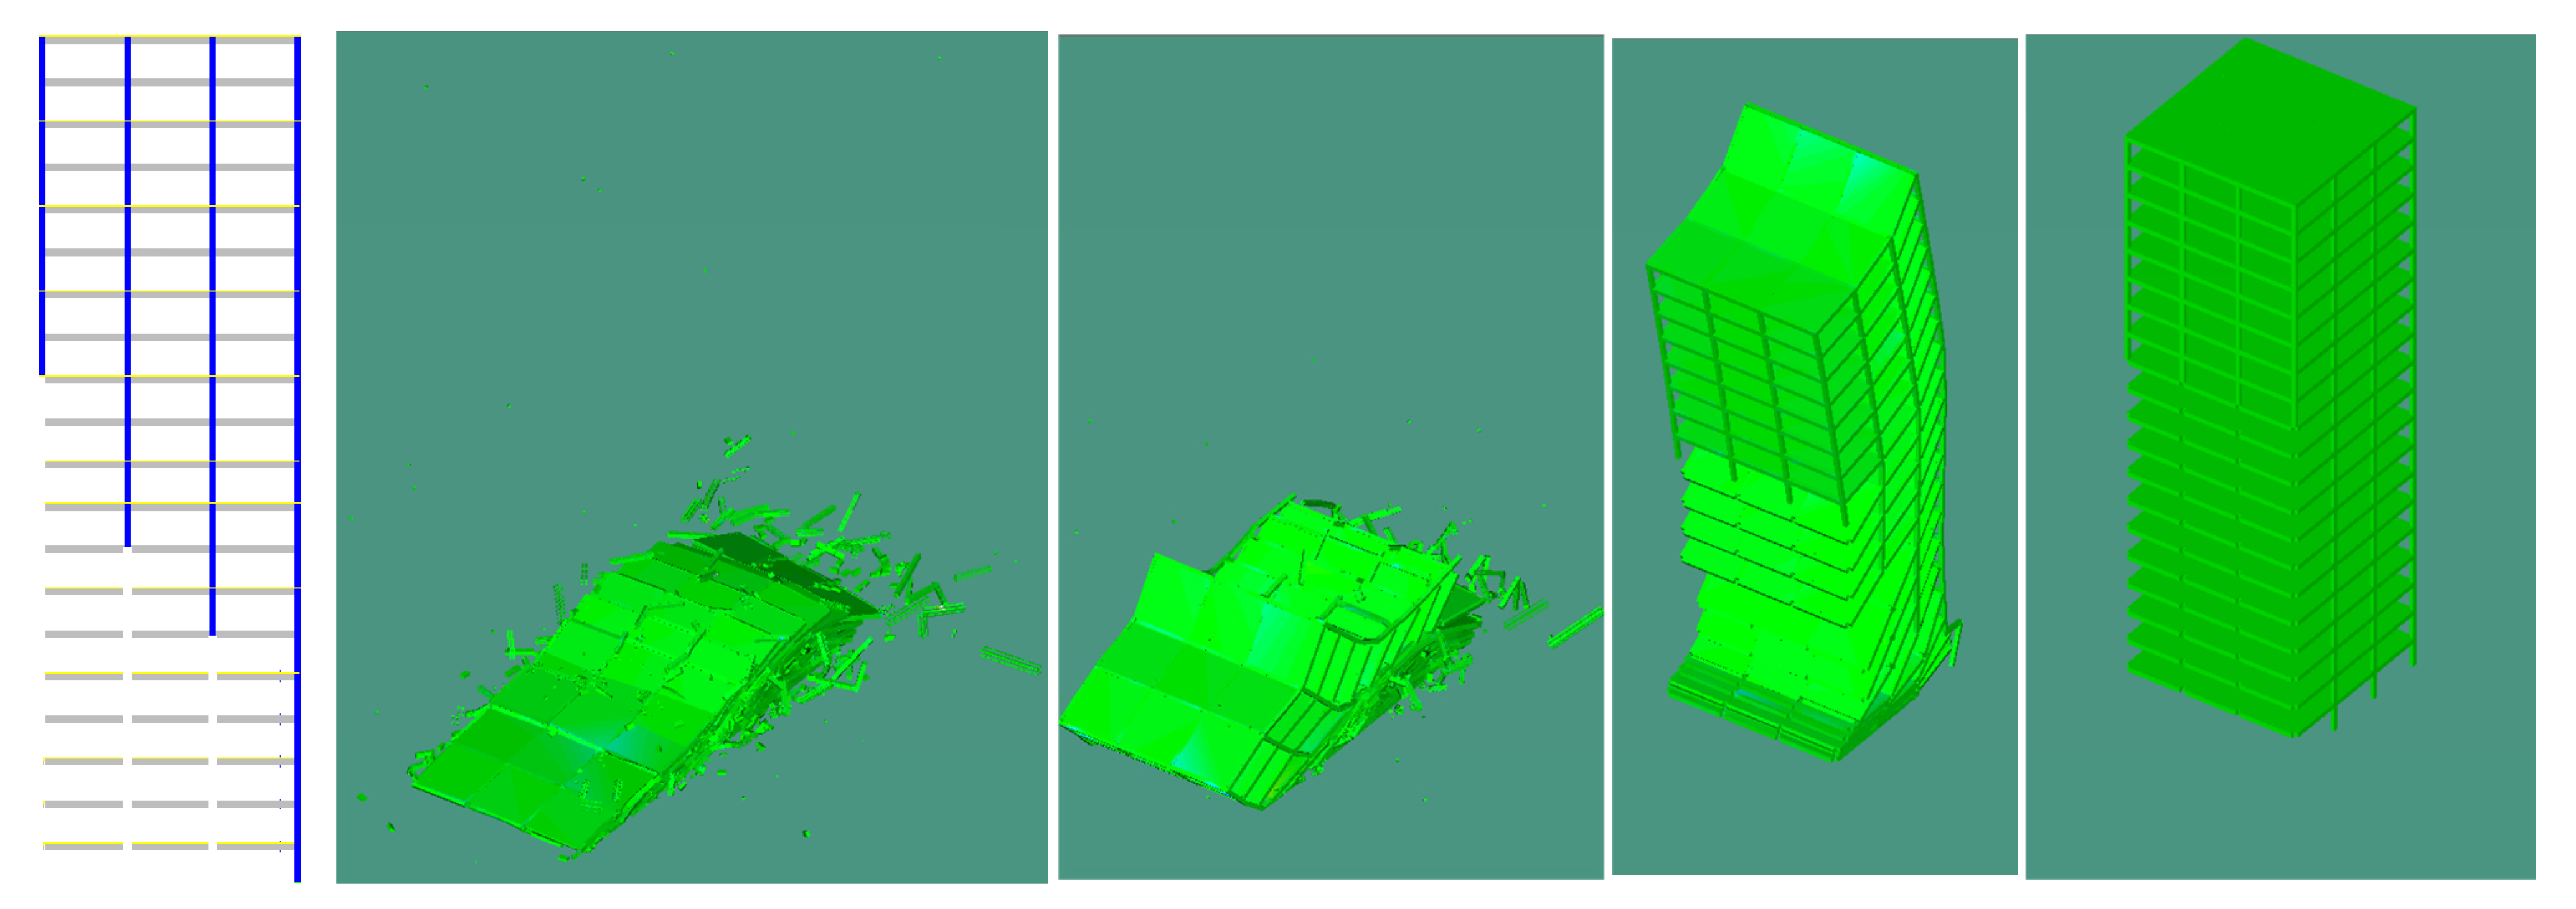
The analysis focuses on the 20-storey structure with a fixed 300 ms removal interval while varying the column removal sequences to minimize horizontal debris spread. The sequences evaluated include 4–3–2, 12–8–6, and 16–12–6 (Figure 13, Figure 14 and Figure 15).
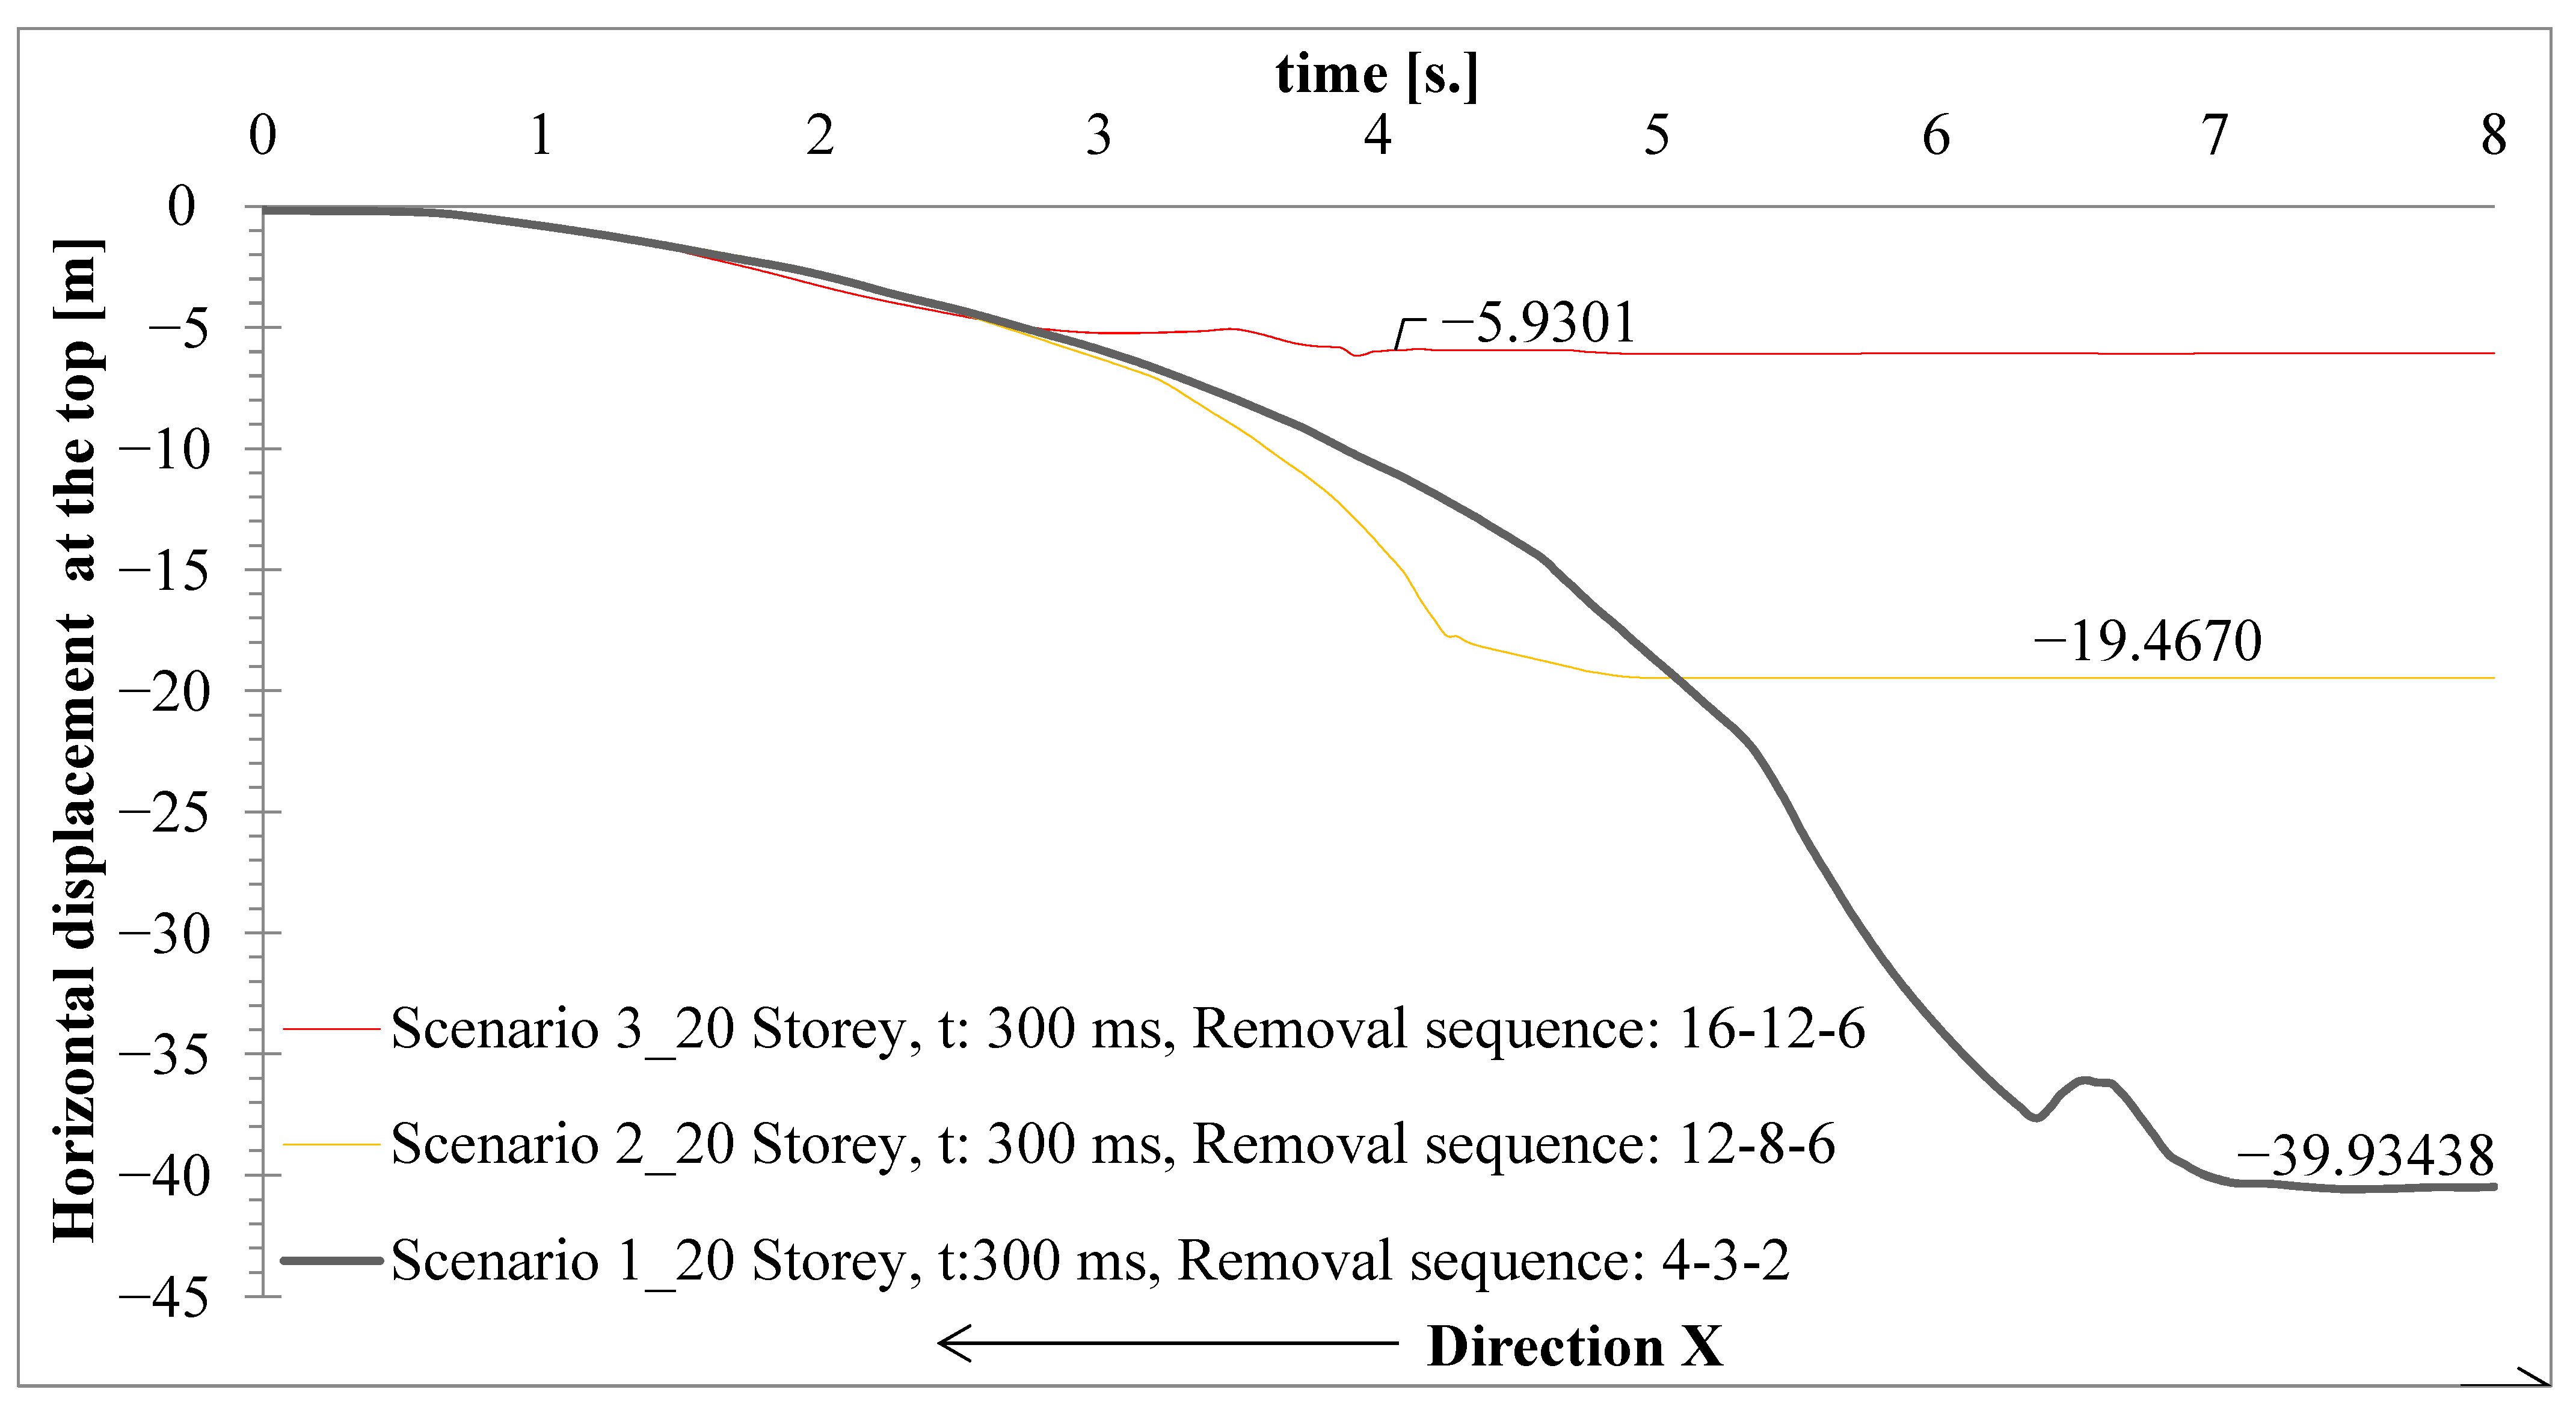
Figure 16 illustrates the evolution of maximum horizontal debris distances over time during the controlled demolition simulations of the 20-storey building. The analyses were conducted with a constant time interval of 300 ms between sequential column removals.
For the 20-storey structure with a constant 300 ms time interval under different sequence removal scenarios, the results reveal that (Figure 12):
  • Scenario 1: Under the 4–3–2 removal sequence, the debris distance reached approximately −39.9 m.
  • Scenario 2: For the 12–8–6 sequence, debris distance was reduced to about −19.46 m.
  • Scenario 3: The 16–12–6 sequence further decreased the debris spread to around −5.93 m.
Three different removal sequence scenarios (S1, S2, and S3) are compared to evaluate their influence on debris spread. Scenario 1 (S1) follows the 4–3–2 sequence, Scenario 2 (S2) the 12–8–6 sequence, and Scenario 3 (S3) the 16–12–6 sequence. The figure clearly shows that Scenario 1 results in the largest maximum debris distances at almost all recorded times. Scenario 2 demonstrates a moderate reduction in debris spread compared to Scenario 1. Scenario 3 consistently yields the smallest debris distances, indicating the most controlled collapse with minimal horizontal dispersion. The time-dependent curves reveal the dynamic progression of debris propagation as the demolition unfolds. These results emphasize the significant role of removal sequencing in mitigating debris hazards during progressive collapse. These findings, illustrated in Figure 16, demonstrate that adjusting the removal sequence significantly impacts the debris dispersion and can effectively reduce the horizontal extent of collapse debris.

Limitations of the Study

Given the inherent complexity of progressive and controlled collapse dynamics, the present study is subject to certain limitations. Further investigations using additional case studies and high-fidelity, time-dependent nonlinear analyses would be valuable to more comprehensively assess sensitivity to material properties and modeling assumptions. Moreover, the results reported here apply specifically to structures within the defined scope of this study, and caution should be exercised when generalizing to configurations or materials beyond this range. Therefore, real-world data and diverse validation are important, as they contribute to the further development and robustness of the field.

6. Conclusions

This study presents a comprehensive investigation into the simulation of a high-rise building collapse process using the Applied Element Method (AEM), with a specific focus on the horizontal distribution of debris resulting from sequential column removal scenarios. In contrast to conventional Finite Element Method (FEM) approaches, the proposed methodology is not blast-induced but rather adopts a progressive collapse framework through time-delayed column extractions, enabling a practical and engineering-informed understanding of structural disintegration.
The study systematically evaluated the effects of sequential column removal timing and sequence on horizontal debris spread in progressive collapse simulations of tall building structures. Initial analyses (Figure 8 and Figure 12) revealed that shorter removal intervals increase debris dispersion, but intervals that are too long risk destabilizing the undemolished structure sections.
Analyses were conducted on 15- and 20-storey buildings; these heights were chosen to represent commonly encountered high-rise structures within a practical representative range, and the number of column removals was selected based on actual project cases to reflect realistic scenarios while maintaining computational feasibility.
Results from both building heights show that the largest debris spread was observed under the 100 ms interval, indicating a higher degree of sudden energy release and loss of vertical load paths. In contrast, the 300 ms and 500 ms intervals exhibited more localized and reduced debris propagation, suggesting that delayed removals allow for partial energy dissipation and controlled debris behavior. However, in the 15-storey configuration, the differences between the 300 ms and 500 ms cases were less significant, highlighting a possible diminishing return in extending time delays beyond a certain threshold.
Based on these findings, a 300 ms removal interval was selected for deeper investigation due to its balanced approach between controlled demolition realism and debris containment. For the subsequent investigation, 300 ms was selected as the optimal time interval to assess different removal sequences: Scenario 1 (levels 4–3–2), Scenario 2 (levels 12–8–6), and Scenario 3 (levels 16–12–6). The aim of these additional simulations was to minimize debris dispersal while maintaining structural realism. Further analysis in Section 5 showed that by optimizing the removal sequence, significant reductions in horizontal debris spread can be achieved, as evidenced by the reduction from nearly 40 m in the baseline sequence to under 6 m in the optimized sequence.
Results showed a clear trend in debris spread reduction across the scenarios: Scenario 1 resulted in the widest debris distribution, with horizontal debris reaching approximately 39.9 m; Scenario 2 reduced the debris spread to about 19.46 m; and Scenario 3 achieved the most compact debris footprint, further decreasing debris dispersion to approximately 5.93 m. These findings demonstrate that both the timing and sequence of column removal, particularly the vertical positioning and spacing of removals, critically influence the extent and pattern of debris propagation.
In conclusion, the study demonstrates that AEM-based simulations incorporating time-delayed, sequenced column removals offer a valuable framework for understanding and optimizing controlled demolition strategies, particularly in urban environments where minimization of debris spread is crucial. The outcomes offer practical insights for both engineering design and post-collapse safety planning.
The study highlights the sensitivity of debris distribution to both the time interval and spatial sequence of column removals during progressive collapse. Key findings include:
  • Rapid column removals (e.g., 100 ms) cause the most extensive horizontal debris dispersion, especially in taller structures.
  • A 300 ms delay offers a balance between progressive failure realism and debris containment.
  • The sequence of removal significantly influences collapse behavior; evenly spaced, higher-level removals (as in Scenario 3) reduce debris extent.
  • Excessively long removal intervals risk destabilizing remaining structural parts, demonstrating the need for an optimized timing window.
  • Vertical positioning and the number of columns removed per sequence directly affect debris footprint size, confirming the necessity of scenario-specific demolition planning.
This study encompasses a variety of scenarios involving different timing intervals and removal sequences, providing a solid foundation for understanding progressive collapse behavior. The Applied Element Method (AEM), with its discrete element-based formulation with springs, demonstrates notable computational efficiency, characterized by a streamlined model setup process and reduced analysis runtimes. These features collectively position AEM as an effective and promising tool for advancing the understanding and optimization of progressive collapse strategies.
Future research would benefit from extending the present findings by explicitly incorporating cost implications, safety considerations, and implementation constraints, as these factors are essential for real-world applicability. Moreover, exploring a broader range of models and conditions would be valuable to further generalize and validate the outcomes. In this regard, different building typologies can be investigated to enhance the transferability of the results across diverse structural systems. Forthcoming studies can also integrate artificial intelligence–assisted approaches, enabling systematic cost–benefit evaluations, improved safety strategies, and data-driven insights. Such developments would not only complement the current work but also foster practical and sustainable applications in demolition and structural risk assessment.
Overall, these results emphasize the critical role of timing and sequence strategies in minimizing debris hazards, improving safety, and enhancing control in progressive collapses of tall buildings.

Funding

This research received no external funding.

Data Availability Statement

All data generated or used during the study appear in the article.

Acknowledgments

Gratitude is expressed to ASI for their support providing ELS. Appreciation is also expressed to Mehmet Guler for university-industry collaboration.

Conflicts of Interest

The author declares no conflicts of interest.

Abbreviations

The following abbreviations are used in this manuscript:
FEMFinite Element Method
AEMApplied Element Method
msmillisecond
ttime
ssecond
mmeter
RCReinforced Concrete

References

  1. Yuzbasi, J. Controlled demolition: Novel monitoring and experimental validation of blast-induced full-scale existing high-rise building implosion using numerical finite element simulations. J. Civ. Struct. Health Monit. 2024, 15, 891–914. [Google Scholar] [CrossRef]
  2. Michaloudis, G.; Blankenhorn, G.; Mattern, S.; Schweizerhof, K. Modelling structural failure with finite element analysis of controlled demolition of buildings by explosives using LS-DYNA. In High Performance Computing in Science and Engineering’09: Transactions of the High Performance Computing Center, Stuttgart (HLRS) 2009; Springer: Berlin/Heidelberg, Germany, 2010; pp. 539–551. [Google Scholar] [CrossRef]
  3. Yuzbasi, J. Experimental verification of full-scale silo structure demolition: Investigating successive column removal with finite element method and progressive collapse simulation through blast load. Struct. Concr. 2024, 25, 4408–4427. [Google Scholar] [CrossRef]
  4. Karasin, I.B. Comparative analysis of the 2023 Pazarcık and Elbistan Earthquakes in Diyarbakır. Buildings 2023, 13, 2474. [Google Scholar] [CrossRef]
  5. Işık, E. Structural failures of adobe buildings during the February 2023 Kahramanmaraş (Türkiye) earthquakes. Appl. Sci. 2023, 13, 8937. [Google Scholar] [CrossRef]
  6. Elnashai, A.S.; Di Sarno, L. Fundamentals of Earthquake Engineering: From Source to Fragility; John Wiley & Sons: Hoboken, NJ, USA, 2015. [Google Scholar]
  7. Di Sarno, L. Effects of multiple earthquakes on inelastic structural response. Eng. Struct. 2015, 56, 673–681. [Google Scholar] [CrossRef]
  8. Ivanov, M.L.; Chow, W.K. Structural damage observed in reinforced concrete buildings in Adiyaman during the 2023 Türkiye Kahramanmaras Earthquakes. In Structures; Elsevier: Amsterdam, The Netherlands, 2023; Volume 58, p. 105578. [Google Scholar] [CrossRef]
  9. Yuzbasi, J. Post-Earthquake Damage assessment: Field observations and recent developments with recommendations from the Kahramanmaraş earthquakes in Türkiye on February 6th, 2023 (Pazarcık M7. 8 and Elbistan M7. 6). J. Earthq. Eng. 2024, 1–26. [Google Scholar] [CrossRef]
  10. Büyüksaraç, A.; Işık, E.; Bektaş, Ö.; Avcil, F. Achieving intensity distributions of 6 February 2023 Kahramanmaraş (Türkiye) earthquakes from peak ground acceleration records. Sustainability 2024, 16, 599. [Google Scholar] [CrossRef]
  11. Wang, T.; Chen, J.; Zhou, Y.; Wang, X.; Lin, X.; Wang, X.; Shang, Q. Preliminary investigation of building damage in Hatay under February 6, 2023 Türkiye earthquakes. Earthq. Eng. Eng. Vib. 2023, 22, 853–866. [Google Scholar] [CrossRef]
  12. Kobbekaduwa, D.; Yang, P.; Nanayakkara, O.; Krevaikas, T.; Di Sarno, L. Experimental study on corroded reinforced concrete columns repaired with textile-reinforced mortar (TRM) and organic corrosion inhibitors. Constr. Build. Mater. 2025, 491, 142702. [Google Scholar] [CrossRef]
  13. Pei, S.; Van De Lindt, J.W.; Barbosa, A.; Berman, J.; McDonnell, E.; Dolan, J.D.; Blomgren, H.-E.; Zimmerman, R.B.; Huang, D.; Wichman, S. Experimental seismic response of a resilient 2-story mass-timber building with post-tensioned rocking walls. J. Struct. Eng. 2019, 145, 04019120. [Google Scholar] [CrossRef]
  14. Zarate Garnica, G.I.; Lantsoght, E.O.L.; Yang, Y. Monitoring structural responses during load testing of reinforced concrete bridges: A review. Struct. Infrastruct. Eng. 2022, 18, 1558–1580. [Google Scholar] [CrossRef]
  15. Di Sarno, L.; Albuhairi, D.; Medeiros, J.M.P. Exploring innovative resilient and sustainable bio-materials for structural applications: Hemp-fibre concrete. In Structures; Elsevier: Amsterdam, The Netherlands, 2024; Volume 68, p. 107096. [Google Scholar] [CrossRef]
  16. Yuzbasi, J. Research and Practice on Demolition of Structures Worldwide in the 21st Century: Exploring Methods Using Mechanics of Solid Bodies with Object Tracking Validation. In Proceedings of the CIBv 2024—Civil Engineering and Buildings Services; Tuns, I., Muntean, R., Gălățanu, T., Cazacu, C., Conțiu, M., Eds.; Springer: Cham, Switzerland, 2025; Volume 665. [Google Scholar] [CrossRef]
  17. Kocakaplan Sezgin, S.; SAYGILI, Ö. Architectural Heritage After the February 6th Kahramanmaras Earthquakes: Preliminary Observations on Historical Masonry Structures. Afyon Kocatepe Üniv. Fen Ve Mühendis. Bilim. Derg. 2025, 25, 621–634. [Google Scholar] [CrossRef]
  18. Thomsen, A.; Schultmann, F.; Kohler, N. Deconstruction, demolition and destruction. Build. Res. Inf. 2011, 39, 327–332. [Google Scholar] [CrossRef]
  19. Yankelevsky, D.Z.; Schwarz, S.; Brosh, B. Full scale field blast tests on reinforced concrete residential buildings–from theory to practice. Int. J. Prot. Struct. 2013, 4, 565–590. [Google Scholar] [CrossRef]
  20. Schenker, A.; Anteby, I.; Gal, E.; Kivity, Y.; Nizri, E.; Sadot, O.; Michaelis, R.; Levintant, O.; Ben-Dor, G. Full-scale field tests of concrete slabs subjected to blast loads. Int. J. Impact Eng. 2008, 35, 184–198. [Google Scholar] [CrossRef]
  21. Jiang, J.; Zhang, Z.; Ke, C. Study on Dynamic Response and Progressive Collapse Resistance of Space Steel Frame Under Impact Load. Buildings 2025, 15, 1888. [Google Scholar] [CrossRef]
  22. Jiang, L.; Zhao, C.; Zhang, S.; Qiu, M.; Zhang, R.; Li, Y.; Zhang, W.; Yu, S. Failure Mechanisms of Basalt Fiber Concrete Under Splitting Tensile Tests and DEM Simulations. Buildings 2025, 15, 3035. [Google Scholar] [CrossRef]
  23. Zhang, Z.; Davis, L.; Malomo, D. Distinct Element macro-crack networks for expedited discontinuum seismic analysis of large-scale URM structures. J. Build. Eng. 2024, 97, 110962. [Google Scholar] [CrossRef]
  24. Devanand, K.; Ghiassi, B.; Faramarzi, A.; Mehravar, M. Particle-Based DEM to Assess Masonry Behaviour Under Compression. In Proceedings of the 18th International Brick and Block Masonry Conference, Birmingham, UK, 21–24 July 2024; Springer Nature: Cham, Switzerland, 2024; pp. 254–271. [Google Scholar] [CrossRef]
  25. Chen, X.; Liang, Z.; Chan, A.H. Simulating the damage of rubble stone masonry walls using FDEM with a detailed micro-modelling approach. Comput. Part. Mech. 2024, 11, 2839–2855. [Google Scholar] [CrossRef]
  26. Yuzbasi, J.; Arslan, H.M. Applied element method and Finite element method for progressive collapse assessment: A comparative study on the influence of slab types, thicknesses, and damping via three incremental column removals. In Structures; Elsevier: Amsterdam, The Netherlands, 2025; Volume 73, p. 108358. [Google Scholar] [CrossRef]
  27. Chen, G.; Cheng, X.; Diao, M.; Li, Y.; Lu, Y. Progressive collapse resistance of one-way wet-connected precast concrete beam-slab-column substructures: Experimental and numerical investigations. Eng. Struct. 2025, 344, 121288. [Google Scholar] [CrossRef]
  28. Guo, M.; Huang, H.; Yang, S.; Huang, M. Experimental and numerical investigation on progressive collapse resistance of three-dimensional RC structures. Eng. Fail. Anal. 2025, 167, 108954. [Google Scholar] [CrossRef]
  29. Song, M.; Wang, Z.; Chen, X.; Liu, B.; Huang, S.; He, J. Numerical Investigation of Progressive Collapse Resistance in Fully Bonded Prestressed Precast Concrete Spatial Frame Systems with and Without Precast Slabs. Buildings 2025, 15, 2743. [Google Scholar] [CrossRef]
  30. Tan, K.H. Experimental study on progressive collapse behaviour of intact and slightly earthquake-damaged exterior precast concrete joints, and finite element modelling of building performance. Eng. Struct. 2025, 333, 120146. [Google Scholar] [CrossRef]
  31. Savin, S.; Kolchunov, V.; Fedorova, N.; Tuyen Vu, N. Experimental and Numerical Investigations of RC Frame Stability Failure under a Corner Column Removal Scenario. Buildings 2023, 13, 908. [Google Scholar] [CrossRef]
  32. Fascetti, A.; Kunnath, S.K.; Nisticò, N. Robustness evaluation of RC frame buildings to progressive collapse. Eng. Struct. 2015, 86, 242–249. [Google Scholar] [CrossRef]
  33. Izzuddin, B.A. Robustness by design–Simplified progressive collapse assessment of building structures. Stahlbau 2010, 79, 556–564. [Google Scholar] [CrossRef]
  34. Al-Sadoon, Z.A.; Junaid, M.T.; Al-Sabouni, U.; Dabous, S.A.; Almaghari, H. Resilience of code compliant reinforced concrete buildings to progressive collapse: A numerical analysis investigation. Results Eng. 2024, 24, 102982. [Google Scholar] [CrossRef]
  35. Huang, H.; Huang, M.; Zhang, W.; Guo, M.; Chen, Z.; Li, M. Progressive collapse resistance of multistory RC frame strengthened with HPFL-BSP. J. Build. Eng. 2021, 43, 103123. [Google Scholar] [CrossRef]
  36. Elsanadedy, H.M.; Almusallam, T.H.; Abbas, H.; Al-Salloum, Y.A. Innovative Retrofitting for Disaster Resilience: Optimizing Steel Plate Grade and Scheme in RC Non-Seismic Frames to Prevent Progressive Collapse. Buildings 2025, 15, 3325. [Google Scholar] [CrossRef]
  37. Mokashi, V.M.; Jadhav, H.S. Progressive collapse analysis and seismic performance of irregular RC structures: A probabilistic approach. Asian J. Civ. Eng. 2024, 25, 4911–4921. [Google Scholar] [CrossRef]
  38. Ferraioli, M.; Laurenza, B.; Lavino, A.; De Matteis, G. Progressive collapse analysis and retrofit of a steel-RC building considering catenary effect. J. Constr. Steel Res. 2024, 213, 108364. [Google Scholar] [CrossRef]
  39. Ding, L.; Dai, X.; Gan, Y.; Zeng, Y. Impact of Reinforcement Corrosion on Progressive Collapse Behavior of Multi-Story RC Frames. Buildings 2025, 15, 2534. [Google Scholar] [CrossRef]
  40. Costanzo, S.; Cassiano, D.; D’Aniello, M. Robustness of Steel Moment-Resisting Frames Under Column Loss Scenarios with and without Prior Seismic Damage. Buildings 2025, 15, 2490. [Google Scholar] [CrossRef]
  41. Wang, Z.; Yin, J.; Wang, Z.; Yi, J. Dynamic Response and Anti-Collapse Analysis of Multi-Column Demolition Mode in Frame Structures. Buildings 2025, 15, 1525. [Google Scholar] [CrossRef]
  42. Yuzbasi, J. Progressive Collapse Analysis of Steel Structures. Cukurova Univ. J. Fac. Eng. 2025, 40, 429–444. [Google Scholar]
  43. Gnedin, N.Y.; Semenov, V.A.; Kravtsov, A.V. Enforcing the Courant–Friedrichs–Lewy condition in explicitly conservative local time stepping schemes. J. Comput. Phys. 2018, 359, 93–105. [Google Scholar] [CrossRef]
  44. Higaki, T.; Tanabe, Y.; Hashimoto, H.; Iida, T. Step-by-step enhancement of a graph neural network-based surrogate model for Lagrangian fluid simulations with flexible time step sizes. Appl. Ocean Res. 2025, 154, 104424. [Google Scholar] [CrossRef]
  45. Meguro, K.; Tagel-Din, H. Applied Element Method: A New Efficient Tool for Design of Structure Considering Its Failure Behavior; Institution of Industrial Science (IIS), The University of Tokyo: Tokyo, Japan, 2001; pp. 1–20. [Google Scholar]
  46. Meguro, K.; Tagel-Din, H. Applied element method for structural analysis: Theory and application for linear materials. Struct. Eng. Earthq. Eng. JSCE 2000, 17, 15. [Google Scholar] [CrossRef] [PubMed]
  47. Tagel-Din, H.; Meguro, K. Applied element method for dynamic large deformation analysis of structures. Struct. Eng. Earthq. Eng. JSCE 2000, 17, 215–224. [Google Scholar] [CrossRef] [PubMed]
  48. Tagel-Din, H.; Meguro, K. Applied element method for simulation of nonlinear materials: Theory and application for RC structures. Struct. Eng. Earthq. Eng. JSCE 2000, 17, 137–148. [Google Scholar]
  49. Christy, D.L.; Pillai, T.M.; Nagarajan, P.; Manimaran, L. Determination of Crack Pattern in Concrete Structures Using Applied Element Method. Mater. Sci. Forum 2019, 969, 303–308. [Google Scholar] [CrossRef]
  50. Yuzbasi, J. Applied element method: Earthquake simulation analysis of soft story and weak story in building structures using solid mechanics. In Proceedings of the CIBv 2024—Civil Engineering and Buildings Services; Springer Nature: Cham, Switzerland, 2024; pp. 695–712. [Google Scholar] [CrossRef]
Figure 1. Plan view of the validation model building [1].
Buildings 15 03396 g001
Figure 2. FEM solid RC model elevation; (a) FEM solid rebars model with air; (b) AEM solid RC model; (c) AEM solid rebars model; (d) AEM progressive collapse-based column removal (e).
Buildings 15 03396 g002
Figure 3. Visual validation of the AEM-based solid model by comparison with real demolition footage.
Buildings 15 03396 g003
Figure 4. (a) the plan layout of the frame system; (b) the column layout; (c) 20-storey fully meshed solid model, and (d) the visualization of the three-dimensional 15-storey high-rise structure.
Buildings 15 03396 g004
Figure 5. 20 Storey-100 ms Removal Sequence: 4–3–2.
Buildings 15 03396 g005
Figure 6. 20 Storey-300 ms Removal Sequence: 4–3–2.
Buildings 15 03396 g006
Figure 7. 20 Storey-500 ms Removal Sequence: 4–3–2.
Buildings 15 03396 g007
Figure 8. 20 Storey; Removal Sequence: 4–3–2; Time intervals: 100 ms, 300 ms, 500 ms; Maximum debris distances over time.
Buildings 15 03396 g008
Figure 9. 15 Storey-100 ms Removal Sequence: 4–3–2.
Buildings 15 03396 g009
Figure 10. 15 Storey-300 ms Removal Sequence: 4–3–2.
Buildings 15 03396 g010
Figure 11. 15 Storey-500 ms Removal Sequence: 4–3–2.
Buildings 15 03396 g011
Figure 12. 15 Storey; Removal Sequence: 4–3–2; Time intervals: 100 ms, 300 ms, 500 ms; Maximum debris distances over time.
Buildings 15 03396 g012
Figure 13. Scenario 1: 20 Storey-300 ms Removal Sequence: 4–3–2.
Buildings 15 03396 g013
Figure 14. Scenario 2: 20 Storey-300 ms Removal Sequence: 12–8–6.
Buildings 15 03396 g014
Figure 15. Scenario 3: 20 Storey-300 ms-Removal Sequence: 16–12–6.
Buildings 15 03396 g015
Figure 16. 20 Storey; Time interval: constant 300 ms; Removal Sequence Scenarios: S1, S2, S3; Maximum debris distances over time.
Buildings 15 03396 g016
Table 1. Modelling framework and validation approach applied in the numerical study.
CategoryParameterDescription
Numerical methodApplied Element Method (AEM)Used for detailed collapse simulation
Collapse typeProgressive CollapseSequential column removal scenarios
Slab StrategyThin Structure Correction Factor (TSCF)Applied to capture out-of-plane flexural behavior
Model typeSolid model with rebarReinforced concrete with detailed meshing
Validation referenceReal demolition footageUsed for visual comparison with model
Validation methodVisual validationComparison using fixed-camera and drone imagery
Highlighted zonesRear (Blue), Front (Orange)Emphasized for debris spread similarity
Table 2. Geometry and Material Properties of the RC Building Models.
Parameter15-Storey Model20-Storey Model
Story height3.0 m3.0 m
Total building height45.0 m60.0 m
Typical span length6.0 m6.0 m
Column cross-section120 × 120 cm120 × 120 cm
Beam cross-section75 × 90 cm75 × 90 cm
Slab thickness20 cm20 cm
Reinforcement ratio (vertical members)4%4%
Concrete gradeC40C40
Steel gradeS420S420
Table 3. Column removal timing for each scenario: Uniformly from left to right (Axis 1 to Axis 3).
Scenario Time IntervalAxis 1 Trigger TimeAxis 2 Trigger TimeAxis 3 Trigger Time
100 ms0 ms100 ms200 ms
300 ms0 ms300 ms600 ms
500 ms0 ms500 ms1000 ms
Table 4. Column removal sequence and timings under fixed 300 ms delay.
Scenario1st Removal2nd Removal3rd Removal
S1Storey 4Storey 3Storey 2
S2Storey 12Storey 8Storey 6
S3Storey 16Storey 12Storey 6
Disclaimer/Publisher’s Note: The statements, opinions and data contained in all publications are solely those of the individual author(s) and contributor(s) and not of MDPI and/or the editor(s). MDPI and/or the editor(s) disclaim responsibility for any injury to people or property resulting from any ideas, methods, instructions or products referred to in the content.