Abstract
Digital Building Logbooks (DBLs) have been proposed to preserve lifecycle data across the design, construction, operation, and renovation phases of buildings. Yet, implementation has been hindered by the absence of standardized data models across jurisdictions and stakeholder practices. This paper argues that Large Language Models (LLMs) offer a solution that reduces reliance on rigid standardization. To test this approach, we first draw on parallels from the healthcare sector, where LLMs have extracted structured information from unstructured electronic health records. Second, we present an LLM-based workflow for processing unstructured building inspection reports. The workflow encompassed three tasks: (1) qualitative summary, (2) quantitative summary, and (3) risk level assessment. Sixteen inspection reports were processed through GPT-4o across 320 runs via a Python script. Results showed perfect consistency for categorical fields and Boolean indicators, minimal variability for ordinal severity ratings (σ ≤ 0.6), and stable risk assessments with 87.5% of reports showing low standard deviations. Each report was processed in under 10 s, representing up to a 100-fold speed improvement over manual review. These findings demonstrate the feasibility of post hoc standardization, positioning DBLs to evolve into large-scale knowledge bases that can substantially advance research on the built environment.
1. Introduction
1.1. Background
In the current era, digital information has emerged as one of society’s most valuable collective resources, enabling informed decision-making, innovation, and strategic planning across sectors [1]. The emergence of machine learning (ML), a subset of artificial intelligence (AI), has further emphasized the need for structured and well-organized datasets across all data-intensive domains, including the built environment. ML encompasses a family of algorithms capable of identifying patterns and making predictions based on data. These models typically require inputs to be formatted in a tabular, numerical, or otherwise structured form to perform effectively [1]. Another important feature of ML is that most applications require a large database in order to achieve sufficient predictive accuracy, a concept often referred to as big data [2].
Yet, within the architecture, engineering, and construction (AEC) industry, vast quantities of information that are produced throughout the lifecycle of buildings remain fragmented and inaccessible. This situation can be seen as a digital equivalent to the tragedy of the commons [3], where valuable data that could inform sustainability, improve safety, and drive innovation is effectively lost due to the absence of coordinated collection and storage mechanisms.
1.2. Digital Building Logbooks
Recognizing the urgency of this matter, the concept of Digital Building Logbooks (DBLs) proposed by the European Union (EU), is aimed at preserving the information generated throughout the building lifecycle [4]. The DBL is envisioned to include technical, performance, and maintenance data. Such integration holds the promise of fostering improved decision-making, knowledge dissemination, and innovation within the AEC industry [5]. A recent EU-funded work has defined a DBL data structure that incorporates energy performance, sustainability, and smartness indicators, highlighting its central role in supporting lifecycle evaluations [6]. However, comparative reviews of European DBL models such as iBRoad, ALDREN, and X-tendo emphasize that while important progress has been achieved, consensus is still lacking on indicators, data sources, and functionalities [7]. The concept of the DBL in the construction industry is quite new and academic publications on this topic have increased considerably during the past five years [8]. Note that in some papers, DBLs are referred to as “Building Passports”, or simply “Building Logbooks”.
Despite the EU’s recognition of this imperative, the widespread implementation of DBLs faces a significant obstacle: a lack of standardization across different jurisdictions and stakeholders. Various countries and regions have already introduced partial logbook initiatives, but these efforts differ substantially in focus, scope, and format. For example, some prioritize energy use and material savings, and aim to utilize DBLs to move toward a society that is carbon neutral [9,10,11]. Others emphasize DBLs as a means for advancing digital permitting and regulatory compliances [12]. Furthermore, case studies from Portugal demonstrate that existing cadastral and building datasets can already fulfill up to 90% of DBL requirements, while highlighting governance and interoperability challenges that still need to be addressed [13]. While policymakers advocate for unified standards to achieve interoperability, such efforts have proven slow and challenging. Developing and enforcing such standards requires overcoming significant obstacles, particularly, the diversity of legacy systems, regional regulations, and differing formats in the AEC industry.
1.3. Related Information Systems: PMIS and BIM
Another invaluable repository of information in the AEC sector is project management information systems (PMIS). Various systems and software have been proposed and developed for the objective of information management throughout the design and construction of buildings [14]. DBLs differ from PMIS in various aspects. Primarily, DBLs are intended to encompass the entire building life-cycle, including the operational phase, whereas PMIS focus on the managerial aspects during design and construction. Nevertheless, the two are not mutually exclusive; PMIS can be integrated into a DBL, to provide a comprehensive record, as illustrated in Figure 1. However, achieving this integration is complex due to the significant variability and often unstructured nature of data across different PMIS platforms and project-specific implementations.
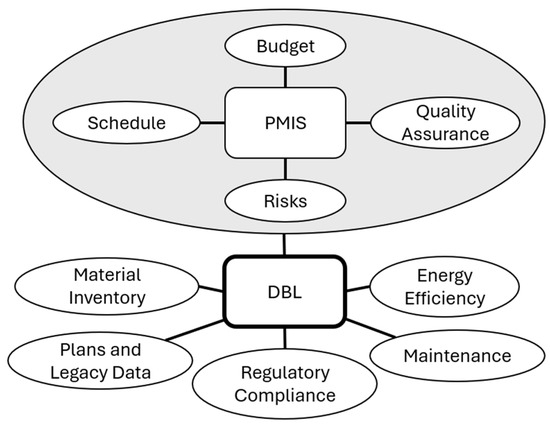
Figure 1.
The relationship and proposed integration of PMIS into DBLs.
The concept of building information model (BIM) aligns well with DBLs, as BIM models consist of object-oriented information, that can be fed into the DBLs [15]. This information includes floor area, material quantities, heating, ventilation and air-conditioning (HVAC) equipment inventory, fire-safety assemblies, and more. Additional information collected through the different stages of the building life-cycle, such as sensor data and maintenance operations, could also be tied into the BIM model, thus improving information management [16]. However, studies show that BIM adoption varies considerably by region and building type [17]. Thus, imposing BIM as a central part of DBLs would inevitably exclude many of the buildings.
1.4. The Challenge of Standardization
Implementing DBLs requires combining data from diverse sources: architectural plans, construction documents, inspection reports, energy audits, maintenance logs, etc. These documents come in varying formats and terminologies depending on the jurisdiction and the purpose [4]. Even within the same country, data formats can vary between agencies or simply change over time. For example, some records remain paper-based or in scanned PDFs, while others are in spreadsheets or proprietary databases. Furthermore, each jurisdiction has entrenched practices, regulatory requirements and building codes. Empirical evidence from Spain and Italy confirms that, although multiple building datasets already exist, their fragmented structure and limited interoperability make them only partially suitable for direct integration into DBLs [5].
This heterogeneity poses a standardization dilemma: how to define a common schema that accommodates all relevant building information. Previous studies note that the lack of a common data repository leads to inefficiencies and limits the usability of building data [4]. A survey of European initiatives concluded that a unified logbook framework covering the full building lifecycle would greatly improve interoperability and data consistency.
Attempts at imposing international standards, such as ISO frameworks for building data, often lack the granularity to cover every use case [18]. Another important question is how to build standards for different types of buildings, such as residential, commercial, industrial, and other types of buildings. Obviously, a simple single-family residence would require a different DBL template than a high-rise office building. Similarly, buildings built by the public sector would benefit from storing bidding information, as this could be used to improve procurement strategies [19]. Developing overly fragmented standards to accommodate several differences risks complicating bureaucratic workflows.
Reaching consensus on such a framework is difficult, making upfront standardization a bottleneck to DBL adoption. Stakeholders must choose between delaying integration until standards are universal, potentially taking years, or integration across different standards. LLMs offer a transformative alternative: instead of enforcing standardization at data entry, intelligent processing tools can interpret heterogeneous inputs, shifting the burden from those recording the data to the AI that interprets it.
1.5. Large Language Models for DBL Data
LLMs are a subset of ML codes that specialize in language prediction. LLMs are trained on vast text datasets using large-scale architecture. Initially designed for next-word prediction, they have proven highly effective at interpreting and generating unstructured text. Their use is rapidly expanding across domains [20], including the building sector [21]. Models such as GPT-4 can convert narrative inputs into structured, database-ready information [22]. Moreover, a growing body of research demonstrates their promise for enhancing digital workflows in the built environment, supporting tasks such as data integration, energy modeling, and decision-making [23,24,25].
Key properties that make LLMs suitable for the DBL standardization challenge include:
- Semantic understanding of unstructured text: LLMs interpret natural language descriptions of buildings and projects. For instance, an LLM can parse a maintenance log and identify structured elements (e.g., date of inspection, system type, action taken, next due date). This ability to extract structured facts from free-form text allows capturing qualitative records and transform them into structured and quantitative data [26].
- Adaptability to varied document formats: Unlike traditional software that might expect data in a specific layout, LLMs can handle information in many forms [27], such as text documents, emails, scanned images, etc. LLMs regularly integrate the use of optical character recognition (OCR) and image analysis tools, enabling the interpretation of scanned or photographed documents [28]. This capability can be applied to DBLs: old-paper records or blueprints can be digitized and then parsed by LLMs to populate the logbook.
- Learning from examples: A powerful aspect of LLMs is their capacity to learn from examples and improve with more data. The technique called few-shot learning allows for transforming information into structured datasets by inferring patterns based on only few examples [29]. For example, a few-shot learning approach could provide the model with examples of how a building record should be transformed into structured output, teaching it to generalize this to new inputs. This is particularly valuable for DBLs, since buildings are highly heterogeneous.
- Learning from external sources: LLMs could be used to search for additional resources external to the DBLs, such as local building codes and regulations, and compare this with the information within the DBLs [30]. This could allow for identifying different correlations between regions with different codes or detecting non-compliance with legal documents. Other external information resources that could be associated with DBLs include weather archives, real estate data, and geological reports. Hence, by including a greater amount of non-structured text in the DBL, more nuanced understanding can be achieved via such comparisons.
These capabilities position LLMs as a robust foundation for interpreting diverse and unstructured data. Figure 2 compares the two approaches, structured and unstructured data collection. While both aim to support consistent, high-value building logbooks, the unstructured approach has two major advantages: (1) it avoids standardization bottlenecks, and (2) it enables richer aggregation.
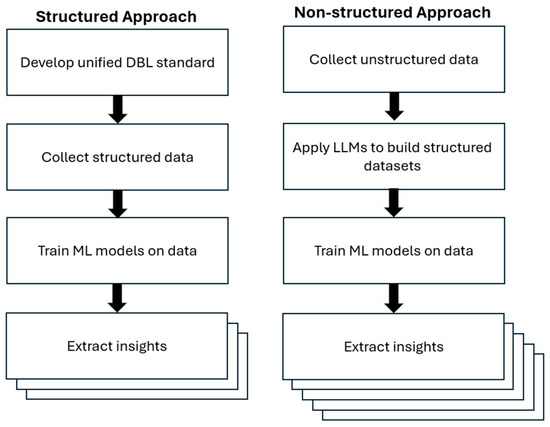
Figure 2.
Comparison of structured vs. non-structured approaches for DBL implementation.
Finally, adopting a non-structured approach does not imply that unified standards should not be developed. Indeed, both structured and unstructured data play important and complementary roles within a comprehensive DBL. Structured data, such as dates, numerical measurements, and categorical entries, is essential for regulatory compliance, statistical comparison across buildings, and automated reporting. However, unstructured data, such as inspection reports, maintenance logs, or correspondence between stakeholders, often contain valuable context that cannot be easily captured within rigid formats. Importantly, advances in ML offer a powerful means of extracting insight from this combined data environment. In particular, unsupervised learning techniques allow algorithms to detect patterns and groupings within data without requiring predefined labels or categories [31]. For example, such algorithms could analyze large volumes of unstructured inspection reports alongside structured performance metrics to identify recurring failure modes, correlations between design elements and long-term performance, or clusters of buildings exhibiting similar deterioration trends. Such analyses can point to which attributes are important to define for future unified standards.
1.6. Advances in AI for Structural and Building Assessment
Recent advancements in AI have transformed building diagnostics in areas such as defect detection, anomaly detection, and structural damage assessment. Deep learning models have been widely applied to buildings, bridges, and roads, achieving high accuracy in detecting cracks, surface defects, and material flaws [32,33]. Unsupervised anomaly detection approaches, which learn the distribution of defect-free images, reduce the need for costly manual labeling while enabling automated maintenance optimization [33]. Beyond imaging, vibration-based SHM and hybrid residual-based methods combine data-driven and model-based reasoning to improve fault detection and predictive maintenance [34]. Point cloud analysis using laser scanning, photogrammetry, and LiDAR also supports geometric diagnostics and HBIM integration [35].
Despite these advances, most AI methods remain limited by reliance on structured datasets, domain-specific implementations, and fragmented workflows across sensing modalities [36]. These limitations mirror the challenges facing DBLs, which must consolidate diverse, unstructured, and heterogeneous data. The present study builds on these developments by proposing LLMs as a unifying approach to extract, structure, and standardize building diagnostics information. In doing so, the methodology positions DBLs as scalable platforms that integrate recent AI-based advances into a broader lifecycle data environment.
1.7. Research Objectives
This paper addresses the research question: Can LLMs effectively extract building data from non-standardized DBLs?
To explore this question, we use two approaches:
- We examine initiatives from the healthcare sector, where LLMs have been applied to unstructured electronic health records (EHRs) and other resources for diagnostics, prognosis, and treatment support. These case studies demonstrate how LLMs can be used similarly for unstructured DBLs.
- We demonstrate a proof-of-concept workflow by testing the abilities of an LLM to extract organized information from building inspection reports written in free form. The methodology for this analysis is detailed in Section 3.
By meeting these objectives, the paper aims to provide an evidence-based foundation for using LLMs as a practical, scalable tool for the analysis of unstructured DBLs.
2. Cross-Domain Insights: LLMs in Healthcare Records
Many of the challenges in implementing DBLs parallel those in healthcare with EHRs, where inconsistent formats, unstructured notes, and persistent difficulties in achieving standardization leave critical information locked in non-standardized records [37]. Recently, the advent of LLMs has opened a new path to integrate these records. In a recent study on health data interoperability, researchers found that LLMs could bridge different data formats and convert them into easily understandable formats, greatly reducing the need for time-consuming standardization. A study by [24,25,38] has demonstrated that an AI could take free-form clinical notes from various sources and harmonize them. Similarly, ref. [39] leveraged an LLM to analyze unstructured EHRs for improving diagnostic accuracy, as well as reducing the time and cost of clinical visits. These results are highly relevant to DBLs, suggesting that the slow work of agreeing on every data field could be sidestepped by using LLMs to do on-demand standardization.
Additional case studies in medicine demonstrate the feasibility of this approach. One research effort used GPT-3.5 to process over a thousand pathology reports from different hospitals, extracting structured diagnostic information with nearly 90% accuracy [40]. The LLM handled variations in how doctors described tumor pathology and still produced a consistent data table for analysis. Importantly, the system required no specialized training data for each hospital’s format and relied on the general language understanding of the model. Another study by Vithanage and colleagues [41] applied the LLaMA 2-Chat 13B model to unstructured EHR data from aged care facilities, aiming to classify records related to clinical conditions such as depression, frailty, and malnutrition risks. Results demonstrated that the LLM was highly effective in extracting structured, clinically relevant information from disorganized health records. Singhal et al. (2025) introduced Med-PaLM 2, a domain-adapted LLM capable of handling diverse clinical tasks, such as answering complex medical questions and generating patient-friendly explanations [42]. Such studies demonstrate that LLMs can learn the semantic equivalence between different representations.
In addition to LLMs, other ML-based methods, such as CNNs, have been proved successful at interpreting visual data, such as pneumonia screenings [43]. Another example is the use of multimodal models to couple audio recordings of patients’ coughs with their report of symptoms for diagnosing respiratory disorders [44]. Such techniques could be applied to building information, such as scanned drawings, photos of cracks, moisture damage, and more. Indeed, studies within the building domain have demonstrated that deep learning models can outperform traditional computer vision techniques in recognizing visual patterns related to building health [45]. When combined with LLMs, which excel at interpreting associated metadata or textual descriptions (e.g., inspection notes), this offers a powerful hybrid approach for coupling narrative and visual building information to obtain reliable analysis. Possibly, audio recordings could also be included in DBLs. For example, recordings of pile drillings could be correlated with geological information, something that would eventually improve predictive power for geotechnical applications.
The success of LLMs in handling medical notes and records provides a template for AEC professionals looking to implement DBLs. If a model can learn from messy clinical notes, it can likely do the same for building logs, which are often less complex than medical history. To summarize, Table 1 lists key capabilities of LLMs that can be harnessed for the analysis of DBLs alongside case studies from the health sector that demonstrate these capabilities in practice.

Table 1.
Summary of LLM capabilities that can be used for unstructured DBLs.
3. Methodology
3.1. Data and Sampling
To assess the capability of LLMs to extract structured data from unstructured building inspection reports, we conducted a controlled demonstration using a synthetic dataset of eight inspection reports. These reports were intentionally written in inconsistent format and reflect diverse building conditions and structural issues. All reports included general descriptions of buildings, findings and recommended actions.
In order to further assess the consistency and reliability of LLM-based data analysis, the eight original reports were rewritten, so that the original factual content is preserved, but wording is significantly changed. This includes not only rephrasing of sentences, but changing of format, headings, addition and omission of non-essential details, etc. Importantly, this process was conducted manually, without the use of an LLM, in order to prevent the LLM from using language patterns embedded in its training process, thus compromising the reliability of the assessment. Hence, the data set includes a total number of sixteen reports. This small-scale dataset was selected to allow for detailed verification of the LLM’s extraction accuracy and consistency.
This study is a pilot investigation aimed at testing the feasibility, reliability, time efficiency, and cost implications of applying LLMs to inspection reports. The small dataset was chosen to enable close verification while maintaining diversity in building conditions. The objective at this stage was not large-scale representativeness, but rather to demonstrate the workflow in practice, benchmark runtime against manual processing, and generate indicative cost estimates. Given the rapid evolution of AI and LLM technologies, the timing of this pilot is critical for presenting early, promising results that can guide and accelerate subsequent large-scale implementations.
3.2. Workflow Overview
The methodology addresses the fundamental challenge of converting diverse building-related documents into structured, machine-readable formats suitable for analysis. As illustrated in Figure 3, the proposed framework establishes a three-stage processing pipeline that can be adapted across different building types, jurisdictions, and document formats:
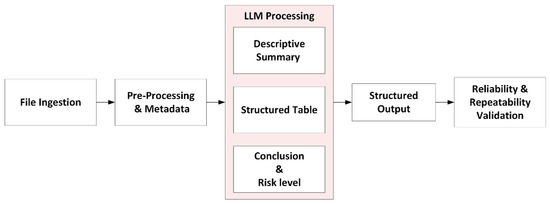
Figure 3.
The proposed workflow for LLM-based processing of building inspection reports.
- Stage 1—Descriptive summarization:
- Extract key information from unstructured text using natural language understanding.
- Organize findings into standardized categories relevant to building condition assessment.
- Generate human-readable summaries that preserve technical context and nuance.
- Stage 2—Data structuring and quantification:
- Convert qualitative descriptions into quantitative, database-ready fields.
- Apply consistent classification schemes across diverse input formats.
- Generate structured datasets suitable for statistical analysis and ML.
- Stage 3—Risk level assessment:
- Synthesize multi-dimensional information into actionable insights.
- Provide standardized risk evaluations that can inform decision-making processes.
- Enable comparative analysis across different buildings and time periods.
In LLMs, the temperature parameter controls the randomness of output generation, with higher temperatures producing more diverse and creative responses [47]. For this analysis, we apply a different temperature for each processing stage (see Table 2). A moderate value of 0.5 was chosen for the descriptive summary to allow linguistic variation while preserving technical accuracy. For structured data extraction, a deterministic setting of 0.0 was used to ensure consistent, machine-readable outputs. The risk assessment stage was assigned an intermediate temperature of 0.3, reflecting the need to combine broad judgment with the assignment of a numerical risk score.
Table 2.
Prompt engineering strategy for three-stage LLM processing pipeline.
3.3. LLM Processing
All three stages were implemented using the GPT-4o model from OpenAI. The workflow is implemented in Python 3.10 where the GPT-4o model is activated via the OpenAI application programming interface (API). For each processing stage, the number of tokens, runtime, and cost is logged and exported to a timestamped Excel workbook. This allows for a complete audit for reproducibility, performance monitoring, and cost analysis.
The three processing stages involve the following instructions:
- Descriptive summary generation: The full, cleaned report text is passed to the LLM with strict prompting instructions and returns a structured summary in the form of: (i) Building Overview, (ii) Observations, (iii) Structural Analysis, and (iv) Recommendations.
- Structured attribute extraction: the same report text is then re-submitted to the model with a second prompt that demands a valid Python dictionary. Required keys include number of stories, foundation type, soil type, and binary presence of corrosion, cracking, and moisture issues and their severity on a 1–5 scale. Constraining the output ensures that every value is machine-readable, normalized, and ready for statistical analysis.
- Conclusion and risk level: A third prompt feeds the model the descriptive summary from previous stages. The LLM is asked to synthesize these inputs into a brief risk conclusion and an overall risk score on a 1–10 scale, where 1 signifies minimal concern and 10 denotes critical urgency. This 1–10 scale was chosen for its simplicity and interpretability, providing sufficient granularity while allowing straightforward mapping into categorical bands (low, moderate, high) commonly used in risk communication
Table 2 summarizes the prompt engineering strategy implemented across the three processing stages, detailing the specific role definitions, task requirements, and output specifications for each stage to ensure consistency and reproducibility.
3.4. Evaluation and Reliability Assessment
To evaluate that the proposed LLM-based workflow is both accurate and consistent, each of the inspection reports was processed independently 20 times. This resulted in a total of 320 processed report runs. The consistency of both qualitative and quantitative outputs was then assessed across these runs according to the following metrics:
- For each numeric or ordinal field (e.g., cracking severity, moisture severity), statistics such as mean, standard deviation, and min/max were computed.
- For each categorical field, qualitative values (e.g., Building Type, Soil Type, Foundation Type) were compared.
- For the descriptive summary, a random subset of the data was manually checked. In addition, all of the data was evaluated by an LLM via a separate pass, focusing on semantic stability and overall coherence across repeated runs.
As mentioned, a set of the original inspection reports was paired with a corresponding set of reports that were reworded and restructured. Both sets were processed using the same LLM-based workflow, and the resulting outputs were evaluated using the same statistical and consistency checks described above. When interpreting results, the consistency was examined both across runs and between each pair of the original and altered report.
4. Results
The results section presents the outputs of the proposed LLM-based pipeline and evaluates its accuracy, consistency, and efficiency across multiple runs. All experiments were executed on a workstation (Intel Core i9-14900K, 3.20 GHz, 128 GB RAM, Windows 64-bit) using the OpenAI API, without GPU acceleration or batch execution. The findings are organized into: (1) initial run outputs, (2) consistency across repeated runs, (3) LLM-based evaluation of summary stability, (4) coupled report comparison, and (5) computational efficiency in terms of token usage and runtime.
4.1. Initial Run
The initial run of the LLM-based pipeline was performed on a balanced dataset of 16 building inspection reports, comprising eight real and eight altered reports. Table 3, Table 4 and Table 5 present a sample of the generated responses for Reports 1–3. The full results from the initial run, covering all 16 reports, are provided in Appendix A. As shown in Table 3, the model produced coherent outputs across all narrative sections, including Building Overview, Observations, Structural Analysis, and Recommendations. In parallel, Table 4 presents the structured attributes extracted from each report, including Building Use, Foundation Type, Cracking Severity, and Moisture Severity. Table 5 contains the LLM-generated risk summaries and assigned risk levels (on a 1–10 scale). The risk assessments demonstrate the model’s capability to identify high-severity cases while appropriately classifying lower-risk buildings. Overall, these results indicate that the model effectively extracts multi-layered structural insights and contextualizes them into meaningful, actionable risk evaluations.
Table 3.
Narrative outputs generated by the LLM for each inspection reports 1–3.
Table 4.
Structured attributes extracted from inspection reports 1–3.
Table 5.
LLM-generated risk summaries and assigned risk levels for reports 1–3.
Overall, most attributes were extracted accurately. Minor discrepancies in subjective severity ratings were noted, but overall accuracy and consistency were found sufficient for automated DBL workflows.
4.2. Consistency Across Runs
To assess robustness and repeatability, each inspection report was processed 20 times with GPT-4o, and outputs were compared for both structured fields and narratives. Key structured attributes were extracted with perfect consistency across all runs. Building Use, Foundation Type, and Soil Type were identical in every case, regardless of wording differences in the source text. Building Area was also stable, with Reports 3 and 11 consistently showing the correct value of 260 m2, while Reports 6 and 14 alternated between “empty” and “not specified” due to ambiguous source data. All other reports consistently returned correct values.
As shown in Figure 4, Boolean fields (Corrosion?, Cracking?, Moisture Issues?) were perfectly consistent across all runs (σ = 0), confirming the model’s reliability in detecting binary conditions. Minor variability appeared only in a few ordinal severity fields (σ ≤ 0.6), typically between adjacent values (e.g., 2 and 3), indicating interpretive flexibility rather than true inconsistency. Overall, the results show high repeatability in structured outputs, especially for deterministic fields, supporting the pipeline’s suitability for consistent DBL data extraction.
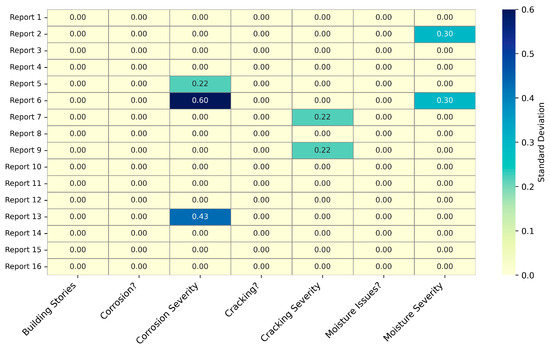
Figure 4.
Standard deviation of structured field outputs across 20 LLM runs.
The risk level was an LLM-generated score derived from each inspection report’s findings, reflecting the overall severity of observed issues on a scale from 1 (low) to 10 (high). Table 6 shows score frequencies across 20 runs, with the following patterns:
Table 6.
Frequency distribution and statistics of LLM-generated risk levels across 20 runs per report, showing mean, standard deviation, and score range.
- 14 of 16 (87.5%) reports have a standard deviation of 0.60 or below, indicating minimal variability.
- 10 reports fluctuate by only one risk-level stage, a spread that would be indistinguishable to a human assessor, and five reports show a two-point swing.
- Report 5 is the lone outlier, spanning three points (3–6). Closer inspection shows that 17 of the 20 runs returned the same score (4), only one run each produced levels 3, 5, and 6.
These results show that the model’s risk assessments are deterministic and robust, with relatively low variability, as illustrated in Figure 5. Where variability occurs, it aligns with genuine textual ambiguity rather than random hallucinations. This consistency is essential for Digital Building Logbooks, ensuring automated triage remains stable across runs while still reflecting real uncertainty in borderline cases.
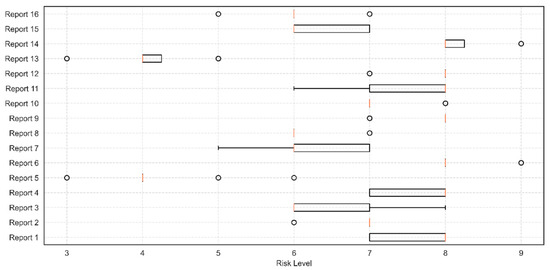
Figure 5.
Distribution of LLM-assigned risk levels across 20 runs per report.
4.3. LLM-Based Evaluation of Summary Consistency
As a preliminary investigation, we tested whether a second set of LLMs could evaluate the consistency of multi-run summary outputs. Six models were examined: GPT-4o and o3 (OpenAI), Gemini 2.5 Pro (Google), Grok 4 (xAI), DeepSeek-R1, and Opus 4.1 (Anthropic). Each model reviewed 20 repeated generations of summaries from 16 building reports and assigned a consistency score (1–100) reflecting semantic stability, factual coherence, and preservation of key structural attributes. A key finding of this preliminary test is that most reports produced moderate to high ratings (80–100), indicating that multi-run summaries were generally stable and coherent, as illustrated in Figure 6.
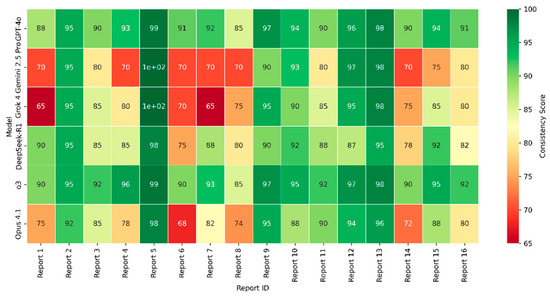
Figure 6.
Score of each model per report.
However, the distribution of scores revealed interesting patterns that warrant further research. DeepSeek-R1 (92.7) and o3 (93.5) consistently awarded higher scores, whereas Gemini (81.8) and Grok (83.6) applied stricter evaluations, underscoring the influence of model-specific evaluation styles. Score correlation analysis (Figure 7a) identified two clear clusters: a lenient pair (DeepSeek-R1 and o3, r ≈ 0.96) and a stricter pair (Gemini and Grok, r ≈ 0.92). The weakest alignment was between Grok and GPT-4o (r ≈ 0.64), reflecting divergent evaluation approaches. The mean absolute differences in scores were generally small (Figure 7b), indicating that despite variations in scoring precision the models converged on broader consistency patterns, particularly for clearly consistent reports. This finding was further supported by pairwise agreement analysis, which showed that most model pairs exceeded 75% alignment at ±10 points and surpassed 80% at ±15 points.
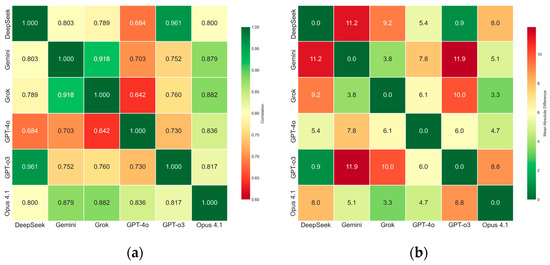
Figure 7.
(a) Correlation coefficients between models; (b) Mean absolute score differences between models.
4.4. Evaluation of Coupled Report Consistency
To further assess the robustness of the LLM-based extraction and scoring pipeline, we evaluated a set of paired reports. Each pair consisted of a real-world inspection report and a synthetically generated analogue that preserved the structural context and key observations of the original. This coupling was designed to test the model’s ability to generalize across similar input formats while maintaining consistent outputs. The evaluation compared structured field values and risk level assessments across each pair, focusing on semantic alignment and numeric stability.
Evaluation of the paired real–synthetic reports revealed high consistency across key structured fields:
- Building Stories and Building Use matched perfectly in all pairs, confirming reproducibility for clearly defined attributes.
- Building Area was consistent except in two pairs (Reports 6 and 14), where the source alternated between “empty” and “Not specified,” reflecting input ambiguity rather than extraction error.
- Foundation Type showed close semantic alignment despite minor wording differences (“Shallow” vs. “Shallow footings”, “Raft” vs. “Slab”).
- Soil Type matched exactly in six pairs, with only descriptive variations (“sand” vs. “sandy”) in the remainder.
- Boolean fields (Reinforcement Corrosion?, Cracking?, Moisture Issues?) achieved 100% agreement across all pairs.
These results highlight the model’s robustness in extracting semantically stable outputs from varied wording, which is critical for practical DBL applications.
Ordinal-severity ratings extracted by the LLM remain highly consistent across the eight real–synthetic report pairs, as summarized in Table 7. Mean Absolute Error (MAE) captures the average absolute difference between the two reports in a pair, while the exact-match rate records the percentage of runs in which both reports received the identical score.
Table 7.
Mean absolute error (MAE) and exact match rates for severity fields and risk level.
- For corrosion severity, six pairs achieve perfect agreement (100% exact matches, MAE = 0), while the two remaining pairs still show high concordance (90% and 80%, MAE = 0.20).
- Cracking severity: Six pairs exceeded 90% matches; the lowest results (Pairs 3–11 and 7–15) still differed by only one level (MAE = 1.00 and 0.95).
- Moisture severity follows the same pattern, six pairs surpassed 90% agreement, and the largest deviation remained within ±1 level (MAE ≤ 1.0).
- All disagreements were confined ±1 level, indicating that the LLM delivers semantically robust extractions with only minor, interpretable deviations.
The risk level scoring between coupled report pairs showed strong consistency across runs Figure 8, with 60% (96/160) exact matches and a mean absolute error (MAE) of 0.487 on the 10-point scale. In total, 91.9% of scores fell within ±1 point, and only 8.1% deviated by two points or more, with one three-point outlier. Performance ranged from excellent (25% of pairs, MAE ≤ 0.20, ≥80% exact matches) to moderate in one case (Pair 3–11, MAE 1.25). No systematic error patterns were observed, and differences remained small, confirming the LLM’s reliability for operational risk scoring, with potential for refinement in a few borderline cases.
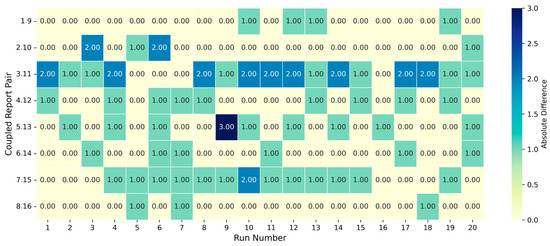
Figure 8.
Absolute risk level differences between report pairs across 20 runs.
4.5. Token Usage and Execution Time
To assess computational efficiency, token consumption was recorded across all 320 report runs, segmented by each processing stage (as presented in Table 8): Stage 1: Descriptive Summary Generation, Stage 2: Structured Attribute Extraction, and Stage 3: Risk and Conclusion Analysis. Across all reports, usage was consistent, with standard deviations well below 50 tokens per stage, indicating predictable cost and high repeatability. Report 16 showed the highest total usage (2484.8 tokens), and Report 3 the lowest (1637.5 tokens), reflecting differences in report length and complexity. Stage 2 exhibited the lowest variance, confirming that structured extraction tasks are more deterministic than free-text generation in Stages 1 and 3.
Table 8.
Token usage avarage (Avg.) and standard deviation (SD) across 20 runs for 16 reports and three LLM stages.
Execution time was also measured across all runs (Table 9). The average end-to-end runtime per report was 8.7 s (σ = 2.4), with Stage 2 taking the longest (3.6 s on average). Variability was modest and mainly linked to longer, text-heavy reports (e.g., Reports 8, 12, and 16). Compared to manual extraction (15–30 min), the pipeline achieves a more than 100-fold speed improvement while preserving consistency and interpretability. These results demonstrate that the LLM-based workflow is both scalable and operationally feasible for rapid processing of unstructured building inspection data.
Table 9.
Execution time average and standard deviation (in seconds) across 20 runs for 16 reports and three LLM stages.
5. Discussion
5.1. Demonstration of LLM-Based Data Extraction
The proposed three-stage LLM-based pipeline demonstrated strong capability in transforming heterogeneous, unstructured inspection reports into structured, decision-ready information for DBLs. Manual validation confirmed consistent identification of key building attributes, structural issues, plausible causal factors, and technically sound recommendations. Deterministic fields, such as Building Use and Foundation Type, as well as Boolean indicators of defect presence, were extracted with perfect repeatability across 20 independent runs for each report, underscoring the robustness of the approach for critical DBL entries.
Variability in ordinal severity ratings was minimal, typically confined to adjacent values (±1 level), reflecting interpretive flexibility rather than instability. Risk levels, expressed on a 1–10 scale, also exhibited high stability: 14 of 16 reports had standard deviations below 0.6, and more than 90% of scores differed by no more than one point between runs. This level of reproducibility is essential for automated triage in DBLs, where stability is as important as interpretive accuracy. Operationally, the pipeline processed each report in under 10 s on average, with low variance in token usage and runtime, allowing for predictable cost estimation and scalability to large datasets.
Compared to conventional approaches, the pipeline also demonstrates clear advantages: manual review typically requires 15–30 min per report versus under 10 s here, and rule-based NLP or template-based parsers often fail to adapt to heterogeneous document formats. While a full benchmarking study is beyond the scope of this pilot, these contrasts highlight the workflow’s efficiency and adaptability relative to existing methods.
These findings confirm the feasibility of post hoc standardization, where structured, machine-readable data can be generated from unstructured inputs without prior adherence to a fixed schema. They are consistent with recent studies demonstrating the potential of LLMs to improve digital workflows in the built environment [24,25,38]. This capability addresses one of the main barriers to DBL adoption: the diversity and heterogeneity of building-related documentation. By shifting the standardization burden from data contributors to an AI-driven interpretation layer, the approach offers a practical pathway toward more inclusive, scalable, and analytically powerful DBLs.
5.2. Implications for Research and Practice
DBLs involve practical benefits for various stakeholders, including regulators, facility managers, building owners, and engineers. Nevertheless, a group that stands to benefit profoundly from the emergence of large-scale DBL systems is the AEC research community. Researchers could leverage DBLs as a previously unavailable empirical substrate for studying buildings in their operational environments.
Traditional scientific research in the built environment often relies on controlled laboratory experiments, idealized assumptions, or a limited number of case studies. These methods, while rigorous, tend to fall short when addressing the full complexity of real-world building performance across diverse conditions. The limitations of small sample sizes and artificial experimental settings have contributed more broadly to the so-called “replication crisis” in science, where findings established in one study fail to replicate in latter studies. This phenomenon has been documented not only in the social sciences but also in medicine, and even in civil engineering research [48].
In contrast, DBLs, especially when integrated with LLM-driven standardization, can unlock access to a vastly larger and more heterogeneous corpus of data. This includes maintenance activities, renovations, structural interventions, and failure events, all contextualized within specific geographic, regulatory, and climatic conditions. By enabling the analysis of empirical findings from thousands of buildings, DBLs can support data-intensive methodologies such as statistical learning, causal inference, and longitudinal analyses that reveal trends and insights previously inaccessible. Particularly, ML methods excel in identifying non-intuitive patterns from large sets of data that cannot be captured by humans [2].
Importantly, such scale comes with challenges. The diversity and potential noise in real-world DBL data increase the risk of misinterpretation, especially when applying LLMs or other ML models that may produce inaccurate outputs or spurious correlations. ML methods can fail to generalize to new kinds of data that they have not been trained on [1]. However, the scientific method combats such issues scrutiny and peer review. Making appropriately anonymized and privacy-preserved data accessible to academic institutions and research organizations would allow for critical cross-examination, as well as continuous refinement of both algorithms and scientific hypotheses.
In this sense, DBLs should not be viewed as merely digital tools for record-keeping, but as infrastructures for knowledge production. From the example used in the proof-of-concept study in this paper, a large-scale data set of inspection reports would allow for ML models to identify root causes of specific types of building damage and assess correlations between structural performance and various factors. Such integration aligns with recent advances in risk frameworks that incorporate time-dependent degradation processes into lifecycle assessments [49,50], and with applications of machine learning in geotechnical engineering, where transfer learning has been explored to overcome data scarcity challenges [51]. Moreover, tracking repair activities over time would also allow for quantitative evaluation of intervention effectiveness. The proposed methodology can be extended to include images, sensor data, and 3D building models to allow for multi-modal analysis and enrichment of the knowledge. Ultimately, the insights generated through such research will help optimize building practices, inform policy, and enhance resilience, thereby increasing the public utility of the built environment.
5.3. Practical Implications
Beyond research, the findings of this study carry practical implications for diverse stakeholders in the AEC ecosystem:
- Policy makers: The pipeline provides a scalable mechanism to harmonize heterogeneous building data without requiring immediate consensus on international standards, thus accelerating DBL adoption.
- Facility managers: Automated extraction of structured maintenance and inspection insights can improve asset monitoring, prioritize interventions, and reduce operational costs.
- Engineers and practitioners: Risk evaluation outputs generated consistently within seconds offer actionable insights that can guide rehabilitation strategies, compliance checks, and project planning.
- Building owners and investors: More transparent, standardized records increase confidence in long-term asset performance, valuation, and sustainability compliance.
By aligning the needs of these stakeholders, the proposed workflow demonstrates the potential to support not only scientific inquiry but also decision-making in practice.
5.4. Limitations and Future Research
While this study demonstrates the feasibility of using LLMs to extract structured knowledge from unstructured inspection reports, it should be regarded as a proof of concept. Several limitations must be acknowledged. First, the analysis focused exclusively on building inspection reports in PDF and DOCX formats, while other DBL-relevant document types such as energy audits, maintenance logs, or permitting records were not assessed and may require prompt adaptation or preprocessing. Second, the evaluation was conducted using a single LLM (GPT-4o), and outcomes may vary with alternative models or domain-adapted architectures. Third, the dataset was relatively small, selected to enable close verification of outputs while capturing diversity in building use and defect profiles. While suitable for a pilot, broader generalizability requires validation on larger and more heterogeneous datasets. Fourth, the study did not include a systematic comparison against rule-based NLP, template-based parsers, or traditional ML baselines. Such benchmarking is essential for positioning LLM pipelines relative to established methods and will be a key focus of future work.
In addition, LLMs are known to exhibit risks of bias and hallucination, producing outputs that may appear plausible but are factually incorrect or skewed [52,53]. These challenges highlight the need for detection and mitigation strategies, as well as domain-expert validation, to ensure reliability and ethical deployment. Finally, while the pipeline demonstrated significant efficiency gains, scaling to thousands of reports may pose cost implications that warrant further study and optimization.
Future research should therefore expand the dataset to encompass a wider range of building types including residential, commercial, and industrial, as well as additional document categories. Moreover, integrating multimodal inputs such as photographs, sensor data, and BIM models represents a promising avenue for advancing DBL automation, enabling richer and more reliable analyses that can better inform both research and practice. In addition, stakeholder validation through interviews, surveys, and pilot studies with engineers, facility managers, and regulators will be needed to evaluate usability, trust, and interpretability of LLM-based outputs.
6. Conclusions
The widespread implementation of DBLs, a critical stage toward digital transformation in the built environment, has long been hindered by the lack of standardization. Existing efforts to unify building lifecycle data across jurisdictions have faced barriers, delaying the realization of DBLs’ potential. This paper argues that recent advancements in LLMs can help overcome many of these obstacles.
LLMs are uniquely capable of processing unstructured, inconsistent, and multilingual inputs. Large use cases from the healthcare sector have demonstrated the capability of LLMs to extract actionable knowledge from disparate medical records. Thus, it is safe to assume that heterogeneous building data too can be transformed into coherent knowledge.
As a proof-of-concept demonstration, we tested the accuracy of GPT 4o in extracting data from 16 unstructured building inspection reports, comprising both eight authentic and an additional set of reworded and restructured reports, designed to check for consistency. Via a Python code, the LLM was activated to produce descriptive summaries, structured quantitative summaries and risk levels. Across 320 total runs, results showed high performance in accuracy, consistency, and computational efficiency.
Manual validation confirmed the semantic quality and technical accuracy of outputs, with only minor subjective deviations in severity classifications. Structured fields such as Building Use, Foundation Type, and Boolean condition flags were extracted with perfect repeatability across all runs. Ordinal fields, including Cracking Severity and Moisture Severity, showed minimal variability, typically limited to adjacent values, reflecting interpretable flexibility rather than error.
Risk assessments on a 1–10 scale exhibited strong consistency: 14 of 16 reports had a standard deviation below 0.6, and over 90% of scores deviated by no more than one point between runs. Paired analysis of real and synthetic reports revealed strong alignment, with exact match rates above 90% in most severity fields and a mean absolute error below 0.5 for risk scores.
Computationally, the pipeline processed each report in under 10 s on average, with low variance in both token usage and runtime. This represents more than a 100-fold speed improvement over manual review, while maintaining interpretability and robustness. Overall, these results confirm that the proposed LLM pipeline is a reliable and scalable approach for extracting structured data from unstructured documents.
Ultimately, DBLs supported by LLMs would open new frontiers for research. By enabling large-scale, empirical analysis of buildings in their operational contexts, they could provide an unprecedented knowledge base for the AEC sector. Accordingly, we urge policy makers to push forward a “capture first, refine later” strategy, trusting that researchers will harness the necessary tools to extract actionable insights.
At the same time, this proof-of-concept study has limitations, including the small dataset, reliance on a single LLM model, and focus on inspection reports in PDF and DOCX formats. These constraints highlight directions for future work: expanding datasets across building types, integrating multimodal inputs such as images, BIM, and sensor data, benchmarking against alternative approaches, and validating usability and trust through stakeholder studies. Addressing these aspects will be essential for fully establishing LLMs as a scalable and reliable foundation for DBL implementation.
Author Contributions
Conceptualization, A.M.; methodology, A.M. and Y.G.; investigation, A.M., A.U. and Y.G.; writing—original draft preparation, A.M.; writing—review and editing, A.M., A.U. and Y.G.; All authors have read and agreed to the published version of the manuscript.
Funding
This research received no external funding.
Data Availability Statement
The original contributions presented in the study are included in the article, further inquiries can be directed to the corresponding author.
Acknowledgments
During the preparation of this manuscript, the authors used ChatGPT (GPT-4o and GPT-5, OpenAI) for the purpose of improving the style of writing. The authors have reviewed and edited the output and take full responsibility for the content of this publication.
Conflicts of Interest
The authors declare no conflicts of interest.
Abbreviations
The following abbreviations are used in this manuscript:
| DBL | Digital building logbook |
| LLM | Large language model |
| AEC | Architecture, engineering and construction |
| EU | European Union |
| ML | Machine learning |
| AI | Artificial Intelligence |
| BIM | Building information model |
| HVAC | Heating, ventilation and air-conditioning |
| EHR | Electronic healthcare record |
| OCR | Optical character recognition |
Appendix A
This appendix provides supplementary materials supporting the main text. It includes the detailed output results of the initial run. The initial run refers to the first complete application of the pipeline to the dataset of structural inspection reports. Results are presented in three tables:
- Table A1—narrative outputs, including building overviews, observations, structural analyses, recommendations, and token counts and execution time.
- Table A2—summarizes the structured attributes extracted in the same run, covering building stories, use, area, foundation type, soil type, cracking, corrosion, and moisture conditions, and token counts and execution time.
- Table A3—presents the LLM-generated risk summaries and assigned risk levels, reflecting how the pipeline interprets and categorizes building conditions, and token counts and execution time.
Table A1.
Initial Run Results—Narrative outputs.
Table A1.
Initial Run Results—Narrative outputs.
| Model | Building Overview | Observations | Structural Analysis | Recommendations | Tokens | Execution Time (s) |
|---|---|---|---|---|---|---|
| 1 | The building is a six-story residential apartment constructed in 1976 with a reinforced concrete structure, shallow foundations, and masonry infill walls. | Cracks in masonry walls and columns, water infiltration, and rust staining suggest settlement and potential reinforcement corrosion. | Shallow foundations, age, and poor drainage likely contribute to settlement and differential movement, with active settlement indicated by crack patterns. | Monitor cracks with gauges, repair cracks over 0.5 cm with epoxy, inspect roof drainage, and conduct further analysis for basement slab corrosion. | 832 | 2.33 |
| 2 | The subject property is a four-story commercial building constructed in 1983 with a steel frame structure and concrete slab foundation. | Hairline cracks and water seepage were noted on the exterior, while vertical cracks and rust staining were observed in the basement, along with ceiling sagging on the first floor. | Cracks and sagging indicate differential settlement, and rust staining suggests potential steel reinforcement corrosion requiring core sampling. | Install crack monitors, repair window seals, analyze first-floor ceiling, and implement a phased repair plan with ongoing monitoring every three months. | 678 | 2.37 |
| 3 | The property is a 3-story house built in 1986 with an area of 260 m2, featuring concrete walls and natural rock exterior covering. | Rock elements have fallen in some exterior areas, and minor hairline cracks are observed in the slabs and walls inside the house. | The soil is fat clay with differential heaving, and the piles were driven to a shallow depth of 8 m, contributing to the cracking. | A new foundation system should be designed and built to strengthen the existing one, and rock elements should be removed to inspect the main columns. | 559 | 2.94 |
| 4 | The subject property is a seven-story residential complex constructed in 1992 with reinforced concrete, a raft foundation, and brick masonry walls. | Vertical cracks, spalling concrete, ceiling sag, horizontal cracks with moisture seepage, and a basement gap with moisture intrusion were observed. | The ceiling sag suggests potential beam deflection due to excessive load or corrosion, and the horizontal cracks indicate possible differential movement from foundation settlement. | Immediate shoring of the third-floor ceiling, moisture testing on the fifth floor, crack monitoring, core sampling for corrosion, and phased repairs are recommended. | 709 | 2.13 |
| 5 | The subject property is a seven-story residential complex constructed in 1992 with prefabricated reinforced concrete elements and a raft foundation. | No cracks were found during the visual inspection of the exterior lower stories or in the two inspected apartments. | The finite-element model indicates no immediate risk of structural failure, but the wall removal is non-compliant with building codes and may lead to large deformations. | The wall should be rebuilt or replaced with a steel beam under the supervision of an experienced structural engineer as soon as possible. | 582 | 2.55 |
| 6 | The building is a 12-story structure with a basement parking area, made of reinforced concrete, with shallow foundations and built approximately 20 years ago. | Three major vertical cracks, 1–2 cm wide, were observed in adjacent columns at the ground level, exposing reinforcement bars. | The vertical cracking in columns suggests potential axial loading issues or foundation-related movements, posing a severe risk to structural integrity. | Immediate actions include moving heavy objects, restricting access, treating exposed rebar, adding external jackets to columns, and considering evacuation if repairs are delayed. | 886 | 2.83 |
| 7 | The property is a single-story residential dwelling built in 2008 with concrete block walls and a reinforced concrete roof slab on a shallow footing system. | A significant horizontal crack was observed on the southern wall, with varying widths and slight vertical displacement, along with elevated moisture content and clay-rich soil showing signs of wetting and drying cycles. | The findings suggest foundation movement likely due to soil heave or settlement caused by volume changes in the clay-rich soil, possibly exacerbated by poor drainage. | Evaluate surface drainage around the southern elevation to prevent excessive wetting and schedule a follow-up inspection after winter to monitor the situation. | 726 | 3.00 |
| 8 | The building is a 3-story commercial structure built in 1997 with brick walls and a reinforced concrete frame, located less than 2 km from the sea with a high groundwater level. | Cracks in the brick walls are primarily diagonal and stepped, occurring near openings, with moisture levels slightly elevated, and some separation at the brick-concrete interface. | The cracking is likely due to localized differential movement, thermal effects, and moisture issues influenced by the building’s age, construction, and proximity to the marine environment. | Conduct a thermographic survey, remove and inspect sections of brickwork, and analyze mortar samples to determine necessary repairs. | 919 | 2.72 |
| 9 | The building is a 6-story residential apartment constructed in 1976 with a reinforced concrete structure and shallow footings, featuring masonry infill walls. | Cracks ranging from 0.5 cm to 1 cm wide were observed in masonry walls near columns and windows, with water infiltration and rust staining also noted. | The building’s shallow foundations, age, and poor drainage have contributed to settlement and differential movement, with ongoing monitoring required due to active settlement signs. | Immediate monitoring of cracks is advised, along with a detailed structural analysis and repairs to drainage systems and cracks over 0.5 cm under engineering supervision. | 875 | 3.92 |
| 10 | A four-story commercial building built in 1983 with a steel frame core and a thick concrete slab foundation was visually inspected for structural evaluation. | Hairline cracks in masonry walls, water seepage near windows, significant basement cracks, ceiling sag, and rust staining on basement beams were observed. | The observed structural issues, including cracks and sagging, appear to result from differential settlement in the raft foundation. | Immediate crack monitoring, core sampling, structural analysis of the first-floor ceiling, window seal repairs, and ongoing monitoring every 3 months are recommended. | 691 | 2.17 |
| 11 | The property is a three-story residential house built in 1986 with an area of 260 m2, featuring a rock façade. | Minor hairline cracks are present in the walls and ceilings, and differential surface settlement is observed in the garden. | The current 8 m-deep pile foundation is inadequate for resisting clay heaving, likely causing differential movement and cracking. | A new foundation system with significantly deeper piles is recommended, and façade elements should be removed for column inspection. | 610 | 2.57 |
| 12 | The building is a 7-story residential complex with a basement, constructed in 1992 using reinforced concrete and brick walls, and features a slab foundation. | Vertical cracks on the eastern façade and minor concrete spalling near the roof parapet were noted, along with ceiling sag and horizontal cracks with moisture seepage on the third and fifth floors, respectively. | The ceiling sag on the third floor suggests potential beam deflection, while the horizontal cracks on the fifth floor indicate possible differential movement due to foundation settlement. | Immediate shoring of the third-floor ceiling is necessary, along with moisture testing on the fifth floor, installation of crack monitors, core sampling for corrosion evaluation, and phased repairs focusing on structural deformation and moisture intrusion. | 777 | 3.64 |
| 13 | The building is a seven-story structure with four apartments per story, made of prefabricated concrete elements, constructed in 1992 with a slab foundation. | No cracks were found in the exterior of the lower stories or in the two inspected apartments. | The analytical computer model indicates no immediate risk of structural failure, but the wall removal is not compliant with building codes. | The structure’s integrity should be restored by rebuilding the wall or designing a structural replacement, requiring design and supervision by an experienced structural engineer. | 586 | 2.39 |
| 14 | The building is a 12-story reinforced concrete structure with a single-story basement parking facility, constructed approximately 20 years ago. | Three significant vertical cracks, measuring 1–2 cm wide, were observed in adjacent ground-level columns, with reinforcement bars exposed. | The root cause of the cracking is undetermined, but may involve axial loading issues or foundation-related movements, posing a risk to structural integrity. | Immediate actions include restricting access, treating exposed rebar, reinforcing columns, and possibly evacuating residents if permanent repairs are delayed. | 888 | 5.96 |
| 15 | The building is a single-story residential dwelling built in 2008 with load-bearing concrete block walls and a reinforced concrete roof slab. | A significant horizontal crack, 6 m long and 2–5 mm wide, was observed on the southern wall, with slight vertical displacement and elevated moisture content. | The crack is likely due to foundation movement caused by soil cyclic heave and settlement in clay-rich soil. | Evaluate and improve surface drainage around the southern elevation and conduct another inspection after winter to monitor the condition. | 640 | 1.99 |
| 16 | The building is a three-story commercial structure built in 1997, featuring masonry brick walls, concrete columns and slabs, and a foundation system of 15–20 m-deep piles on sandy soil near the sea with a high groundwater level. | Cracks are mainly diagonal on the first and second floors, originating near openings, with widths ranging from 1 mm to 3 mm, and minor vertical cracks at wall intersections, with moisture levels slightly elevated compared to unaffected areas. | The cracking seems to result from localized differential movement, thermal effects, and moisture issues due to the building’s age, construction, and marine environment location with a high groundwater table. | Further investigations, including a thermographic survey, localized material inspection, and mortar analysis, are essential to fully understand the cracking causes and to provide detailed repair instructions. | 983 | 2.91 |
Table A2.
Initial Run Results—Structured attributes.
Table A2.
Initial Run Results—Structured attributes.
| Model | Building Stories | Building Use | Building Area | Foundation Type | Soil Type | Reinforcement Corrosion? | Corrosion Severity | Cracking? | Cracking Severity | Moisture Issues? | Moisture Severity | Total Tokens | Execution Time |
|---|---|---|---|---|---|---|---|---|---|---|---|---|---|
| 1 | 6 | Residential | Shallow | 1 | 3 | 1 | 4 | 1 | 3 | 887 | 3.61 | ||
| 2 | 4 | Commercial | Concrete slab | 1 | 3 | 1 | 3 | 1 | 2 | 736 | 3.41 | ||
| 3 | 3 | Residential | 260 | Piles | Fat Clay | 0 | 0 | 1 | 3 | 0 | 0 | 558 | 2.92 |
| 4 | 7 | Residential | Raft | 1 | 3 | 1 | 4 | 1 | 3 | 753 | 3.58 | ||
| 5 | 7 | Residential | Raft | 0 | 0 | 0 | 631 | 3.89 | |||||
| 6 | 12 | Residential | Not specified | Shallow foundations | Over-consolidated clay | 1 | 5 | 1 | 5 | 0 | 0 | 893 | 3.07 |
| 7 | 1 | Residential | Shallow reinforced concrete footing | Clay-rich | 0 | 1 | 4 | 1 | 3 | 750 | 9.28 | ||
| 8 | 3 | Commercial | Piles | Sandy | 0 | 1 | 3 | 1 | 3 | 946 | 3.94 | ||
| 9 | 6 | Residential | Shallow footings | 1 | 3 | 1 | 4 | 1 | 3 | 910 | 3.89 | ||
| 10 | 4 | Commercial | Concrete Slab | 1 | 3 | 1 | 3 | 1 | 2 | 736 | 3.59 | ||
| 11 | 3 | Residential | 260 | Pile | Fat Clay | 0 | 0 | 1 | 2 | 0 | 0 | 627 | 2.48 |
| 12 | 7 | Residential | Slab | 1 | 3 | 1 | 4 | 1 | 3 | 788 | 3.75 | ||
| 13 | 7 | Residential | Slab | 0 | 1 | 0 | 1 | 0 | 1 | 610 | 2.96 | ||
| 14 | 12 | Residential | Not specified | Shallow | Over-consolidated clay | 1 | 5 | 1 | 5 | 0 | 0 | 895 | 2.71 |
| 15 | 1 | Residential | Shallow reinforced concrete footing | Clay | 0 | 1 | 3 | 1 | 3 | 688 | 3.92 | ||
| 16 | 3 | Commercial | Piles | Sand | 0 | 1 | 3 | 1 | 2 | 977 | 4.28 |
Table A3.
LLM-generated risk summaries and assigned risk levels.
Table A3.
LLM-generated risk summaries and assigned risk levels.
| Model | Summary | Overall Risk Level | Total Tokens | Execution Time |
|---|---|---|---|---|
| 1 | The building, a six-story residential apartment constructed in 1976, exhibits significant structural issues. Observations indicate cracks in masonry walls and columns, water infiltration, and rust staining, suggesting settlement and potential reinforcement corrosion. Structural analysis points to shallow foundations, age, and poor drainage as contributing factors to settlement and differential movement. Active settlement is indicated by crack patterns. Recommendations include monitoring cracks, repairing significant ones, inspecting roof drainage, and further analysis for basement slab corrosion. | 7 | 557 | 3.22 |
| 2 | The building is a four-story commercial structure with notable structural concerns. Observations include hairline cracks and water seepage on the exterior, vertical cracks, and rust staining in the basement, and ceiling sagging on the first floor. These issues suggest differential settlement and potential steel reinforcement corrosion. Immediate actions recommended include installing crack monitors, repairing window seals, analyzing the first-floor ceiling, and implementing a phased repair plan with ongoing monitoring every three months. | 7 | 555 | 3.36 |
| 3 | The building is a 3-story residential house with a concrete structure and natural rock exterior, built in 1986. It is experiencing structural issues due to differential heaving of the fat clay soil and shallow pile foundations, leading to hairline cracks in slabs and walls. Rock elements have fallen in some exterior areas. A new foundation system is recommended to address these issues. | 7 | 550 | 2.76 |
| 4 | The seven-story residential building constructed in 1992 exhibits significant structural issues, including vertical and horizontal cracks, spalling concrete, ceiling sag, and moisture intrusion. These issues suggest potential foundation settlement, beam deflection, and reinforcement corrosion. Immediate interventions such as shoring, moisture testing, crack monitoring, and phased repairs are recommended to mitigate risks. | 8 | 541 | 3.13 |
| 5 | The seven-story residential building, constructed with prefabricated reinforced concrete elements and a raft foundation, shows no visible cracks or moisture issues. However, a structural analysis reveals that a non-compliant wall removal could lead to large deformations, posing a potential risk. Immediate action is recommended to rebuild the wall or replace it with a steel beam under professional supervision. | 5 | 530 | 2.63 |
| 6 | The 12-story residential building, constructed with reinforced concrete and shallow foundations, exhibits severe structural risks. Major vertical cracks in ground-level columns expose reinforcement bars, indicating potential axial loading issues or foundation movements. This poses a significant threat to structural integrity, necessitating immediate remedial actions such as restricting access, treating exposed rebar, and reinforcing columns. Evacuation should be considered if repairs are delayed. | 9 | 561 | 4.48 |
| 7 | The building is a single-story residential dwelling with a significant horizontal crack on the southern wall, likely due to foundation movement from soil heave or settlement. The clay-rich soil and poor drainage contribute to elevated moisture content, increasing the risk of structural issues. | 7 | 540 | 2.09 |
| 8 | The building, a 3-story commercial structure built in 1997, exhibits diagonal and stepped cracks near openings due to differential movement, thermal effects, and moisture issues. Its proximity to the sea and high groundwater level contribute to these issues. Moisture levels are slightly elevated, and there is some separation at the brick-concrete interface. Recommendations include conducting a thermographic survey and inspecting brickwork and mortar samples. | 6 | 569 | 2.78 |
| 9 | The 6-story residential building, constructed in 1976 with a reinforced concrete structure and shallow footings, exhibits significant structural concerns. Notable issues include cracks in masonry walls, water infiltration, and rust staining, indicating reinforcement corrosion. The building’s age, shallow foundations, and poor drainage contribute to ongoing settlement and differential movement, necessitating immediate monitoring and repairs. | 7 | 560 | 2.79 |
| 10 | The building, a four-story commercial structure built in 1983, exhibits several structural issues including significant basement cracks, ceiling sag, and rust staining on basement beams. These issues are likely due to differential settlement in the raft foundation. There are also signs of reinforcement corrosion and moisture problems. Immediate actions such as crack monitoring, core sampling, and window seal repairs are recommended, along with ongoing monitoring every 3 months. | 7 | 555 | 3.65 |
| 11 | The three-story residential building, constructed in 1986, exhibits minor hairline cracks and differential settlement due to inadequate pile foundation depth for the clay soil. Structural integrity is compromised, necessitating a new foundation system with deeper piles and further inspection of façade elements. | 7 | 510 | 2.48 |
| 12 | The 7-story residential building, constructed in 1992, exhibits significant structural concerns. Notable issues include vertical cracks on the eastern façade, concrete spalling near the roof, ceiling sag on the third floor, and horizontal cracks with moisture seepage on the fifth floor. These issues suggest potential beam deflection, differential movement due to foundation settlement, and possible reinforcement corrosion. Immediate shoring and further investigations are recommended to address structural deformation and moisture intrusion. | 7 | 600 | 6.06 |
| 13 | The building is a seven-story residential structure made of prefabricated concrete, constructed in 1992. No cracks were found in the exterior or inspected apartments, and there are no immediate risks of structural failure. However, a wall removal is non-compliant with building codes, necessitating structural restoration by an experienced engineer. | 4 | 526 | 2.88 |
| 14 | The 12-story residential building, constructed 20 years ago, exhibits significant structural concerns. Three vertical cracks with exposed reinforcement bars were observed in ground-level columns, indicating potential axial loading issues or foundation-related movements. The corrosion severity is high, and immediate actions are recommended to restrict access, treat the exposed rebar, and reinforce the columns. Evacuation may be necessary if repairs are delayed. | 8 | 553 | 2.05 |
| 15 | The building is a single-story residential dwelling with a significant horizontal crack on the southern wall, likely due to foundation movement from soil heave and settlement in clay-rich soil. The crack shows slight vertical displacement and elevated moisture content. Recommendations include improving surface drainage and conducting a follow-up inspection after winter. | 6 | 525 | 2.92 |
| 16 | The building, a three-story commercial structure built in 1997, exhibits diagonal cracks on the first and second floors, likely due to localized differential movement, thermal effects, and moisture issues. The marine environment and high groundwater table contribute to these issues. Further investigations are recommended to fully understand the causes and provide repair instructions. | 6 | 588 | 1.93 |
References
- Kelleher, J.D.; Tierney, B. Data Science; MIT Press: Cambridge, MA, USA, 2018; ISBN 9780262535434. [Google Scholar]
- Yarkoni, T.; Westfall, J. Choosing Prediction Over Explanation in Psychology: Lessons from Machine Learning. Perspect. Psychol. Sci. 2017, 12, 1100–1122. [Google Scholar] [CrossRef]
- Hardin, G. The Tragedy of the Commons: The Population Problem Has No Technical Solution; It Requires a Fundamental Extension in Morality. Science 1968, 162, 1243–1248. [Google Scholar] [CrossRef]
- European Commission. Definition of the Digital Building Logbook: Report 1 of the Study on the Development of a European Union Framework for Buildings’ Digital Logbook; Publications Office of the European Union: Luxembourg, 2020. [Google Scholar] [CrossRef]
- Gómez-Gil, M.; Sesana, M.M.; Salvalai, G.; Espinosa-Fernández, A.; López-Mesa, B. The Digital Building Logbook as a Gateway Linked to Existing National Data Sources: The Cases of Spain and Italy. J. Build. Eng. 2023, 63, 105461. [Google Scholar] [CrossRef]
- Malinovec Puček, M.; Khoja, A.; Bazzan, E.; Gyuris, P. A Data Structure for Digital Building Logbooks: Achieving Energy Efficiency, Sustainability, and Smartness in Buildings across the EU. Buildings 2023, 13, 1082. [Google Scholar] [CrossRef]
- Gómez-Gil, M.; Espinosa-Fernández, A.; López-Mesa, B. Review and Analysis of Models for a European Digital Building Logbook. Energies 2022, 15, 1994. [Google Scholar] [CrossRef]
- Signorini, M.; Dejaco, M.C.; Lupica Spagnolo, S. The Evolution of Digital Building Logbook: Exploring Building Information Gathering Systems to Boost Building Maintenance and Renovation. Appl. Sci. 2025, 15, 771. [Google Scholar] [CrossRef]
- Alonso, R.; Olivadese, R.; Ibba, A.; Recupero, D.R. Towards the Definition of a European Digital Building Logbook: A Survey. Heliyon 2023, 9, e19285. [Google Scholar] [CrossRef]
- Ugliotti, F.M.; Stradiotto, E. Integrating EPC Data into OpenBIM Workflows: A Methodological Approach for the Digital Building Logbook. Sustainability 2025, 17, 6005. [Google Scholar] [CrossRef]
- Beltrán-Velamazán, C.; Gómez-Gil, M.; Monzón-Chavarrías, M.; Espinosa-Fernández, A.; López-Mesa, B. Harnessing Open European Data for a Data-Driven Approach to Enhancing Decarbonization Measurement in the Built Environment. Environ. Clim. Technol. 2024, 28, 776–793. [Google Scholar] [CrossRef]
- Mêda, P.; Fauth, J.; Schranz, C.; Sousa, H.; Urban, H. Twinning the Path of Digital Building Permits and Digital Building Logbooks—Diagnosis and Challenges. Dev. Built Environ. 2024, 20, 100573. [Google Scholar] [CrossRef]
- Mêda, P.; Calvetti, D.; Sousa, H.; Moreira, J. Data Discovery for Digital Building Logbook (DBL): Directly Implementing and Enabling a Smarter Urban Built Environment. Urban Sci. 2024, 8, 160. [Google Scholar] [CrossRef]
- Lee, S.-K.; Yu, J.-H. Success Model of Project Management Information System in Construction. Autom. Constr. 2012, 25, 82–93. [Google Scholar] [CrossRef]
- Gómez-Gil, M.; Karami, S.; de Almeida, J.-P.; Cardoso, A.; Espinosa-Fernández, A.; López-Mesa, B. Envisaging a European Digital Building Renovation Logbook: Proposal of a Data Model. Appl. Sci. 2024, 14, 8903. [Google Scholar] [CrossRef]
- Urlainis, A.; Mitelman, A. Implementation of a BIM Workflow for Building Permit Coordination in Urban Metro Projects. J. Inf. Technol. Constr. 2025, 30, 319–334. [Google Scholar] [CrossRef]
- Gurevich, U.; Sacks, R. Longitudinal Study of BIM Adoption by Public Construction Clients. J. Manag. Eng. 2020, 36, 05020008. [Google Scholar] [CrossRef]
- Tam, V.W.Y.; Zhou, Y.; Illankoon, C.; Le, K.N. A Critical Review on BIM and LCA Integration Using the ISO 14040 Framework. Build. Environ. 2022, 213, 108865. [Google Scholar] [CrossRef]
- Giat, Y.; Mitelman, A. Cost Overruns, Winner’s Curse, Wisdom of the Crowd, and a Pendulum Effect in Public Construction Tenders. IEEE Eng. Manag. Rev. 2023, 51, 141–151. [Google Scholar] [CrossRef]
- Brynjolfsson, E.; Li, D.; Raymond, L. Generative AI at Work. Q. J. Econ. 2025, 140, 889–942. [Google Scholar] [CrossRef]
- Jurišević, N.; Kowalik, R.; Gordić, D.; Novaković, A.; Vukasinovic, V.; Rakić, N.; Nikolić, J.; Vukicevic, A. Large Language Models as Tools for Public Building Energy Management: An Assessment of Possibilities and Barriers. Int. J. Qual. Res. 2025, 19. [Google Scholar] [CrossRef]
- Wu, H.; Yuan, Y.; Mikaelyan, L.; Meulemans, A.; Liu, X.; Hensman, J.; Mitra, B. Structured Entity Extraction Using Large Language Models. arXiv 2024, arXiv:2402.04437. [Google Scholar] [CrossRef]
- Ghimire, P.; Kim, K.; Acharya, M. Opportunities and Challenges of Generative AI in Construction Industry: Focusing on Adoption of Text-Based Models. Buildings 2024, 14, 220. [Google Scholar] [CrossRef]
- Liu, M.; Zhang, L.; Chen, J.; Chen, W.-A.; Yang, Z.; Lo, L.J.; Wen, J.; O’Neill, Z. Large Language Models for Building Energy Applications: Opportunities and Challenges. Build. Simul. 2025, 18, 225–234. [Google Scholar] [CrossRef]
- Berlato, M.; Binni, L.; Durmus, D.; Gatto, C.; Giusti, L.; Massari, A.; Toldo, B.M.; Cascone, S.; Mirarchi, C. Digital Platforms for the Built Environment: A Systematic Review Across Sectors and Scales. Buildings 2025, 15, 2432. [Google Scholar] [CrossRef]
- Balsiger, D.; Dimmler, H.-R.; Egger-Horstmann, S.; Hanne, T. Assessing Large Language Models Used for Extracting Table Information from Annual Financial Reports. Computers 2024, 13, 257. [Google Scholar] [CrossRef]
- Durmus, D.; Giretti, A.; Ashkenazi, O.; Carbonari, A.; Isaac, S. The Role of Large Language Models for Decision Support in Fire Safety Planning. In Proceedings of the 41st International Symposium on Automation and Robotics in Construction (ISARC), Lille, France, 3–5 June 2024; pp. 339–346. [Google Scholar]
- Pakhale, K. Large Language Models and Information Retrieval. SSRN Electron. J. 2023, 4636121. [Google Scholar] [CrossRef]
- Bahrami, M.; Mansoorizadeh, M.; Khotanlou, H. Few-Shot Learning with Prompting Methods. In Proceedings of the 2023 6th International Conference on Pattern Recognition and Image Analysis (IPRIA), Qom, Iran, 14–16 February 2023; pp. 1–5. [Google Scholar]
- Fuchs, S.; Witbrock, M.; Dimyadi, J.; Amor, R. Using Large Language Models for the Interpretation of Building Regulations. arXiv 2024, arXiv:2407.21060. [Google Scholar]
- Géron, A. Hands-On Machine Learning with Scikit-Learn and TensorFlow, 3rd ed.; O’Reilly Media: Sebastopol, CA, USA, 2022; ISBN 9781098125974. [Google Scholar]
- Beskopylny, A.N.; Shcherban’, E.M.; Stel’makh, S.A.; Mailyan, L.R.; Meskhi, B.; Razveeva, I.; Kozhakin, A.; El’shaeva, D.; Beskopylny, N.; Onore, G. Discovery and Classification of Defects on Facing Brick Specimens Using a Convolutional Neural Network. Appl. Sci. 2023, 13, 5413. [Google Scholar] [CrossRef]
- Oulahyane, A.; Kodad, M.; Bouazza, A.; Oulahyane, K. Assessing the Impact of Deep Learning on Grey Urban Infrastructure Systems: A Comprehensive Review. In Proceedings of the 2024 International Conference on Decision Aid Sciences and Applications, DASA, Manama, Bahrain, 11–12 December 2024. [Google Scholar]
- Alves, V.H.M.; Alves, V.A.M.; Cury, A.A. Artificial Intelligence-Driven Structural Health Monitoring: Challenges, Progress, and Applications. In New Advances in Soft Computing in Civil Engineering; Studies in Systems, Decision and Control; Springer Nature: Cham, Switzerland, 2024; Volume 547, pp. 149–166. [Google Scholar]
- Szűrös, Z.; Ördög, R.R.; Károlyfi, K.A.; Szalai, D.; Bukovics, Á. Building Diagnostics Options for Existing Buildings–Innovative Methods. Chem. Eng. Trans. 2024, 114, 793–798. [Google Scholar] [CrossRef]
- Kim, J.-W.; Choi, H.-W.; Kim, S.-K.; Na, W.S. Review of Image-Processing-Based Technology for Structural Health Monitoring of Civil Infrastructures. J. Imaging 2024, 10, 93. [Google Scholar] [CrossRef]
- Ayaz, M.; Pasha, M.F.; Alzahrani, M.Y.; Budiarto, R.; Stiawan, D. The Fast Health Interoperability Resources (FHIR) Standard: Systematic Literature Review of Implementations, Applications, Challenges and Opportunities. J. Med. Inf. Inform. 2021, 9, e21929. [Google Scholar]
- Papaioannou, I.; Korkas, C.; Kosmatopoulos, E. Smart Building Recommendations with LLMs: A Semantic Comparison Approach. Buildings 2025, 15, 2303. [Google Scholar] [CrossRef]
- Ye, J.; Woods, D.; Jordan, N.; Starren, J. The Role of Artificial Intelligence for the Application of Integrating Electronic Health Records and Patient-Generated Data in Clinical Decision Support. AMIA Jt. Summits Transl. Sci. Proc. 2024, 2024, 459. [Google Scholar]
- Huang, J.; Yang, D.M.; Rong, R.; Nezafati, K.; Treager, C.; Chi, Z.; Wang, S.; Cheng, X.; Guo, Y.; Klesse, L.J. A Critical Assessment of Using ChatGPT for Extracting Structured Data from Clinical Notes. npj Digit. Med. 2024, 7, 106. [Google Scholar] [CrossRef]
- Vithanage, D.; Deng, C.; Wang, L.; Yin, M.; Alkhalaf, M.; Zhang, Z.; Zhu, Y.; Soewargo, A.C.; Yu, P. Evaluating Machine Learning Approaches for Multi-Label Classification of Unstructured Electronic Health Records with a Generative Large Language Model. medRxiv 2024. [Google Scholar] [CrossRef]
- Singhal, K.; Tu, T.; Gottweis, J.; Sayres, R.; Wulczyn, E.; Amin, M.; Hou, L.; Clark, K.; Pfohl, S.R.; Cole-Lewis, H. Toward Expert-Level Medical Question Answering with Large Language Models. Nat. Med. 2025, 31, 943–950. [Google Scholar] [CrossRef]
- Zech, J.R.; Badgeley, M.A.; Liu, M.; Costa, A.B.; Titano, J.J.; Oermann, E.K. Variable Generalization Performance of a Deep Learning Model to Detect Pneumonia in Chest Radiographs: A Cross-Sectional Study. PLoS Med. 2018, 15, e1002683. [Google Scholar] [CrossRef]
- Rajpurkar, P.; Chen, E.; Banerjee, O.; Topol, E.J. AI in Health and Medicine. Nat. Med. 2022, 28, 31–38. [Google Scholar] [CrossRef] [PubMed]
- Cha, Y.; Choi, W.; Suh, G.; Mahmoudkhani, S.; Büyüköztürk, O. Autonomous Structural Visual Inspection Using Region-Based Deep Learning for Detecting Multiple Damage Types. Comput. Aided Civ. Civil. Infrastruct. Eng. 2018, 33, 731–747. [Google Scholar] [CrossRef]
- Wajsbürt, P.; Sarfati, A.; Tannier, X. Medical Concept Normalization in French Using Multilingual Terminologies and Contextual Embeddings. J. Biomed. Inf. Inform. 2021, 114, 103684. [Google Scholar] [CrossRef]
- Peeperkorn, M.; Kouwenhoven, T.; Brown, D.; Jordanous, A. Is Temperature the Creativity Parameter of Large Language Models? arXiv 2024, arXiv:2405.00492. [Google Scholar] [CrossRef]
- Mitelman, A.; Yang, B.; Elmo, D.; Giat, Y. Choosing between Prediction and Explanation in Geological Engineering: Lessons from Psychology. Interdiscip. Sci. Rev. 2023, 48, 651–668. [Google Scholar] [CrossRef]
- Maidi, M.; Lifshitz Sherzer, G.; Shufrin, I.; Gal, E. Seismic Resilience of CRC- vs. RC-Reinforced Buildings: A Long-Term Evaluation. Appl. Sci. 2024, 14, 11079. [Google Scholar] [CrossRef]
- Urlainis, A.; Lifshitz Sherzer, G.; Shohet, I.M. Multi-Scale Integrated Corrosion-Adjusted Seismic Fragility Framework for Critical Infrastructure Resilience. Appl. Sci. 2024, 14, 8789. [Google Scholar] [CrossRef]
- Mitelman, A.; Urlainis, A. Investigation of Transfer Learning for Tunnel Support Design. Mathematics 2023, 11, 1623. [Google Scholar] [CrossRef]
- Leiser, F.; Eckhardt, S.; Leuthe, V.; Knaeble, M.; Mädche, A.; Schwabe, G.; Sunyaev, A. HILL: A Hallucination Identifier for Large Language Models. In Proceedings of the CHI Conference on Human Factors in Computing Systems, Honolulu, HI, USA, 11–16 May 2024; ACM: New York, NY, USA, 2024; pp. 1–13. [Google Scholar]
- Massenon, R.; Gambo, I.; Khan, J.A.; Agbonkhese, C.; Alwadain, A. “My AI Is Lying to Me”: User-Reported LLM Hallucinations in AI Mobile Apps Reviews. Sci. Rep. 2025, 15, 30397. [Google Scholar] [CrossRef] [PubMed]
Disclaimer/Publisher’s Note: The statements, opinions and data contained in all publications are solely those of the individual author(s) and contributor(s) and not of MDPI and/or the editor(s). MDPI and/or the editor(s) disclaim responsibility for any injury to people or property resulting from any ideas, methods, instructions or products referred to in the content. |
© 2025 by the authors. Licensee MDPI, Basel, Switzerland. This article is an open access article distributed under the terms and conditions of the Creative Commons Attribution (CC BY) license (https://creativecommons.org/licenses/by/4.0/).