Article

Numerical Evaluation of Cooling Energy Saving and Indoor Thermal Comfort for Building Energy Retrofit with Reflective Materials

1
College of Architecture and Urban Planning, Tongji University, Siping Road 1239, Shanghai 200092, China
2
Guizhou Huazhen Planning, Surveying and Design Group Co., Ltd., Tongren 554200, China
*
Author to whom correspondence should be addressed.
Buildings 2025, 15(18), 3387; https://doi.org/10.3390/buildings15183387
Submission received: 28 July 2025 / Revised: 11 September 2025 / Accepted: 15 September 2025 / Published: 18 September 2025
(This article belongs to the Special Issue Thermal Comfort and Energy Efficiency in Built Environments)

Abstract

Reflective materials, characterized by high albedo and thermal emissivity, offer effective passive cooling strategies for reducing building energy demand. While prior studies have developed thermal transfer models validated under laboratory conditions or conducted short-term monitoring in non-air-conditioned spaces, their effectiveness in operational buildings remains underexplored. This research evaluates the change in cooling energy demand and indoor thermal comfort in a retrofitted office building with reflective materials in China’s Hot Summer and Cold Winter (HSCW) zone. The calibrated WUFI®Plus simulations show that the application of reflective roof and window materials can result in an 11.3% reduction in cooling energy demand. Moreover, occupant surveys indicate improved thermal perception, with the mean Thermal Comfort Vote (TCV) rising from −0.75 to −0.30, thermal acceptability increasing from 0.10 to 0.35, and 80% of occupants reporting cooler conditions. These subjective results align with simulated Predicted Mean Vote (PMV) reductions (0.82 → 0.74), confirming the retrofit’s effectiveness. While the energy savings are more modest than those reported in Mediterranean climates, they are generally consistent with the energy saving ratios of buildings in the HSCW region as evaluated by previous studies. This study provides a framework for assessing retrofits in occupied buildings with reflective materials and indicates the practicality of such retrofits as an economic, low-disruption strategy for upgrading aging office building stocks in the HSCW zone.

1. Introduction

Buildings account for 36.2% of China’s energy consumption, with 60.4% originating from the operational phase in 2021 [1]. Moreover, the high occupant density in office buildings drives energy intensity in offices (180 kWh/m2 on average in Shanghai [2]) to over four times higher than that in residential buildings (43 kWh/m2 on average in Shanghai [3]). Thus, reducing the operational energy use in office buildings is of great significance in the energy-saving field. For this reason, numerous studies focus on the reduction in the operational energy use of office buildings from the aspects of energy management [4], the energy retrofit of building envelopes [5], the integration of renewable energy [6], etc.
Based on existing studies, there are various energy retrofit measures to mitigate energy consumption in buildings, including passive and active ones. Examples of active measures include the adoption of photovoltaic systems and ground-source heat pumps, as well as the application of electric shading systems [7,8,9,10]. In contrast to active measures which rely on mechanical systems for heating, cooling, and ventilation, passive measures are those harnessing natural elements to achieve optimal indoor conditions. Among passive strategies, reflective materials, which are characterized by high albedo and thermal emissivity, can reduce the excessive heat ingress into buildings due to solar radiation, facilitate the long-wave radiation of buildings’ external surfaces to outdoor environments and therefore reduce the building cooling energy demand in warm seasons. This type of material has received much attention because of its convenience of retrofitting and considerable energy-saving effects [11,12,13]. Rincón et al. [12] analyzed the energy-saving effect of reflective roof coatings on seven benchmark Spanish office buildings in 12 climate zones, indicating an average reduction of 25% in cooling energy and an average reduction of 6% in the annual HVAC energy consumption, alongside a 26–78% reduction in the number of days with thermal discomfort. Costanzo et al. [14] investigated the application of reflective roofs across different Italian climate zones, concluding an average reduction of 25 °C in the peak roof surface temperatures and 9% annual energy savings of HVAC systems.
It is worth noting that the energy-saving effect of reflective materials is affected by many factors. Research from Akbari et al. [15] shows the cooling energy saving brought by reflective materials varies from 1.1 kWh/m2 to 6.5 kWh/m2 in different climate zones in California, while the operation of buildings also poses a considerable influence [16]. As a result, numeric simulations are widely used to evaluate the energy-saving effect of reflective materials under different boundary and climatic conditions [17], showing satisfactory effectiveness [18,19].
Despite advances in building performance simulation, numerous studies have documented persistent discrepancies between predicted and actual building energy use, often referred to as the energy performance gap (EPG) [20]. These deviations arise from multiple factors, including differences between design and construction, uncertainties in boundary conditions, and particularly occupant behavior. Addressing this performance gap is essential, as inaccurate energy savings predictions can undermine confidence in retrofitting strategies.
To increase the accuracy of the simulation, the calibration of the model is essential. Current studies usually ignore the importance of calibration or calibrate the model [21] based on short-term monitoring [22]. However, model calibration helps not only enhance the credibility of the model but also explore hidden factors influencing the energy performance [23], which is essential to the predictive ability of models.
Meanwhile, research has shown that these materials can also generate unintended negative impacts on their surrounding environment. While they may lower ambient air temperatures, their reflective properties can increase mean radiant temperature (MRT) at the pedestrian level, leading to greater heat stress [24,25]. In addition, highly reflective façades can cause intense glare, visual discomfort, and even safety hazards in adjacent streets and buildings [26]. At night, reflective surfaces can further amplify light pollution by redirecting artificial light into the sky, worsening urban skyglow [27]. These challenges highlight the importance of evaluating reflective retrofits before implementation.
Furthermore, the subjective thermal feeling of building occupants is also a critical aspect for the energy retrofit of buildings, directly influencing the decision-making of renovation projects. The Chinese standard GB/T 51141-2015 Assessment standard for green retrofitting of existing building includes the evaluation of thermal comfort before and after energy retrofits of buildings as an important part [28]. However, comprehensive evaluations of building environment combining the energy performance and thermal comfort still remain insufficient [29]. Current research focuses mainly either on energy-saving designs or the evaluation of thermal comfort alone. The influence of retrofits on occupants’ thermal comfort lacks on-site investigations including a post-evaluation questionnaire [30].
Therefore, this study bridges a critical gap by validating reflective materials in an operational office building in China’s HSCW zone, combining calibrated energy simulations with occupant comfort surveys—an approach not found in previous studies. A comprehensive survey for the research object has been conducted, collecting the information of construction characteristics, occupation situation such as the number of occupants in each room and their realistic occupation time, as well as the operation and technical specifications of air conditioners. These parameters are input into the software WUFI®Plus (V3.5.0.1), along with the local climate data, to conduct hygrothermal building simulations. In addition, the monitoring of the hourly indoor air temperature covering the cooling season (July to September 2024) is conducted to calibrate the hygrothermal simulation of WUFI®Plus, helping compare the energy performance of the investigated building before and after applying reflective materials. Additionally, questionnaires are used to collect occupants’ responses on the top floors of the building, which are then statistically analyzed to obtain an indication of the average perception of occupants regarding the indoor thermal comfort. The Predicted Mean Vote (PMV) throughout the cooling season is also calculated based on simulation results compared with the mean Thermal Sensation Vote (TSV) from the conducted questionnaire, verifying the results of the questionnaire and illustrating the change in thermal comfort in the cooling season.

2. Principles Evaluating Reflective Materials

2.1. Principles of Reflective Materials

According to Tian et al. [31], reflective materials can be classified into five generations based on the technologies they were adopted for and the years they were applied. The first generation consists of natural high-reflectivity materials like marble, whose reflectivity can reach up to 0.75. The second generation is artificial white coatings, with higher reflectivity of around 0.85. The third generation can selectively reflect the invisible solar component in the near-infrared spectrum, allowing the materials to appear to be different colors and avoid glare. The fourth generation exhibits high reflectivity in the solar spectrum (0.3–2.5 μm) and high emissivity in the atmospheric window (8–13 μm). These materials can lower the surface temperature below the ambient air temperature, enhancing radiative cooling into the atmosphere. The fifth-generation temperature-adaptive radiative materials (TARMs) aim to solve the problem of the unnecessary increase in heating demand in winter caused by reflective roofs. These materials contain specific metal oxides whose reflectivity changes at different temperatures. At low temperatures, the surface turns dark to absorb more solar radiation, reducing over-cooling.
The thermal dynamics of building surfaces under solar radiation include the following heat fluxes (Figure 1): incident solar short-wave radiation (I), long-wave radiation exchange with sky (rrad1), the convective heat exchange with the outer atmosphere (qconv1), and the convective and radiative heat exchange with the indoor environment (qconv2, rrad2).
Under steady-state conditions (with thermal capacity neglected), the building envelope’s energy balance is governed by Equation (1):
T s o     T i R i _ s e = 1 r I σ ε T s o 4 T s k y 4 + h c T s o T o
where
T s o : Outer surface temperature (°C);
T i : Indoor air temperature (°C);
R i _ s e : Thermal resistance of building components (m2·K/W);
I : Total solar irradiance (W/m2);
T s k y : Effective sky temperature (°C);
T o : Outdoor air temperature (°C);
h c : Convective heat transfer coefficient (W/m2·K);
r : Solar reflectivity;
ε : Thermal emissivity;
σ : Stefan–Boltzmann constant (5.67 × 10⁻⁸ W/m2⋅K4).
Site-specific parameters ( I , T s k y , T o , and h c ) are determined by geographic and climatic conditions [32]. Equation (1) reveals that surface properties r and ε critically determine cooling performance. Higher values of r and ε lead to less heat transfer into the indoor environment, which are the key parameters of the reflective coating.

2.2. Available Methods for Evaluating Building Energy Performance

The evaluation of building energy performance within this study follows the Chinese standard GB55015-2021 [33]. This section also reviews the most common frameworks in North America and Europe for a comparison with the Chinese one.

2.2.1. Chinese GB55015-2021

This standard mandates a trade-off judgment for the thermal performance of building envelopes, when design parameters of building envelopes (e.g., the window–wall ratio) exceed basic limits. The core metric is annual total electricity consumption for heating and cooling [33], according to Equation (2):
E = E H + E C
where E (kWh/m2) represents the annual total heating and cooling electricity consumption, E H (kWh/m2) is the heating electricity consumption, and E C (kWh/m2) is the cooling electricity consumption.
Heating energy consumption is calculated as
E H = Q H A × C O P H
where EH (kWh/m2) is the annual heating electricity consumption, QH (kWh) is the annual heating energy demand calculated by simulation software, A (m2) is the building area, and C O P H is the coefficient of performance for the heating system, which is set at 2.6 by GB 55015−2021.
Cooling energy consumption is calculated by Equation (4):
E C = Q C A × C O P C
where EC (kWh/m2) is the annual cooling electricity consumption, QC (kWh) is the annual cooling energy demand calculated by simulation software, A(m2) is the building area, and C O P c is the coefficient of performance for the cooling system, which is set at 3.5 by GB 55015−2021.
Regarding the energy retrofit of existing public buildings, the evaluation follows two methods, as specified in JGJ 176 Technical Code for the Retrofitting of Public Building on Energy Efficiency [34]: (1) comparing the design values with the reference thermal parameters of different building components or systems and (2) comparing the energy performance of the retrofitted building with the energy performance before the retrofit, which is applied in this study.

2.2.2. ASHRAE 90.1

The ASHRAE 90.1 standard [35] mandates a whole-building energy simulation approach to evaluate the building energy performance called the Performance Rating Method (PRM). This method requires comparing the proposed design against a benchmark model with identical geometry but standardized components meeting minimum code requirements. Key metrics include annual site energy consumption (kWh/m2) and energy cost savings, calculated through three steps:
The ASHRAE 90.1 standard recommends energy simulation tools (e.g., eQuest, EnergyPlus) to calculate building energy consumption. These tools can simulate annual energy consumption using detailed building parameters, including thermal properties of building envelopes, technical specifications of HVAC systems, and lighting configurations. The evaluation process involves three key steps:
(1)
Benchmark modeling: A reference building is created with identical geometric features but envelope properties (e.g., U-values), HVAC efficiency (e.g., the coefficient of performance (COP)), and lighting power density compliant with ASHRAE minimums.
(2)
Whole-system analysis: The total energy consumption of the designed building and reference building, including HVAC, lighting, hot water systems, equipment operation, and renewable energy contributions, is simulated using energy simulation tools (e.g., eQuest, EnergyPlus).
(3)
Performance quantification: Energy savings are calculated as the percentage reduction in the designed building’s energy consumption compared to the benchmark building.

2.2.3. European EN ISO 52003−1:2017

Within the framework of EN ISO 52003−1:2017 [36], the reliability and comparability of energy performance indicators strongly depend on the prescription of standardized input conditions. These conditions define the boundary parameters under which building energy performance is simulated or calculated, ensuring that results are not influenced by arbitrary modeling choices. The EPB standards require that climatic data be drawn from reference weather files, typically defined for each climatic zone, to ensure consistency across different evaluations. Internal loads, such as occupant density, equipment use, and lighting profiles, are also standardized through conventional schedules that represent typical usage rather than project-specific assumptions. Similarly, set-point temperatures, ventilation rates, and hot water demand levels are prescribed according to the building type in order to avoid distortions caused by artificially favorable or unfavorable operating scenarios. The same principle applies to system efficiencies: values for heating, cooling, and ventilation systems must follow documented reference data or certified product characteristics rather than speculative inputs. By constraining these parameters, the standard enforces a level playing field, where calculated results reflect intrinsic building characteristics—such as envelope performance, system design, and the integration of renewable energy—rather than variations in assumptions. This rigor in defining input conditions allows both the compliance check against minimum requirements and the subsequent rating classifications to remain transparent, reproducible, and equitable across different contexts.

2.3. Evaluation of Indoor Thermal Comfort

Thermal comfort describes the occupant’s subjective feelings of the indoor thermal environment. ASHRAE-55 [37] recommends a seven-point-scale Thermal Sensation Vote (TSV) to describe the thermal environment. In many studies, Thermal Comfort Vote (TCV) is also adopted [38,39,40,41]. These indices can be collected using questionnaires on site for the occupants.
Considering the time-consuming process of questionnaires and operational constraints, the PMV is developed by Fanger [42]. The PMV predicts the average TSV of occupants in a given thermal environment. The PMV is calculated based on the following parameters: air temperature, mean radiant temperature (MRT), air speed, relative humidity, metabolic rate and clothing level. According to ASHRAE-55 [37], PMV values ranging from −0.5 to +0.5 are considered comfortable.

3. Methodology

3.1. Research Object

3.1.1. Climate Information

The investigated building is located in Tongren, a southwestern Chinese city. According to the climate zoning of the Chinese thermal standard GB50176−93 [43], Tongren’s climate is classified as the Hot Summer and Cold Winter (HSCW) zone, with significant seasonal temperature fluctuations.
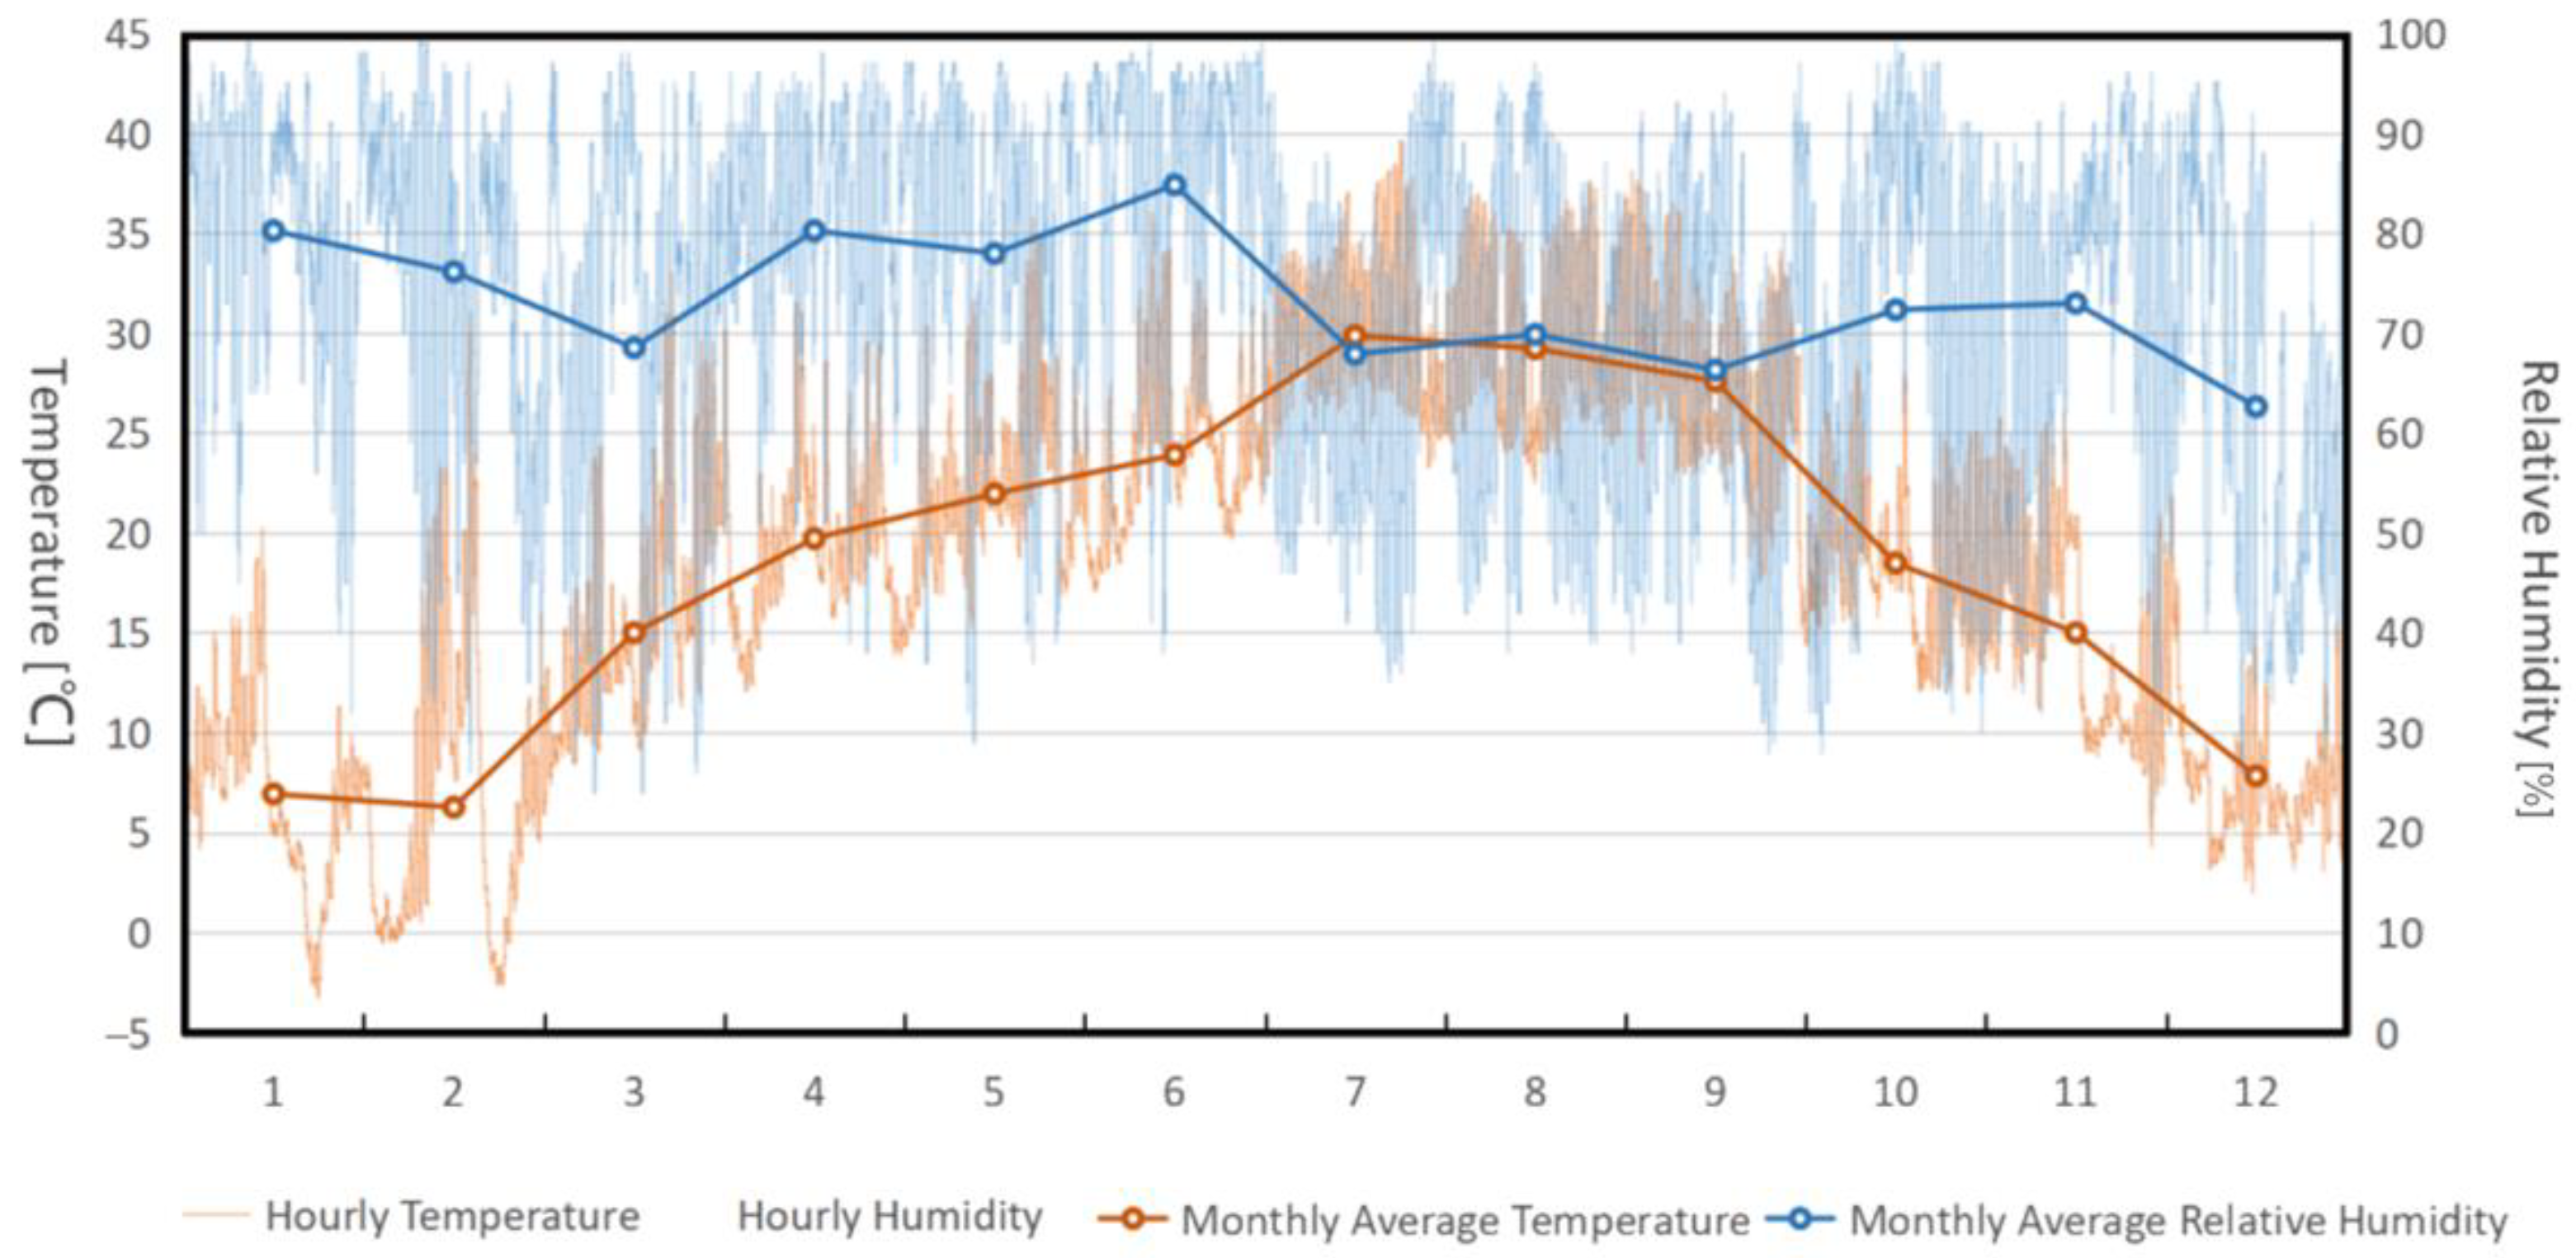
As shown in Figure 2, the climate data of 2024 obtained from the local weather station (about 1 km away from the investigated building) reveal some key characteristics. The monthly average relative humidity remains consistently above 60%. Temperatures exhibit remarkable seasonal fluctuations throughout the year. The hottest months (July, August and September) have monthly average temperatures over 25 °C, with maximum daily temperatures occasionally exceeding 35 °C. During the coldest period (December to February), monthly averages range from 5 °C to 10 °C, while the daily temperatures occasionally fall below 0 °C.

3.1.2. Basic Building Information

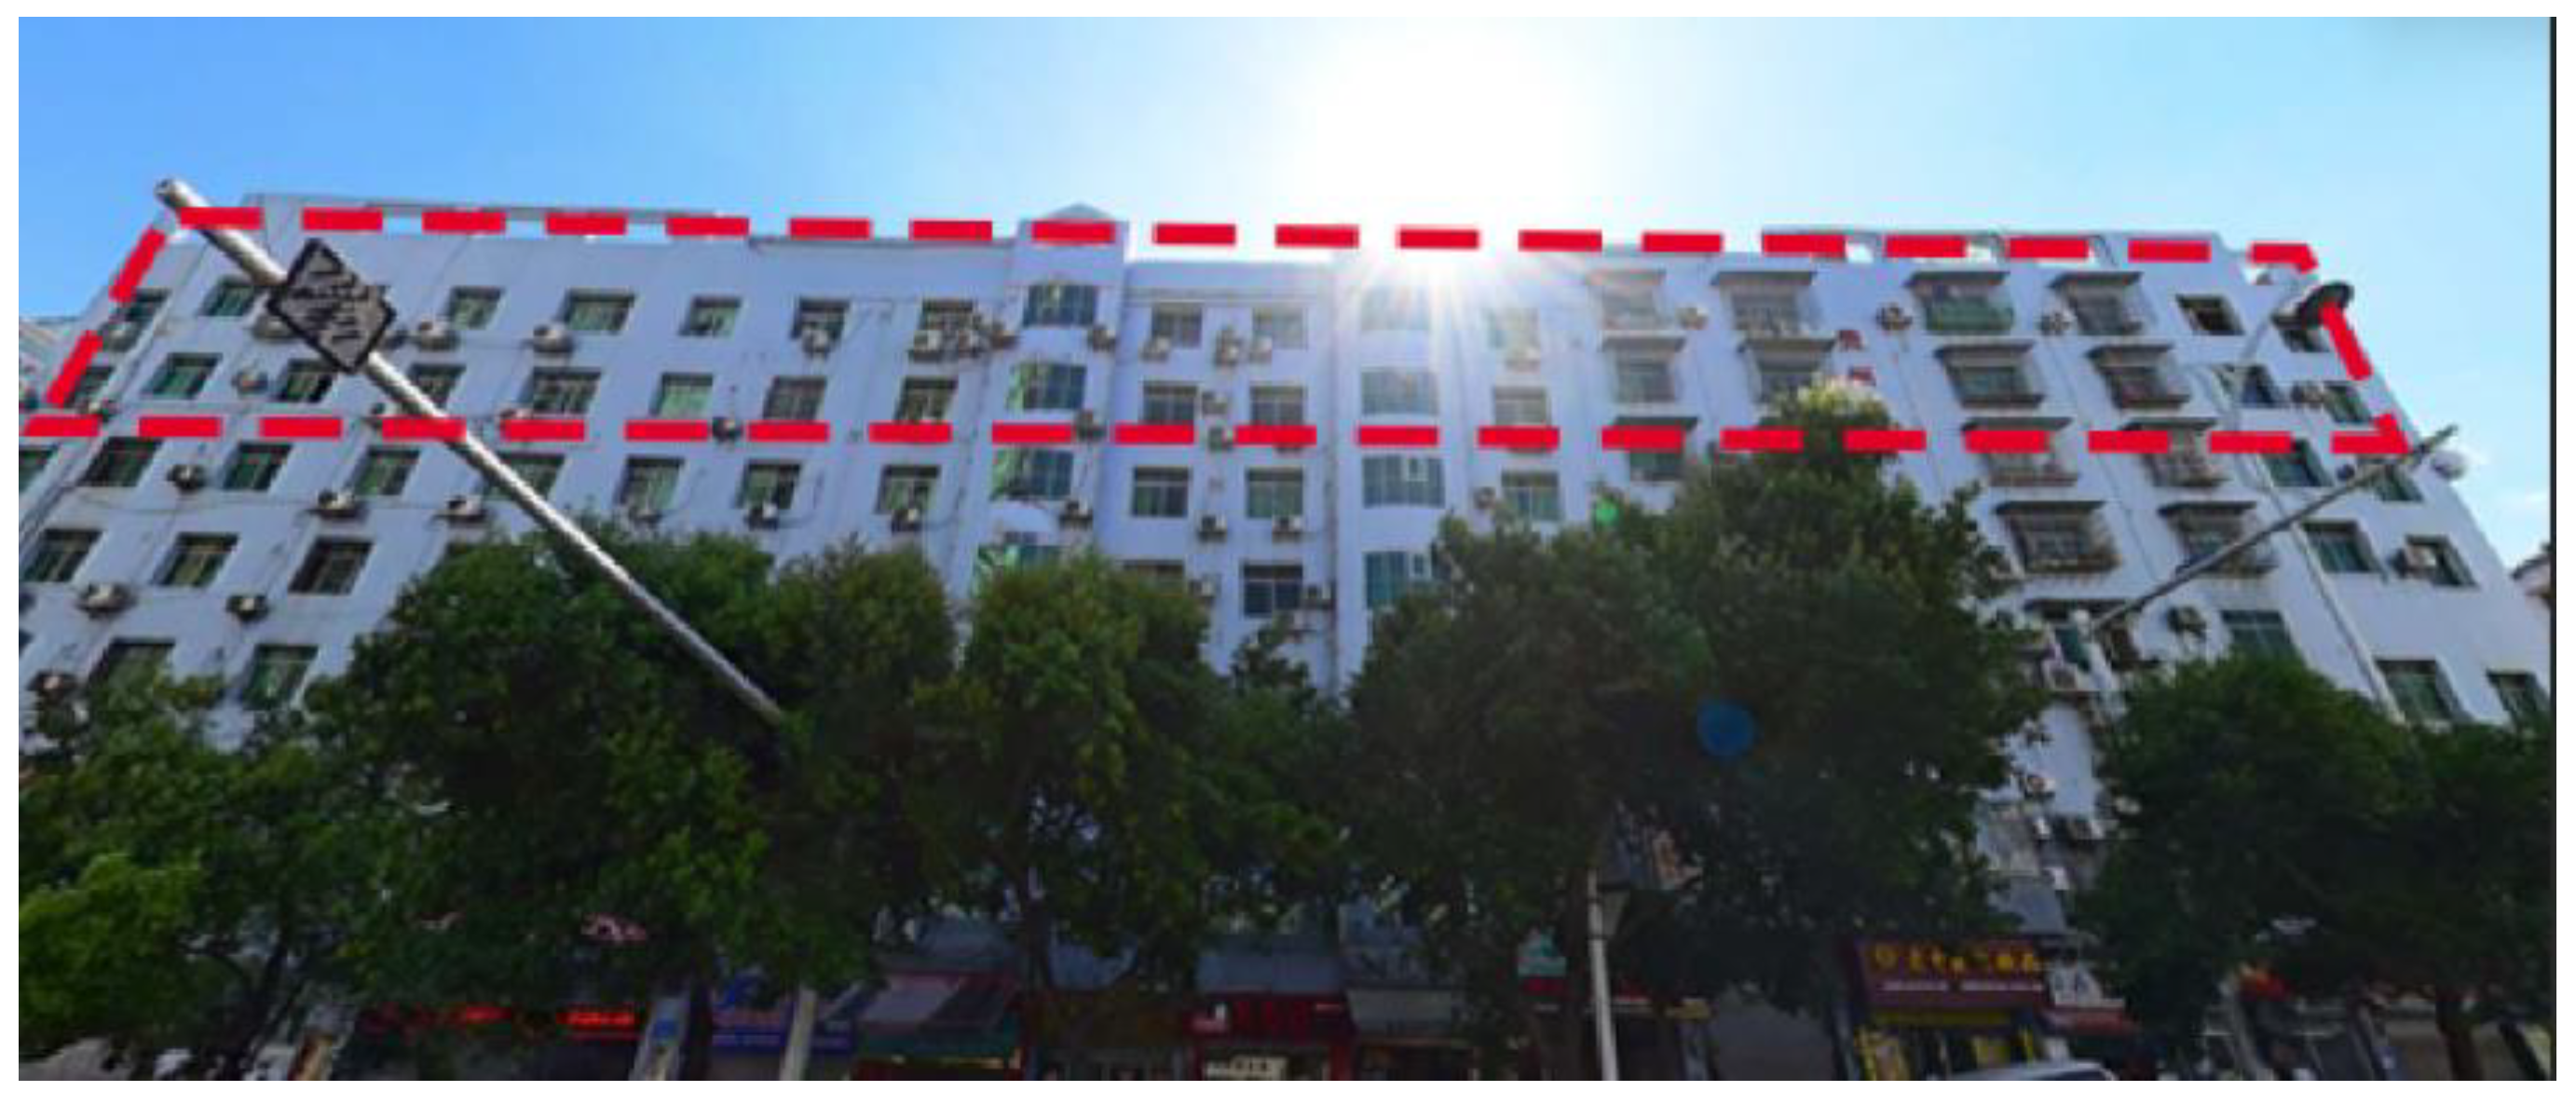
The subject building (Figure 3) is located in the downtown area of Tongren. The building is a typical example of the widespread office buildings in China’s HSCW zone, characterized by its brick–concrete structure and compact size. This research focuses on the highest floors (6th and 7th floors) of the building, since these two floors were retrofitted with reflective materials due to their greatest exposure to solar radiation. Each floor of the building features a corridor and office spaces with similar layouts (Figure 4 shows the layout of the 7th floor). The corridor is naturally ventilated, while distributed air conditioning units are used to cool the office rooms.
The number of persons in each room and the room area and volume are listed in Table 1:
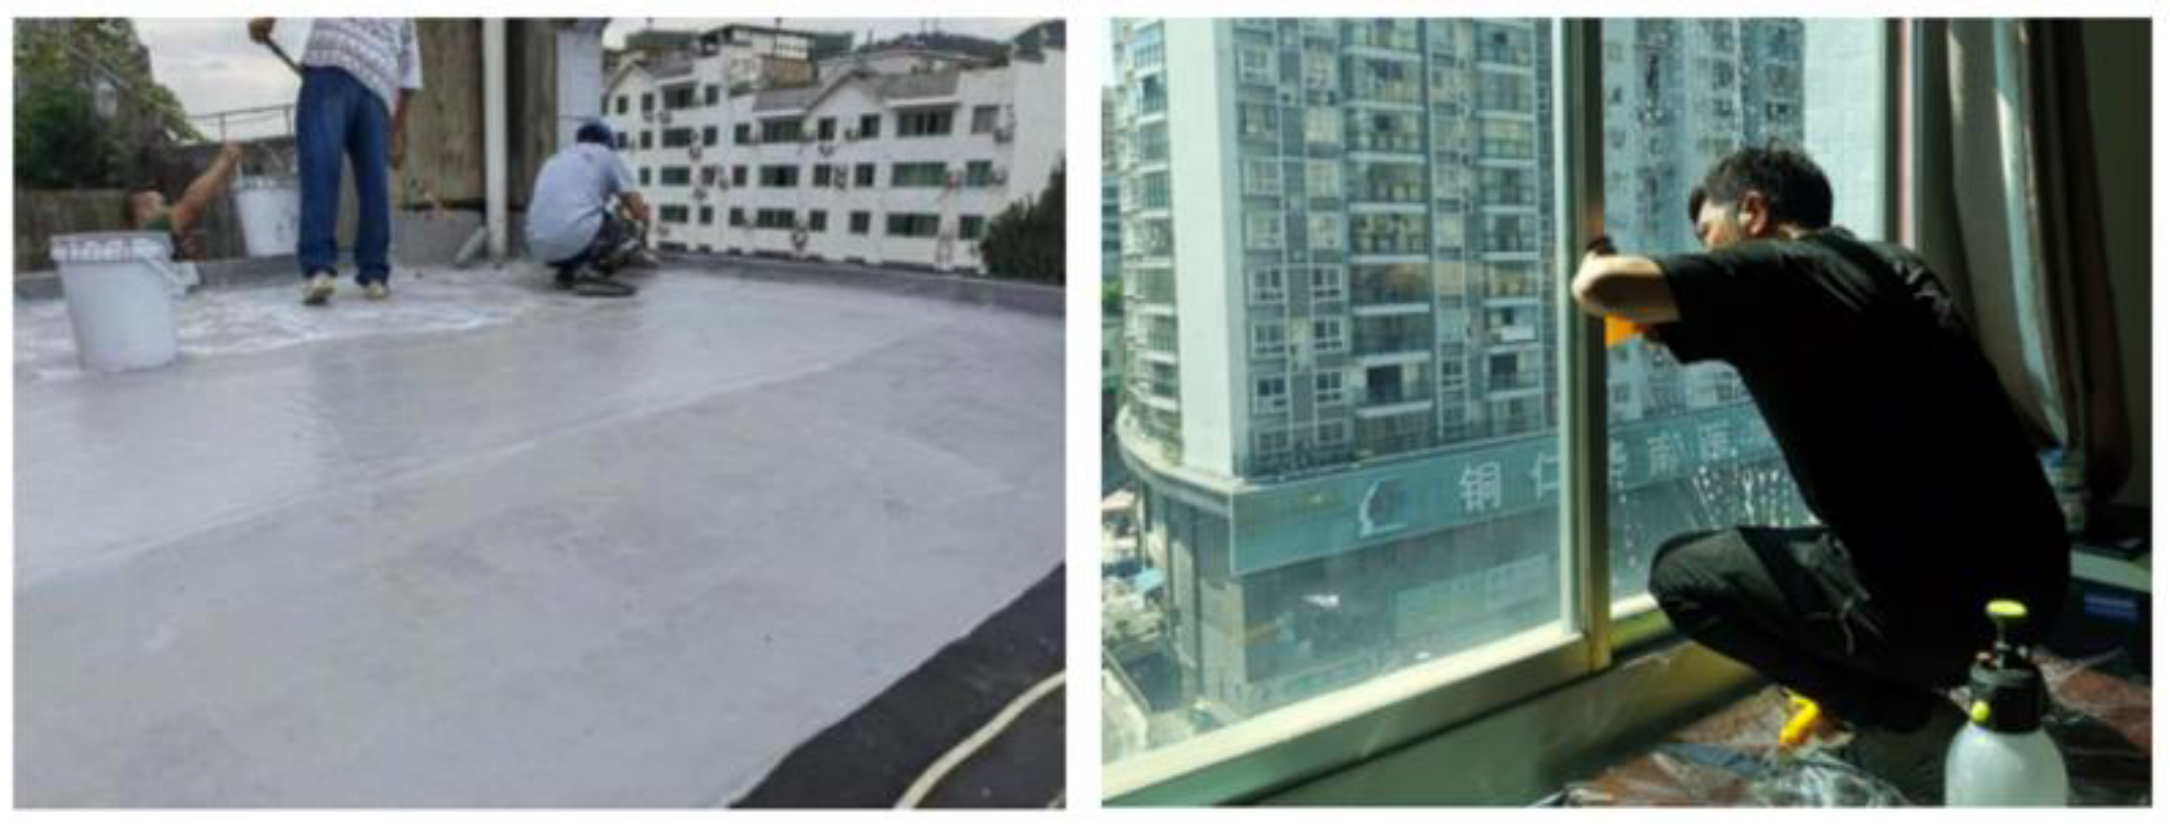
Reflective materials were installed in September 2023, including reflective coatings applied to the roof and reflective films installed on the windows (Figure 5).
The reflective coatings on the roof are composed of insulation resin as the base material, with nanomaterials to achieve high near-infrared reflectivity and emissivity. According to the technical documents of the manufacturer, the coatings have a reflectivity of 0.85 and an emissivity of 0.92. Due to air pollutions in city areas, reflectivity may change due to increasing exposure to the outdoor environment. The decrease in reflectivity caused by surface pollution on the coating is up to 5%, according to the manufacturer. The coating can be sprayed or brushed onto the roof surface (Figure 5, left), after leveling the substrate and waterproofing work. With regard to the reflective film, it was installed on the interior surface of windows due to high-rise access challenges (Figure 5, right). After the retrofit, the solar heat gain coefficient (SHGC) of windows can decrease from the original 0.8 to 0.45 according to the manufacturer.

3.2. Applied Method

3.2.1. Research Workflow

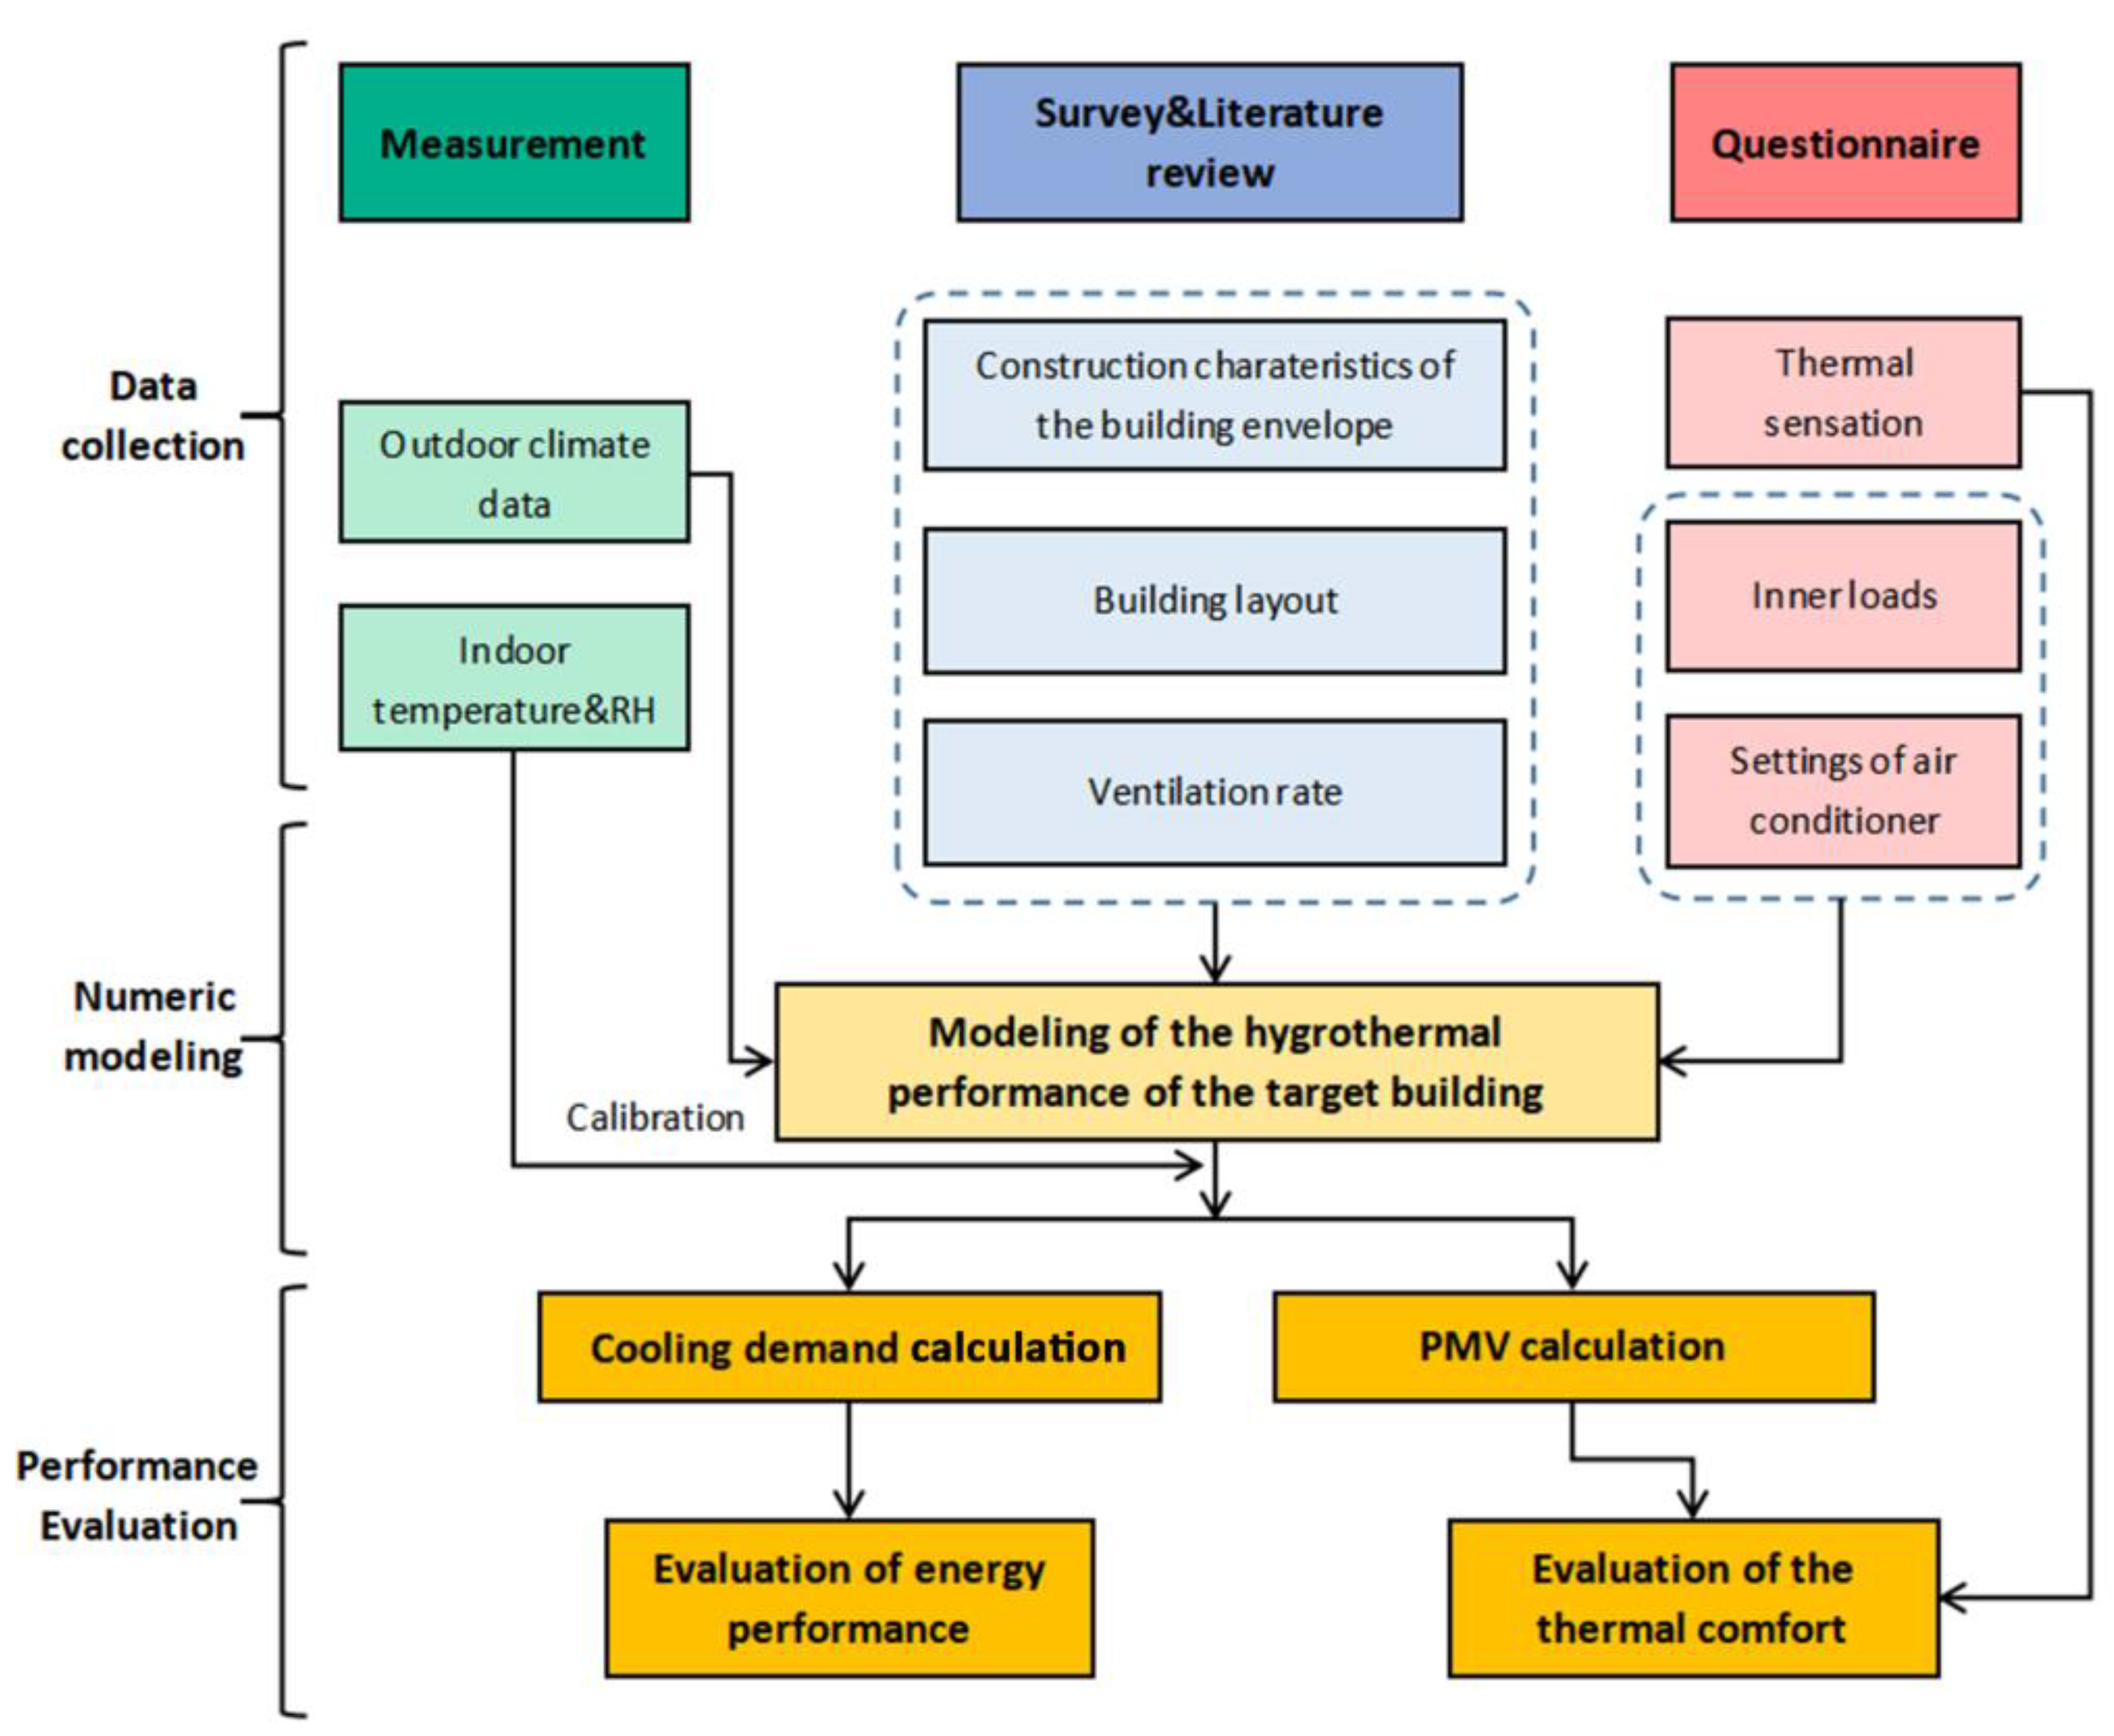
The research workflow of this study aims at a comprehensive assessment of the energy retrofit including the energy efficiency improvement and changes in indoor thermal comfort due to the application of reflective materials. For this purpose, this research is divided into three main steps: data collection, numerical modeling, and performance evaluation (Figure 6).
(1)
Data collection: In this step, indoor air temperatures and relative humidity are measured on site and outdoor climate data are collected from the local weather station. Meanwhile, an on-site investigation is conducted to determine the construction of building components of the building envelope. Properties of building materials are obtained from literature reviews and the WUFI®Plus database. Additionally, a questionnaire survey collects occupants’ subjective thermal perceptions.
(2)
Numerical modeling: Based on the collected data, a hygrothermal simulation model of the target building is established using the WUFI®Plus software [44], which is further introduced in Section 3.2.3. This software provides a coupled model for heat and moisture transfer that considers outdoor climate conditions, hygrothermal properties of building components, occupant behaviors, and HVAC system operation. Simulation results cover various aspects such as the dynamic hygrothermal conditions of building components, indoor air temperature and humidity, building energy consumption, and indoor thermal comfort. This study calibrates the simulation model by comparing simulated indoor air temperature with measured values obtained from a three-month monitoring period throughout the cooling season. Subsequently, the simulation quantifies changes in energy consumption before and after the application of reflective materials. The PMV is also calculated to compare with the result of the questionnaire, helping to assess the improvement in indoor thermal comfort.
(3)
Performance evaluation: This stage assesses the energy-saving effect of reflective materials by simulating the energy consumption for cooling. Moreover, the changes in thermal comfort resulting from the application of reflective materials are assessed through the statistical analysis of the thermal sensation questionnaires and the PMV derived from the simulation, introducing new dimensions to the evaluation of the indoor thermal environment.

3.2.2. Measurement Plan

Several measurements were conducted at the site, including that of indoor air temperatures and relative humidity, along with exterior and interior surface temperatures of walls and windows. These measurements covered the cooling season from July to September. In this study, only the data of air temperature were considered.
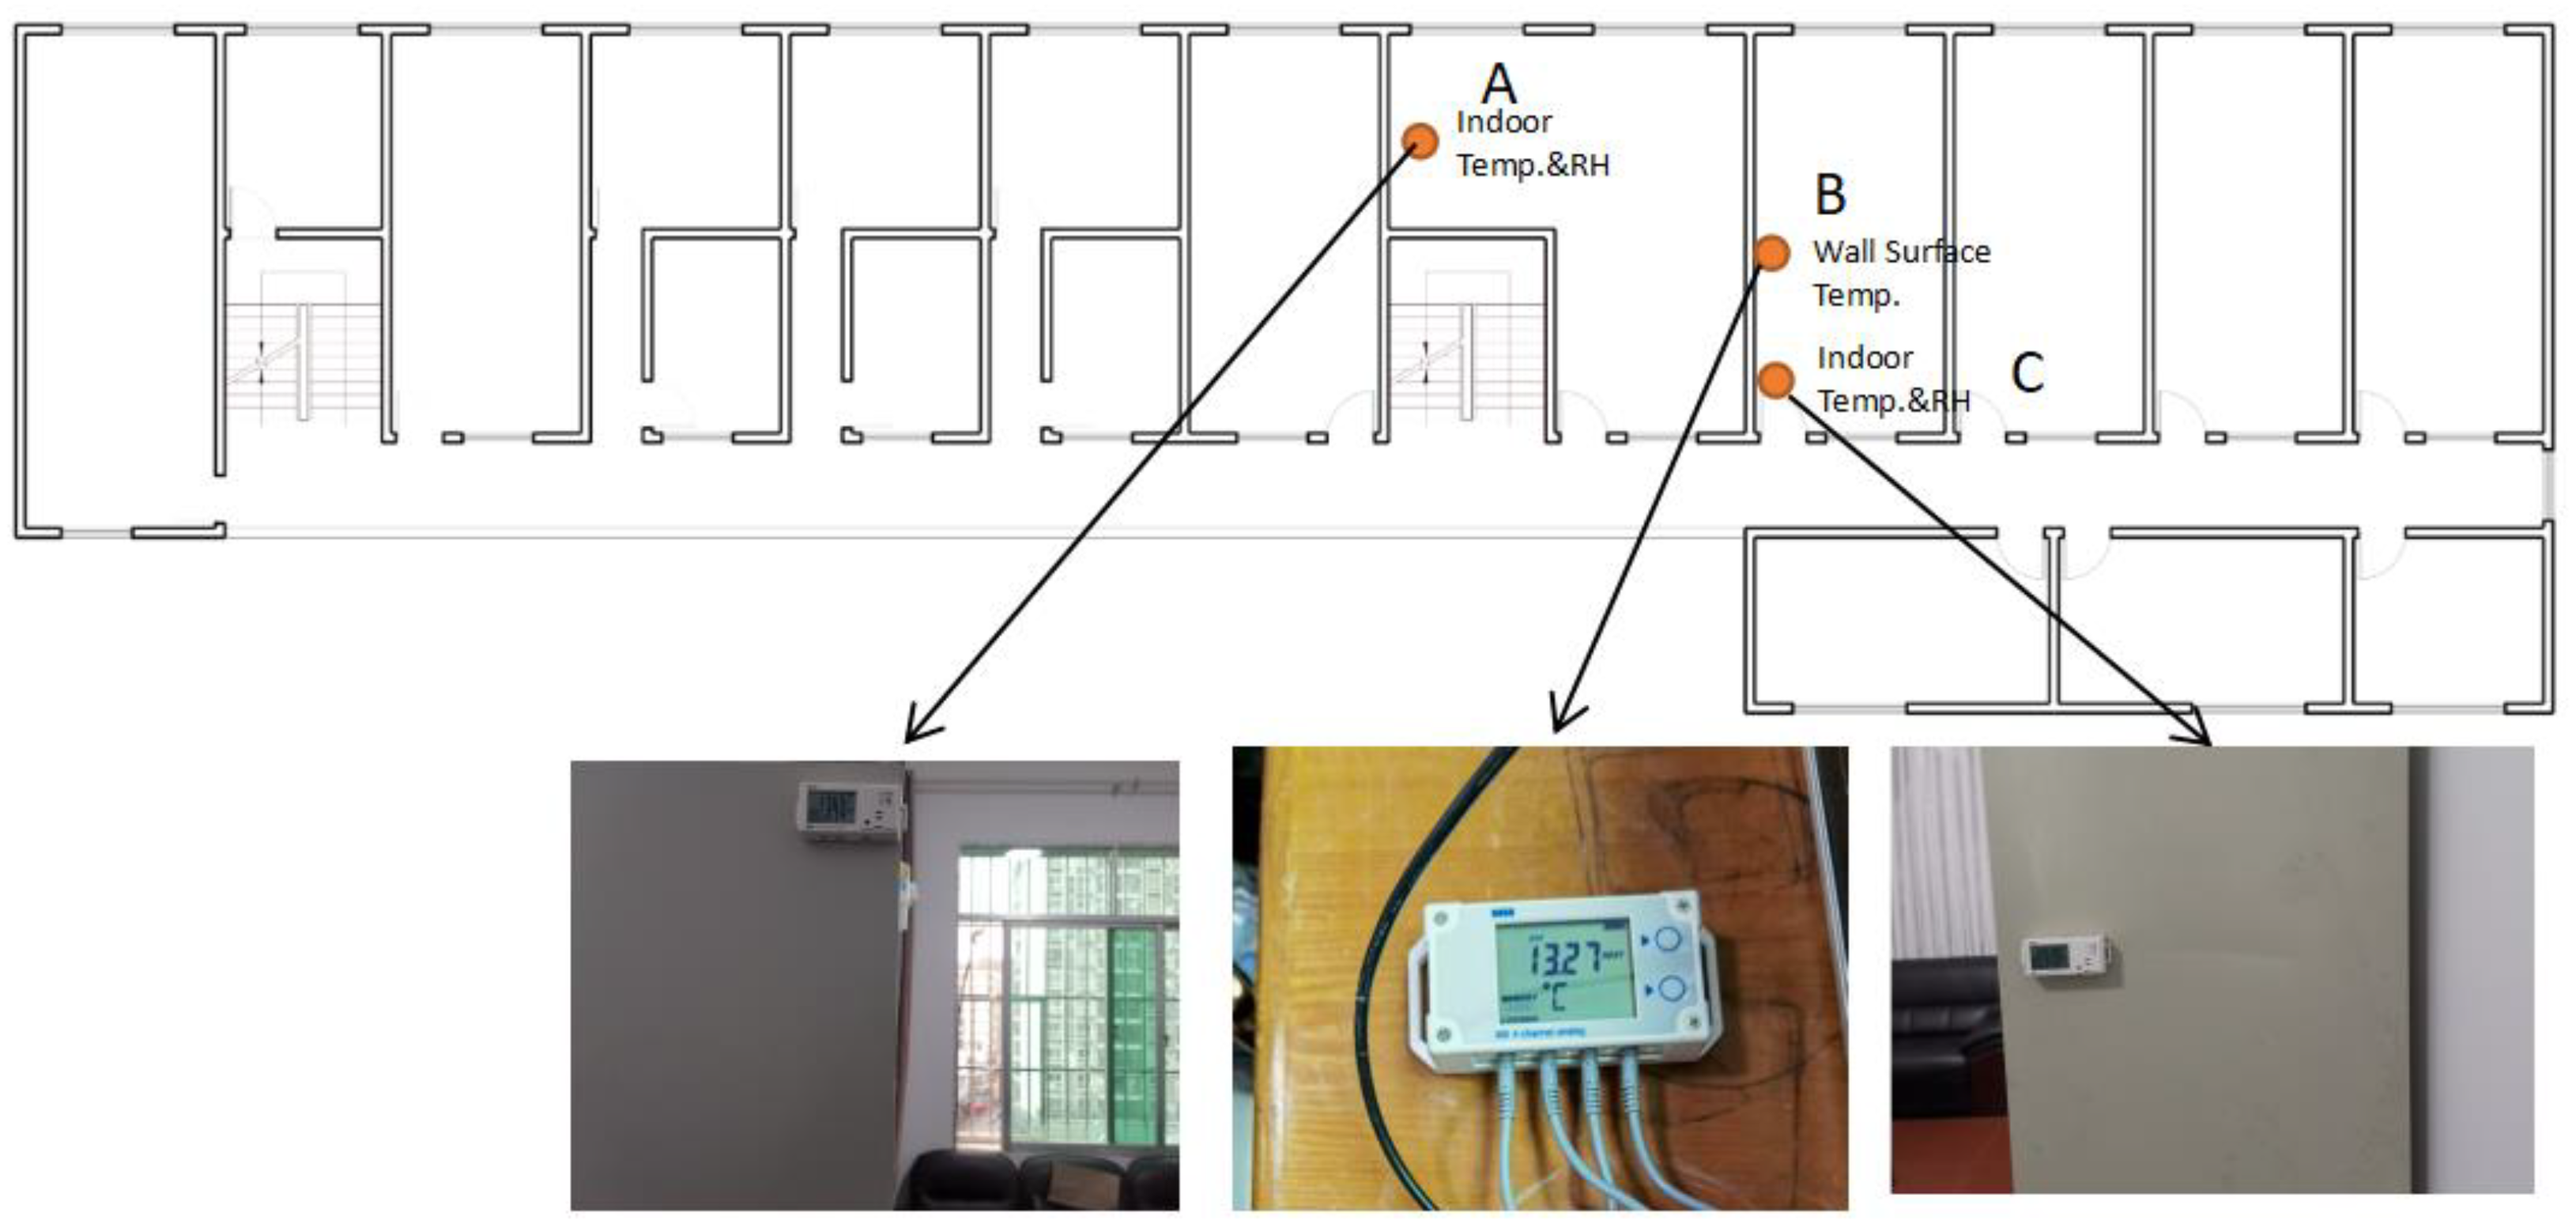
The indoor air temperature and relative humidity were measured in Room 707 and Room 708, two rooms located on the 7th floor. The exterior and interior surface temperatures of walls and windows were measured in Room 708.
The measurement instruments are listed in Table 2, and the locations where the instruments are placed are shown in Figure 7. The instruments were mounted 1.5 m above the floor. A distance of more than 1 m from all walls, except for the south inner wall, was maintained.
It is worth noting that ASHRAE 55 [37] recommends that the distance of measurement instruments for indoor air temperature and relative humidity not be less than 1 m from interior walls to avoid the possible influence of the radiation effect. In our study, the distance of measurement instrument A from the wall on the south side is about 40 cm. However, the interference caused by the surface radiation of the south inner wall is limited due to the following reasons.
The adjacent room behind the wall is also air-conditioned with a similar indoor environment. Therefore, the surface temperature of the interior wall is very close to the indoor air temperature, making radiant heat exchange negligible and exerting no substantial effect on the measured air temperature. Moreover, the air temperature probes are housed within ventilated radiation shields of the sensors. This design is specifically intended to minimize the influence of radiant heat exchange from surrounding surfaces, thereby providing a measurement that is more representative of the true air temperature.

3.2.3. Hygrothermal Simulation Model

Suitable simulation tools provide accurate insights into the changes in a building’s hygrothermal environment and the underlying reasons for these changes. This study employs WUFI®Plus software [44] to simulate the hygrothermal performance of the target building and calculate cooling energy consumption. WUFI®Plus has the following features supporting this research:
(1)
Coupled heat and moisture transfer modeling: WUFI can establish detailed hygrothermal models of building components, capturing the complex interaction between heat and moisture transport.
(2)
Higher accuracy in temperature and humidity prediction: By using transient simulations under real climate data, WUFI®Plus provides more precise results compared to simplified steady-state methods.
(3)
Detailed physical models: The software integrates advanced physical processes, such as vapor diffusion, capillary transport, and phase change, offering a richer level of detail for analysis.
(4)
Convenient for further research: Its comprehensive modeling framework and material database facilitate in-depth studies on durability, condensation risk, and moisture control.
(5)
Combination with comfort assessment: WUFI supplies reliable parameters that can be used for subsequent PMV calculations, supporting indoor comfort evaluation.
The software’s mathematical and physical models are based on the work of Künzel [45], complying with EN 15026, and are validated by studies [46,47,48], which prove its excellent performance in analyzing the heat and moisture transfer between the indoor and outdoor environments. The calculation of indoor heat balance is based on the following equation, which provides a comprehensive evaluation:
d H i d t = j Q C omp , j + Q S ol + Q I n + Q V ent + Q HVAC
  • Hi: Overall enthalpy of the air in zone i (room) [J].
  • T: Time [s].
  • QComp,j: Transmission heat flow over component j [W].
  • QSol: Short-wave solar radiation leading directly to heating the inner air or interior furnishing [W].
  • QIn: Convective heat sources in the room [W].
  • QVent: Heat flow from ventilation [W].
  • QHVAC: Convective heat flow from building ventilation systems [W].
The geometric characteristics of the building were modeled in SketchUp and imported into WUFI®Plus. Then, the model was zoned to simulate each room’s hygrothermal environment. The outdoor hourly climate data were obtained from the local weather station, including air temperature, relative humidity, precipitation, direct and diffuse solar radiation, wind direction and speed, and air pressure. These data, along with those collected during the measurement phase, define the boundary conditions of the model. In this research, the adjacent floors are treated as independent zones with no thermal exchange between each other. As all floors share identical layouts and similar indoor environment control conditions, each floor is simplified as a thermal zone with identical boundary conditions.

3.3. Numeric Investigation

3.3.1. Hygrothermal Properties of Building Envelope

The exterior walls of the investigated building are 28.6 cm thick, constructed with bricks and plasters on exterior and interior sides without insulation materials. The hygrothermal properties of building materials are defined with data in WUFI®Plus, which are summarized in Table 3. The U-value of exterior walls is calculated to be 1.93 W/(m2K).
The roof features a standard concrete structure comprising a 15 cm concrete structural layer, a leveling course, an asphalt waterproof membrane and a reflective coating on the top (Table 4). The U-value is 2.77 W/(m2K).
All windows employ single-glazed aluminum frames with thermal break design. Thermal parameters of windows are listed in Table 5.

3.3.2. Internal Hygrothermal Loads

The internal hygrothermal loads comprise three parts: occupant loads, lighting loads and other electrical equipment loads (excluding air conditioners). Each occupant contributes 78 W convective heat, 39 W radiant heat, and 81 g/h moisture load according to ASHRAE 55. The definition of lighting and other electrical equipment loads follows GB55015−2021, General code for energy efficiency and renewable energy application in buildings [33]. The lighting load is regulated as 8 W/m2 and the electrical equipment is regulated as 15 W/m2. The overview of internal hygrothermal loads is listed in Table 6.

3.3.3. Operation of Air Conditioners and Ventilation Behaviors

Based on interviews with office employees, the air conditioning setpoints are 26 °C for cooling. The cooling season is from July to September. The system operates on weekdays, with operational hours from 08:00 to 17:00.
The office has no mechanical ventilation system. Fresh air supply relies on natural ventilation. According to the Chinese standard JGJ 67−2017, Civil building ventilation design code [49], fresh air supply should meet the minimum requirement of 30 m3 per person per hour. This study assumes that natural ventilation can provide the necessary fresh air, with calculated air exchange rates presented in Table 7.

3.3.4. Energy Efficiency of Air Conditioners

The calculation of the energy use of air conditioners follows the method provided by the Chinese standard JGJ 176 [34]. The split air conditioner in each room is used for both cooling and heating in the investigated office building. The coefficient of performance (COP) values of air conditioners are specified on the nameplate. Small rooms like Room 703 have KFR-35GW/(35559)FNhAb-A3 (Gree Electric Appliances, Inc. of Zhuhai, Zhuhai, Guangdong, China) with a COP for cooling of 3.21 and a COP for heating of 3.36. In larger rooms like Room 706, the installed type is Gree KFR-60LW/E(60511L)B-N4 (Gree Electric Appliances, Inc. of Zhuhai, Zhuhai, Guangdong, China), which has a COP for cooling of 2.89 and a COP for heating of 3.35. The COP values of the air conditioners in each room are listed in Table 8.
The total energy use of cooling E is calculated as Equation (5):
E = 1 n Q c i C O P c i
where Q c i is the cooling demand of room i, C O P c i is the coefficient of performance for cooling of room i, and Q c i is the cooling demand of room i.

3.3.5. Calibration of the Simulation Model

To calibrate the established simulation model, the indoor air temperature of Room 708 is simulated and compared with the on-site measurement. The hourly simulation covers the cooling period from 1 July to 30 September. A comparison is presented in Figure 8. According to Figure 8, both measured and simulated indoor air temperatures drop during the working hours when air conditioners are operated and increase at nights. It is worth noting that the measured indoor air temperature in Room 708 can drop below the defined limit for cooling of 26 °C for the simulation. This means that the occupants would prefer a lower indoor air temperature than the design value for cooling, resulting in higher cooling energy consumption than calculated by standards. In addition, the indoor peak temperature at night could be 2 °C lower than the monitored values. This may come from qn overestimation of the air change rate at nights for the numerical simulation. In the real case, windows and doors could be closed outside working hours.
Regarding the calibration quality, this study uses five statistical indicators, including Normalized Mean Bias Error (NMBE), Coefficient of Variation of Root Mean Square Error (CV (RMSE)), Coefficient of Determination (R2), Root Mean Square Error (RMSE), and the Mean Absolute Error(MAE) to evaluate the simulation quality. These indicators are calculated below:
N M B E = i = 1 n t i p     t i m n 1 1 t m ¯ 100 %
C V R M S E = i = 1 n t i p t i m 2 n 1 1 t i m ¯ 100 %
R 2 = i = 1 n t i m t i m ¯ t i p t i p ¯ i = 1 n t i m   t i m ¯ 2 i = 1 n t i p t i p ¯ 2 2
M A E = i = 1 n t i p t i m n 1
R M S E = i = 1 n t i p t i m 2 n 1
  • where t i p is the simulated value at time i.
  • t i m is the measured value at time i.
  • t i m ¯ is the arithmetic mean of a set of measurements.
  • n is the number of measurements.
The NMBE describes the discrepancy between simulated values and measurements. The CV(RMSE) describes the ratio of the Root Mean Square Error to the average measured value. The NMBE indicates systematic bias and errors, while the CV(RMSE) evaluates the accuracy of the simulation [47]. According to ASHRAE Guideline 14–2023 [50], for hourly data discrepancy examination, an NMBE ≤ 10% and a CV(RMSE) ≤ 30% are acceptable. IPMVP [51] suggests a stricter limit of NMBE ≤ 5% and CV(RMSE) ≤ 20%. For R2, ASHRAE Guideline 14–2023 [50] and IPMVP [51] give a threshold of 0.75. The statistical indicators of the calibration are shown in Table 9:
The key performance indicators NMBE, CV and R2 are all within the thresholds set by IPMVP. The results indicate that the simulation closely matches the actual measurements, thereby supporting the validity of the model. The MBE of −0.69 °C indicates a slight average underestimation of the simulated values compared to the measurements, while the RMSE is 1.31 °C.

3.4. Investigation of Indoor Thermal Comfort

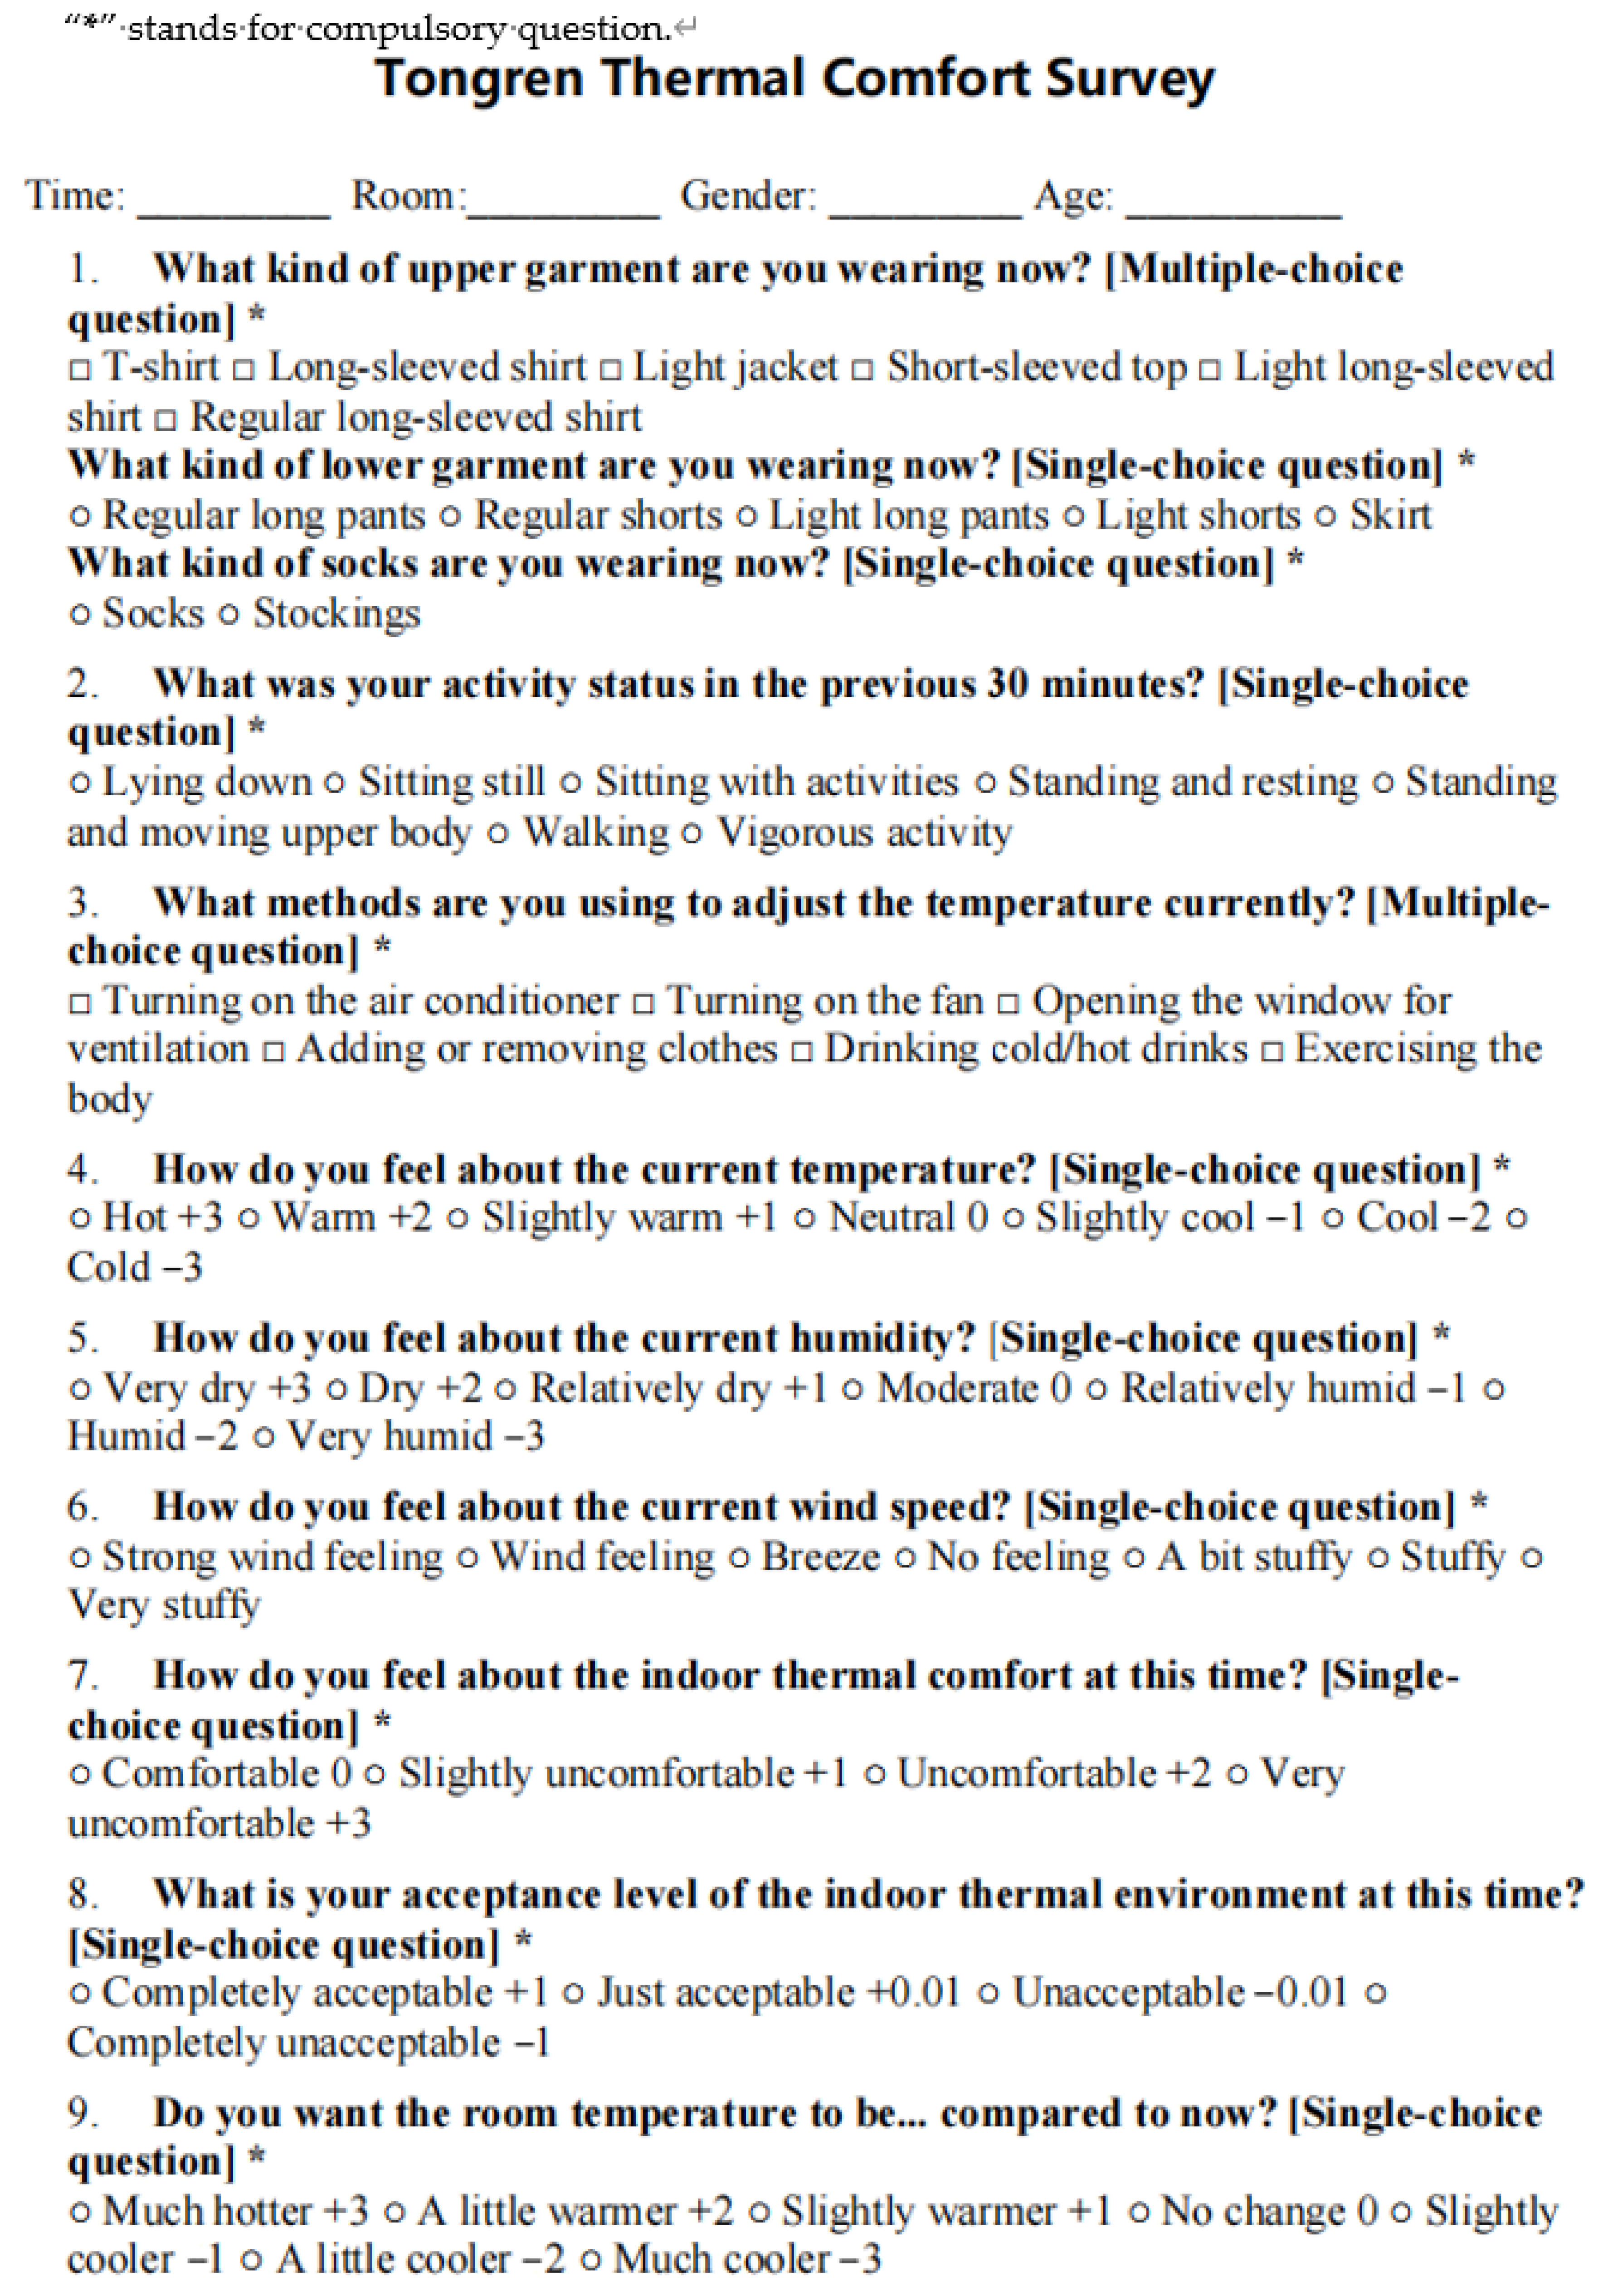
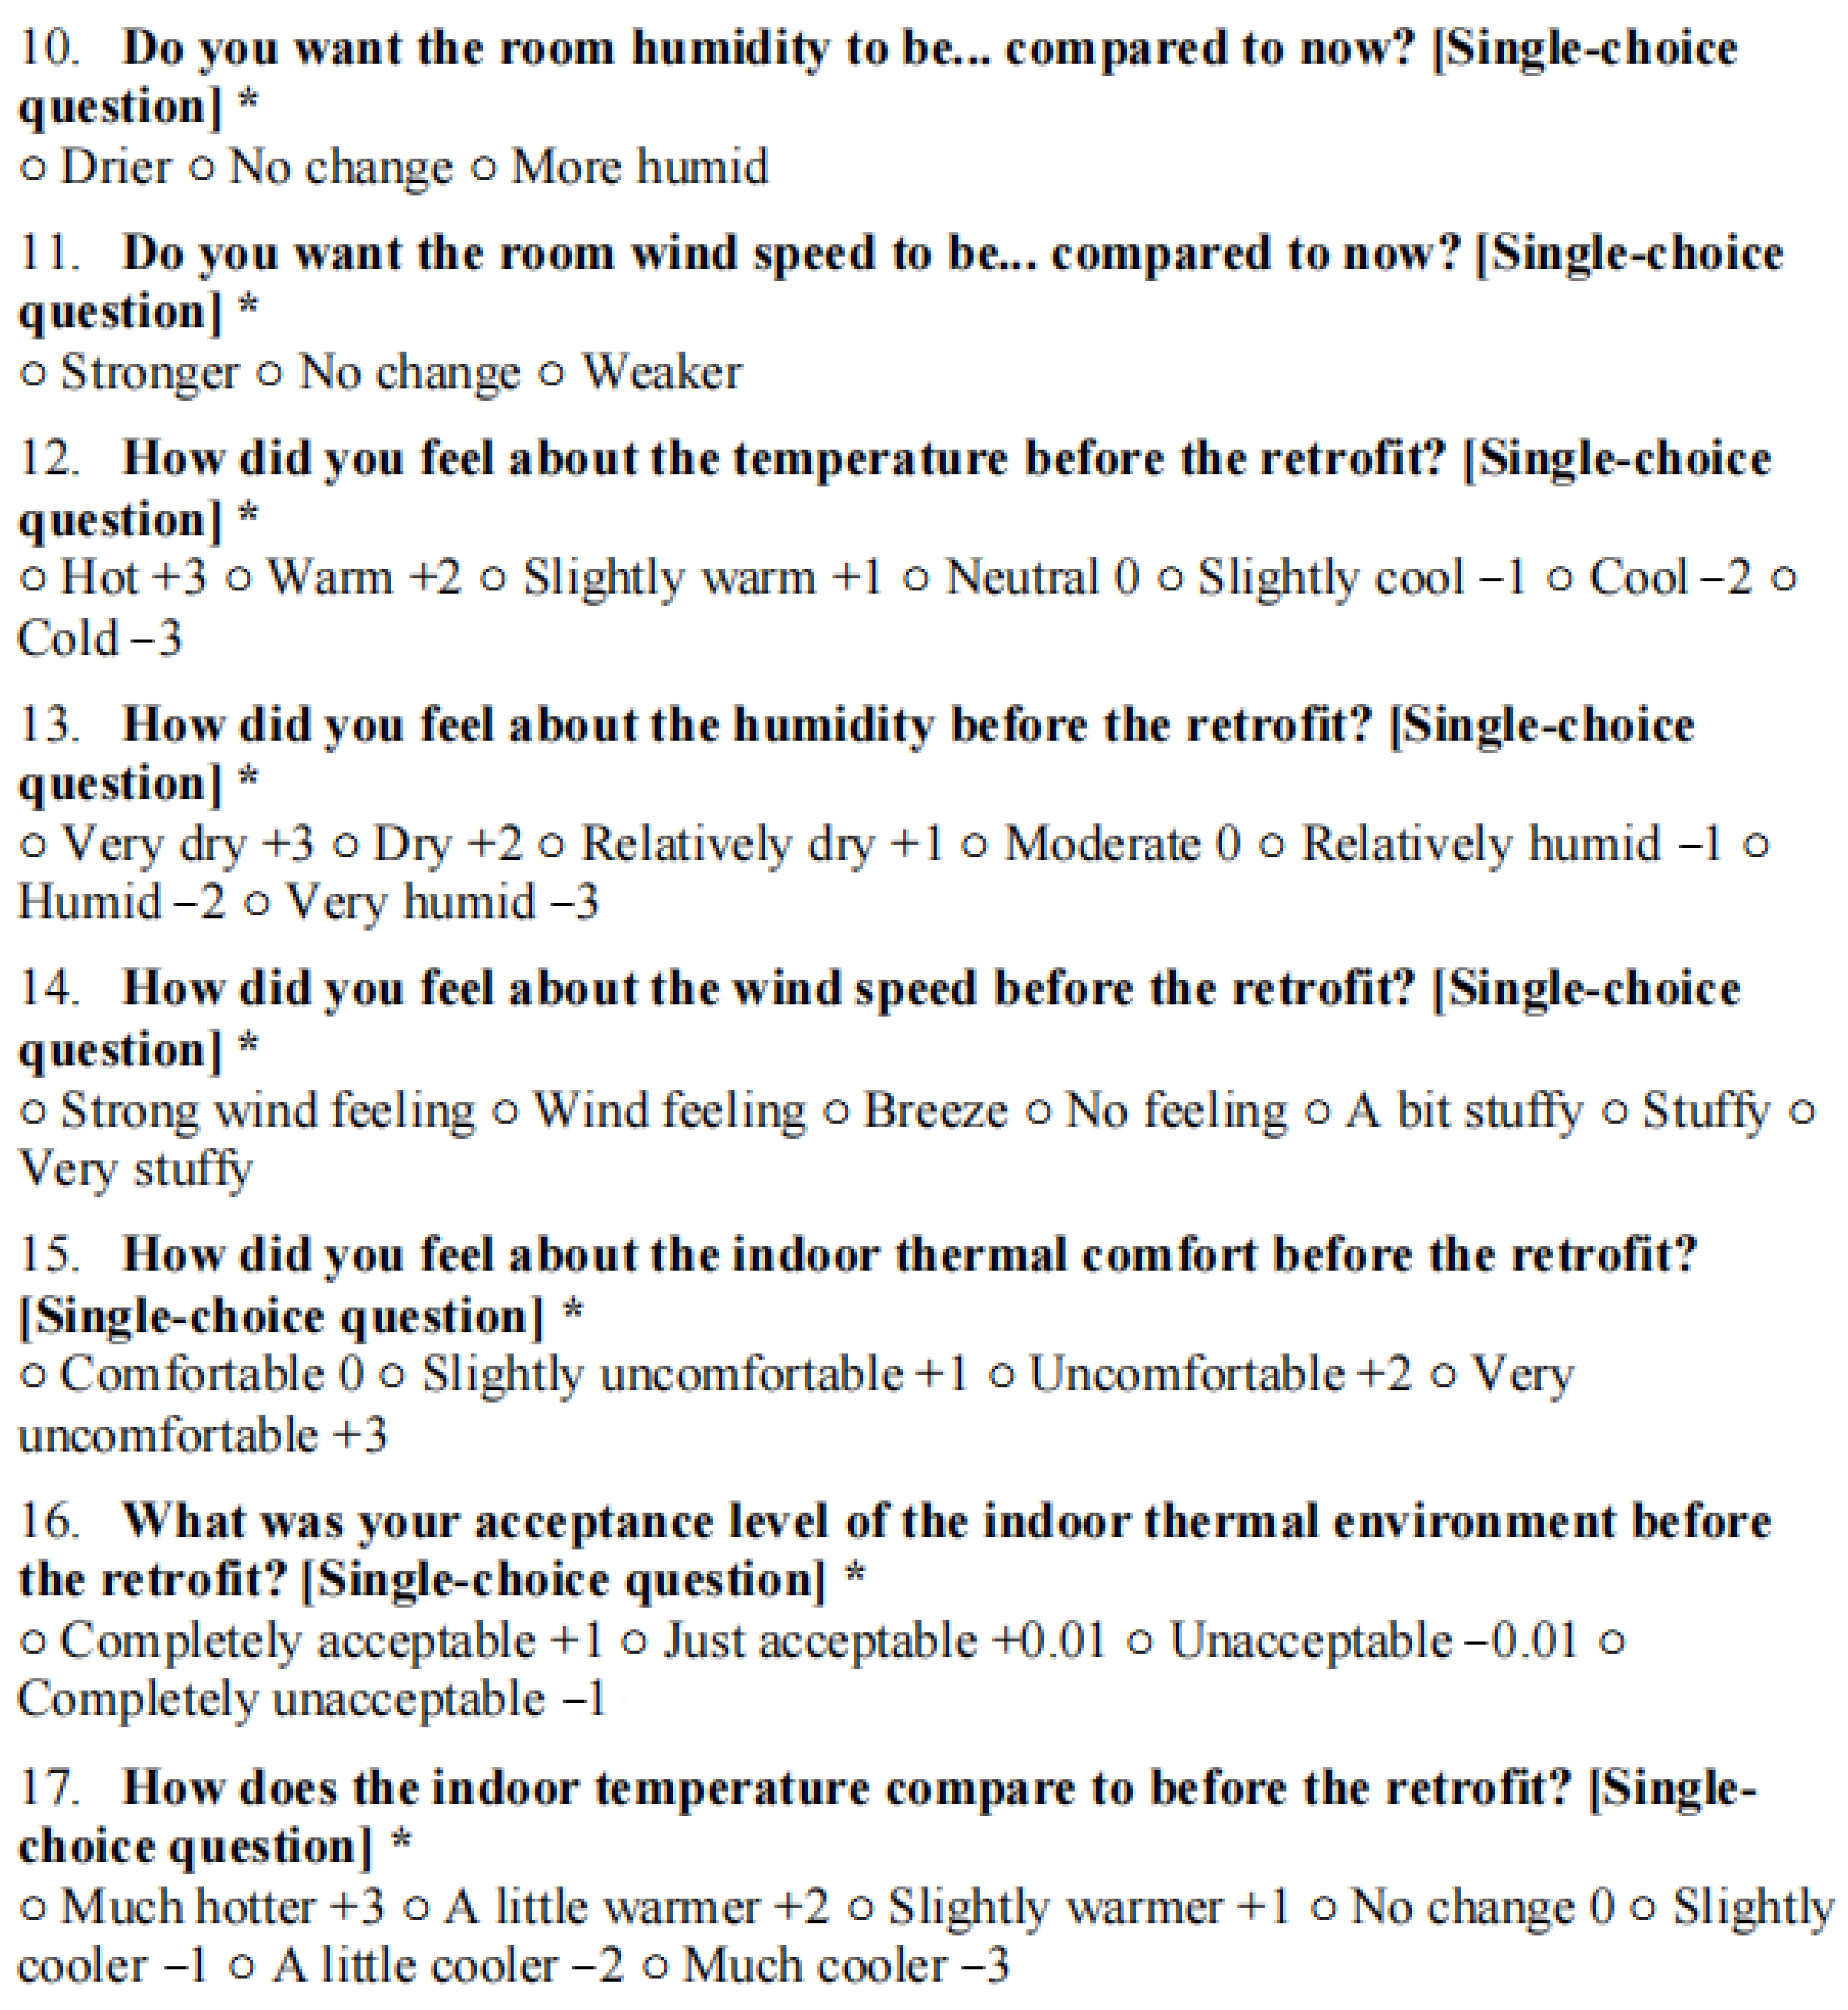
This study employed a field-based methodology combining occupant surveys and building performance simulation to assess thermal comfort following a building retrofit. A comprehensive survey was conducted on 27 August 2024, administering a questionnaire to all 20 occupants—constituting a full census of the studied sections. Data on gender and age were gathered. Key physiological parameters, including clothing insulation (clo) and metabolic rate (met), were collected and estimated for each subject in accordance with the Chinese standard GB/T 50785−2012 [52]. The survey collected subjective votes on TSV, TCV, thermal acceptability, thermal expectation, and a comparison of perceptions before and after the retrofit. The questionnaire adopted the ASHRAE seven-point-scale TSV for thermal sensation evaluation, ranging from +3 (“hot”) to −3 (“cold”). The TCV was rated on a scale from 0 to −3, where lower values indicated great discomfort. Thermal acceptability was rated on a four-point scale: 1 (completely satisfied), 0.01 (fairly satisfied), −0.01 (slightly dissatisfied), and −1 (totally dissatisfied). Thermal expectation indicated the tendency for temperature adjustment, ranging from −3 (“much colder”) to +3 (“much hotter”). The full questionnaire is provided in Appendix A. The subsequent analysis integrated both datasets, using statistical comparisons of mean values and distributions to quantitatively and qualitatively evaluate the retrofit’s impact on the indoor thermal environment.
This subjective data were complemented by an objective analysis using WUFI® Plus software to simulate and calculate the PMV index hourly throughout the cooling season, with a specific focus on working hours to align with occupancy patterns. PMV is determined by 5 parameters: clothing insulation, metabolic, operative temperature, relative humidity, and air velocity. The clothing insulation and metabolic rate are set to the average values obtained from the questionnaire, in accordance with the Chinese standard GB/T50785−2012 [52] and ASHRAE 55 [37] as the input. The air velocity was measured on site and the average value was 0.1 m/s. The operative temperature is based on indoor air temperature and MRT. The MRT is calculated as the mean simulated surface temperature of each component in the target room following ISO 52016−1:2017 [53]. The indoor air temperature and relative humidity are also based on the simulation. The research calculates the average PMV in working hours before and after the retrofit to evaluate long-term changes in the indoor thermal comfort environment.

4. Assessment of Energy-Saving Potential

A simulation of the annual energy demand before and after the application of reflective coatings on the roof and reflective films on the windows is conducted. Then, the energy consumption of cooling is calculated based on Equation (5). The obtained result is shown in Table 10 and Table 11 (“cooling demand” refers to the cooling energy demand required to maintain the set indoor air temperature, while “cooling energy” refers to the electricity consumed by the air-conditioning system). Since Rooms 711, 712, and 713 are unoccupied, theses rooms are not further considered in this section.
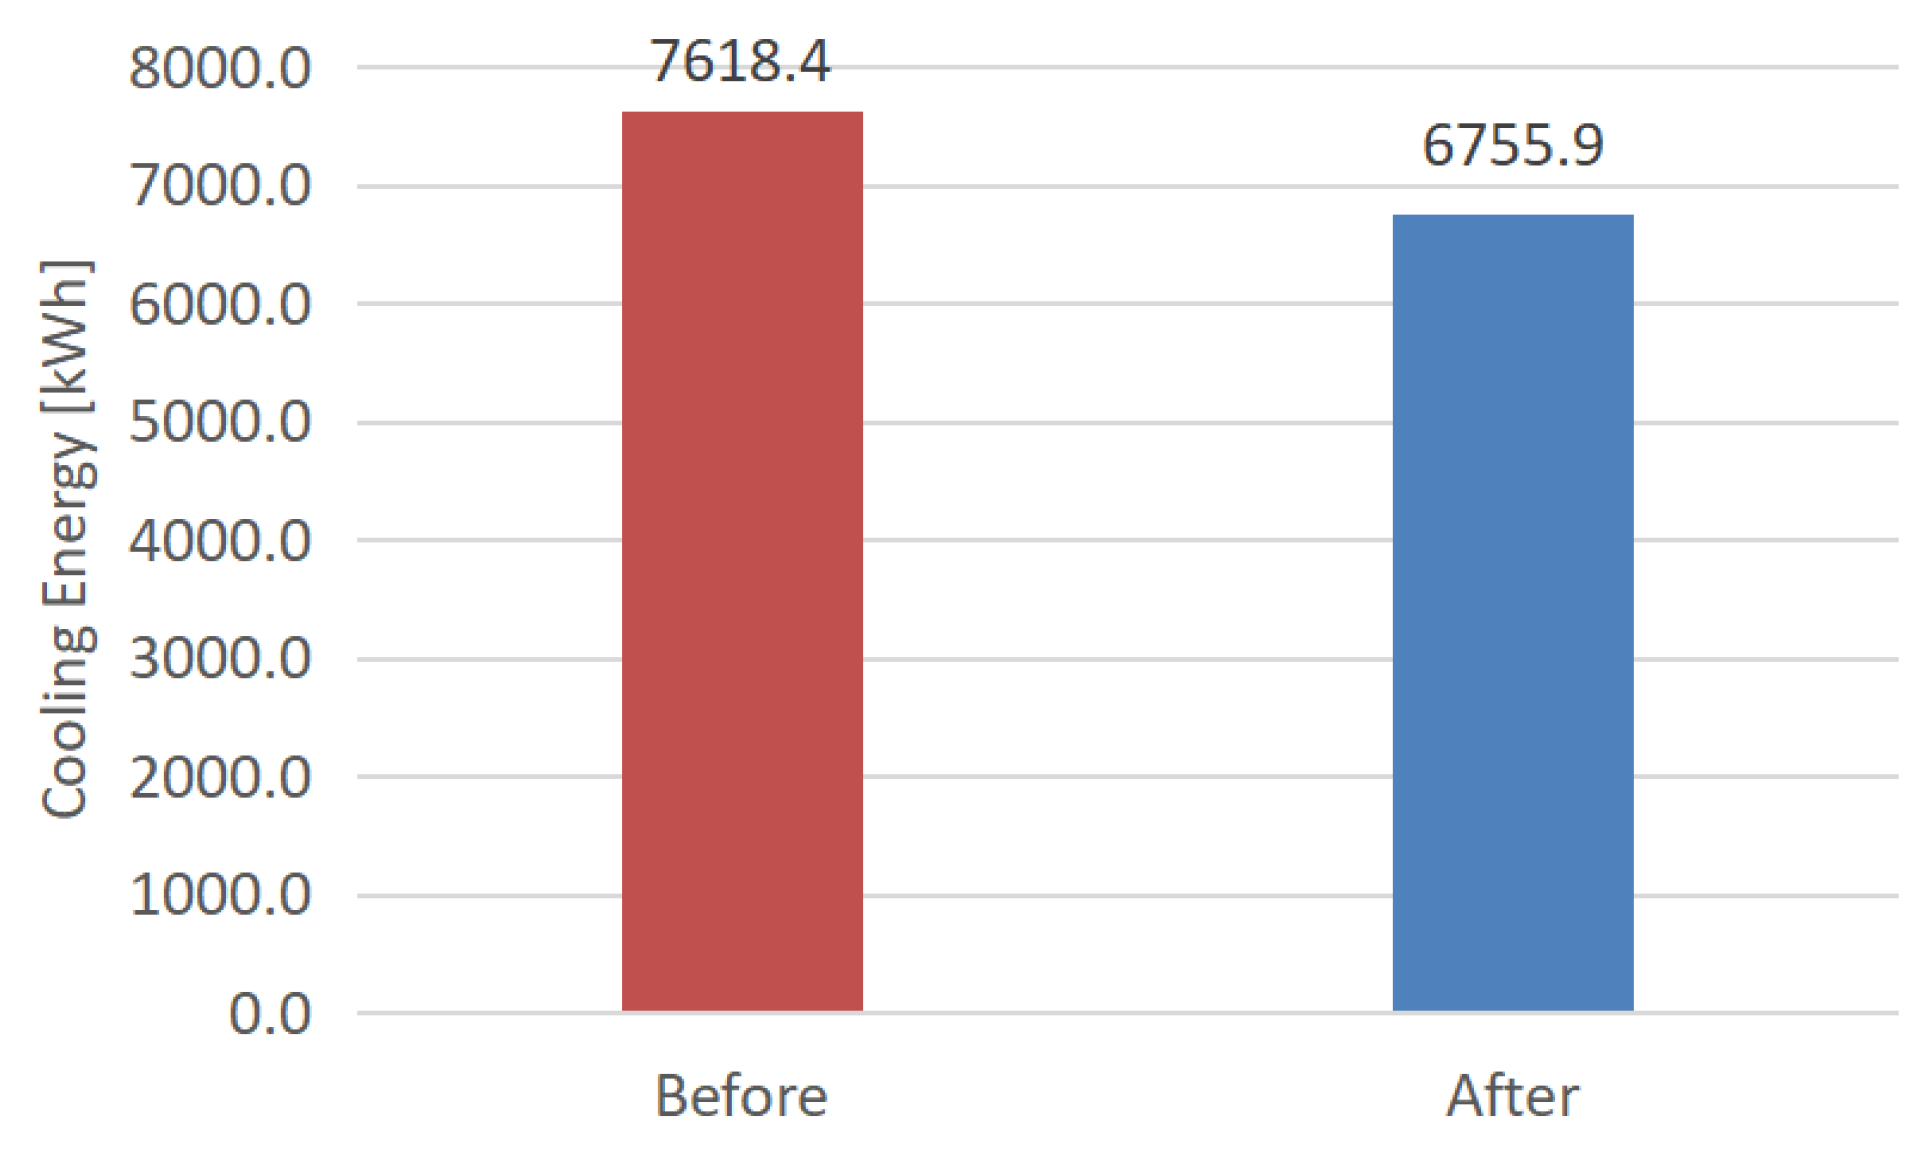
The result demonstrates that the application of reflective materials is an efficient energy-saving measure in the HSCW zone. The simulation shows that the cooling demand is 23,342.6 kWh before the retrofit. The cooling demand decreases by 11.3% to 20,699.7 kWh after the application of the reflective materials. Considering Equation (5), the annual cooling energy consumption is 7618.4 kWh before the retrofit and 6755.9 kWh after the retrofit (Figure 9). Thus, the annual cooling energy consumption per m2 decreases from 12.8 kWh/m2 to 11.4 kWh/m2 after the retrofit.

5. Thermal Comfort Evaluation

The questionnaire was conducted on 27 August 2024, surveying all 20 occupants on the investigated floors. While this represents a limited sample size, it constitutes the full occupant population of the studied sections—a scale representative of retrofitted office buildings in this typology.
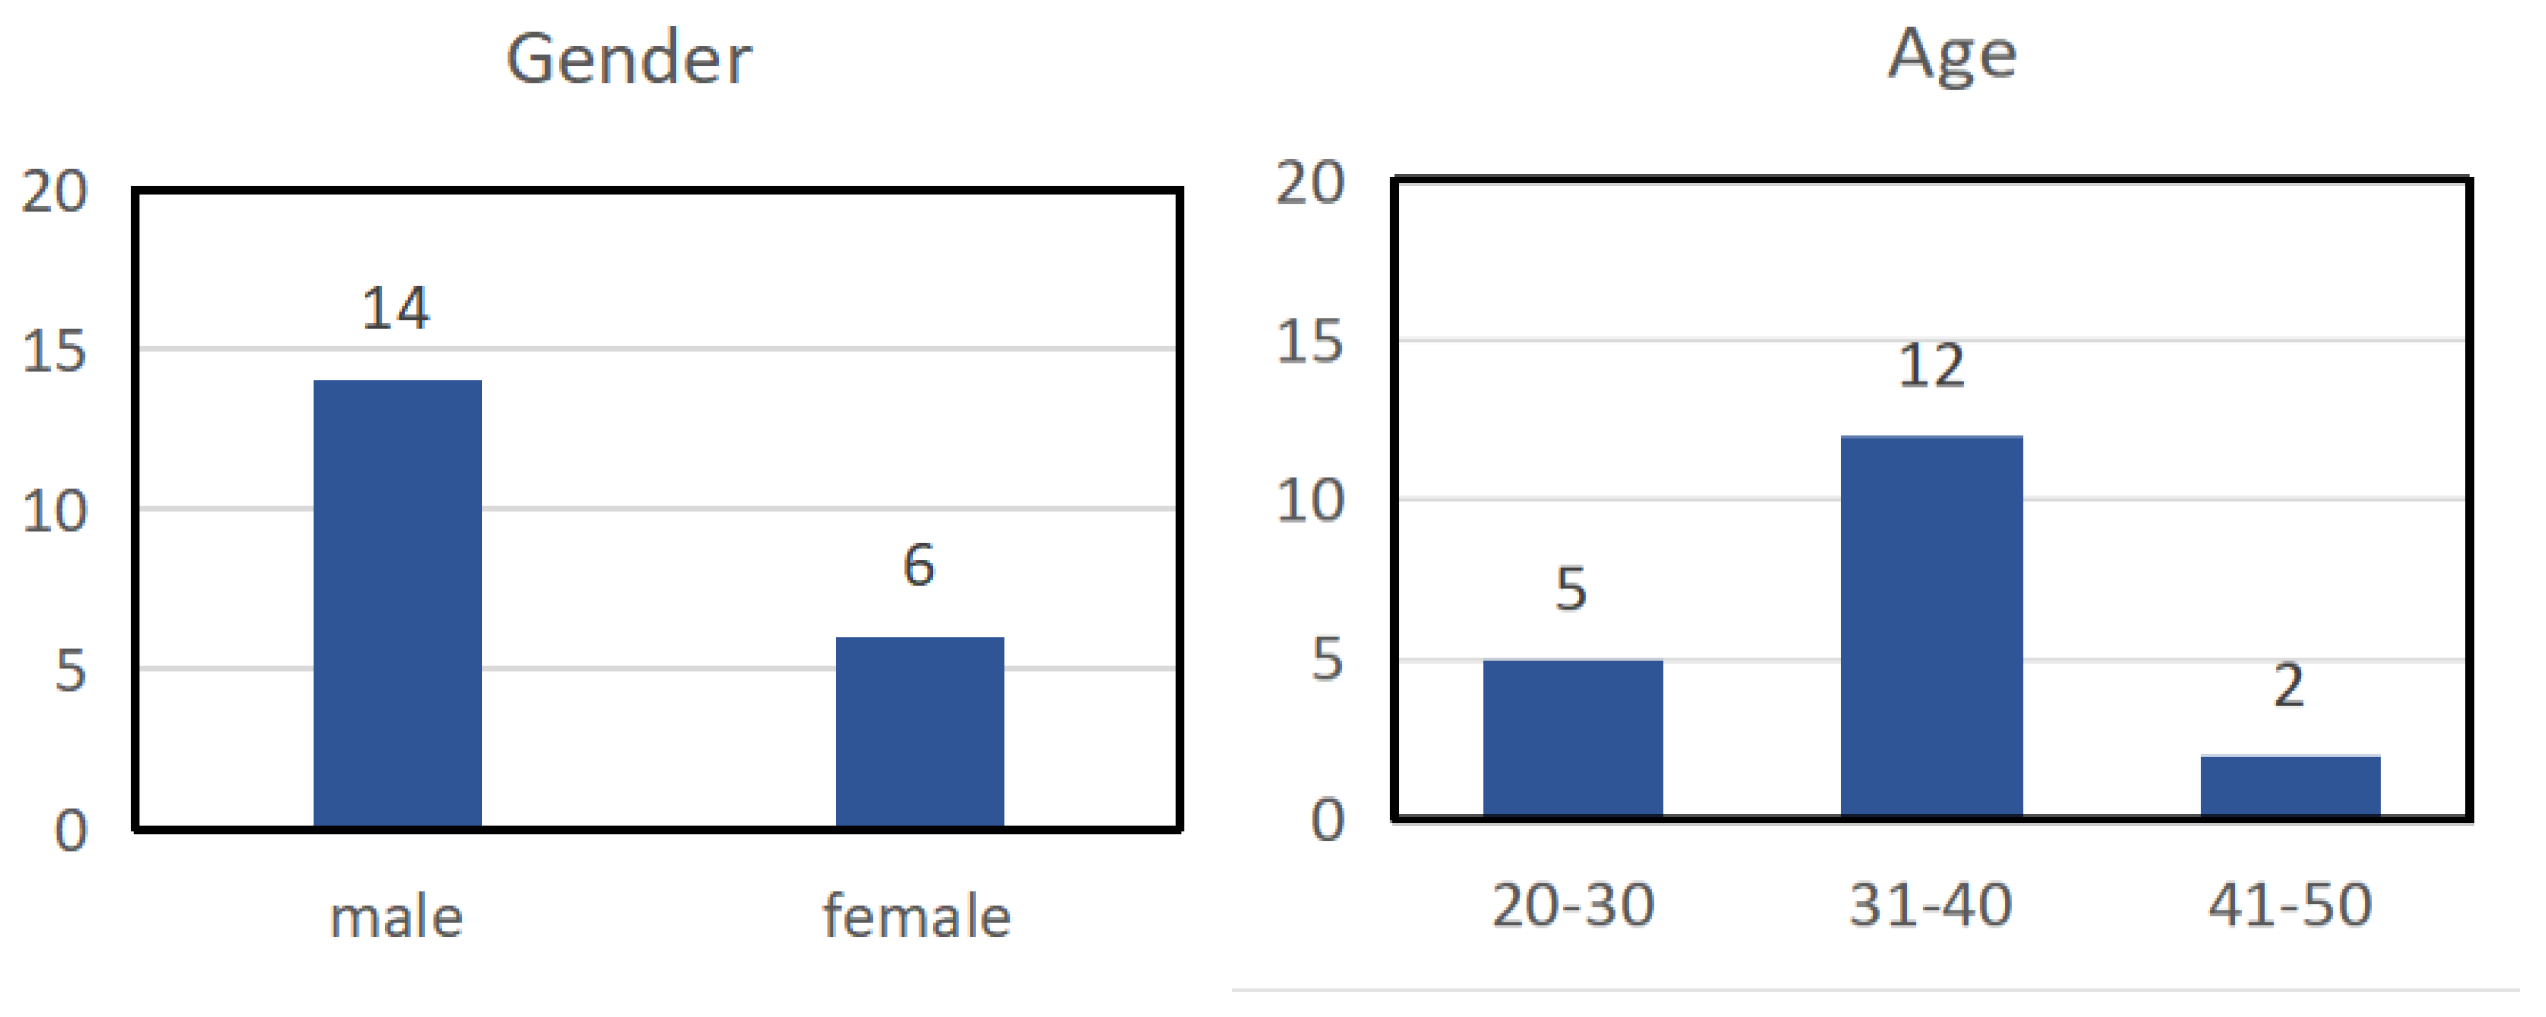
The gender and age distributions are shown in Figure 10. The investigated area has more male employees, who constitute 70% of the total number. Most employees are between 31 and 40 years old.
The metabolic rates of subjects and thermal resistance of their clothing are shown in Table 12, estimated based on the Chinese standard GB/T50785−2012 [52].
According to the questionnaire, the occupants have one or two layers of light clothing. Most of the male subjects are wearing short-sleeved shirts with trousers, of which the typical thermal resistance is 0.46 clo. Most of the female subjects wear T-shirts and trousers, of which the typical thermal resistance is 0.41 clo.
Regarding the activity of subjects, most of the subjects perform office work while sitting, corresponding to a metabolic rate of 1.2 met according to ASHRAE 55 [51].
The results indicate that the differences in clothing were statistically significant (p = 0.021), while the metabolic rate (p = 0.129) was not. It can be explained that the males tend to wear thicker clothing like formal shirts, while the females can wear a dress with lower insulation. The metabolic rate is not different by gender, suggesting that the work assignment is generally the same.
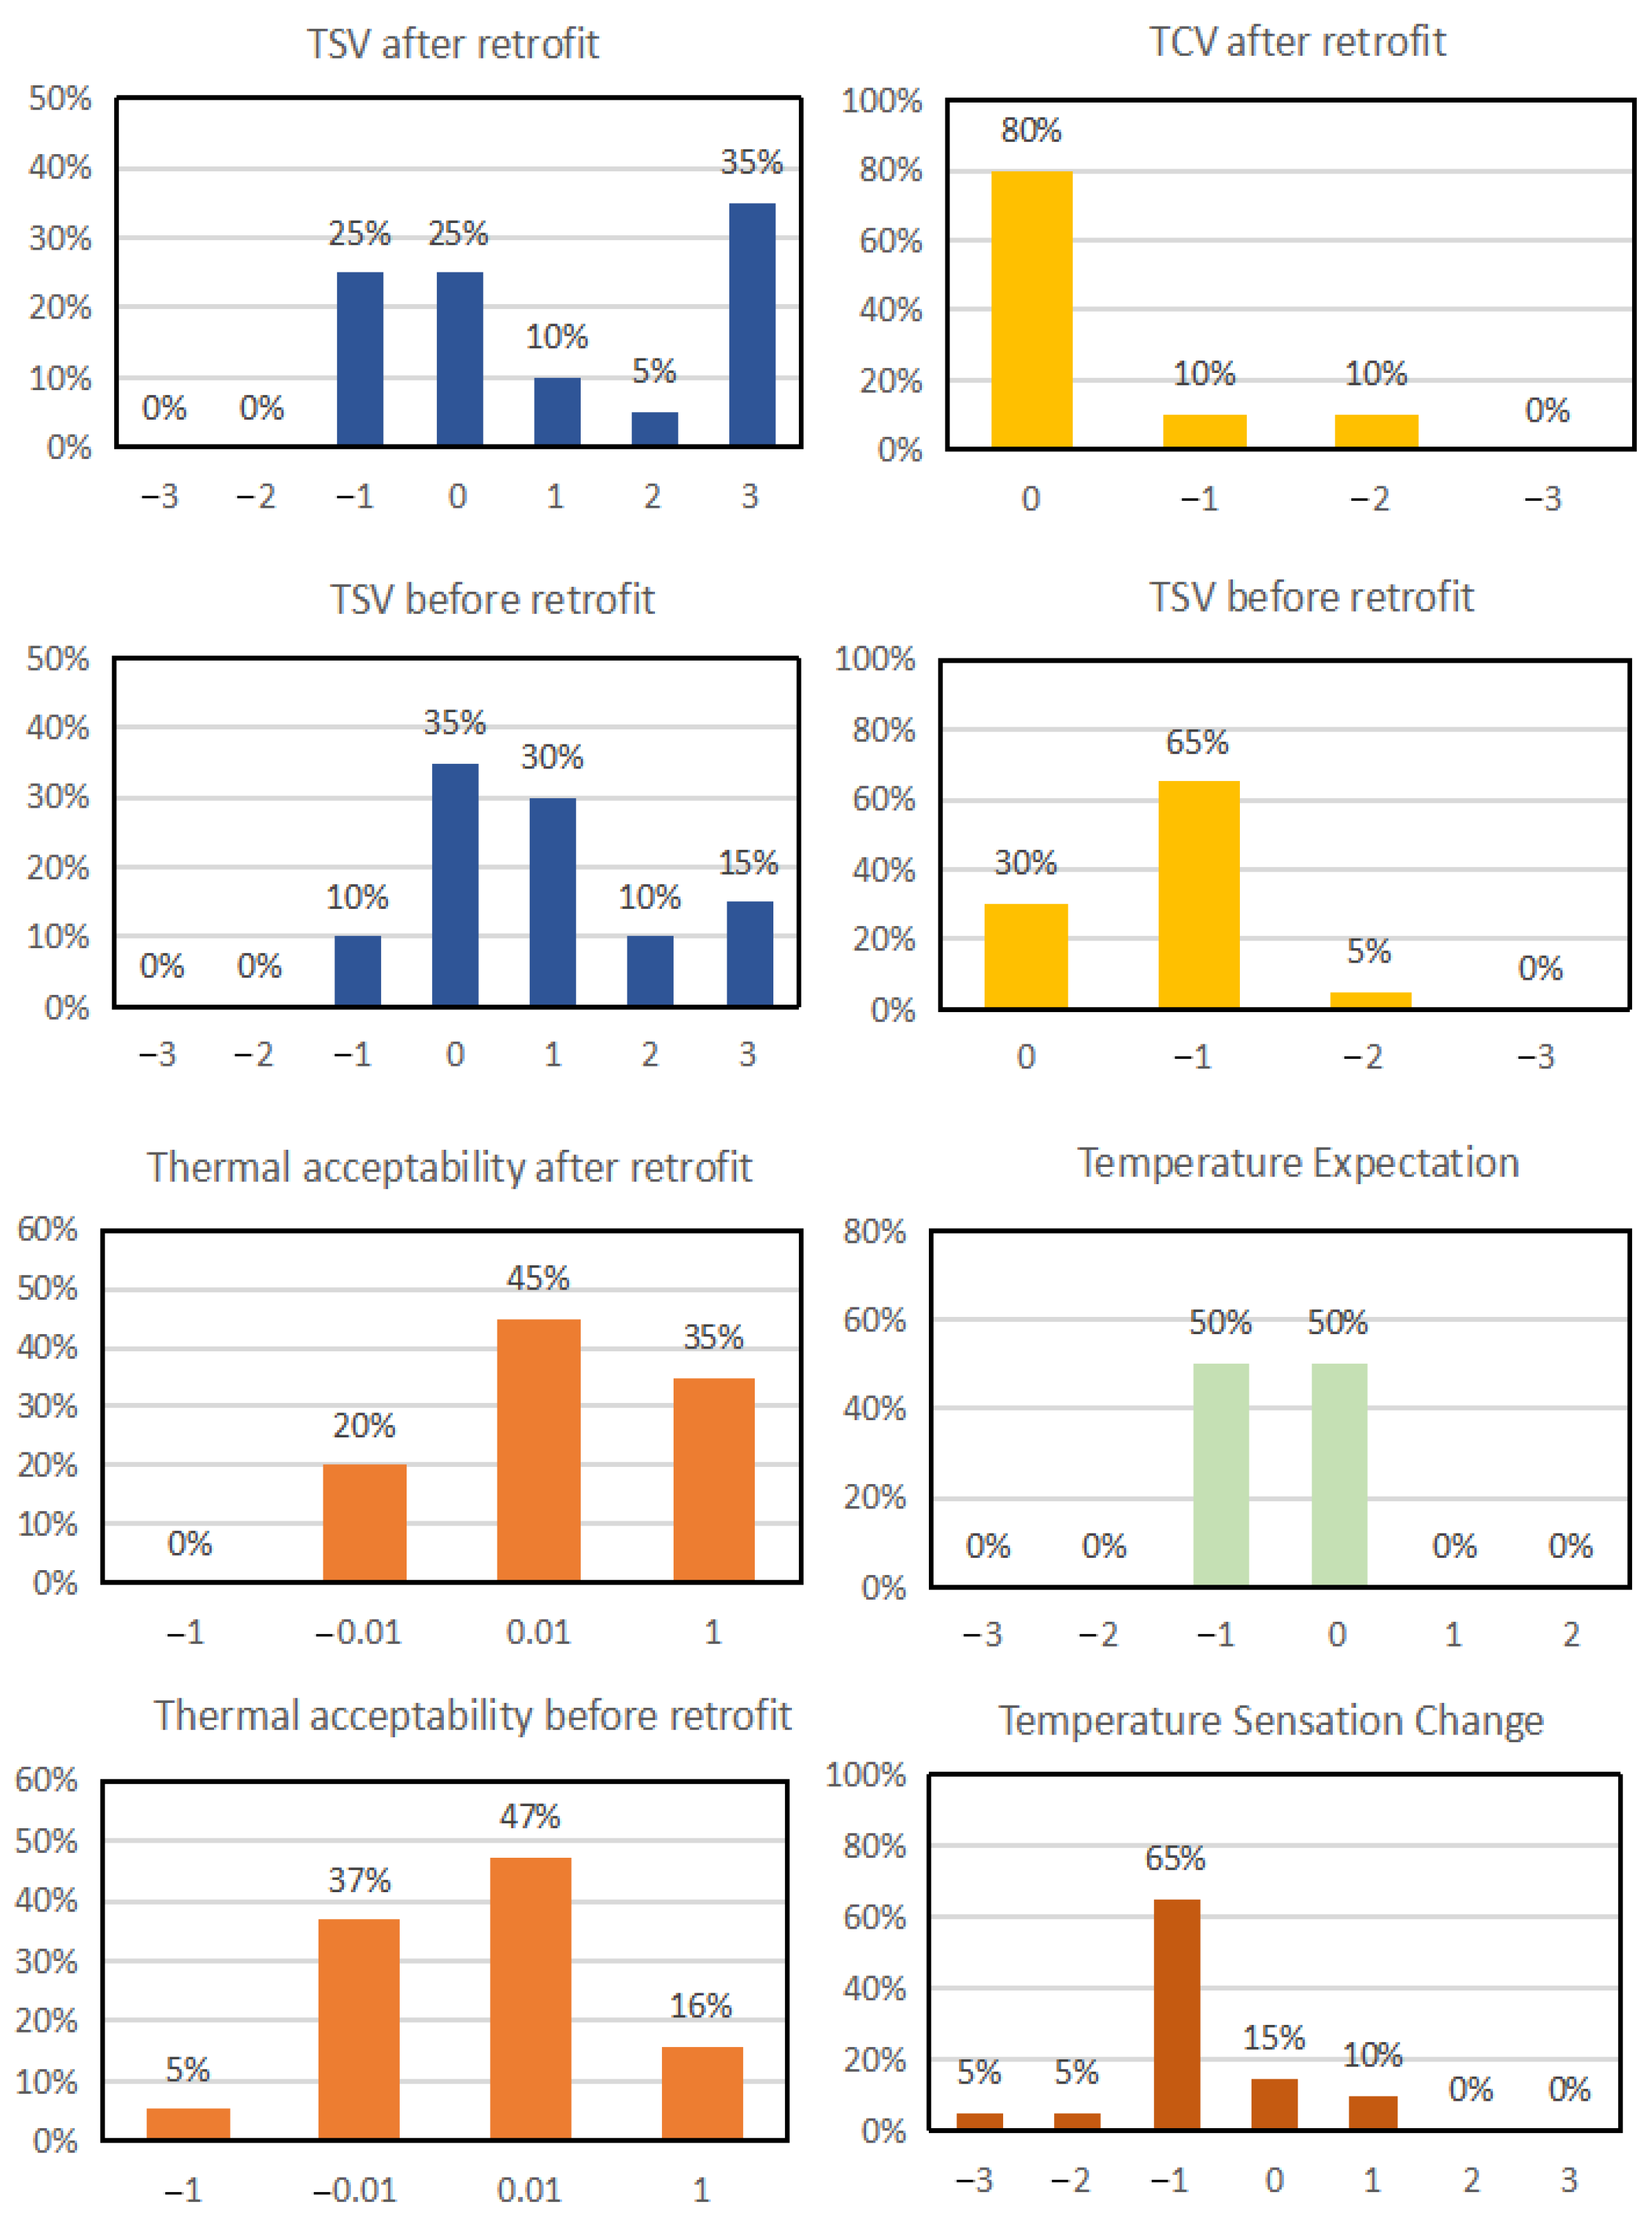
The survey results indicate high occupant adaptation to the thermal environment in the investigated zones (Figure 11). Although 40% of respondents reported feeling hot, the mean TSV of 1.0 reflects a slightly warm perception. Crucially, 80% of occupants rated the environment as both acceptable and comfortable. Supporting this, the average TCV reached −0.3 and thermal acceptability scored 0.35, demonstrating satisfaction with summer conditions post-retrofit. The mean thermal expectation of −0.5 further confirms occupant preference for slightly cooler conditions—consistent with the ‘slightly warm’ TSV assessment. Collectively, these metrics confirm that the retrofitted building delivers a comfortable thermal environment.
The survey also captured occupants’ subjective thermal comfort relative to pre-retrofit conditions (Figure 11). The mean TSV pre-retrofit measured 0.85—slightly lower than the post-retrofit value (1.00). However, the significantly lower mean TCV of −0.75 (versus post-retrofit −0.3) and thermal acceptability of 0.10 (versus post-retrofit 0.35) indicate reduced comfort prior to intervention. Crucially, 80% of subjects reported cooler conditions post-retrofit, confirming improved thermal comfort.
Regarding cooling behaviors, occupants primarily used air conditioners, sometimes supplemented with fans. Notably, open windows during air conditioner operation in Rooms 707–708 on high-temperature days were observed. This preference for concurrent natural ventilation likely increases actual cooling energy consumption—a factor not fully captured in our simulations.
The hourly PMV is calculated by WUFI®Plus to give an overview of the thermal comfort conditions in the cooling season (Figure 12 and Table 13). This study focuses on the PMV during working hours for the analysis.
The post-retrofit PMV values predominantly ranged between 0.5 and 1.0, consistent with the questionnaire results indicating a slightly warm environment. Notably, PMV exceeded the ASHRAE Standard 55 comfort range (−0.5 to +0.5) during most operational hours, demonstrating potential occupant adaptation to elevated temperatures.
The retrofit improved thermal conditions: the mean PMV decreased from 0.82 to 0.74—a 10.0% shift toward thermal neutrality. This result shows the reflective materials’ potential in optimizing indoor thermal environments.
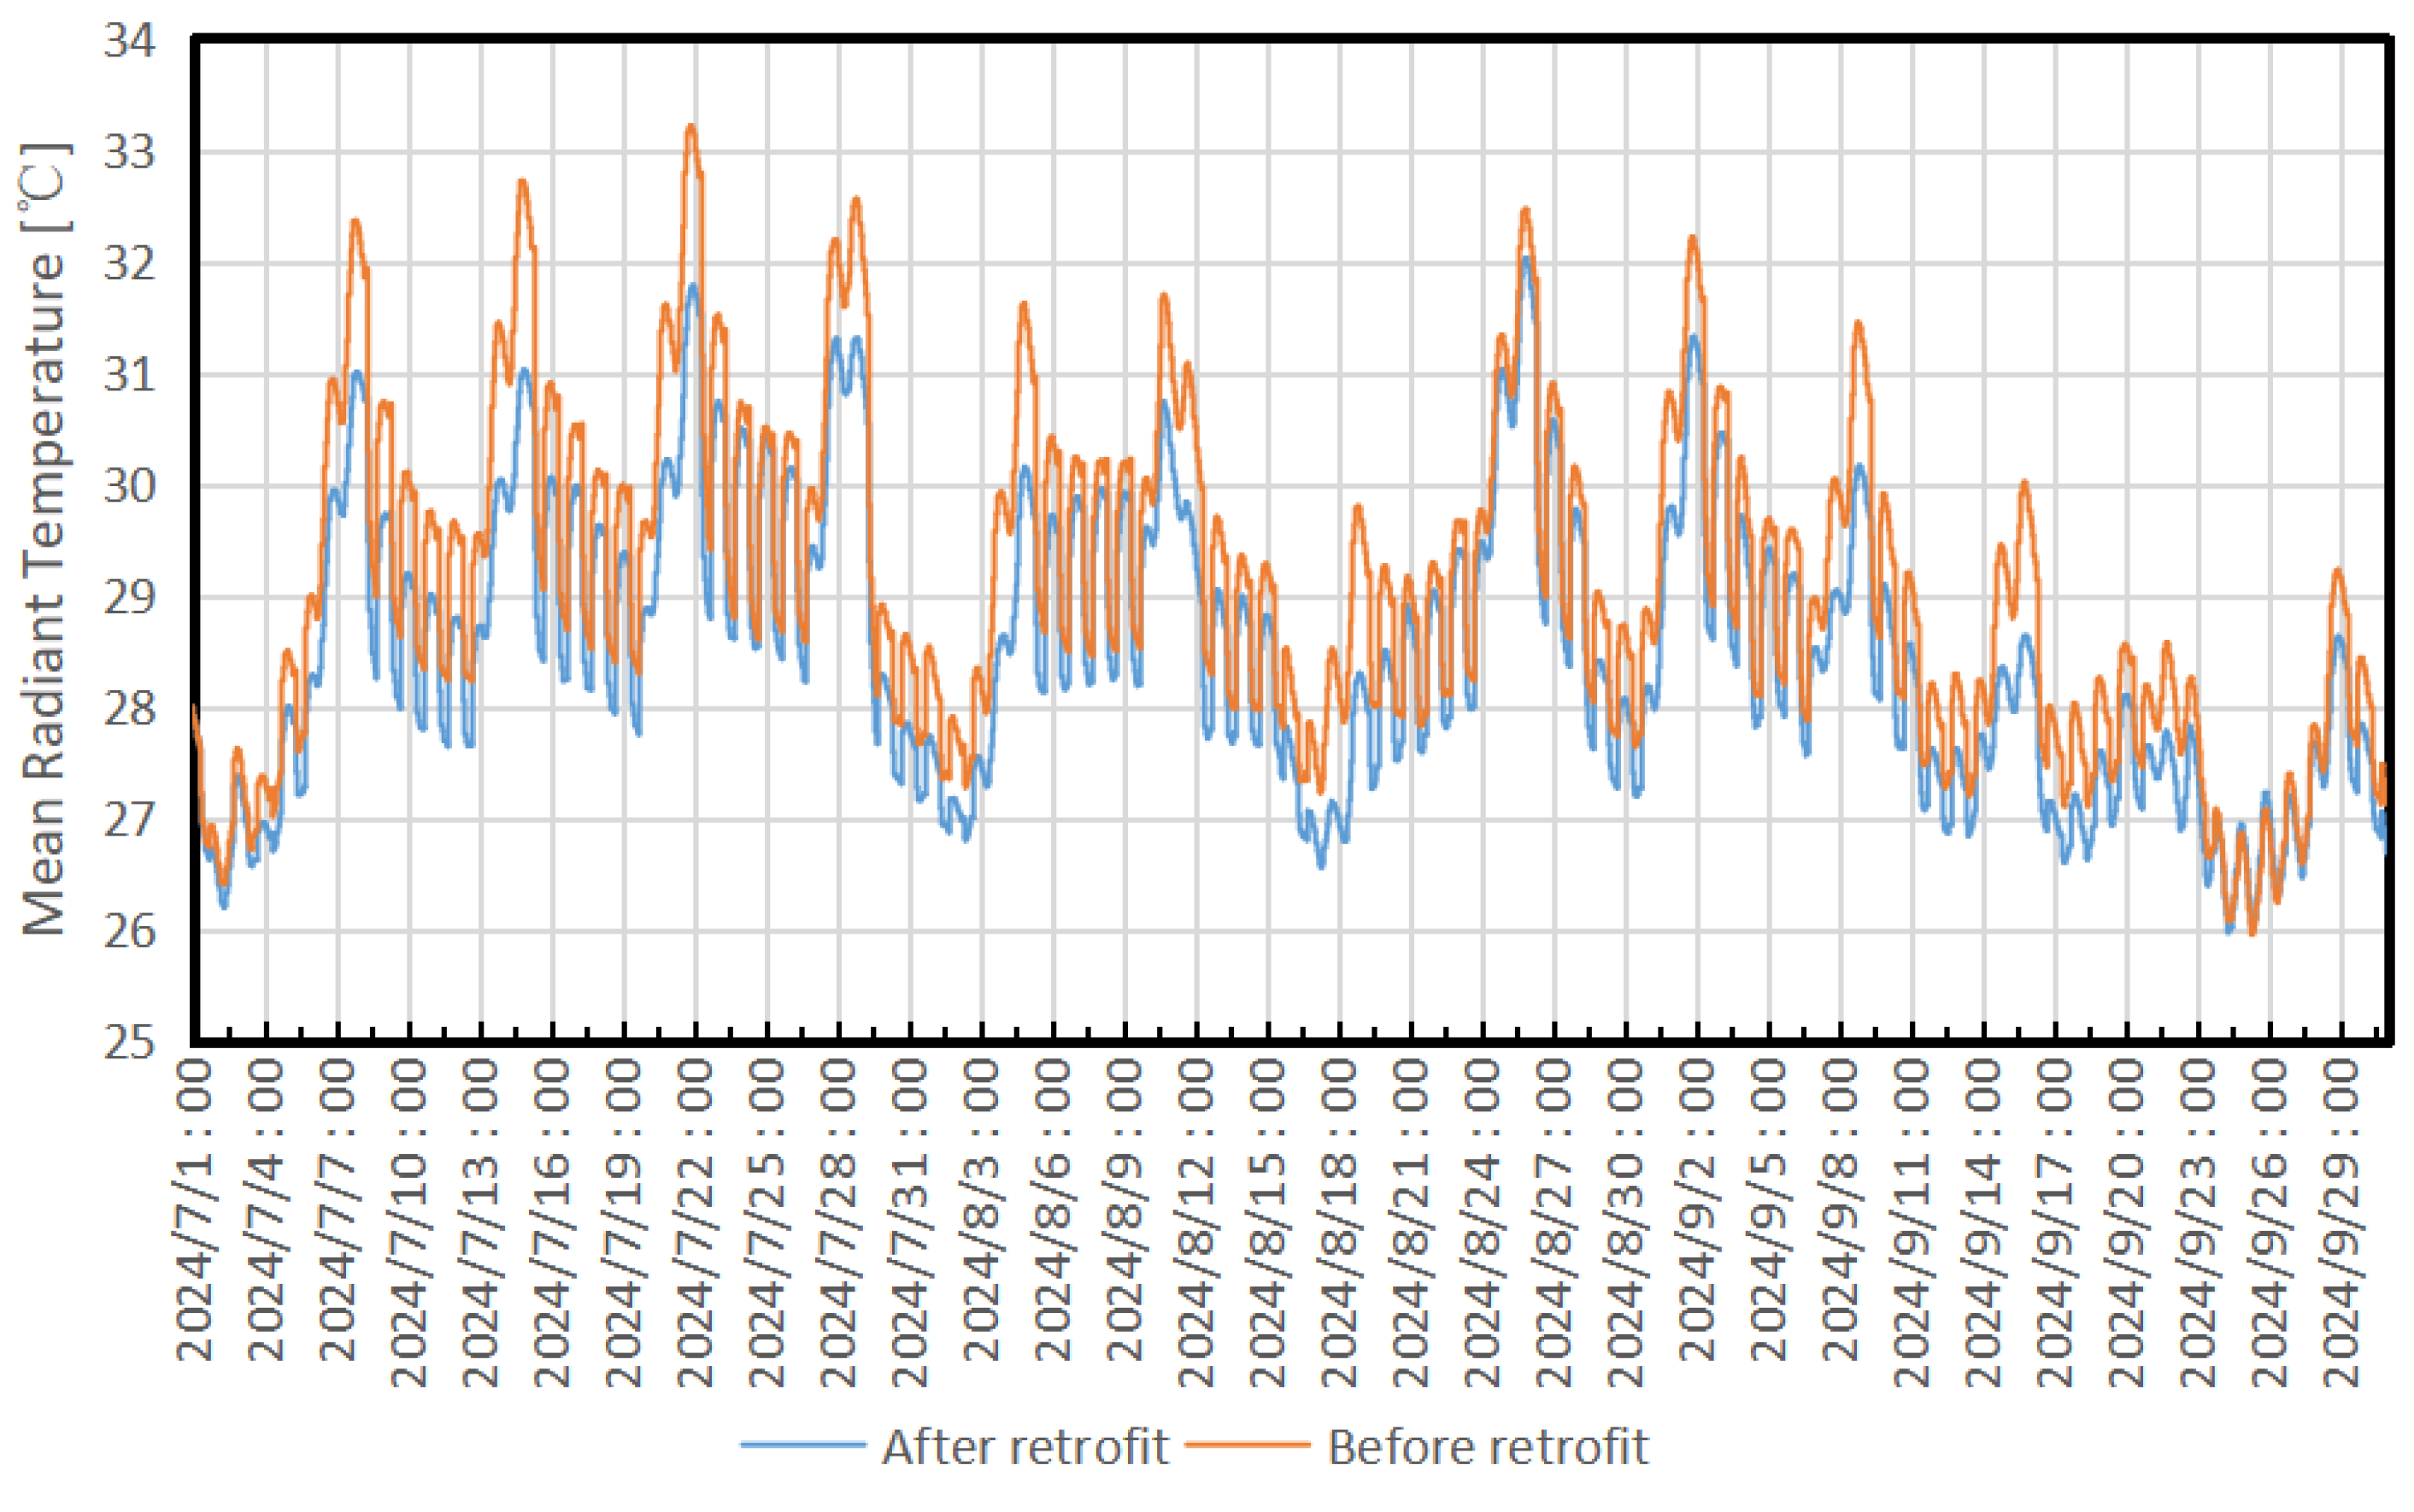
The decrease in MRT from 29.14 °C to 28.53 °C (a drop of 0.60 °C) has a direct impact on the PMV index (Figure 13). MRT quantifies the radiant heat exchange between the human body and the surrounding surfaces. A decrease in MRT means the body loses more heat to the environment via radiation, thereby increasing the sensation of coolness. In the PMV calculation formula, this is directly reflected as a decrease in the PMV value.

6. Discussion

This research conducts an hourly simulation throughout the cooling season based on a three-month-long monitoring process to provide an accurate evaluation of the cooling consumption decrease due to the application of reflective materials. The simulation is calibrated with the chosen statistical indicators NMBE, CV(RMSE), and R2 which meet the defined limit values. However, several factors could still influence the simulation’s accuracy, which require further attention and improvement.
First, the actual as-built drawings for the building components are not available. For this reason, the construction of building components is based on the standard design specifications. Also, the material parameters of the building envelope are mainly primarily sourced from the WUFI®Plus material database and values specified in relevant regulations, which may deviate from the actual values due to the aging of materials, the inadequate construction quality, and structural defects such as cracks.
Second, the calculation of natural ventilation rates is simplified according to code JGJ 67 [49], which regulates the basic fresh air supply for each person in office buildings. However, the actual natural ventilation rate is influenced by the frequency of opening windows and the dynamic wind pressure, which requires further monitoring of the actual occupants’ behaviors for window opening.
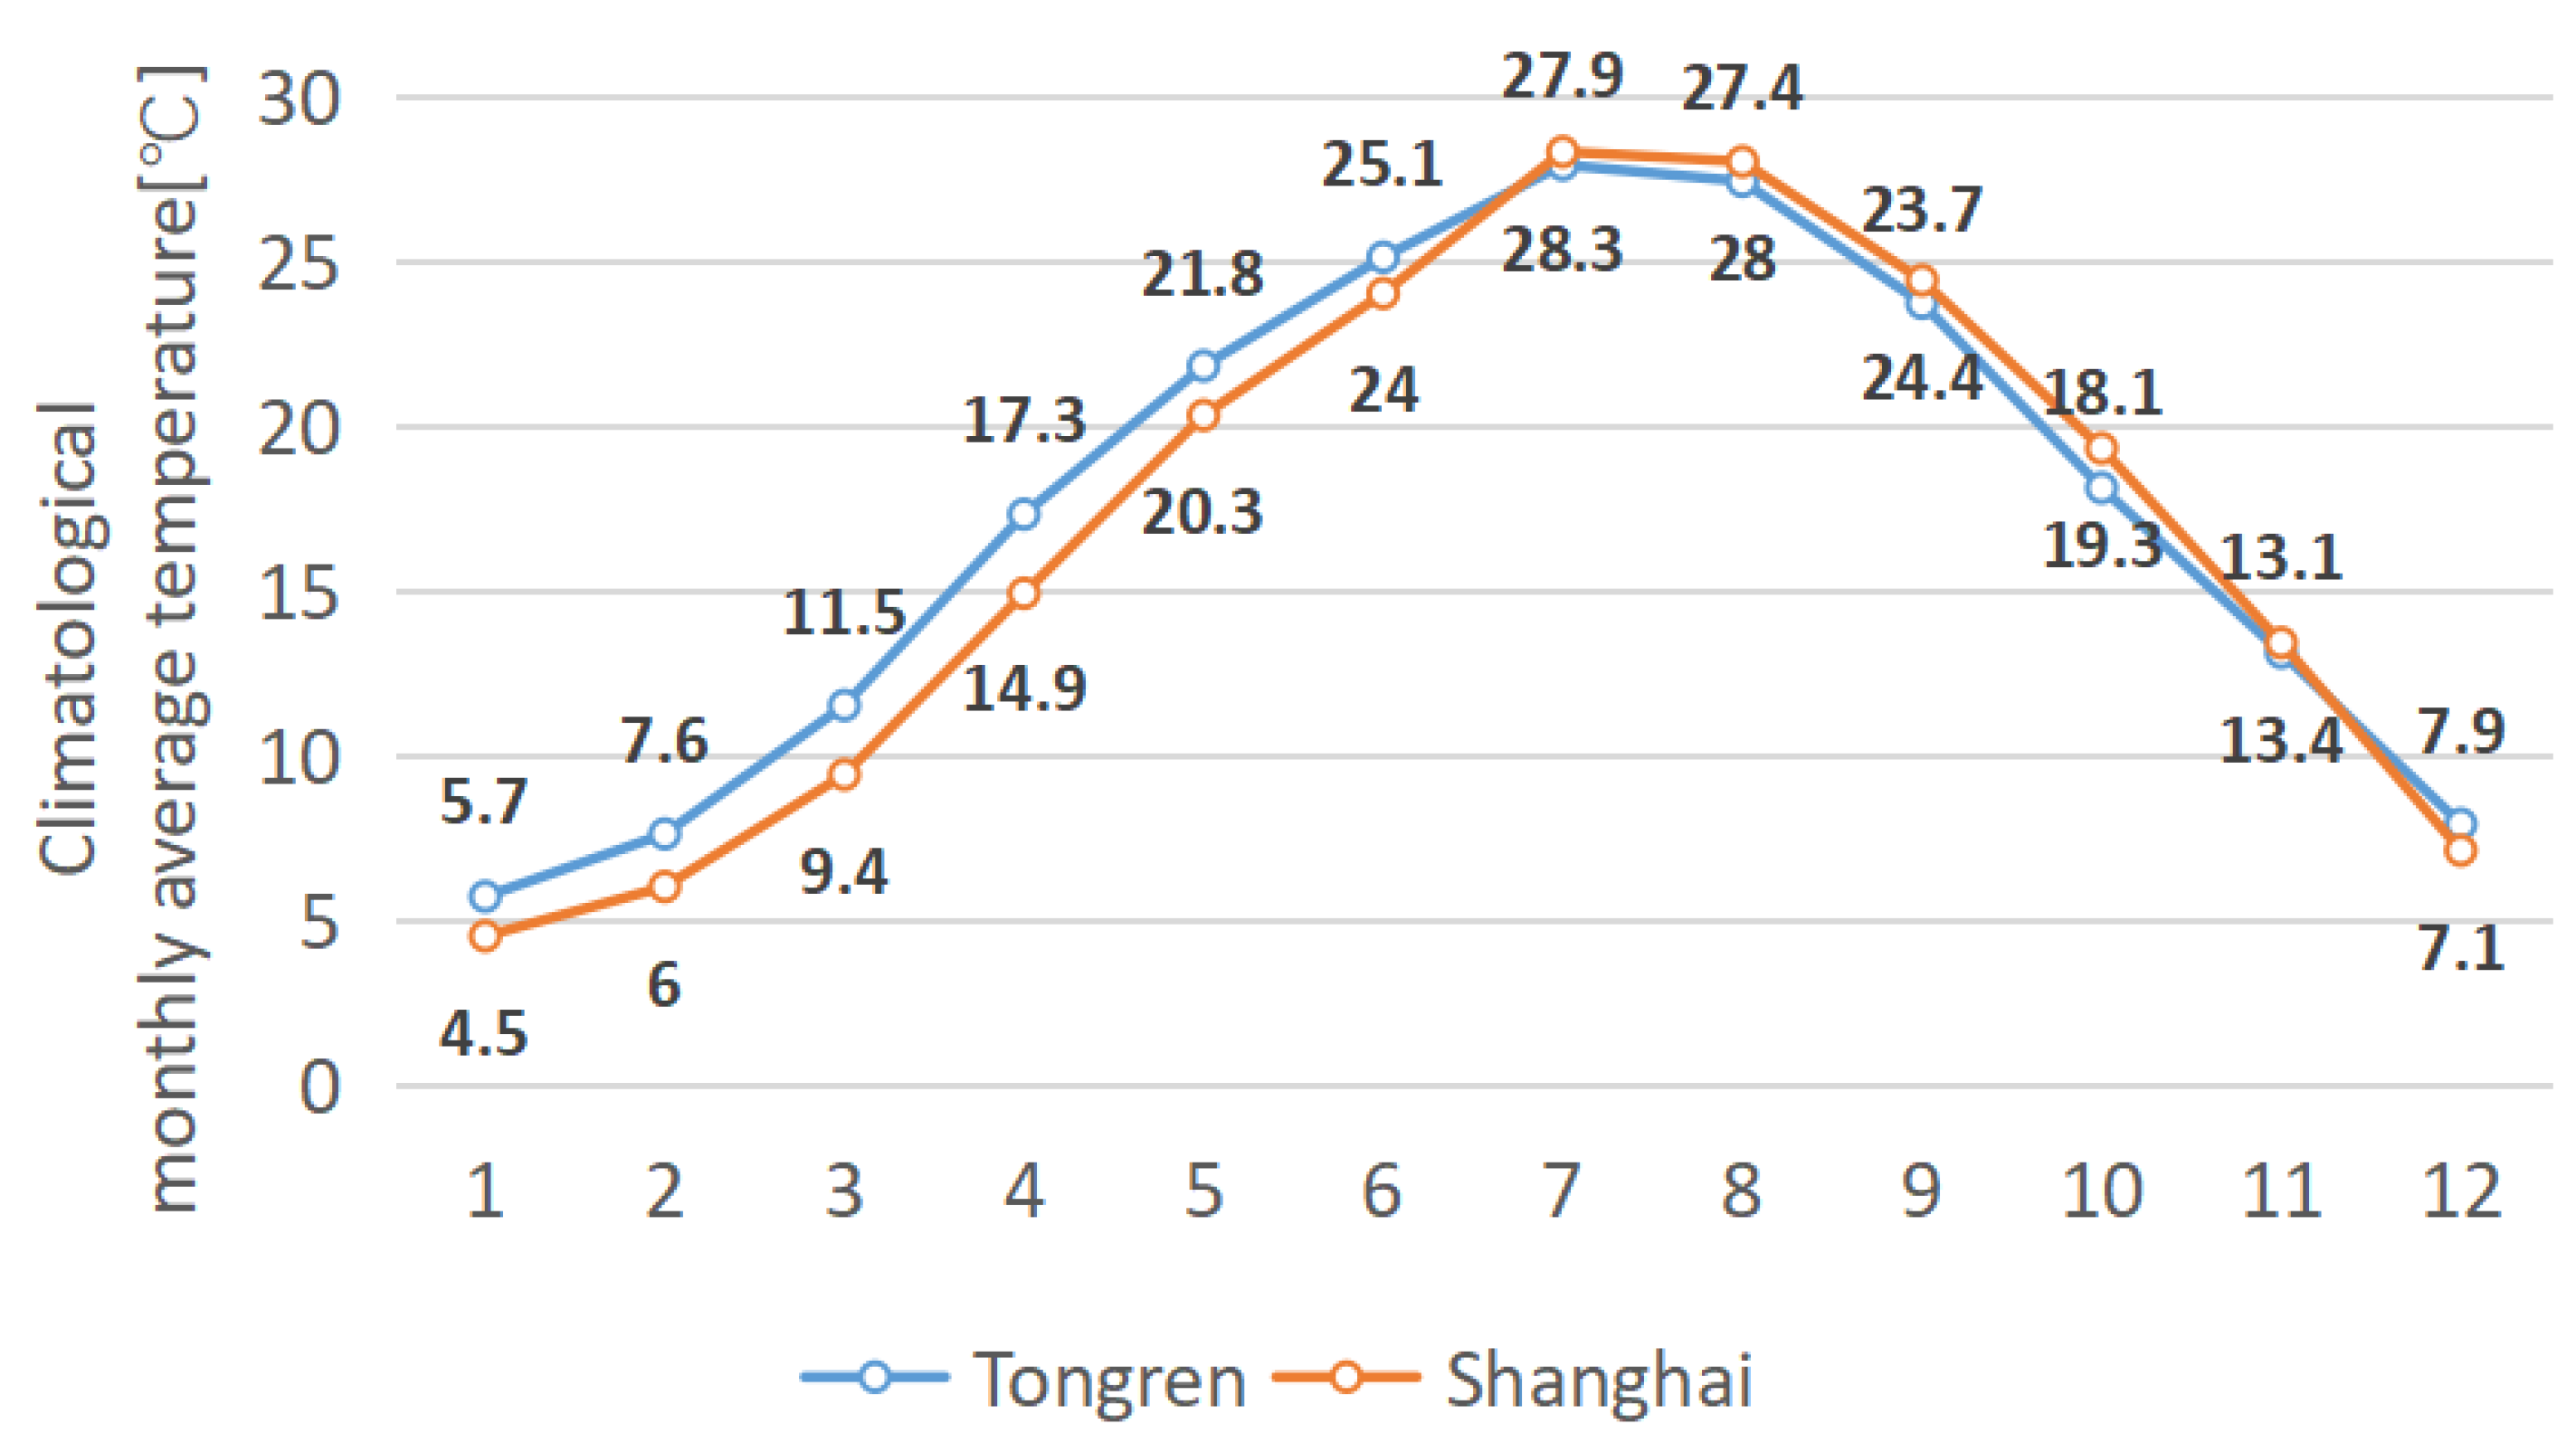
Regarding the monitoring period, this research mainly focuses on the building performance during the cooling season. The indoor air temperature and relative humidity are collected from July to September of 2024 and thermal sensation questionnaires in summer. In the HSCW zone, heating energy consumption is also a critical part of annual energy consumption. The evaluation of excessive heat loss in winter and its influence on thermal sensation still needs further investigation in follow-up studies. To estimate the influence of reflective materials on heating energy demand, findings from several studies in the HSCW zone are reviewed. In Chen and Lu’s research [54], a prototype room with a similar size, building envelope quality, ventilation condition, air conditioning and inner loads experienced a 1.2 kWh/m2 increase in heating energy demand in Shanghai, where the energy consumption in the cooling and heating seasons is nearly equal. However, the cooling energy savings (8.2 kWh/m2) significantly surpass the penalty (1.2 kWh/m2), leading to an annual energy saving of 4.1% in total. Considering the higher climatological monthly average temperatures in Tongren (sourced from the China Meteorological Administration database), it is reasonable to estimate a lower heating penalty in Tongren (Figure 14).
Moreover, in this study, the natural ventilation rate was set as 30 m3/h·person in accordance with the Civil Building Ventilation Design Code [49]. This approach was chosen because conducting field measurements of window opening during air conditioner AC operation would require long-term and multi-room monitoring campaigns, which faces challenges including limited facilities and the consideration of occupants’ privacy. Therefore, the use of the code-based value serves as a practical approximation in the absence of large-scale empirical data.
Nevertheless, this simplification may not fully reflect real occupant behavior, resulting in a code-based value that is relatively high compared to actual conditions. This setting assumes that the supply of fresh air depends entirely on window opening and ignores occupant adaptation to indoor air quality. Consequently, the simulations reflect the building’s performance under disadvantageous operating conditions. To more accurately evaluate the energy-saving performance of the retrofit, future work should investigate infiltration and monitor window opening behaviors.
In addition, while the occupant thermal comfort survey offers valuable insights into subjective perceptions within the studied zone, the interpretation of its findings necessitates caution due to the limited sample size (n = 20). Although designed to be representative, this constrained scale inherently limits the statistical power to extrapolate findings with high confidence to a broader population or to robustly characterize sub-group variations.
Furthermore, although the comparison between PMV and TSV indicated a degree of alignment, the PMV was observed to consistently fall outside the ASHRAE Standard 55 optimal range during the monitored period. This observed bias necessitates further investigation into potential local adaptations. The phenomenon of local adaptation has been widely studied by researchers, including Xu et al. in Nanjing [38] and Ben et al. in Guangzhou [55]. However, due to the small sample size in this study, it is difficult to derive robust statistical evidence to validate specific adaptive behaviors in this population. This limitation must be addressed in subsequent studies by expanding the sample size.
It is worth noting that recent studies have increasingly highlighted the importance of the in situ monitoring of parameters related to the PMV in retrofitted buildings [39,56] in order to ensure accurate thermal comfort evaluations in real building environments. Although the experimental phase in this study faced instrumentation limitations that prevented the continuous monitoring of operative temperature, this gap was addressed by complementing measurements with numerical simulations. Nevertheless, the literature indicates that the direct measurement of operative temperature is crucial as it provides a more representative indicator of occupants’ thermal experience than air temperature alone. Therefore, it is recommended that future field studies incorporate the comprehensive monitoring of operative temperature and related PMV parameters at the position near the occupant. This would not only enhance the reliability of comfort assessments but also align with international standards for evaluating thermal environments in energy-efficient buildings.
Concerning the discrepancies between the simulated and measured temperatures, the discrepancies primarily suggest that the current model may underestimate heat loss in certain localized areas of the building assembly caused by the following potential factors:
  • Potential undercooling of building components due to strict cooling setpoint: In the simulation, the indoor air temperature is precisely cooled to and maintained at 26 °C. This differs significantly from actual conditions, where AC systems often operate intermittently. Thus, building mass such as walls become more cooled than it would in reality during the day. At night, the slow temperature recovery results in a considerable thermal lag.
  • Unaccounted thermal bridges: It is acknowledged that the initial model might not have incorporated all existing thermal bridges (e.g., junctions around window openings). Their omission from the model would result in simulated temperatures that are lower than the measured ones at those critical points.
However, due to the inherent limitations of the software and the unavailability of real-time AC operational data and as-built construction documents, it was not possible to further isolate or mitigate these interfering factors in the present study. These issues remain to be identified and addressed in future dedicated research.
In this research, WUFI® Plus is adopted to estimate the energy and thermal comfort performance of the target building due to its comprehensive integration of heat and moisture transfer processes. However, a notable discrepancy exists in long-term predictions of indoor thermal comfort across different Building Energy Performance Simulation (BEPS) tools, highlighting a critical yet often overlooked challenge in building performance assessment, as addressed by a recent study by Alfano et al. [57]. This study provides a valuable framework for improving input consistency across different simulation tools and indicates that energy-related outputs such as heating and cooling energy demands show reasonable agreement across different BEP tools, while indoor temperature predictions, which directly influence the evaluation of indoor thermal comfort, can vary substantially. It is therefore recommended that future studies should pay close attention to this issue and prioritize the acquisition of on-site measurement data to minimize such biases. Cross-software validation under unified modeling protocols should also be enhanced to improve the reliability and comparability of the evaluation of indoor thermal comfort.
To further ensure the validity of the result, existing studies are reviewed and compared with the energy saving ratio in this research. In this study, it has been found that reflective materials can reduce cooling energy consumption by 11.3% in the chosen type of office buildings in the HSCW zone. Within the HSCW zone, previous research has evaluated the energy-saving potential of reflective materials through simulations of their respective baseline buildings. Xuan et al. [58] simulated the annual cooling energy consumption of a small insulated concrete office (5.2 m×4.6 m×3.0 m) under different Chinese urban climatic conditions. This study reported energy savings exceeding 30% after applying reflective materials with a solar reflectance of 0.85 in the HSCW zone. Jia et al. [59] reported a reduction in cooling energy demand by up to 35.7%. Yang et al. [13] indicated a cooling energy demand saving by 13.81% in a three-floor insulated office building. Zhang et al. [11] modeled a four-story concrete office building (46.33 m×16.92 m×12.19 m) without insulation reducing annual cooling energy by 10.06%, which is closer to the findings of this study (11.3%). These comparisons suggest that variations in energy savings may originate from differences in the shape coefficient of buildings, the window-to-wall ratio (WWR), and the thermal performance of the building envelope. Reflective materials may potentially yield higher cooling energy saving ratios in buildings with better insulation. This hypothesis requires further validation in future studies. Nevertheless, existing research consistently demonstrates that reflective materials can provide considerable energy savings, even in buildings with inadequate envelope performance. As a low-cost and low-disruption solution, they deserve considerable attention from engineering practitioners.

7. Conclusions

This study provides a comprehensive field-based assessment of reflective retrofits in an operational office building within China’s HSCW zone, offering insights that extend beyond simulation-based or short-term monitoring approaches.

7.1. Key Findings

Reflective roof and window materials can reduce cooling energy demand by 11.3% (39.2 → 34.8 kWh/m2) and cooling energy consumption by 11.0% (12.8 → 11.4 kWh/m2). While lower than the reductions reported in studies from Spain and by Zhang et al. [11], these results remain significant given the low equipment density and envelope quality of the studied building.
Occupant surveys indicated improved thermal perception, with mean TCV rising from −0.75 to −0.30, thermal acceptability increasing from 0.10 to 0.35, and 80% of occupants reporting cooler conditions. These subjective results aligned with simulated PMV reductions (0.82 → 0.74), confirming the retrofit’s effectiveness. However, due to the limited sample size, these findings should be validated in future research.
Compared with related studies, the present results confirm both the potential and limitations of reflective retrofits in mixed climates. The observed cooling energy reduction of 11.0–11.3% is lower than the 29.1% reported by Zhang et al. [11] for a similar retrofit measure, but the gap can be attributed to the lower equipment density, less stringent comfort requirements, and the degraded envelope performance of the old office building under investigation. At the same time, the reduction aligns closely with another case study in China’s HSCW zone [11], highlighting the climate-specific boundaries of reflective measures in regions with relatively high heating demand. By contrast, studies in Mediterranean climates such as Spain [12] have achieved higher savings, likely due to greater annual solar radiation and longer cooling seasons. Despite the relatively modest energy savings, the thermal comfort improvements observed in this study are consistent with previous survey-based findings, where reflective retrofits not only reduced cooling loads but also enhanced occupant thermal satisfaction. This reinforces the dual value of such interventions in real-world applications, suggesting that reflective retrofits should be considered as a complementary, low-disruption strategy particularly suited for aging office building stocks in HSCW climates.

7.2. Methodological Contributions

This study developed a replicable evaluation framework combining long-term calibrated WUFI®Plus simulations (NMBE: 2.40%, CV(RMSE): 4.52%, R2: 0.81) with real-world operational data and occupant surveys. This method validates reflective retrofits as an effective energy solution for HSCW regions, even in older buildings with poor thermal performance.

7.3. Future Outlook

This study acknowledges two key limitations inherent in the current analysis: the constrained sample size (n = 20) and the uncertainty surrounding ventilation behaviors. The relatively small number of samples may restrict the statistical power and generalizability of the findings. Therefore, to draw more generalizable conclusions, future studies should take into account the number of occupants in the target buildings and ensure that the sample size is sufficient. Meanwhile, the ambiguity in occupant window opening behavior introduces potential discrepancies into energy consumption simulations. To address these challenges, future research will actively explore the transformative potential of Internet of Things (IoT) technology in building performance evaluation. By deploying networks of low-cost sensors to continuously monitor indoor occupancy status, window operations, and ambient environmental parameters, it is possible to capture high-resolution, granular behavioral data to establish more reliable energy models. This data-driven approach not only promises to significantly enhance the precision of future retrofit project assessments but also opens new avenues for understanding the complex interplay between humans, buildings, and the environment, ultimately advancing the development of personalized and adaptive energy-saving strategies. For the winter season, the future field study will comprise two key components: objective measurements of PMV parameters and subjective surveys to capture occupants’ thermal perceptions in the heating season.
Author Contributions

Conceptualization, M.Z. and T.W.; Methodology, M.Z. and T.W.; Software, T.W.; Validation, T.W.; Formal Analysis, T.W. and M.Z.; Investigation, M.Z., T.W. and S.H.; Resources, S.H.; Writing—Original Draft Preparation, T.W.; Writing—Review and Editing, M.Z. and T.W.; Visualization, T.W.; Supervision, Y.L. and M.Z.; Project Administration, Y.L.; Funding Acquisition, S.H., Y.L. and M.Z. All authors have read and agreed to the published version of the manuscript.

Funding

The study was financially supported by the National Natural Science Foundation of China (grant Nos. 52338004 and 52378033), the Shanghai Pujiang Program (grant no. 23PJ1413900), the Tongren Municipal Bureau of Science and Technology (Tongren Research (2023) Nr.19) and the Tongji Architectural Design (Group) Co., Ltd (grant no. 2023J-JB01).

Data Availability Statement

The datasets presented in this article are not readily available because the data are part of an ongoing study.

Acknowledgments

During the preparation of this manuscript/study, the author(s) used Deepseek for the purposes of spell and grammar check.

Conflicts of Interest

Author Yu Lan and Shaoding Hu were employed by the company Guizhou Huazhen Planning, Surveying and Design Group Co., Ltd. The remaining authors declare that the research was conducted in the absence of any commercial or financial relationships that could be construed as a potential conflict of interest.

Appendix A

Thermal comfort questionnaire (translated version).
Buildings 15 03387 i001
Buildings 15 03387 i002
Table A1. Clothing insulation reference in GB/T50785−2012.
GarmentId
clo
UnderwearUnderpants0.03
Long underwear pants0.1
Undershirt0.04
T-shirt0.09
Long-sleeved shirt0.12
Underpants and bra0.03
Shirts/BlousesShort-sleeved0.15
Lightweight long-sleeved0.2
Regular long-sleeved0.25
Flannel shirt, long-sleeved0.3
Lightweight blouse, long-sleeved0.15
PantsShorts0.06
Lightweight0.2
Regular0.25
Flannel0.28
Dresses/SkirtsLightweight skirt (summer)0.15
Thick skirt (winter)0.25
Lightweight dress (short-sleeved)0.2
Winter dress, long0.4
Boiler suit0.55
SweatersVest0.12
Lightweight sweater0.2
Sweater0.28
Thick sweater0.35
JacketsLightweight summer jacket0.25
Jacket0.35
Overblouse0.3
High-insulation, fiber-leatherBoiler suit0.9
Pants0.35
Jacket0.4
Vest0.2
Outdoor clothingOuterwear0.6
Down jacket0.55
Snowsuit0.7
Fiber-leather overalls0.55
MiscellaneousAnkle socks0.02
Thick ankle socks0.05
Thick knee-high socks0.1
Nylon pants0.03
Shoes (thin sole)0.02
Shoes (thick sole)0.04
Boots0.1
Gloves0.05

References

  1. China Association of Building Energy Efficiency; Chongqing University Urban and Rural Construction and Development Research Institute. Research Report on Energy Consumption and Carbon Emissions of Chinese Buildings (2023). Building 2024, 2, 46–59. [Google Scholar]
  2. Pan, Y.; Huang, Z.; Wu, G. Calibrated Building Energy Simulation and Its Application in a High-Rise Commercial Building in Shanghai. Energy Build. 2007, 39, 651–657. [Google Scholar] [CrossRef]
  3. Shanghai Municipal Bureau of Statistics. 2023 Statistical Yearbook; China Statistics Press: Beijing, China, 2024. [Google Scholar]
  4. Salimi, S.; Hammad, A. Critical Review and Research Roadmap of Office Building Energy Management Based on Occupancy Monitoring. Energy Build. 2019, 182, 214–241. [Google Scholar] [CrossRef]
  5. Lin, Y.-H.; Tsai, K.-T.; Lin, M.-D.; Yang, M.-D. Design Optimization of Office Building Envelope Configurations for Energy Conservation. Appl. Energy 2016, 171, 336–346. [Google Scholar] [CrossRef]
  6. Zogou, O.; Stapountzis, H. Energy Analysis of an Improved Concept of Integrated PV Panels in an Office Building in Central Greece. Appl. Energy 2011, 88, 853–866. [Google Scholar] [CrossRef]
  7. Ge, J.; Lu, J.; Wu, J.; Luo, X.; Shen, F. Suitable and Energy-Saving Retrofit Technology Research in Traditional Wooden Houses in Jiangnan, South China. J. Build. Eng. 2022, 45, 103550. [Google Scholar] [CrossRef]
  8. Hu, X.; Xiang, Y.; Zhang, H.; Lin, Q.; Wang, W.; Wang, H. Active–Passive Combined Energy-Efficient Retrofit of Rural Residence with Non-Benchmarked Construction: A Case Study in Shandong Province, China. Energy Rep. 2021, 7, 1360–1373. [Google Scholar] [CrossRef]
  9. Gao, B.; Zhu, X.; Ren, J.; Ran, J.; Kim, M.K.; Liu, J. Multi-Objective Optimization of Energy-Saving Measures and Operation Parameters for a Newly Retrofitted Building in Future Climate Conditions: A Case Study of an Office Building in Chengdu. Energy Rep. 2023, 9, 2269–2285. [Google Scholar] [CrossRef]
  10. Azimi Fereidani, N.; Rodrigues, E.; Gaspar, A.R. A Review of the Energy Implications of Passive Building Design and Active Measures under Climate Change in the Middle East. J. Clean. Prod. 2021, 305, 127152. [Google Scholar] [CrossRef]
  11. Zhang, W.; Jiao, D.; Zhao, B.; Pei, G. Experimental and Numerical Investigation of the Effects of Passive Radiative Cooling-Based Cool Roof on Building Energy Consumption. Appl. Energy 2024, 376, 124161. [Google Scholar] [CrossRef]
  12. Rincón, L.; Gangolells, M.; Medrano, M.; Casals, M. Climate Change Mitigation and Adaptation in Spanish Office Stock through Cool Roofs. Energy Build. 2024, 323, 114738. [Google Scholar] [CrossRef]
  13. Yang, Y.; Zhang, G.; Rong, L. Assessing Energy Saving Potential of Wavelength-Dependent Passive Daytime Radiative Cooler Implemented with EnergyPlus by a Roof Model. Heliyon 2024, 10, e26428. [Google Scholar] [CrossRef]
  14. Costanzo, V.; Evola, G.; Marletta, L. Energy Savings in Buildings or UHI Mitigation? Comparison between Green Roofs and Cool Roofs. Energy Build. 2016, 114, 247–255. [Google Scholar] [CrossRef]
  15. Akbari, H.; Levinson, R.; Rainer, L. Monitoring the Energy-Use Effects of Cool Roofs on California Commercial Buildings. Energy Build. 2005, 37, 1007–1016. [Google Scholar] [CrossRef]
  16. Kolokotsa, D.; Diakaki, C.; Papantoniou, S.; Vlissidis, A. Numerical and Experimental Analysis of Cool Roofs Application on a Laboratory Building in Iraklion, Crete, Greece. Energy Build. 2012, 55, 85–93. [Google Scholar] [CrossRef]
  17. Dua, A.R. Systematic Literature Review of Roof Systems on Energy Efficiency of a Building to Support an Ideal Study Framework. Master’s Thesis, Clemson University, Clemson, SC, USA, 2023. [Google Scholar]
  18. Jiang, L.; Gao, Y.; Zhuang, C.; Feng, C.; Zhang, X.; Guan, J. Experiment Verification and Simulation Optimization of Phase Change Material Cool Roof in Summer—A Case Study of Chongqing, China. Energy 2024, 293, 130613. [Google Scholar] [CrossRef]
  19. Virk, G.; Jansz, A.; Mavrogianni, A.; Mylona, A.; Stocker, J.; Davies, M. Microclimatic Effects of Green and Cool Roofs in London and Their Impacts on Energy Use for a Typical Office Building. Energy Build. 2015, 88, 214–228. [Google Scholar] [CrossRef]
  20. Mahdavi, A.; Berger, C. Ten Questions Regarding Buildings, Occupants and the Energy Performance Gap. J. Build. Perform. Simul. 2024, 1–11. [Google Scholar] [CrossRef]
  21. Zheng, Z.; Xiao, J.; Yang, Y.; Xu, F.; Zhou, J.; Liu, H. Optimization of Exterior Wall Insulation in Office Buildings Based on Wall Orientation: Economic, Energy and Carbon Saving Potential in China. Energy 2024, 290, 130300. [Google Scholar] [CrossRef]
  22. Verma, R.; Rakshit, D. Comparison of Reflective Coating with Other Passive Strategies: A Climate Based Design and Optimization Study of Building Envelope. Energy Build. 2023, 287, 112973. [Google Scholar] [CrossRef]
  23. Hong, T.; Langevin, J.; Sun, K. Building Simulation: Ten Challenges. Build. Simul. 2018, 11, 871–898. [Google Scholar] [CrossRef]
  24. Erell, E.; Pearlmutter, D.; Boneh, D.; Kutiel, P.B. Effect of High-Albedo Materials on Pedestrian Heat Stress in Urban Street Canyons. Urban Clim. 2014, 10, 367–386. [Google Scholar] [CrossRef]
  25. Schrijvers, P.J.C.; Jonker, H.J.J.; De Roode, S.R.; Kenjereš, S. The Effect of Using a High-Albedo Material on the Universal Temperature Climate Index within a Street Canyon. Urban Clim. 2016, 17, 284–303. [Google Scholar] [CrossRef]
  26. Speroni, A.; Mainini, A.G.; Zani, A.; Paolini, R.; Pagnacco, T.; Poli, T. Experimental Assessment of the Reflection of Solar Radiation from Façades of Tall Buildings to the Pedestrian Level. Sustainability 2022, 14, 5781. [Google Scholar] [CrossRef]
  27. Kocifaj, M.; Petržala, J.; Medveď, I. Skyglow from Ground-Reflected Radiation: Model Improvements. Mon. Not. R. Astron. Soc. 2024, 533, 2356–2363. [Google Scholar] [CrossRef]
  28. GB/T 51141-2015; Assessment Standard for Green Retrofitting of Existing Building. Ministry of Housing and Urban-Rural Development of the People’s Republic of China: Beijing, China, 2016.
  29. Al Mindeel, T.; Spentzou, E.; Eftekhari, M. Energy, Thermal Comfort, and Indoor Air Quality: Multi-Objective Optimization Review. Renew. Sustain. Energy Rev. 2024, 202, 114682. [Google Scholar] [CrossRef]
  30. Kaczmarek, A. A State-of-the-Art Review of Retrofit Interventions in Low-Emission School Buildings Located in Cool Temperate Climates. Buildings 2025, 15, 1620. [Google Scholar] [CrossRef]
  31. Tian, D.; Zhang, J.; Gao, Z. The Advancement of Research in Cool Roof: Super Cool Roof, Temperature-Adaptive Roof and Crucial Issues of Application in Cities. Energy Build. 2023, 291, 113131. [Google Scholar] [CrossRef]
  32. Mahgoub, M.; Alhumaidi, A.; Osman, B.; Alshehhi, R. Cool Roofs in Hot Climates: A Conceptual Review of Modelling Methods and Limitations. Buildings 2022, 12, 1968. [Google Scholar] [CrossRef]
  33. GB55015-2021; General Code for Energy Efficiency and Renewable Energy Application in Buildings. Ministry of Housing and Urban-Rural Development of the People’s Republic of China: Beijing, China, 2021.
  34. JGJ 176-2009; Technical Code for the Retrofitting of Public Building on Energy Efficiency. Ministry of Housing and Urban-Rural Development of the People’s Republic of China: Beijing, China, 2009.
  35. 35. Standard 90.1-2022; Energy Standard for Sites and Buildings Except Low-Rise Residential Buildings. American Society of Heating. Refrigerating and Air-Conditioning Engineers: Peachtree Corners, GA, USA, 2022.
  36. ISO 52003-1:2017; Energy Performance of Buildings—Indicators, Requirements, Ratings and Certificates. International Organization for Standardization: Geneva, Switzerland, 2017.
  37. ANSI/ASHRAE Standard 55-2023; Thermal Environmental Conditions for Human Occupancy. American Society of Heating, Refrigerating and Air-Conditioning Engineers: Peachtree Corners, GA, USA, 2023.
  38. Xu, C.; Li, S.; Zhang, X.; Shao, S. Thermal Comfort and Thermal Adaptive Behaviours in Traditional Dwellings: A Case Study in Nanjing, China. Build. Environ. 2018, 142, 153–170. [Google Scholar] [CrossRef]
  39. Lakhiar, M.T.; Sanmargaraja, S.; Olanrewaju, A.; Lim, C.H.; Ponniah, V.; Mathalamuthu, A.D. Evaluating and Comparing Objective and Subjective Thermal Comfort in a Malaysian Green Office Building: A Case Study. Case Stud. Therm. Eng. 2024, 60, 104614. [Google Scholar] [CrossRef]
  40. Yu, H.; Zhao, X.; Chen, L.; Tian, X.; Liang, S.; Hu, S. Experimental Study of the Effects of Siestas on the Nocturnal Sleep Quality and Thermal Comfort Levels under Thermoneutral Environment in Summer. Energy Built Environ. 2025, 6, 448–454. [Google Scholar] [CrossRef]
  41. Wang, X.; Wang, Y.; Lai, X.; Wang, G.; Sang, C. Investigation of Heat Stress and Thermal Response in Deep Hot-Humid Underground Environments: A Field and Experimental Study. Build. Environ. 2025, 270, 112506. [Google Scholar] [CrossRef]
  42. Fanger, P.O. Thermal Comfort. Analysis and Applications in Environmental Engineering; Danish Technical Press: Copenhagen, Denmark, 1970; 244p. [Google Scholar]
  43. GB 50176-2016; Thermal Design Code for Civil Building. Ministry of Housing and Urban-Rural Development of the People’s Republic of China: Beijing, China, 2016.
  44. WUFI Plus, V 3.2.0.1; Fraunhofer Institute for Building Physics: Stuttgart, Germany, 2018.
  45. Künzel, H.M. Simultaneous Heat and Moisture Transport in Building Components: One- and Two-Dimensional Calculation Using Simple Parameters; IRB Verlag: Stuttgart, Germany, 1995; ISBN 978-3-8167-4103-9. [Google Scholar]
  46. Künzel, H.M.; Holm, A.; Zirkelbach, D.; Karagiozis, A.N. Simulation of Indoor Temperature and Humidity Conditions Including Hygrothermal Interactions with the Building Envelope. Sol. Energy 2005, 78, 554–561. [Google Scholar] [CrossRef]
  47. Nguyen, A.T.; Reiter, S. An Investigation on Thermal Performance of a Low Cost Apartment in Hot Humid Climate of Danang. Energy Build. 2012, 47, 237–246. [Google Scholar] [CrossRef]
  48. Mustafaraj, G.; Chen, J.; Lowry, G. Development of Room Temperature and Relative Humidity Linear Parametric Models for an Open Office Using BMS Data. Energy Build. 2010, 42, 348–356. [Google Scholar] [CrossRef]
  49. JGJ 67-2017; Civil Building Ventilation Design Code. Ministry of Housing and Urban-Rural Development of the People’s Republic of China: Beijing, China, 2017.
  50. ASHRAE Guideline 14–2023; Measurement of Energy, Demand, and Water Savings. American Society of Heating, Refrigerating and Air-Conditioning Engineers: Peachtree Corners, GA, USA, 2023.
  51. Efficiency Valuation Organization. International Performance Measurement and Verification Protocol: Concepts and Options for Determining Energy and Water Savings; Efficiency Valuation Organization: Washington, DC, USA, 2002. [Google Scholar]
  52. GB/T 50785-2012; Evaluation Standard for Indoor Thermalenvironmenin Civil Buildings. Ministry of Housing and Urban-Rural Development of the People’s Republic of China: Beijing, China, 2012.
  53. ISO 52016-1:2017; Energy Performance of Buildings — Energy Needs for Heating and Cooling, Internal Temperatures and Sensible and Latent Heat Loads. International Organization for Standardization: Geneva, Switzerland, 2017.
  54. Chen, J.; Lu, L. Comprehensive Evaluation of Thermal and Energy Performance of Radiative Roof Cooling in Buildings. J. Build. Eng. 2021, 33, 101631. [Google Scholar] [CrossRef]
  55. Ben, H.; Brown, C.S.; Kolo, I.; Falcone, G.; Walker, S. Decarbonising Well-Insulated Buildings in a Warming Climate: The Case of Adaptive Thermal Comfort with Geothermal Space Heating. Energy Build. 2024, 319, 114466. [Google Scholar] [CrossRef]
  56. Ge, J.; Zhao, J.; Wu, Z.; Zhang, H. Investigation into the Impact of Enclosure Retrofit on Thermal Comfort in Semi-Open University Space. Buildings 2025, 15, 2883. [Google Scholar] [CrossRef]
  57. d’Ambrosio Alfano, F.R.; Olesen, B.W.; Pepe, D.; Palella, B.I. Working with Different Build-ing Energy Performance Tools: From Input Data to Energy and Indoor Temperature Predic-tions. Energies 2023, 16, 743. [Google Scholar] [CrossRef]
  58. Xuan, Q.; Lei, L.; Wang, T.; Jiang, B.; Zhao, B.; Li, G.; Pei, G.; Dai, J.-G. Analysis of the Ther-mal and Energy Saving Performance of the Concrete Roof with Radiative Cooling Coating. J. Build. Eng. 2025, 106, 112578. [Google Scholar] [CrossRef]
  59. Jia, L.-R.; Li, Q.-Y.; Yang, J.; Han, J.; Lee, C.-C.; Chen, J.-H. Investigation of the Energy-Saving Potential of Buildings with Radiative Roofs and Low-E Windows in China. Sustainability 2024, 16, 148. [Google Scholar] [CrossRef]
Figure 1. Schematic diagram of envelope heat transfer process.
Buildings 15 03387 g001
Figure 2. Air temperature and relative humidity throughout 2024 in Tongren.
Buildings 15 03387 g002
Figure 3. The subject building viewed from the street side.
Buildings 15 03387 g003
Figure 4. Layout of the 7th floor with thermal zoning. Blue: office rooms, red: corridors.
Buildings 15 03387 g004
Figure 5. Construction site brushing the coatings and installing reflective films.
Buildings 15 03387 g005
Figure 6. Research workflow.
Buildings 15 03387 g006
Figure 7. Location of measurement instruments.
Buildings 15 03387 g007
Figure 8. The comparison between measured and simulated indoor air temperatures of Room 708.
Buildings 15 03387 g008
Figure 9. Comparison of cooling energy before and after retrofit.
Buildings 15 03387 g009
Figure 10. The gender and age distribution of occupant.
Buildings 15 03387 g010
Figure 11. Results of the thermal comfort questionnaire before and after the retrofit.
Buildings 15 03387 g011
Figure 12. Hourly PMV before and after retrofit.
Buildings 15 03387 g012
Figure 13. MRT comparison.
Buildings 15 03387 g013
Figure 14. Comparison of the monthly average temperature between Tongren and Shanghai.
Buildings 15 03387 g014
Table 1. The number of persons and area and volume of rooms in the subject building.
RoomNumber of PersonsArea (m2)Volume (m3)
701241.6118.6
702033.695.8
703116.446.7
703−1111.131.6
704116.446.7
704−1111.131.6
705116.446.7
705−1111.131.6
706133.695.8
707−1133.695.8
707313.595.8
708333.695.8
709333.695.8
710133.695.8
711033.695.8
712028.480.8
713028.480.8
corridor0165.4471.3
Table 2. The measurement instruments used in the study.
DeviceMeasurement ParameterMeasurement RangeAccuracyResolutionSetting Place
HOBO MX1101Temperature−20~70 °C±0.21 °C (0~50 °C)0.024 °C (at 25 °C)707,708
Relative humidity1~90%±2% (20~80%)0.01%
HOBO MX1105 recorder+TMC6-HE sensorSurface temperature−40~100 °C±0.15 °C (0~70 °C)0.002 °C (at 25 °C)708
Table 3. Hygrothermal properties of exterior walls for the simulation.
Component Layers (Outside to Inside)Density [kg/m3]Specific Thermal Capacity
[J/(kgK)]
Thermal Conductivity [W/(mK)]Thickness [m]Porosity [−]
Cement plaster20008501.20.0050.3
Concrete screed180010500.930.020.175
Solid brick180010660.810.240.24
Cement–lime mortar18008500.870.0180.1
Interior plaster16008500.700.0030.65
Table 4. Hygrothermal properties of the roof for the simulation.
Component Layers (Outside to Inside)Density [kg/m3]Specific Thermal Capacity
[J/(kgK)]
Thermal Conductivity [W/(mK)]Thickness [m]Porosity [−]
Reflective coating11008500.040.00010.12
Asphalt waterproof200015000.70.00050.001
Concrete Screed180010500.930.020.175
Light Concrete85010500.20.020.72
Concrete23088501.70.150.15
Cement mortar170010500.870.0050.175
Lime plastering12008500.350.0020.1
Table 5. Thermal parameters of windows.
Uw-mounted (W/m2K)5
Frame factor0.85
Solar energy transmittance hemispherical0.45
Long wave radiation emissivity0.8
Table 6. Overview of internal hygrothermal loads in each office rooms.
RoomArea (m2)PersonPerson Heat Convective
(W)
Person
Heat Radiant (W)
Moisture Load (g/h)Lighting and Electrical Equipment
(W)
70141.6255678162956.8
70233.600000
70316.412783981377.2
703−111.112783981255.3
70416.412783981377.2
704−111.112783981255.3
70516.412783981377.2
705−111.112783981255.3
70633.612783981772.8
707−113.512783981310.5
70733.63834117243772.8
70833.63834117243772.8
70933.63834117243772.8
71033.6127839162772.8
71133.600000
71228.400000
71328.400000
corridor165.3800000
Table 7. The overview of air change rates of each office room.
RoomVolume (m3)PersonAir Change Rate (h−1)
701118.620.51
70295.80-
70346.710.64
703−131.610.95
70446.710.64
704−131.610.95
70546.710.64
705−131.610.95
70695.810.31
707−195.810.78
70795.830.94
70895.830.94
70995.830.94
71095.810.32
71195.80-
712161.60-
corridor471.30-
Table 8. Summary of technical specifications of air conditioners in the investigated floor.
RoomTypeCOPCCOPH
701KFR-60LW/E(60511L)B-N42.893.35
702KFR-35GW/(35559)FNhAb-A33.213.36
703KFR-35GW/(35559)FNhAb-A33.213.36
703−1KFR-35GW/(35559)FNhAb-A33.213.36
704KFR-35GW/(35559)FNhAb-A33.213.36
704−1KFR-35GW/(35559)FNhAb-A33.213.36
705KFR-35GW/(35559)FNhAb-A33.213.36
705−1KFR-35GW/(35559)FNhAb-A33.213.36
706KFR-35GW/(35559)FNhAb-A33.213.36
707−1KFR-35GW/(35559)FNhAb-A33.213.36
707KFR-60LW/E(60511L)B-N42.893.35
708KFR-60LW/E(60511L)B-N42.893.35
709KFR-60LW/E(60511L)B-N42.893.35
710KFR-35GW/(35559)FNhAb-A33.213.36
711KFR-35GW/(35559)FNhAb-A33.213.36
712KFR-35GW/(35559)FNhAb-A33.213.36
corridor---
Table 9. Statistical indicators of the calibration of the August air temperature of Room 708.
NMBECV (RMSE)R2MBERMSE
−2.40%4.52%0.81−0.69 °C1.31 °C
Table 10. Energy consumption for cooling before retrofit.
ZoneArea (m2)COPCCooling Demand (kWh)Cooling Energy (kWh)
70141.62.892876995.2
70233.63.211631.6508.3
70316.43.211293.8403.1
703−111.13.21984.4306.7
70416.43.211208.3376.4
704−111.13.21987.5307.6
70516.43.211231.4383.6
705−111.13.21927.0288.8
70633.63.211870.1582.6
70733.62.892475.8856.7
707−113.53.211247.9388.8
70833.62.892344.0811.1
70933.62.892352.5814.0
71033.63.211912.3595.7
71133.63.21-(unoccupied)-
71228.43.21-(unoccupied)-
71328.43.21-(unoccupied)-
corridor165.4-0.00.0
Total 23,342.6 kWh 7618.4 kWh
Per m2 39.2 kWh/m212.8 kWh/m2
Table 11. Energy consumption for cooling after retrofit.
ZoneArea (m2)COPCCooling Demand (kWh)Cooling Energy (kWh)
70141.62.892550.4941.5
70233.63.211532.3440.3
70316.43.211202.6348.4
703−111.13.21943.1276.3
70416.43.211196.6326.3
704−111.13.21942.9277.3
70516.43.211146.4327.0
705−111.13.21881.0252.7
70633.63.211817.0537.7
70733.62.892325.1739.4
707−113.53.211184.5328.9
70833.62.892193.4701.8
70933.62.891868.0701.0
71033.63.211868.0557.2
71133.63.21-(unoccupied)-
71228.43.21-(unoccupied)-
71328.43.21-(unoccupied)-
corridor165.38-0.00.0
Total 20,699.7 kWh6755.9 kWh
Per m2 34.8 kWh/m211.4 kWh/m2
Table 12. Summary of metabolic rates and thermal resistance of clothing.
IndicatorGenderMaxMinStandard DeviationAverage
Thermal resistance of clothes (clo)Male 0.60.360.070.45
Female0.410.220.070.36
p = 0.0214 0.42
Metabolic rate (met)Male1.910.231.18
Female1.910.391.4
p = 0.129 1.245
Table 13. The average PMV before and after retrofit.
The Average PMV
BeforeAfterImprovement Percent (%)
0.820.7410.0
Disclaimer/Publisher’s Note: The statements, opinions and data contained in all publications are solely those of the individual author(s) and contributor(s) and not of MDPI and/or the editor(s). MDPI and/or the editor(s) disclaim responsibility for any injury to people or property resulting from any ideas, methods, instructions or products referred to in the content.