1. Introduction
Graphene is a two-dimensional nanomaterial of carbon atoms arranged in sp
2 hybridized orbitals, forming a hexagonal honeycomb lattice. It boasts an exceptionally high specific surface area (2630 m
2/g) [
1], with tensile strength and Young’s modulus reaching up to 125 GPa [
2] and 1.1 TPa [
3], respectively. Graphene nanoplatelets (GNPs) are two-dimensional nanomaterials consisting of multiple stacked graphene layers, with diameters in the micrometer range and thicknesses of up to 100 nm. Carbon nanotubes (CNTs), on the other hand, are one-dimensional nanofiber materials formed by rolling GNPs into seamless cylindrical structures.
GNPs and CNTs have recently been incorporated into cementitious materials to enhance their properties. Wang et al. [
4] observed that in cementitious composites doped with GNPs, the number of pores larger than 200 nm decreased, while the number of pores smaller than 50 nm increased. Similarly, Han et al. [
5] observed that doping 0.2% CNTs into cement mortar significantly decreased the permeability coefficient of the composites. Du et al. [
6] demonstrated that the addition of 0.6% GNPs to cement mortar reduced the permeability coefficient by 64%, the chloride diffusion coefficient by 70%, and the chloride mobility coefficient by 31%. Furthermore, Wang et al. [
4] found that the compressive and flexural strengths of cementitious composites increased by 27.4% and 25.2%, respectively, when doped with 0.05% GNPs. Similarly, Hawreen et al. [
7] reported that the compressive and flexural strengths of composites doped with 0.05% CNTs improved by 23% and 29%, respectively. Other studies [
8,
9,
10,
11,
12,
13] have consistently demonstrated that improvements in pore structure, mechanical properties, and durability are primarily attributed to the nano-filling effect of graphene materials, which refine larger pores into smaller ones. In addition, the large specific surface area of graphene materials serves as nucleation sites for cement hydration, thereby promoting hydration reactions and generating more hydration products, which significantly enhance the densification of cementitious composites [
14,
15]. Moreover, the bridging effect of CNTs effectively mitigates the formation and propagation of microcracks, further contributing to the improved performance of cementitious composites [
16].
In addition to the aforementioned research on the effects of graphene materials on the basic mechanical properties of cementitious composites, scholars, both domestically and internationally, have conducted studies on the damping enhancement of cementitious materials, particularly in response to dynamic loads such as those caused by vehicles, wind, and earthquakes. For instance, polymer cementitious composites have been shown to significantly improve material damping due to the viscous damping properties of polymers [
17,
18]. However, this improvement is often accompanied by reductions in stiffness, strength, and durability [
19,
20,
21,
22]. Similarly, cementitious composites doped with micrometer-sized fibers can enhance damping through interfacial debonding and interfacial Coulomb damping mechanisms [
23,
24,
25]. Nevertheless, the effectiveness of these fibers is highly dependent on their dosage. High dosages can lead to uneven mixing, reduced fluidity, and an increase in pores and defects, which pose significant challenges to their practical application in cementitious composites [
26]. Graphene materials, due to their unique size and properties, can overcome the issues associated with the fracture and macro-agglomeration of micrometer-sized fibers, as well as the reduction in mechanical properties caused by fiber doping. For example, Liew et al. [
27] conducted dynamic mechanical tests on CNT-reinforced cement mortar and found that CNTs, when homogeneously dispersed using the Triton X-100 noncovalent wrapping dispersion in solution (TNWDIS) method, improved the loss factor of cement mortar composite by 25.9%. Similarly, Long et al. [
28] investigated the damping performance of graphene oxide (GO)-reinforced cement mortar. They observed that the addition of GO increased the loss factor of cementitious composites by 77% and the energy storage modulus by 52%. Although significant progress has been made by scholars, both domestically and internationally, in applying CNTs and GO to enhance the damping properties of cementitious materials, the mechanisms underlying the synergistic enhancement of damping and mechanical properties in cementitious composites using graphene materials of different dimensions (e.g., GNPs and CNTs) and the characterization of their microstructures remain unclear.
Therefore, in this study, five types of graphene cementitious composite specimens with varying dosages were designed to investigate the enhancement mechanisms of graphene materials with different dimensions (1D and 2D) on the damping characteristics of cementitious composites. It is worth noting that this study was conducted on cement paste composites, and deliberately excluded aggregates to create a simplified system that allows for a fundamental investigation of the intrinsic interactions between nanomaterials and the cement binder, without confounding effects from aggregate interfaces. First, the optimal dispersant types for dispersing CNTs and GNPs were determined. Subsequently, comparative tests were conducted to examine the damping characteristics, mechanical properties, pore structure, and micro-morphology of cementitious composites incorporating GNPs and CNTs. The interactions between GNPs, CNTs, and the cement matrix were elucidated through phase analysis, along with the mechanisms underlying the improvement in damping. The originality and primary contributions of this work are threefold: First, we provide a systematic, head-to-head comparison of how one-dimensional (1D) CNTs and two-dimensional (2D) GNPs affect the dynamic modulus and damping of cement composites, focusing on the low-frequency range (0.5–2 Hz) most relevant to civil engineering structures. Second, we introduce a link between a microstructural feature and the macroscopic dynamic mechanical response, offering a new analytical perspective on material performance. Third, we deconstruct the governing mechanisms by correlating nanoparticle dispersion with quantifiable changes in pore size distribution and the resultant synergy or trade-off between stiffness and damping. The findings provide valuable insights for developing cementitious composites with excellent damping and mechanical properties, offering a foundational understanding before extending to more complex concrete systems.
3. Test Results and Discussion
3.1. Dispersion of GNP/CNT
The UV–vis absorption spectrum of the graphene material suspension exhibits a characteristic peak at a wavelength of approximately 260 nm [
44]. Following the Lambert–Beer law, the suspension’s optical absorbance is linearly related to the concentration of particles within the solution [
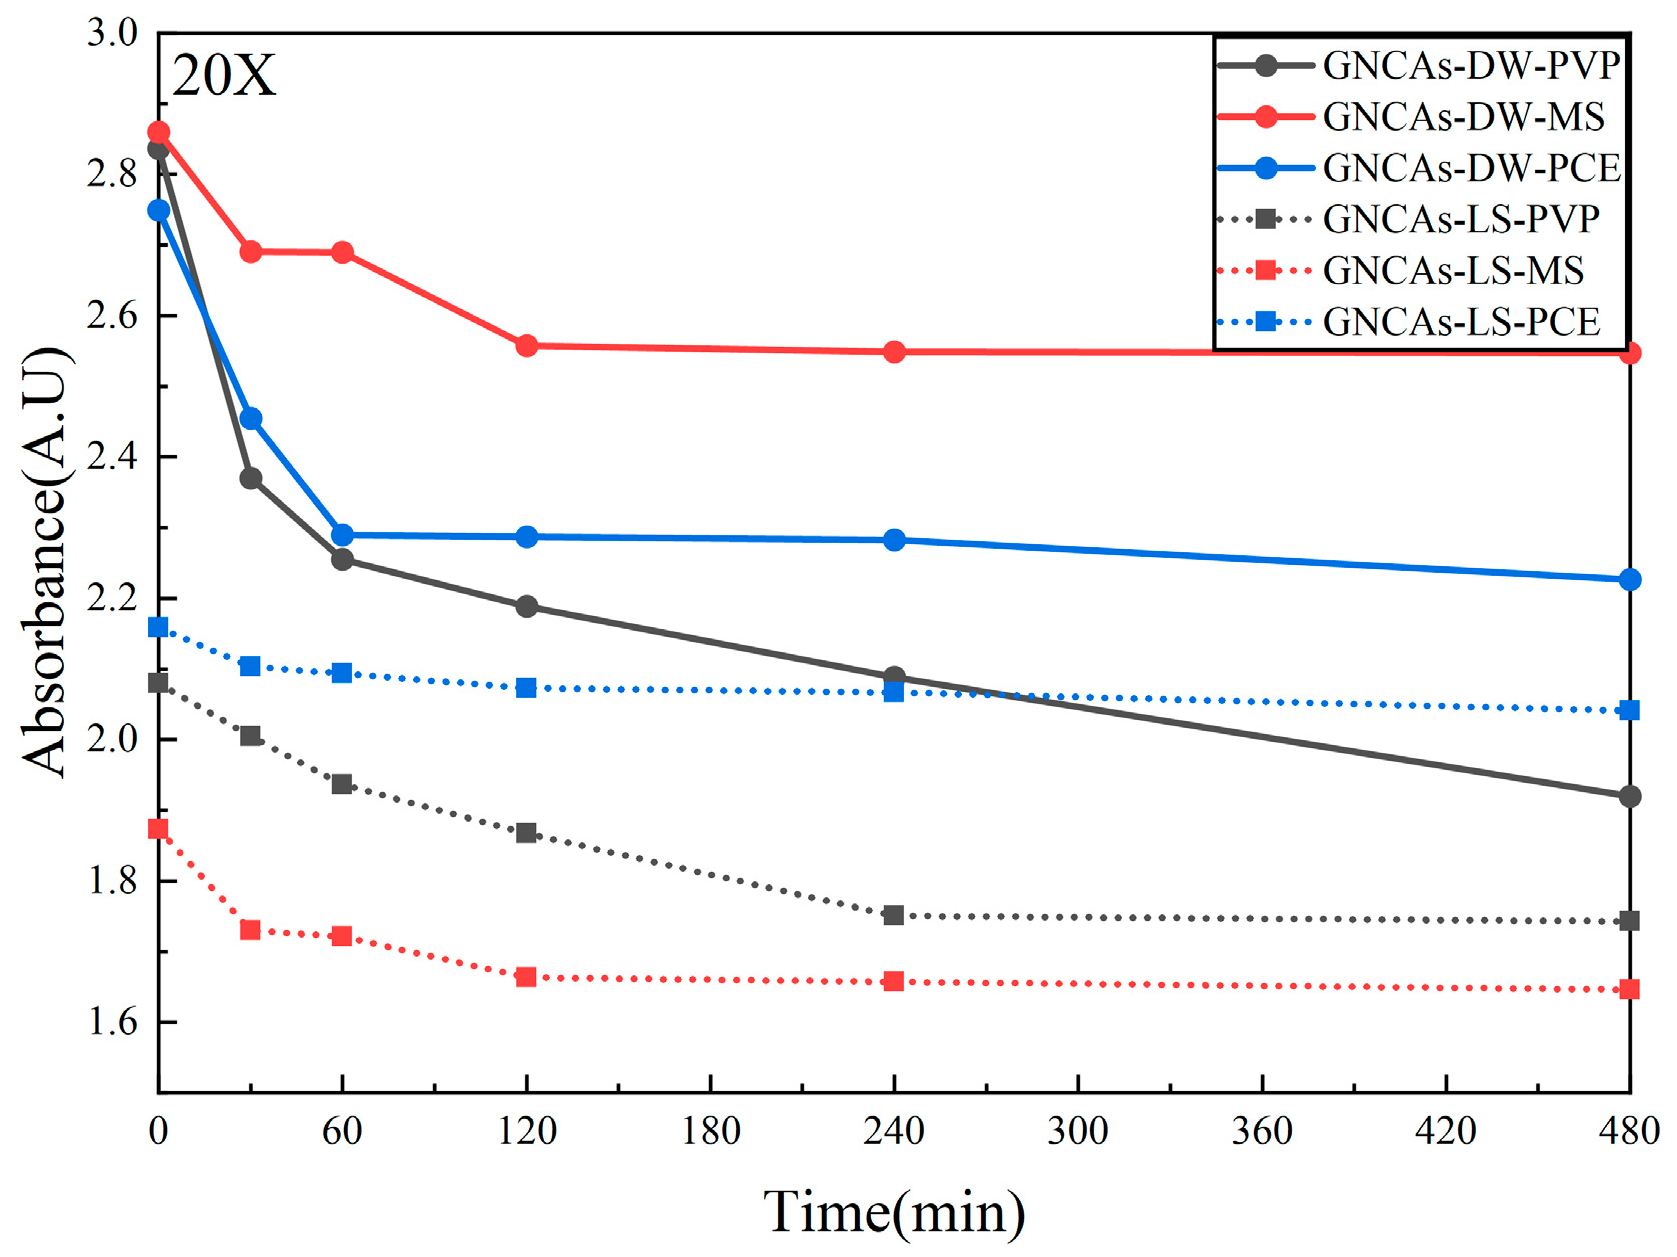
45], where higher absorbance values indicate improved dispersion of the graphene material. The absorbance at 260 nm was measured over time using UV–vis spectroscopy to evaluate the suspension’s stability. Before measurement, the suspension was diluted by a factor of 20 to ensure the signal intensity remained within the instrument’s detection range. The resulting plot of absorbance versus settling time is presented in
Figure 5.
As shown in
Figure 5, the dispersions prepared by 2 h of ultrasonication in deionized water (pH = 7) with the addition of PVP10, MS, and PCE demonstrated effective dispersing capabilities. During the initial 60 min of the resting process, all three dispersions exhibited a notable decline in absorbance, with reductions of 20.5% (PVP10), 6% (MS), and 16.7% (PCE), respectively. After 480 min of standing, the graphene material suspension dispersed with the MS exhibited the highest stability, while the suspension dispersed with PVP10 showed the lowest stability, as evidenced by a significant decrease in absorbance over time.
In a Ca(OH)
2 solution (pH = 11.8), the suspension dispersed using the PCE exhibited the highest absorbance after 2 h of ultrasonic dispersion. This result indicates that, under alkaline conditions, the PCE outperforms both the MS and PVP10 in dispersing graphene materials. Furthermore, the absorbance of the suspensions dispersed by the three agents decreased by 34.5% (MS), 29.2% (PVP10), and 21.4% (PCE) compared with their respective values in deionized water (pH = 7). This suggests that the presence of Ca
2+ ions significantly impairs the dispersing efficiency of the agents for graphene materials. Notably, the suspension dispersed with the PCE exhibited the smallest decrease in absorbance (−5.4%) over 480 min of standing, demonstrating superior stability. These findings align with the results reported by Zhao et al. [
46], which highlight the enhanced dispersion and stability of graphene materials achieved by PCE in alkaline environments with high concentrations of Ca
2+ ions.
To evaluate the effectiveness of the selected dispersants in maintaining the stability of graphene material suspensions over both short- and long-term periods, the absorbance of alkaline graphene suspensions (pH = 11.8) dispersed by the three dispersants was measured after 10 days of resting. The results reveal that the suspension dispersed with the PCE exhibited a significantly higher absorbance compared with the other two dispersants (see
Figure 6), indicating superior long-term stability.
Through the evaluation of the dispersibility of three commonly used dispersants for graphene materials in both alkaline and neutral environments, it was determined that the PCE exhibited superior dispersing performance. Moreover, the PCE demonstrated the highest dispersing stability in alkaline environments with high concentrations of Ca2+ ions. Based on these findings, the PCE was selected as the optimal dispersant for graphene materials in the preparation of subsequent specimens.
3.2. Microscopic Morphology Analysis
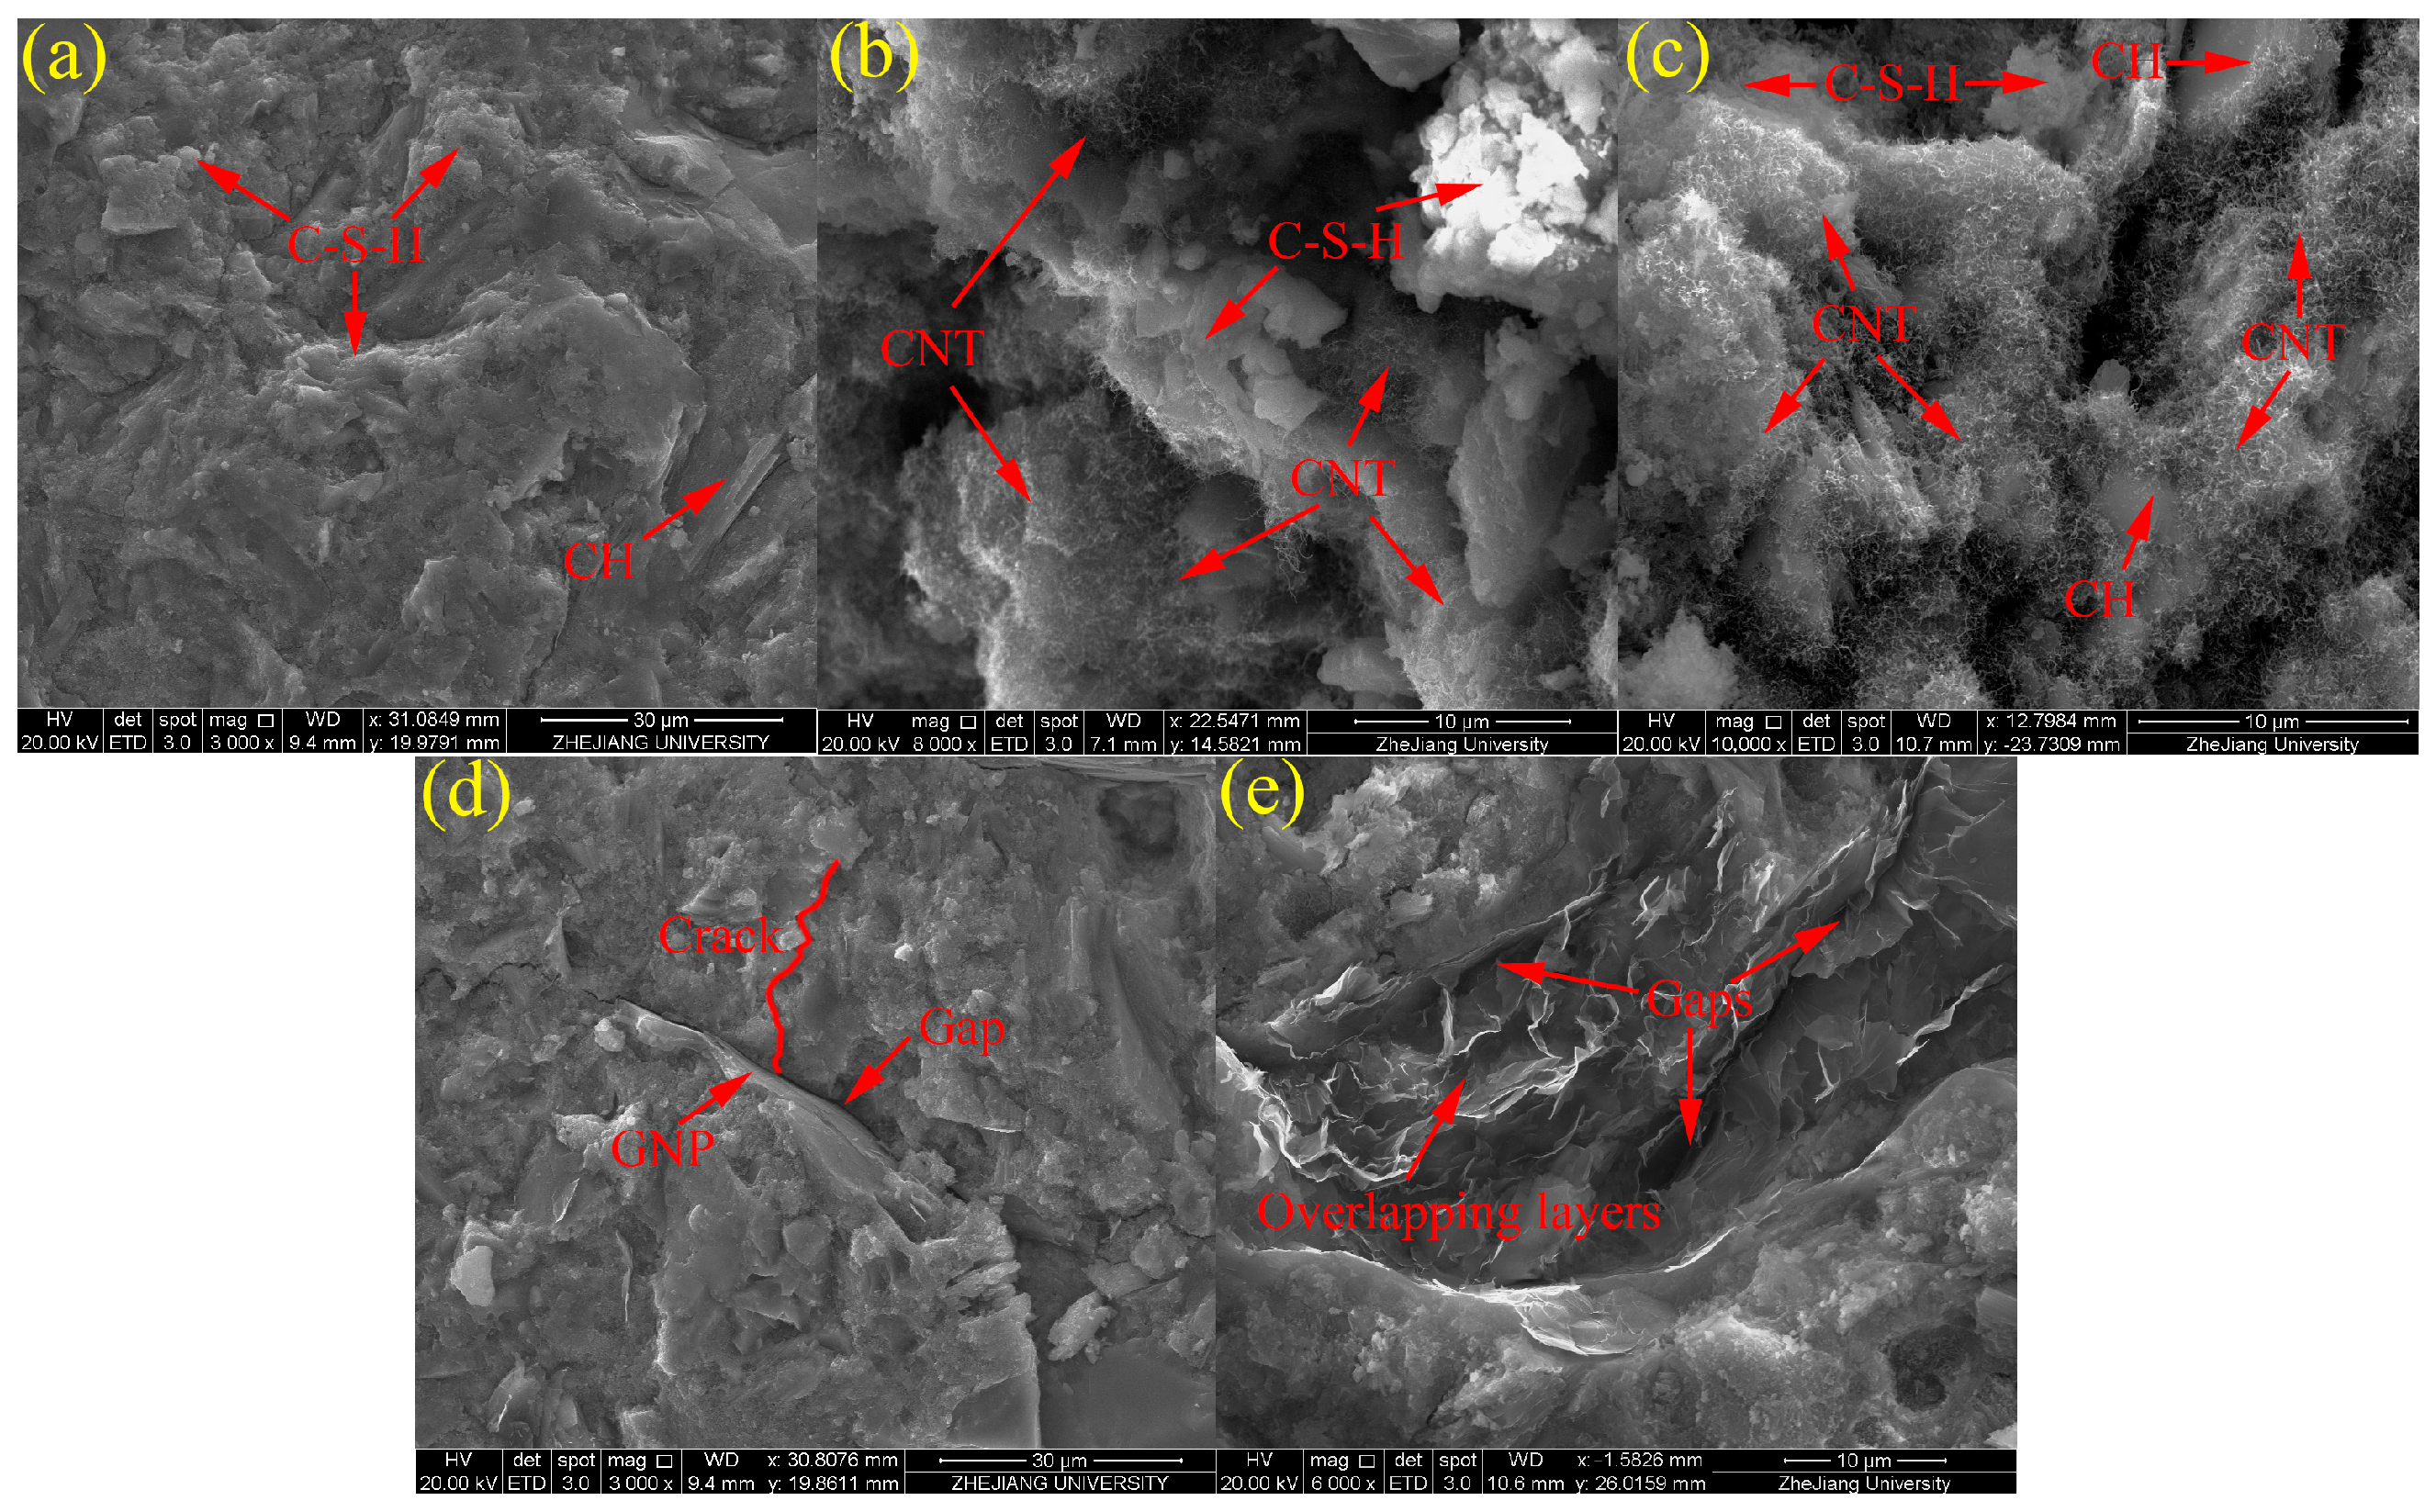
To elucidate the microstructure of the composites, SEM observations were conducted, with representative micrographs presented in
Figure 7. It is important to note that the following interpretations are based on morphology.
Figure 7b,c show composites with 0.1% and 0.3% CNTs, respectively, and show extensive C–S–H formation surrounding the nanotubes. CNTs are embedded within hydration products and help fill capillary pores in the cement matrix, an effect that becomes more pronounced with increasing CNT dosage. Nevertheless, localized CNT agglomeration into micrometer-scale clusters generates highly porous domains that act as nucleation sites for hexagonal prismatic portlandite crystals.
Figure 7d,e illustrate the morphology and dispersion of GNPs in the cement slurry. Similar to CNTs, the two-dimensional, lamellar GNPs occupy pore space; however, their larger lateral dimensions enable them to bridge and fill larger voids than CNTs. As shown in
Figure 7d, the geometry of GNPs more effectively arrests crack propagation in their vicinity relative to CNTs, indicating that GNPs can suppress microcrack initiation and growth, thereby enhancing peak load capacity and dynamic resistance. Although SEM provides only localized views, the extensive GNP–cement interfaces afforded by nanoscale GNPs impede crack development and serve as sites for load transfer and energy dissipation, which likely contributes to the improved mechanical performance of GNP–cementitious composites.
By contrast,
Figure 7e shows that inadequately dispersed GNPs tend to curl, fold, and agglomerate within the matrix, producing interlayer gaps between stacked sheets. These gaps can increase the critical pore size of GNP–cementitious composites and degrade their properties. Thus, achieving uniform GNP dispersion is essential to minimize agglomeration and may further improve both mechanical and damping performance. For definitive phase identification and a more detailed microstructural characterization, future studies may incorporate SEM-EDS analysis.
3.3. Pore Structure Analysis
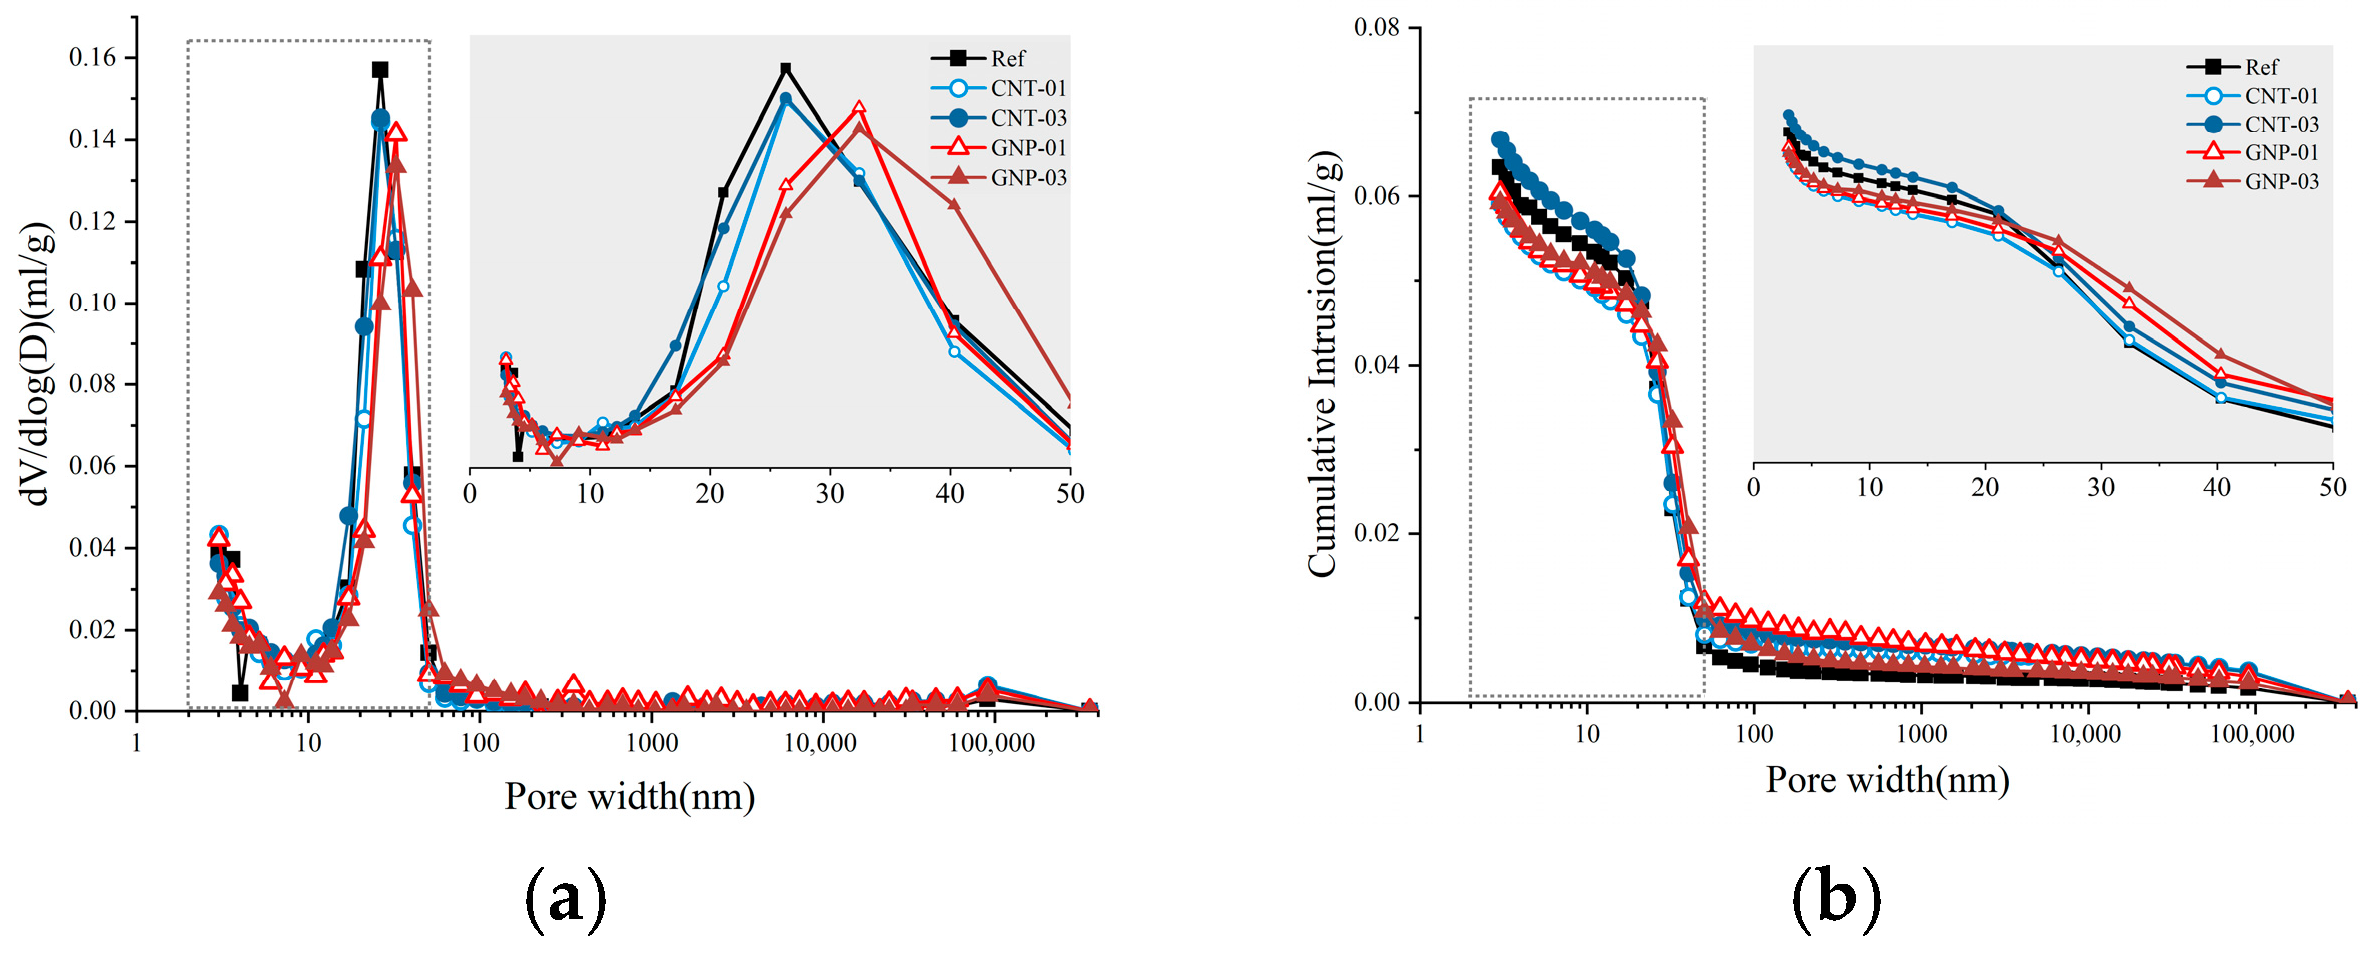
The pore structure of graphene-enhanced cementitious composites was characterized by mercury intrusion porosimetry (MIP). Summary metrics—total porosity, average pore size, critical pore size, and pore-size distribution—are listed in
Table 7, and the corresponding differential and cumulative distributions are shown in
Figure 8. As indicated in
Table 7, adding 0.1% CNTs or 0.1% GNPs reduced porosity by 5.8% and 5.4%, respectively, implying comparable matrix-filling effects for both graphene-based additives.
The pore-size distributions, however, reveal distinct roles. In CNT-modified composites, the fraction of pores with diameters below 20 nm increases, whereas in GNP-modified composites, the proportion of 50–200 nm pores grows. This divergence reflects the materials’ geometries: CNTs are more effective at occupying finer capillary pores, while the larger lateral dimensions of GNPs favor filling and bridging of larger voids, thereby redistributing pore classes. Notably, the average and critical pore sizes remain essentially unchanged with CNT addition, but both parameters increase with GNP addition.
For GNP-03 (0.3 wt.%), total porosity decreases while the threshold pore size increases to 32.4 nm, and the fractions of 50–200 nm and >200 nm pores grow significantly (
Table 7), indicating pore coarsening. This phenomenon is consistent with 2D-flake-specific effects: stacking-induced interlayer slit pores and GNP–matrix interfacial gaps that eliminate fine capillaries while introducing fewer but larger mesopores. SEM at the magnifications used cannot resolve 30–200 nm slit pores; therefore, we interpret this as the combined consequence of flake stacking and interfacial effects rather than solely visible agglomeration.
When the CNT dosage is increased to 0.3%, the composite porosity rises by 4.3% relative to the control. This reversal is consistent with that found when exceeding the optimal CNT content (previously identified as 0.048% [
47]), which promotes self-agglomeration, diminishes effective pore filling, and ultimately increases percolating void space.
3.4. XRD Analysis
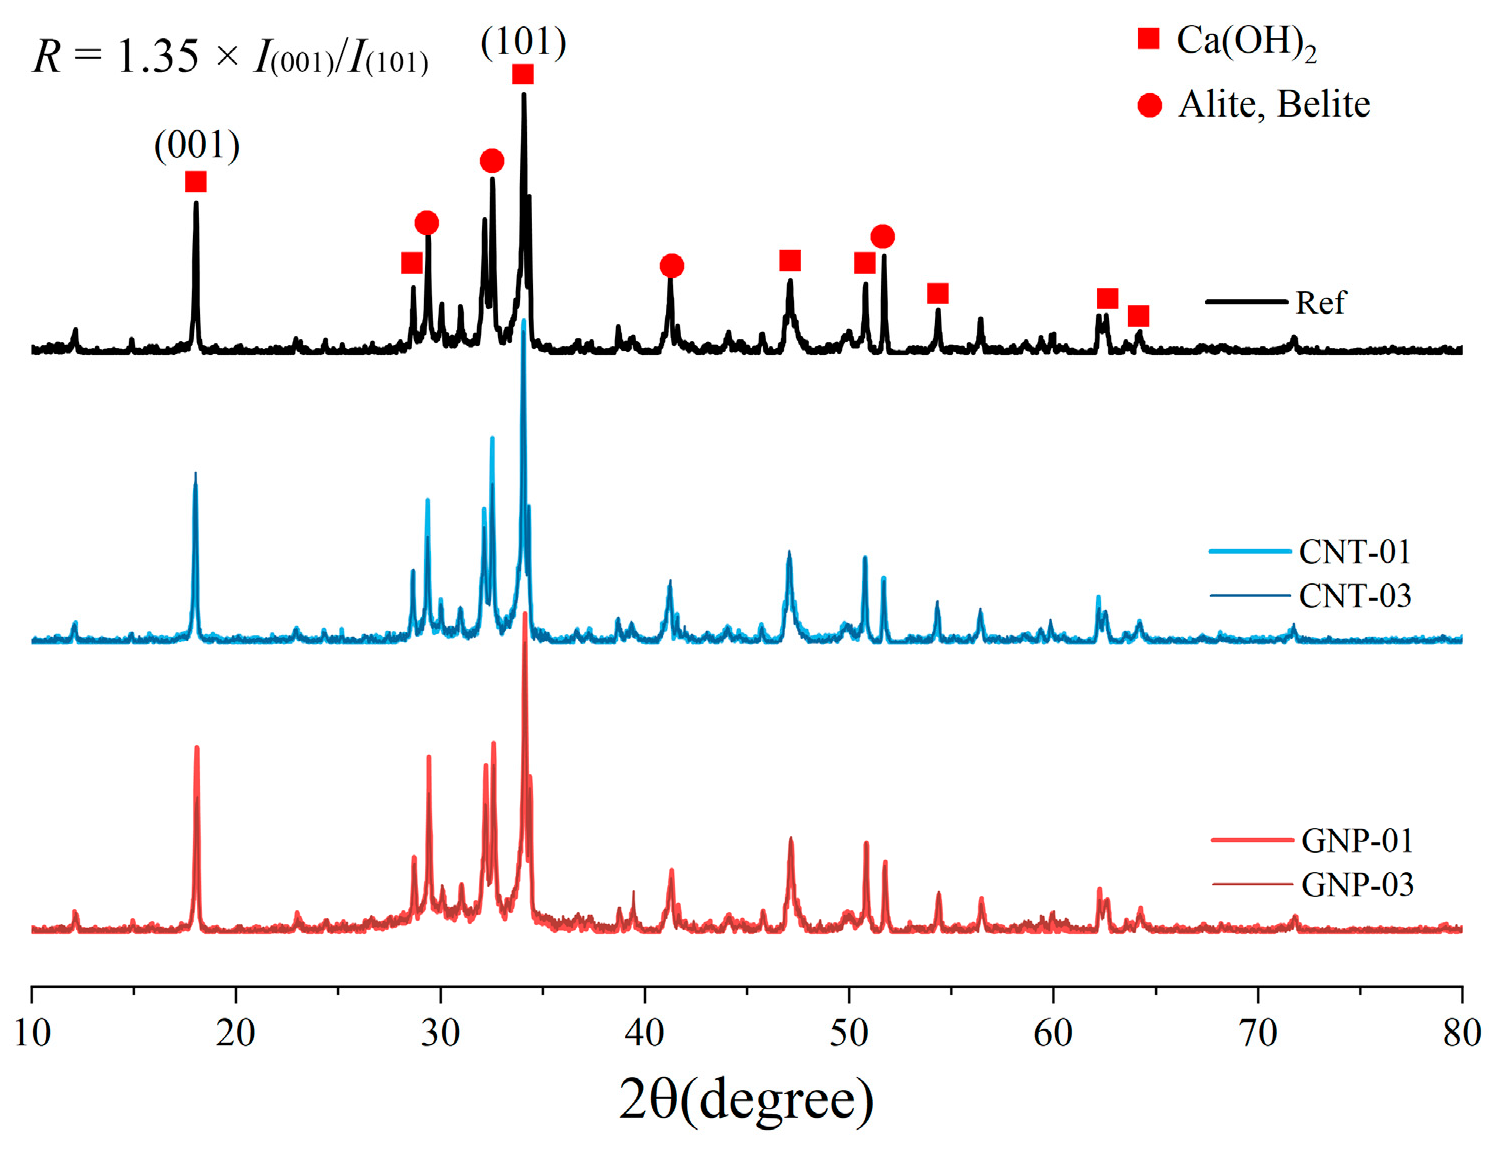
Figure 9 shows the 28-day XRD patterns of graphene cementitious composites. A qualitative analysis of these patterns provides insight into the hydration process. As is typical, the patterns are dominated by sharp diffraction peaks corresponding to residual unhydrated clinker phases (alite, C
3S, and belite, C
2S) and primary crystalline hydration products, mainly calcium hydroxide (Ca(OH)
2, or portlandite) and traces of calcium carbonate (CaCO
3, likely from minor carbonation). The progression of hydration is marked by the gradual consumption of the clinker phases and the simultaneous formation of amorphous C–S–H gel, which is visible as a broad, diffuse halo.
Upon incorporating GNPs and CNTs, a noticeable increase in the Ca(OH)
2 peak intensity is observed relative to the control group. This suggests that the nanocarbons accelerate the hydration of the clinker phases, leading to a greater quantity of crystalline Ca(OH)
2 at 28 days. It is worth noting that no distinct diffraction peaks for GNPs or CNTs were detected, which is expected given their low dosage and is consistent with the previous studies of Horszczaruk et al. [
48].
Ca(OH)
2 typically crystallizes as layered hexagonal plates, and its preferred orientation strongly affects paste mechanics. The influence of GNPs/CNTs on Ca(OH)
2 texture can be assessed via an orientation index derived from XRD data [
49]; lower values generally correlate with a denser microstructure and improved performance [
50,
51]. Thus, the orientation coefficient offers a proxy for the mechanical benefits imparted by GNPs/CNTs. Following Grandet and Ollivier [
52], and using the Ca(OH)
2 (001) plane at 2θ ≈ 18.1° as the reference, the orientation index R for the (101) plane at 2θ ≈ 34.0° is given by Equation (8), as follows:
where
I(001) and
I(101) represent the diffraction peak intensities of Ca(OH)
2 crystals. For randomly oriented crystals,
R = 1; values of
R > 1 indicate preferred orientation, with larger
R reflecting stronger texture and, typically, inferior mechanical performance. As shown in
Figure 10, the orientation coefficient of the reference paste (Ref) is 1.22, whereas the values for CNT-01, CNT-03, GNP-01, and GNP-03 are 1.01, 1.04, 1.16, and 1.10, respectively. These results indicate that appropriate GNP/CNT additions decrease the preferred orientation of Ca(OH)
2 (lower
R), thereby densifying the matrix and improving mechanical properties, consistent with the measured mechanical outcomes.
3.5. Thermogravimetric Analysis (TGA)
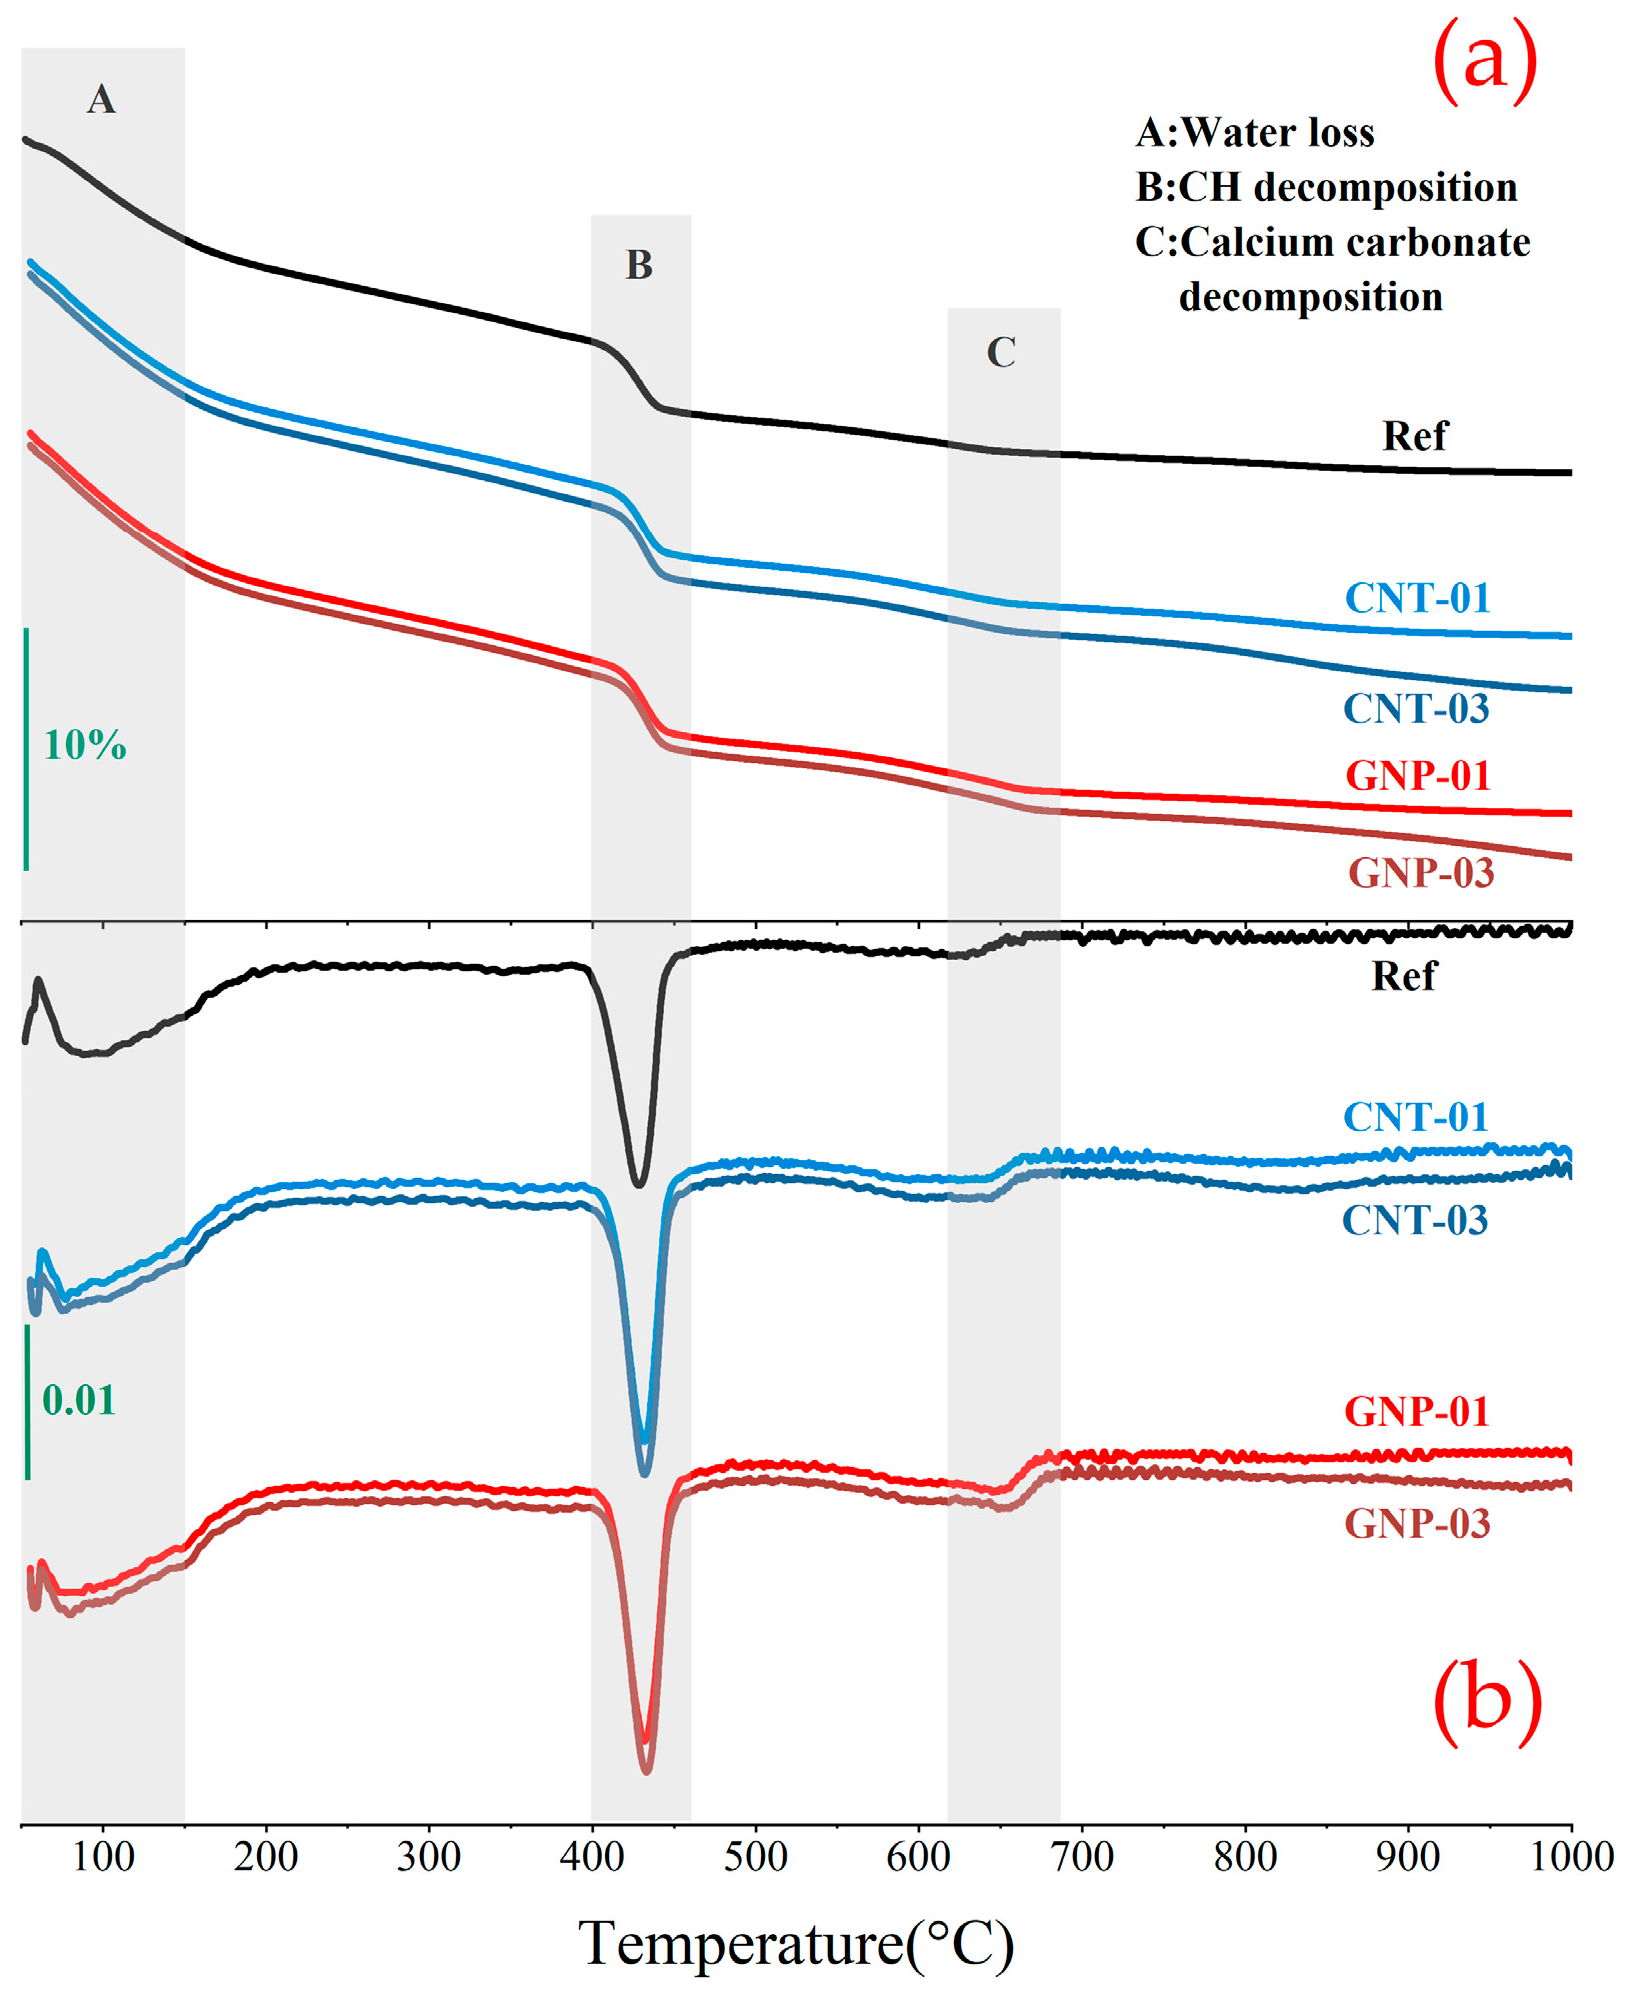
Figure 10 shows the thermogravimetric (TG) curves of GNP/CNT–cementitious composites, exhibiting three distinct mass-loss stages. In cement-based systems, mass loss between 50–100 °C reflects evaporation of pore water and physically adsorbed water, while loss between 105–200 °C is associated with release of crystalline water from minor phases (e.g., gypsum). Despite pre-drying at 60 °C, Stage A still accounts for about 6% mass loss (
Figure 10), largely because interlayer water in C–S–H is difficult to remove completely [
53,
54]. Stage B (400–500 °C) corresponds to the dehydroxylation of portlandite [Ca(OH)
2], and Stage C (625–700 °C) primarily reflects the decarbonation of calcite (CaCO
3) formed by carbonation of a fraction of Ca(OH)
2 and C–S–H [
55].
The degree of cement hydration is directly correlated with the Ca(OH)
2 content at Stage B, and the Ca(OH)
2 content in the cement matrix can be determined using Equation (9), as follows:
where
denotes the mass loss attributable to Ca(OH)
2 within 400–500 °C, and
M500 is the mass at 500 °C. The factor 74/18 converts the mass of released water to the equivalent mass of Ca(OH)
2, corresponding to the molar masses of Ca(OH)
2, where 74 and 18 are the molar masses of Ca(OH)
2 and H
2O, respectively.
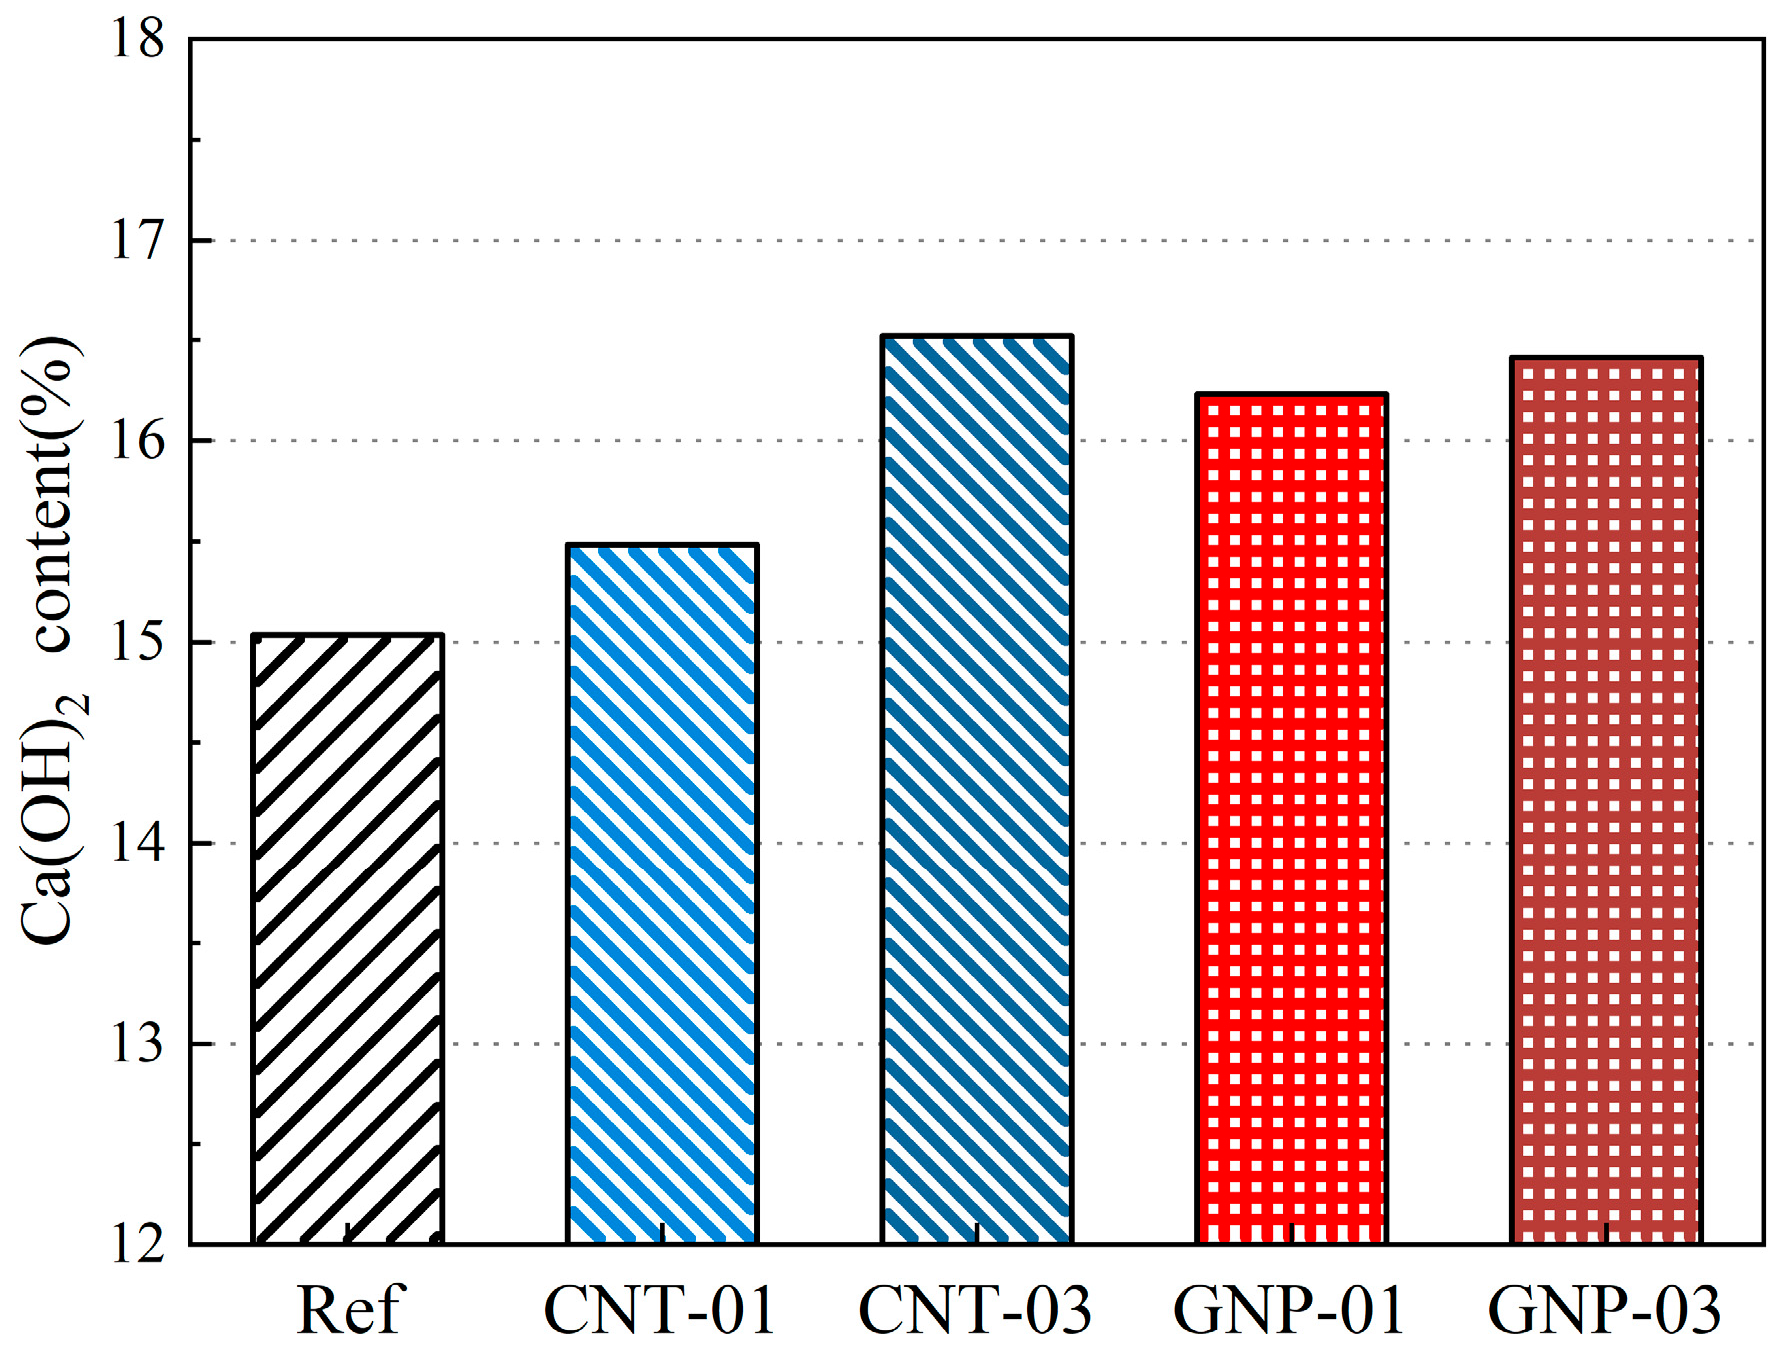
Figure 11 illustrates the percentage content of Ca(OH)
2 at 28 days, revealing that the CNT-03 cementitious composites exhibit the highest degree of hydration. The incorporation of both GNP and CNT enhances cement hydration, which aligns with the XRD results. This effect can be attributed to the ability of carbon nanotubes and graphene nanosheets to provide heterogeneous nucleation sites for the growth of hydration products (see
Figure 7), thereby accelerating the hydration process. These findings are consistent with the results of Fakhim and Abedi [
15,
56], who have reported that an increased degree of hydration improves the mechanical properties of cementitious composites and refines the pore structure of the cement matrix.
As is well-established, C–S–H gel is a predominantly amorphous or poorly crystalline phase. Consequently, in XRD patterns, it does not produce sharp, distinct diffraction peaks but is instead characterized by a broad, diffuse scattering hump, typically observed in the 2θ range of 25–35°. Additionally, the detection of certain phases (such as minor calcite content) by TGA may not correspond directly to XRD observations due to differences in detection limits and sensitivities between the two analytical techniques mentioned above.
3.6. Mechanical Performance
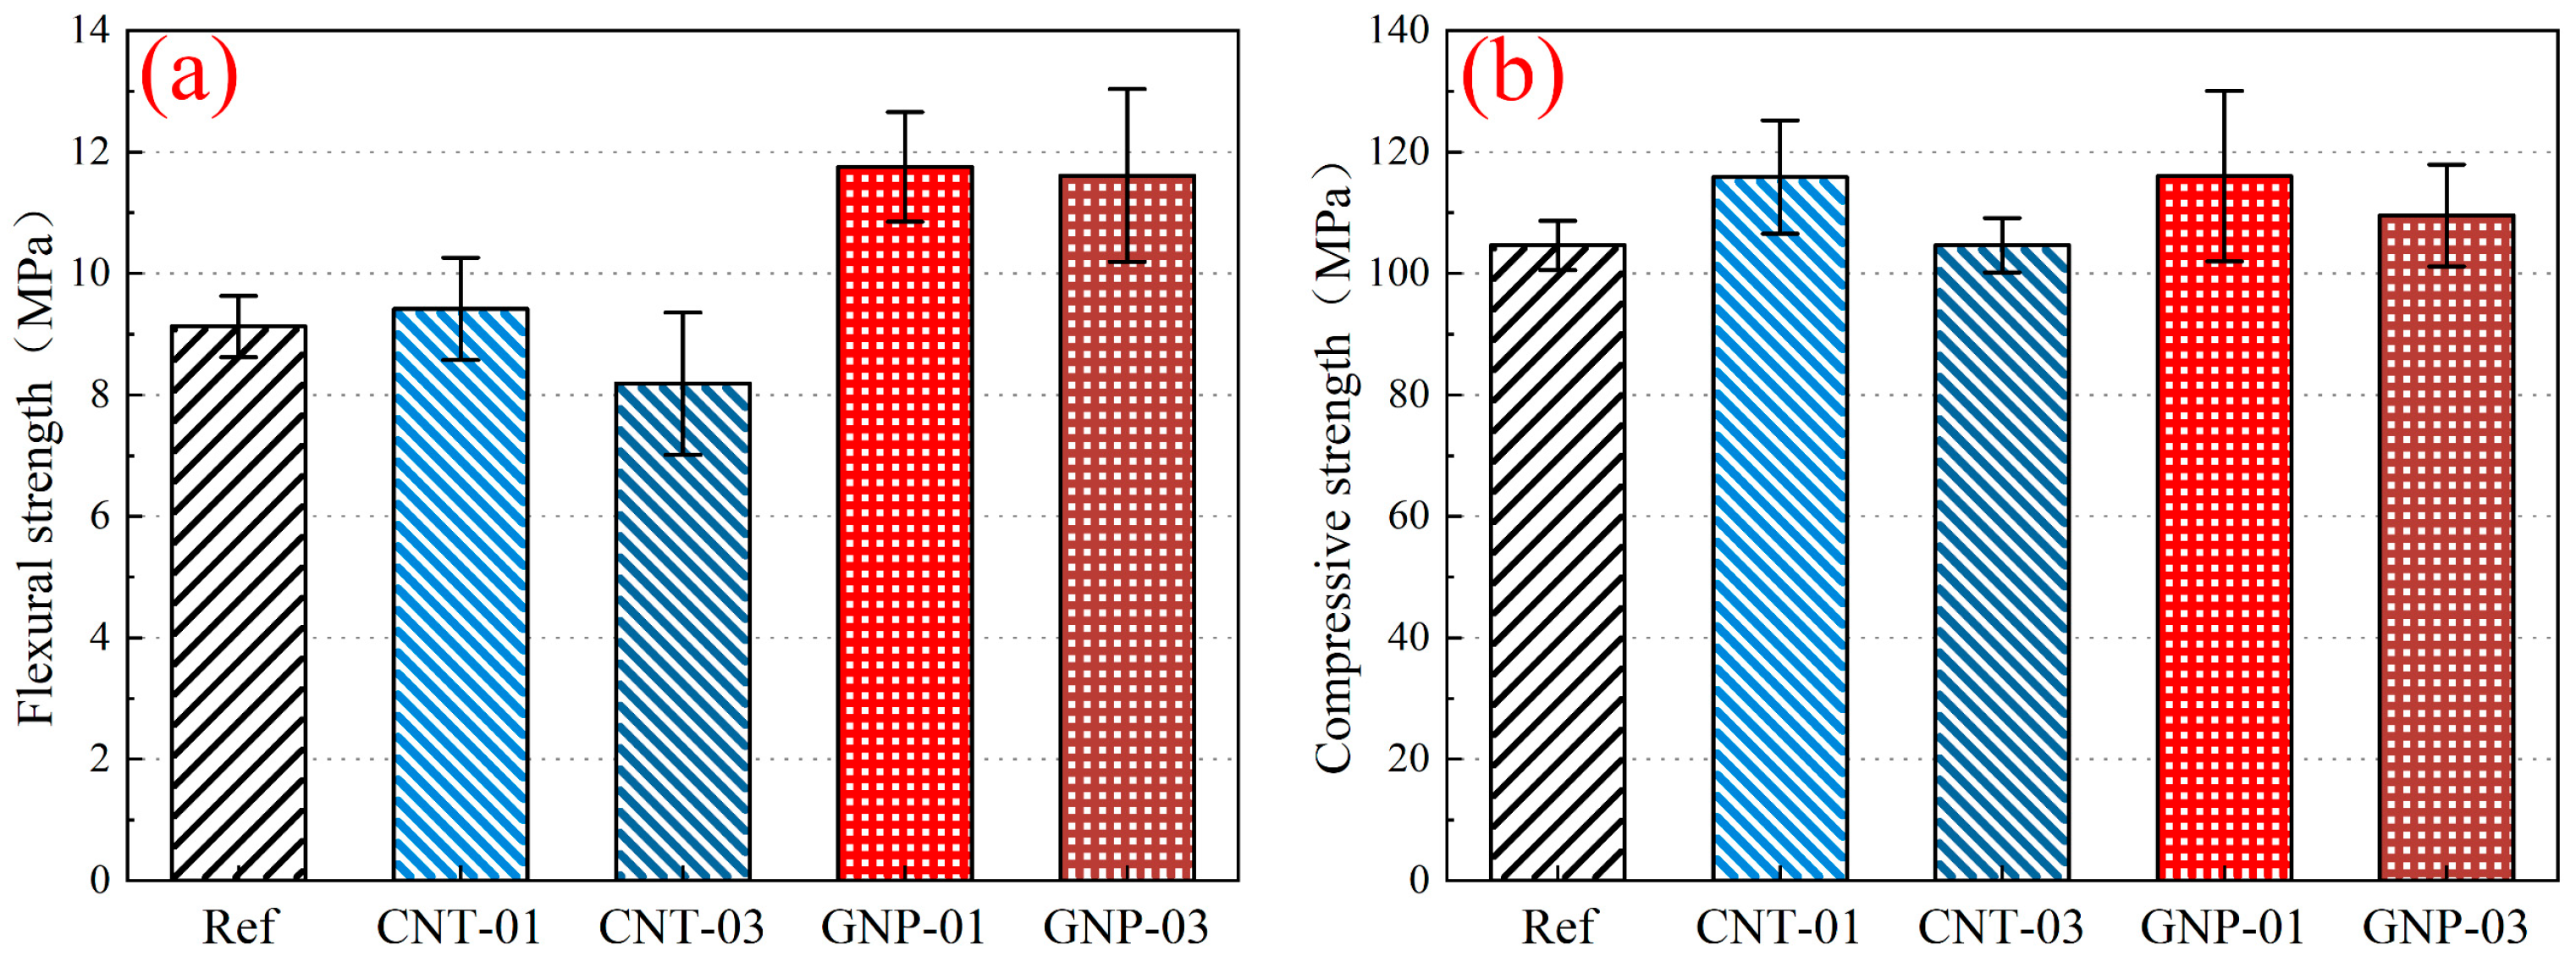
Figure 12 shows the 28-day flexural and compressive strengths of graphene-modified cementitious composites. Relative to the control (flexural: 9.1 MPa; compressive: 104.6 MPa), adding 0.1% CNTs increased flexural strength to 9.4 MPa (+3.3%) and compressive strength to 115.8 MPa (+10.7%), while 0.1% GNPs raised flexural strength to 11.7 MPa (+28.6%) and compressive strength to 116.0 MPa (+10.9%). These enhancements are consistent with Abedi et al. [
15].
The enhancement mechanisms are twofold: physical reinforcement and chemical influence on hydration. However, the final mechanical strength is predominantly governed by the physical mechanisms. The superior performance of GNPs, particularly at the 0.1% dosage, is attributed to their unique 2D plate-like morphology. These well-dispersed flakes are highly effective at deflecting and bridging microcracks, thereby inhibiting crack propagation and enhancing load-transfer efficiency [
57,
58]. From a chemical perspective, the 2D geometry of GNPs also provides superior nucleation sites for C–S–H formation—the primary strength-bearing phase in cement [
59]. In contrast, 1D CNTs promote general bulk hydration, producing more Ca(OH)
2 (a weaker crystalline by-product) without the targeted, dense C–S–H growth observed with GNPs.
Conversely, increasing the dosage to 0.3% (as in CNT-03 and GNP-03) led to decreased strength due to nanomaterial agglomeration, which introduces weak zones and stress concentrations within the matrix. This explains why CNT-03 shows lower strength than GNP-01 despite higher Ca(OH)2 content: the detrimental impact of agglomeration-induced defects outweighs any hydration benefits, and CNTs lack the geometric advantage for efficient C–S–H templating. Therefore, dispersion quality, crack-resistance effectiveness, and preferential C–S–H nucleation are the primary determinants of composite strength.
3.7. Damping Performance
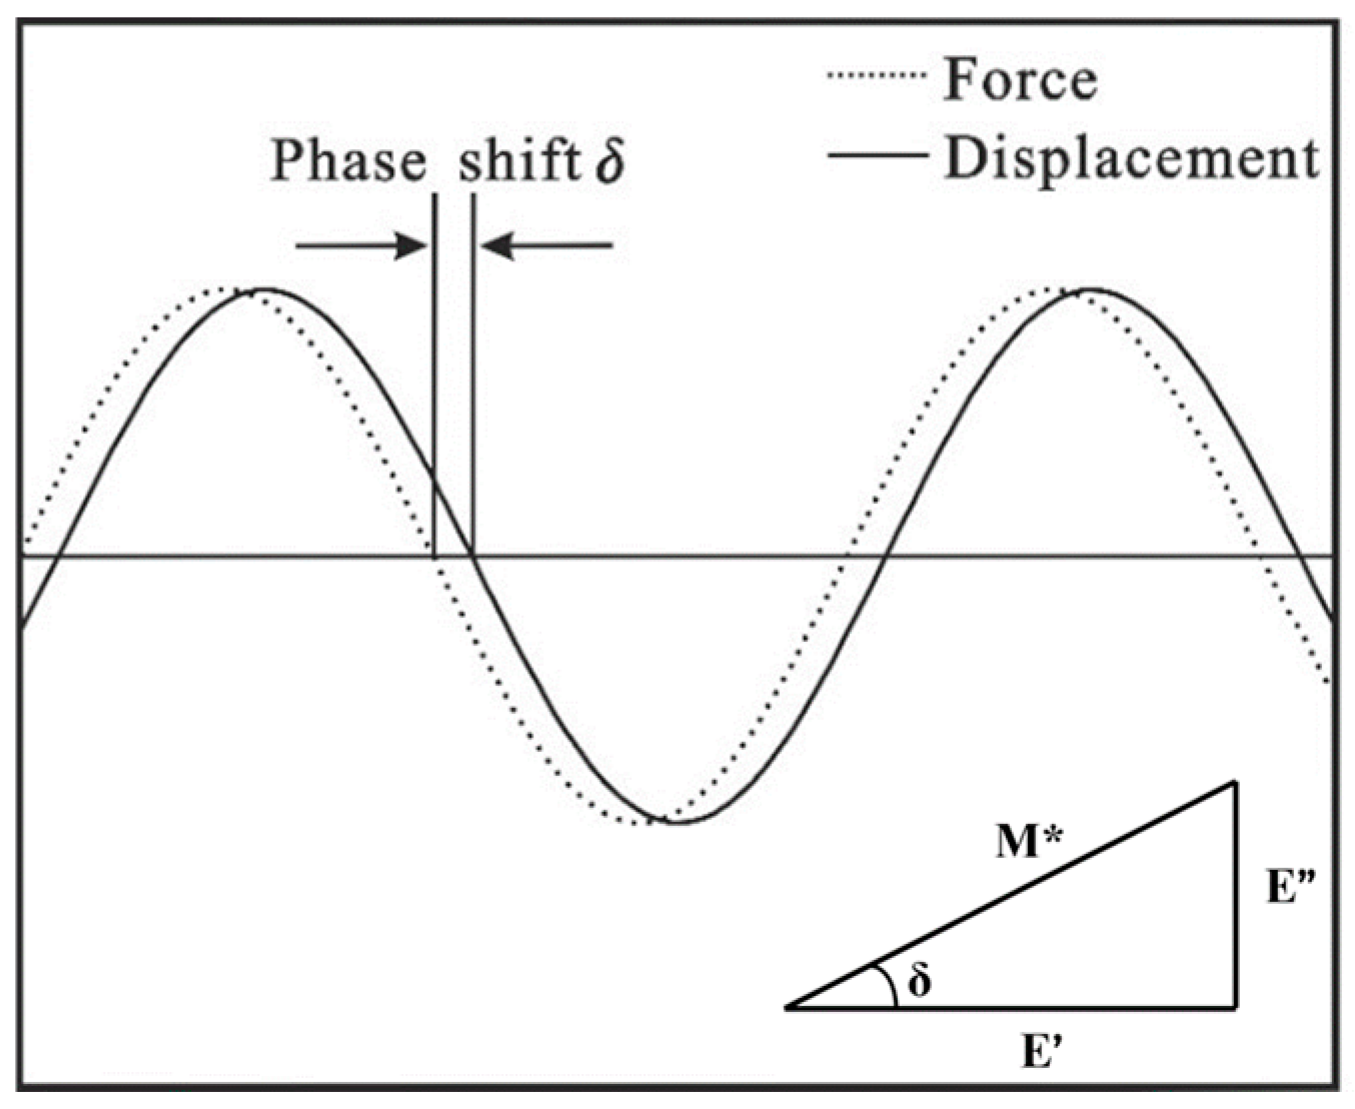
To avoid plastic deformation and fracture, specimens were subjected to low-amplitude harmonic loading. The damping behavior of graphene–cementitious composites was evaluated at frequencies of 0.5–2 Hz under a constant displacement amplitude of 7 μm. Damping performance was characterized by the loss factor (tan δ) and the storage modulus (E′) [
28,
60]. In practice, effective damping requires a high loss factor together with sufficient stiffness (i.e., elevated E′), ensuring both energy dissipation and load-bearing capacity.
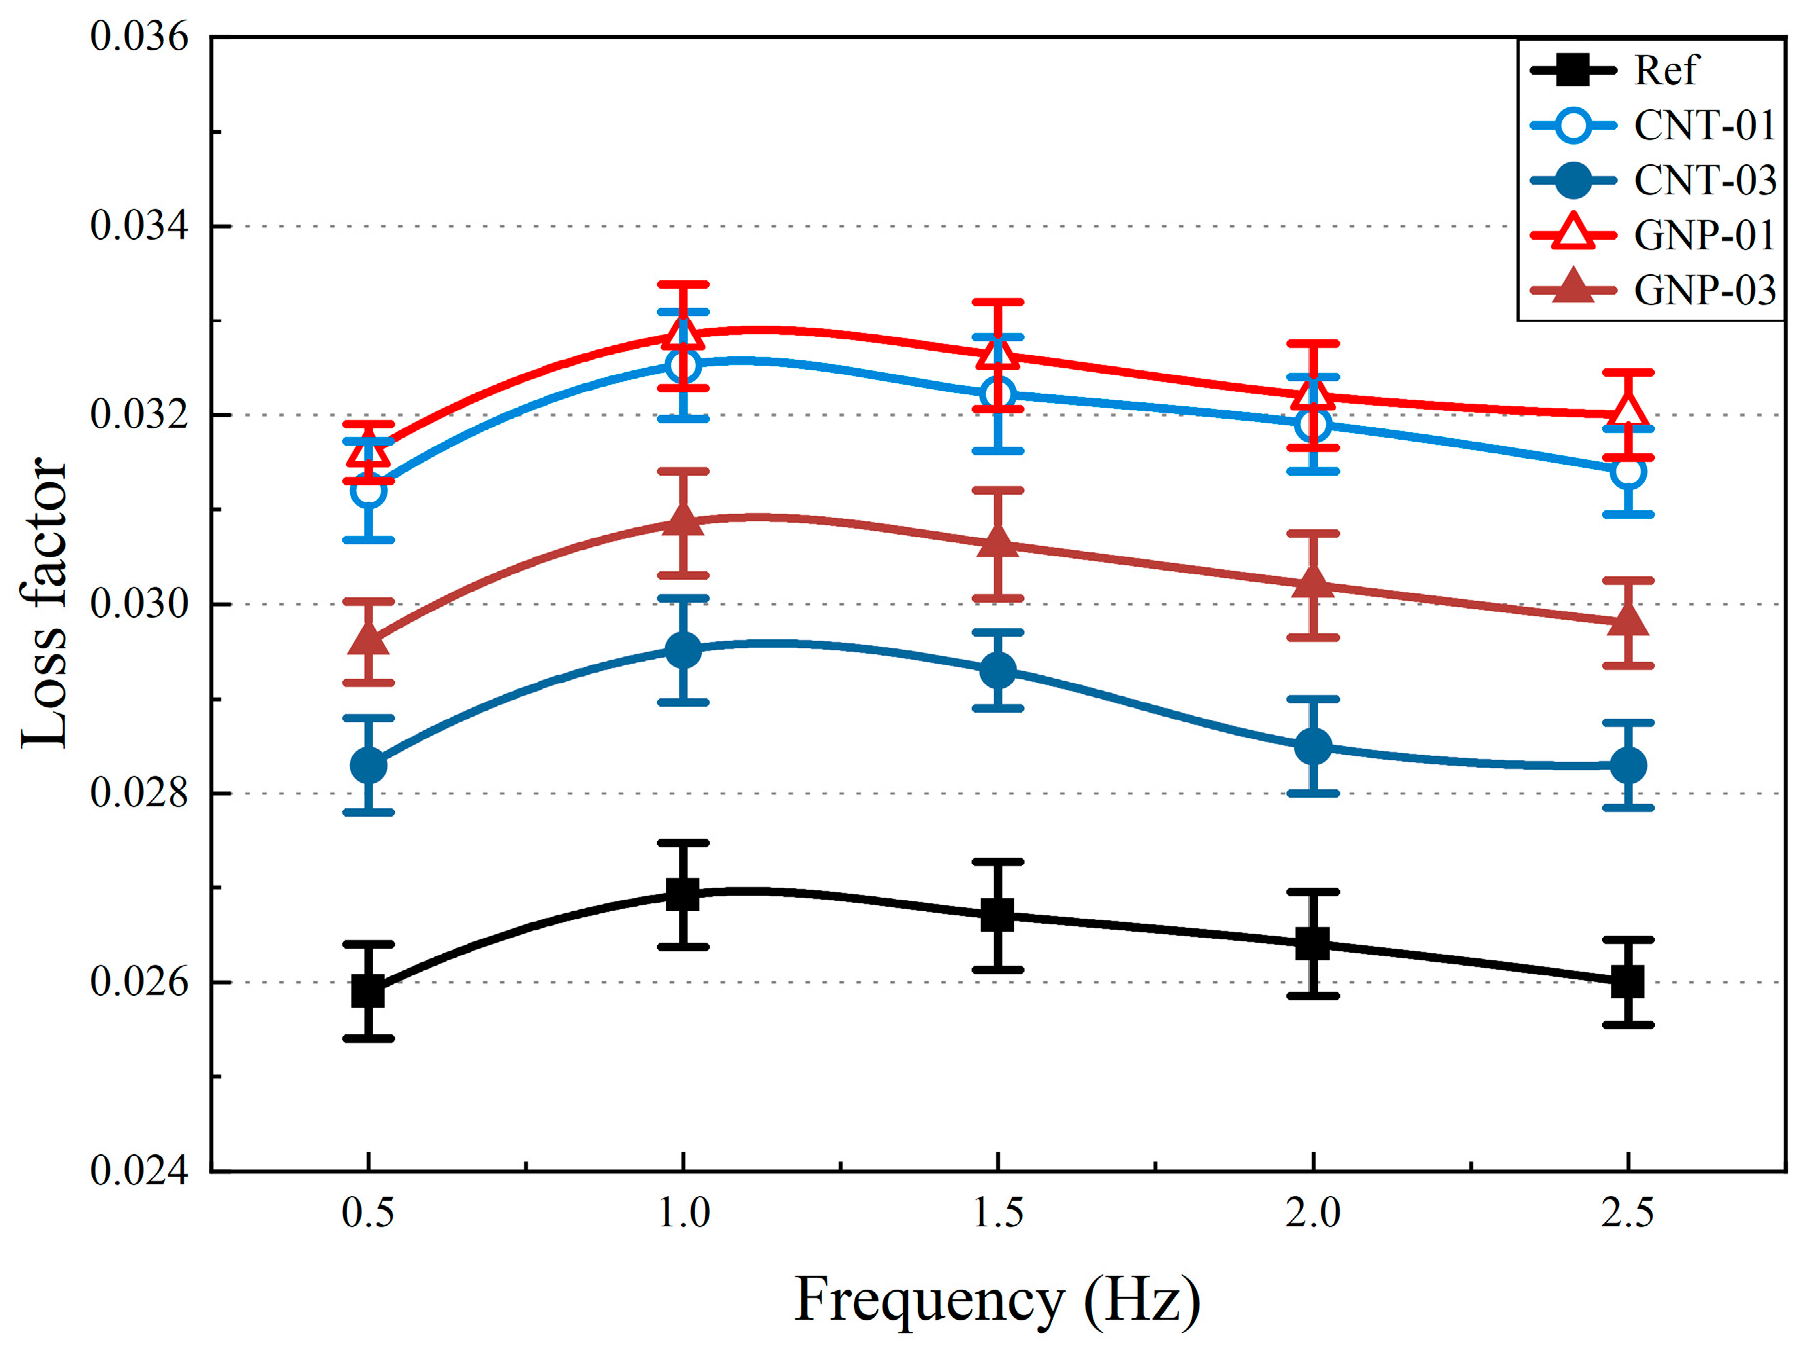
Figure 13 illustrates the frequency dependence of the loss factor tan δ for all composites. A prominent damping peak is observed at 1 Hz across all specimens, after which tan δ gradually decreases. This peak signifies an enhancement in viscoelastic damping due to the nanofillers. At 1 Hz, the loss factor increases by up to 21.9% (GNP-01), 20.8% (CNT-01), 14.5% (GNP-03), and 9.6% (CNT-03), relative to the reference. This behavior is attributed to intrinsic material behavior rather than experimental artifacts. All measurements were conducted within the linear viscoelastic region at a maximum displacement amplitude of 7 μm, and the testing environment was isolated to minimize external interference. The clear composition-dependent variation in peak intensity further rules out systemic artifacts and points to a material-based origin. Consistent with prior work [
61,
62], the enhanced damping arises from energy dissipation via frictional sliding at the nanocarbon–matrix interface and relative motion within the nanostructures themselves (i.e., inter-wall for CNTs and inter-layer for GNPs). These mechanisms convert mechanical work into heat through localized debonding and slip.
The storage modulus (E′)—the elastic energy stored per loading cycle and a close approximation to the dynamic Young’s modulus under small-strain harmonic loading—was measured at 1 Hz (
Figure 14). Compared with the control, incorporating 0.1% GNPs and 0.1% CNTs increased E′ by 11.8% and 5.3%, respectively, indicating that a low nanocarbon dosage effectively stiffens the cement matrix. This enhancement accords with the poroelastic dependence of modulus on microstructure: in porous solids, E′ decreases as porosity increases [
63]. SEM, MIP, TGA, and XRD in this study show that the high specific surface area of GNPs/CNTs provides additional nucleation sites, accelerates hydration, and—together with a filling effect—reduces total porosity and refines the pore network, thereby densifying the matrix and elevating E′. At a higher dosage (0.3%), however, insufficient dispersion leads to agglomeration and defect formation, which increase effective porosity and hinder local hydration; consequently, the storage modulus declines relative to the 0.1% mixes.
3.8. Discussion
The incorporation of GNPs and CNTs increases the loss factor (tan δ), storage modulus (E′), and thus the small-strain damping capacity of graphene–cementitious composites. SEM, MIP, XRD, and TG/DTG analyses indicate the complementary mechanisms:
Damping in fiber-reinforced cementitious materials scales with the number and quality of matrix–fiber interfaces [
64]. Nanoscale GNPs and CNTs introduce orders-of-magnitude more interfacial area than micrometer-scale fibers [
1,
65], enhancing frictional energy dissipation [
66,
67]. Interfacial bonding is decisive. In this study, GNPs/CNTs were not acid-functionalized and thus lacked surface functional groups, weakening chemical and mechanical anchorage to hydration products; interfacial gaps at GNP–cement contacts (
Figure 7d,e) corroborate this. While stronger bonding improves damping [
66], weak chemical/van der Waals/interlocking bonds can be disrupted under vibration, generating additional frictional contacts that dissipate energy [
27]. Under cyclic loading, the dense population of nanocarbon–matrix interfaces functions as the primary locus of frictional loss.
- (2)
Relative slip (debonding and sliding)
The large modulus mismatch between graphene reinforcements (≈1.1 TPa for GNPs; ≈2.1 TPa for CNTs) [
3,
68] and the cement matrix (≈30 GPa) induces interfacial shear and nonuniform stresses under load [
67], promoting local debonding and relative slip. Debonding dissipates substantially more energy than steady interfacial sliding alone [
24]. SEM evidence of CNT pull-out/slip in cement pastes substantiates this pathway [
9]. Post-debonding, sliding friction along GNP surfaces and CNT outer walls under cyclic strain converts mechanical work to heat, enabling stress redistribution and additional energy dissipation.
- (3)
Intrinsic material properties
GNPs and CNTs combine high stiffness with recoverable deformation, facilitating load transfer while accommodating interfacial shear [
1,
65]. Their multilayer architectures enable interwall/interlayer shear (multiwalled CNTs; multilayer GNPs), providing internal friction under dynamic loading [
61,
62]. These intrinsic features further augment vibrational energy dissipation, thereby improving overall damping performance.
- (4)
TGA, MIP, and DMA Correlation
The microstructural changes revealed by XRD provide a strong foundation for understanding the macroscopic dynamic properties. The increased C–S–H formation and higher degree of hydration (from TGA-derived Ca(OH)2 content) directly explain the increase in storage modulus (E′), as more solid binder phase is available to carry load.
Furthermore, the pore structure refinement observed in MIP for the 0.1 wt.% samples correlates well with the enhanced mechanical performance. The reduced Ca(OH)2 orientation (lower R index) in these samples suggests a more tortuous and interlocked microstructure, which restricts pore connectivity and contributes to both higher stiffness and more effective energy dissipation pathways.
The superior damping capacity (tan δ) of the GNP samples, especially at 0.1 wt.%, can be attributed to the following two primary mechanisms now supported by evidence: (1) increased interfacial friction and slip between the large-surface-area GNP sheets and the surrounding C–S–H matrix, and (2) potential energy dissipation from friction between adjacent, overlapping GNP layers. CNTs, with their lower surface area and different geometry, offer fewer slip planes, resulting in a less pronounced damping enhancement. At 0.3 wt.%, the agglomeration of nanoparticles (seen in SEM and inferred from MIP pore coarsening) creates stress concentrations and voids, which compromise the matrix’s integrity and reduce the efficiency of interfacial load transfer and energy dissipation, explaining the drop in both E′ and tan δ compared with the 0.1 wt.% optimum.


