Article

Lifecycle Assessment of Seismic Resilience and Economic Losses for Continuous Girder Bridges in Chloride-Induced Corrosion

by
Ganghui Peng
1,2,*,
Guowen Yao
1,*,
Hongyu Jia
3,
Shixiong Zheng
3 and
Yun Yao
2
1
School of Civil Engineering, Chongqing Jiaotong University, Chongqing 400074, China
2
The Engineering & Technical College of Chengdu University of Technology, Leshan 614000, China
3
School of Civil Engineering, Southwest Jiaotong University, Chengdu 610031, China
*
Authors to whom correspondence should be addressed.
Buildings 2025, 15(18), 3315; https://doi.org/10.3390/buildings15183315
Submission received: 9 July 2025 / Revised: 6 August 2025 / Accepted: 10 September 2025 / Published: 12 September 2025
(This article belongs to the Section Building Structures)

Abstract

This study develops a computational framework for the simultaneous quantification of seismic resilience and economic losses in corrosion-affected coastal continuous girder bridges. The proposed model integrates adjustment factors to reflect delays in post-earthquake repairs and cost increments caused by progressive material degradation. Finite element methods and nonlinear dynamic time-history simulations were conducted on an existing coastal continuous girder bridge to validate the proposed model. The key innovation lies in a probability-weighted resilience index incorporating damage state occurrence probabilities, which overcomes the computational inefficiency of traditional recovery function approaches. Key findings demonstrate that chloride exposure duration exhibits a statistically significant positive association with earthquake-induced structural failure probabilities. Sensitivity analysis reveals two critical patterns: (1) a 0.3 g PGA increase causes a 11.4–18.2% reduction in the resilience index (RI), and (2) every ten-year extension of corrosion exposure decreases RI by 2.7–6.2%, confirming seismic intensity’s predominant role compared to material deterioration. The refined assessment approach reduces computational deviation to ±2.4%, relative to conventional recovery function methods. Economic analysis indicates that chloride-induced aging generates incremental indirect losses ranging from $58,000 to $108,000 per decade, illustrating compounding post-disaster socioeconomic consequences. This work systematically bridges corrosion-dependent structural vulnerabilities with long-term fiscal implications, providing decision-support tools for coastal continuous girder bridges’ maintenance planning.

1. Introduction

The structural integrity of reinforced concrete bridges under seismic loading is significantly diminished by corrosion effects. Extended service periods in aggressive environments exacerbate multiple failure risks, including compromised load-bearing capacity, operational disruptions, and heightened susceptibility to collapse, accompanied by considerable long-term financial burdens [1]. Particularly detrimental is the chloride attack on embedded steel reinforcement, which initiates and propagates deleterious processes that dramatically reduce service life expectancy. Industry reports estimate worldwide maintenance costs for corrosion-affected concrete infrastructure at approximately $100 billion per annum, underscoring the necessity for improved evaluation techniques [2]. Supporting evidence comes from ASCE’s (American Society of Civil Engineers) 2013 nationwide survey, revealing that over 66,000 of the inspected 600,000 bridge spans exhibited diminished earthquake resistance attributable to chloride infiltration [2,3].
The field of bridge seismic engineering has undergone a significant transformation in recent years, with modern research prioritizing design strategies that facilitate post-earthquake repairability and improve structural damage tolerance, as evidenced by numerous studies in leading journals [4,5,6,7]. These seismic resilience evaluation systems have proven their effectiveness at different analytical levels, from discrete structural elements to entire transportation networks [8,9,10,11,12]. In this context, fragility curve analysis has become a cornerstone technique for quantifying bridge behavior during earthquakes [13]. Recent years have witnessed significant methodological advancements in this research domain, as evidenced by several pioneering analytical approaches developed by scholars. Vishwanath et al. [14] established nonlinear dynamic simulation techniques that correlated structural failure probabilities with seismic intensity measures, while Pang et al. [15] developed lifecycle-oriented probabilistic models addressing concurrent deterioration processes in suspension systems. Motlagh et al. [16] contributed mathematical formulations for predicting time-dependent structural capacity considering concrete carbonation effects, and Dong et al. [17] proposed performance-based sustainability evaluation frameworks incorporating degradation processes. Additionally, Biondini et al. [18] created reliability assessment systems for structures in aggressive environments, and Nettis et al. [19] investigated the vulnerability of an existing prestressed concrete girder bridge under the combined effects of traffic loading and corrosion. Their study proposed an effective technical framework for conducting reliable probabilistic assessments of prestressed concrete girder bridges. These methodological breakthroughs have collectively advanced the field’s analytical capabilities.
Extensive research has established that corrosive processes markedly degrade the earthquake-resistant capacity of bridge structures. Despite this recognition, current methodologies rarely utilize advanced damage-tolerant evaluation techniques specifically tailored for chloride-affected bridge systems. Our work introduces an innovative assessment framework that integrates: (1) performance-oriented verification parameters for structural vulnerability evaluation, and (2) probabilistic econometric modeling to characterize long-term financial impacts resulting from chloride-related deterioration mechanisms.

2. Probabilistic Modeling of Deterioration

The deterioration mechanism initiates with chloride ion diffusion through the concrete matrix, compromising the passive protection layer and reaching the embedded steel reinforcement. This electrochemical process accelerates material degradation through oxidative reactions. Such corrosion phenomena in reinforced concrete elements pose substantial threats to load-bearing capacity and structural safety margins. Consequently, incorporating corrosion progression models into bridge service life assessments has become a critical component of comprehensive performance evaluations [20,21].

2.1. Diffusion Process

The predominant pathway for chloride ion ingress in concrete bridge components during service life occurs through diffusion processes, making the accurate determination of chloride diffusion coefficients in concrete critically important [22]. Existing research suggests that Fick’s second law of diffusion provides a fundamental theoretical basis for modeling chloride penetration in cementitious materials [23], as shown in Equation (1). While Collepardi [24] pioneered an early transport model for chloride migration, subsequent refinements by the Duracrete project [25,26] improved predictive accuracy through modified formulations. The latter model enhances chloride diffusion modeling by incorporating time-variant diffusion properties, material characteristics, environmental factors, and other key parameters. The chloride concentration at depth x below the concrete surface at time t is given by Equation (2):
C ( x , t ) t = D c 2 C ( x , t ) x 2
C ( x , t ) = C s 1 e r f x 2 D 0 k e k c k t t 0 n t 1 n
where Dc is the chloride diffusivity coefficient; C(x,t) is the concentration of chlorides at the depth x and time t; Cs represents the chloride concentration at the concrete surface; erf (·) is the error function, e r f ( z ) = 2 / π 0 z exp ( θ 2 ) d θ . D0 denotes the reference chloride diffusion coefficient when the age of concrete is taken as 28 days; ke is the correction coefficient of environmental influence; kc represents the correction coefficient of maintenance conditions; kt denotes the correction coefficient of the test method and t0 represents the concrete age.

2.2. Corrosion of Reinforcing Steel

As chloride ions progressively migrate through the concrete matrix, their accumulation at the steel–concrete interface reaches critical levels. Corrosion initiation occurs when the localized chloride content exceeds the critical threshold concentration (Ccr). The time-to-corrosion onset for embedded reinforcement can be determined using the analytical expression provided in Equation (3) [25,26]:
T c o r = d c 2 D 0 k e k c k t t 0 n e r f 1 C s C c r C s 2 1 1 n
For the fluctuation of yield stress with time for steel bars subjected to chloride attack, Du et al. [27] presented the equation shown below:
f y = ( 1.0 β y Q c o r ) f y 0
Q c o r = 4 x c o r r d s 0 1 x c o r r d s 0
x c o r r = 0.5204 ( 1 w / c ) 1.64 d c t 0.71
where fy denotes the yield strength of the rusted reinforcement, fy0 is the initial yield stress of the reinforcement, Qcorr represents the ratio of the reduced mass of the reinforcement to the initial mass, ds0 denotes the diameter of the uncorroded reinforcement, xcorr is the depth of erosion, dc is the thickness of the concrete protective layer, w/c denotes the water-cement ratio, and t represents the time during which the reinforcement is eroded.

3. Seismic Fragility Analysis of Bridges

The evaluation of bridge lifecycle seismic resilience necessitates the prior execution of seismic fragility analysis, as illustrated in Figure 1. Analytical fragility assessment methodologies overcome the constraints of empirical approaches in regions with scarce seismic activity and limited damage records by systematically evaluating structural seismic performance [28,29]. These theoretical frameworks employ probabilistic seismic demand analysis (PSDA) principles, particularly through linear regression techniques, to establish correlation models between engineering demand parameters (EDPs) and ground motion intensity measures (IMs). The methodology involves subjecting structural models to diverse seismic excitations to characterize their dynamic response characteristics [30]. Based on this work, Cornell et al. [31] established a probabilistic correlation between structural demand parameters and seismic intensity measures, expressed mathematically in Equation (7). When structural capacity is modeled as a lognormally distributed random variable, the conditional failure probability can be derived as shown in Equation (8).
ln (Sd) = a + b ln (PGA)
P f = P ( D I L S   |   I M ) = Φ ln ( S d ) ln ( S c ) β c 2 + β d 2
In this formulation, the terms a and b correspond to regression coefficients derived from statistical analysis; Sd indicates the structural demand, which correlates with the damage index (DI); while βc and βd represent the logarithmic standard deviations of structural capacity and seismic demand, respectively; and Sc refers to the structural capacity associated with the limit state (LS). This relationship holds when peak ground acceleration (PGA) is employed as the IM, β c 2 + β d 2 = 0.5 [32].
A critical step in structural reliability assessment involves determining the system failure probability through multivariate probability analysis of constituent components under defined limit states. Following the development of component-level fragility functions, system reliability can be efficiently evaluated using first-order approximation methods [33]. The conditional probability of the bridge system reaching the i-th damage state threshold may be mathematically represented as:
max i = 1 n [ P i ] P s y s 1 i = 1 n [ 1 P i ]
In this context, Psys refers to the probability of system failure, and Pi indicates the damage probability of the i’s component. Research has shown that structural vulnerability estimates based on parallel connectivity assumptions exhibit strong agreement with Monte Carlo simulation results [34]. Given the fragility curve and IM of a component or system, the occurrence probability of the i-th damage state can be expressed as:
P D S , i = 1 P s y s , i   ( i = 0 ) P s y s , i P s y s , i + 1 ( i = 1 , 2 , n 1 ) P s y s , i ( i = n )
Here, Psys,i represents the probability of system failure under the i-th damage state.

4. Seismic Resilience Assessment

4.1. Definition of Resilience

Seismic resilience serves as a fundamental metric for assessing bridge performance under earthquake loading, providing critical insights into structural integrity, post-event operational recovery, and risk-informed management strategies. A key aspect of this evaluation involves quantifying functional degradation, where bridge operability is numerically characterized using a normalized index ranging from complete dysfunction (0) to full operational capacity (1), representing the structure’s traffic serviceability.
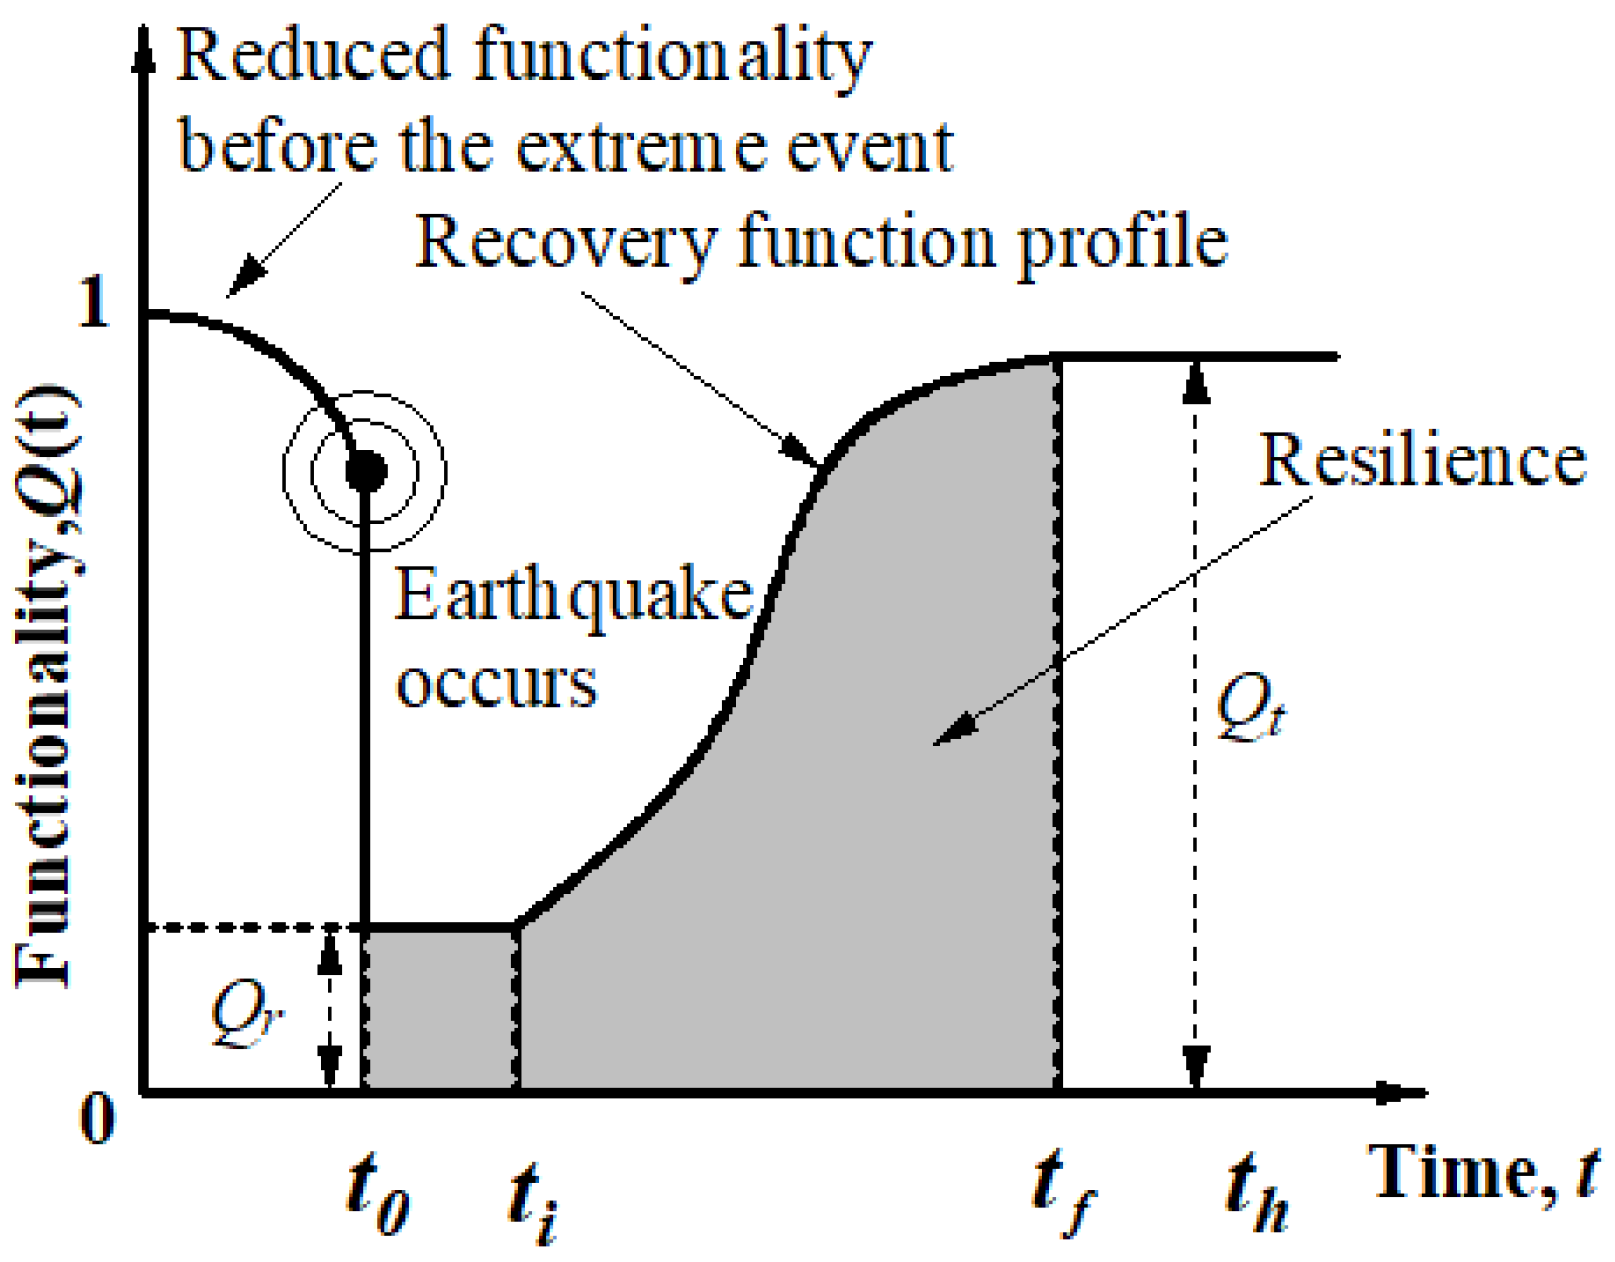
Figure 2 illustrates the characteristic response of bridge functionality following seismic damage, showing an abrupt reduction in operational performance to significantly diminished levels. During the rehabilitation phase, structural capacity progressively improves through systematic repair and strengthening interventions until full serviceability is restored. This time-dependent recovery process is mathematically described by the recovery functionality Q(t), where the integral area between the performance curve and the coordinate axes quantifies the system’s seismic resilience. The resilience metric can be computed using the following formulation [5,10,18,35]:
R = 1 t h t 0 t 0 t h Q ( t )     d t
where t0 denotes the timing of an extreme event; th represents the examined time point; Q(t) is the recovery functionality; ti represents post-earthquake repair initiation time; ti represents a specific time point during the rehabilitation period; Qr denotes post-earthquake residual functionality; Qt is target functionality at the end of recovery time tf.

4.2. Time-Variant Seismic Capacity and Functionality

Structural performance inevitably degrades throughout service life as a consequence of environmental exposure, mechanical loading, and progressive material deterioration. Figure 3 demonstrates how chloride penetration significantly compromises structural functionality through progressive damage accumulation. This research incorporates time-variant performance degradation caused by chloride ingress, enhancing resilience assessment accuracy within coupled corrosion-seismic scenarios. The developed framework introduces a critical improvement over traditional approaches by considering functionality degradation before seismic events. Whereas standard methods presume constant structural capacity before earthquakes, the model explicitly incorporates the gradual weakening of seismic performance that occurs during the pre-hazard period. This pre-event capacity loss stems from the complex interaction between a structure’s physical condition and its operational performance capabilities. The total functionality reduction is quantified as follows:
F l o s s = F i C l + P D S , i R i
where Floss denotes the total functionality loss; Fi represents the functional loss corresponding to different damage limit states; Cl represents the seismic capacity loss of pier corresponding to different damage limit states; FiCl represents pre-seismic functional loss; PDS,i represents the probability of occurrence for the i-th damage state; Ri represents the functionality loss ratio corresponding to damage states, and PDS,i Ri denotes post-seismic functional loss. For instances of slight, moderate, severe, and complete damage, the functionality loss ratio Ri is assigned values of 0.03, 0.08, 0.25, and 1.0, respectively [36], and the functional loss indicator Fi adopts quantified gradients of 0.03, 0.25, 0.75, and 1.0, respectively [37].

4.3. Recovery Functionality

The temporal restoration of bridge operational capacity exhibits strong dependence on structural damage severity. This investigation adopts an established analytical approach, implementing Gaussian cumulative distribution functions derived from post-seismic evaluations of coastal highway bridges. The methodology specifically addresses functionality quantification under chloride exposure conditions, accounting for the heightened rehabilitation complexity associated with corrosion-induced pier damage in marine environments [38,39]:
F R i ( t ) = 1 2 1 + e r f t μ i θ t 2 σ i
θ t = λ t η 10
In this formulation, FRi (t) indicates the functional recovery level of the bridge system under the i-th damage state; μi and σi correspond to the mean and standard deviation, respectively, governing the recovery time for the specified damage state. The term θt refers to a repair amplification factor accounting for chloride-induced corrosion, while λt represents a time escalation coefficient for restoration following corrosion repairs, assigned a value of 1.1 based on current rehabilitation efficacy—a value expected to decrease as remediation technologies advance. The variable η signifies the duration of chloride exposure (years).
Given the probabilistic distribution of potential damage states and corresponding system performance metrics, the time-dependent operational capacity Q(t) of the bridge system can be mathematically expressed as follows:
Q ( t ) = i = 1 n F R i ( t ) P s y s , i

4.4. Resilience Improvement

Section 4.3 presents the precise calculation of resilience indices through restoration function analysis, though computational demands limited practical implementation. To enhance applicability, we developed an efficient computational framework incorporating normalized structural recovery models to simulate post-seismic bridge functionality evolution [40], as illustrated in Equation (16).
Q ( τ ) = Q r + H ( τ ) r f ( τ ) ( Q t Q r )
in which τ = normalized time; Qr = residual functionality at the initial time ti; Qt = target functionality at the end of recovery time tf; H (τ) = Heaviside unit step function; and rf(τ) = recovery functionality.
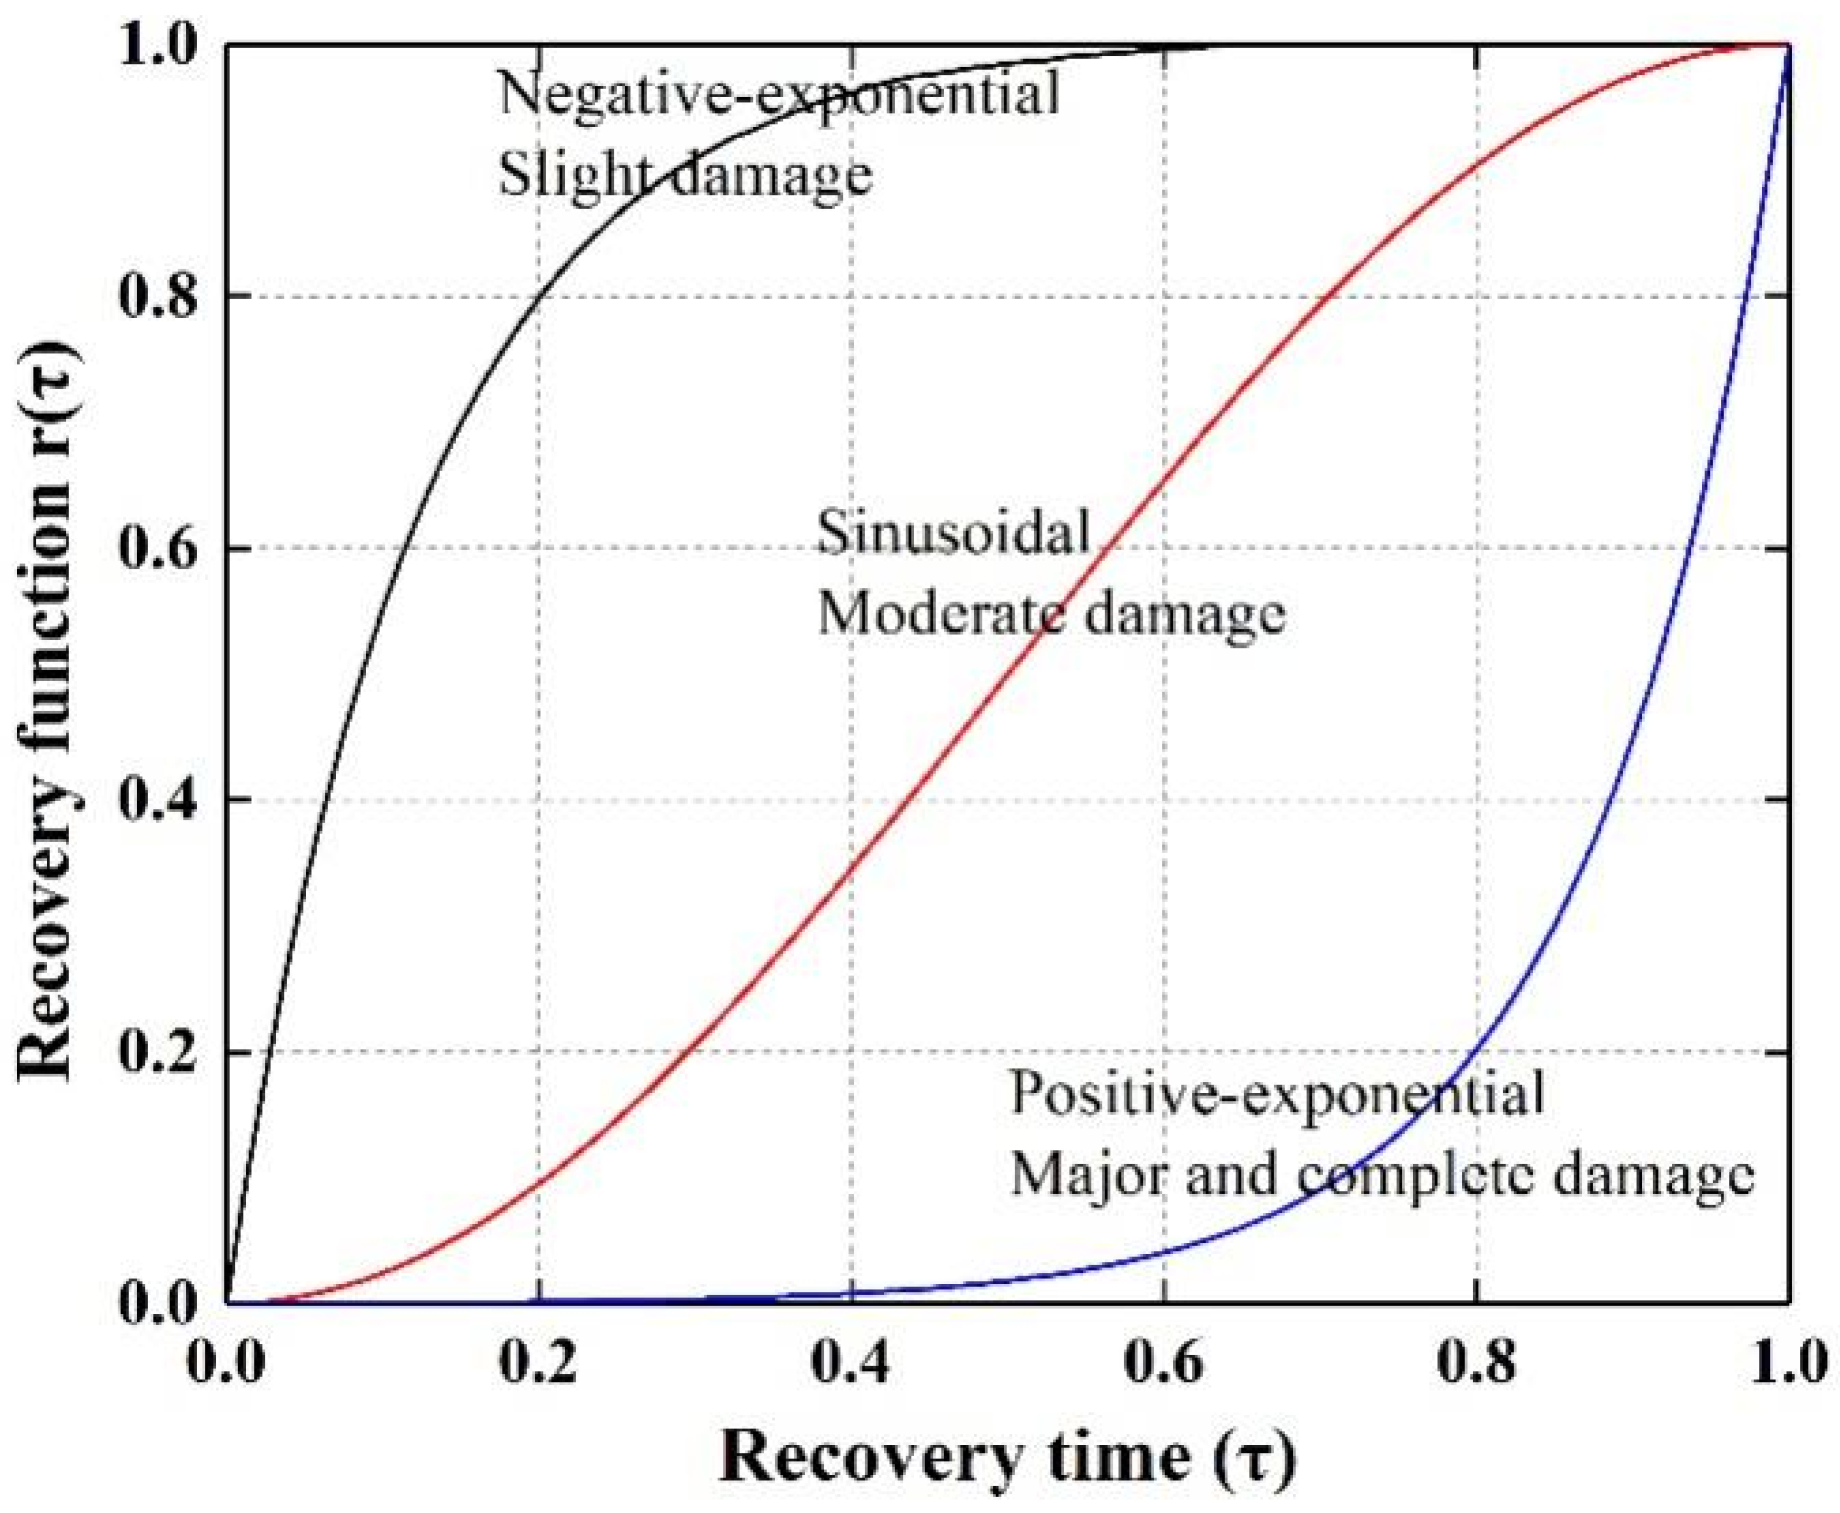
Post-earthquake rehabilitation strategies should be implemented according to damage severity and predefined recovery protocols [41]. The proposed framework activates three distinct restoration modes corresponding to identified damage levels [18,40], as demonstrated in Figure 4 and mathematically represented in Equation (17).
r f ( τ ) = 1 e w τ , negative - exponential r f ( τ ) = 1 cos ( π τ ) 2 , sinusoidal r f ( τ ) = e w ( 1 τ ) , positive - exponential
Three distinct restoration models (exponential, linear, and triangular formulations) were systematically developed with well-defined parametric configurations. Each formulation corresponds to specific damage severity levels: exponential for minor damage, linear for moderate damage, and triangular for extensive damage. While individual function application may lead to estimation errors, incorporating probabilistic failure analysis effectively addresses these uncertainties. The proposed methodology advances bridge resilience assessment through probabilistic integration, where resilience indices for different damage conditions are weighted by their occurrence probabilities, as mathematically expressed in Equation (18).
R = P D S , i R i
where Ri denotes seismic resilience metrics for categorized recovery functions.

5. Economic Loss Assessment

Bridge-related economic losses comprise both direct and indirect components. While maintenance costs for standard bridges primarily depend on their classification system, structures suffering from chloride-induced corrosion typically incur significantly higher upkeep expenditures. As a result, maintenance costs for chloride-damaged piers require distinct assessment [42,43]. This principle suggests that the direct economic impact of chloride-affected bridges can be quantified using the following equation:
C R E P = C 1 i = 1 n j = 1 4 β j P i , j A i θ c + C 2 k = 1 m j = 1 4 β j P k , j
θ c = λ c η 10
where βj represents the ratio of maintenance costs for the j-th damage state, and is assigned values of 0.1, 0.3, 0.75, and 1.0 for slight, moderate, major, and complete damage states, respectively. Refer to Table 1 for the definitions of the remaining parameters in Equations (19) and (20).
Structural damage in a continuous girder bridge compromises its operational integrity, leading to capacity degradation. This necessitates speed restrictions and a reduced vehicle quota, imposing detours for excess traffic. This leads to indirect economic losses in the form of operational and time-related costs. The computation of associated costs requires quantification of traffic volume on the structurally compromised bridge. This entails deriving the traffic rate coefficient, Tp(t), expressed as the ratio of allowable traffic flow on the degraded structure to the mean daily traffic (MDT) of the undamaged bridge, contingent upon the operational state of the bridge [43]:
T p ( t ) = 1         0.9 < Q ( t ) 0.75 0.6 < Q ( t ) 0.9 0.5     0.4 < Q ( t ) 0.6 0.25 0.1 < Q ( t ) 0.4 0       Q ( t ) 0.1
Parameters for Equations (21)–(24) are provided in Table 1.
The implementation of detours necessitates that vehicles (e.g., passenger cars and freight trucks) incur additional travel distance, which in turn generates quantifiable daily operational expenditures, calculated as follows [42,43]:
C R U N ( t ) = c c a r 1 T 100 + c t r u c k T 100 L d [ 1 T p ( t ) ] M D T
Detour routing and mandatory reduced-speed crossings impose prolonged travel time on light- and heavy-duty vehicles, thereby generating a quantifiable daily time cost formulated as [42,43]:
C T I M E ( t ) = c s c d o c a r 1 T 100 + c s t d o t r u c k T 100 [ 1 T p ( t ) ] M D T L d S d e + T p ( t ) M D T L l S d a L l S 0
The aggregate financial impact is derived by consolidating all direct and indirect economic consequences, yielding the following expression [42,43]:
C T O T A L = C R E P + t = 1 t r e c C R U N ( t ) + C T I M E ( t )

6. Example Bridge and Selection of Ground Motions

6.1. Finite Element Analysis of a Representative Bridge Structure

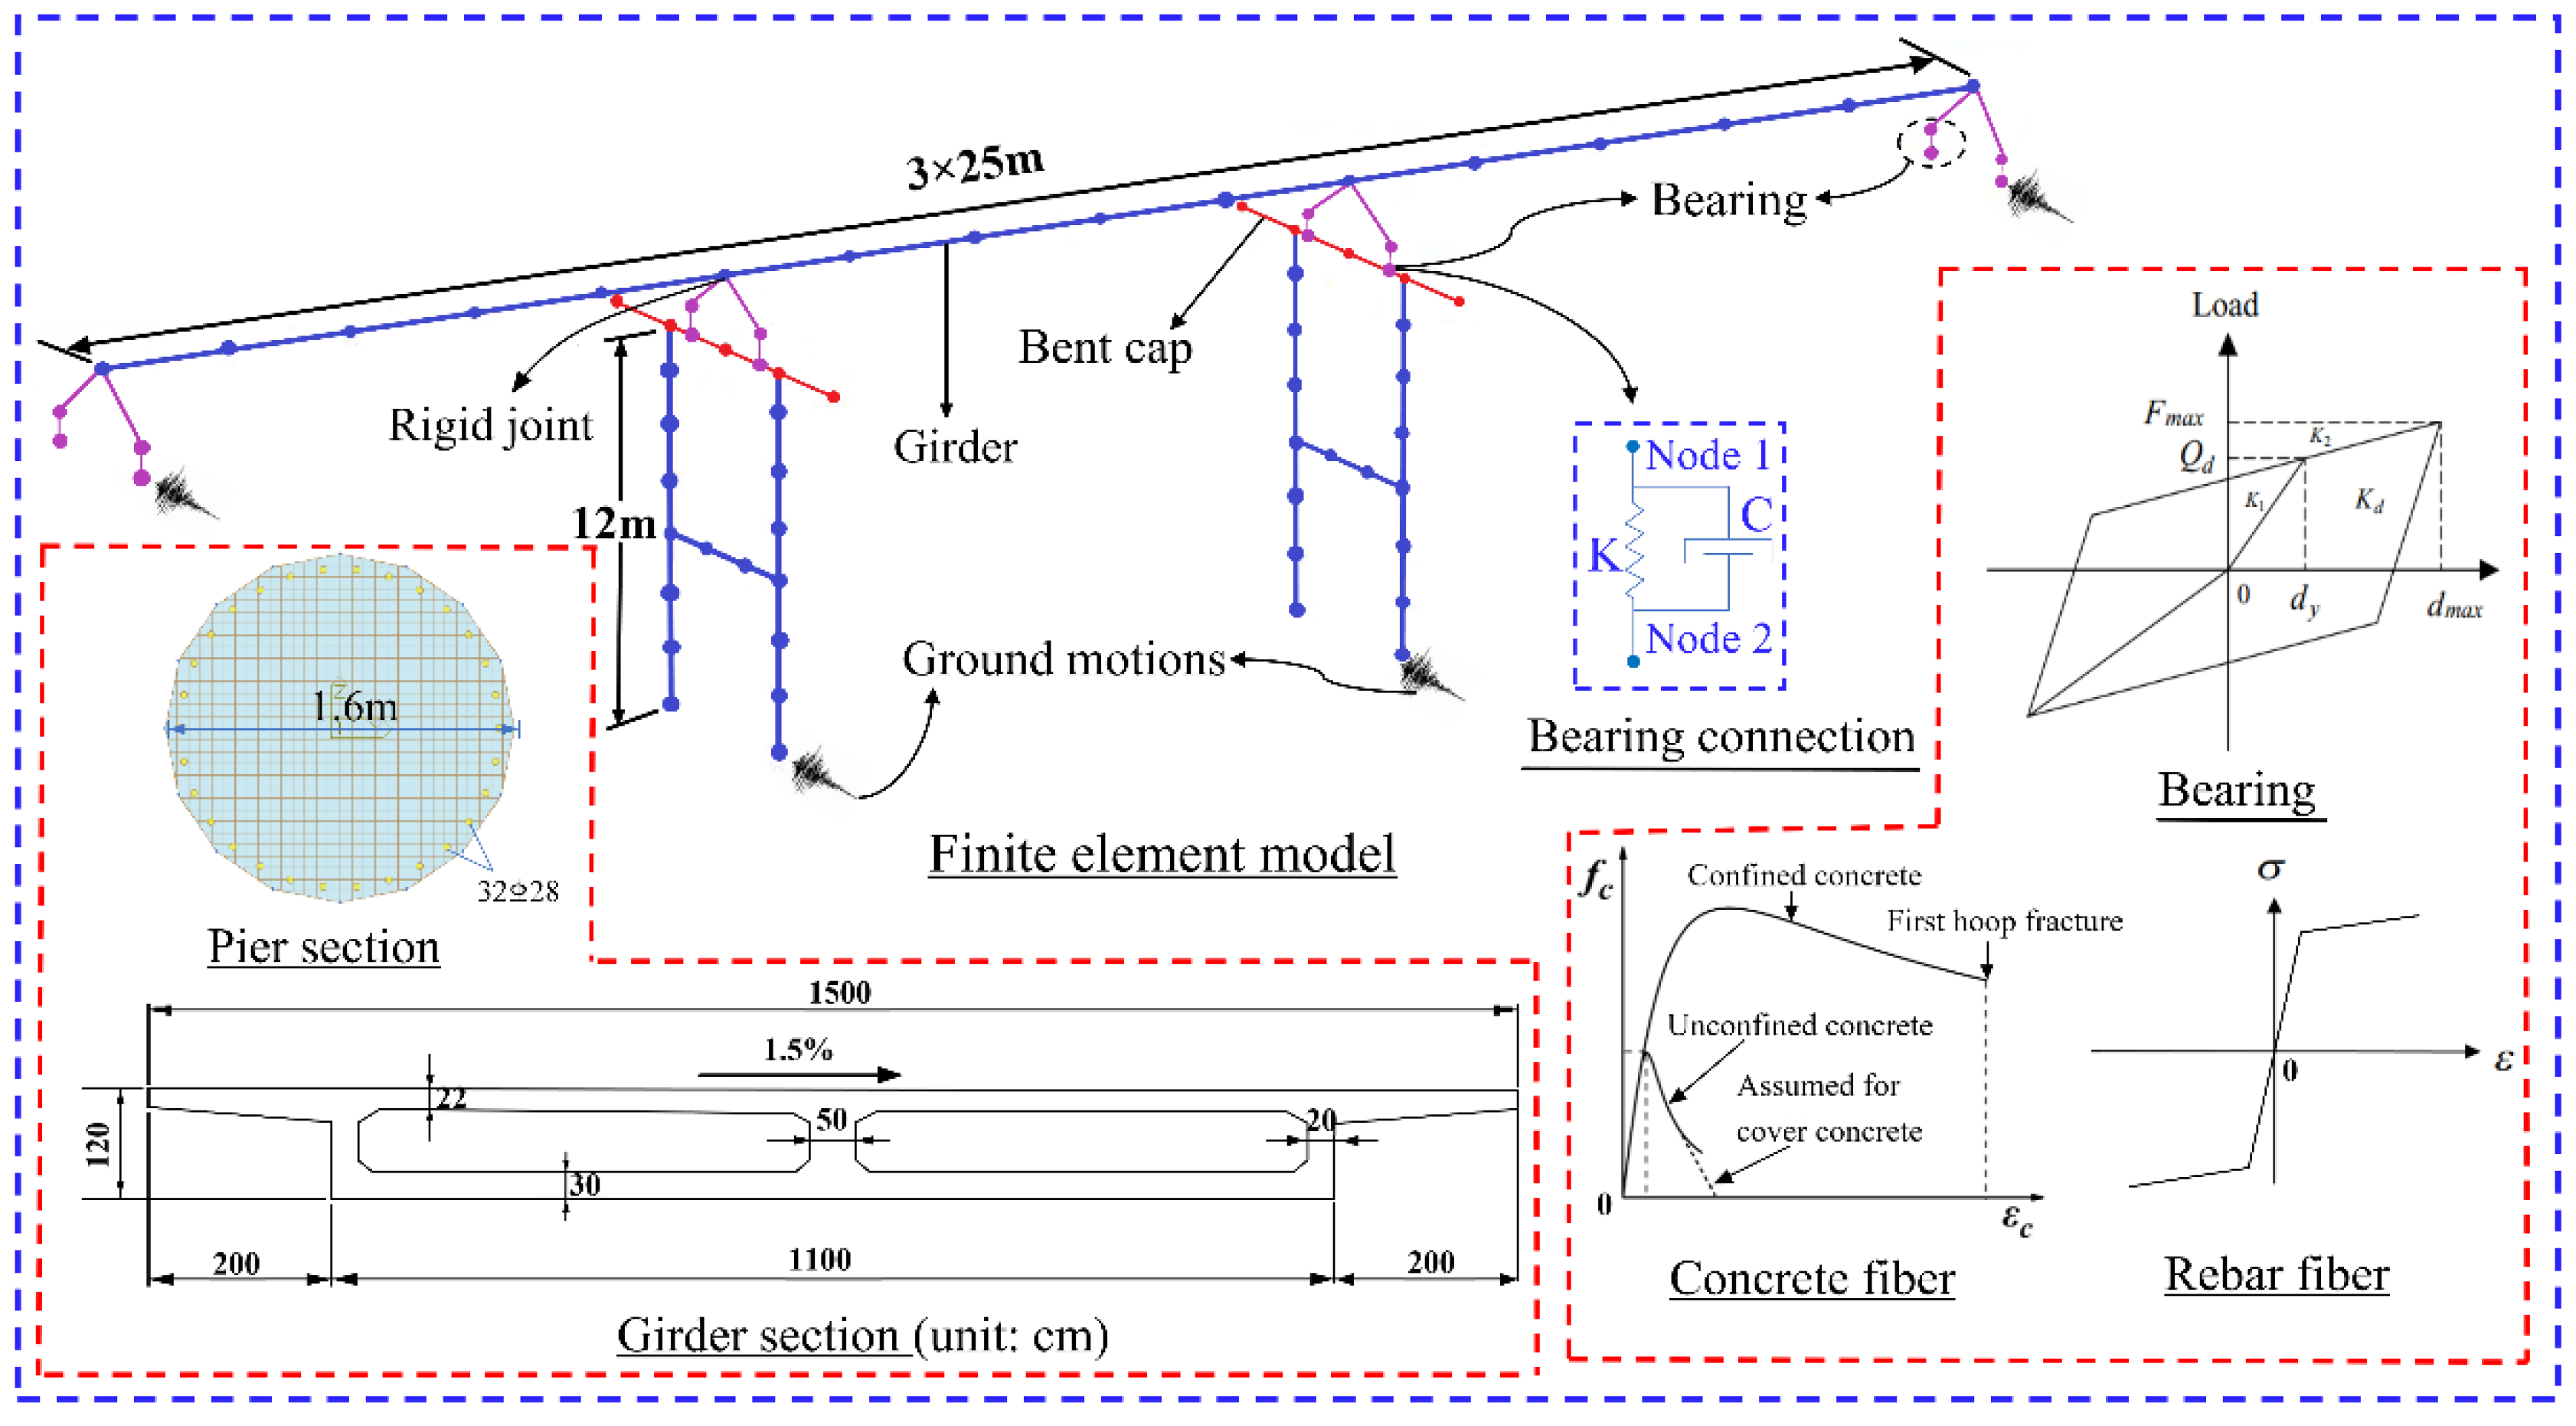
To illustrate the methodology, a bridge structure with three continuous 25 m spans was selected for detailed analysis. The superstructure comprises a single-box, two-cell girder with section modulus values of 9.38 m3 at both the midspan and supports. The 12 m-high piers were constructed from reinforced concrete with circular cross-sections. Figure 5 illustrates the numerical model along with the constitutive material models for bearings, reinforcement bars, and concrete. The three-dimensional finite element model of the bridge was developed using ABAQUS (v2021) and ANSYS (v2022) software. In the developed finite element model, girder elements were simulated using T3D2 and BEAM44 elements, whereas piers were represented through C3D8R solid elements and BEAM189 beam formulations, incorporating the Concrete Damage Plasticity (CDP) constitutive model to characterize their nonlinear inelastic response [44]. The rebars were numerically represented using T3D2 truss elements and constrained within the concrete matrix through the embedded region constraint formulation. The nonlinear constitutive response of concrete was modeled through the Kent–Scott–Park material formulation, incorporating second-order P-δ effects and neglecting tensile resistance in fiber-based discretization. This framework enables explicit representation of the uniaxial stress–strain behavior for confined and unconfined concrete conditions [45]. The nonlinear stress–strain response of reinforcing steel was simulated using the Giuffre–Menegotto–Pinto constitutive model, which captures the characteristic elastoplastic hardening behavior. The reinforcing steel exhibits a yield strength of 435 Mpa and an elastic modulus of 200 Gpa. C50 grade concrete was used for the girders, and C35 grade concrete was employed for the piers. The lead rubber bearings (LRB) were modeled using a bilinear hysteretic model [46], with corresponding parameters provided in Table 2. The structural connections were idealized through rigid kinematic constraints between the following components: (a) monolithic girder ends and the superior nodes of bearing assemblies (Node 1), and (b) the inferior nodes of bearings (Node 2) and bent cap interfaces. Bearing elements were implemented to form force-transfer mechanisms between Node pairs 1 and 2. Foundation boundary conditions were modeled as fixed constraints at the rock interface, with soil-structure interaction effects considered negligible due to the presence of competent bedrock formations.
The HAZUS (MR4) manual [36] defines four distinct damage states (DSs)—complete, major, moderate, and slight damage—each characterized by specific damage indicator (DI) criteria. Bridge piers and bearings represent the most seismically vulnerable structural components. Following the damage thresholds established by Li et al. [47], this study adopts the maximum drift ratio (θc) of the pier top and the maximum displacement (δ) of bearing as the key engineering performance parameters. The research considers four strain limit states as four performance indicators, which correspond to four distinct damage states: (a) initial yielding of longitudinal rebars, (b) onset of core concrete crushing, (c) first occurrence of rebar buckling, and (d) initiation of rebar fracture. Table 3 presents the corresponding DI thresholds used for DSs’ classification of these components.

6.2. Selection of Ground Motions

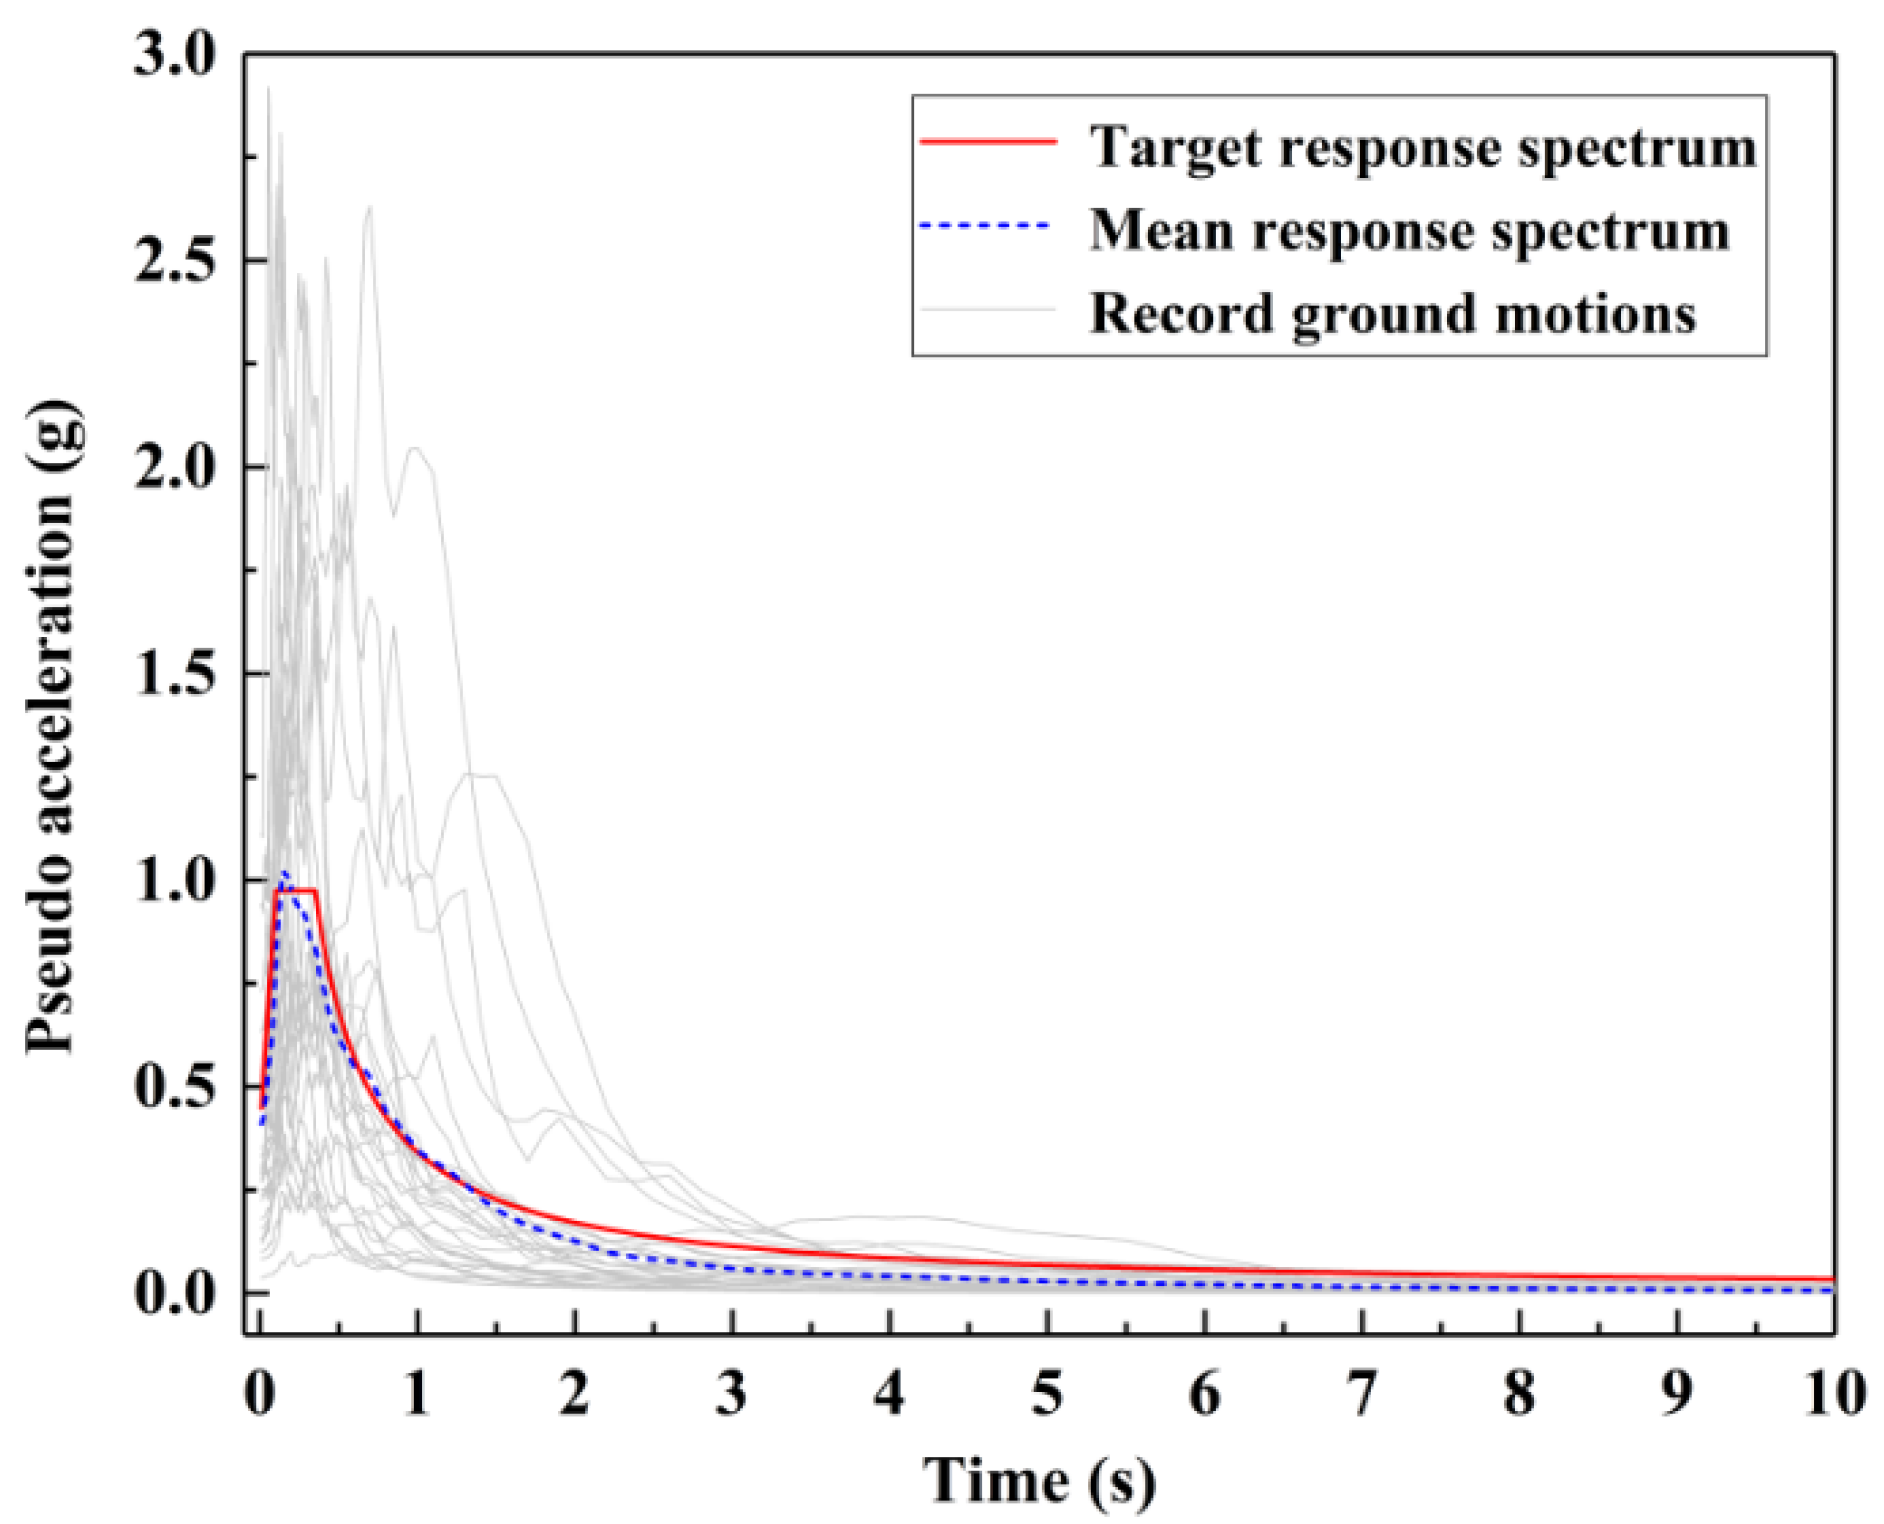
The target response spectrum was generated based on the following parameters: E2 seismic level, Site Class II, Bridge Category A, a characteristic period of 0.4 s, structural damping ratio of 0.05, and PGA of 0.3 g. E2 corresponds to a rare seismic event characterized by a 50 year exceedance probability of 2–3%. Class II site conditions refer to soil profiles exhibiting shear wave velocities (Vs30) between 260 and 510 m/s. Bridge Category A designates critical infrastructure, for which rapid functional restoration following an earthquake is essential. This spectrum served as the target for selecting compatible ground motions from the PEER NGA-West2 database [35,48]. Records demonstrating significant spectral variability were excluded through an iterative screening process, yielding a final set of 30 motions, as summarized in Table A1 of Appendix A. Figure 6 compares the computed average spectrum of these motions with the target spectrum. For the chloride-corroded bridge structure, the fundamental period varied between 1.736 s and 1.954 s, corresponding to response spectrum variations of 6.32–12.57%. The close spectral agreement validates the selected ground motions for engineering analysis. To facilitate PSDA, incremental dynamic analysis was performed using PGA levels increasing from 0.1 g to 1.5 g with a step size of 0.1 g. A total of 450 nonlinear time–history analyses (30 ground motions × 15 intensity levels) were carried out on the finite element bridge model. Scaled multi-directional excitation records were applied to quantify the uncertainty in structural responses under stochastic seismic inputs.

7. Results and Discussion

7.1. Seismic Performance of a Representative Bridge Structure

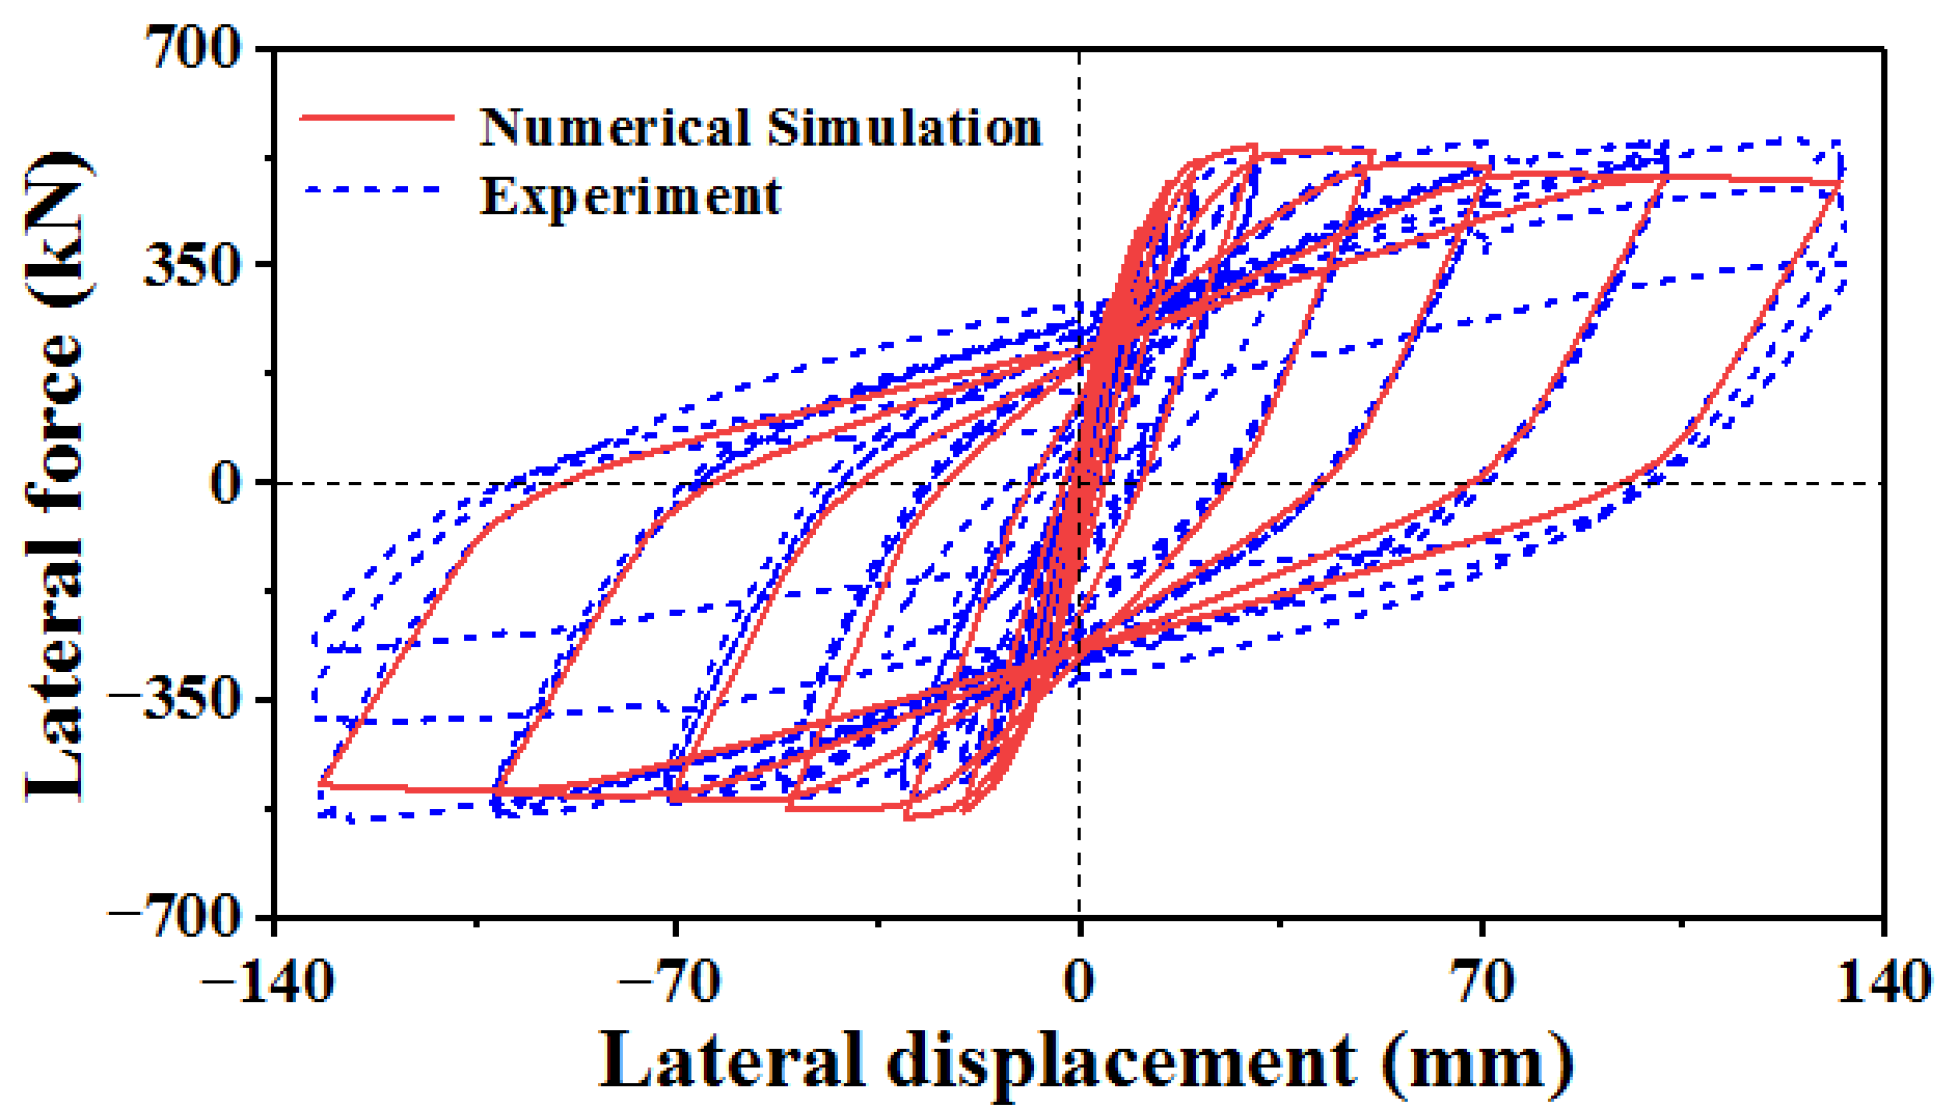
The C35 grade concrete specified for the pier was numerically modeled in ABAQUS, following the experimental configuration described by Calderone et al. [49]. Lateral loading was applied at the pier top (pushover analysis) to generate force-displacement curves, which were then compared with experimental results. As shown in Figure 7, the numerical and experimental curves exhibit strong agreement. This validated constitutive model can therefore be reliably employed for parametric simulations in case studies.
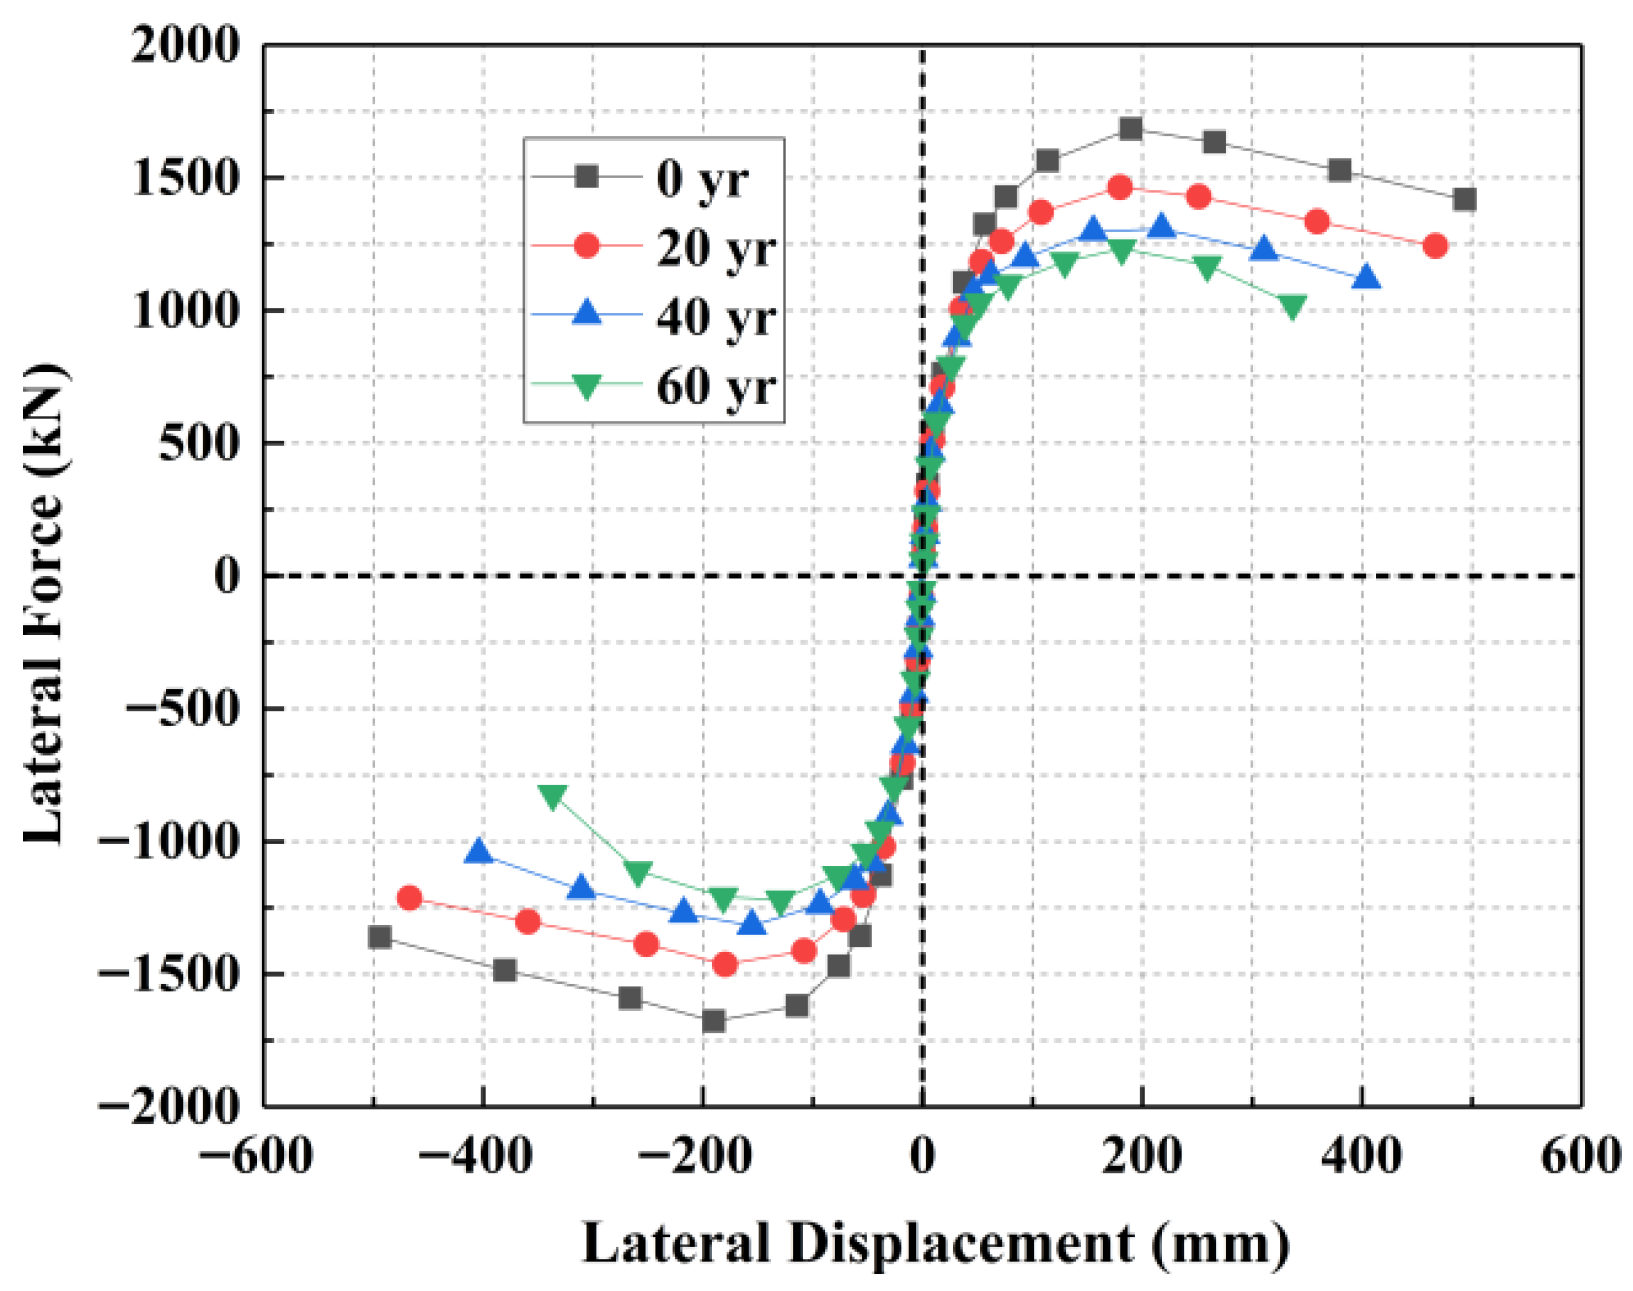
The time-dependent degradation of rebar strength and the cross-sectional area under chloride attack was analytically determined through Equations (4)–(6). These corrosion-induced property variations were subsequently implemented in ABAQUS to develop high-fidelity finite element models for quasi-static nonlinear analysis. Figure 8 demonstrates consistent behavioral patterns in the pier load–displacement curves under different chloride corrosion durations. Three distinct phases are evident: (1) an initial linear elastic phase (displacement < 13 mm) with constant stiffness; (2) a post-cracking phase showing stiffness degradation due to concrete yielding; and (3) a strength-degradation phase following peak load attainment, characterized by gradual force reduction. This final phase results from two primary mechanisms: extension of plastic hinge length at the pier base and reduced energy dissipation capacity during post-yield failure.
The energy absorption capacity, represented by the area under load–displacement curves, exhibits progressive deterioration with corrosion duration—decreasing from 1453 kN·m (uncorroded) to 1206, 938, and 720 kN·m after 20, 40, and 60 years of exposure, respectively. These values correspond to performance reductions of 17.01%, 35.42%, and 50.44% compared to the non-corroded condition, clearly demonstrating time-dependent degradation effects.

7.2. Seismic Fragility of Sample Bridge

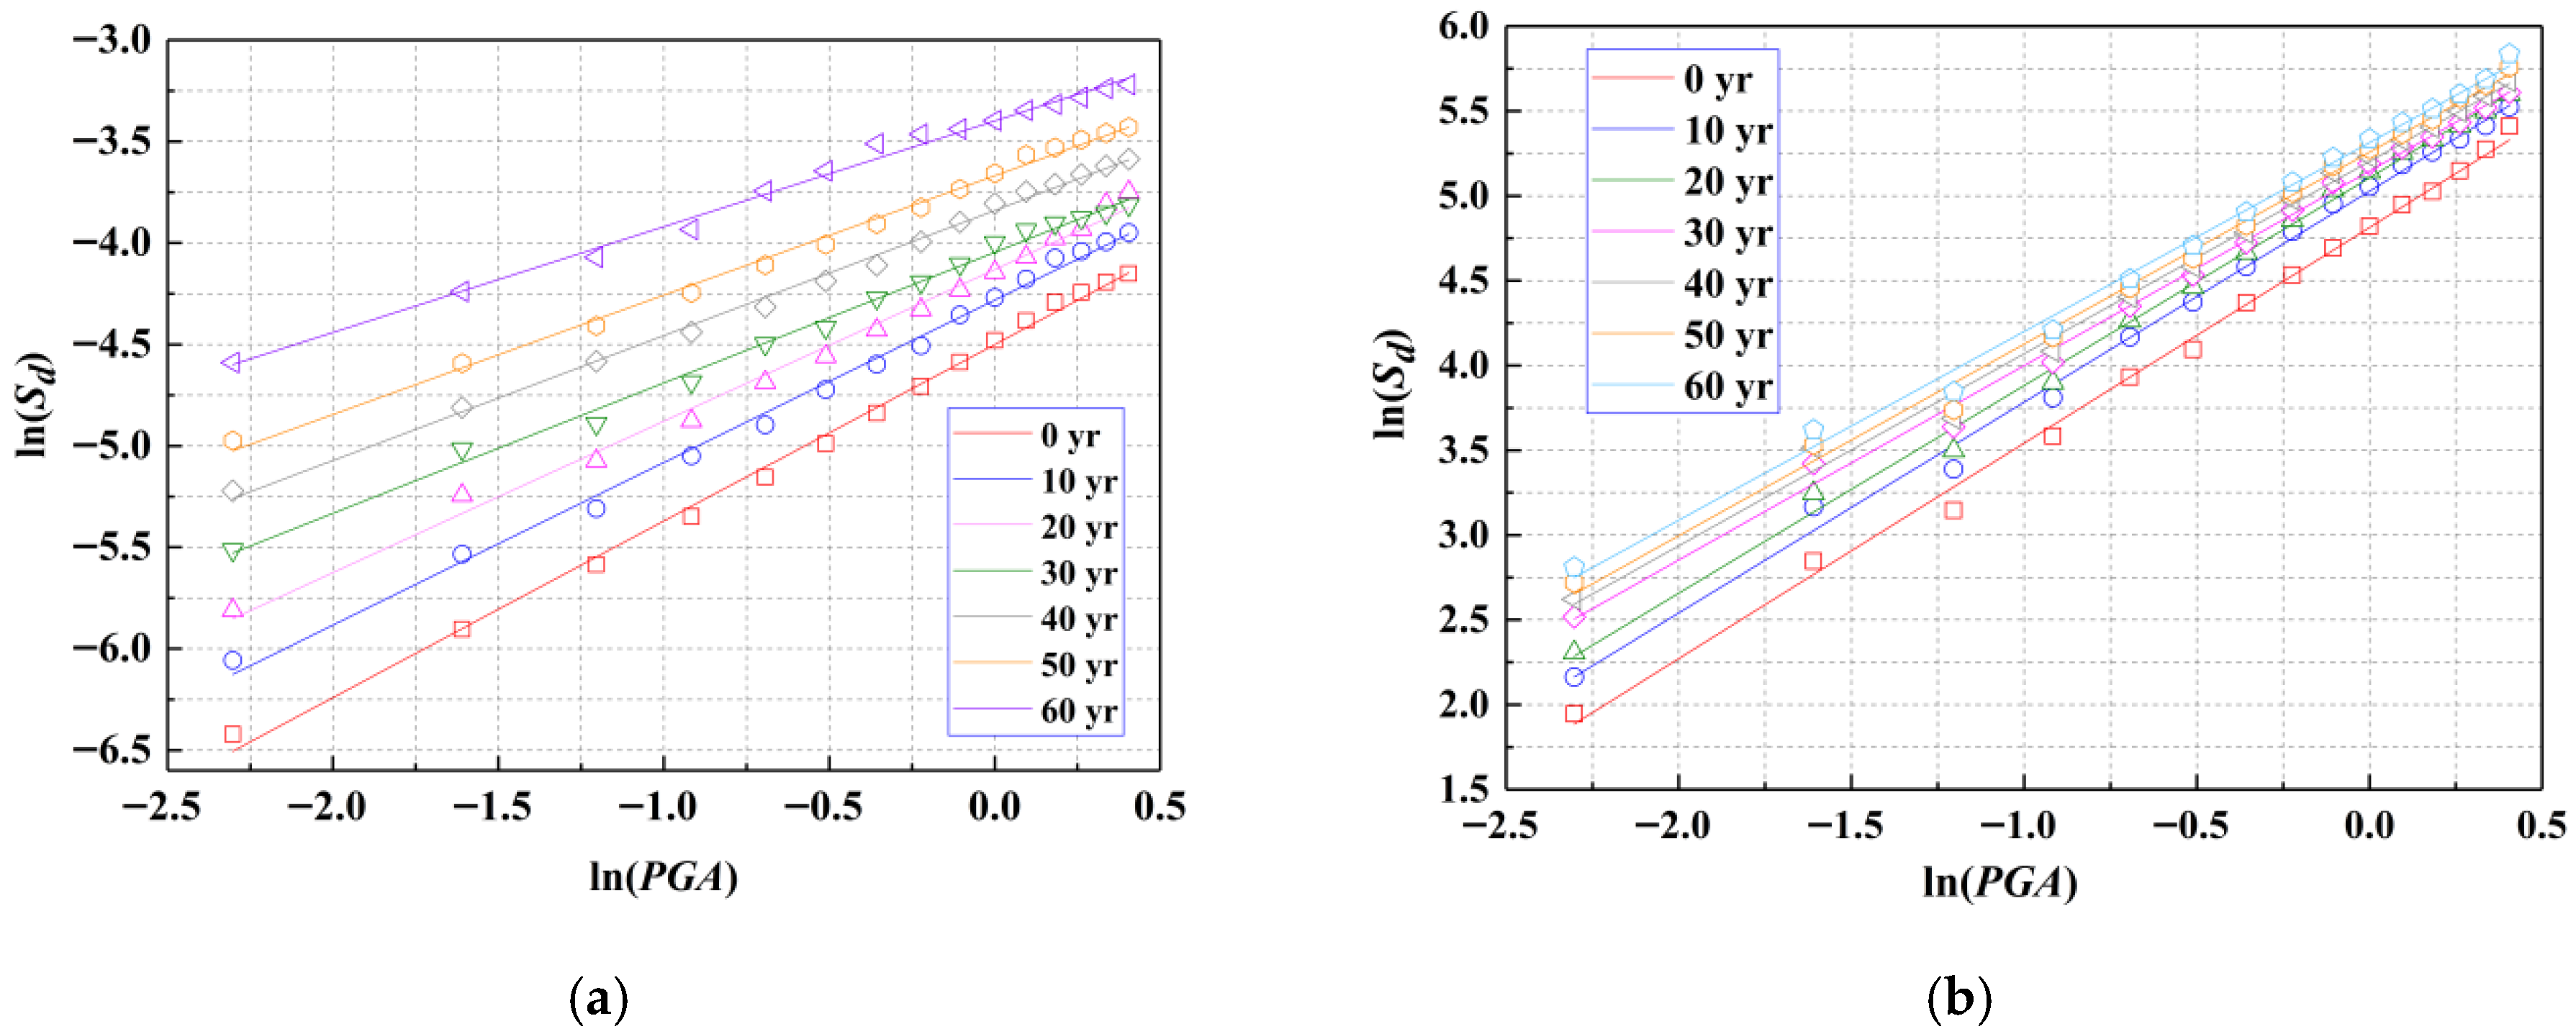
The seismic fragility analysis of the sample bridge was conducted using ANSYS software. As a key intensity measure in PSDA, PGA is commonly used to evaluate bridge seismic vulnerability. Seismic fragility assessments predominantly prioritize piers and bearings due to their critical vulnerability, with pier overturning and bearing slippage representing the dominant failure mechanisms. Conversely, girders exhibit relatively negligible impacts on overall structural performance and consequently receive minimal attention in these evaluations. For each PGA level (0.1 g–1.5 g), we computed the mean structural demand (Sd) from 30 spectrally matched ground motions, yielding 15 discrete Sd values. Both PGA and Sd were logarithmically transformed to establish a linear relationship between ln(PGA) and ln(Sd). This procedure yielded fitting coefficients a and b for Equation (6). The study incorporated seven representative bridge configurations, with distinct regression models formulated for piers and bearings. As summarized in Table 4 and illustrated in Figure 9a,b, the derived equations demonstrate high goodness-of-fit (R2 > 0.95), affirming their statistical robustness for predicting seismic demands.
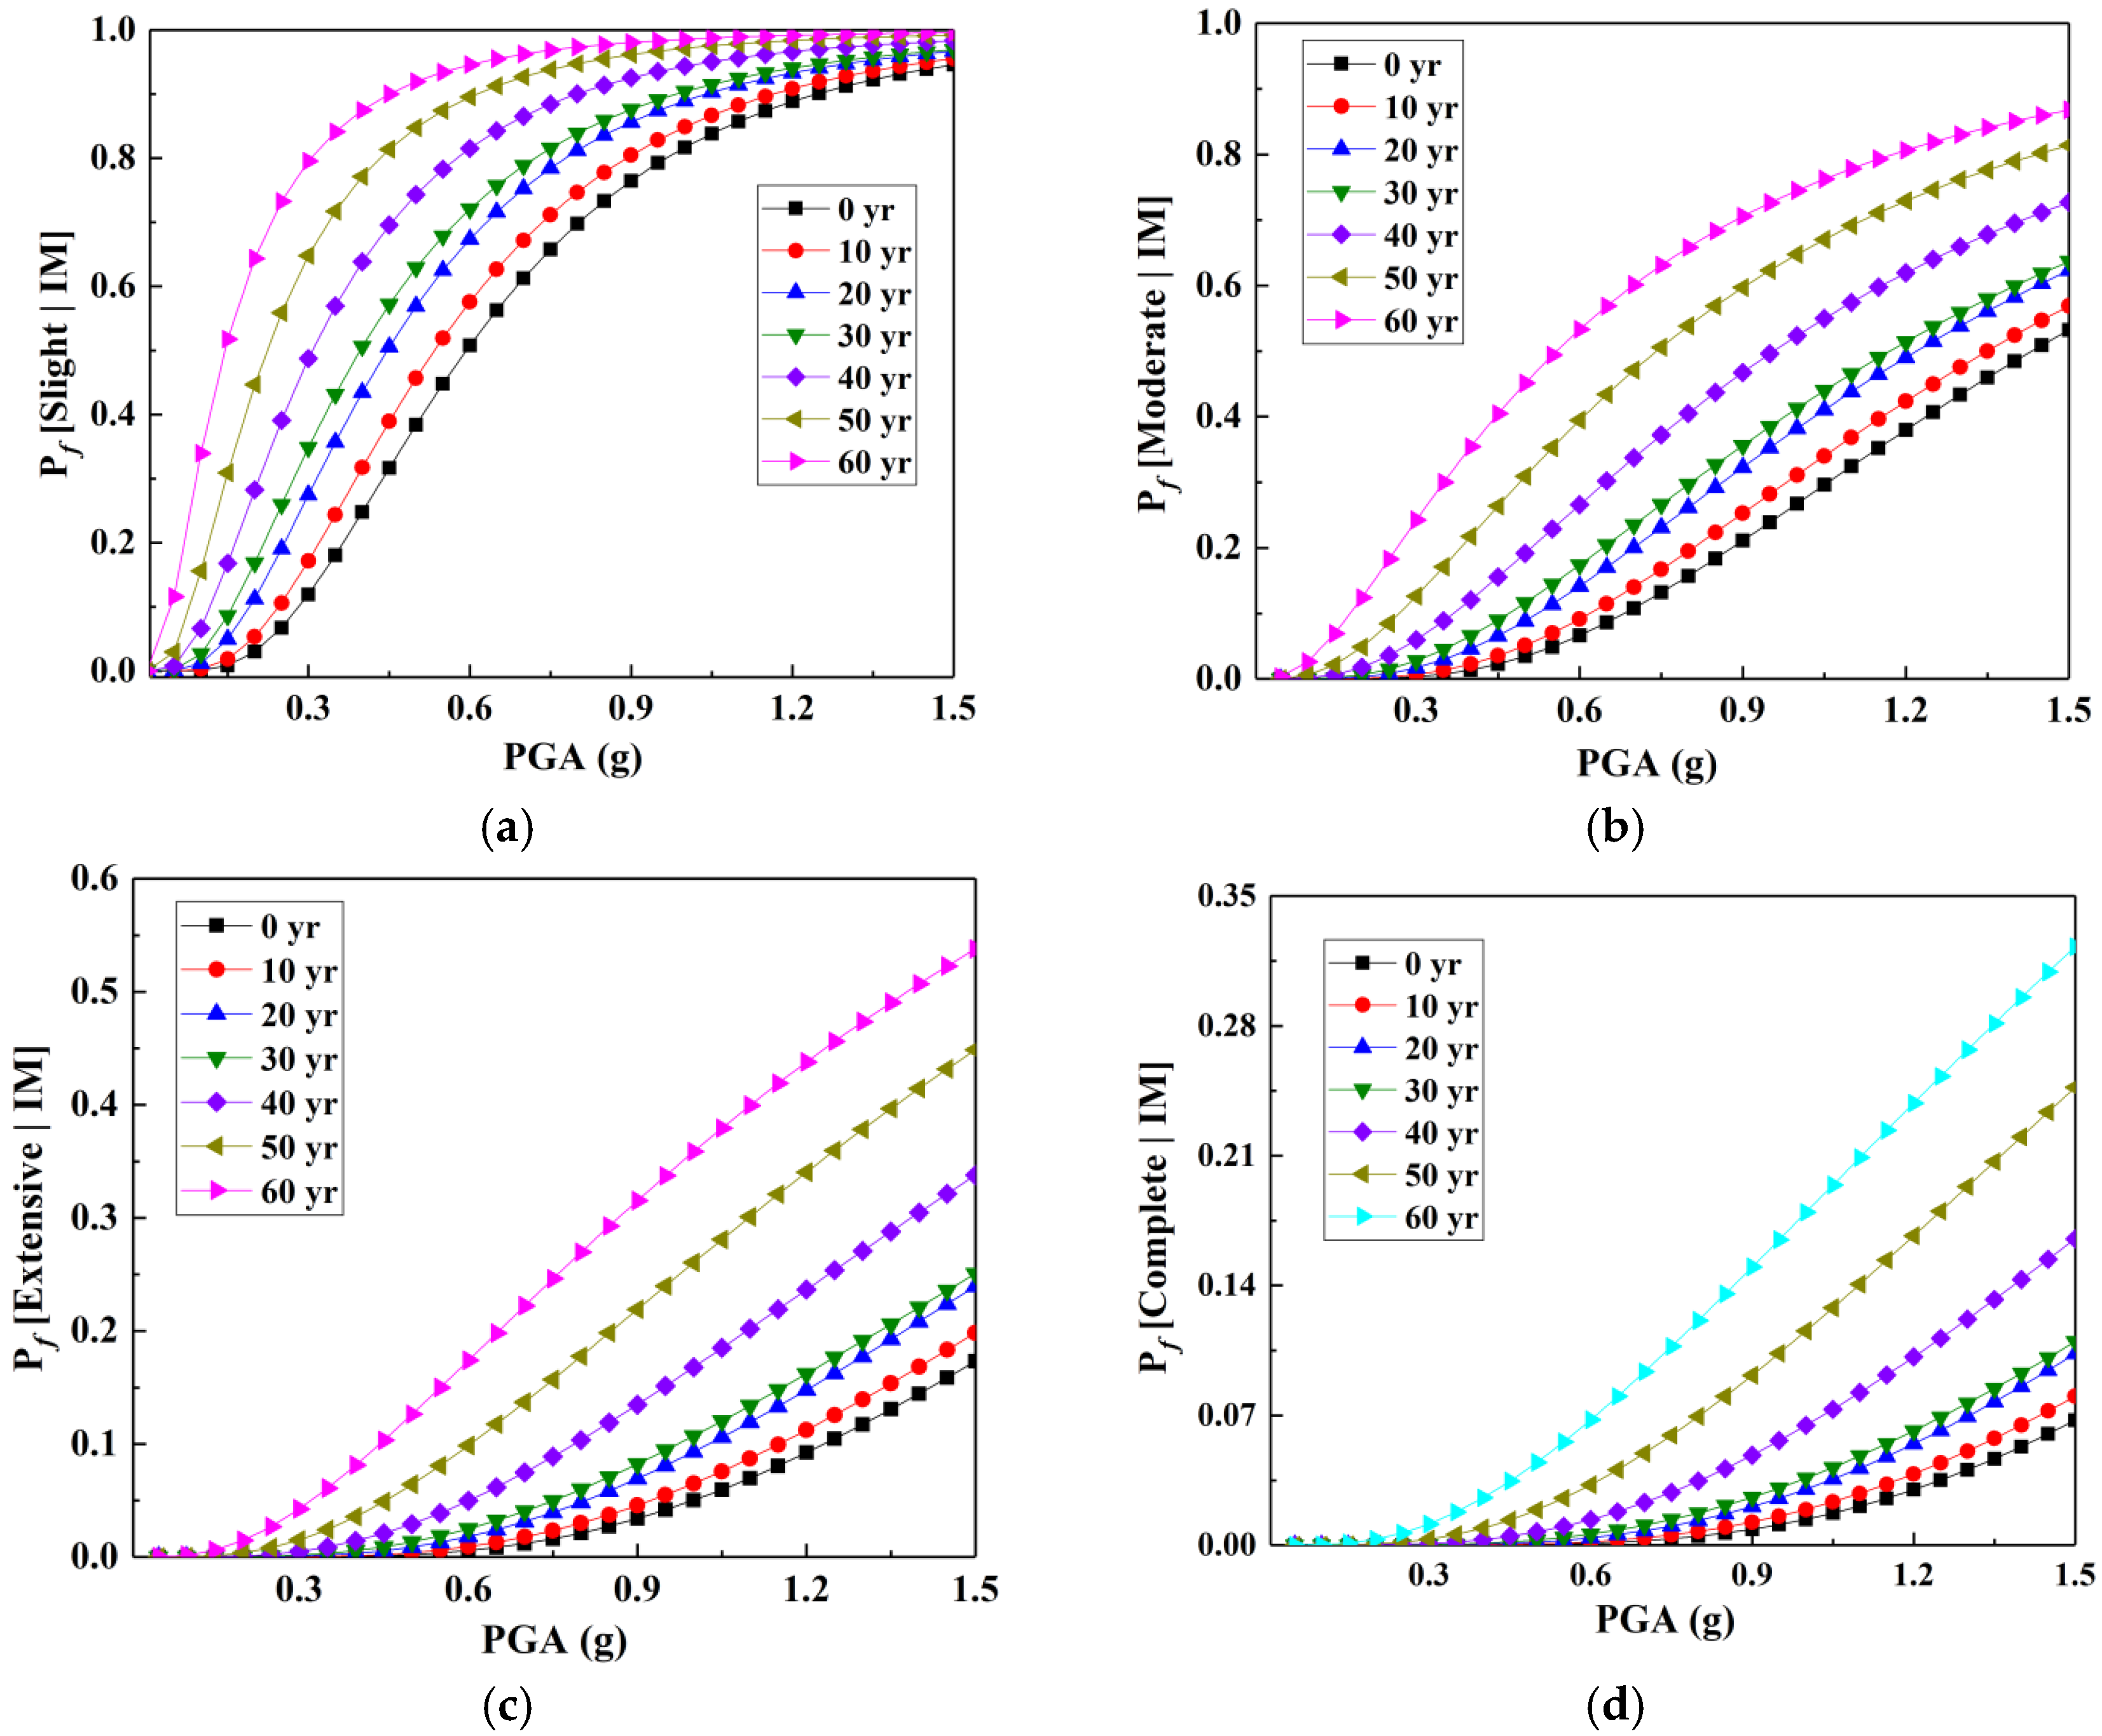
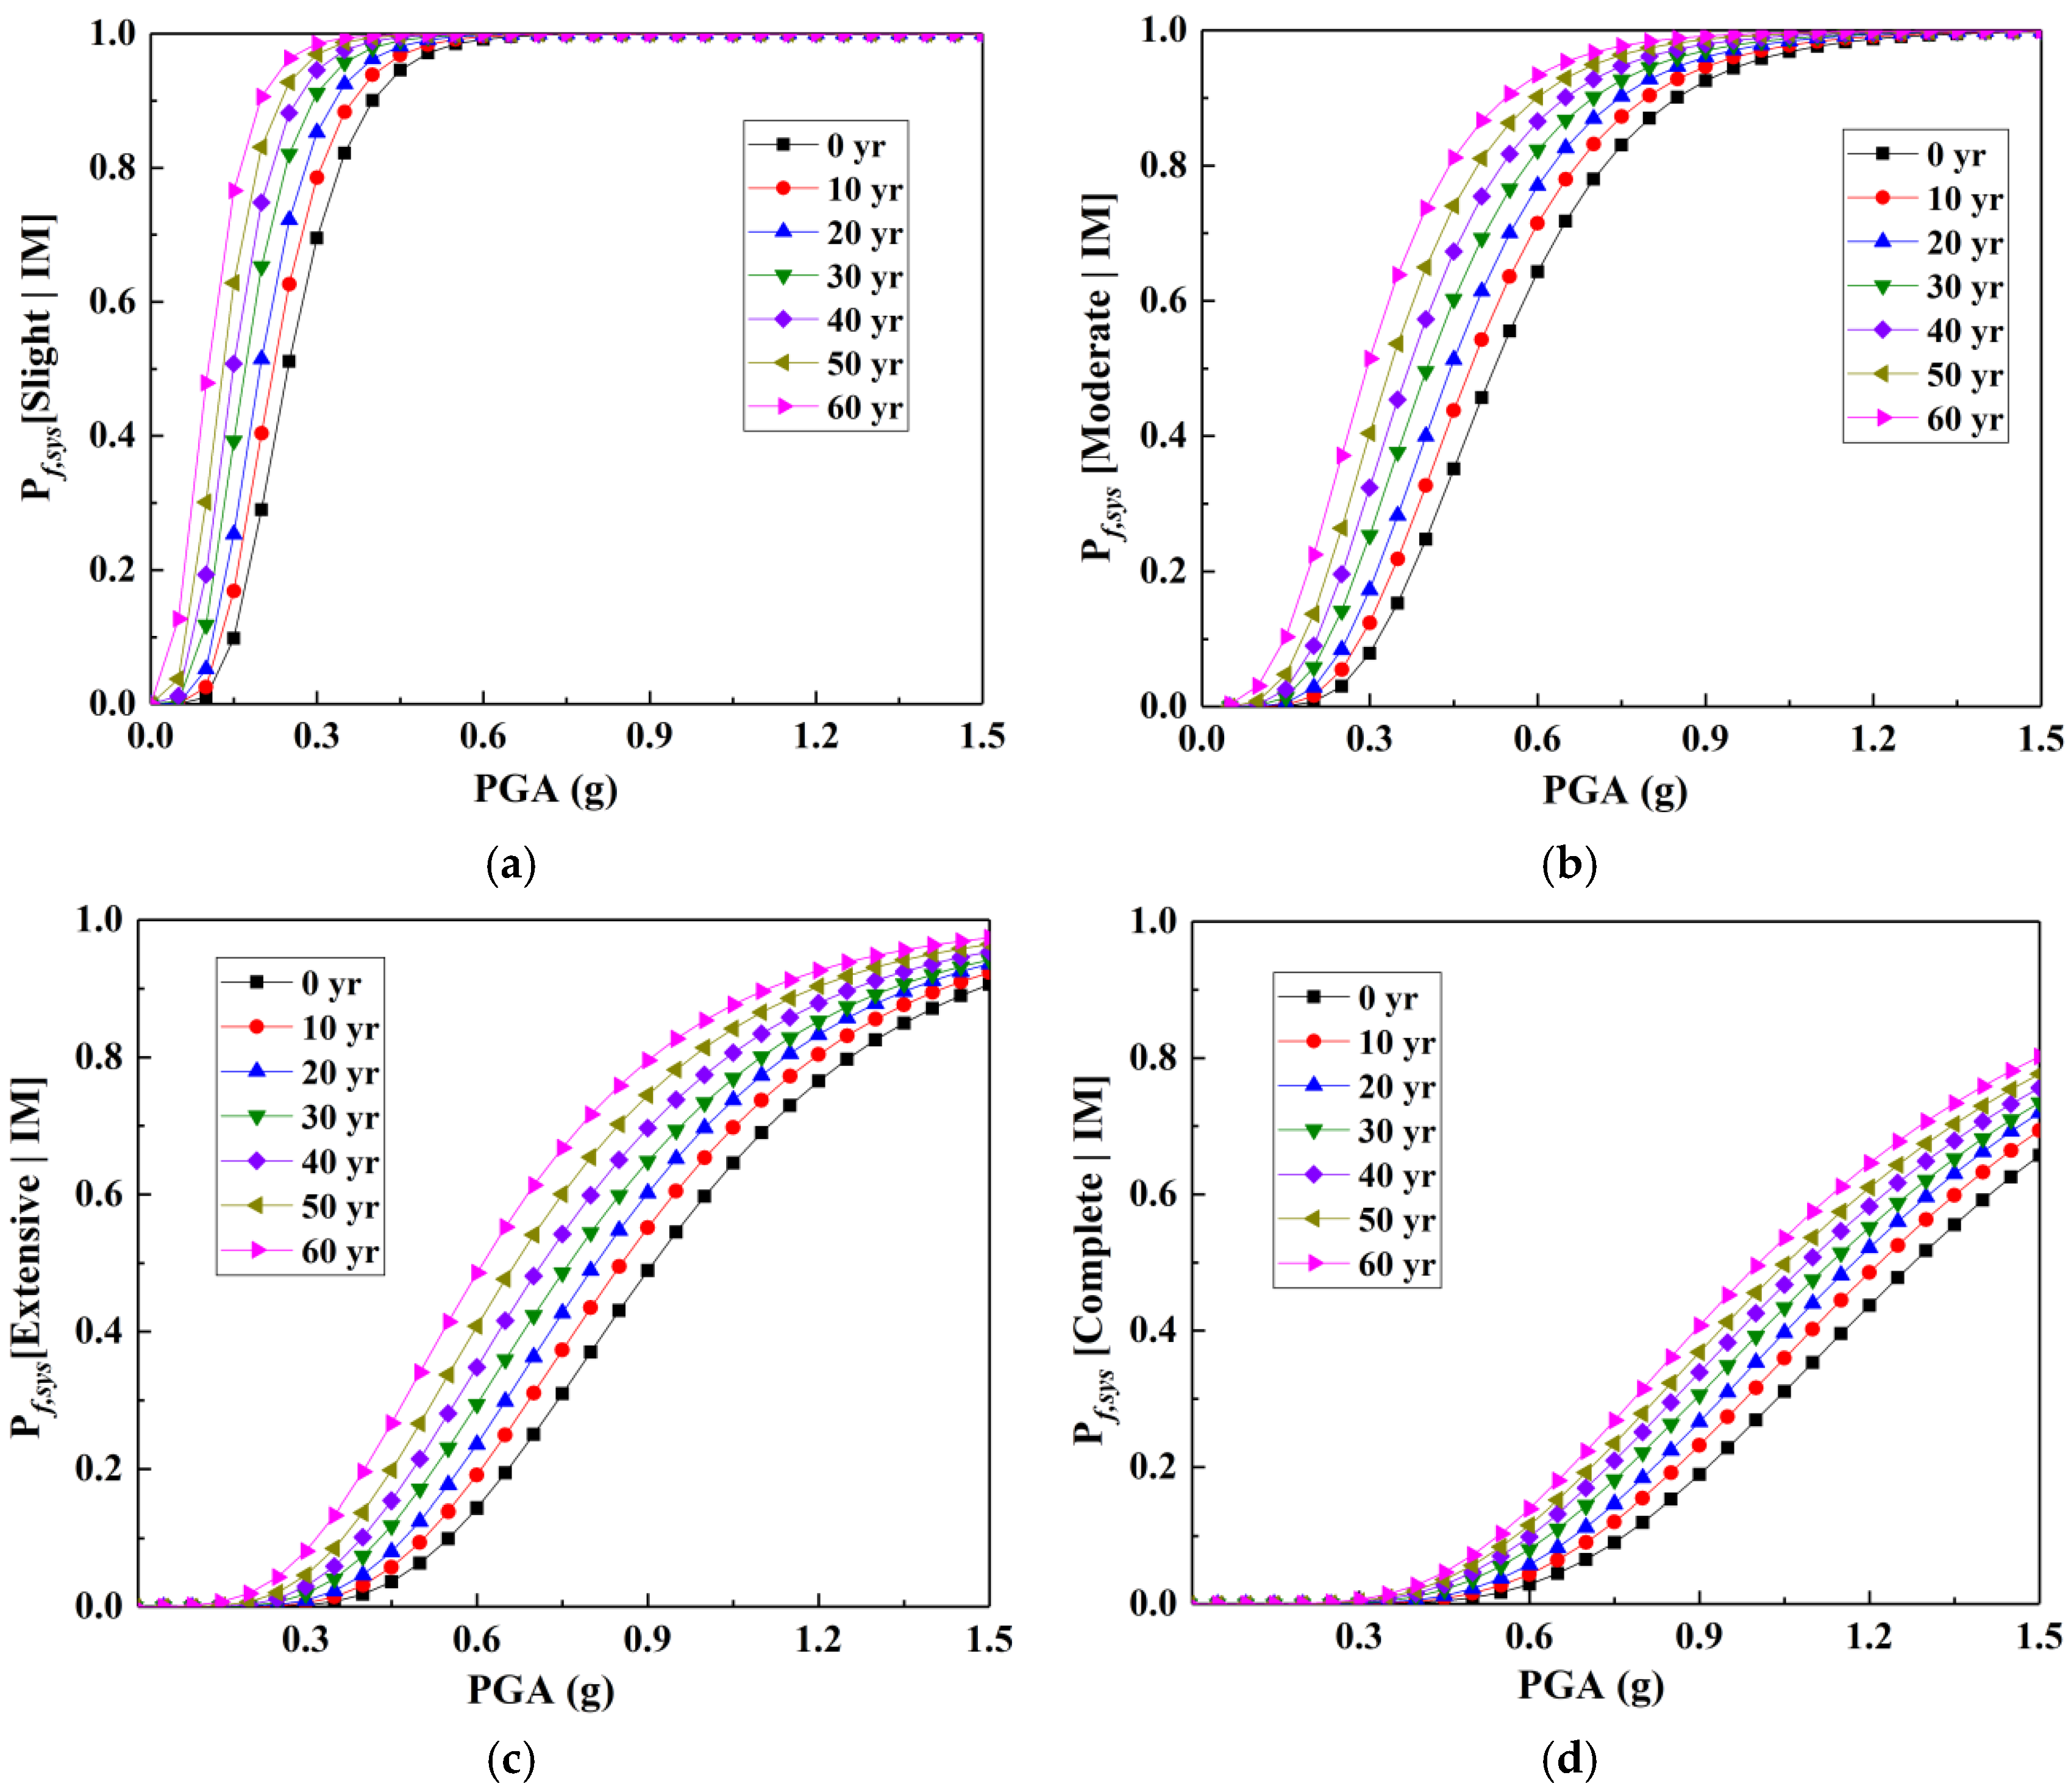
The fragility curves for different damage states (DSs) of structural components can be calculated using Equations (7) and (8), based on the damage index (DI) thresholds listed in Table 3, the engineering demand parameters (EDPs) listed in Table 5, and the PSDA parameters. A comparison of the fragility curves for piers and bearings at varying service durations is provided in Figure 10 and Figure 11, while Figure 12 illustrates the bridge system’s vulnerability curves. The analysis indicates that higher PGA levels lead to increased damage probabilities for both piers and bearings, with longer service periods exacerbating their deterioration. Notably, the piers’ degradation is highly dependent on their age. When comparing newly constructed (0 year) and aged (60 year) structures under the same PGA conditions, the piers exhibit maximum probability differences of 0.676 (minor damage), 0.501 (moderate), 0.365 (severe), and 0.255 (complete collapse). Conversely, bearings are less affected by long-term chemical aging, with corresponding differences of 0.469, 0.356, 0.261, and 0.206. For the entire bridge system, the maximum discrepancies in damage probability are 0.668, 0.489, 0.363, and 0.226.
These results highlight that chloride-induced degradation has a more pronounced impact on piers than on bearings. The observed vulnerability differences further confirm that piers are more prone to environmental deterioration in terms of durability performance.

7.3. Assessment of Resilience

A framework for assessing seismic resilience probabilistically was developed based on the fragility analysis approach presented in Section 7.1. The study utilized vulnerability curves of bridges constructed under varying design specifications (subjected to 0.3 g seismic intensity) to calculate failure probabilities for different design standards through Equation (10). Uncertainties in the restoration process were incorporated by modeling parameters μi and σi in Equation (13) as random variables following a normal distribution. Their statistical characteristics were calibrated based on guidelines provided by the Applied Technology Council and FEMA [38,39].
Probabilistic evaluation of bridge recovery functionality Q(t) was conducted employing Equations (13)–(15), as shown in Figure 13. The analysis demonstrates that: (1) under similar durations of chloride corrosion, Q(t) exhibits an inverse correlation with PGA magnitude; (2) elevating PGA by 0.3 g diminishes Q(t) values by 16–32% in bridges with 60 year corrosion history while shrinking the Q(t)-time integral by 12–19%; and (3) the enclosed area under Q(t) curves contracts about 4% per decade of chloride exposure, indicating progressive capacity reduction due to reinforcing steel deterioration. As illustrated in Figure 8, corrosion reduces pier lateral resistance and deformation capacity by 22.3% and 20.7%, respectively, amplifying damage potential at identical PGA levels. These outcomes stem from dual mechanisms: seismic energy directly induces structural damage, while chloride penetration progressively weakens material properties, collectively accelerating functional degradation.
The bridge performance metric Q(t) shows degradation under both increased PGA levels and prolonged chloride corrosion exposure. Nevertheless, seismic retrofitting and structural repairs can effectively recover serviceability. Analysis reveals a direct relationship between repair timeframes and functional restoration, where longer rehabilitation periods yield greater Q(t) enhancement. This improvement mechanism primarily involves reconstructing structural capacity via CFRP strengthening techniques and renewal of deteriorated reinforcement elements. The calculation of the functional recovery function assumes that repair durations follow a normal distribution. However, this assumption may not always hold, particularly under the coupled effects of multiple factors—such as earthquakes, hot and humid environments, typhoons, and traffic loads. Such scenarios introduce greater complexity, necessitating deeper investigation and further research.
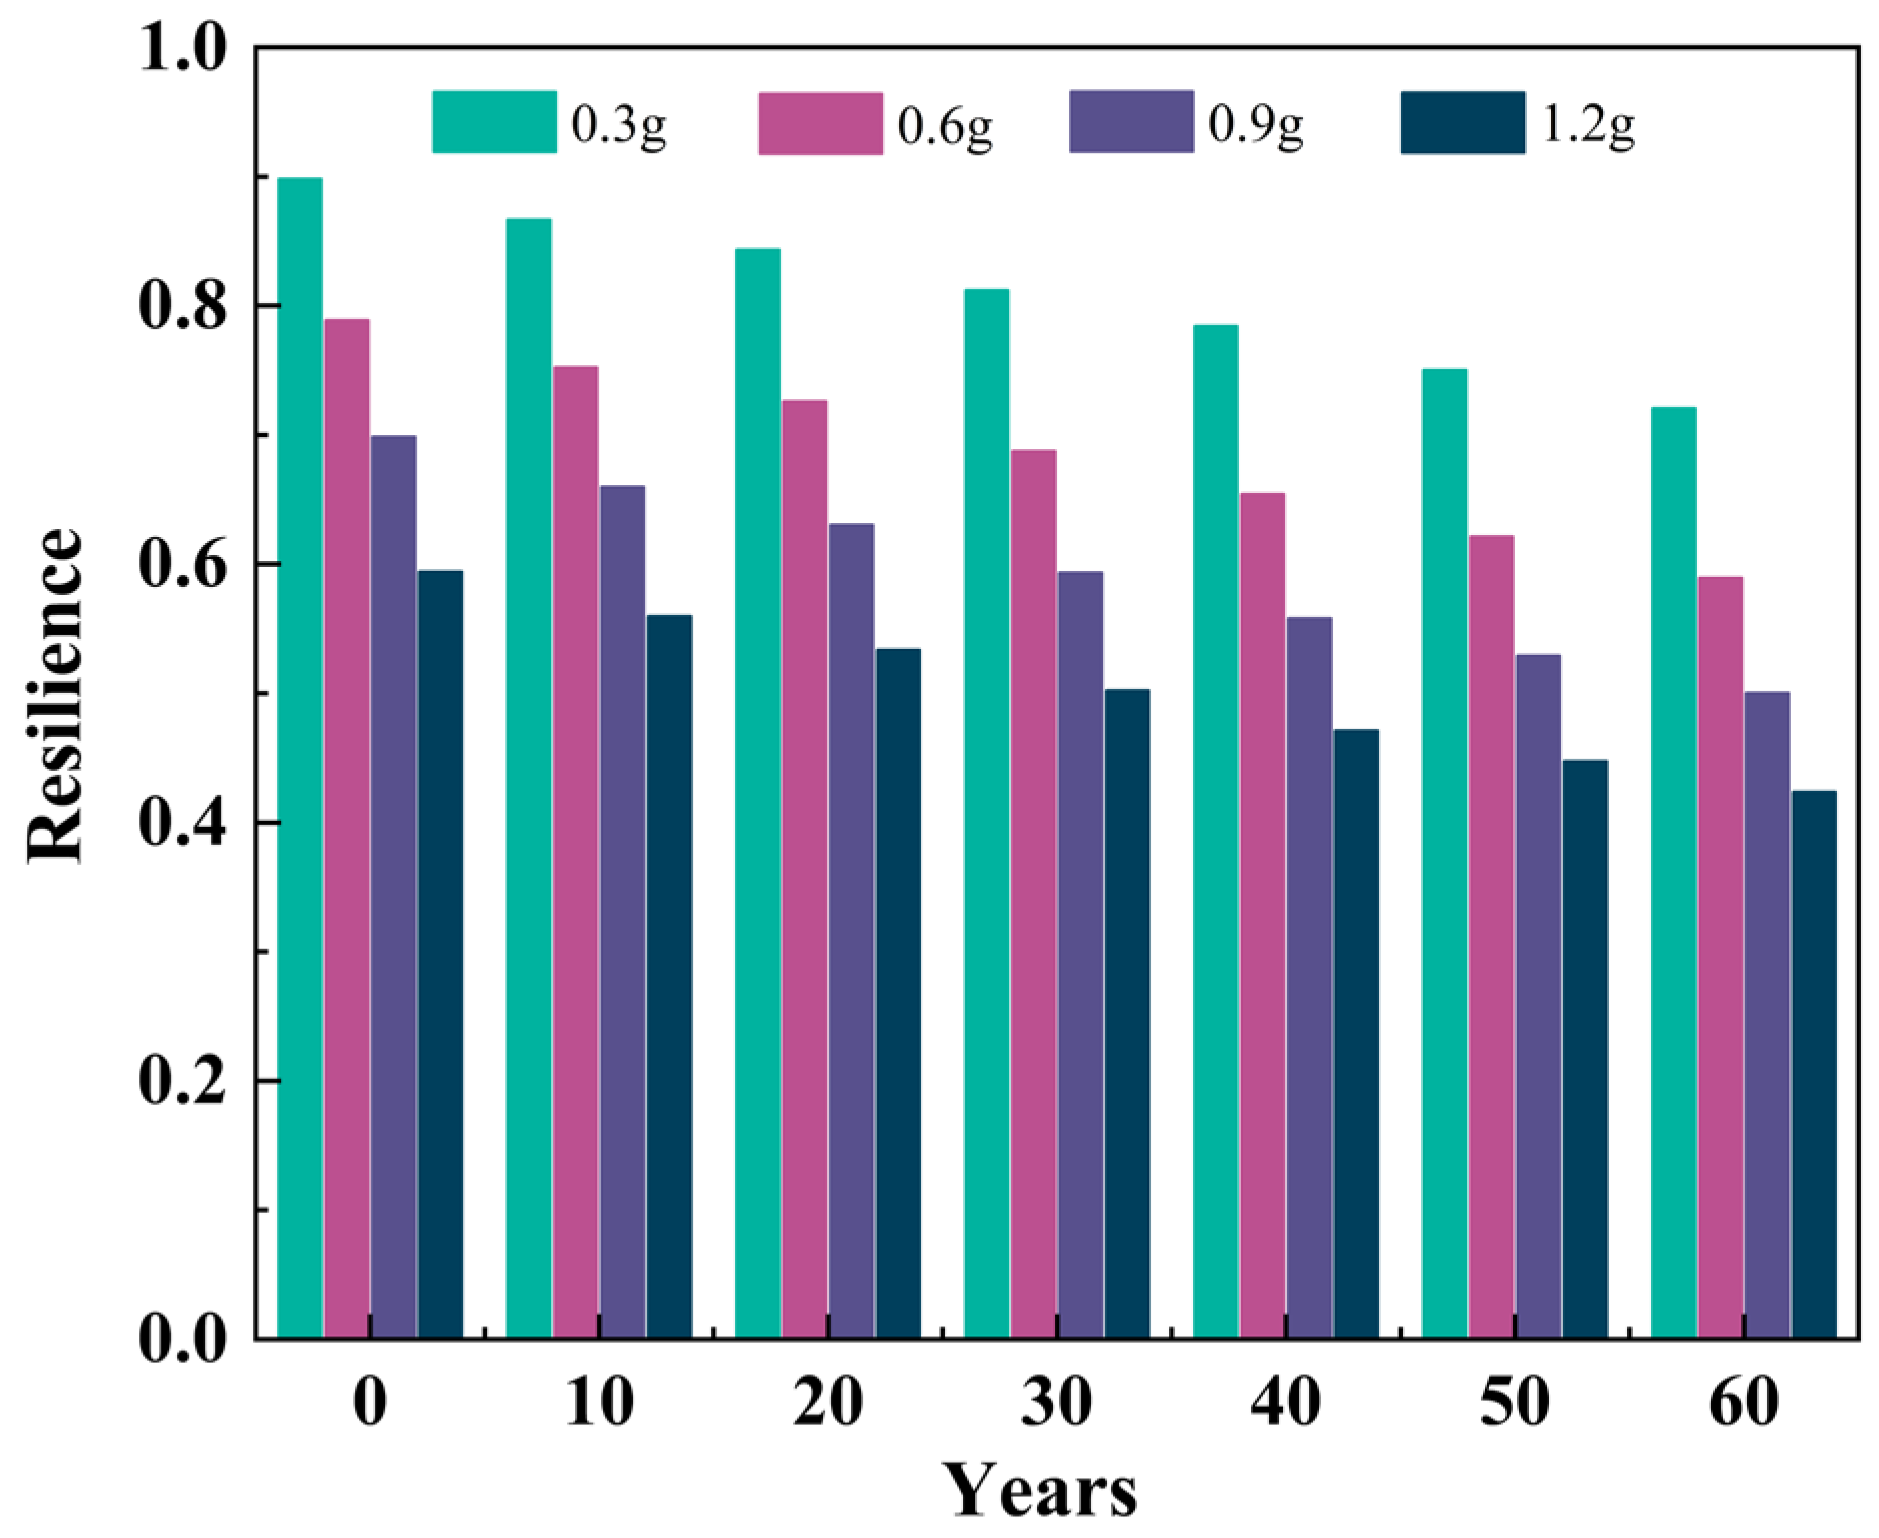
Figure 14 displays the resilience index (RI), computed using Equation (11) with a defined recovery function. The RI exhibits a progressive decline as exposure to both PGA and chloride ions extends, albeit with varying rates of reduction. Key observations from sensitivity analyses include: (1) PGA Influence: An increase of 0.3 g in PGA leads to an 11.4–18.2% drop in RI, as determined by logarithmic regression models. (2) Corrosion Duration: For every 10 year increment in chloride exposure, the RI diminishes by 2.7–6.2%, following a degradation trend described by a Weibull distribution. (3) Long-Term Corrosion Effects: After 60 years of corrosion, the RI declines by 19.8–28.7% compared to initial values, correlating with a 35–40% loss in steel cross-sectional area. (4) High-Intensity Seismic Effects: Under 1.2 g PGA, the RI experiences a 33.8–41.2% reduction relative to 0.3 g PGA, linked to heightened plastic hinge rotation at pier bases. The findings indicate that seismic intensity (PGA) has a more pronounced effect on resilience degradation than chloride-induced corrosion, especially under strong seismic conditions (PGA > 0.6 g).
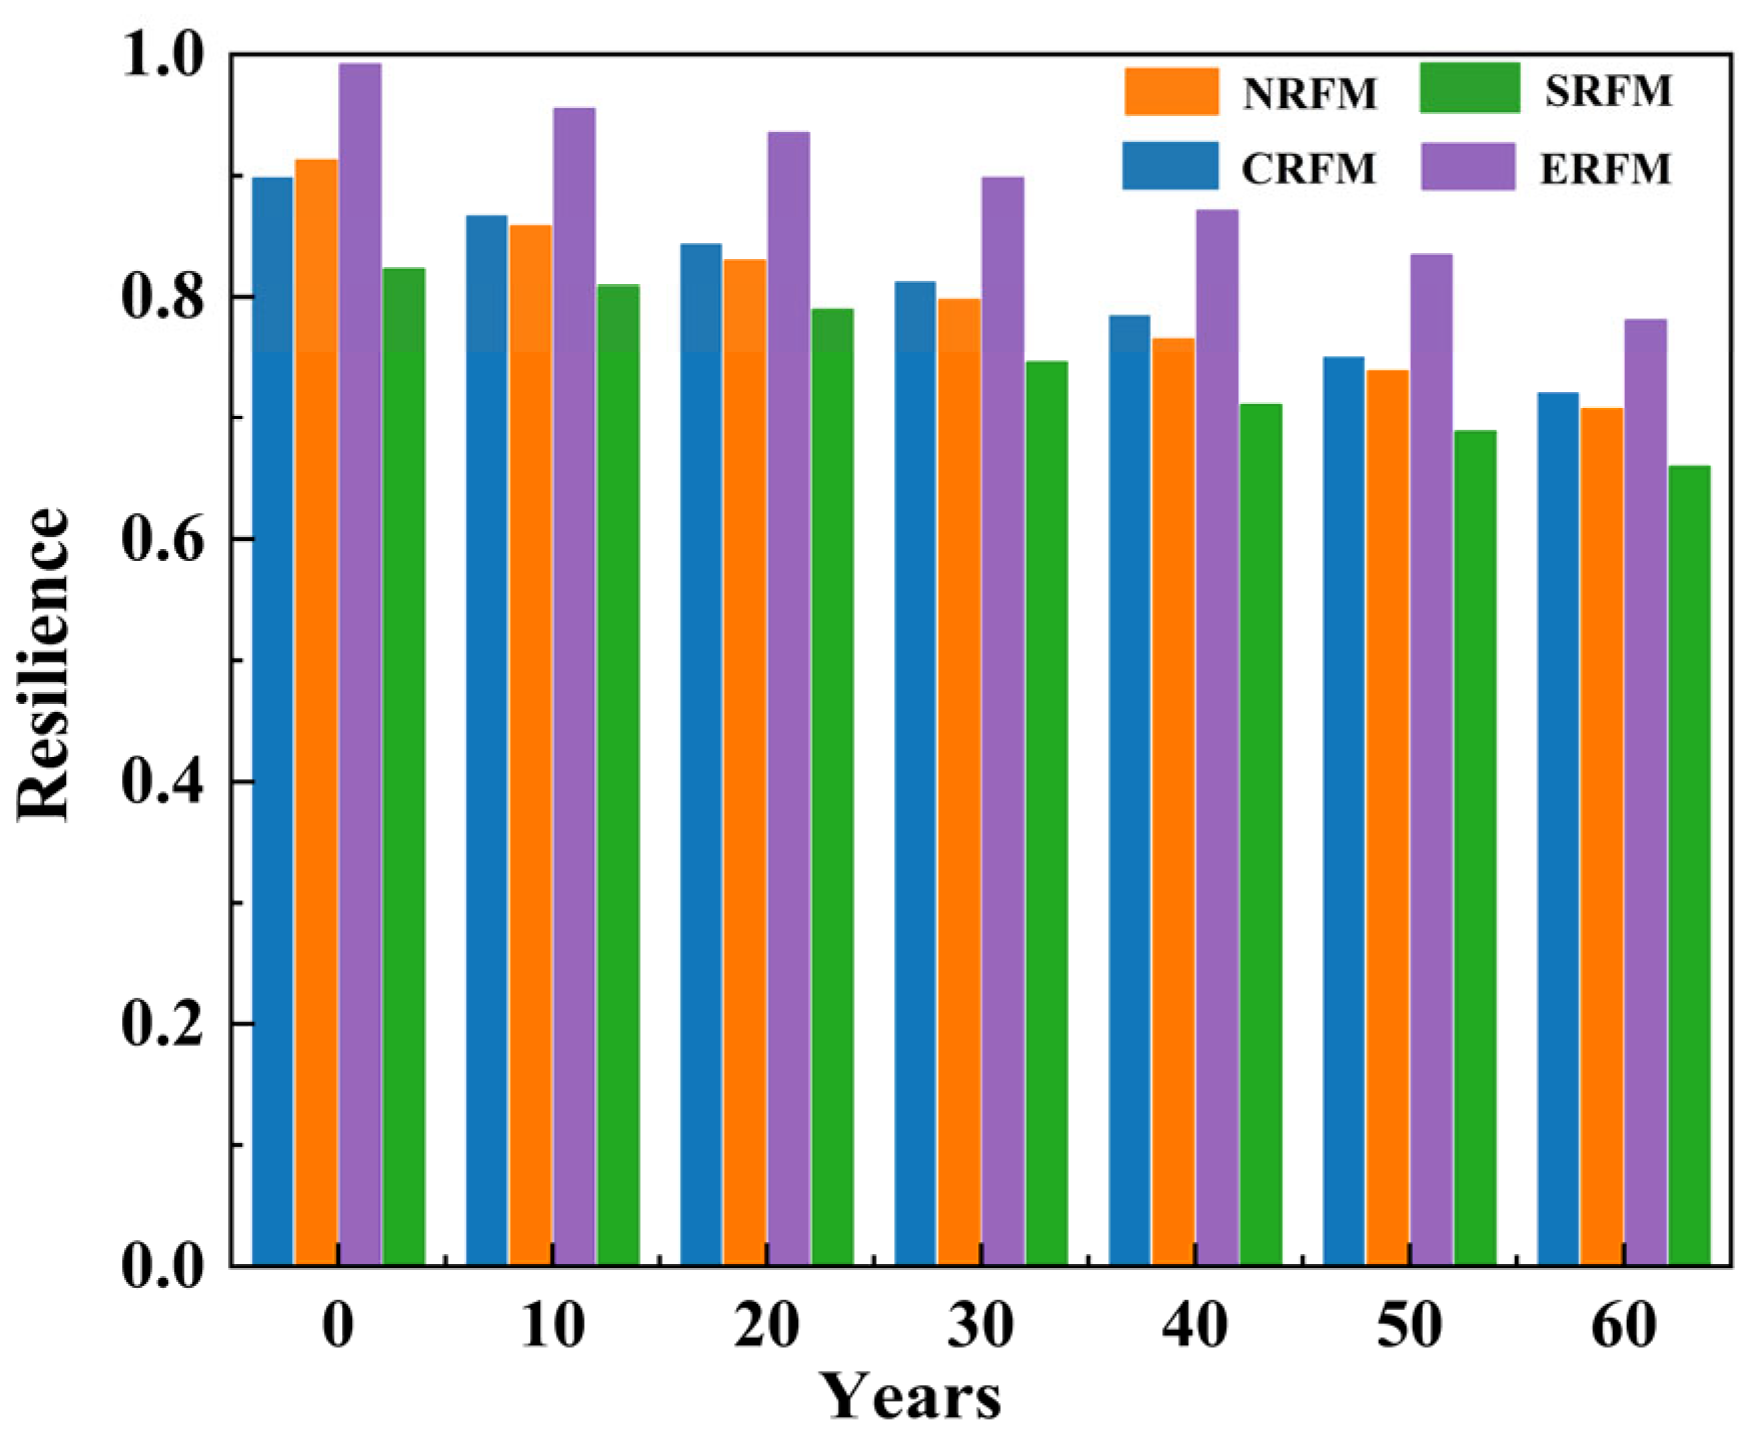
Figure 15 presents a comparative analysis of four computational approaches for evaluating seismic resilience at PGA = 0.3 g. While the conventional recovery function method (CRFM) demonstrates result reliability, its practical application is constrained by two major limitations: computationally intensive procedures and heightened sensitivity to parameter variations. Three modified techniques were consequently developed and benchmarked against CRFM: (1) The exponential recovery function method (ERFM) exhibits a systematic positive bias of 8.2–11.2%, attributable to its idealized representation of recovery asymptotes. (2) The sinusoidal recovery function method (SRFM) shows a consistent 7.9% underestimation, resulting from incomplete characterization of structural behavior during the recovery phase. (3) The method of calculating the resilience index using Equation (18) is defined as a novel recovery function method (NRFM), which implements optimized parameterization schemes, demonstrating a near-equivalent performance with only 0.9–2.4% variation from reference CRFM values. The advanced NRFM achieves significant efficiency gains, requiring 64% fewer input variables than CRFM while keeping computational errors within a 3% threshold. This performance advantage remains stable across elevated seismic intensities (PGA = 0.6–1.2 g), with methodology-induced variations consistently below the 3% tolerance limit under all examined loading scenarios.
Limited by the research scope and paper length, this study exclusively investigates the seismic resilience of an individual bridge, without extending the analysis to the time-dependent systemic seismic resilience of bridges within highway networks. Further research is warranted to address this aspect.

7.4. Assessment of Economic Losses

Table 1 comprehensively outlines the key variables implemented in the analytical framework for evaluating structural losses, categorized into direct and indirect impact assessments. The methodology addresses uncertainty quantification by establishing probability bounds through extensive Latin Hypercube Sampling (10,000 simulation cycles). The developed assessment methodology employs a dual computational strategy: (1) direct economic losses are assessed via Equations (19) and (20), combining probabilistic repair cost estimates with discrete damage-state likelihoods; and (2) indirect impacts are systematically evaluated through Equations (21)–(23) to account for cascading effect pathways.
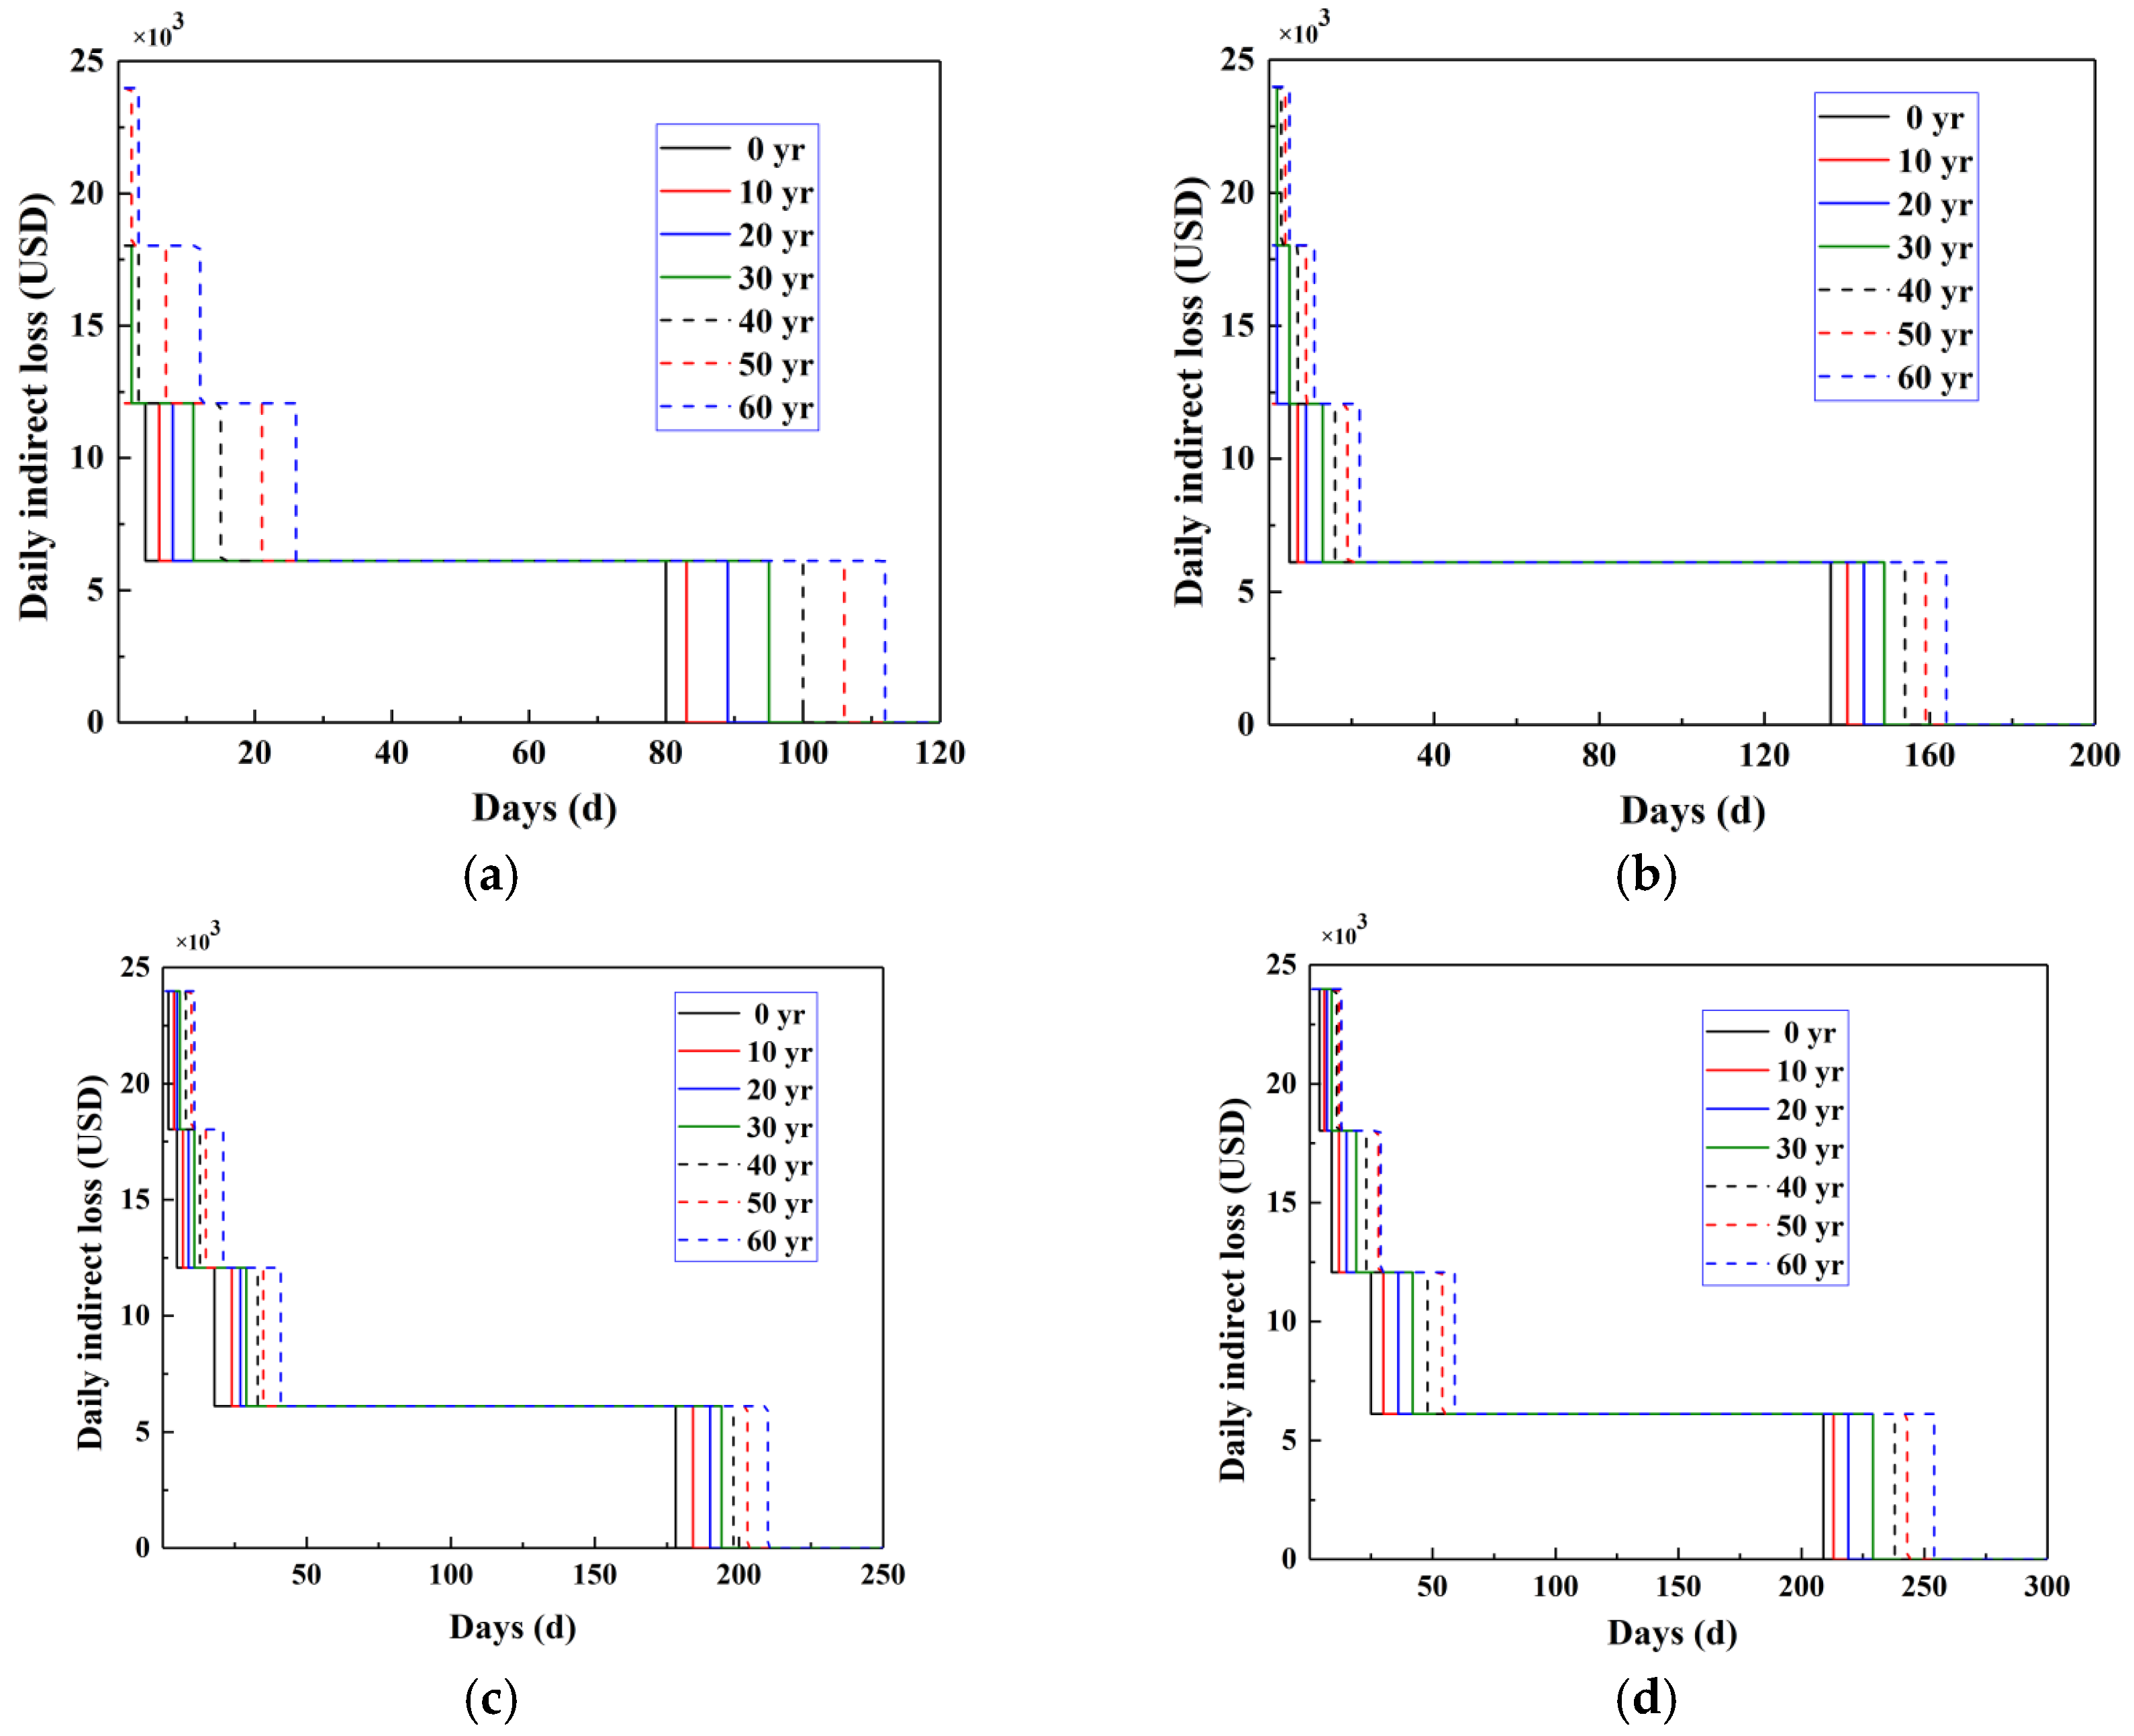
Figure 16 analyzes the interdependencies among three critical factors: daily secondary economic impacts (encompassing detour-related expenses and temporal costs), earthquake magnitude measures, and chloride deterioration timelines. The analysis reveals several significant patterns: (1) Dual Correlation Effect: Economic impacts grow proportionally with both ground motion intensity and corrosion timespan, as modeled by the recovery function Q(t). (2) Acceleration Impact: Under extreme shaking conditions (PGA = 1.2 g), combined with extended corrosion exposure, secondary costs amplify dramatically, while system restoration periods lengthen considerably. (3) Cost Escalation Patterns: Moderate seismic events (PGA = 0.3 g) show a $58,000 cost increment per 10 year corrosion interval, and strong seismic events (PGA = 1.2 g) exhibit nearly doubled cost increments ($108,000 per decade). (4) Nonlinear Progression: The cost–intensity relationship follows a characteristic J-curve pattern, with initial modest growth giving way to exponential escalation.
Figure 17 analyzes the combined economic impacts, revealing that indirect losses consistently exceed direct damages, with total losses increasing proportionally to both seismic intensity (PGA) and chloride exposure time, ultimately resulting in prolonged service disruptions and heightened financial costs.

8. Conclusions

This research presents an integrated probabilistic approach for evaluating seismic resilience and economic impacts throughout the service life of coastal continuous girder bridges, combining chloride penetration modeling with performance-based engineering principles. Structural response was characterized through critical demand parameters such as pier drifts and bearing movements, while post-event functionality, resilience metrics, and financial consequences were thoroughly examined using nonlinear dynamic analysis and probabilistic fragility evaluation. The study’s novel aspects include: (i) an innovative framework for determining resilience indices (RI), and (ii) a detailed assessment of chloride corrosion effects on lifecycle costs. Extensive fragility-based probabilistic analysis verifies the enhanced precision of the developed RI quantification technique for severe earthquake scenarios. Key outcomes include:
(1)
A highly reliable fragility prediction model (R2 > 0.95) was established through multivariate analysis of seismic damage indicators. Statistical fragility profiles indicate that chloride attack substantially elevates structural susceptibility, particularly for piers rather than bearings. The interaction between chloride deterioration and seismic acceleration intensifies the recovery function Q(t) impairment, accelerating performance decline. Post-seismic rehabilitation measures, featuring targeted damage repair and stiffness augmentation, effectively restored operational capacity within required timeframes.
(2)
Nonlinear resilience degradation patterns were identified to both ground motion severity and chloride exposure time. Analytical results quantify that 0.3 g PGA enhancements reduce RI by 11.4–18.2%, while ten-year chloride exposure intervals lead to more moderate 2.7–6.2% reductions. NRFM refines existing ERFM and SRFM approaches by integrating probabilistic failure analysis. Verification against CRFM shows discrepancies ≤ 2.4% in stochastic analyses, confirming the method’s reliability.
(3)
Financial analysis demonstrated significant indirect cost amplification due to seismic intensity and corrosion duration, with each decade of chloride penetration increasing secondary expenses by $58,000–$108,000. Indirect impacts consistently outweighed direct damages, substantially influencing rehabilitation scheduling and resource allocation.
Future research should systematically investigate time-dependent seismic vulnerability uncertainties in highway network bridges, integrating regional seismic occurrence probabilities with temporal accumulation of network-level losses to enable comprehensive assessment of strong earthquake impacts. Concurrently, deeper exploration is needed to address two fundamental challenges: (1) the applicability of chloride-induced corrosion models to specific bridge typologies, (2) the temporal amplification limits and corrosion-related cost growth factors to optimize seismic lifecycle evaluation protocols for reinforced concrete bridges, and (3) the development of functional recovery functions under multi-hazard coupling effects, particularly for sequential seismic and environmental stressors. These parallel research directions will significantly advance infrastructure resilience quantification and risk-informed decision-making.

Author Contributions

G.P.: Writing—original draft, Methodology, Conceptualization, Writing—review and editing, Resources. G.Y.: Funding acquisition, Supervision, Resources, Writing—review and editing. Y.Y.: Investigation, Validation. S.Z.: Formal analysis, Writing—review and editing. H.J.: Resources, Software. All authors have read and agreed to the published version of the manuscript.

Funding

This paper was supported by the Innovation and Development Joint Project of Natural Science Foundation of Chongqing, China (Grant No. CSTB2023NSCQ-LZX0077), Joint Training Base Construction Project for Graduate Students in Chongqing (Grant No. JDLHPYJD2020004), Team Building Project for Graduate Tutors in Chongqing (Grant No. JDDSTD2022003).

Data Availability Statement

The original contributions presented in this study are included in the article. Further inquiries can be directed to the corresponding authors.

Acknowledgments

These data were obtained with the support of the School of Civil Engineering, Chongqing Jiaotong University, funded by statutory research conducted at the State Key Laboratory of Mountain Bridge and Tunnel Engineering.

Conflicts of Interest

The authors declare no conflicts of interest.

Appendix A

Table A1. Selected Ground Motions.
EarthquakeYearStation NameMwMechanismRrup
(km)
Vs30
(m/s)
1 Northern Calif1952 Ferndale City Hall5.2 strike slip43.28219.31
2 Southern Calif1952 San Luis Obispo6 strike slip73.41493.5
3 Central Calif1954 Hollister City Hall5.3 strike slip25.81198.77
4 Imperial Valley1955 El Centro Array #95.4 strike slip14.88213.44
5 San Francisco1957 Golden Gate Park5.28 Reverse11.02874.72
6 Central Calif1960 Hollister City Hall5 strike slip9.02198.77
7 Northern Calif1960 Ferndale City Hall5.7 strike slip57.21219.31
8 Hollister1961 Hollister City Hall5.6 strike slip19.56198.77
9 Lytle Creek1970 Castaic-Old Ridge Route5.33 Reverse Oblique103.39450.28
10 Lytle Creek1970 Cedar Springs Pumphouse5.33 Reverse Oblique22.94477.22
11 Lytle Creek1970 Cedar Springs_Allen Ranch5.33 Reverse Oblique19.35813.48
12 Lytle Creek1970 LA-Hollywood Stor FF5.33 Reverse Oblique73.67316.46
13 Lytle Creek1970 Lake Hughes #15.33 Reverse Oblique90.42425.34
14 Lytle Creek1970 Santa Anita Dam5.33 Reverse Oblique42.52667.13
15 Lytle Creek1970 Wrightwood-6074 Park Dr5.33 Reverse Oblique12.14486
16 San Fernando1971 Anza Post Office6.61 Reverse173.16360.45
17 San Fernando1971 Carbon Canyon Dam6.61 Reverse61.79235
18 San Fernando1971 Cedar Springs_Allen Ranch6.61 Reverse89.72813.48
19 San Fernando1971 Cholame-Shandon Array #26.61 Reverse218.13184.75
20 San Fernando1971 Lake Hughes #126.61 Reverse19.3602.1
21 San Fernando1971 Maricopa Array #16.61 Reverse193.91303.79
22 San Fernando1971 Pasadena-CIT Athenaeum6.61 Reverse25.47415.13
23 San Fernando1971 Pasadena-Old Seismo Lab6.61 Reverse21.5969.07
24 San Fernando1971 San Diego Gas and Electric6.61 Reverse205.77354.06
25 San Fernando1971 San Juan Capistrano6.61 Reverse108.01459.37
26 San Fernando1971 San Onofre-So Cal Edison6.61 Reverse124.79442.88
27 San Fernando1971 Santa Anita Dam6.61 Reverse30.7667.13
28 San Fernando1971Castaic-Old Ridge Route6.61 Reverse22.63450.28
29 San Fernando1971Bakersfield-Harvey Aud6.61 Reverse113.02241.41
30 San Fernando1971 UCSB-Fluid Mech Lab6.61 Reverse124.41322.42

References

  1. Mehta, P.K. Durability of concrete-fifty ages of progress. ACI SP 1991, 126, 1–31. [Google Scholar]
  2. Li, C.Q.; Melchers, R.E. Time-dependent risk assessment of structural deterioration caused by reinforcement corrosion. ACI Struct. J. 2005, 102, 754–762. [Google Scholar] [CrossRef]
  3. Council, ASCE Advisory. 2013 Report Card for America’s Infrastructure; Reston Va American Society of Civil Engineers: Reston, VA, USA, 2013; pp. 1–4. [Google Scholar]
  4. Qeshta, I.M.; Hashemi, M.J.; Gravina, R.; Setunge, S. Review of resilience assessment of coastal bridges to extreme wave-induced loads. Eng. Struct. 2019, 185, 332–352. [Google Scholar] [CrossRef]
  5. Dong, Y.; Frangopol, D.M. Performance-based seismic assessment of conventional and base-isolated steel buildings including environmental impact and resilience. Earthq. Eng. Struct. Dyn. 2016, 45, 739–756. [Google Scholar] [CrossRef]
  6. Dong, Y.; Frangopol, D.M. Probabilistic life-cycle cost-benefit analysis of portfolios of buildings under flood hazard. Eng. Struct. 2017, 142, 290–299. [Google Scholar] [CrossRef]
  7. Frangopol, D.M.; Dong, Y.; Sabatino, S. Bridge life-cycle performance and cost: Analysis, prediction, optimisation and decision-making. Struct. Infrastruct. Eng. 2017, 13, 1239–1257. [Google Scholar] [CrossRef]
  8. Chandrasekaran, S.; Banerjee, S. Retrofit optimization for resilience enhancement of bridges under multihazard scenario. J. Struct. Eng. 2016, 142, C4015012. [Google Scholar] [CrossRef]
  9. Gidaris, I.; Padgett, J.E.; Barbosa, A.R.; Chen, S.; Cox, D.; Webb, B.; Cerato, A. Multiple-hazard fragility and restoration models of highway bridges for regional risk and resilience assessment in the United States: State-of-the-art review. J. Struct. Eng. 2017, 143, 04016188. [Google Scholar] [CrossRef]
  10. Pang, Y.; Wang, X. Enhanced endurance-time-method (EETM) for efficient seismic fragility, risk and resilience assessment of structures. Soil Dyn. Earthq. Eng. 2021, 147, 106731. [Google Scholar] [CrossRef]
  11. Bocchini, P.; Frangopol, D.M. A stochastic computational framework for the joint transportation network fragility analysis and traffic flow distribution under extreme events. Probabilistic Eng. Mech. 2011, 26, 182–193. [Google Scholar] [CrossRef]
  12. Shafieezadeh, A.; Burden, L.I. Scenario-based resilience assessment framework for critical infrastructure systems: Case study for seismic resilience of seaports. Reliab. Eng. Syst. Saf. 2014, 132, 207–219. [Google Scholar] [CrossRef]
  13. Kazmi, S.Q.A.; Naqvi, S.A.A.; Hussain, E.; Ahmed, S. Resilience Assessment Framework for an Urban Road Network Subjected to Disruptions. KSCE J. Civ. Eng. 2023, 27, 5350–5361. [Google Scholar] [CrossRef]
  14. Vishwanath, B.S.; Banerjee, S. Life-Cycle Resilience of Aging Bridges under Earthquakes. J. Bridge Eng. 2019, 24, 04019106. [Google Scholar] [CrossRef]
  15. Pang, Y.; Wei, K.; He, H.; Wang, W. Assessment of lifetime seismic resilience of a long-span cable-stayed bridge exposed to structural corrosion. Soil Dyn. Earthq. Eng. 2022, 157, 107275. [Google Scholar] [CrossRef]
  16. Motlagh, Z.S.; Dehkordi, M.R.; Eghbali, M.; Samadian, D. Evaluation of seismic resilience index for typical RC school buildings considering carbonate corrosion effects. Int. J. Disaster Risk Reduct. 2020, 46, 101511. [Google Scholar] [CrossRef]
  17. Dong, Y.; Frangopol, D.M.; Saydam, D. Time-variant sustainability assessment of seismically vulnerable bridges subjected to multiple hazards. Earthq. Eng. Struct. Dyn. 2013, 42, 1451–1467. [Google Scholar] [CrossRef]
  18. Biondini, F.; Camnasio, E.; Titi, A. Seismic resilience of concrete structures under corrosion. Earthq. Eng. Struct. Dyn. 2015, 44, 2445–2466. [Google Scholar] [CrossRef]
  19. Nettis, A.; Nettis, A.; Ruggieri, S.; Uva, G. Corrosion-induced fragility of existing prestressed concrete girder bridges under traffic loads. Eng. Struct. 2024, 314, 118302. [Google Scholar] [CrossRef]
  20. Alipour, A.; Shafei, B.; Shinozuka, M. Performance evaluation of deteriorating highway bridges located in high seismic areas. J. Bridge Eng. 2011, 16, 597–611. [Google Scholar] [CrossRef]
  21. Ghosh, J.; Padgett, J.E. Aging considerations in the development of time-dependent seismic fragility curves. J. Struct. Eng. 2010, 136, 1497–1511. [Google Scholar] [CrossRef]
  22. Szweda, Z.; Gołaszewski, J.; Ghosh, P.; Lehner, P.; Konečný, P. Comparison of Standardized Methods for Determining the Diffusion Coefficient of Chloride in Concrete with Thermodynamic Model of Migration. Materials 2023, 16, 637. [Google Scholar] [CrossRef]
  23. Bertolini, L. Steel corrosion and service life of reinforced concrete structures. Struct. Infrastruct. Eng. 2008, 4, 123–137. [Google Scholar] [CrossRef]
  24. Collepardi, M.; Marcialis, A.; Turriziani, R. Penetration of chloride ions into cement pastes and concretes. J. Am. Ceram. Soc. 1972, 55, 534–535. [Google Scholar] [CrossRef]
  25. DuraCrete. Modelling of Degradation, DuraCrete-Probabilistic Performance Based Durability Design of Concrete Structures; EU-Brite EuRam III, Contract BRPR-CT95–0132, Project BE95–1347/R4–5; Civieltechnisch Centrum Uitvoering Research: Gouda, The Netherlands, 1998. [Google Scholar]
  26. DuraCrete. Statistical Quantification of the Variables in the Limit State Functions, DuraCrete-Probabilistic Performance Based Durability Design of Concrete Structures; EU-Brite EuRam III, Contract BRPR-CT95–0132, Project BE95–1347/R9; Civieltechnisch Centrum Uitvoering Research: Gouda, The Netherlands, 2000. [Google Scholar]
  27. Du, Y.G.; Clark, L.A.; Chan, A.H.C. Residual capacity of corroded reinforcing bars. Mag. Concr. Res. 2005, 57, 135–147. [Google Scholar] [CrossRef]
  28. Karim, K.R.; Yamazaki, F. A simplified method of constructing fragility curves for highway bridges. Earthq. Eng. Struct. Dyn. 2003, 32, 1603–1626. [Google Scholar] [CrossRef]
  29. Sfahani, M.G.; Guan, H. An extended cloud analysis method for seismic fragility assessment of highway bridges. Earthq. Struct. 2018, 15, 605–616. [Google Scholar] [CrossRef]
  30. Yu, X.H.; Lv, D.G. Probabilistic seismic demand analysis and seismic fragility analysis based on a cloud-stripe method. Eng. Mech. 2016, 33, 68–76. [Google Scholar]
  31. Cornell, C.A.; Jalayer, F.; Hamburger, R.O.; Foutch, D.A. Probabilistic basis for 2000 sac federal emergency management agency steel moment frame guidelines. J. Struct. Eng. 2002, 128, 526–533. [Google Scholar] [CrossRef]
  32. Federal Emergency Management Agency (FEMA), The Department of Homeland Security (DHS). Multi-hazard loss estimation methodology earthquake model. In HAZUS®MH MR4 Technical Manual; National Institute of Building Sciences: Washington, DC, USA, 2003. [Google Scholar]
  33. Choi, E.; DesRoches, R.; Nielson, B. Seismic fragility of typical bridges in moderate seismic zones. Eng. Struct. 2004, 26, 187–199. [Google Scholar] [CrossRef]
  34. Nielson, B.G.; DesRoches, R. Seismic fragility methodology for highway bridges using a component level approach. Earthq. Eng. Struct. Dyn. 2007, 36, 823–839. [Google Scholar] [CrossRef]
  35. Lu, J.; Li, Z.; Teng, J. Seismic Resilience Evaluation of High-Rise Frame-Core Tube Structure Considering Structural Network Performance Loss and Repair Path. Buildings 2025, 15, 23. [Google Scholar] [CrossRef]
  36. Federal Emergency Management Agency (FEMA), The Department of Homeland Security (DHS). Multi-hazard loss estimation methodology earthquake model. In HAZUS®MH 2.1 Technical Manual; National Institute of Building Sciences: Washington, DC, USA, 2012. [Google Scholar]
  37. Werner, S.D.; Taylor, C.E.; Cho, S.; Lavoie, J.P.; Huyck, C.K.; Eitzel, C.; Eguchi, R.T. REDARS 2 Methodology and Software for Seismic Risk Analysis of Highway Systems (MCEER-06-SP08); Multidisciplinary Center for Earthquake Engineering Research: Buffalo, NY, USA, 2006. [Google Scholar]
  38. Applied Technology Council. Earthquake Damage Evaluation Data for California, ATC-13; Applied Technology Council: Redwood City, CA, USA, 1999. [Google Scholar]
  39. Federal Emergency Management Agency (FEMA), The Department of Homeland Security (DHS). Multi-hazard loss estimation methodology earthquake model. In HAZUS®MH MR5 Technical Manual; National Institute of Building Sciences: Washington, DC, USA, 2011. [Google Scholar]
  40. Cimellaro, G.P.; Reinhorn, A.M.; Bruneau, M. Seismic resilience of a hospital system. Struct. Infrastruct. Eng. 2010, 6, 127–144. [Google Scholar] [CrossRef]
  41. Camnasio, E. Lifetime Performance and Seismic Resilience of Concrete Structures Exposed to Corrosion. Ph.D. Thesis, Politecnico di Milano, Milan, Italy, 2013. [Google Scholar]
  42. Zheng, Y.; Dong, Y.; Li, Y. Resilience and life-cycle performance of smart bridges with shape memory alloy (SMA)-cable-based bearings. Constr. Build. Mater. 2018, 158, 389–400. [Google Scholar] [CrossRef]
  43. Dong, Y.; Frangopol, D.M. Risk and resilience assessment of bridges under mainshock and aftershocks incorporating uncertainties. Eng. Struct. 2015, 83, 198–208. [Google Scholar] [CrossRef]
  44. Dassault Systèmes. ABAQUS Theory Manual, Version 6.16. Software Documentation. Dassault Systèmes: Providence, RI, USA, 2016.
  45. Mander, J.B. Seismic Design of Bridge Columns; University of Canterbury: Christchurch, New Zealand, 1983. [Google Scholar]
  46. AASHTO. Guide Specification for Seismic Isolation Design, 4th ed.; American Association of State Highway and Transportation Officials: Washington, DC, USA, 2014. [Google Scholar]
  47. Li, H.N.; Li, C. Research progress on life-cycle based bridge structural seismic performance evaluation and design method. China J. Highw. Transp. 2014, 27, 32–45. [Google Scholar] [CrossRef]
  48. Pacific Earthquake Engineering Research Center. PEER Ground Motion Database-PEER Center. Available online: https://ngawest2.berkeley.edu/ (accessed on 3 March 2024).
  49. Calderone, A.J.; Lehman, D.E.; Moehle, J.P. Behavior of Reinforced Concrete Bridge Columns Having Varying Aspect Ratios and Varying Lengths of Confinement; PEER 2000/08; Pacific Earthquake Engineering Research Center: Berkeley, CA, USA, 2000. [Google Scholar]
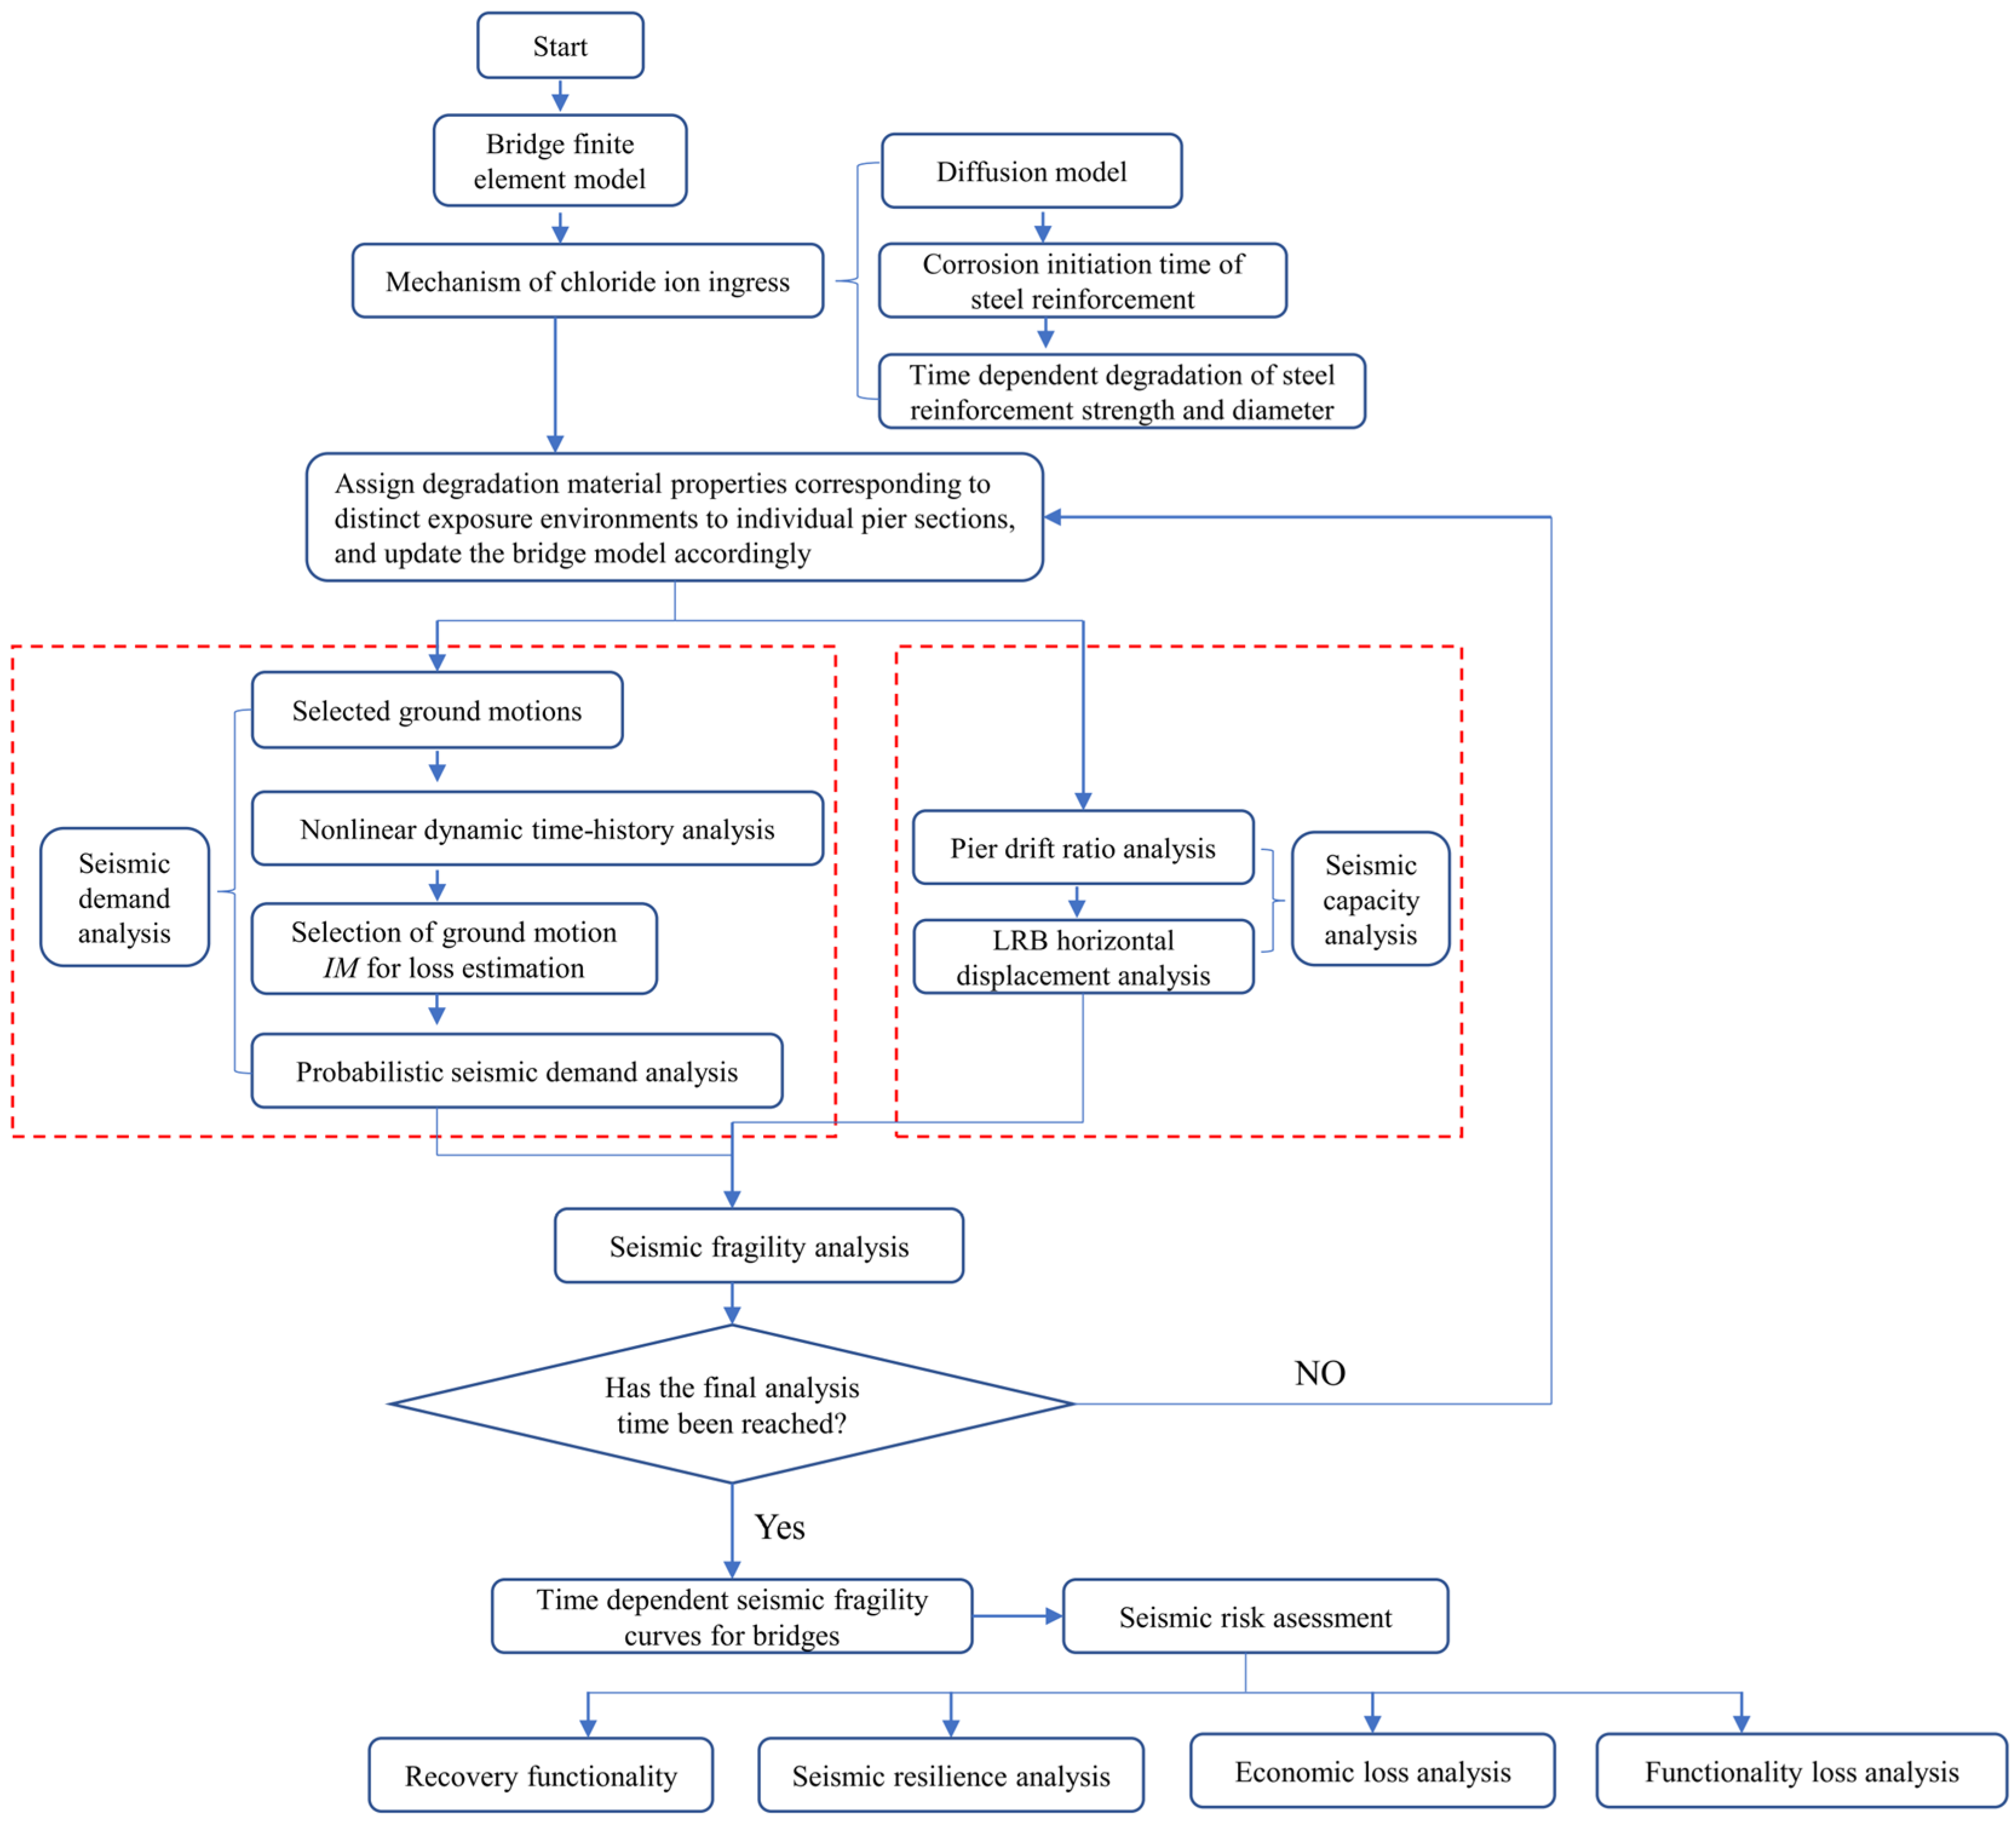
Figure 1. Technical workflow diagram for fragility analysis and seismic resilience assessment.
Buildings 15 03315 g001
Figure 2. Recovery functionality and definition of resilience.
Buildings 15 03315 g002
Figure 3. Functionality degradation under chloride ion erosion (environmental aggressiveness with ① slight/moderate exposure or ② severe exposure).
Buildings 15 03315 g003
Figure 4. Recovery functions when the shape parameter w = 10.
Buildings 15 03315 g004
Figure 5. Overall layout of 3D finite element model.
Buildings 15 03315 g005
Figure 6. Pseudo-acceleration response spectra of the selected ground motions.
Buildings 15 03315 g006
Figure 7. Lateral force-displacement hysteretic curves of piers.
Buildings 15 03315 g007
Figure 8. The pier of load–displacement curves under different years.
Buildings 15 03315 g008
Figure 9. Comparison of PSDAs between (a) piers and (b) bearings, both versus PGA.
Buildings 15 03315 g009
Figure 10. Seismic fragility curves of piers at different service years for: (a) slight damage state; (b) moderate damage state; (c) major damage state; and (d) complete damage state.
Buildings 15 03315 g010
Figure 11. Seismic fragility curves of bearings at different service years for: (a) slight damage state; (b) moderate damage state; (c) major damage state; and (d) complete damage state.
Buildings 15 03315 g011
Figure 12. Seismic fragility curves of systems at different service years for: (a) slight damage state; (b) moderate damage state; (c) major damage state; and (d) complete damage state.
Buildings 15 03315 g012
Figure 13. The recovery functionality of the bridge under varying PGA: (a) 0.3 g; (b) 0.6 g; (c) 0.9 g; and (d) 1.2 g.
Buildings 15 03315 g013
Figure 14. Resilience index under different PGA and chloride exposure years.
Buildings 15 03315 g014
Figure 15. Benchmarking of resilience index solution methods (0.3 g).
Buildings 15 03315 g015
Figure 16. Indirect losses incurred daily by the representative bridge when subjected to chloride ion erosion for differing durations: (a) 0.3 g; (b) 0.6 g; (c) 0.9 g; (d) 1.2 g.
Buildings 15 03315 g016
Figure 17. Financial impacts on the case study bridge from various earthquake events and exposure times to chloride ion attack: (a) direct loss; (b) total loss.
Buildings 15 03315 g017
Table 1. Parameters for direct and indirect loss assessment.
ParametersNotationMeanCVDistribution
Recovery time increasing ratioθt1.6 bN/AN/A
Unit reconstruction cost per square meter for piers (USD/m2)c1100,000 b0.2LN b
Unit refurbishment cost for an individual isolation bearing (USD)c210,000 b0.2LN b
The ratio of maintenance costs for the j-th damage stateβjN/AN/AN/A
The cross-sectional area of the i-th pier elementAiN/AN/AN/A
The probability of the j-th damage state of the i-th pier element at a specified IMPi,jN/AN/AN/A
The probability of the j-th damage state of the kth bearing element at a given IMPk,jN/AN/AN/A
The total number of bearing unitsmN/AN/AN/A
The total number of pier unitsnN/AN/AN/A
The cost-augmenting factor of the i-th pier elementθc2.2 bN/AN/A
Duration of chloride ion exposure (years)ŋN/AN/AN/A
The growth rate of chloride ion erosion repair costsλc1.3 bN/AN/A
Mean daily trafficMDT19,750 cN/AN/A
Daily truck traffic ratioT0.13 cN/AN/A
Length of detour distance (km)Ld2 cN/AN/A
Length of the transport link incorporating the bridge (km)Ll6 cN/AN/A
Freight load factor for haulage vehiclesotruck1.05 cN/AN/A
Cost of ownership for private passenger vehicles (USD/km)ccar0.4 a0.2LN a
Passenger car occupancy rateocar1.5 cN/AN/A
Monetary remuneration for car drivers (USD/h)cscd11.91 a0.3LN a
Monetary remuneration for truck drivers (USD/h)cstd29.87 a0.3LN a
Mean travel speed on the deviated route (km/h)Sde50 a0.2LN a
Benchmark operating speed on the unimpaired link (km/h)S080 a0.2LN a
Cost of ownership for commercial trucking operations (USD/km)ctruck0.57 a0.2LN a
Mean travel speed on the degraded segment (km/h)Sda65 b0.2LN b
Note: CV = Coefficient of variation; LN = Log-normal distribution; and N/A = Not applicable. a Data from Dong and Frangopol [43]. b Assumed. c Data from Zheng et al. [42].
Table 2. Parameters of bearings.
Pre-Yield Stiffness (kN/m)Equivalent Stiffness
(kN/m)
Post-Yield Stiffness
(kN/m)
Yield Force (kN)
21,80045003400200
Table 3. Quantified damage measures at structural limit conditions.
ComponentDamage IndexNo DamageSlight DamageModerate DamageMajor DamageComplete Damage
PierDrift ratio θc0~0.0070.007~0.0150.015~0.0250.025~0.05>0.05
BearingDisplacement δ (mm)0~2525~5050~100100~150>150
Table 4. Parameters for PSDAs of distinct structural components and modeling approaches.
ComponentYearsabχ2R2
Pier0−4.5030.8710.02160.9967
10−4.2810.8010.02520.9954
20−4.1310.7470.03310.9931
30−4.0460.6440.02010.9944
40−3.8390.6160.01230.9962
50−3.6690.5880.01330.9953
60−3.3980.5210.01610.9932
Bearing04.8131.2710.1090.9922
105.0281.2440.05460.9959
205.1061.2250.04480.9965
305.1461.1470.04360.9961
405.2031.1330.05510.9950
505.2571.1310.04910.9955
605.3141.1130.04680.9956
Table 5. Results of nonlinear dynamic time-history analysis.
YearsPier Drift Ratio (%)LRB Horizontal Displacement (mm)
0.3 g0.6 g0.9 g1.2 g1.5 g0.3 g0.6 g0.9 g1.2 g1.5 g
00.3750.6811.0181.3681.6122160109152183
100.4070.7501.0971.4681.7362667117157192
200.4930.8451.1901.5531.8142870121160199
300.5360.8891.2401.6201.9163275126163203
400.6871.0551.4471.8622.0283377130168209
500.8141.2591.6982.1202.3443479132171214
601.0321.5201.9562.4042.6223783135177221
Disclaimer/Publisher’s Note: The statements, opinions and data contained in all publications are solely those of the individual author(s) and contributor(s) and not of MDPI and/or the editor(s). MDPI and/or the editor(s) disclaim responsibility for any injury to people or property resulting from any ideas, methods, instructions or products referred to in the content.