Article

Design and Implementation of Health Monitoring System for an Airport Terminal Building with a Large-Span Truss Steel Structure

1
School of Civil Engineering, Tianjin Chengjian University, Tianjin 300384, China
2
Tianjin Key Laboratory of Civil Structure Protection and Reinforcement, Tianjin 300384, China
3
Department of Building Structures and Structural Mechanics, Faculty of Civil Engineering and Environmental Sciences, Bialystok University of Technology, 15-351 Bialystok, Poland
*
Author to whom correspondence should be addressed.
The author Xuyue Wang contributed equally to this work with the first author.
Buildings 2025, 15(18), 3308; https://doi.org/10.3390/buildings15183308
Submission received: 12 August 2025 / Revised: 8 September 2025 / Accepted: 11 September 2025 / Published: 12 September 2025

Abstract

This study investigates the structural health monitoring and stress prediction of large-span steel roof structures in airport terminals, focusing on the impact of temperature variations and the development of an advanced hybrid prediction model. A comprehensive monitoring system was designed and implemented to track key structural responses, including stress, displacement, and temperature, revealing significant correlations between thermal effects and structural behavior. To enhance predictive accuracy, a BO-CNN-LSTM hybrid model was proposed, integrating Bayesian optimization with convolutional and long short-term memory neural networks. The model demonstrated superior performance in capturing spatial–temporal stress patterns compared to traditional methods, providing a reliable tool for real-time structural assessment and early warning. The findings highlight the importance of temperature effects on structural integrity and offer practical insights for the health monitoring of large-span steel structures in complex environments. This study provides a reference for future research on structural health monitoring and performance assessment.

1. Introduction

In recent years, with the rapid economic development in China, significant achievements have been made in the construction industry, particularly in the field of large-span spatial structures. WANG and others took the Xining Haihu Gymnasium as a case to introduce health monitoring technology that applies the fiber grating sensor and vibrating wire sensor during the construction phase of the gymnasium. During the construction stage, the stress variations in each of the main reinforcement bars remained stable, and the internal force was far less than the yield strength of the reinforcing bar. Furthermore, the stress of each structural member was consistently less than the serviceability limit state, meeting the design requirements. The displacement monitoring data of each member was stable and the structural stiffness reserve is abundant [1]. TANG and others proposed a real-time comparison strategy of stress and unloading point displacement based on response increment. Based on a real large-span truss structure in China, they proposed four construction schemes and conducted simulation studies. The proposed construction scheme and monitoring strategy were applied to monitor the stress and displacement of the large-span truss structure. By comparing the monitoring data with the simulation results, the feasibility of this strategy in construction monitoring was validated. This approach not only enhances the efficiency of construction monitoring but also ensures construction safety [2]. Based on the health monitoring system of the large-span cantilever spatial structure of the Taiyuan Botanical Garden in China, XU and others monitored the strain of welding details of welded pipe joints in the main truss for a long time and investigated the processing method of massive monitoring data. The study reveals that fatigue damage of the welds is primarily caused by a small number of medium-amplitude strain cycles. When the load growth effect is taken into account, the rate of fatigue damage development at the welds significantly accelerates, leading to a prominent reduction in the fatigue life and fatigue reliability index of the weld [3]. Svendsen and others proposed a data-driven structural health monitoring method for the damage detection of steel bridges and an unsupervised machine learning algorithm. The results demonstrated that relevant structural damage in steel bridges could be found, and the unsupervised machine learning can be performed nearly as well as the supervised methods learning [4]. Aiming to ensure the structural safety of historic buildings during its renovation process, LI and others designed a structural health monitoring system to monitor the overall state of the structure and the condition of critical components. The structural health monitoring system includes sensors, data acquisition, and data management system. The design of the monitoring system and the installation of the sensors are discussed in depth, followed by an analysis of the monitoring data to investigate the state of the structure before and after renovation. Additionally, a structural safety assessment was conducted based on multi-source monitoring data and neural networks [5].
Structural health monitoring (SHM) integrates the latest sensor technology, computer science, and information technology and is dedicated to real-time monitoring of key physical parameters, such as deformation, temperature, humidity, stress, and environmental factors, of building structures. The system can accurately identify abnormal deformations and cracks in a structure and provide reliable data support for timely maintenance measures, thereby ensuring the safety and reliability of buildings. The application of SHM systems not only enhances the emergency response capability of buildings but also lays a scientific foundation for the long-term maintenance and management of structures, marking a step towards a greater level of advancement in construction engineering technology [6,7,8]. Li et al. developed a digital twin-based SHM system that combines Bayesian modal identification, response reconstruction, and PCA-driven anomaly detection, achieving high-precision simulation of bridge dynamics and real-time warning capabilities. This work offers a groundbreaking approach to smart infrastructure maintenance [9]. Desjardins and Lau utilized long-term vibration monitoring data from the Confederation Bridge to develop a regression model linking environmental factors to modal parameters. They proposed a damage identification method based on residual change point detection, which reduced the detectable frequency shift threshold to 0.4%, establishing a new paradigm for micro-damage monitoring in bridges [10]. Alsehaimi et al. employed structural equation modeling to validate the synergistic enhancement effect of five key IoT technical dimensions (including adaptive control and real-time monitoring) on the seismic resilience of buildings. The study revealed that real-time data analysis contributed the most significantly (β = 0.507), providing a quantifiable implementation framework for intelligent monitoring in seismically active regions [11]. Mayank Mishra and others explored the application of wireless Internet of Things technology in the inspection of civil engineering infrastructure and used sensor data to predict masonry structure deterioration, formwork removal time, and seismic vulnerability identification and assessment of various damage types [12]. Tang et al. proposed a new data anomaly detection method based on convolutional neural networks that is capable of efficiently and accurately monitoring multimodal anomalies in SHM data, thus providing strong support for SHM data preprocessing [13]. In addition, Zhao et al. proposed a Gaussian Mixture Model (GMM)-based method for data modeling and prediction of physical systems. By adaptively determining the number of GMM components and establishing a multivariate GMM prediction algorithm, the method enables interpretable analysis of bridge traffic load and environmental response data. Its prediction accuracy is comparable to that of deep learning, while also providing statistically meaningful parameters with physical significance. This approach offers a novel AI tool for fields such as structural health monitoring [14]. These studies not only promoted the development of structural health monitoring technology but also provided solid technical support and assurance for the safe construction and operation of engineering buildings.
The complexity of large-span spatial structures is reflected not only in the number and diversity of their components but also in the impact of non-uniform temperature fields, which are caused mainly by sunshine conditions, increasing the complexity of temperature effects. Many scholars have carried out a series of related studies to address the effects of temperature on the structure. Gong et al. achieved automated identification of temperature-induced anomalies in bridges (F1-score 96.3%) through Gramian Angular Field (GAF) image encoding and a lightweight CNN model. With a cross-project validation accuracy of 97%, the study provides an efficient solution for sensor fault diagnosis in regional bridge networks [15]. Zhou and others proposed a new method for simulating the non-uniform time-varying temperature field of large-span steel structures, which calculates the actual absorbed solar radiation and accurately considers the temperature effects during construction. Through engineering examples and numerical simulation studies, it was shown that sunlight cannot be ignored, and its accumulated temperature effect during construction is significant. Designers should pay special attention to this issue [16]. Sun et al. proposed a Bayesian Robust Tensor Learning (BRTF) framework that leverages third-order tensor modeling to capture bridge symmetry. Under 50% data missing conditions, the method achieved a 3.16% recovery error for deflection field reconstruction while simultaneously cleaning 15% of anomalous data, providing a highly robust solution for temperature effect analysis in cable-stayed bridges [17]. Chen et al. proposed a DL-AR model that integrates spatiotemporal features of temperature fields and nonlinear correlations in structural responses. Under 50% data missing conditions, the model achieved a reconstruction accuracy of 1.4 μɛ, establishing a cross-scale analysis paradigm from meteorological data to structural responses for temperature-dominated bridge health monitoring [18]. Luo Yaozhi and Mei Yujia used a wireless sensor network-based system to monitor the temperature and stress of the steel structure of the National Stadium for a long period of time and reported that the stress changes caused by obvious temperature differences distinguished the different effects of uniform and non-uniform temperature fields on the structural stress. This provides a new perspective for understanding the behavior of long-span structures in the natural environment [19,20]. At present, the performance of long-span spatial structures under the influence of the temperature effect has been studied mainly by combining tests and finite element numerical simulations.
This paper takes the steel structure roof of an airport terminal as the research object and designs a long-term health monitoring scheme for the airport terminal’s steel roof. The focus of this paper is to explore the design and application of the health monitoring system. Based on the long-term measured data of the health monitoring system, an in-depth analysis is conducted on the force patterns of key components of the airport terminal under the influence of temperature, as well as the prediction of stress changes and other core issues.

2. Engineering Background

A certain airport terminal with a large-span spatial truss structure serves as a provincial trunk line airport and is classified as a first-class national aviation port, with a total construction area of 121,700 m2. The terminal is divided into four districts from districts A to D. District D consists of three aboveground floors and one partial underground floor, with the steel structure roof having a maximum planar dimension of 145 m by 342 m.
The D district hall employs a design that combines a steel hollow truss with a triangular tube truss, ensuring both visual permeability and structural stability. The main trusses are spaced 16.2 m apart and supported on upright and Y-shaped branched steel concrete columns. The cantilever structure uses spatial trusses made of round steel pipes. The curtain wall edge columns are designed to accommodate dynamic requirements, employing different connection methods to adapt to stresses caused by temperature changes. The column top supports use spherical hinges and sliding spring supports, optimizing the stability and flexibility of the structure. The whole structure is composed of six rows of main trusses, forming a mutually supported structural system that integrates modern architectural technology and design concepts. The layout plan of the main truss structure is shown in Figure 1.

3. Design and Application of Health Monitoring Systems

The design of the health monitoring system aims to increase safety, reduce maintenance costs, and ensure the long-term stability of the structure. To achieve these objectives, the design of the health monitoring system for the large-span steel roof structure of the airport terminal should adhere to the following guidelines [21,22,23,24].
(1)
Targeted monitoring and analysis: According to the mechanical characteristics of the steel roof structure of the terminal building, finite element analysis is carried out. Moreover, cost effectiveness is considered to achieve a comprehensive understanding of the terminal situation in the most economical way.
(2)
Environmental adaptability and durability: Considering the climatic characteristics of the site, such as cold in winter, high summer temperatures, monsoons, and salt spray erosion in coastal areas, monitoring equipment and sensors must be designed to adapt to these environmental conditions.
(3)
Visual interface: The interface should clearly display the terminal’s three-dimensional model and monitoring data of the terminal, including real-time strain, displacement, and other information.
(4)
Automated monitoring: Terminal monitoring data can be displayed in real time, reducing the need for manual inspection. The system should also support mobile devices and remote access so that managers can easily monitor the status of the structure, ensuring continuity and real-time monitoring.
(5)
In the visual interface of the terminal steel roof structure health monitoring system, the service health status of the key rods monitored on site can be observed, and if the strain of a rod exceeds the predetermined threshold, the system can issue a warning to prevent unnecessary safety accidents in the terminal steel roof structure.

3.1. Functional Design of Health Monitoring Systems

Depending on the requirements of actual working conditions, the structural health monitoring system should have the following functions [25,26,27]: (1) data acquisition and data integration management: the system should have the layout of various sensors and on-site data acquisition, including the function of multiparameter monitoring such as strain, temperature, displacement, wind speed, and direction, to realize the monitoring requirements and data sharing in different periods of construction and operation and data analysis of different parameter data; (2) structural health assessment and functional early warning: the system should reasonably arrange three-dimensional monitoring points, conduct health assessments of the results, and be equipped with an early warning functions; (3) visual application interaction and display: to better present the structural model and monitoring data, the system needs to have a visual display of the 3D model of the monitoring object, as well as a real-time dynamic display and processing of the monitoring data.
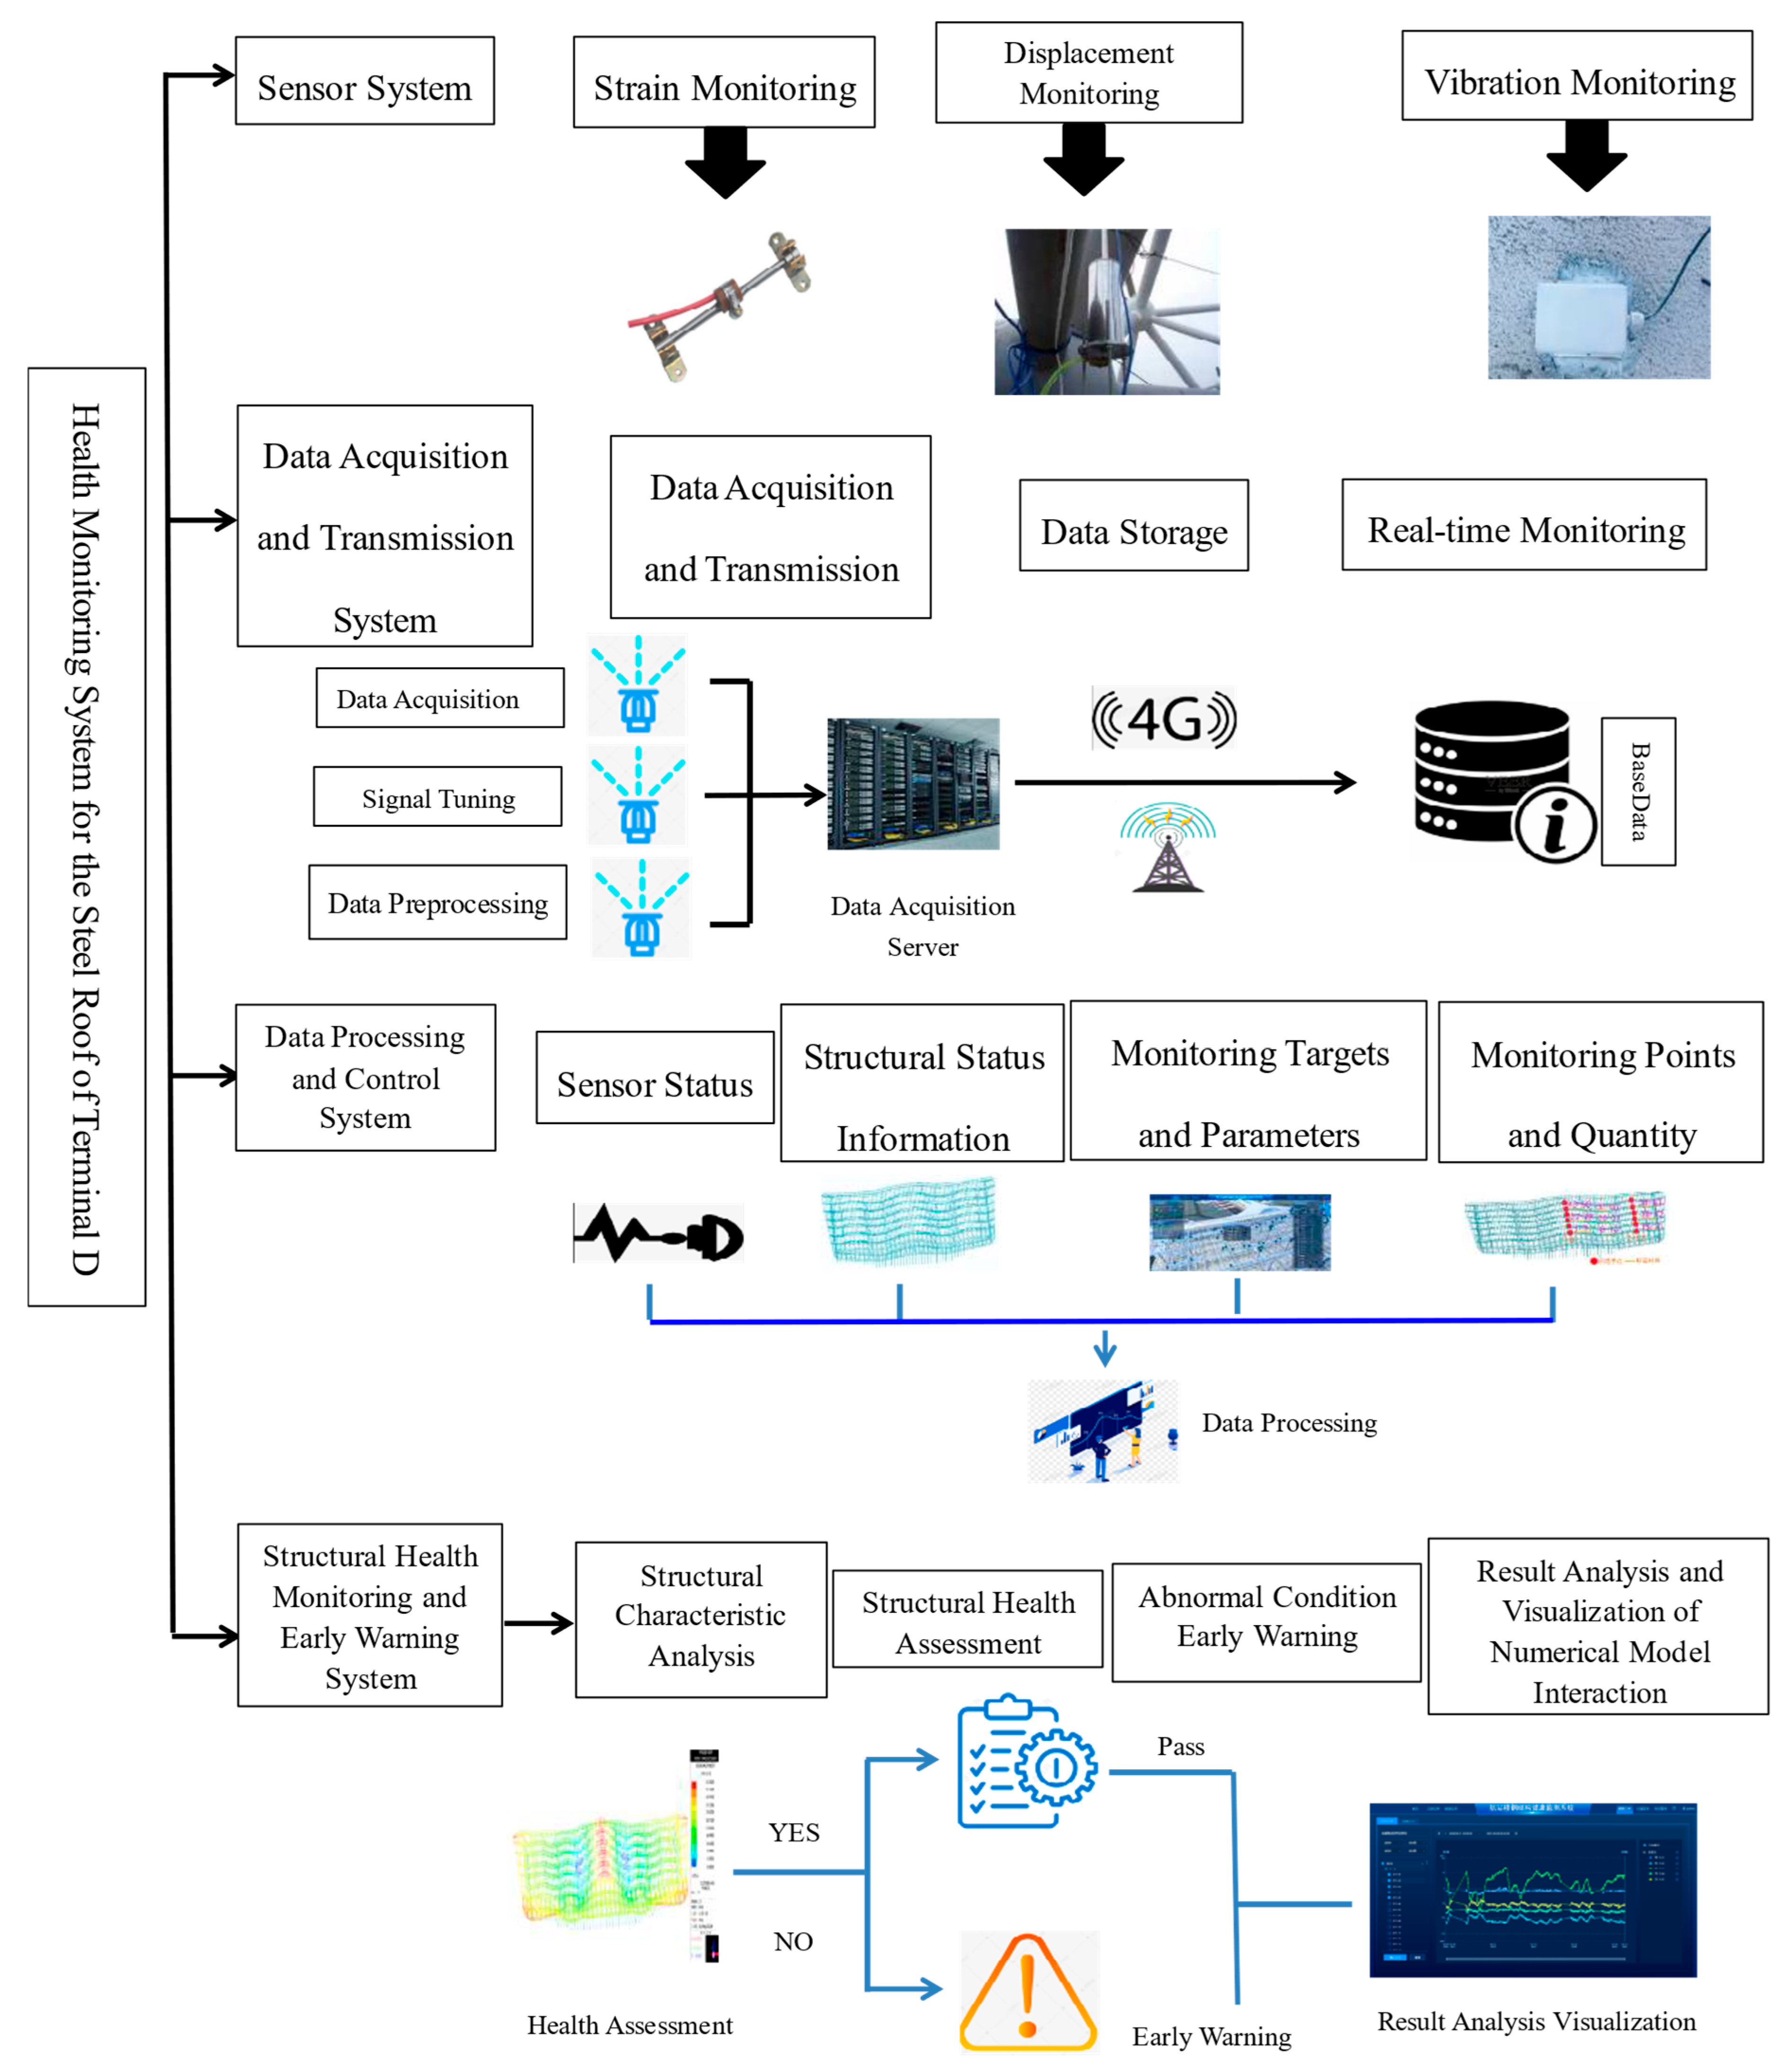
The system includes four subsystems: a sensor system, a data acquisition and transmission system, a data processing and control system, and a structural health assessment and early warning system. In this way, the functions of health assessment and abnormal state warning of the steel roof structure of a large-span space terminal can be realized to ensure the safe and long-term stable operation of the structure [28,29,30,31,32]. The functional architecture of the system is shown in Figure 2.

3.2. Sensor System Functional Design

The selected include intelligent surface vibrating-wire strain gauges, high-intelligence static level meters, and accelerometers [33].
(1)
Intelligent Surface Vibrating Wire Strain Gauges
The XL-MR150 strain gauge (Xuanlong Technology Co., Ltd., Changsha City, China, German imported steel strings) uses vibrating-wire technology, with key components being steel strings imported from Germany. The built-in temperature coding chip can be used for temperature measurement, self-calibration, and sequence recording, which is suitable for the long-term effective monitoring of long-span steel structures in terminal buildings. The features of this sensor include high precision, sensitivity, waterproofness, and stability. The built-in temperature sensor continuously monitors temperature changes, and data are transmitted through a four-core shielded cable, ensuring accurate readings. Technical parameters are shown in Table 1.
(2)
High-Intelligence Static Level Meter
The high-intelligence static level meter falls within the category of displacement sensors and is composed of an intelligent liquid level sensor and a storage tank connected by a pipe. The reference storage tank is placed on a stable horizontal reference point, whereas other storage tanks are distributed in different locations with essentially the same elevation. When there is a change in the position of these storage tanks relative to the reference tank, the liquid level inside the tanks rises or falls accordingly. By monitoring the changes in the liquid level, the vertical displacement relative to the horizontal reference point can be determined.
(3)
Accelerometer
Considering the environmental conditions of the airport terminal and the vibration characteristics caused by wind loads, in conjunction with the detailed requirements of the tender documents, the selection of sensors must meet the performance criteria of extremely low-frequency response, minimal zero-point offset, and high resolution. Technical parameters are shown in Table 2.

3.3. Main Monitoring Content and Sensor Placement

This paper focuses on the steel roof structure of the airport terminal, monitoring the wind speed, structural acceleration, strain of key nodes and components, deformation, and temperature. Through comprehensive analysis of actual monitoring data, combined with safety assessment techniques, the overall structural safety status is evaluated. The main monitoring content focuses on the monitoring of three core physical quantities:
(1)
Stress and strain monitoring of critical sections (including temperature monitoring at sensor locations);
(2)
Monitoring the overall displacement of the structure, including horizontal and vertical displacements;
(3)
Vibration monitoring of the structure as a whole and in local areas.
The airport terminal roof steel structure consists of a total of six rows of main trusses. Considering the principle of overall structural symmetry, the strain gauges should be concentrated in a semiopen layout, with the 1st/3rd/5th rows of main measurement points arranged to the right and the 2nd/4th/6th rows of main measurement points arranged to the left. The strain change value of the structure is collected by the vibrating string strain gauge installed at the terminal site. The stress change value can be obtained by multiplying the strain change value by the elastic modulus of the material. A detailed layout diagram of the strain gauge sensor measurement points is shown in Figure 3 and Figure 4.
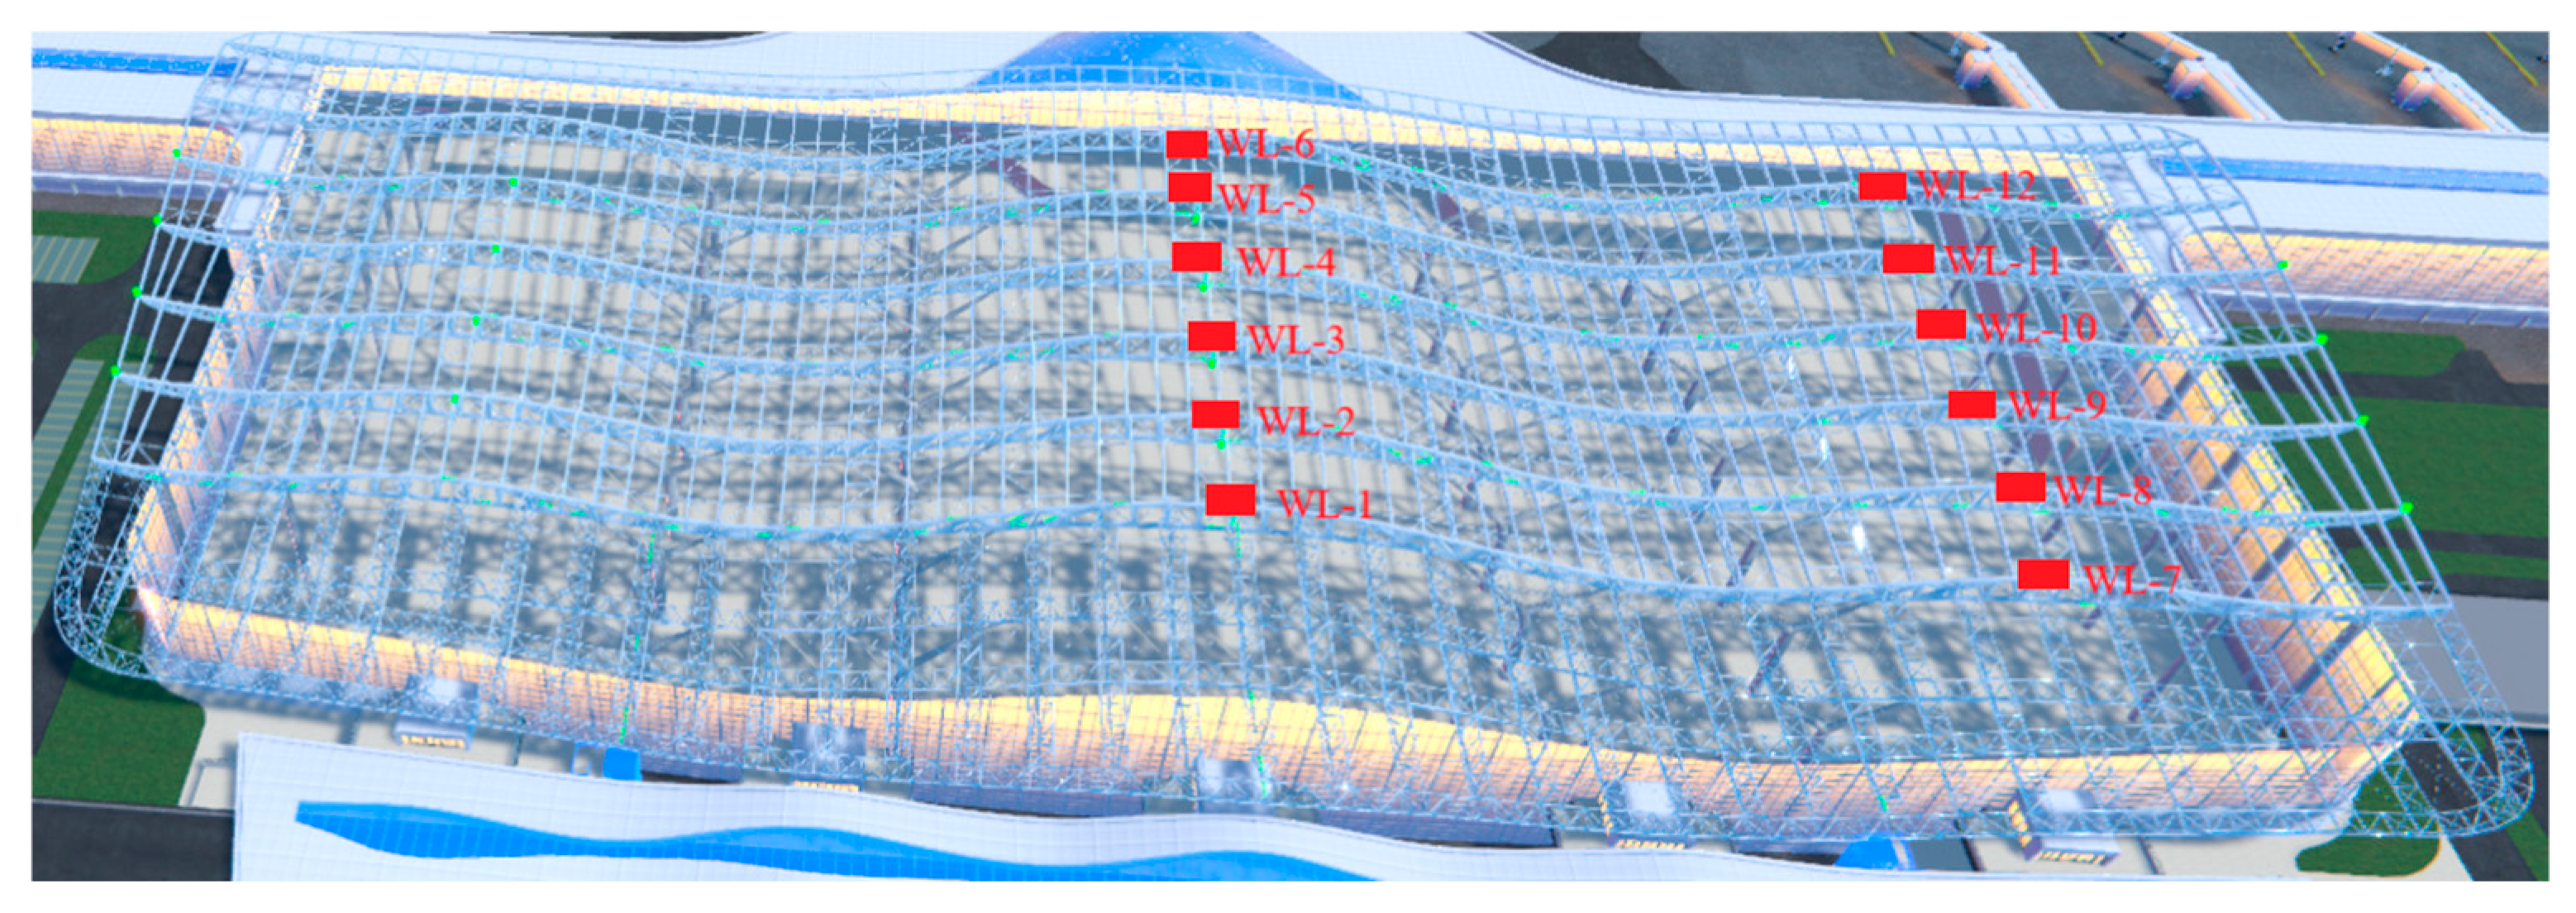
To ensure the accuracy and representativeness of the monitoring data, a total of 12 displacement monitoring points were selected on the basis of the comprehensive analysis of the mechanical characteristics of the structure, considering the economy and practicability. These monitoring points are located at the highest point of the six structural spans of the main truss, and one monitoring point is set at the maximum span of each truss to accurately capture the displacement response of the structure in the maximum stress area. Another six monitoring points are arranged in the midspan between the Y-shaped column and the vertical column, one for each structure, to monitor the displacement changes in the key nodes of the structure comprehensively. Among them, WL-1 and WL-7 serve as reference points. The layout of these monitoring points is designed to fully capture the force state and deformation characteristics of the steel roof structure, providing a scientific basis for the assessment of the structure’s health condition and safety early warning. The displacement layout is shown in Figure 5.
The focus of vibration monitoring for the steel roof structure of the airport terminal is on three-directional vibrations. The information on structural vibrations is primarily in the form of acceleration signals. The acceleration vibration signals obtained through the structural health monitoring system are mainly used for the following:
(1)
To determine the dynamic properties of the structure;
(2)
To provide fundamental data for the refinement of the structural finite element model and the safety assessment of the structure through monitoring the overall vibration signals.
Considering the complexity of the structure, the monitoring of its structural vibration includes X, Y, and Z three-directional vibrations. In the second, third, fourth, and fifth main trusses, five acceleration sensors are arranged to capture the vibration of the part in real time, and the vibration characteristics of the steel structure under different external excitations are analyzed according to the vibration of the part.
This design utilizes a total of 21 intelligent surface vibrating-wire strain gauges, 12 high-intelligence static level meters, and 20 accelerometers.

3.4. Functions of the Health Monitoring System

The main contents of the user interface on the homepage of the visualization platform for the steel roof structure health monitoring system of the airport terminal are as follows:
(1)
Three-dimensional model display: A comprehensive 3D model of the airport terminal’s steel roof, developed using the Unity3D engine, provides an immersive and interactive scene navigation experience, showcasing structural details and the surrounding environment.
(2)
Navigation and interaction: Users can control the perspective with the mouse to navigate, view the full scope of the terminal, and access the locations and data of installed sensors, enabling intuitive interaction between the model and data.
(3)
Functional panels: The homepage integrates an environmental information panel, a sensor status panel, a monitoring point list panel, and a structure visibility panel, displaying meteorological information, sensor status, and detailed monitoring point information.
(4)
Monitoring status display: Real-time reflection of sensor online status, including normal online and abnormal status (highlighted in red), ensuring the timeliness and accuracy of monitoring data.
The main contents of the data management function module for the steel roof structure health monitoring system of the terminal building are as follows:
(1)
Real-time data display: The system displays real-time strain, temperature, displacement, and acceleration data monitored by various sensors, presenting them in graphical form for easy observation of data trends.
(2)
Historical data query: Supports querying historical sensor data by selecting specific dates or time periods (e.g., current day, past week, past month), with trends displayed in charts.
(3)
Data export function: Allows online display and querying of data, enabling users to select specific sensors and time periods to export data for local download and further analysis.
The main contents of the data analysis function module for the steel roof structure health monitoring system of the terminal building are as follows:
(1)
The system’s data analysis module allows for the comparative analysis of multiple sets of measured data from sensors, such as strain and temperature data from strain gauges, displacement data from displacement meters, and acceleration data from accelerometers. By comparatively analyzing the relationships between data indicators measured by different sensors, users can intuitively understand the correlations and trends in the data.
(2)
It provides visual chart displays for multiple datasets, enabling users to select and plot data from multiple sensors over any time period. The module also includes a cloud map display function for finite element analysis results.
The alarm management module of the terminal steel roof structural health monitoring system provides single-indicator alarm functionality and online modification of custom thresholds. Within the single-indicator alarm feature, users can display the alarm status of sensor monitoring points by selecting the alarm level and processing status of various sensor points over any time period. If data anomalies occur, an alarm is triggered and displayed along with the processing status. Additionally, the system allows for real-time online modification of early warning thresholds for monitoring point data based on finite element analysis results, thereby enabling comprehensive alarm management functionality.
The report management function of the terminal steel roof structural health monitoring system is divided into daily reports and monthly reports. On a daily or monthly basis, real-time data monitored by each sensor is summarized for safety assessment, and health evaluation reports are generated. These reports are regularly sent to the designated contact’s email to keep relevant personnel informed about structural responses under various conditions. Additionally, safety warning values and finite element models are updated accordingly.

4. Monitoring of Temperature Effects on Airport Terminals and Analysis of Structural Load Characteristics

4.1. The Impact of Temperature Effects on Structures

Temperature fluctuations have a multifaceted effect on the steel structures of large airport terminals. The deformation and stress changes caused by thermal expansion and contraction can pose potential threats to a structure. When monitoring the steel structure of large airport terminals, it is essential to consider the variation patterns between temperature and strain. The structural characteristics when the steel structure is subjected to different types of temperature loads are shown in Table 3.
When the ambient temperature of a structure changes, the members are restricted by external and internal constraints because of the displacements caused by thermal expansion or contraction. This leads to the generation of thermal stresses within the structure, which affect its mechanical performance. The influence of temperature on large-span structures such as highly hyperstatic systems is particularly significant because of the large number of members and complex structure types. When the finite element method is used to analyze the influence of temperature differences on large-span structures, only a uniform temperature load is often considered. However, actual structures are subjected to non-uniform temperature fields, making long-term thermal stress variation complex and making accurate prediction via finite element simulation alone difficult. Therefore, combining on-site measured data and real-time monitoring data of the structural stress response is a key approach for analyzing its temperature effects.

4.2. The Distribution Law of Structural Temperature Under Solar Radiation Conditions

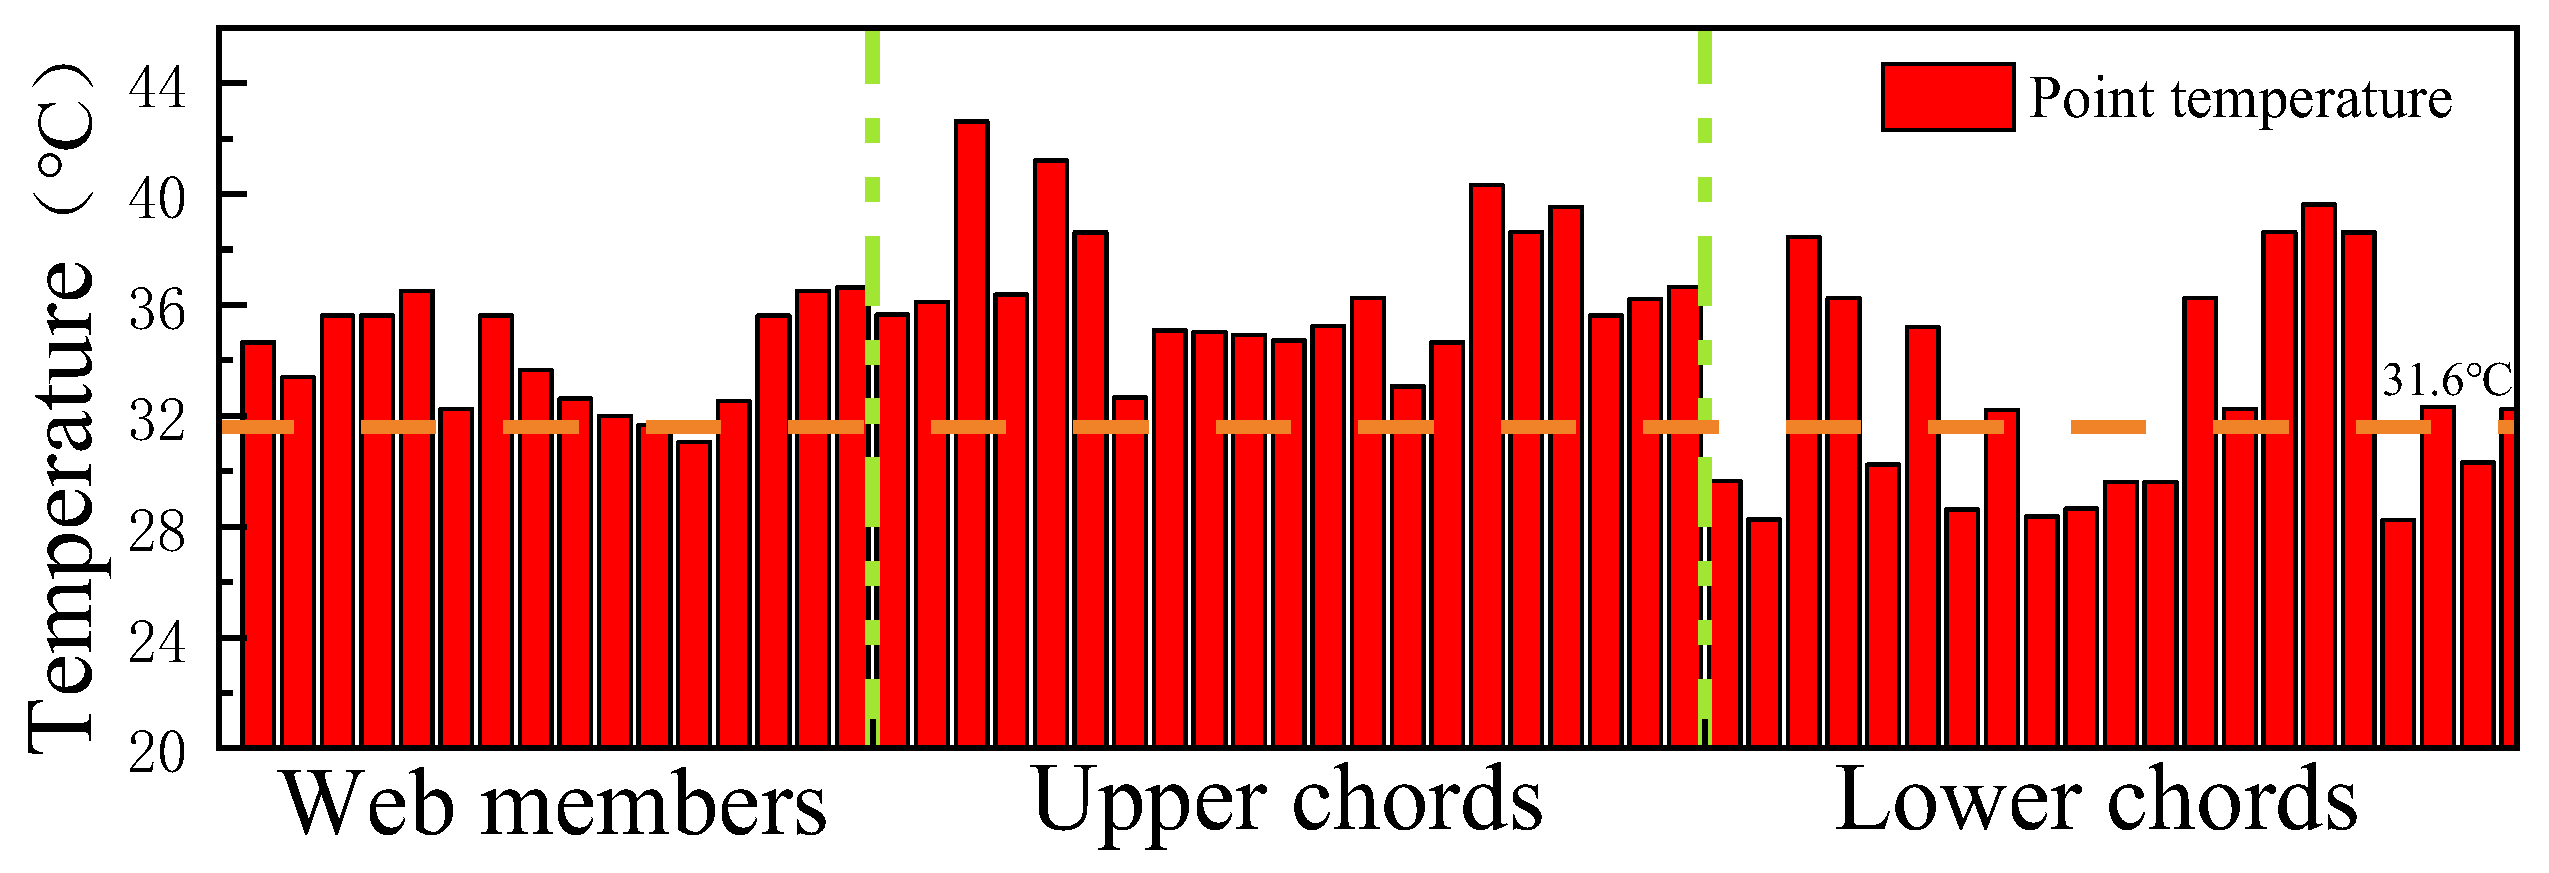
In this section, taking 14:00 on 12 January (Winter) and 12 July (Summer) 2023 as examples, the hourly average measured temperature data and hourly average meteorological temperature of each measuring point of upper and lower chords and web members of the terminal steel roof structure were selected for statistical comparison, as shown in Figure 6 and Figure 7.
From Figure 6 and Figure 7, it can be seen that in summer, due to the influence of solar radiation conditions, the temperature of structural measuring points shows obvious inhomogeneity. The temperature variation in the upper chord is the most significant, with a temperature difference of 11.37 °C. This is because it is directly exposed to sunlight, thus absorbing more heat and causing a high average temperature and wide fluctuation range.
In winter, even though the solar radiation intensity is not as strong as in summer, the inhomogeneity of temperature distribution at the measuring points is still significant. The temperature distribution of the upper chord is the most non-uniform, and the maximum temperature difference is 5.57 °C. At the same time, the north–south distribution of structure greatly affects the temperature distribution, and the temperature of the southern measuring point is higher than that of the northern measuring point. In winter, the measured point temperatures of the bar are mostly lower than the meteorological temperature, especially for web members. It shows that there is a high sensitivity of the bar to low temperature and the influence of the weakened sunshine intensity in winter on the temperature distribution. The primary reason why steel temperature falls below the ambient temperature in cold environments is its high thermal conductivity, which leads to rapid heat dissipation to the colder surroundings. Steel has a high thermal conductivity coefficient, making it an excellent conductor of heat. When exposed to a low-temperature environment, its surface quickly undergoes heat exchange with the surrounding air. Heat is rapidly conducted through the metal to the colder air, resulting in swift heat loss and causing the temperature of steel to drop below the ambient air temperature in cold conditions.
In summary, both summer and winter temperature monitoring results show that the temperature distribution of the steel roof structure is significantly affected by seasonal changes, solar radiation angles and intensity, and member positions. This uneven temperature distribution may significantly affect the structure’s thermal stress distribution, especially when considering thermal expansion or contraction, temperature differences at different places may cause uneven thermal stress, which has a potential impact on the structure’s long-term integrity and stability.

4.3. The Distribution Law of Structural Temperature Under Without Solar Radiation Conditions

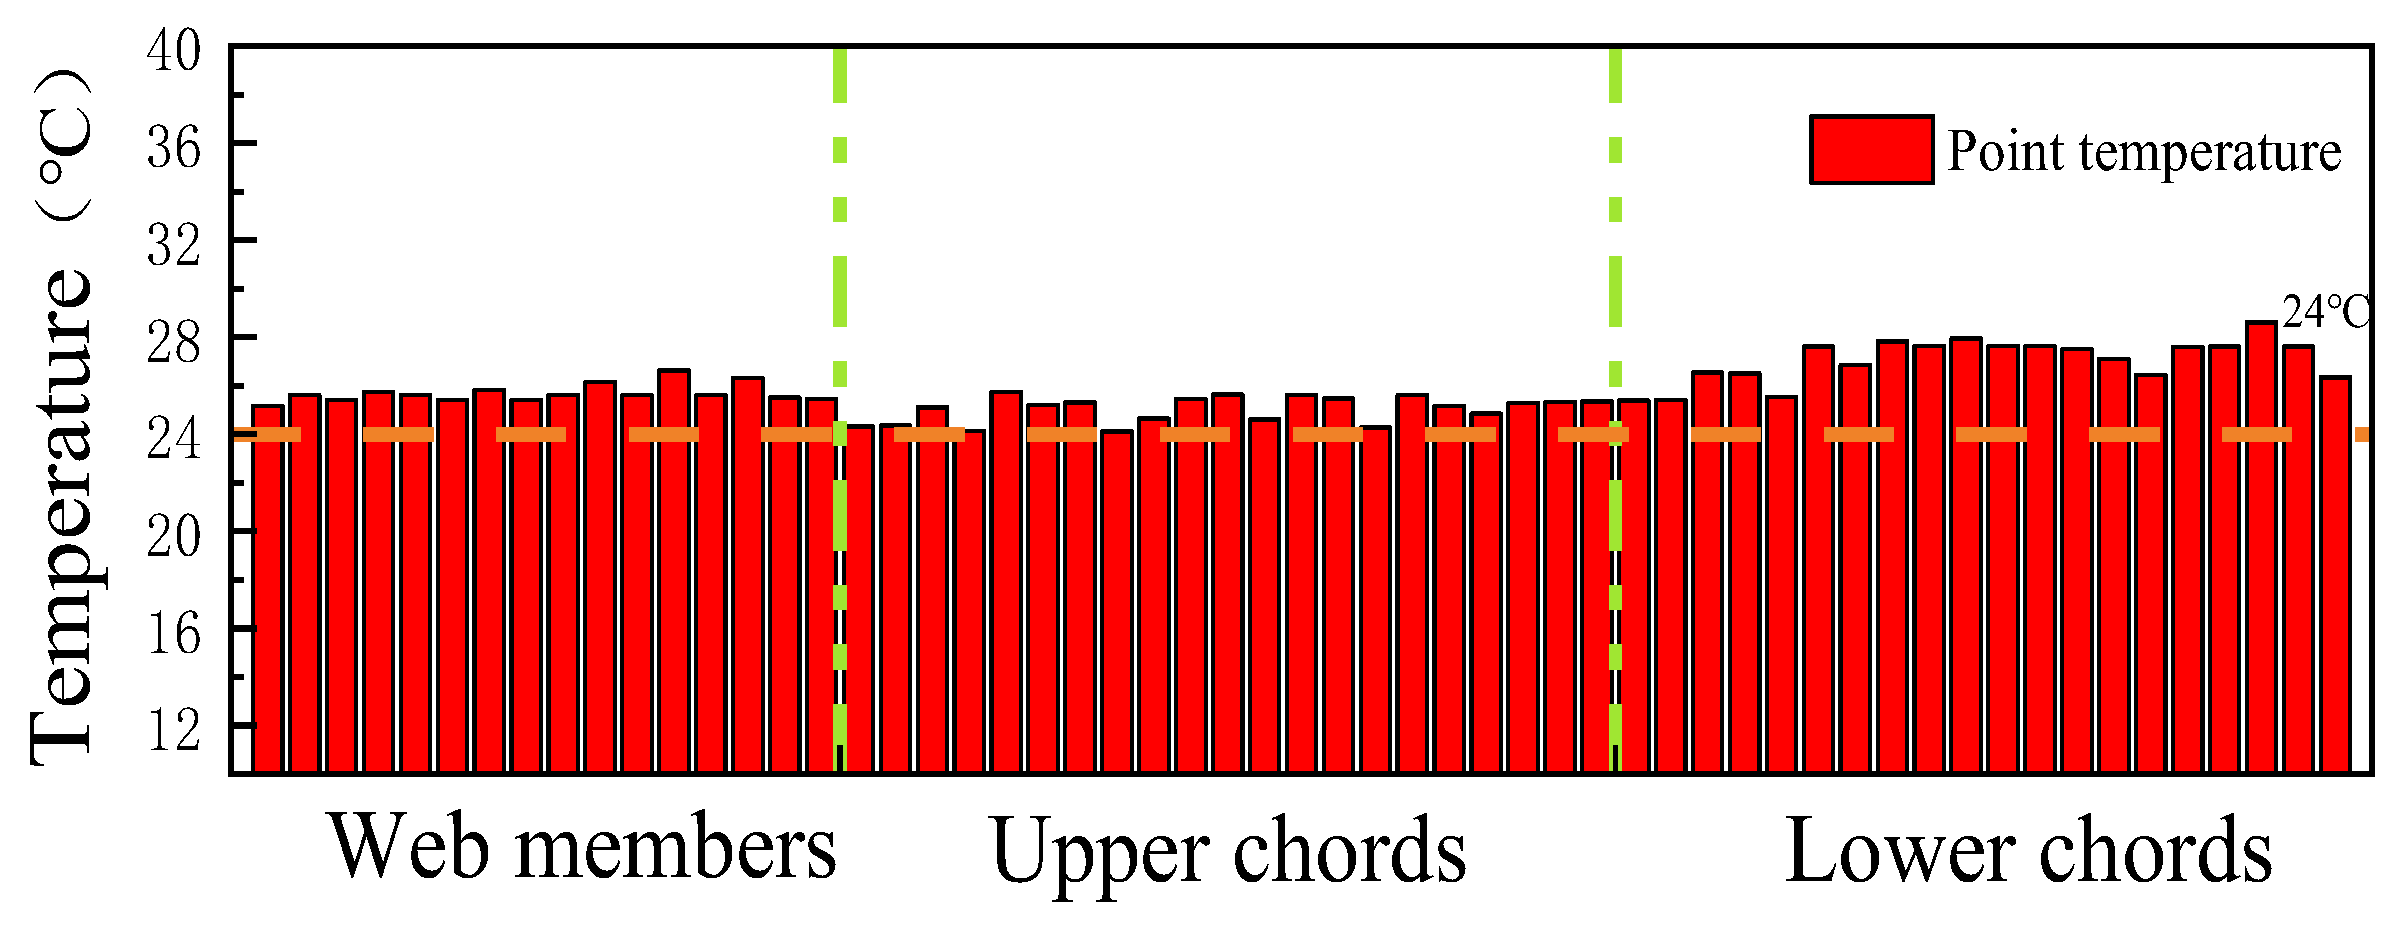
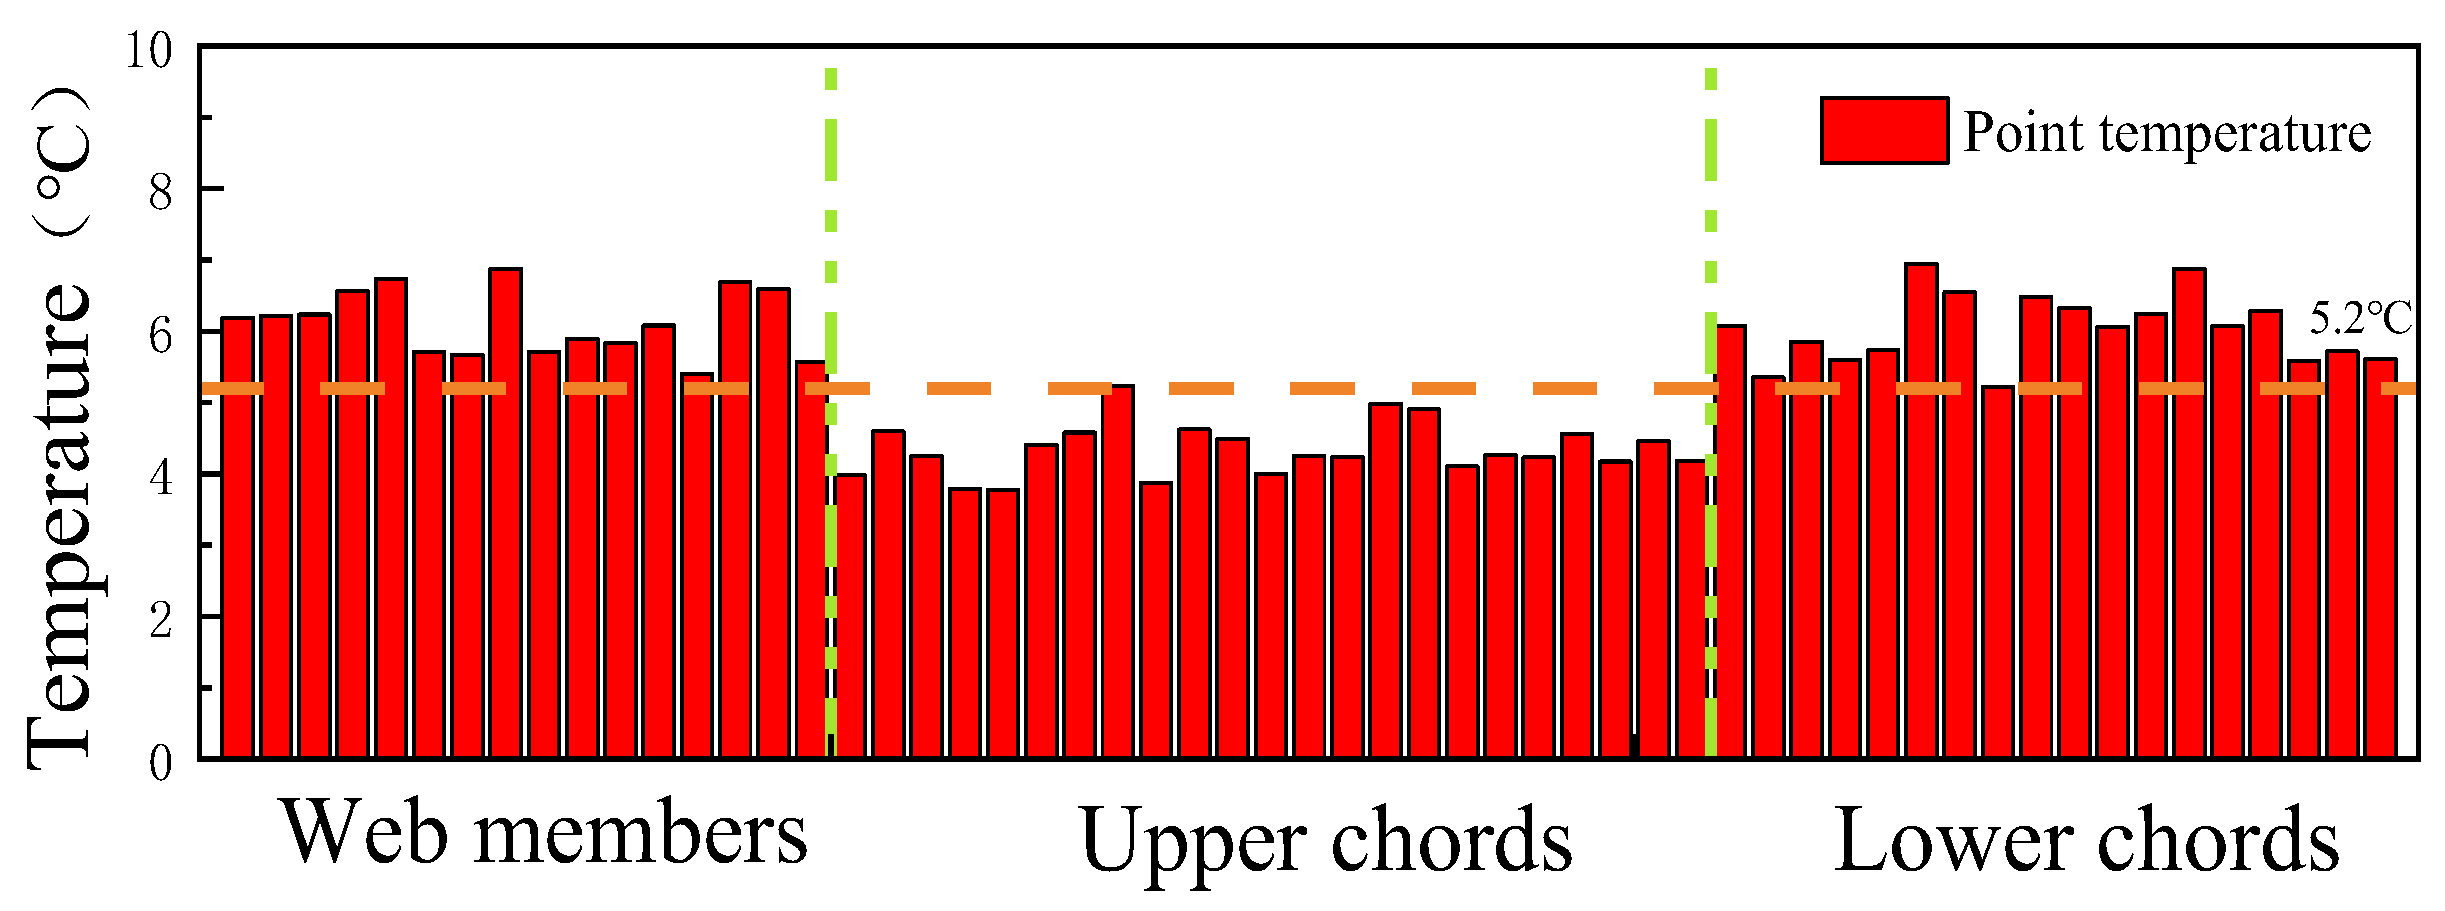
After sunset, buildings are no longer directly affected by solar radiation. However, due to the heat accumulated during the day, especially in those areas where the building part is significantly warmed by direct sunlight, the temperature is still high. These areas will gradually cool down only after dispersing heat over a period of time. Therefore, using the actual measured data at 0:00 can effectively eliminate the direct sunshine effect so as to accurately reflect the temperature distribution of the structure in a natural cooling state. In this section, taking the data at 0:00 on 12 January (Winter) and 12 July (Summer) as an example, the hourly average measured temperatures and meteorological temperatures of different types of members, such as the upper chords, lower chords, and web members of the steel roof structure of the terminal building, were statistically analyzed and compared. The results are shown in Figure 8 and Figure 9.
As shown in Figure 8 and Figure 9, in the environment without solar radiation conditions, the temperature distribution of each measuring point is more uniform than that with solar radiation conditions. At 0:00 in summer, the temperature of the upper chord ranges from 24.12 °C to 25.75 °C, the temperature ranges of the lower chord from 25.39 °C to 28.62 °C, and the temperature ranges of the web members from 25.18 °C to 26.64 °C, with a maximum temperature difference of 3.23 °C. At 0:00 in winter, the upper chord’s temperature is between 3.77 °C and 5.23 °C, the lower chord’s temperature is between 4.18 °C and 6.95 °C, and the web member’s temperature is between 5.41 °C and 6.88 °C, and the maximum temperature difference is about 2.76 °C. The following conclusions are obtained:
(1)
Under without solar radiation conditions, the temperatures at each measuring point are close to the meteorological temperature, showing a more uniform distribution with a maximum temperature difference of no more than 3.23 °C.
(2)
Under without solar radiation conditions, the lower chord’s temperature is generally the highest, followed by the web member, and the upper chord is the lowest. This reveals that structural height significantly impacts temperature distribution. The temperature usually decreases with increasing structural height, which is closely related to the wind speed and ventilation conditions.
(3)
Under without solar radiation conditions, the temperature of each measuring point is generally higher than the average temperature in summer, but in winter, the upper chord’s temperature is lower than the average temperature, which indicates that the steel structure is more sensitive to the low-temperature environment.

4.4. Stress Variation Response Under the Action of Temperature

In the normal service stage, the space steel structure is affected mainly by the control load of the temperature, whereas other loads have relatively little influence on it. Therefore, to understand and analyze the stress changes and temperature characteristics of the three key elements of the upper chord, lower chord, and belly rod in extreme climate months in detail, two typical months, January and July 2023, were selected, and the measured data of several rods were analyzed in detail. Owing to the large number of measuring points, only some representative temperature and stress change data of the upper chord, lower chord, and abdominal chord were selected for analysis. The specific results are shown in Figure 10 and Figure 11.
By comparing the stress change and temperature change curves of the measuring points at different positions of the three types of rods, the measuring points as a whole show a strong correlation between temperature and stress during January and July. To measure the degree of correlation between the temperature and stress change, Pearson correlation coefficients were calculated, and the results were all above 0.86, indicating that there was a strong correlation between the temperature and stress change at the measuring point; the results are shown in Table 4.
The oblique bar located at the support showed a negative correlation between the temperature and stress change during January and July. The results show that the compressive stress of the diagonal bar increases when the temperature increases. This is because the constraints of the support hinder its free expansion, resulting in an increase in internal stress. In contrast, the oblique bar away from the support shows a positive correlation when the temperature increases, indicating that the tensile stress increases with increasing length, which reflects the sensitivity of the structural stiffness to temperature changes.
The lower chord members far from the supports also exhibit a negative correlation between temperature and stress changes in January and July, indicating that they have a strong capacity for free expansion or contraction. At night or during the winter, when temperatures decrease, material contraction may reduce the stress in the lower chord members that are already in a state of tensile stress, whereas in the summer or during the day, when temperatures increase, material expansion may lead to a decrease in tensile stress. The lower chord members at the supports, however, are positively correlated, as the compressive stress increases due to restricted expansion when the temperature increases.
The upper chord members also exhibit a negative correlation between temperature and stress changes during the period from January to July, meaning that the tensile stress decreases as the temperature increases. This may be due to the pressure borne by the upper chord members in the truss, and the thermal expansion caused by the temperature increase reduces the internal compressive stress under structural constraints. Moreover, thermal expansion affects the length and volume of the members, leading to changes in the stress state.

4.5. Structural Stress Variation Under Long-Term Temperature Effect

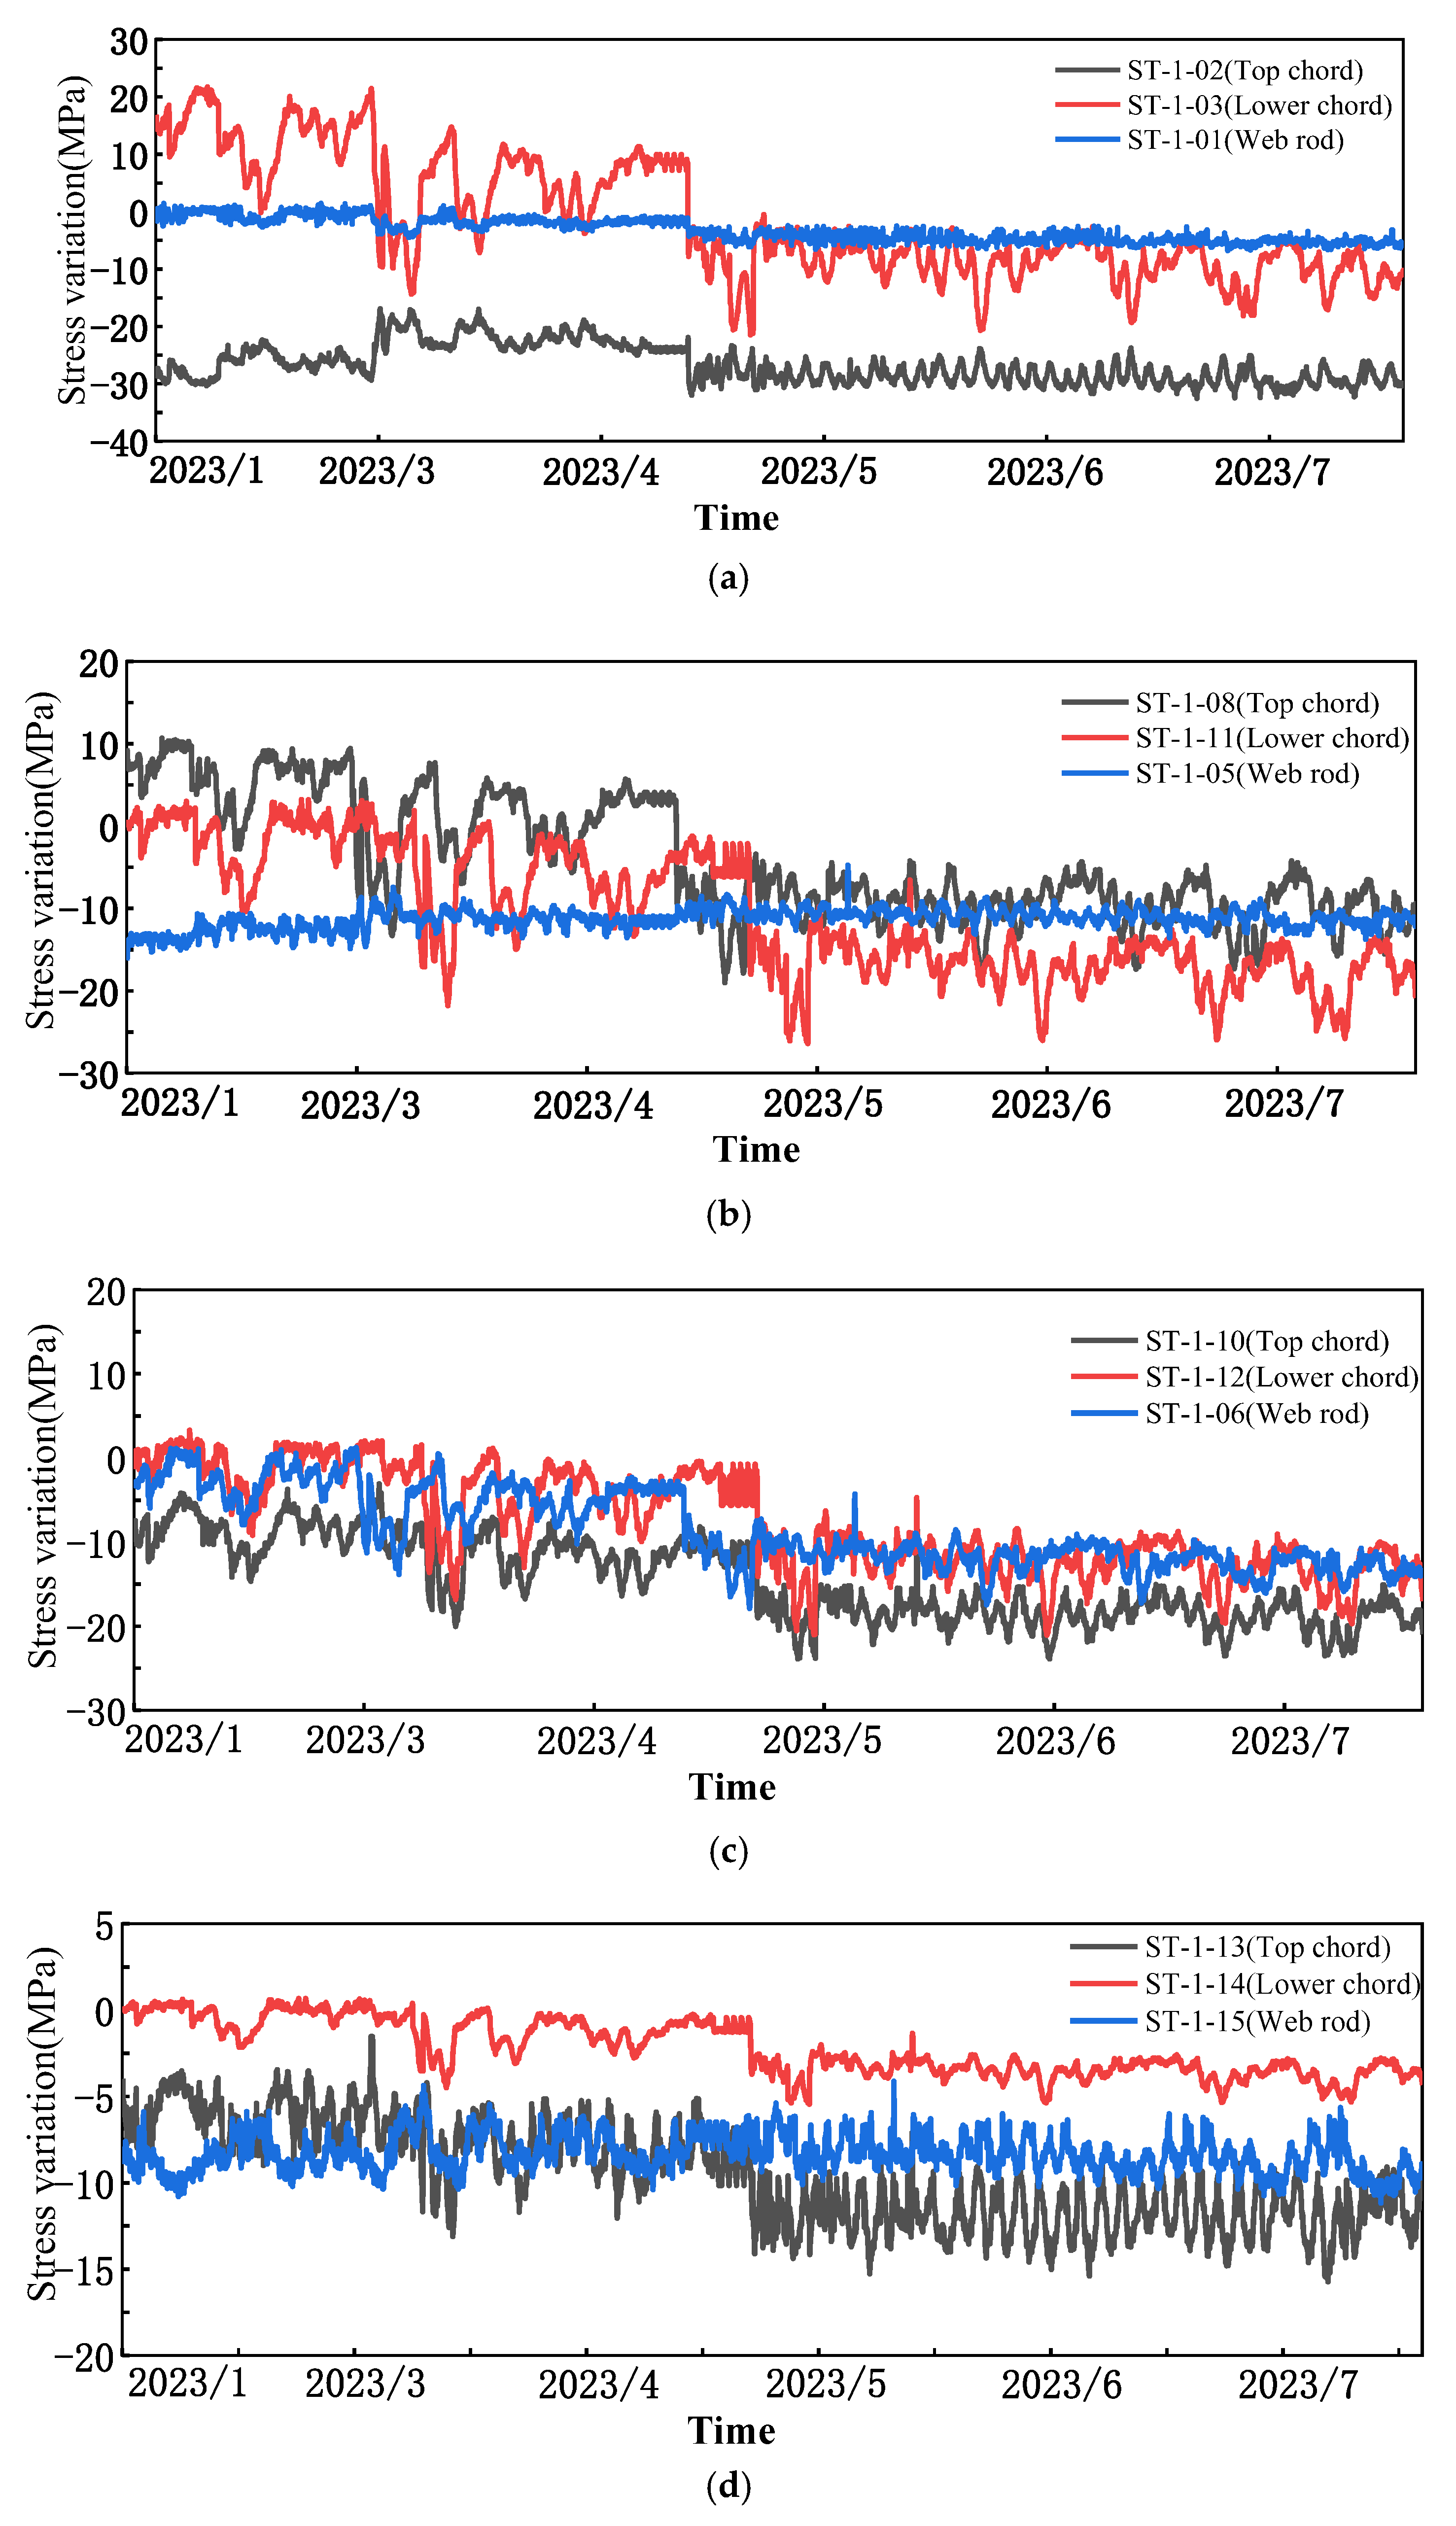
This section further analyzes the effect of long-term temperature variation on structural stress and load-bearing performance. Based on measured data from January 2023 to July 2023, excluding the situation accompanied by wind, snow, and other loads, considering the limited space and numerous measurement points, this section only selects the stress data of some representative points under temperature change, as shown in Figure 12.
From Figure 12, during the long-term stress monitoring, the stress variation amplitudes at most measurement points exceed 10 MPa. The stress fluctuation of the upper chord and the lower chord with time under the action of temperature is generally large, and that of the web member is generally small. The long-term measured stress variation value of each measuring point confirms that the steel roof structure does have a greater stress change under the action of temperature. Moreover, the three types of different measurement points show different characteristics:
(1)
The bars in different positions have different sensitivities to the temperature action. And the measuring points which are more sensitive to the temperature are mainly concentrated in the upper chords and the lower chords, especially the measuring point ST-1-03 (lower chord) located at the highest point of the main truss midspan. The stress change amplitude reaches 43.23 MPa. These members require special attention to ensure structural stability and safety.
(2)
The sensitivity of web members to temperature is generally weak, and the stress change amplitude is generally lower than that of the upper chord and the lower chord. However, the stress change in the measuring point ST-1-06 (diagonal web member) located at the Y-shaped column support is large.
(3)
The data shows that the stress values are significantly different in different months, which may be related to seasonal changes and corresponding temperature changes. The measuring point of the upper chord (for example, ST-1-02) has higher stress values in summer (May, June, July), possibly due to material expansion caused by high temperature. The measuring point of the lower chord (for example, ST-1-03) has higher stress values in winter (December, January), possibly due to material shrinkage in low temperatures. The lower chord is more sensitive to temperature changes, especially in winter.

4.6. Analysis of the Structural Force Characteristics Under Long-Term Temperature Effects

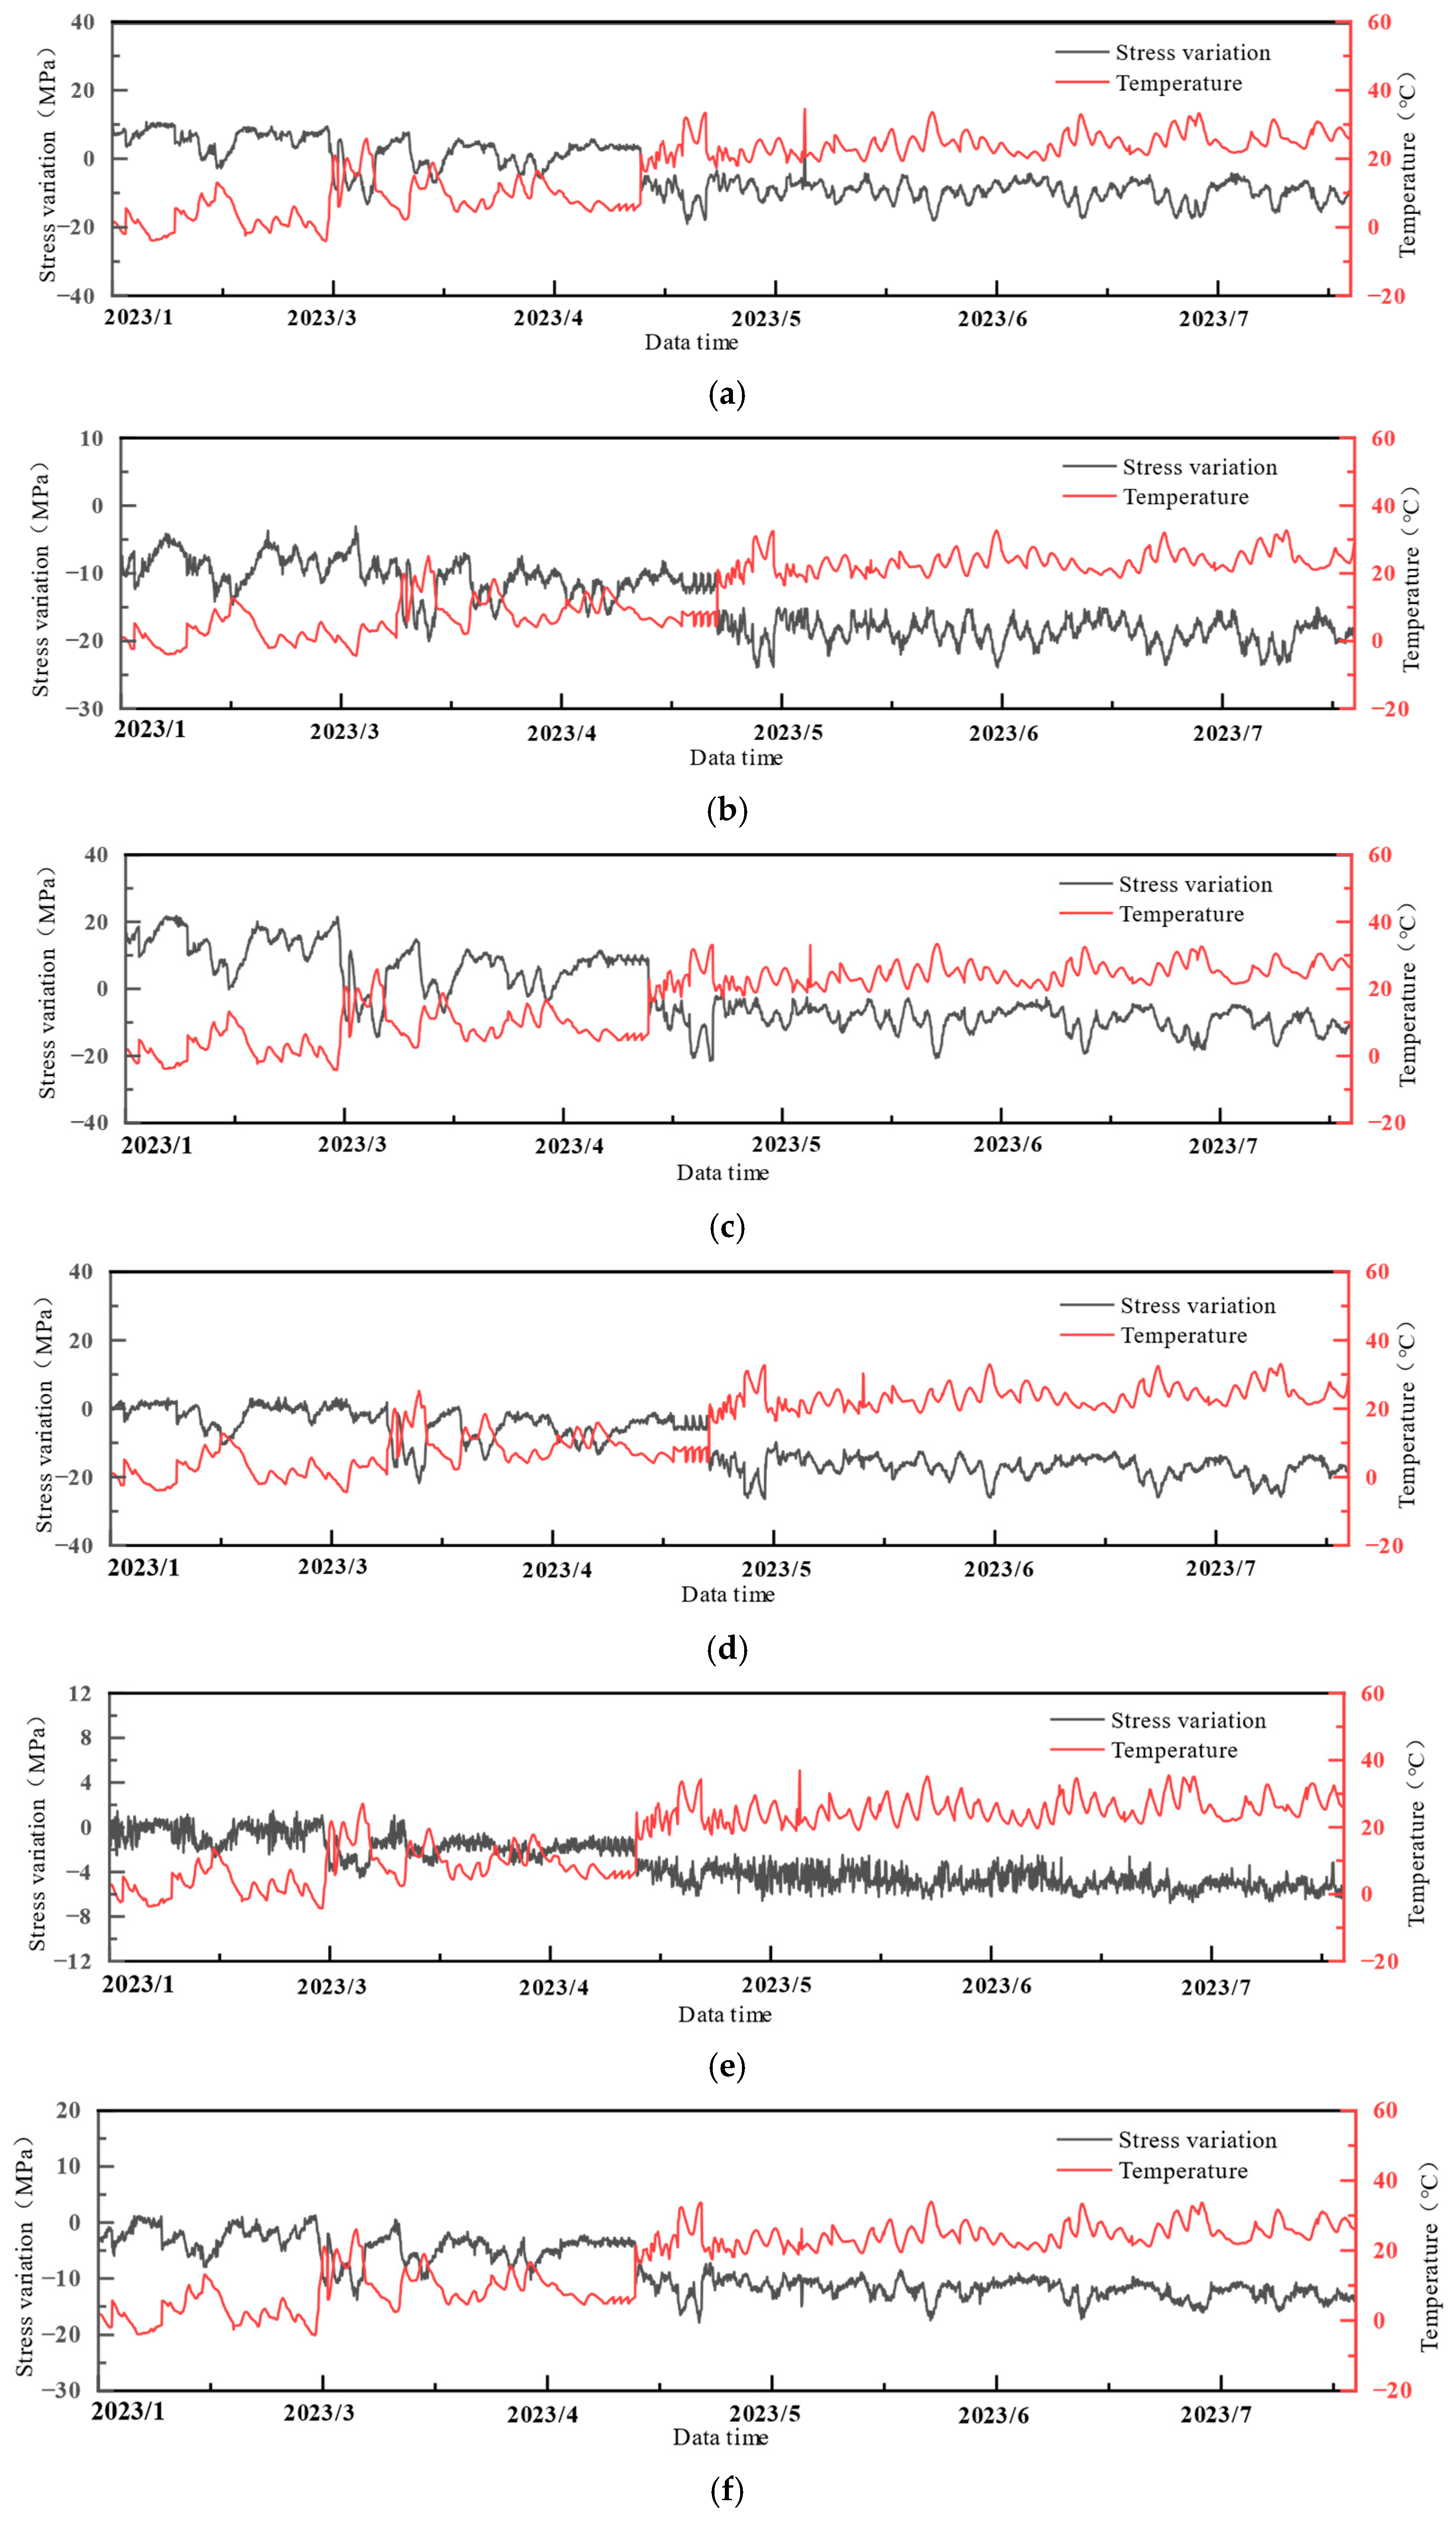
According to the monitoring data obtained from the field, the measured stress variation and temperature data of the terminal steel roof structure during the period from 1 January 2023 to 25 July 2023 are used as the basis for exploring the stress characteristics of different rods of the terminal steel roof structure affected by the effect of temperature during the long-term monitoring process. Owing to space limitations, only some representative measurement points of the temperature and stress increment curves are listed as shown in Figure 13.
As shown in Figure 8, during the long-term monitoring process, which is affected by temperature, the measurement points of the upper chord, lower chord, and web members of the terminal steel roof structure basically remain synchronized in terms of temperature, and there is a strong correlation between the increase in stress and the measurement point temperature. To further explore the correlation between the stress increment of different members and the measurement point temperature, the least squares method was used for linear fitting, with the specific results shown in Table 5.
From Table 5, in most cases, there is a significant negative linear correlation between the stress increment and temperature, which means that the stress increment at the measuring point tends to decrease with increasing temperature, whereas the stress increment tends to increase with decreasing temperature. Normally, steel structures expand when heated and contract when cooled. If a part of the structure is constrained and cannot expand or contract freely (for example, owing to the restriction of supports, connectors, or other structural parts), then with increasing temperature, the compressive stress in the area that should be expanded will be reduced because of the constraint, which is reflected in the reduction in the stress increment. Similarly, when the temperature decreases, the tensile stress of the constrained part increases as it attempts to contract, which manifests as an increase in the stress increment. Therefore, this negative correlation reflects the normal physical response of the structure under the influence of temperature changes.
The analysis results reveal that measurement points ST-1-08 and ST-1-10 in the upper chord exhibit very high R2 values, which are 0.953 and 0.951, respectively, indicating a strong linear correlation between the increase in stress and temperature in these areas. Similarly, measurement points ST-1-03 and ST-1-11 in the lower chord also have large R2 values (both exceeding 0.97), indicating that temperature changes have a close impact on the increase in stress at these measurement points.
At the support position of the structure, the diagonal web member ST-1-06 has an extremely high R2 value, indicating that even with significant temperature fluctuations, the temperature changes are translated into stress increments because one end is fixed on the support, reflecting its high sensitivity to temperature changes. These analyses reveal the differences in the stress response in different parts of a steel structure under long-term temperature influence, providing important information for guiding structural health monitoring and performance assessment in practical engineering applications.

5. Prediction of Structural Stress Changes in Airport Terminals Based on BO-CNN-LSTM

5.1. BO-CNN-LSTM Hybrid Model for Structural Prediction

Bayesian optimization (BO) is a global optimization strategy based on probabilistic models, particularly suitable for optimizing computationally expensive black-box functions. The Bayesian optimization framework not only identifies optimal hyperparameters but also inherently provides uncertainty estimates for model predictions. This enables the system to flag potentially unreliable predictions when encountering feature patterns significantly different from the training distribution. The Bayesian optimization process primarily involves the following key steps: (1) prior knowledge and sampling strategy; (2) objective function; (3) acquisition function; (4) iterative updating.
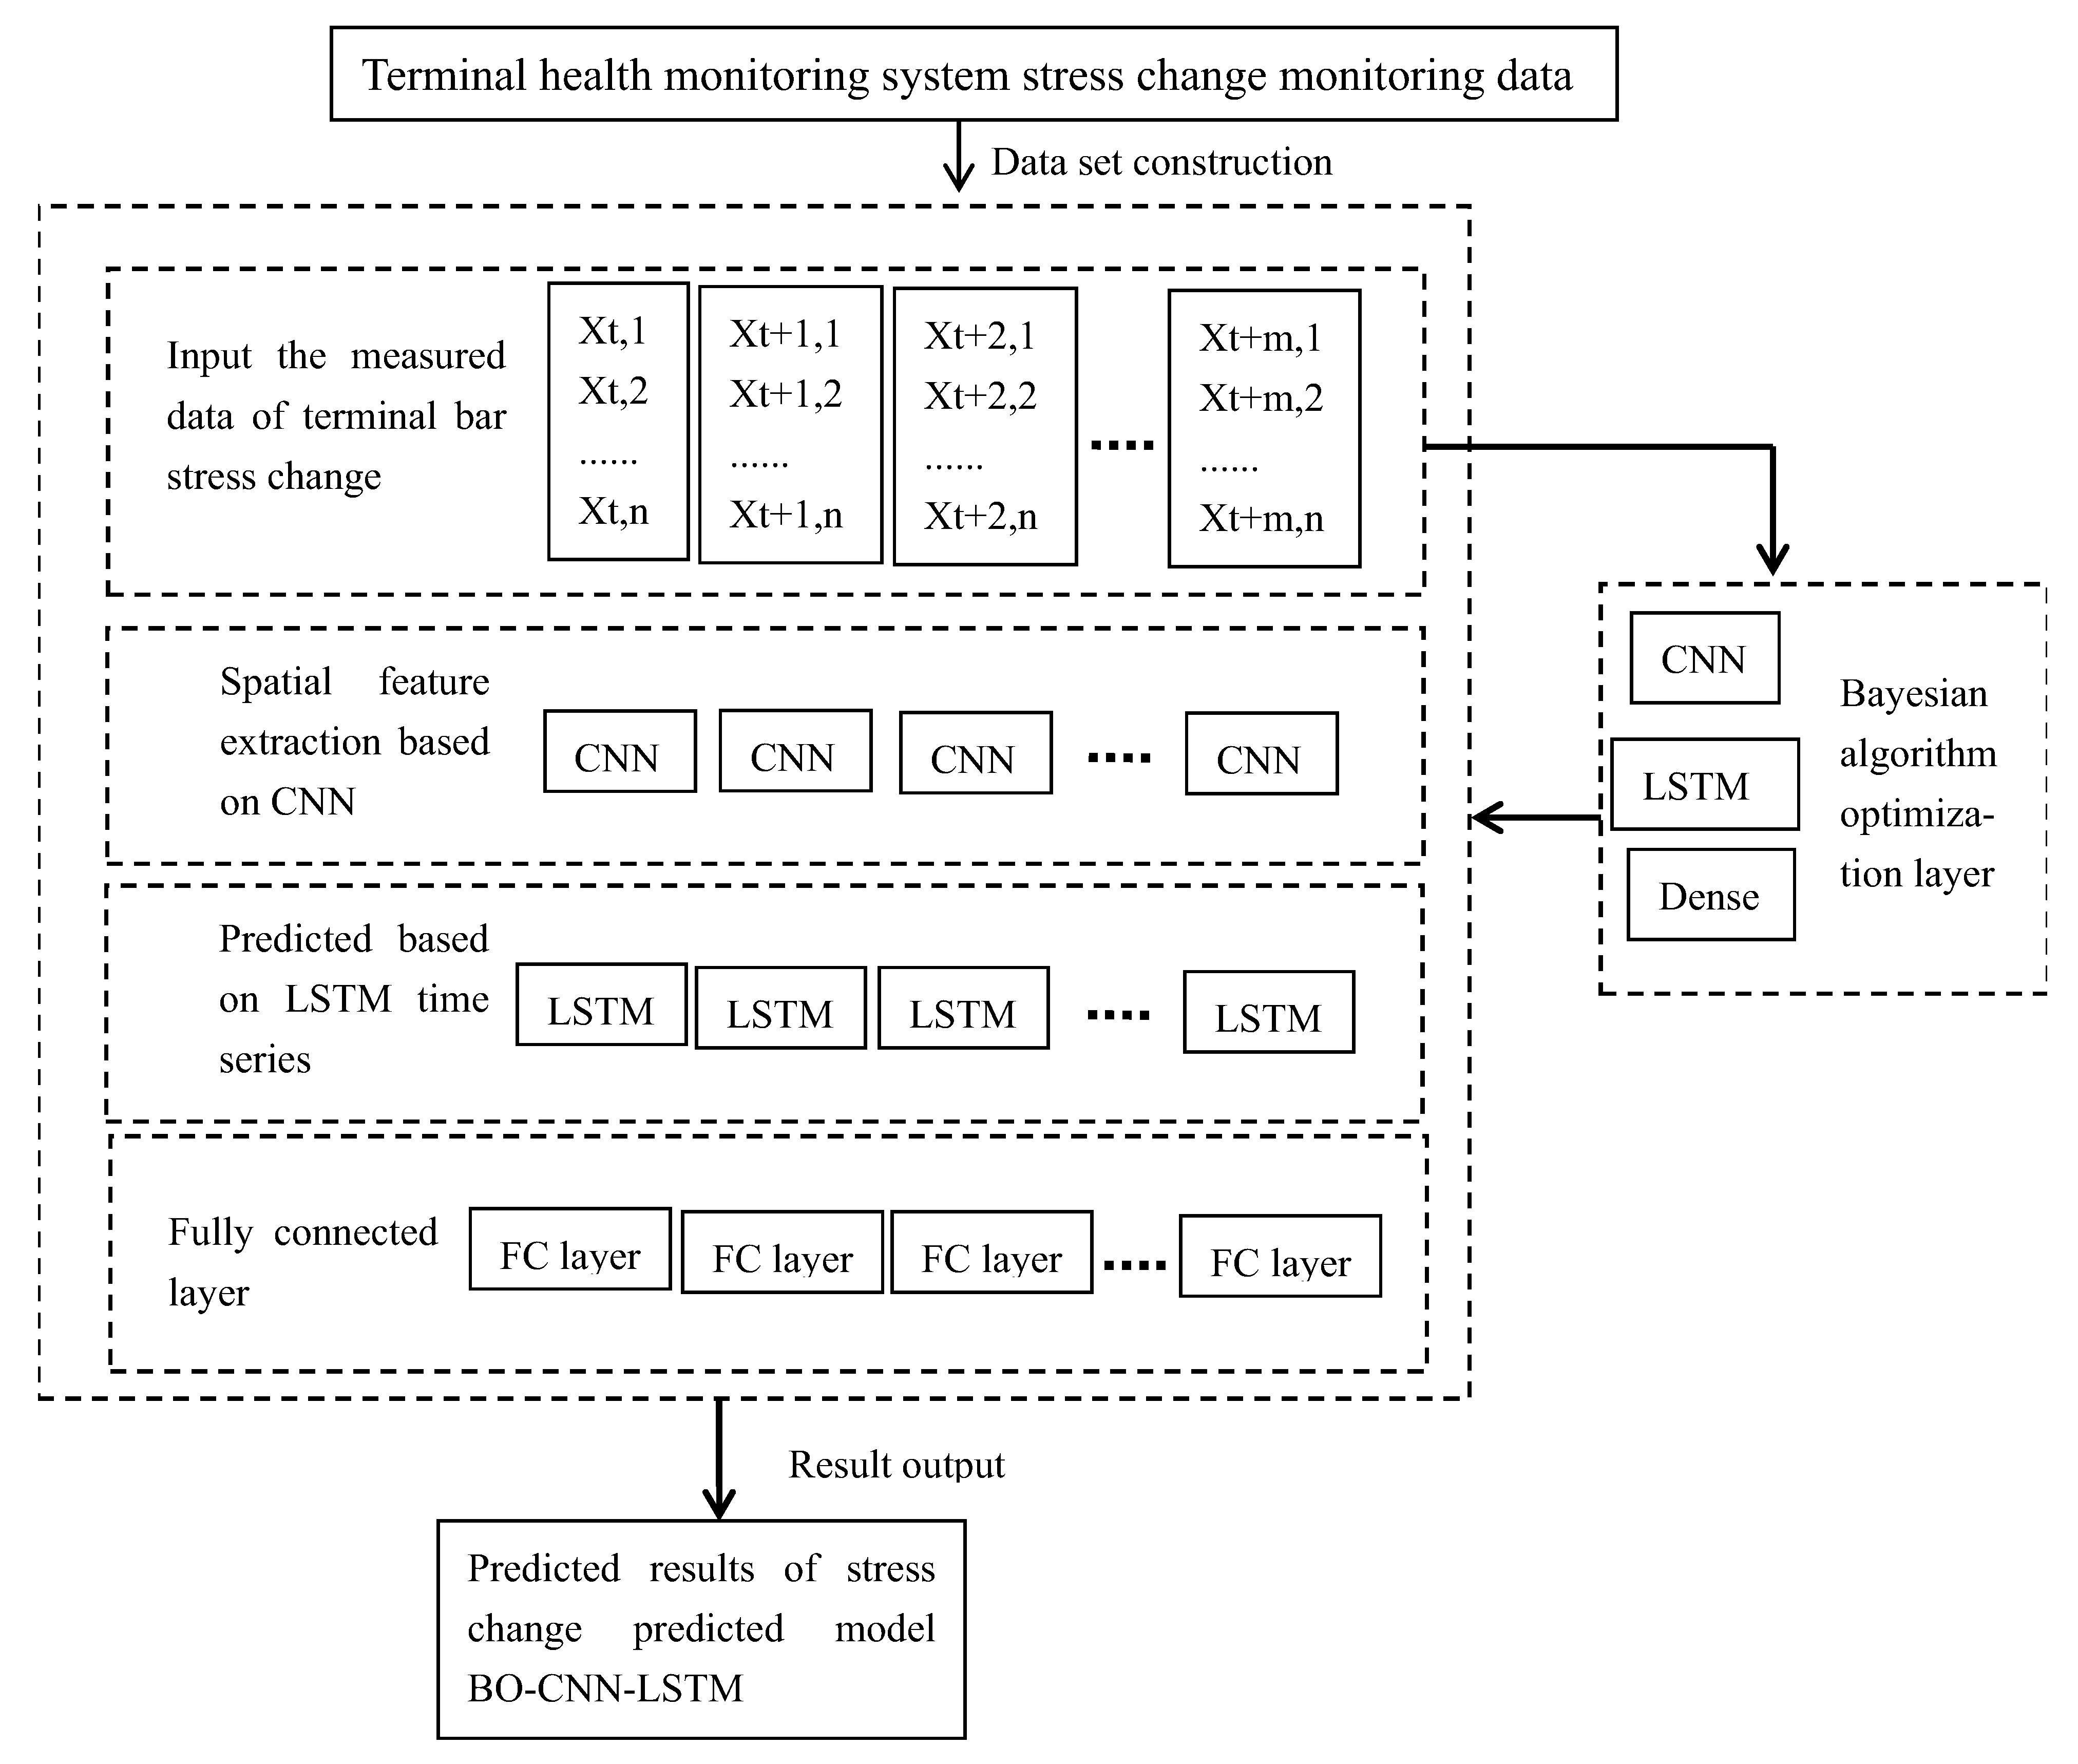
The BO-CNN-LSTM deep learning model fully considers the spatial and temporal features of the monitored data of the key members of the terminal and uses the Bayesian algorithm to optimize model parameters to improve the accuracy of the prediction. The model mainly consists of an input layer of stress monitoring data of key members of the terminal, a convolutional layer for extracting spatial features, a LSTM layer for extracting temporal features, a genetic algorithm optimization layer, and a full connection layer for prediction output, as shown in Figure 14.

5.2. Experimental Environment and Data Sources

This study aims to explore an accurate method in predicting stress changes in the structure of airport terminals and has specifically adopted a hybrid model combining Bayesian optimization with convolutional neural networks and long short-term memory networks (BO-CNN-LSTM) for experimental research [34,35]. The experiments utilize MATLAB R2014 a software for predictive calculations.
The dataset used in the experiment originates from an actual monitoring project of the airport terminal steel structure, collected through a sensor system installed at key structural points. The purpose of machine learning is to obtain a stress prediction model that is adapted to the terminal structure under different temperature loads. Therefore, the data for the training set and the test set in this paper come from the monitoring data of the terminal structure over a period of seven months. The terminal structure dataset consists of 5177 nodes and 13,715 units of data. For this experiment, representative measured stress data and temperature data from monitoring points ST-1-10, ST-1-11, ST-1-12, ST-1-13, etc., on the first main truss of the airport terminal, were selected. The time span of the monitoring data is from 1 December 2022 to 25 July 2023, nearly seven months. The first 80% of the data are used as the training set, and the last 20% are used as the test set. Unless otherwise specified, the experimental data in the following text uses the aforementioned dataset, and the predictive results are from the test set predictions.

5.3. Predicted Results Based on Unilateral Point Correlation

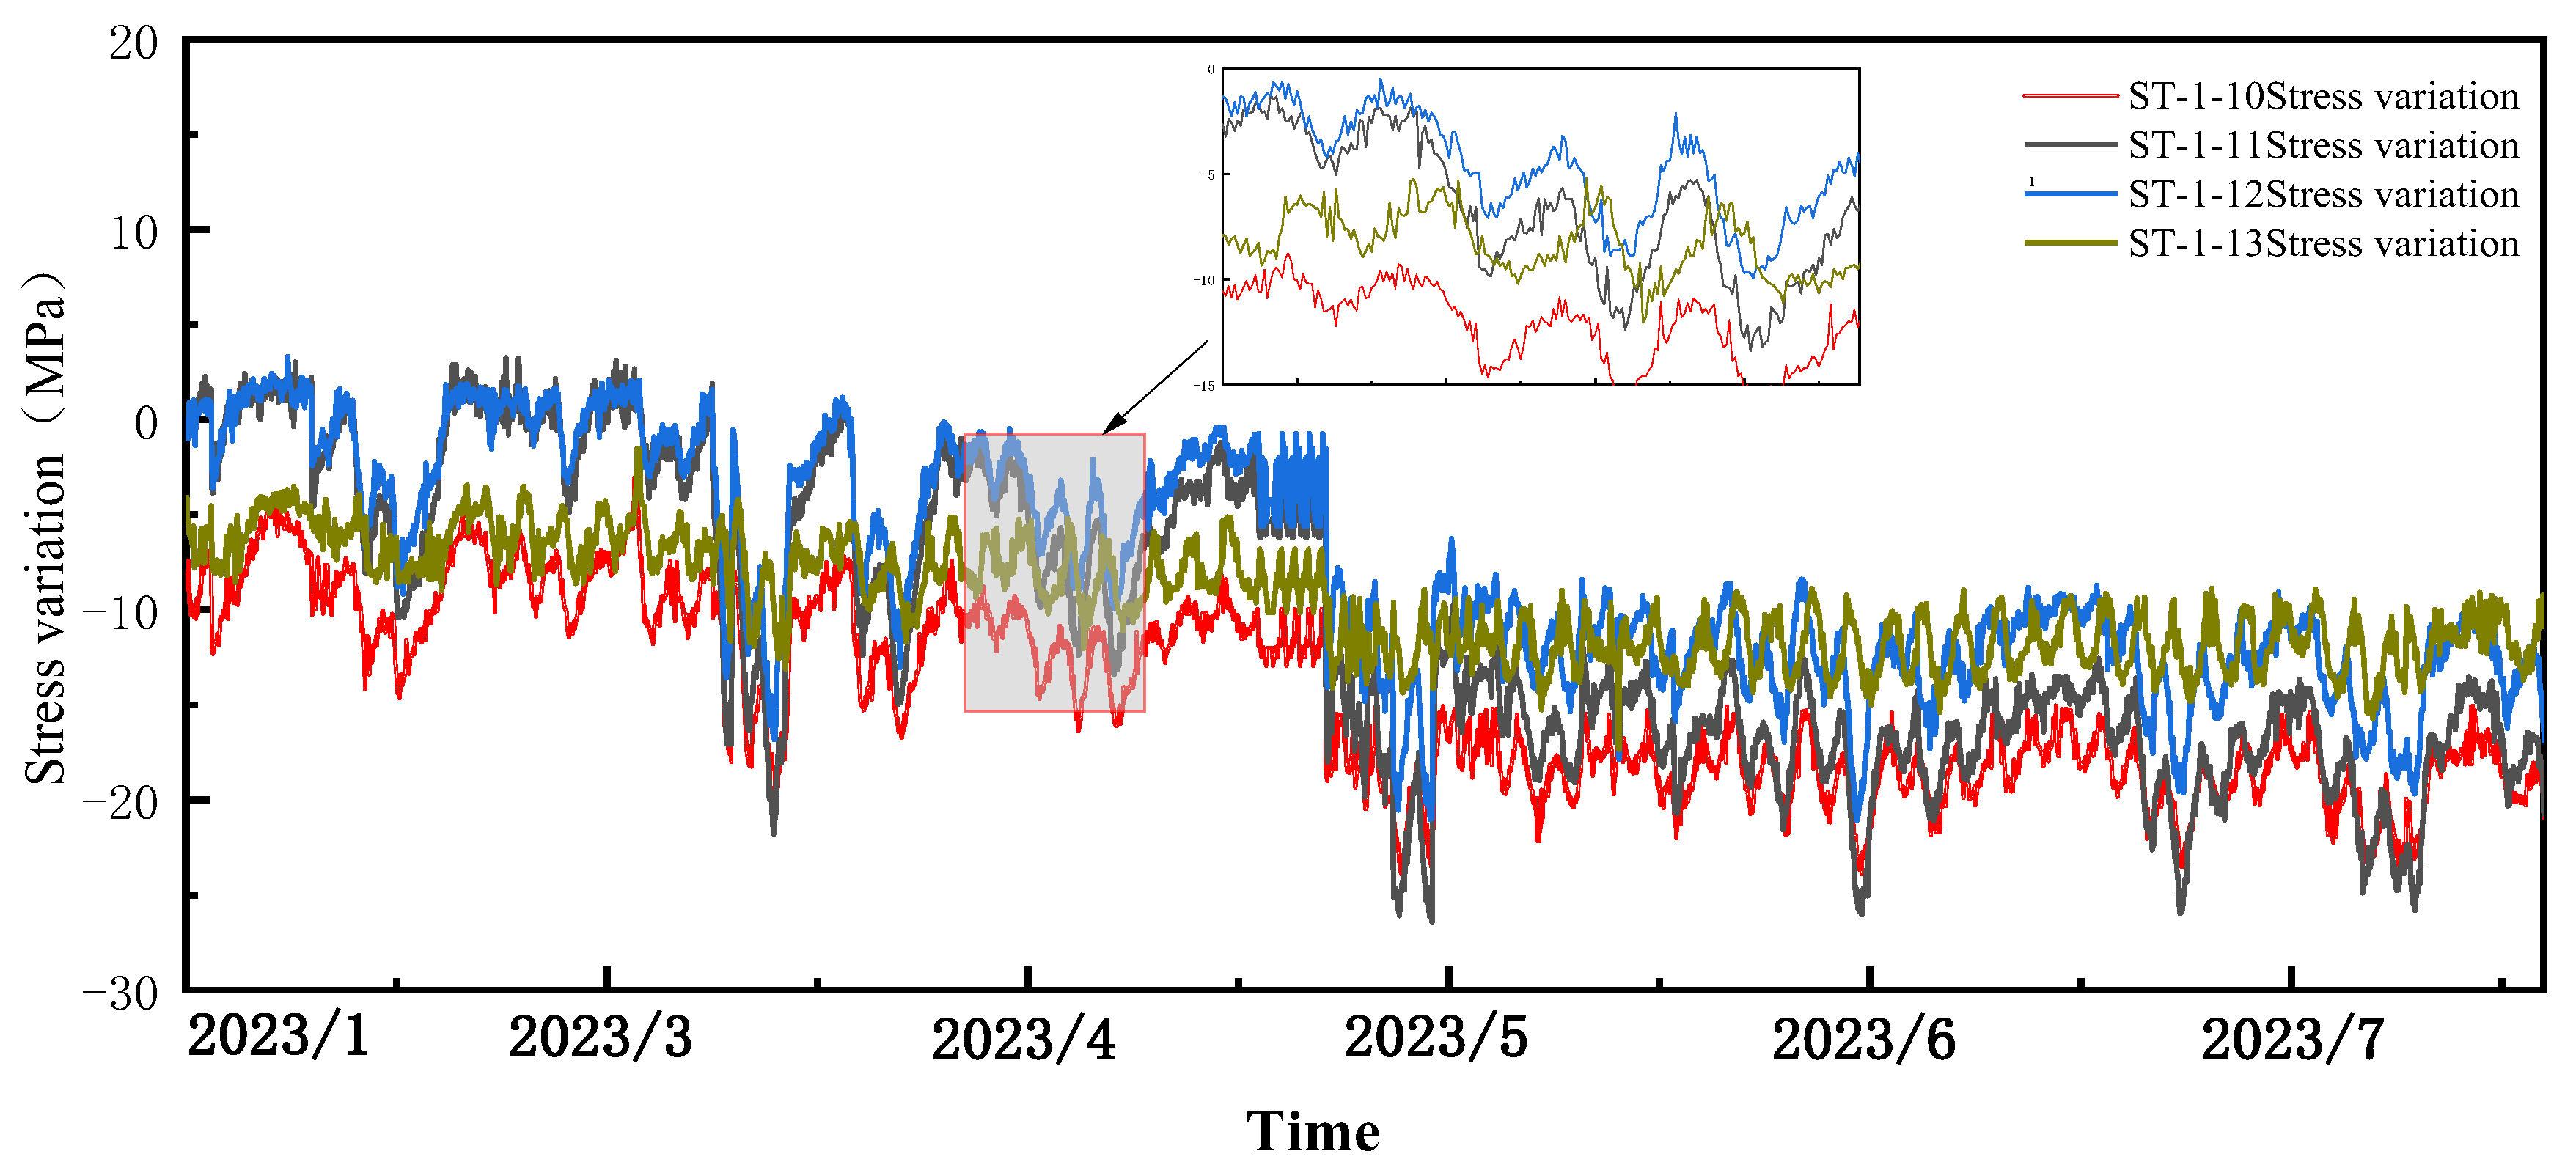
Based on the topological relationships and mechanical properties of the spatial structure, the stress changes at different monitoring points have a certain correlation. As shown in Figure 15, the stress variation curves at different measurement points within the same area during the same time period exhibit a noticeable correlation.
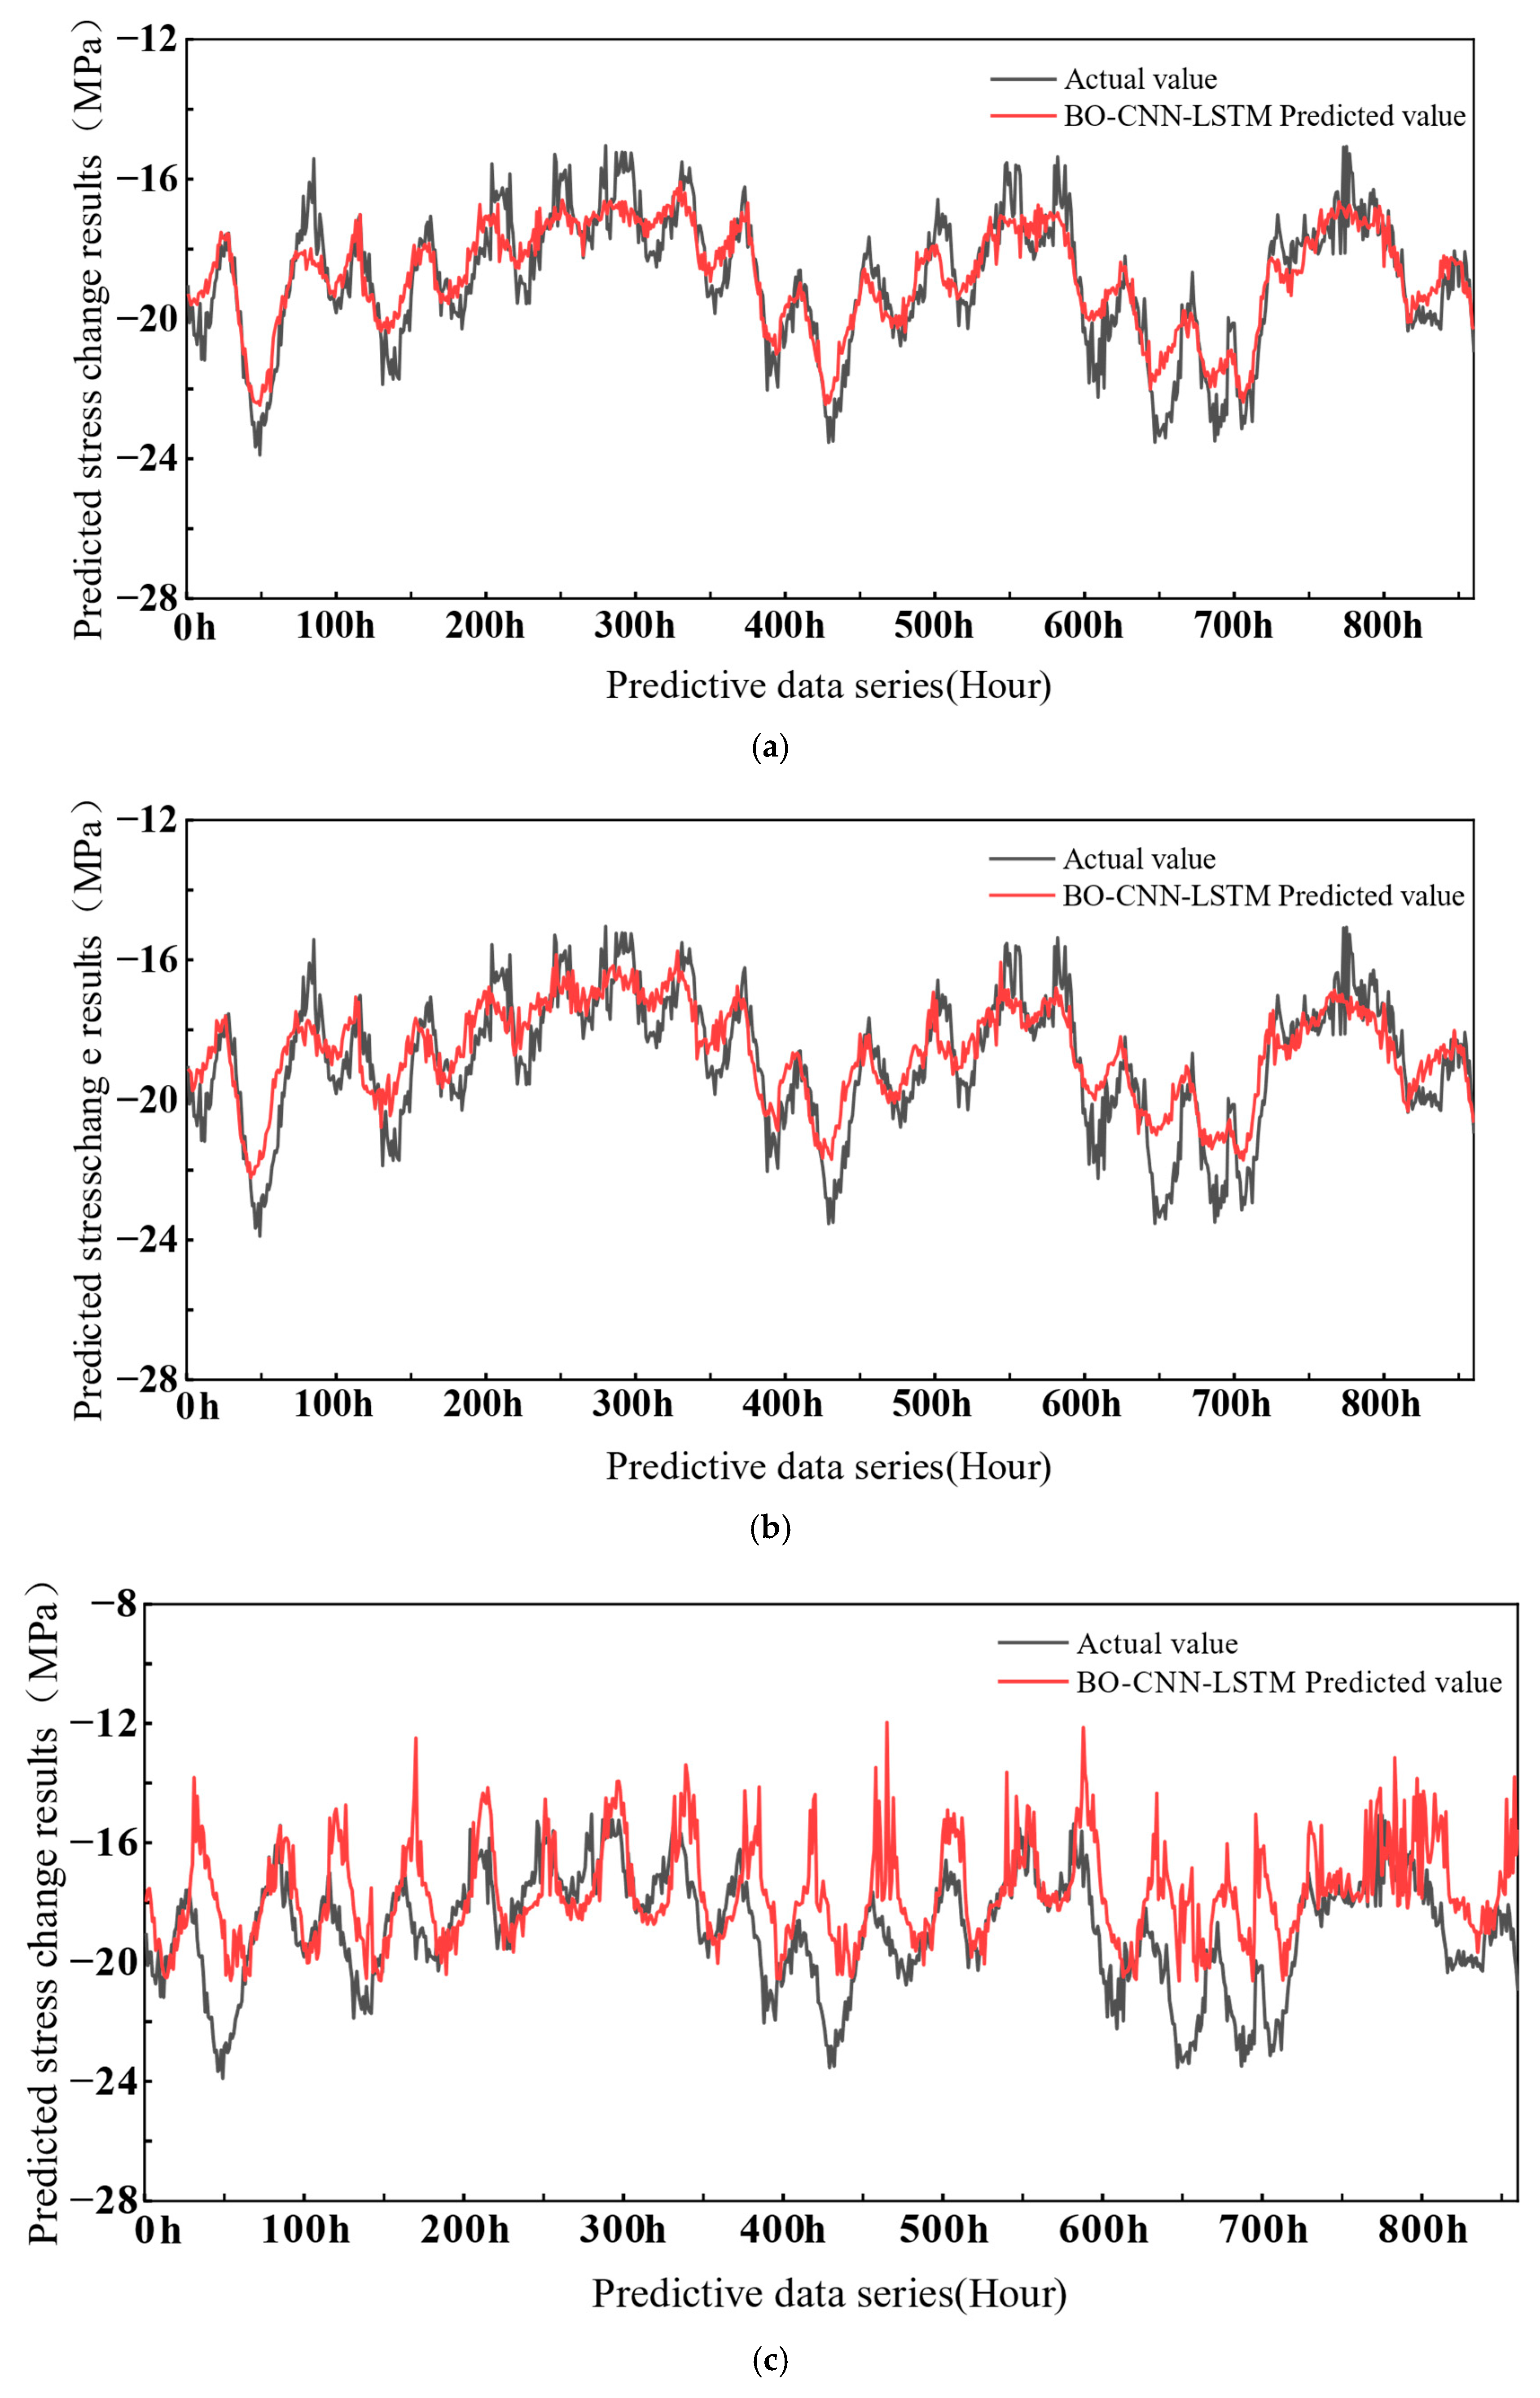
On the basis of the correlation pattern of stress variation at a single measurement point on the first truss of the airport terminal steel roof, this section employs Bayesian optimization techniques to optimize the parameters of the convolutional long short-term memory (CNN-LSTM) model, which uses the reference measurement point’s stress variation data to predict the stress variation at the target measurement point ST-1-10. The predicted results of the airport terminal stress variation model based on the stress change in the BO-CNN-LSTM model are shown in Figure 16 and Figure 17, Table 6.
Figure 16 and Table 6 present the stress variation prediction results based on the correlation of the target measurement points ST-1-10 with three reference measurement points at different positions within the same truss. The experimental results indicate that, compared with other measurement points, ST-1-11 is more accurate at prediction because of its relatively close distance to ST-1-10. It has the lowest MAPE value and relatively small RMSE and MAE values, with an R2 value of 0.793, demonstrating good predictive performance. However, as the distance of the reference measurement point from the target measurement point increases, the prediction accuracy gradually decreases. ST-1-13, as a measurement point at a greater distance, has the highest MAPE value, larger RMSE and MAE values, and a reduced R2 value, indicating relatively poor predictive performance. This change in accuracy is due to the weakening of the stress correlation between measuring points as the distance increases, making the prediction model unable to fully capture the complex stress response relationship between distant measuring points. Owing to the variability of the structural stress response, measurement points at greater distances may be influenced by various factors, such as structural geometry, material properties, and external loads. The interaction of these factors may interfere with the correlation of stress variations, thereby affecting the accuracy of the prediction results.
In summary, for the prediction of stress changes in the structure of airport terminals, when stress changes are predicted on the basis of the correlation of a single measuring point, prioritizing the selection of reference measurement points that are closer to the target measurement point is recommended to improve the accuracy and reliability of the predictive model.

5.4. Predicted Results Based on Multi-Point Correlation

Research on stress variation prediction based on the correlation of a single measurement point has shown that reference points closer to the target measurement point can provide more accurate prediction results. This indicates the impact of the distance between measurement points on the prediction accuracy; that is, closer measurement points, due to greater stress correlation, are more conducive to improving the prediction accuracy. However, in practical structural health monitoring applications, there may be situations where data from ideal location measurement points cannot be obtained or where the number of nearby measurement points is limited. In such cases, relying solely on a single measurement point for prediction may not achieve the expected accuracy.
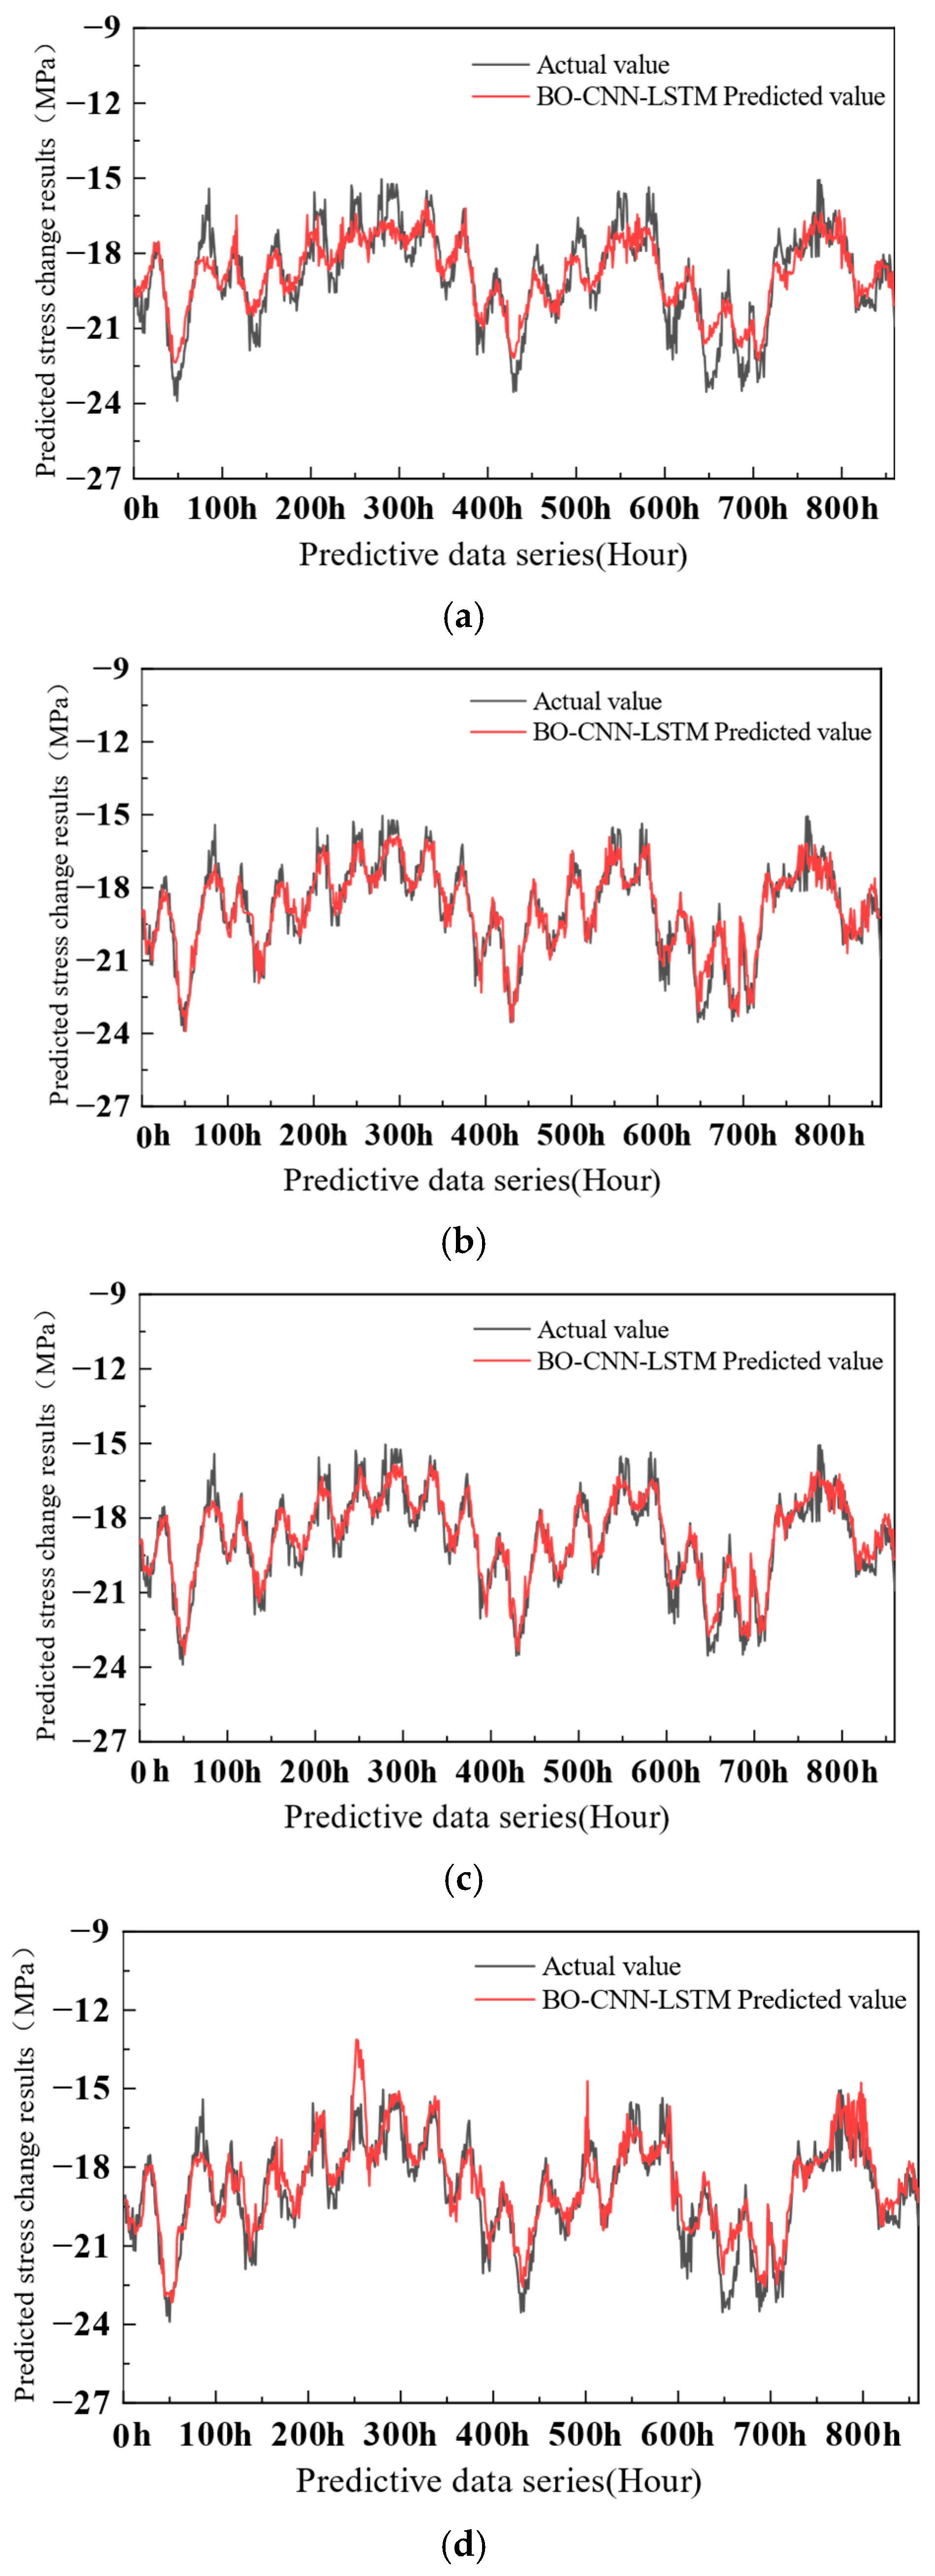
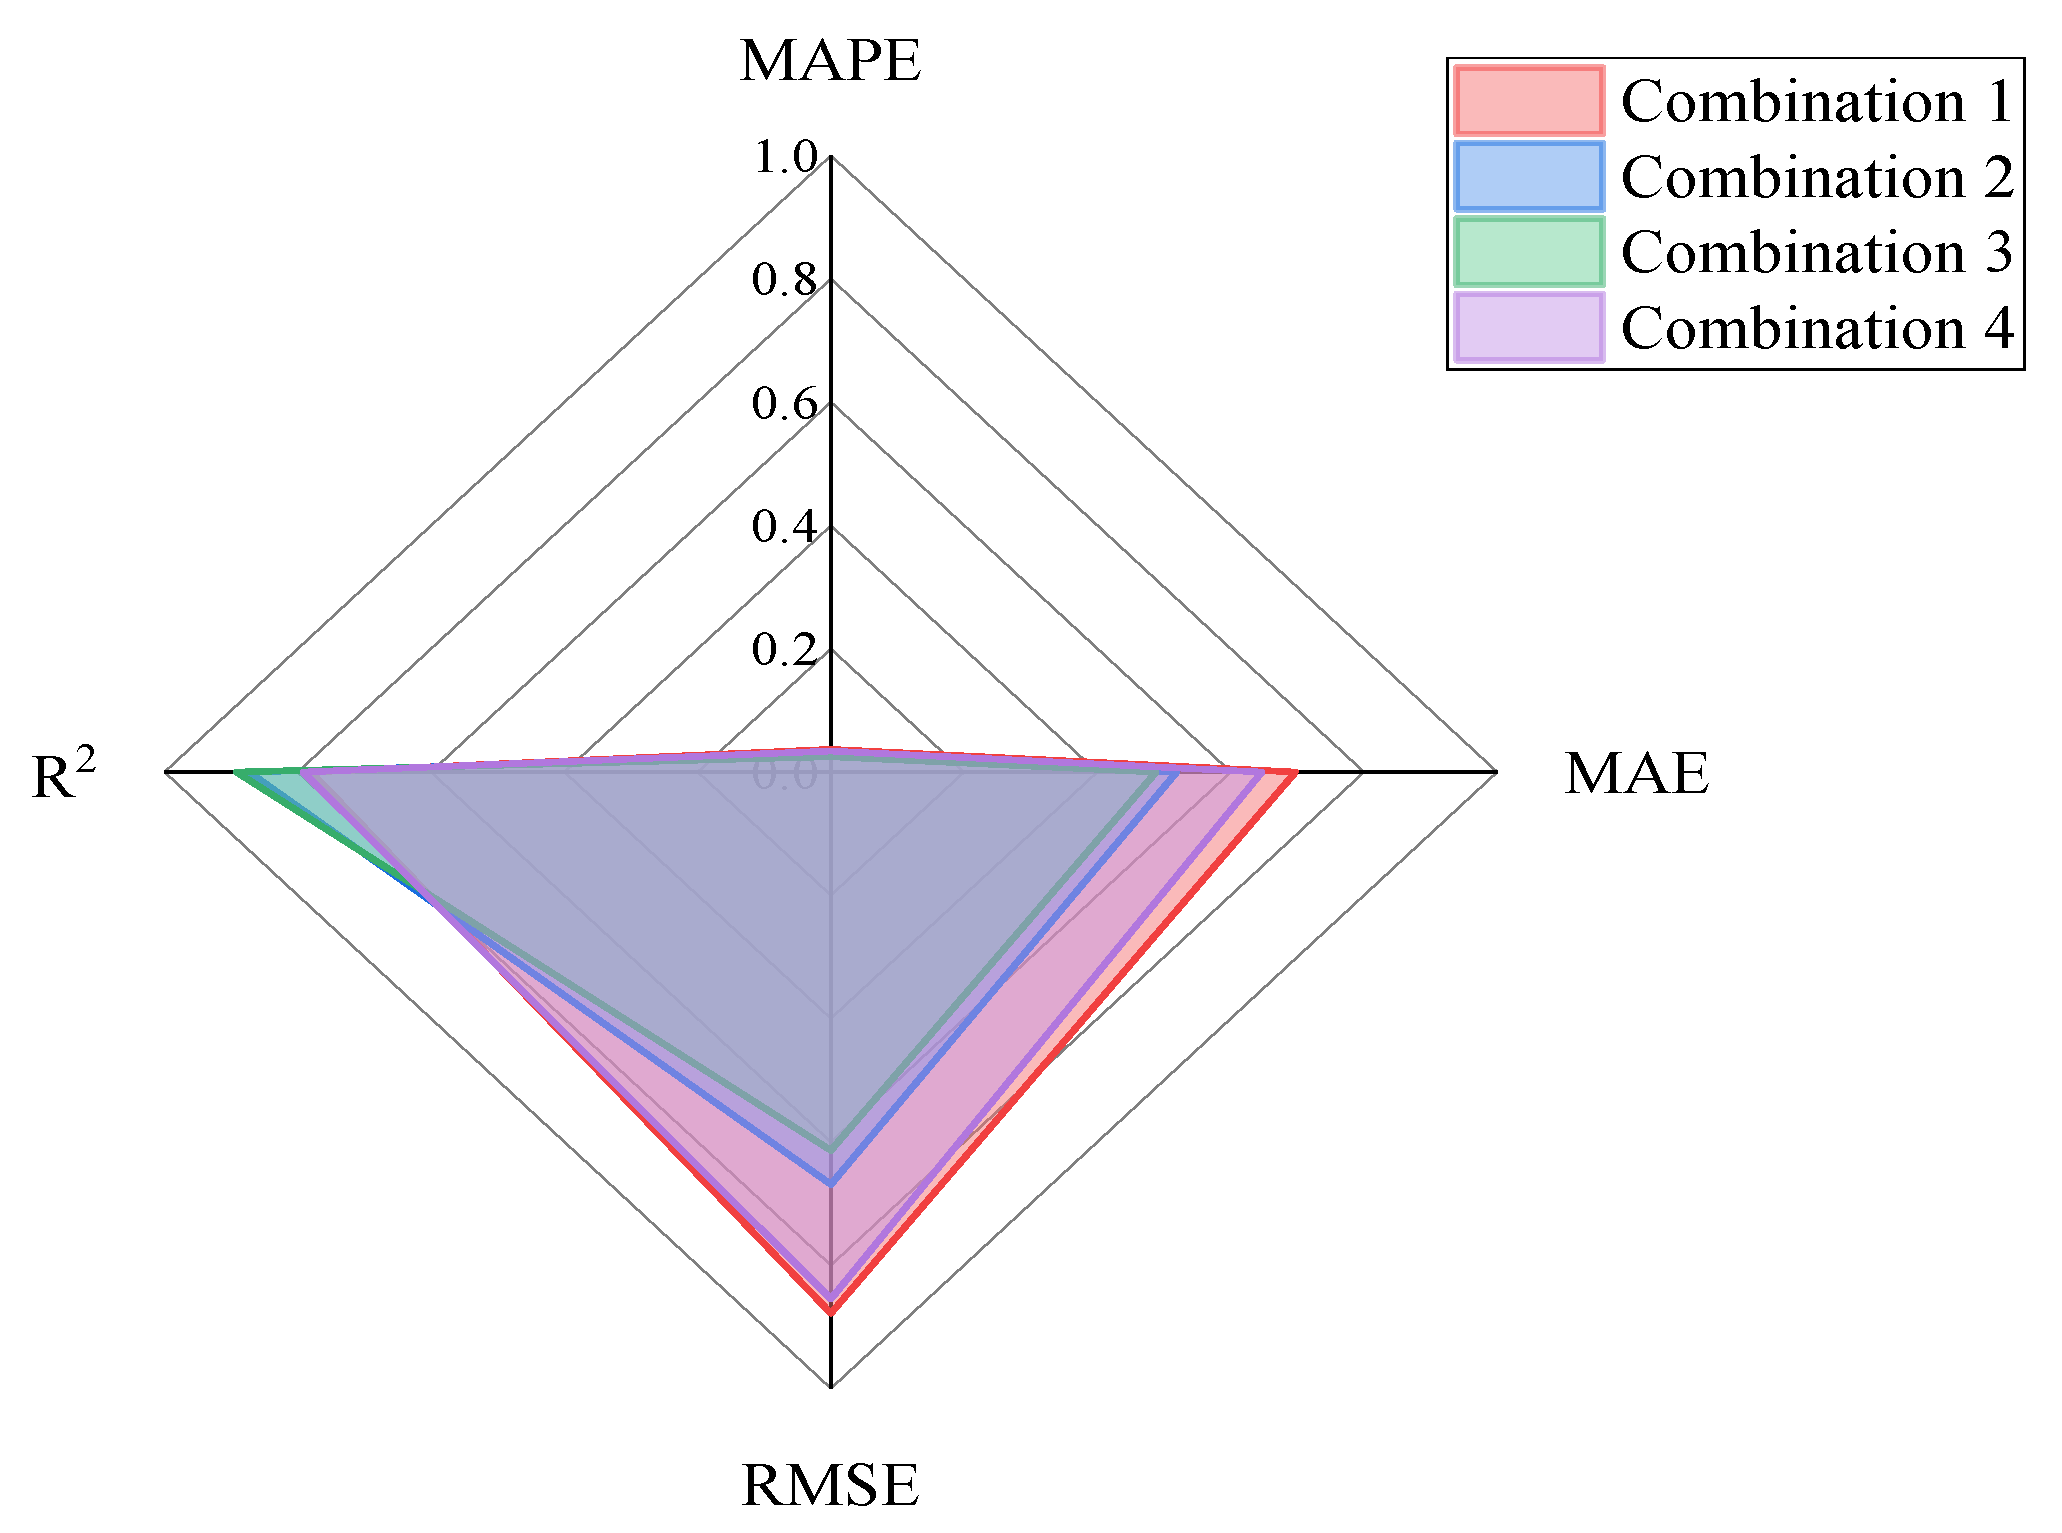
In light of this, we will explore the method of stress variation prediction on the basis of the correlation of multiple measurement points. By combining data from multiple measurement points, even if these points are not very close to the target measurement point, we will investigate the impact of using different combinations of correlated measurement points on stress variation prediction. Taking the target measurement point ST-1-10 as an example, four different measurement point combination schemes are designed for the experiment. The measurement point combinations are shown in Table 7. The predicted results for the four groups are shown in Figure 18 and Figure 19, Table 8.
The aforementioned experimental results indicate that different measurement point combinations have a significant impact on the predictive performance. Although Combination 1 includes relatively close measurement points, its predictive accuracy is relatively low (R2 = 0.780), with higher MAPE, MAE, and RMSE values, reflecting that relying solely on local neighboring measurement point information may not be sufficient to provide accurate predictions. Combination 2 shows an improvement in predictive performance (R2 = 0.873), indicating that incorporating measurement points at medium distances can provide more information to the model, thereby optimizing the prediction results. Combination 3 has the best predictive effect (R2 = 0.892), with the lowest MAPE and MAE values and the smallest RMSE value, indicating that comprehensive information from multiple measurement points can significantly enhance the model’s predictive capability. However, the predictive performance of Combination 4 did not further improve with increasing number of measurement points (R2 = 0.792), suggesting that after a certain number, the predictive accuracy tends to saturate due to redundant information.
In summary, the appropriate number of measurement points and an effective combination strategy are crucial to the accuracy of the stress prediction model. In the prediction of stress variations on the basis of the correlation of multiple measurement points, it is advisable in practice to prioritize the selection of measurement point combinations that are at a moderate distance and have complementary information to avoid a decrease in predictive performance due to duplicated information.

5.5. Prediction Based on the Temperature Correlation

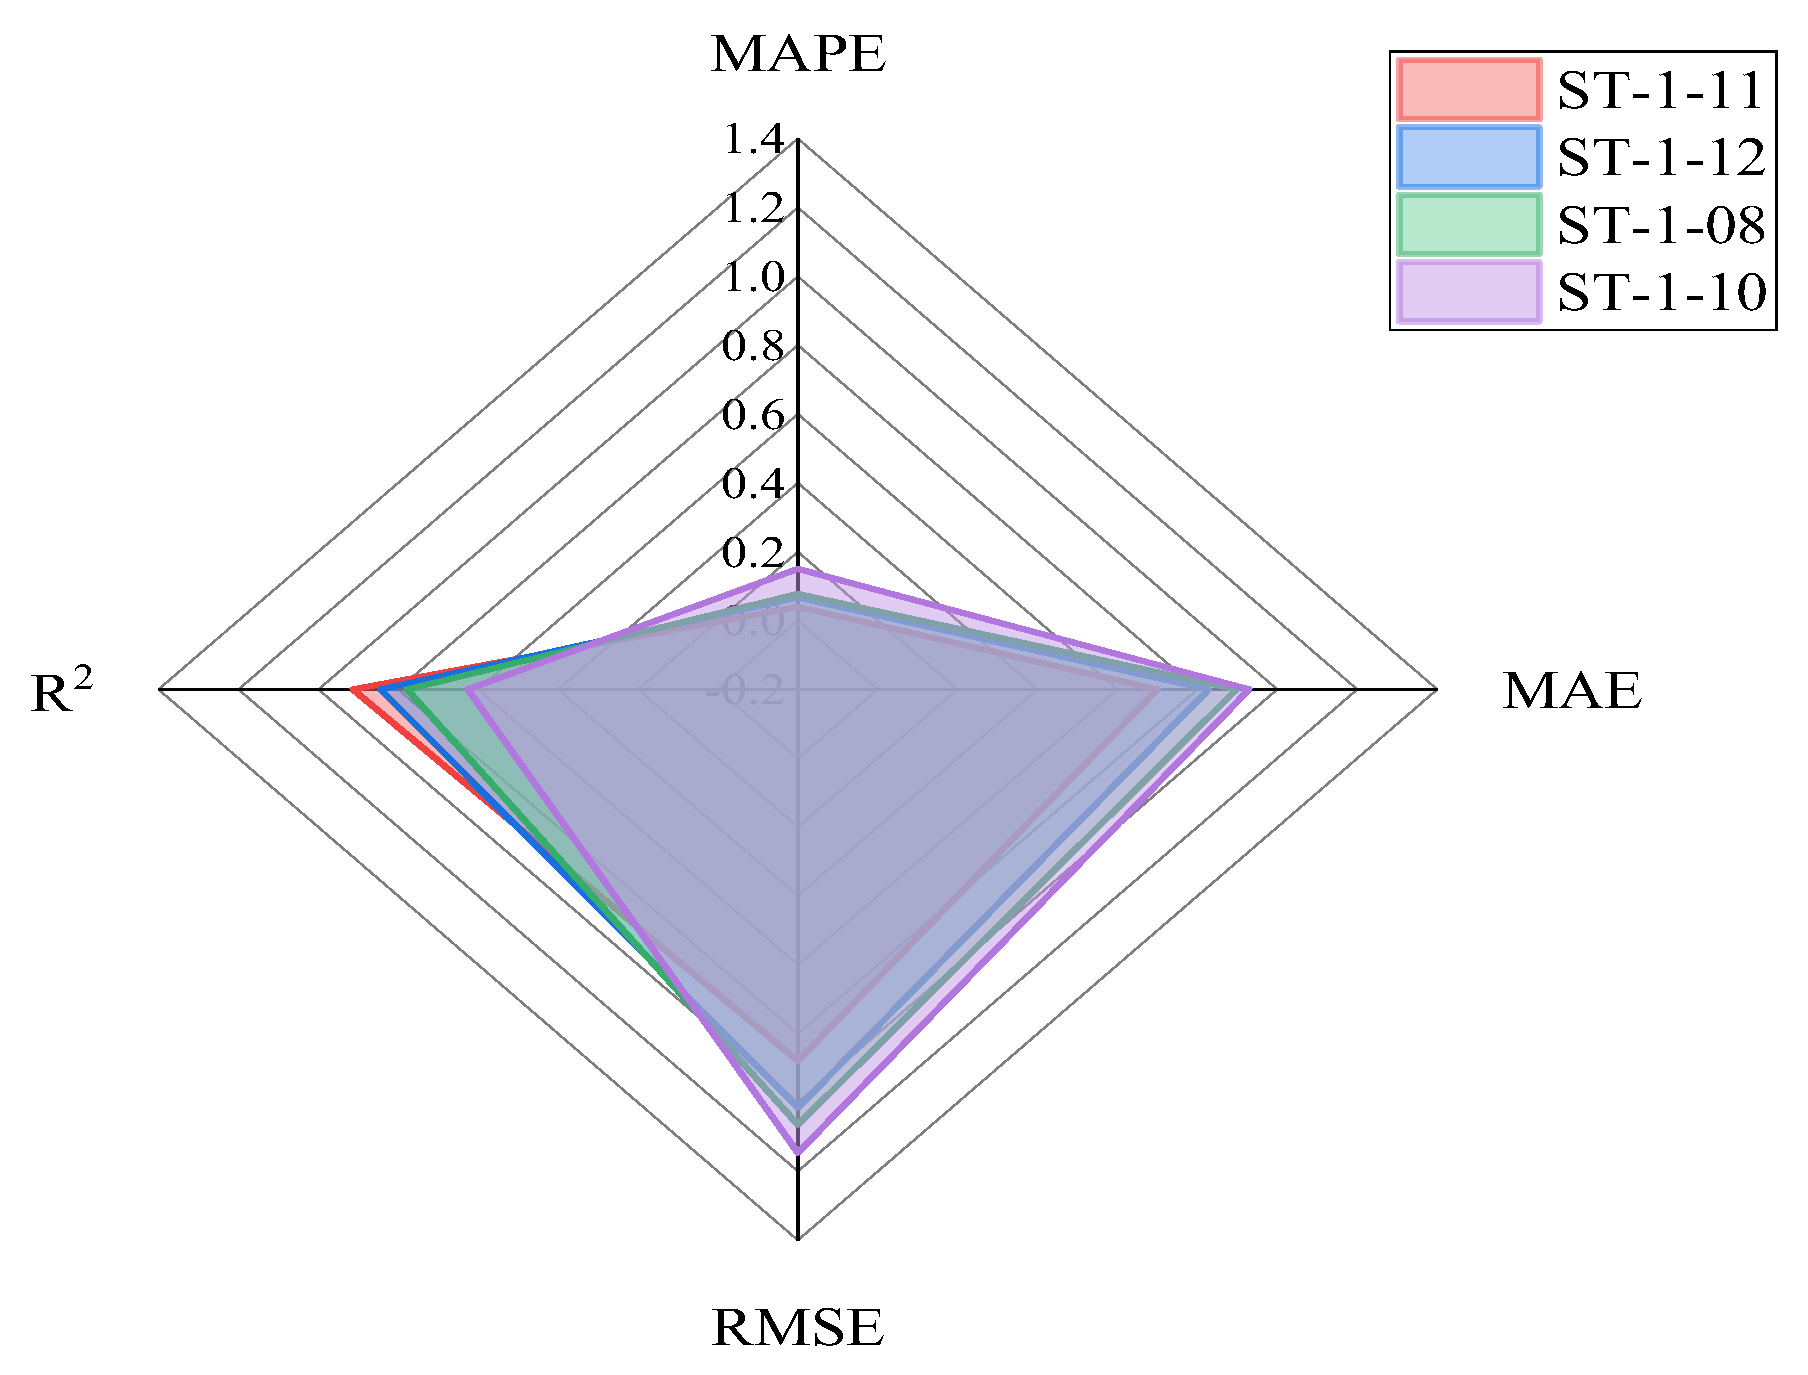
In the field of health monitoring for airport terminal steel structure roofs, the effects of temperature on structural stress changes cannot be ignored. Against this backdrop, an analysis is conducted on the correlation between temperature changes and stress at four representative measurement points with high temperature correlation, namely, ST-1-11, ST-1-12, ST-1-08, and ST-1-10, to carry out prediction experiments for stress changes on the basis of temperature correlation. The results of the predicted model are shown in Table 9 and Figure 20.
The results indicate that the correlation coefficients between temperature changes and stress at measurement points ST-1-11, ST-1-12, ST-1-08, and ST-1-10 are 0.979, 0.970, 0.953, and 0.951, respectively, emphasizing the significant role of temperature in stress response prediction. However, when these high-correlation data were used for prediction with the BO-CNN-LSTM model, a decrease in the predicted R2 values was observed, dropping to 0.914, 0.844, 0.778, and 0.626, respectively. This is because although a single temperature indicator plays an important role in stress prediction, the stress response is affected by other types of loads experienced in the structure. Therefore, the stress measurement results also include other load effects in addition to temperature, which increases the complexity of prediction and introduces errors to some extent.

5.6. Performance Analysis of the BO-CNN-LSTM Prediction Model

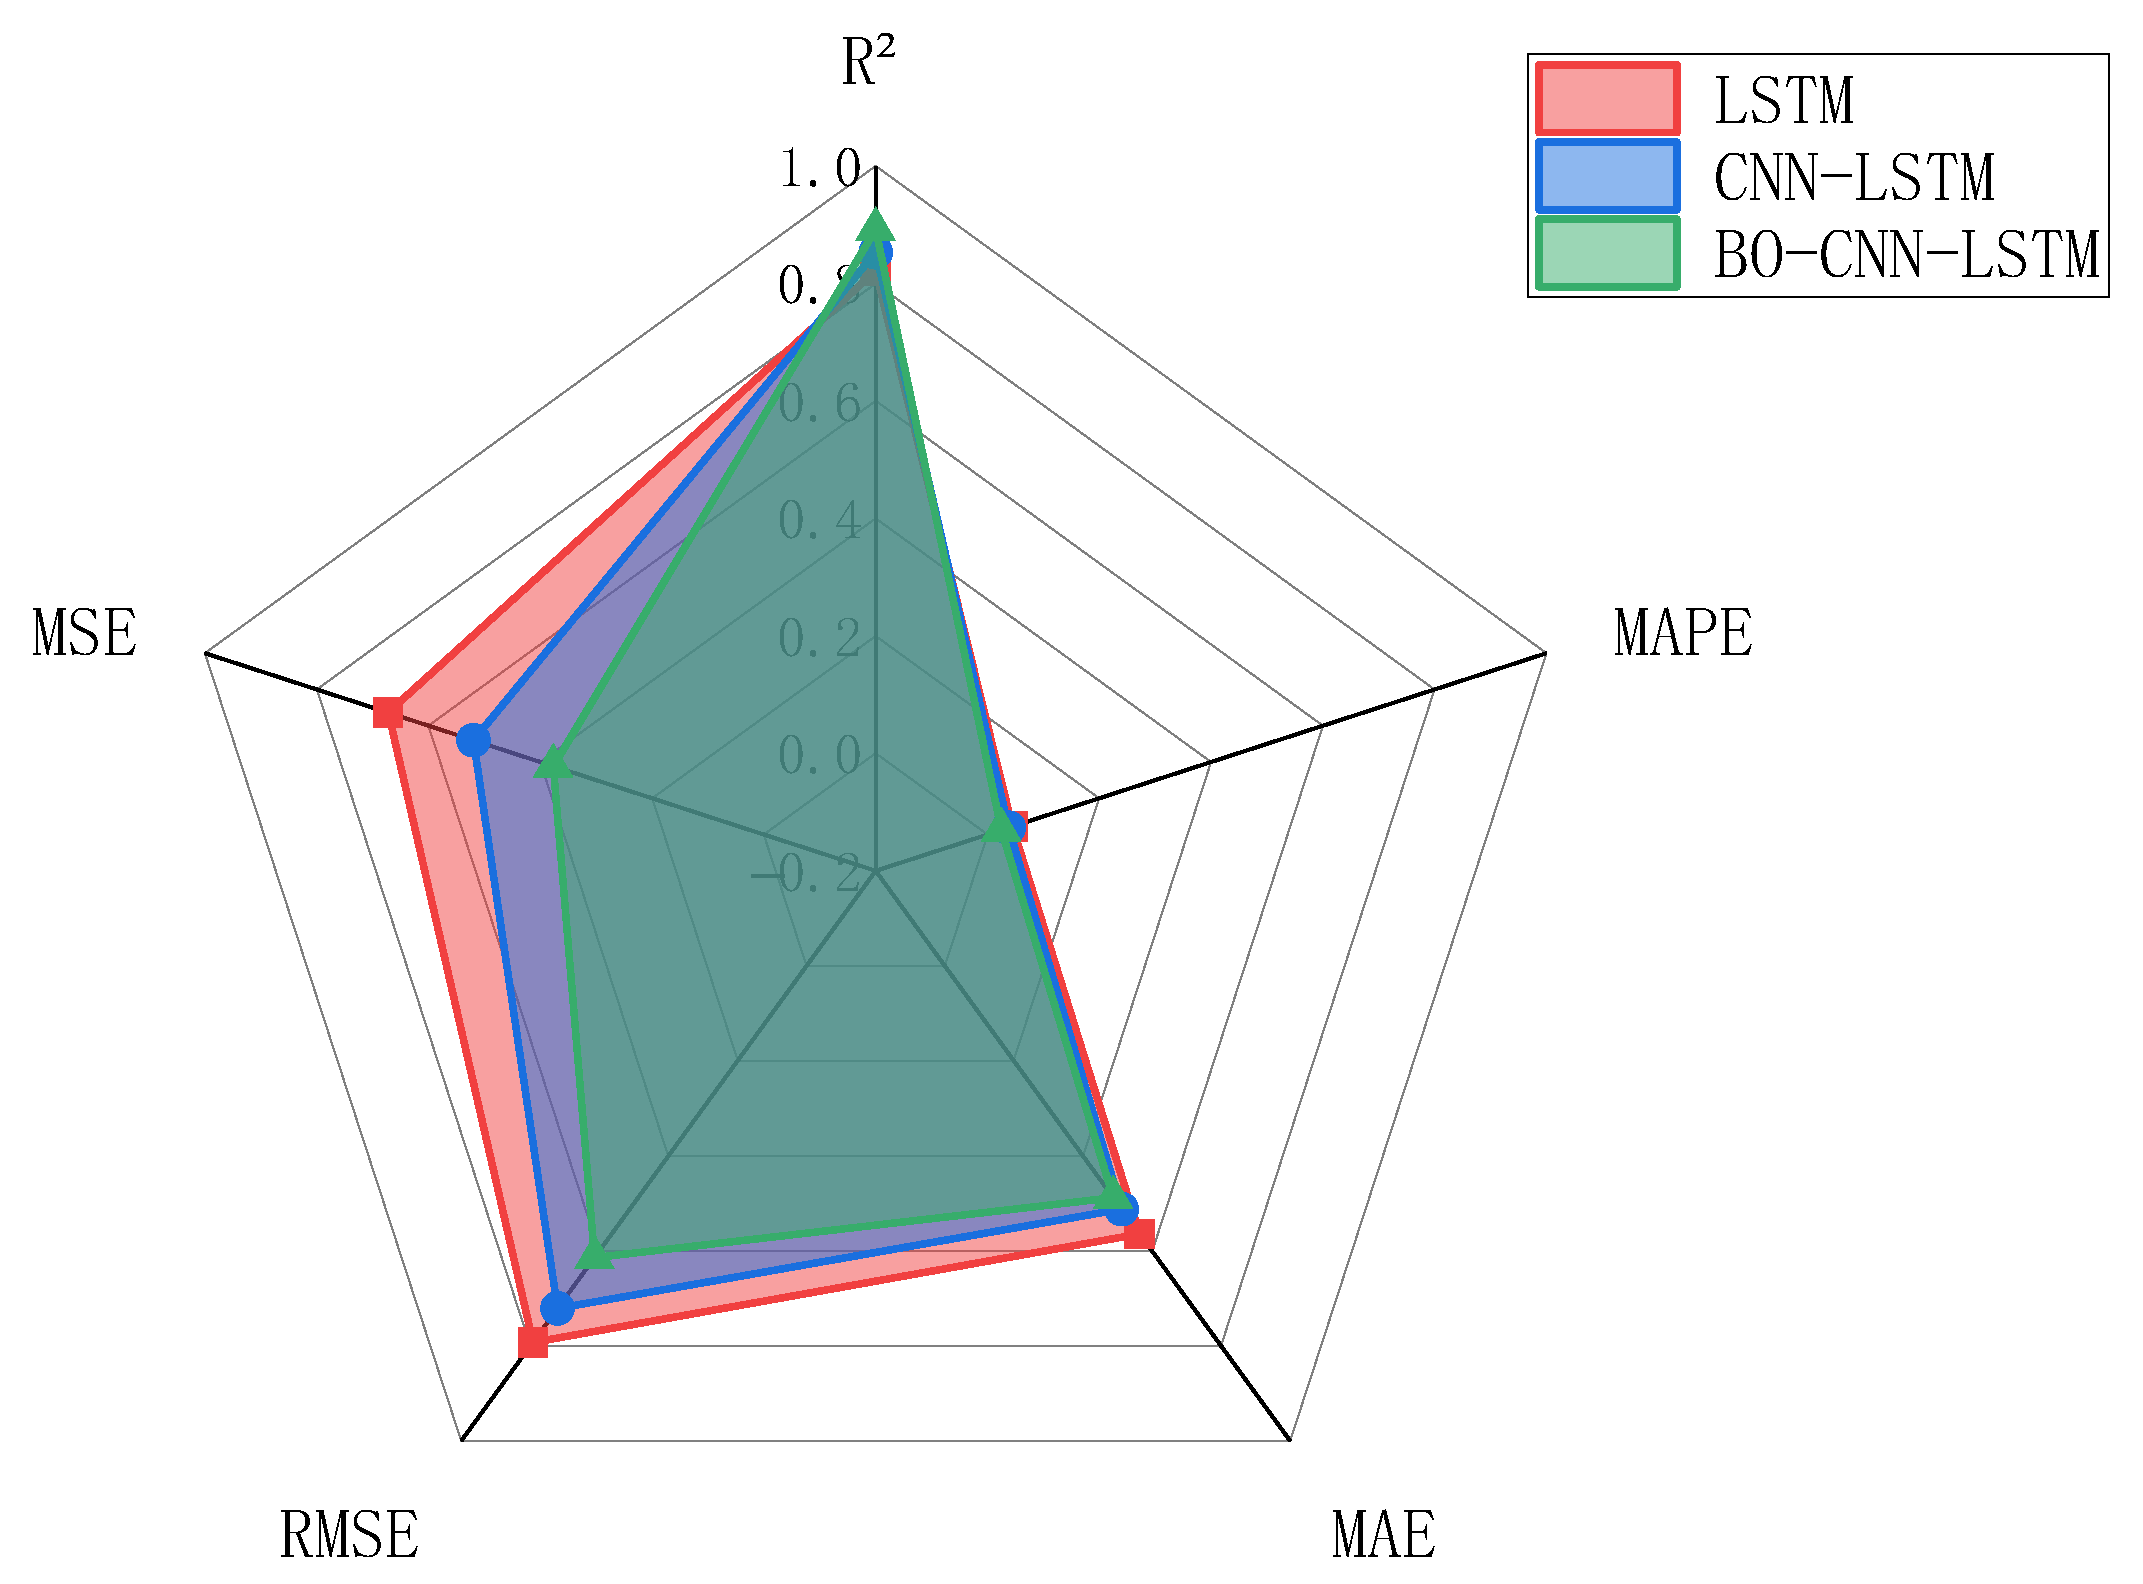
To further verify the effectiveness and robustness of the proposed BO-CNN-LSTM prediction model for terminal structure stress change, this section sets up a comparative test on the prediction performance of three models (LSTM, CNN-LSTM and BO-CNN-LSTM) with actual value. Due to lots of data and limited space, only the dataset of the representative Combination 3 in the analysis of multi-point correlations is selected to evaluate the multi-variable regression prediction performance for the stress change in the target measurement point ST-1-10. The test prediction results are shown in Figure 21, and the prediction accuracy statistics of each prediction model are shown in Table 10. The test results show that the hybrid model has certain advantages in terms of prediction accuracy compared with the single model.
As indicated in Figure 21 and Figure 22, Table 10, the BO-CNN-LSTM model surpasses the LSTM and CNN-LSTM models in various performance evaluation indexes. The MAPE of the BO-CNN-LSTM model is 0.025, which is lower than 0.045 of the LSTM model and 0.038 of the CNN-LSTM model, demonstrating a significant improvement in prediction accuracy. In addition, its MAE and RMSE also have the lowest values of 0.488 and 0.614, respectively, further confirming its superior prediction performance. Moreover, its R2 reaches 0.892. Compared with the 0.821 of the LSTM model and the 0.853 of the CNN-LSTM model, the prediction accuracy and reliability of the model are improved. This can further verify the efficiency of the BO-CNN-LSTM model for terminal stress change prediction and the important role of Bayesian optimization in the process of model parameter optimization. By fine tuning the parameter configuration of CNN and LSTM, Bayesian optimization improves the comprehensive performance of capturing the long-term and short-term dependence and feature extraction ability of the model, thus improving the accuracy and stability of the prediction results. In summary, the BO-CNN-LSTM model offers a more precise and reliable approach for stress change prediction of the terminal structural.

6. Conclusions

This paper focuses on the steel structure roof of the airport terminal as the research object and investigates health monitoring techniques for the large-span spatial structure of the terminal’s steel roof. The following conclusions are reached:
(1)
The designed and implemented monitoring system, through a sensor network, monitors key physical quantities (stress, displacement, temperature, etc.) in real time, enhancing the knowledge of the structural health status and providing a scientific basis for safety assessment. The application of this system has proven its practicality in the field of steel structure health monitoring.
(2)
On the basis of a large amount of measured data, the monitoring and force characteristics of airport terminal steel structures under the action of temperature were explored. Through linear regression analysis, the impact of temperature changes on stress was quantified, confirming that temperature changes have a significant effect on structural stress, especially in the upper and lower chords. This study provides a reference for future research on structural health monitoring and performance assessment.
(3)
A BO-CNN-LSTM hybrid prediction model was designed, which demonstrates greater accuracy and reliability in predicting structural stress changes than traditional methods. By comparing three prediction methods (single measurement point correlation, multiple measurement point correlation, and temperature correlation), it was found that the BO-CNN-LSTM model surpasses the LSTM and CNN-LSTM models in various performance evaluation indexes and can effectively integrate various influencing factors and enhance prediction accuracy. In particular, in multiple measurement point correlation prediction, the model can effectively capture the stress variation patterns of a structure under different environmental conditions, providing support for real-time monitoring and early warning.
While the BO-CNN-LSTM model shows strong generalization within the observed environmental conditions, future work will focus on: (1) developing continuous learning mechanisms to adapt to long-term structural changes, (2) implementing more sophisticated anomaly detection for unexpected events, and (3) expanding the training dataset to cover a wider range of potential operational scenarios.

Author Contributions

J.C.: conceptualization, supervision; X.W.: methodology, writing—review and editing; X.L.: investigation, methodology, writing—original draft preparation; Y.L.: writing—original draft preparation; P.B.: investigation, methodology; C.X.: writing—original draft preparation; T.C.: supervision. All authors have read and agreed to the published version of the manuscript.

Funding

This work was funded by the Tianjin Science and Technology Program of China (23YDTPJC00190).

Data Availability Statement

The original contributions presented in this study are included in the article. Further inquiries can be directed to the corresponding author.

Conflicts of Interest

The authors declare that there are no conflicts of interest.

Correction Statement

This article has been republished with a minor correction to the Data Availability Statement. This change does not affect the scientific content of the article.

References

  1. Wang, X.L.; Ran, Y.H.; Zhu, Y.P. Research on Health Monitoring for Large Span Steel Structures. In Proceedings of the 17th Biennial International Conference on Engineering, Science, Construction, and Operations in Challenging Environments, Virtual, 19–23 April 2021. [Google Scholar]
  2. Tang, B.J.; Zhang, X.; Xia, Z.Y.; Shi, H.Y. Construction process monitoring of a large-span steel truss roof based on response-increment comparison strategy. Meas. Sci. Technol. 2024, 35, 025001. [Google Scholar] [CrossRef]
  3. Xu, C.; Lei, H.; Wang, G. Fatigue life and fatigue reliability assessment for long-span spatial structure based on long-term health monitoring data. Structures 2023, 47, 586–594. [Google Scholar] [CrossRef]
  4. Svendsen, B.T.C.; Frøseth, G.T.; Øiseth, O.A.; Rönnquist, A.N. A data-based structural health monitoring approach for damage detection in steel bridges using experimental data. J. Civ. Struct. Health Monit. 2021, 12, 101–115. [Google Scholar] [CrossRef]
  5. Li, X.; Xie, L.; Lu, W.; Xue, S.; Hong, C.; Lan, W.; Shi, Q. Structural health monitoring of a historic building during uplifting process: System design and data analysis Structural. Health Monit. Int. J. 2023, 22, 3165–3188. [Google Scholar] [CrossRef]
  6. Keshmiry, A.; Hassani, S.; Mousavi, M.; Dackermann, U. Effects of Environmental and Operational Conditions on Structural Health Monitoring and Non-Destructive Testing: A Systematic Review. Buildings 2023, 13, 918. [Google Scholar] [CrossRef]
  7. Sahar, H.; Ulrike, D. A Systematic Review of Advanced Sensor Technologies for Non-Destructive Testing and Structural Health Monitoring. Sensors 2023, 23, 2204. [Google Scholar] [CrossRef]
  8. Tang, D.Y.; Wei, X.B.; Sun, Z.H.; WANG, R.C. Research on Structural Health Monitoring System. Intell. Build. Smart City 2023, 8, 6–11. (In Chinese) [Google Scholar]
  9. Li, X.; Zhang, F.-L.; Xiang, W.; Liu, W.-X.; Fu, S.-J. Structural health monitoring system based on digital twins and real-time data-driven methods. Structures 2024, 70, 107739. [Google Scholar] [CrossRef]
  10. Desjardins, S.L.; Lau, D.T. Enhanced operational modal analysis and change point detection for vibration-based structural health monitoring of bridges. J. Infrastruct. Intell. Resil. 2024, 3, 100121. [Google Scholar] [CrossRef]
  11. Alsehaimi, A.; Houda, M.; Waqar, A.; Hayat, S.; Waris, F.A.; Benjeddou, O. Internet of things (IoT) driven structural health monitoring for enhanced seismic resilience: A rigorous functional analysis and implementation framework. Results Eng. 2024, 22, 102340. [Google Scholar] [CrossRef]
  12. Mayank, M.; Lourenço, P.B.; Ramana, G.V. Structural health monitoring of civil engineering structures by using the internet of things: A review. J. Build. Eng. 2022, 48, 103954. [Google Scholar] [CrossRef]
  13. Tang, Z.; Chen, Z.; Bao, Y.; Li, H. Convolutional neural network-based data anomaly detection method using multiple information for structural health monitoring. Struct. Control Health Monit. 2019, 26, e2296. [Google Scholar] [CrossRef]
  14. Zhao, H.; Zhang, X.; Ding, Y.; Guo, T.; Li, A.; Soh, C.-K. Probabilistic mixture model driven interpretable modeling, clustering, and predicting for physical system data. Eng. Appl. Artif. Intell. 2025, 160, 112–160. [Google Scholar] [CrossRef]
  15. Gong, X.; Song, X.; Li, G.; Xiong, W.; Cai, C.S. Deep learning based anomaly identification of temperature effects in bridge structural health monitoring data. Structures 2024, 69, 107478. [Google Scholar] [CrossRef]
  16. Zhou, M.; Fan, J.-S.; Liu, Y.-F.; Zhang, J.-X.; Duan, X.-J.; Lei, S.-S. Non-uniform temperature field and effect on construction of large-span steel structures. Autom. Constr. 2020, 119, 103339. [Google Scholar] [CrossRef]
  17. Sun, S.; Wang, Z.; Xia, Z.; Yi, L.; Yue, Z.; Ding, Y. The Temperature-Induced Deflection Data Missing Recovery of a Cable-Stayed Bridge Based on Bayesian Robust Tensor Learning. Symmetry 2023, 15, 1234. [Google Scholar] [CrossRef]
  18. Chen, C.B.; Tang, L.Q.; Lu, Y.H.; Wang, Y.; Liu, Z.J.; Liu, Y.P.; Zhou, L.C.; Jiang, Z.Y.; Yang, B. Reconstruction of long-term strain data for structural health monitoring with a hybrid deep-learning and autoregressive model considering thermal effects. Eng. Struct. 2023, 285, 116063. [Google Scholar] [CrossRef]
  19. Luo, Y.; Mei, Y.; Shen, Y.; Yang, P. Field measurement of temperature and stress on steel structure of the National Stadium and analysis of temperature action. J. Build. Struct. 2013, 34, 24–32. (In Chinese) [Google Scholar]
  20. Mei, Y.J. Research on the Performance of the National Stadium’s Steel Structure Under Environmental Loads by Field Measurements. Master’s Thesis, Zhejiang University, Hangzhou, China, 2013. (In Chinese). [Google Scholar]
  21. Wu, S.W. Research on Steel Health Monitoring Scheme and Safety Early Warning of Taiyuan South Station. Master’s Thesis, Taiyuan University of Technology, Taiyuan, China, 2017. (In Chinese). [Google Scholar]
  22. Liu, F. Design of Qingdao Jiaodong International Airport Health Monitoring System and Numerical Simulation Analysis of Data Missing Repair. Master’s Thesis, Qingdao University of Technology, Qingdao, China, 2019. (In Chinese). [Google Scholar]
  23. Wang, G.Y. Design and Application of Stadium Structure Health Monitoring System; Inner Mongolia University of Science & Technology: Baotou, China, 2020. (In Chinese) [Google Scholar]
  24. Xu, X.; Shi, C.; Ren, Y.; Fan, Z.; Guo, Z.; Zeng, X.; Jin, Y.; Huang, Q. Probabilistic anomaly detection considering multi-level uncertainties for cable-stayed bridges. Structures 2023, 58, 105448. [Google Scholar] [CrossRef]
  25. Luo, Y.Z.; Shen, Y.B.; Tong, R.F.; Wang, X.B. Health Monitoring and Early Warning Technology in Spatial Structure. Constr. Technol. 2009, 38, 4–8. (In Chinese) [Google Scholar]
  26. Shen, Y.B.; Luo, Y.Z.; Fu, W.W.; Zhang, Z.Y.; Cai, P.C. Structural health monitoring and analysis of main stadium of the Hangzhou Asian Games. J. Build. Struct. 2024, 45, 81–91. (In Chinese) [Google Scholar]
  27. Luo, Y.Z.; Zhao, J.Y. Research status and future prospects of space structure health monitoring. J. Build. Struct. 2022, 43, 16–28. (In Chinese) [Google Scholar]
  28. Aktan, E.; Bartoli, I.; Glišić, B.; Rainieri, C. Lessons from Bridge Structural Health Monitoring (SHM) and Their Implications for the Development of Cyber-Physical Systems. Infrastructures 2024, 9, 30. [Google Scholar] [CrossRef]
  29. Chiara, G.; Giulio, M.; Tommaso, P.; Domenico, A. BIM-based design and setup of structural health monitoring systems. Autom. Constr. 2024, 158, 105245. [Google Scholar]
  30. Mohsen, E.; Mohsen, G.A.; Omid, B. Integrated Bridge Structural Health Monitoring System. Iran. J. Sci. Technology. Trans. Civ. Eng. 2023, 48, 149–168. [Google Scholar]
  31. Ur, R.S.; Usman, M.; Younus, T.M.H.; Ali, H.Q. Advancing structural health monitoring: A vibration-based IoT approach for remote real-time systems. Sens. Actuators A. Phys. 2024, 365, 114863. [Google Scholar]
  32. Shafiqah, A.A.; Abdul, K.S.; Adiza, J.; Kamaliah, M.N.; Kunitomo, S.M. Recent vibration-based structural health monitoring on steel bridges: Systematic literature review. Ain Shams Eng. J. 2024, 15, 102501. [Google Scholar]
  33. Chen, W.P.; Yu, J.X.; Weng, Y.H.; Wu, J.P.; Xie, B.F. Application Analysis of Structural Health Monitoring Sensors in Civil Engineering. Sichuan Cem. 2023, 5, 86–88. (In Chinese) [Google Scholar]
  34. Zhou, J.C.; Liu, Y.H.; Chen, A.; Zhang, J. State identification of lateral vibration of rail vehicle body based on BO-CNN-LSTM. J. Railw. Sci. Eng. 2024, 21, 3900–3910. (In Chinese) [Google Scholar]
  35. Chen, X.Y. CNN-LSTM Stock Price Prediction Model Based on Bayesian Optimization. Master’s Thesis, Lanzhou University, Lanzhou, China, 2023. (In Chinese). [Google Scholar]
Figure 1. Layout plan of the main truss for the terminal D district. (a) Main truss plan (single row). (b) Main truss plan (Symmetric half row). (c) Overall schematic of the main truss.
Buildings 15 03308 g001
Figure 2. System functional architecture.
Buildings 15 03308 g002
Figure 3. Detailed layout drawing of measurement points for the 1st, 3rd, and 5th main truss rows. Note: The numbers represent the identification codes of the measurement points.
Buildings 15 03308 g003
Figure 4. Detailed layout diagram of measurement points for the 2nd, 4th, and 6th rows of the main trusses. Note: The numbers represent the identification codes of the measurement points.
Buildings 15 03308 g004
Figure 5. Displacement sensor layout. Note: WL-1 to WL-12 are the monitoring points for the displacement sensor.
Buildings 15 03308 g005
Figure 6. Hourly average temperatures at each measurement point at 14:00 in summer.
Buildings 15 03308 g006
Figure 7. Hourly average temperatures at each measurement point at 14:00 in winter.
Buildings 15 03308 g007
Figure 8. Hourly average temperatures at each measurement point at 0:00 in summer.
Buildings 15 03308 g008
Figure 9. Hourly average temperatures at each measurement point at 0:00 in winter.
Buildings 15 03308 g009
Figure 10. Temperature–stress variation curve for the measurement points in July 2023. (a) Measurement Point ST-1-06 (Web Member). (b) Measurement Point ST-5-15 (Web Member). (c) Measurement Point ST-1-03 (Lower Stringer). (d) Measurement Point ST-5-14 (Lower Stringer). (e) Measurement Point ST-1-08 (Upper Chord). (f) Measurement Point ST-5-10 (Upper Chord).
Buildings 15 03308 g010
Figure 11. Temperature–stress variation curve for the measurement points in January 2023. (a) Measurement Point ST-1-06 (Web Member). (b) Measurement Point ST-5-15 (Web Member). (c) Measurement Point ST-1-03 (Lower Stringer). (d) Measurement Point ST-5-14 (Lower Stringer). (e) Measurement Point ST-1-08 (Upper Chord). (f) Measurement Point ST-5-10 (Upper Chord).
Buildings 15 03308 g011
Figure 12. Long-term measured stress variation at each measurement point. (a) The first group of measuring points. (b) The second group of measuring points. (c) The third group of measuring points. (d) The fourth group of measuring points.
Buildings 15 03308 g012
Figure 13. Measured stress increment and temperature time-history curves for different measurement points. (a) Measurement Point ST-1-08 of the Upper Chord. (b) Measurement Point ST-1-10 of the Lower Chord. (c) Measurement Point ST-1-03 of the Lower Chord. (d) Measurement Point ST-1-11 of the Lower Chord. (e) Measurement Point ST-1-01 of the Web Member. (f) Measurement Point ST-1-06 of the Web Member.
Buildings 15 03308 g013
Figure 14. Data training process based on BO-CNN-LSTM hybrid model.
Buildings 15 03308 g014
Figure 15. Stress variation curves at different measurement points.
Buildings 15 03308 g015
Figure 16. The stress variation predicted results at different measurement points. (a) The predicted results of the measurement point ST-1-11. (b) The predicted results of the measurement point ST-1-12. (c) The predicted results of the measurement point ST-1-13.
Buildings 15 03308 g016
Figure 17. Predicted results integrated radar map.
Buildings 15 03308 g017
Figure 18. Stress variation predicted results based on different combinations. (a) Predicted results for Combination 1. (b) Predicted results for Combination 2. (c) Predicted results for Combination 3. (d) Predicted results for Combination 4.
Buildings 15 03308 g018
Figure 19. Predicted results integrated radar map.
Buildings 15 03308 g019
Figure 20. Predicted results integrated radar map.
Buildings 15 03308 g020
Figure 21. Compared the predicted values with the actual values from different predicted models.
Buildings 15 03308 g021
Figure 22. Radar figure of model evaluation.
Buildings 15 03308 g022
Table 1. Technical parameter table for intelligent surface vibrating-wire strain gauge.
Standard Range3000 με
Sensitivity1 με
Temperature Range−20 to + 125 °C
Manual Data Acquisition MethodCollected using a universal readout unit
Automated Data Acquisition MethodRequires connection to a system via a processor for automated data acquisition
Installation MethodSpot-welded on the surface of steel structures with an additional protective cover
Table 2. Performance indicators of accelerometer.
ItemTechnical Specifications
Measurement Range±2.0 g
Frequency Response RangeDC–120 Hz
Nonlinearity≤1% FS
Dynamic Range120 dB
Resolution10 μg
SensitivityLow Sensitivity: ±2.5 V/g
Table 3. The structural characteristics under different types of temperature loads.
Types of Temperature LoadsInfluencing FactorsTemporal CharacteristicsDistributionDegree of Impact
Daily Temperature VariationsAmbient Temperature
Changes
Long-termOverallModerate Impact
Sudden Temperature IncreaseAbrupt Temperature Rise, such as in a FireShort-termLocalSignificant Impact
Sudden Temperature DecreaseAbrupt Temperature Drop, such as in Extreme Cold WeatherShort-termOverallSignificant Impact
Seasonal Temperature ChangesTemperature Fluctuations Induced by Seasonal ChangesLong-termOverallModerate Impact
Table 4. Pearson correlation coefficients between measurement point temperatures and stress changes.
Measurement PointMember PositionPearson Correlation Coefficient
JanuaryJuly
Measurement point ST-1-06 (Web member)Support location−0.95−0.92
Measurement point ST-5-15 (Web member)Non-support location0.940.86
Measurement point ST-1-03 (Lower chord)Non-support location−0.97−0.95
Measurement point ST-5-14 (Lower chord)Support location0.970.87
Measurement point ST-1-08 (Upper chord)Non-support location−0.94−0.88
Measurement point ST-5-10 (Upper chord)Non-support location−0.92−0.87
Table 5. The correlation between temperature and stress increment at various measurement points.
Measurement PointMember TypeR2KEquation
ST-1-08Upper Chord0.953−0.718Y = −0.718X + 7.841
ST-1-10Upper Chord0.951−0.479Y = −0.479X − 7.441
ST-1-03Lower Chord0.976−1.021Y = −1.021X + 15.640
ST-1-11Lower Chord0.979−0.767Y = −0.767X + 0.856
ST-1-1Web Member0.857−0.176Y = −0.176X − 0.182
ST-1-06Web Member0.977−0.452Y = −0.452X − 0.890
Notes: R2 refers to the ratio of the regression sum of squares to the total sum of squares. The larger this ratio is, the more precise the model and the more significant the regression effect. K is the regression coefficient.
Table 6. Predicted results based on the unilateral point correlation.
Reference Measurement
Point Number
Relative Position to
Measurement Point ST-1-10
Evaluation Index
MAPEMAERMSER2
ST-1-11Within the Near-Distance Region0.0360.6810.8530.793
ST-1-12Within the Mid-Distance Region0.0440.8481.0320.697
ST-1-13Within the Distant Region0.0811.6022.1470.511
Note: MAPE: The mean absolute percentage error (MAPE); the closer its value is to 0%, the better the model is considered to be; MAE: The mean absolute error (MAE); the closer its value is to 0, the more the predicted values match the actual values, indicating a more perfect model; RMSE: The root mean square error (RMSE); the closer its value is to 0, the more the predicted values align with the actual values, indicating a more perfect model. R2: the coefficient of determination (R2); it evaluates the correlation between predicted and actual values, with values closer to 1 indicating superior predictive performance.
Table 7. Different measurement point combinations.
Combination NumberMeasurement Point
Combination
Notes
Combination 1ST-1-11, ST-1-12Includes two measurement points that are
relatively close to each other
Combination 2ST-1-12, ST-1-13Combined one measurement point at a medium distance and one at a greater distance
Combination 3ST-1-11, ST-1-12, ST-1-13Integrated three measurement points at different distances to examine the comprehensive effect of multi-point combinations
Combination 4ST-1-11, ST-1-12, ST-1-13, ST-1-08Includes four measurement points to explore the impact of the increase in the number of measurement points on the predictive performance
Table 8. Evaluation index for the predicted results of different combinations.
Combination NumberEvaluation Index
MAPEMAERMSER2
Combination 10.0370.6970.8780.780
Combination 20.0270.5190.6690.873
Combination 30.0250.4880.6140.892
Combination 40.0340.6470.8550.792
Table 9. Correlation between measurement point temperature and stress variation and evaluation index for predicted results.
Measurement Point NumberCorrelation Coefficient Between Measurement Point Temperature and Stress VariationEvaluation Index for Predicted Results
MAPEMAERMSER2
ST-1-110.9790.0400.7000.8790.914
ST-1-120.9700.0670.8281.0150.844
ST-1-080.9530.0770.8981.0650.778
ST-1-100.9510.1500.9291.1460.626
Table 10. Predicted accuracy statistics of each predicted model.
Predicted ModelMAPEMAERMSER2MSE
LSTM0.0450.5640.7920.8210.672
CNN-LSTM0.0380.5120.7210.8530.520
BO-CNN-LSTM0.0250.4880.6140.8920.377
Disclaimer/Publisher’s Note: The statements, opinions and data contained in all publications are solely those of the individual author(s) and contributor(s) and not of MDPI and/or the editor(s). MDPI and/or the editor(s) disclaim responsibility for any injury to people or property resulting from any ideas, methods, instructions or products referred to in the content.